trends and institutional responses - oacubo...trends and institutional responses oklahoma...
TRANSCRIPT
Trends and Institutional
Responses
OKLAHOMA ASSOCIATION OF COLLEGE AND
UNIVERSITY BUSINESS OFFICERS
April 2017
© 2016 HURON CONSULTING GROUP INC.
Huron is pleased to have the opportunity to visit with the OACUBO to share a selection of thoughts and perspectives on higher education financial trends and common institutional responses.
Discussion Topics
2 © 2016 HURON CONSULTING GROUP INC.
Selected Trends in Higher Education
Common Institutional (6 selected)
– Budget Redesign Initiatives
– Operational Performance Reviews
– Enrollment Management Initiatives
– Service Delivery Assessments
– Academic Cost Rationalization
– Strategic Partnerships
Concluding Thoughts and Discussion

Trends in Higher Education
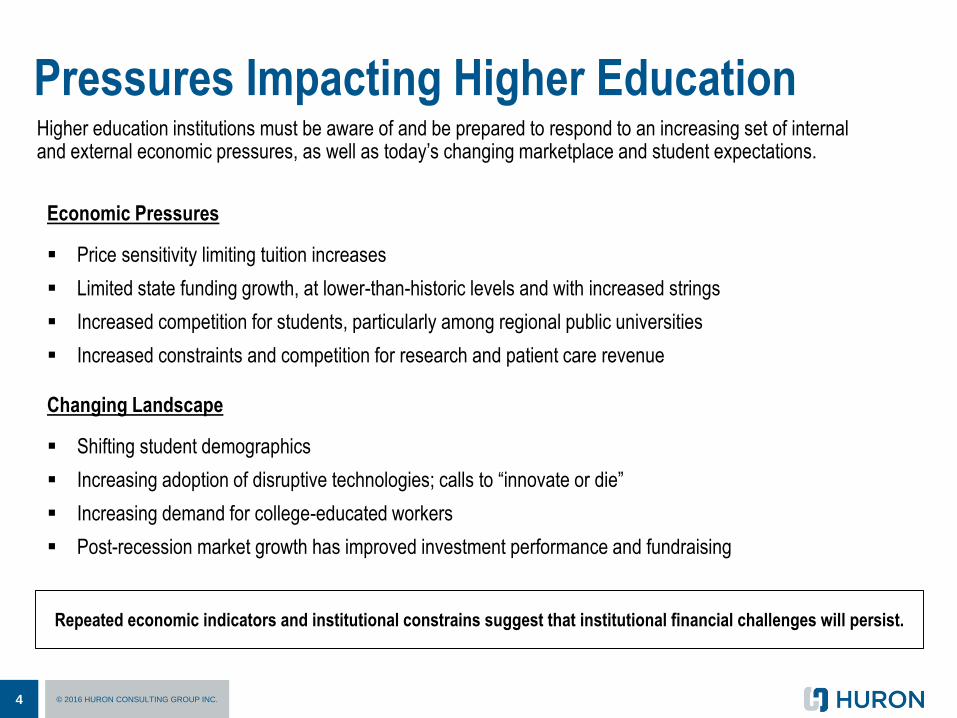
Higher education institutions must be aware of and be prepared to respond to an increasing set of internal and external economic pressures, as well as today’s changing marketplace and student expectations.
Pressures Impacting Higher Education
Repeated economic indicators and institutional constrains suggest that institutional financial challenges will persist.
4 © 2016 HURON CONSULTING GROUP INC.
Economic Pressures
Price sensitivity limiting tuition increases
Limited state funding growth, at lower-than-historic levels and with increased strings
Increased competition for students, particularly among regional public universities
Increased constraints and competition for research and patient care revenue
Changing Landscape
Shifting student demographics
Increasing adoption of disruptive technologies; calls to “innovate or die”
Increasing demand for college-educated workers
Post-recession market growth has improved investment performance and fundraising
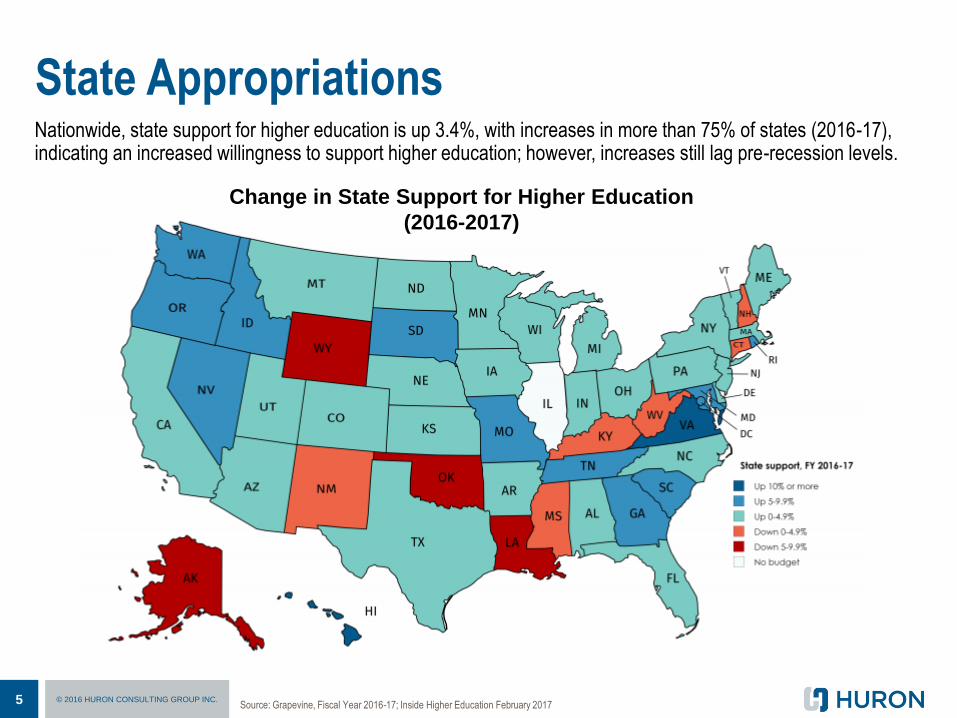
State AppropriationsNationwide, state support for higher education is up 3.4%, with increases in more than 75% of states (2016-17), indicating an increased willingness to support higher education; however, increases still lag pre-recession levels.
Source: Grapevine, Fiscal Year 2016-17; Inside Higher Education February 20175 © 2016 HURON CONSULTING GROUP INC.
Change in State Support for Higher Education
(2016-2017)

Note: Net tuition revenue used for capital debt service included in the above figures. Constant dollars
adjusted by SHEEO Higher Education Cost Adjustment (HECA).
Source: State Higher Education Executive Officers, May 18, 2016
Despite recent state appropriations increases, the overall cost burden of higher education has continued to shift in the last 25 years, from public support to individuals.
Net Tuition Revenue & State Appropriations
6 © 2016 HURON CONSULTING GROUP INC.
In 1990
the public
supported
64% of the
cost
associated
with
Higher
Education
By 2015
public
support for
higher
education
dropped to
46% of the
total cost.
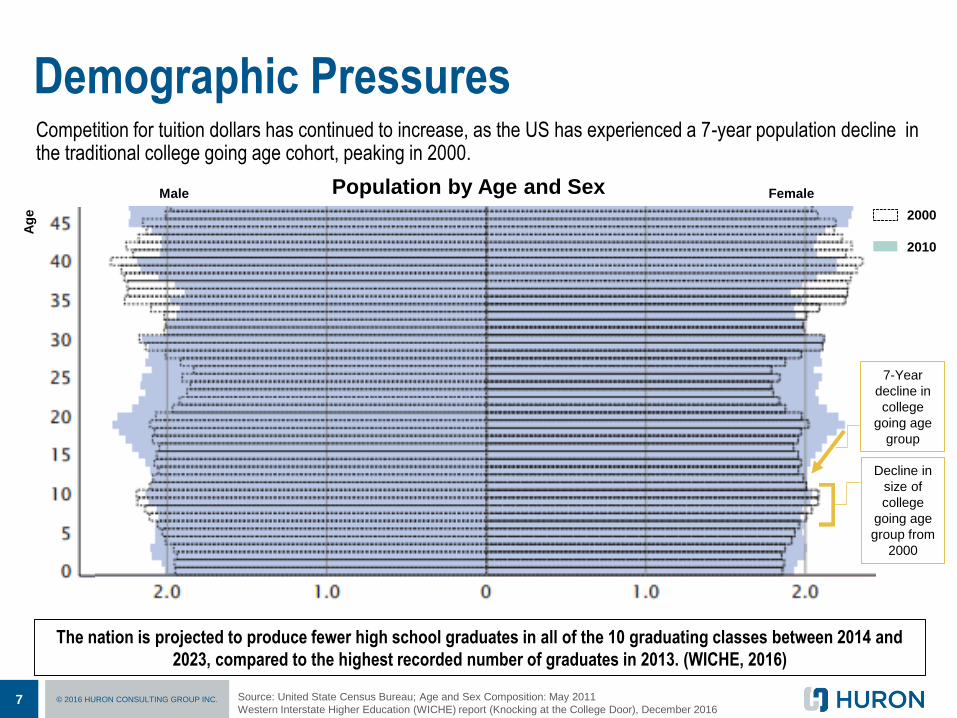
Demographic PressuresCompetition for tuition dollars has continued to increase, as the US has experienced a 7-year population decline in the traditional college going age cohort, peaking in 2000.
The nation is projected to produce fewer high school graduates in all of the 10 graduating classes between 2014 and
2023, compared to the highest recorded number of graduates in 2013. (WICHE, 2016)
Source: United State Census Bureau; Age and Sex Composition: May 2011
Western Interstate Higher Education (WICHE) report (Knocking at the College Door), December 20167 © 2016 HURON CONSULTING GROUP INC.
Male FemalePopulation by Age and Sex
2000
2010
`
7-Year
decline in
college
going age
group
Decline in
size of
college
going age
group from
2000
Ag
e

Tuition DiscountingFor academic year 2015-16, the average private institution discount rate was an estimated 42.5%, extending the gap between sticker prices and what most students actually pay to its highest level ever.
While discounting trends are driven by private institutions, they reflect the increased price sensitivity and potentially
declining yield rates and enrollments that are similarly driving pricing conversations at public institutions.
Source: NACUBO 2016 Tuition Discounting Study, May 20168 © 2016 HURON CONSULTING GROUP INC.
Average Private Institution Tuition Discount Rate
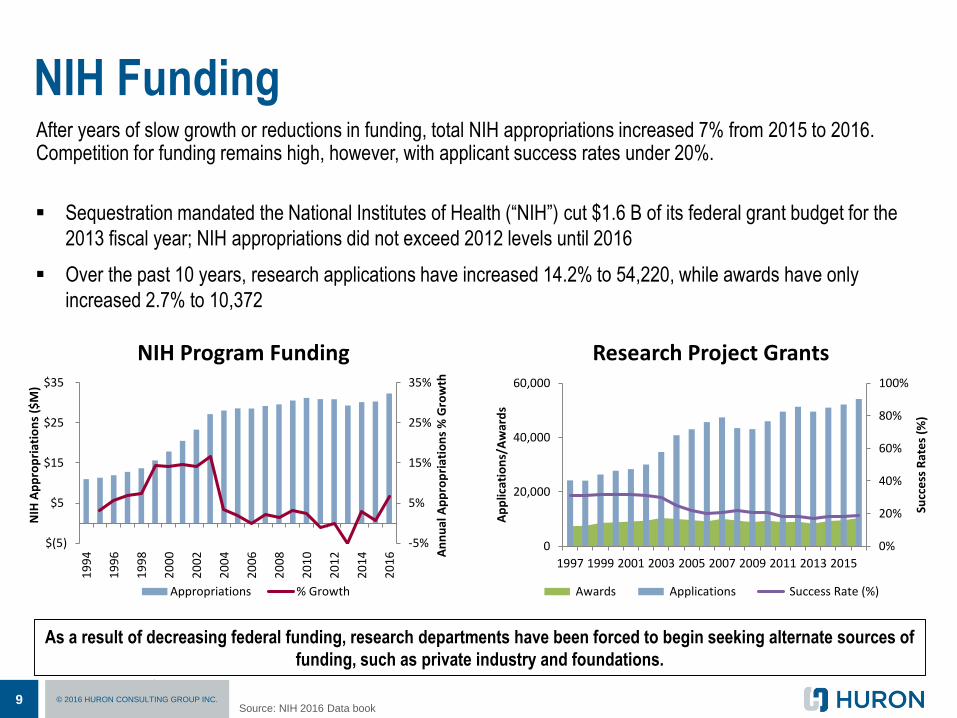
NIH FundingAfter years of slow growth or reductions in funding, total NIH appropriations increased 7% from 2015 to 2016. Competition for funding remains high, however, with applicant success rates under 20%.
As a result of decreasing federal funding, research departments have been forced to begin seeking alternate sources of
funding, such as private industry and foundations.
Sequestration mandated the National Institutes of Health (“NIH”) cut $1.6 B of its federal grant budget for the
2013 fiscal year; NIH appropriations did not exceed 2012 levels until 2016
Over the past 10 years, research applications have increased 14.2% to 54,220, while awards have only
increased 2.7% to 10,372
Source: NIH Data Book
9 © 2016 HURON CONSULTING GROUP INC.
-5%
5%
15%
25%
35%
$(5)
$5
$15
$25
$35
19
94
19
96
19
98
20
00
20
02
20
04
20
06
20
08
20
10
20
12
20
14
20
16 A
nn
ual
Ap
pro
pri
atio
ns
% G
row
th
NIH
Ap
pro
pri
atio
ns
($M
)
NIH Program Funding
Appropriations % Growth
0%
20%
40%
60%
80%
100%
0
20,000
40,000
60,000
1997 1999 2001 2003 2005 2007 2009 2011 2013 2015
Succ
ess
Rat
es
(%)
Ap
plic
atio
ns/
Aw
ard
s
Research Project Grants
Awards Applications Success Rate (%)
Source: NIH 2016 Data book
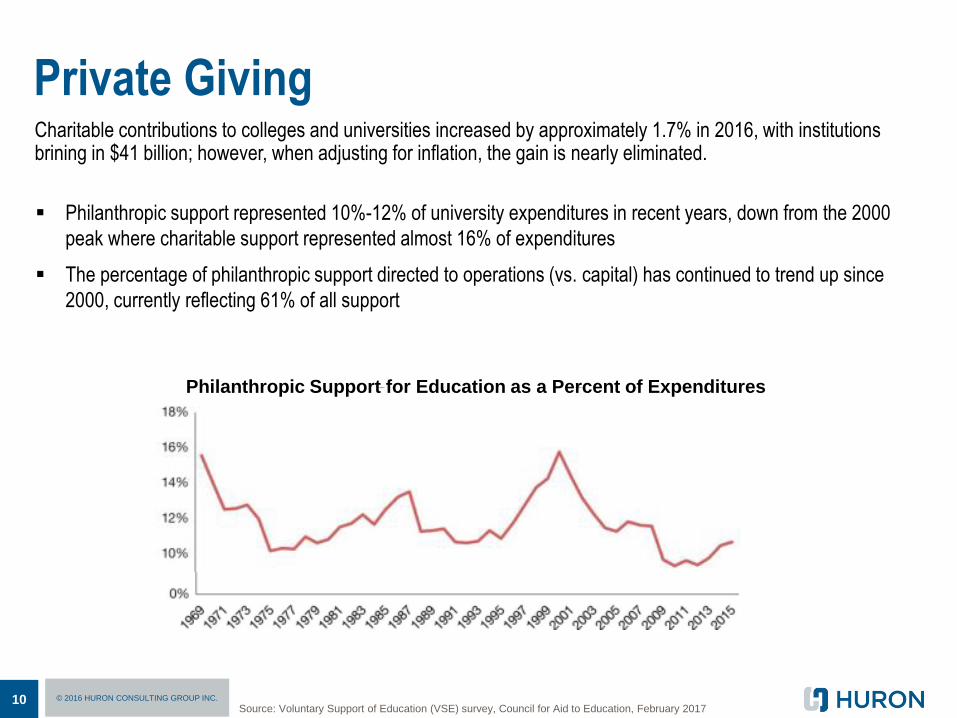
Charitable contributions to colleges and universities increased by approximately 1.7% in 2016, with institutions brining in $41 billion; however, when adjusting for inflation, the gain is nearly eliminated.
Private Giving
Source: Voluntary Support of Education (VSE) survey, Council for Aid to Education, February 201710 © 2016 HURON CONSULTING GROUP INC.
Philanthropic support represented 10%-12% of university expenditures in recent years, down from the 2000
peak where charitable support represented almost 16% of expenditures
The percentage of philanthropic support directed to operations (vs. capital) has continued to trend up since
2000, currently reflecting 61% of all support
Philanthropic Support for Education as a Percent of Expenditures

Persistent economic pressures and a changing marketplace continue to put pressure on higher education institutions, forcing university leaders to think differently.
Summarizing the State of Higher Education
While market pressures are significant, Moody’s 2017 Higher Education Outlook was described as “Stable with Clouds
Forming on Horizon” – an ominous forecast, yet rosier than the “negative” outlook provided in numerous recent years.
Source: Moody’s Investor Services, 2017 Outlook 11 © 2016 HURON CONSULTING GROUP INC.
• Aggregate revenue growth will remain above 3% for both public and private universities.
– Modest net tuition revenue growth, incremental increases in state appropriations, stable research
funding and favorable academic medical center performance support stable revenue growth projections.
• Clouds are beginning to form on the horizon. Rising pension liabilities, increasing labor costs and
uncertainty around future federal policies and funding could weigh on the sector
• Changing business conditions will affect elements of the diverse sector differently.
– Universities, both public and private, with the strongest brands and value propositions for students will
continue to outperform.
– Smaller, more regionally oriented public and private universities will face the greatest challenges.
Selected Institutional Responses
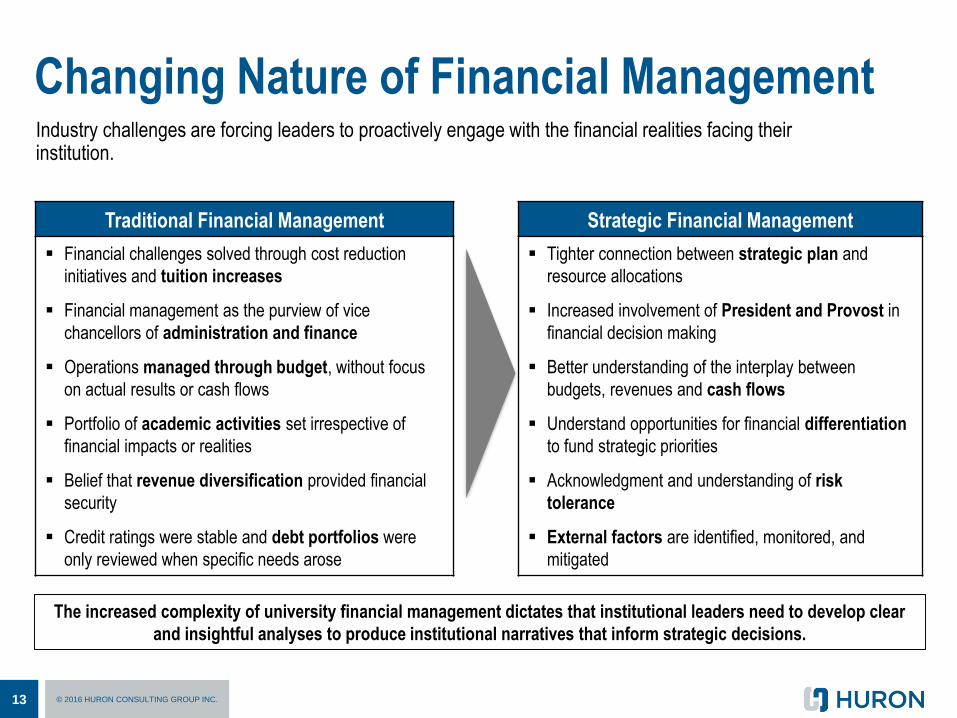
Changing Nature of Financial ManagementIndustry challenges are forcing leaders to proactively engage with the financial realities facing their institution.
The increased complexity of university financial management dictates that institutional leaders need to develop clear
and insightful analyses to produce institutional narratives that inform strategic decisions.
Traditional Financial Management
Financial challenges solved through cost reduction
initiatives and tuition increases
Financial management as the purview of vice
chancellors of administration and finance
Operations managed through budget, without focus
on actual results or cash flows
Portfolio of academic activities set irrespective of
financial impacts or realities
Belief that revenue diversification provided financial
security
Credit ratings were stable and debt portfolios were
only reviewed when specific needs arose
Strategic Financial Management
Tighter connection between strategic plan and
resource allocations
Increased involvement of President and Provost in
financial decision making
Better understanding of the interplay between
budgets, revenues and cash flows
Understand opportunities for financial differentiation
to fund strategic priorities
Acknowledgment and understanding of risk
tolerance
External factors are identified, monitored, and
mitigated
13 © 2016 HURON CONSULTING GROUP INC.
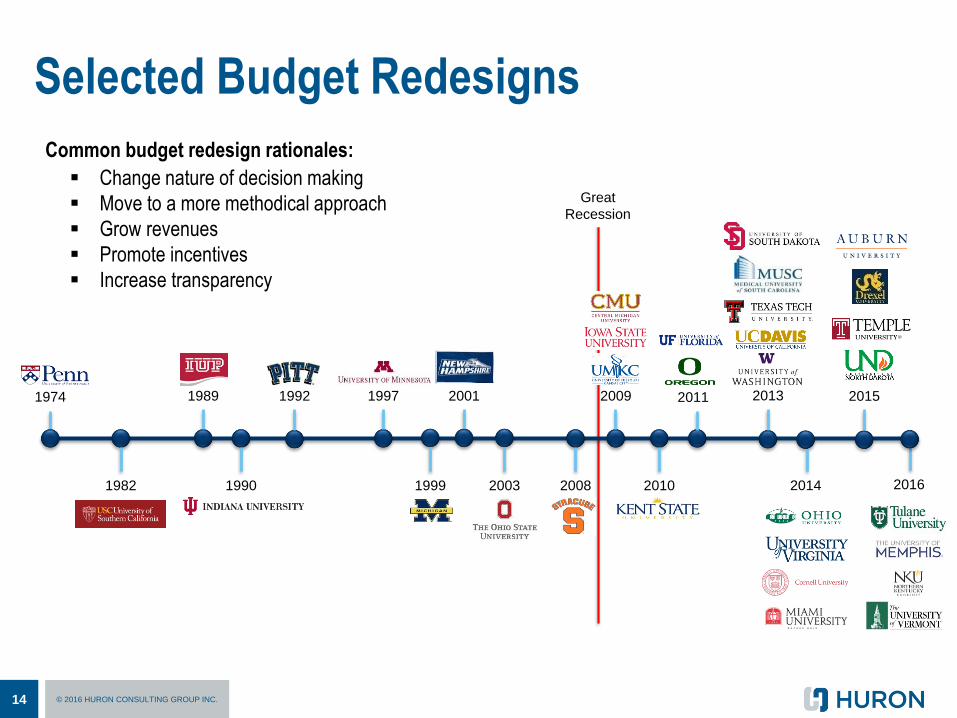
Selected Budget Redesigns
Common budget redesign rationales:
Change nature of decision making
Move to a more methodical approach
Grow revenues
Promote incentives
Increase transparency
2016
1974 1989
2008 2010
201120092001
1982
1997
1990
2013
2014
1992
20031999
Great
Recession
2015
14 © 2016 HURON CONSULTING GROUP INC.

Overview of Budgeting AlternativesInside Higher Ed’s 2016 survey of college business officers found that ~45% of institutions have significantly changed their approach to resource allocation in the past four years.
While incremental models remain the most common, the majority of institutions adopting new budget models are
opting for modified decentralized models of “highly centralized, decentralized models”.
15 © 2016 HURON CONSULTING GROUP INC. (1) Adoption rates from the 2011 Inside Higher Education Survey of College and University Business Officers; Percentages do not add to 100% due to
hybrid budgeting models
Common Budgeting Models1
Incremental Budgeting
Centrally driven
Current budget acts as “base”
Each year’s budget increments
(decrements) adjust the base
Focus is typically placed on
expenses
Common modifications:
– Block-grant models bucket line-
items together to promote local
control
– Revenue incentives may be
incorporated for the allocation of
resources above-and-beyond
the base
Approximately 60% of institutions
and 79% of public doctoral
institutions report using this model
Formula Funding
Unit-based model focused on
providing equitable funding
Unit rates are input-based and
commonly agreed upon
Annual fluctuations are driven
primarily by the quantity of
production and not from changes
to rates
Common modifications:
– Weighting schemes to
control for local cost
structures
– Used only for select activities
(e.g., instruction)
Approximately 26% of institutions
and 45% of public doctoral
institutions utilize a formula
funding model
Performance Funding
Unit-based model focused on
rewarding mission delivery
Unit rates are output based and
commonly agree upon
Annual fluctuations are driven
primarily by changing production
and not from changes to rates
Common modifications:
– Weighting schemes to
control for local unit mission
– Used only for small portions
of overall resources (as little
as 1% - 5%)
Approximately 20% of institutions
and 26% of public doctoral
institutions utilize a performance
funding model
Incentive-Based Models
Focus on academic units
Incorporates a devolution of
revenue ownership to local units,
as generated
Allocates costs to revenue
generating units
Utilizes a centrally managed
“subvention pool” to address
strategic priorities
Common modifications:
– Revenue allocation rules
– Number of cost pools
– Participation fee (tax rate)
Approximately 14% of all
institutions and 21% of public
doctoral institutions use an
incentive-based model
Budget Redesign Motivating Factors
General Benefits
Translates strategic goals into management and operating plans
Lets strategy, not history, drive resource allocation
Facilitates two-way discussions between entities, a joint understanding of markets, and annual discussions
about institutional priorities
Optimizes incentives with the potential to create win-win opportunities across an entire institution
Benefits of Incentive-based Models
Aligns budgetary authority with responsibility and accountability
Focuses necessary and proper attention on revenues and revenue development
Fosters entrepreneurship and rewards departmental efforts
Encourages efficient and competent administrative services
Identifies the true nature of internal subsidies (transfer payments)
16 © 2016 HURON CONSULTING GROUP INC.
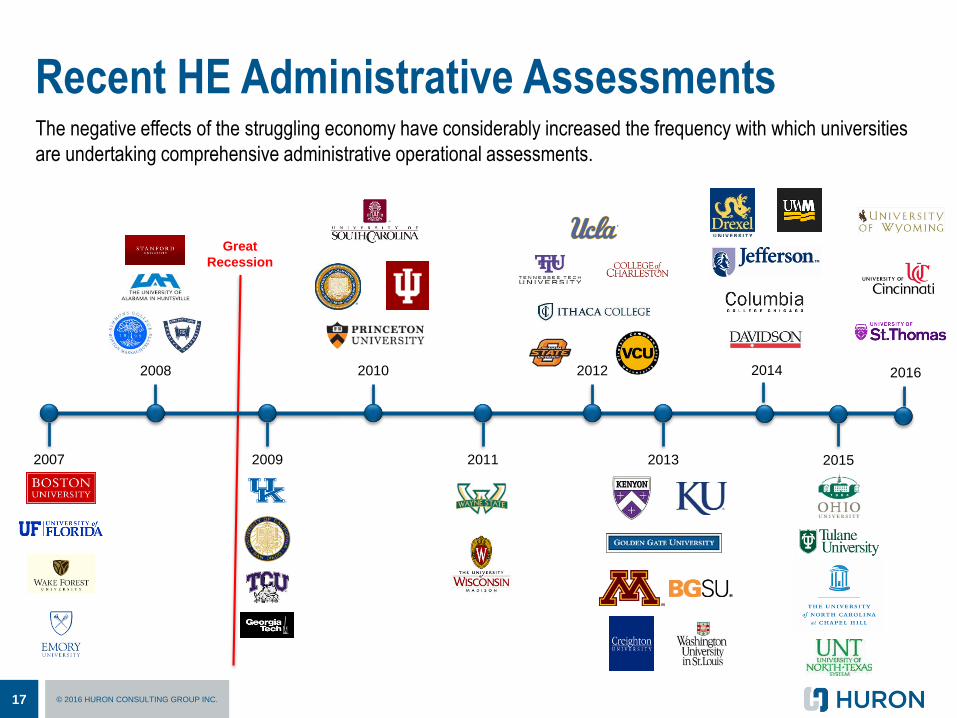
Recent HE Administrative AssessmentsThe negative effects of the struggling economy have considerably increased the frequency with which universities
are undertaking comprehensive administrative operational assessments.
2007
20122010 2014
2015
Great
Recession
2009 2011
2008
2013
2016
17 © 2016 HURON CONSULTING GROUP INC.
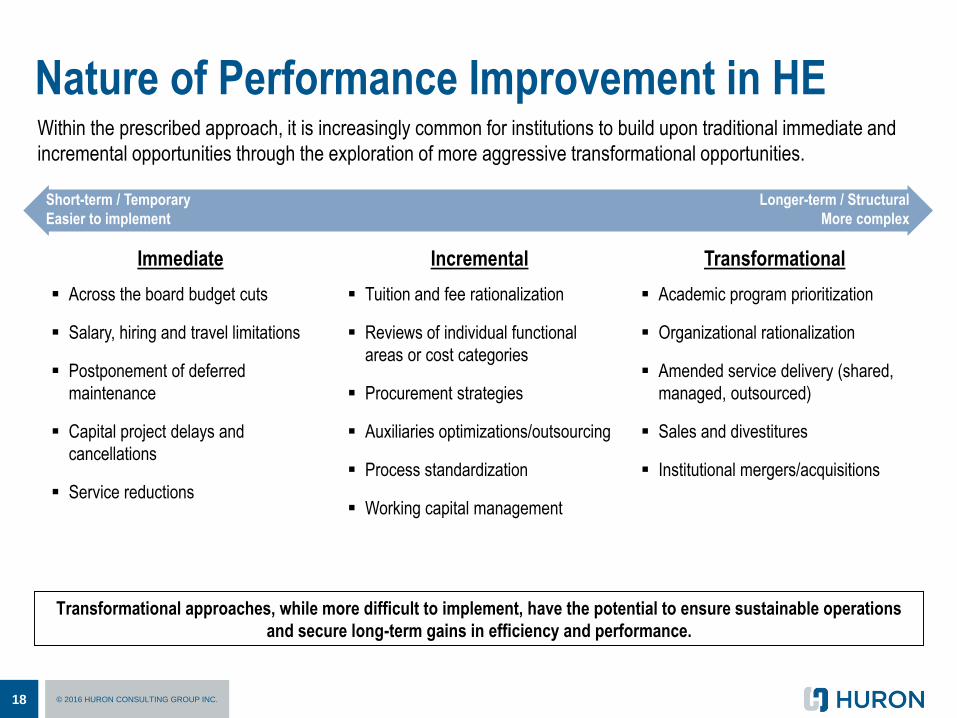
Within the prescribed approach, it is increasingly common for institutions to build upon traditional immediate and
incremental opportunities through the exploration of more aggressive transformational opportunities.
Nature of Performance Improvement in HE
Transformational approaches, while more difficult to implement, have the potential to ensure sustainable operations
and secure long-term gains in efficiency and performance.
Immediate
Across the board budget cuts
Salary, hiring and travel limitations
Postponement of deferred
maintenance
Capital project delays and
cancellations
Service reductions
Short-term / Temporary
Easier to implement
Longer-term / Structural
More complex
Incremental
Tuition and fee rationalization
Reviews of individual functional
areas or cost categories
Procurement strategies
Auxiliaries optimizations/outsourcing
Process standardization
Working capital management
Transformational
Academic program prioritization
Organizational rationalization
Amended service delivery (shared,
managed, outsourced)
Sales and divestitures
Institutional mergers/acquisitions
18 © 2016 HURON CONSULTING GROUP INC.

The Holistic Approach
Holistic and data-driven approach that measures
and improves student success
Model positions the student journey as a
continuous cycle—with critical points of
engagement throughout—beginning when
students are first recruited and post graduation
when alumni
Crucial to consistently engage students at every
stage as their needs evolve, strengthening that
individual stage and enhancing the overall
lifecycle.
Student Lifecycle Management
19 © 2016 HURON CONSULTING GROUP INC.
Institutions are increasingly shifting enrollment operations to focus on Student Lifecycle Management — the
student’s entire journey — from recruiting through the entire educational experience.
These holistic approaches to student lifecycle management have been strengthened considerably in recent years as
more institutions leverage data-mining for student success and CRM tools for relationship management.
Increasingly institutions are using data to create early warning systems to identify students at risk, though
many institutions are still struggling with how to collect, store and share data that can be used in a meaningful
way to support student success.
As institutions shift focus from recruitment to retention, many institutions are wrestling with how to shift
financial aid away from merit aid towards need-based aid, as one of the biggest drivers to retention is
addressing the amount of unmet need for low and middle-socioeconomic students.
Increasingly, colleges and universities have become more reliant on full-pay (or near full-pay) international
students who have help to counter uncertainty regarding state appropriations, declines in domestic
enrollments, and increasing price sensitivity.
– International students contributed $35.8 billion to the U.S. economy in 2015 (1)
Institutions are facing challenges due to aging technology infrastructures, and finding ways to enhance
student / alumni engagement has resulted in an the increased adoption of CRM technology and enhanced
Student Information Systems (SIS) to meet these changing needs
Strategic Enrollment Management
20 © 2016 HURON CONSULTING GROUP INC.
In addition to the overall trend of shifting to a Student Lifecycle approach to enrollment management, Huron has noted trends associated with early warning systems, need-based aid, international students and technology tools.
(1) U.S. Department of Commerce.
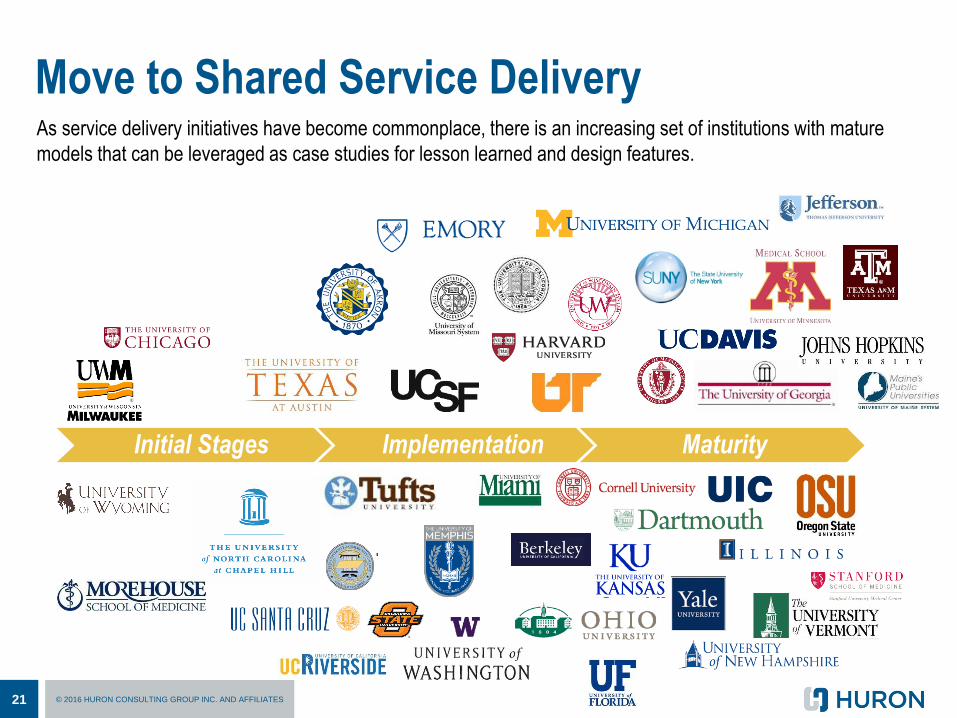
Move to Shared Service Delivery
21 © 2016 HURON CONSULTING GROUP INC. AND AFFILIATES
Initial Stages Implementation Maturity
As service delivery initiatives have become commonplace, there is an increasing set of institutions with mature
models that can be leveraged as case studies for lesson learned and design features.
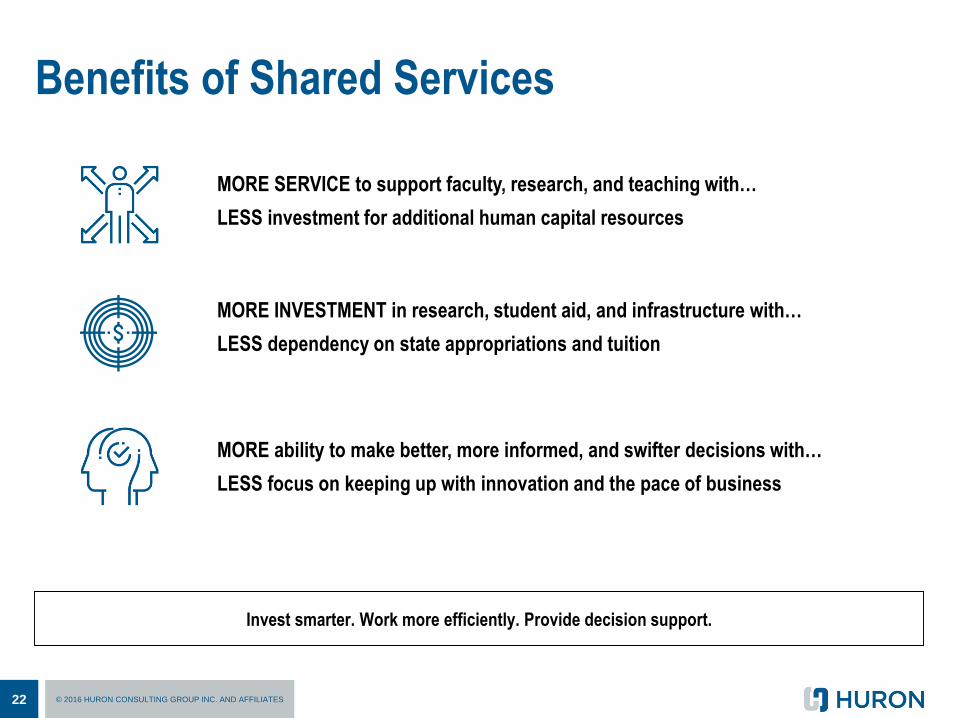
Benefits of Shared Services
22 © 2016 HURON CONSULTING GROUP INC. AND AFFILIATES
MORE SERVICE to support faculty, research, and teaching with…
LESS investment for additional human capital resources
MORE INVESTMENT in research, student aid, and infrastructure with…
LESS dependency on state appropriations and tuition
MORE ability to make better, more informed, and swifter decisions with…
LESS focus on keeping up with innovation and the pace of business
Invest smarter. Work more efficiently. Provide decision support.

Shared Services Lessons Learned
23 © 2016 HURON CONSULTING GROUP INC. AND AFFILIATES
Hasty Commitment to Shared Services – Shared services is only one of a number of models that may
improve operational challenges at a university.
Lack of Stakeholder Involvement – Change in an organization’s structure and operations require broad
stakeholder involvement throughout process.
Underestimating the Human Element – Identifying processes and deploying technology to move to a
shared service model is only the start of the effort; engaging employees and effectively managing transitions
are necessary for success.
Elusive ‘Silver Bullet’ – Shared services have been developed at many institutions; while there are common
elements to successful efforts, each implementation is uniquely tailored to the culture, goals and resources of
the institution.
Information Gap – A lack of clear, concise and complete communication to the campus leads to fear and,
often, unnecessary anxiety by stakeholders.
Unrealistic Savings Targets – Often initiated with the prime focus on achieving cost-savings,
implementation efforts often reduce expected savings after the realities of the changes set in.
Perhaps the most notable lesson from recent higher education shared services initiatives is that cookie cutter
efforts, mirrored on decades of corporate initiatives are unlikely to work in higher education settings.

Recent academic program reviews have taken the form of program prioritization efforts (e.g. Dickenson) or cost of education studies, the majority of which resulted in limited efficiencies and lasting change.
Selected Academic Program Reviews
24 © 2016 HURON CONSULTING GROUP INC.
2006
20112009 2013
20142008 2010
2007
2012 2016
2015
Other Notable Cost of Education Initiatives Include:
Delaware Study (national study sponsored by faculty)
States of Illinois, Minnesota, Texas, and Virginia
State Higher Education Executive Officers (SHEEO) study focused on Florida, Illinois, New York and Ohio
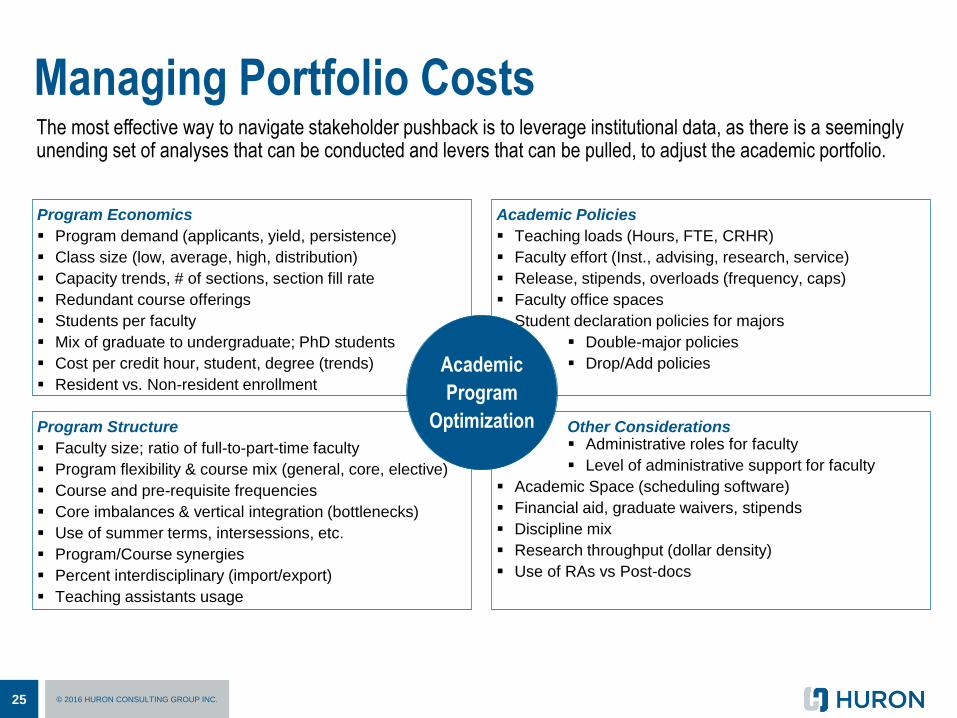
Managing Portfolio Costs
25 © 2016 HURON CONSULTING GROUP INC.
Program Economics
Program demand (applicants, yield, persistence)
Class size (low, average, high, distribution)
Capacity trends, # of sections, section fill rate
Redundant course offerings
Students per faculty
Mix of graduate to undergraduate; PhD students
Cost per credit hour, student, degree (trends)
Resident vs. Non-resident enrollment
Program Structure
Faculty size; ratio of full-to-part-time faculty
Program flexibility & course mix (general, core, elective)
Course and pre-requisite frequencies
Core imbalances & vertical integration (bottlenecks)
Use of summer terms, intersessions, etc.
Program/Course synergies
Percent interdisciplinary (import/export)
Teaching assistants usage
Other Considerations Administrative roles for faculty
Level of administrative support for faculty
Academic Space (scheduling software)
Financial aid, graduate waivers, stipends
Discipline mix
Research throughput (dollar density)
Use of RAs vs Post-docs
Academic Policies
Teaching loads (Hours, FTE, CRHR)
Faculty effort (Inst., advising, research, service)
Release, stipends, overloads (frequency, caps)
Faculty office spaces
Student declaration policies for majors
Double-major policies
Drop/Add policiesAcademic
Program
Optimization
The most effective way to navigate stakeholder pushback is to leverage institutional data, as there is a seemingly unending set of analyses that can be conducted and levers that can be pulled, to adjust the academic portfolio.

The array of academic programs an institution offers, when strategically designed, powerfully supports its
competitive advantage in the marketplace, leading to distinctiveness and long term financial sustainability
The illustrative portfolio below raises questions about the institution’s financial sustainability, as the institution’s
primary low-cost areas are in decline, while the majority of high-cost areas are experiencing growth
The “Academic Portfolio”
26 © 2016 HURON CONSULTING GROUP INC.
$-
$400
$800
$1,200
$1,600
-7.0% -5.0% -3.0% -1.0% 1.0% 3.0% 5.0% 7.0%
Illustrative University-wide Academic Portfolio
Size Represents Enrollment
J ($3,700)
Average Annual Enrollment Growth
$3,700High Cost,
Enrollment
Decline
High Cost,
Enrollment
Growth
Low Cost,
Enrollment
Decline
Low Cost,
Enrollment
Growth
A
B
C
G
H
I
E
L
K
F
D
Instr
ucti
on
al C
ost
Per
CH
Average Cost per CH
Huron recommends that institutions think of their academic programs as a portfolio, in which academic leaders recognize the need to maximize resources, market relevance and mission-driven activities.
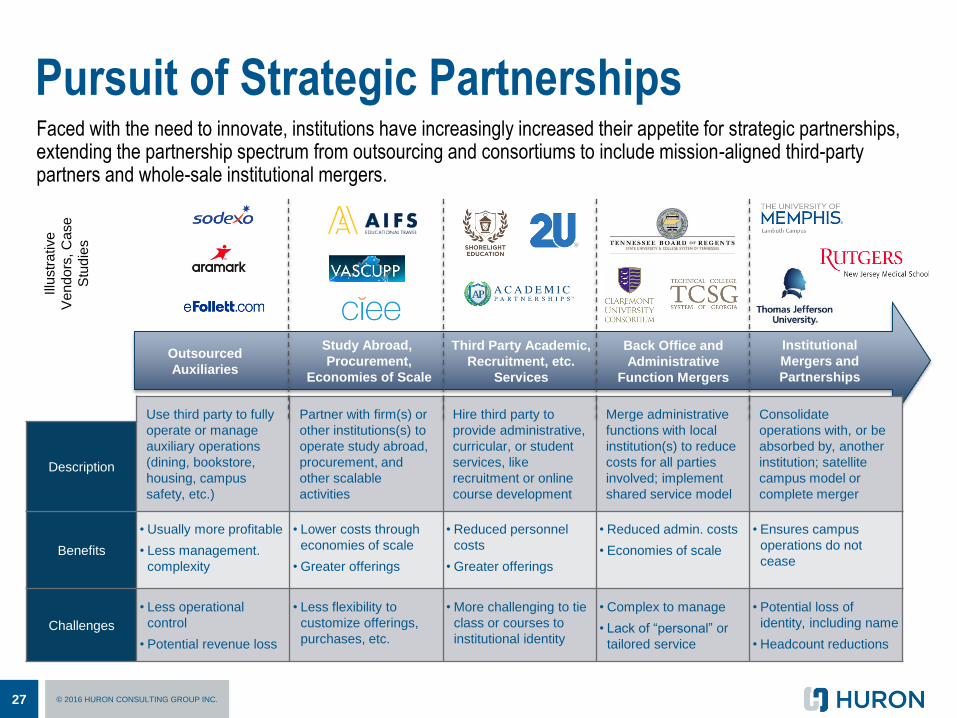
Pursuit of Strategic Partnerships
27 © 2016 HURON CONSULTING GROUP INC.
Faced with the need to innovate, institutions have increasingly increased their appetite for strategic partnerships, extending the partnership spectrum from outsourcing and consortiums to include mission-aligned third-party partners and whole-sale institutional mergers.
` Use third party to fully
operate or manage
auxiliary operations
(dining, bookstore,
housing, campus
safety, etc.)
Partner with firm(s) or
other institutions(s) to
operate study abroad,
procurement, and
other scalable
activities
Hire third party to
provide administrative,
curricular, or student
services, like
recruitment or online
course development
Merge administrative
functions with local
institution(s) to reduce
costs for all parties
involved; implement
shared service model
Consolidate
operations with, or be
absorbed by, another
institution; satellite
campus model or
complete merger
Description
Benefits
• Usually more profitable
• Less management.
complexity
• Lower costs through
economies of scale
• Greater offerings
• Reduced personnel
costs
• Greater offerings
• Reduced admin. costs
• Economies of scale
• Ensures campus
operations do not
cease
Challenges
• Less operational
control
• Potential revenue loss
• Less flexibility to
customize offerings,
purchases, etc.
• More challenging to tie
class or courses to
institutional identity
• Complex to manage
• Lack of “personal” or
tailored service
• Potential loss of
identity, including name
• Headcount reductions
Outsourced
Auxiliaries
Study Abroad,
Procurement,
Economies of Scale
Third Party Academic,
Recruitment, etc.
Services
Back Office and
Administrative
Function Mergers
Institutional
Mergers and
Partnerships
Illu
str
ative
Ve
nd
ors
, C
ase
Stu
die
s

Concluding Thoughts

Lessons Learned
29 © 2016 HURON CONSULTING GROUP INC.
Understand the University’s appetite for change and ability to effectuate change management
Clearly articulate campus and leadership initiative objectives and desired end-goals at the start
Engage faculty, process owners, and key campus stakeholders in solution development
Utilize data and objective measures to depersonalize and depoliticize change
Prioritize opportunities for implementation based on objective goals and realistic fortitude for change
Ensure planning process realistically considers required timeframe and assesses potential risks and
mitigation measures
Establish methods to continually measure savings achieved and track progress following implementation
Systematically update campus stakeholders on progress achieved to ensure continued commitment
As with any sensitive change management effort, it is critical that institutional change efforts are transparent, are data-informed, and that they utilize high levels of stakeholder engagement.
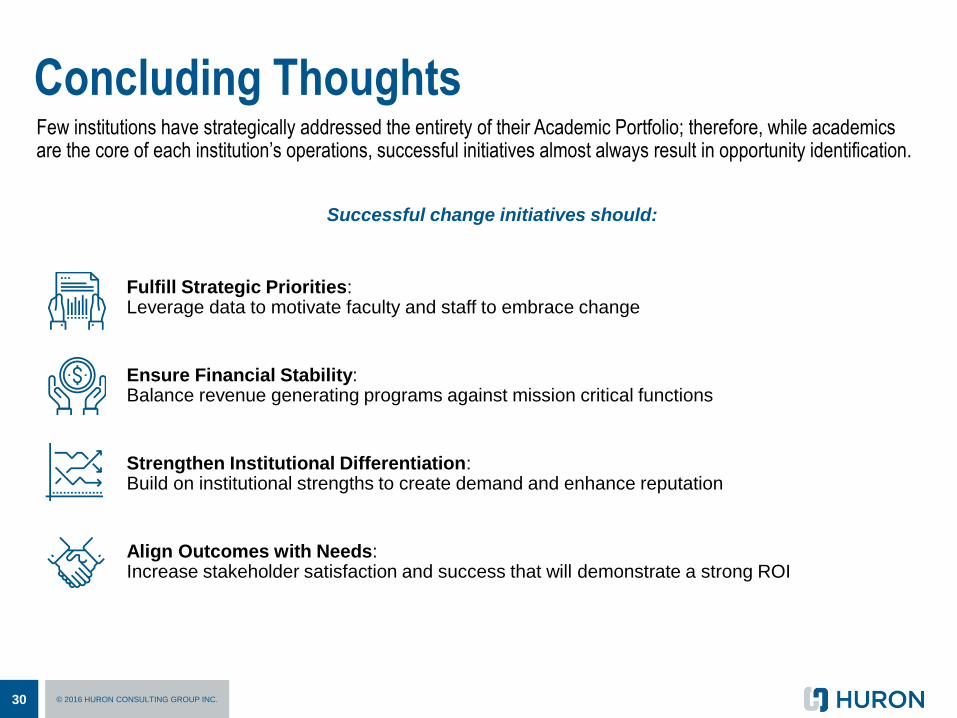
Concluding Thoughts
30 © 2016 HURON CONSULTING GROUP INC.
Successful change initiatives should:
Fulfill Strategic Priorities: Leverage data to motivate faculty and staff to embrace change
Ensure Financial Stability: Balance revenue generating programs against mission critical functions
Strengthen Institutional Differentiation: Build on institutional strengths to create demand and enhance reputation
Align Outcomes with Needs: Increase stakeholder satisfaction and success that will demonstrate a strong ROI
Few institutions have strategically addressed the entirety of their Academic Portfolio; therefore, while academics are the core of each institution’s operations, successful initiatives almost always result in opportunity identification.

Questions and Discussion
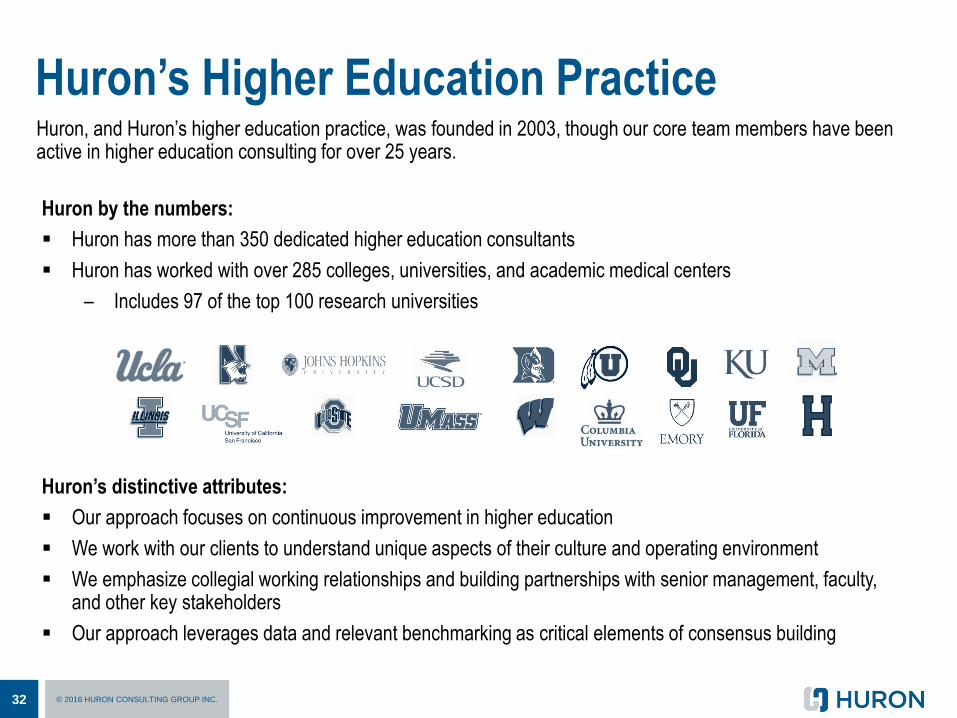
Huron’s Higher Education Practice
32 © 2016 HURON CONSULTING GROUP INC.
Huron by the numbers:
Huron has more than 350 dedicated higher education consultants
Huron has worked with over 285 colleges, universities, and academic medical centers
– Includes 97 of the top 100 research universities
Huron’s distinctive attributes:
Our approach focuses on continuous improvement in higher education
We work with our clients to understand unique aspects of their culture and operating environment
We emphasize collegial working relationships and building partnerships with senior management, faculty, and other key stakeholders
Our approach leverages data and relevant benchmarking as critical elements of consensus building
Huron, and Huron’s higher education practice, was founded in 2003, though our core team members have been active in higher education consulting for over 25 years.
+ Phone: 312-880-3201 | E-mail: [email protected]
Andrew L. LawsManaging Director
33 © 2016 HURON CONSULTING GROUP INC.
Andrew helps colleges and universities maximize, allocate and leverage financial resources. Andrew’s optimization projects include revenue enhancement and cost reduction initiatives; financial modeling and budget planning initiatives; and
organizational assessment and business process redesign initiatives. Andrew has led optimization projects at over 40 institutions and his recent clients include the University of Colorado, University of North Dakota, St. Thomas University, the University of Louisville and the University of Virginia.
Professional Experience
Prior to joining Huron, Andrew spent four years in investment banking,
focused on financial modeling, ratio analysis and revenue and cost
forecasting.
Signature Engagements
Directed a budget redesign initiative to help a $450 MM institution move from a modified incremental budget to an incentive-based budget model. The model’s goal is to incentivize revenue growth, decentralize decision-making, and enhance institutional service levels. The engagement began in January 2011 and the University is scheduled to go-live with the model implementation for the 2013 fiscal year.
Led an evaluation of the resource management, planning, and allocation process for a leading university with a $2.7 billion budget. Documented and analyzed the processes, policies, and incentives used by the institution and its peers, and designed a two-year implementation plan.
Managed a resource optimization project at a top 30 private liberal arts university. The project targeted 20 non-academic departments including auxiliaries, financial operations, and student services. The engagement resulted in nearly 75 revenue enhancement and cost reduction recommendations.
Education
Doctor of Education, Vanderbilt University
Master of Business Administration, University of Chicago
Bachelor in Business Administration, University of Mississippi
Publications
Responsibility Center Management, A Guide to Balancing Academic Entrepreneurship with Fiscal Responsibility, with John R. Curry and Jon C. Strauss, NACUBO, 2013
The Buck Stops Elsewhere, The Business Officer, NACUBO, January 2013
Professional Associations
Speaking engagements include, AAU Provost Council (2016), CACUBO Annual Meeting (2014); NACUBO Budget Forum (2014, 2013); SACUBO Annual Meeting (2014); NACUBO Higher Education Accounting Forum (2014); EACUBO Annual Meeting ( 2011)
Faculty Member, Higher Education Finance, Vanderbilt University, Peabody Professional Institute, 2012-2014
Chairman, Private College Research Incentives Subgroup, Mississippi Secretary of State Business Incentives Study Group, 2012
Board of Directors, The University of Mississippi Alumni Association, 2005-2008

+ Phone: C 773 368 0967 | E-mail: [email protected]
Jason Moebius Managing Director
34 © 2016 HURON CONSULTING GROUP INC.
Jason is a senior leader in Huron’s Health and Education practice with 15 years of experience assisting hospitals and universities improve their performance and implement business critical applications as part of large scale change initiatives. Jason specializes in assisting institutions with enterprise transformation initiatives that improve performance by focusing on people, process, and technology.
Professional Experience
Jason has led over 30 process improvement and technology
implementation projects in the areas of Finance, HR/Payroll, Research,
Business Intelligence and Budgeting, leveraging all leading enterprise
technologies, including Oracle Cloud, Workday and PeopleSoft.
Signature Engagements Supporting the deployment of Oracle Cloud Financials and Projects at
Allegheny Health Network.
Providing Oversight for enterprise technology program at Cincinnati Children’s Hospital focused on improving business process efficiency as part of upgrade to existing PeopleSoft FSCM, HCM, EPM, and ELM applications to version 9.2, as well as the implementation several new Click research administration applications.
Assisted the University of Wyoming with a comprehensive Cloud Planning Program, which included process analysis, requirements gathering, software selection, business case development and implementation planning.
Providing program oversight for the upgrade of PeopleSoft HCM to version 9.2 at the University of Oklahoma Health Sciences Center.
Providing executive oversight for implementation of PeopleSoft Grants Suite and upgrade of PeopleSoft Financials to version 9.2 at the University of California – Berkeley.
Recently served as the program advisor for an implementation of PeopleSoft Financials at City of Hope National Medical Center. Providing coordination with multiple consulting firms assisting with the implementation.
Served as quality assurance director for Financials integration team involved in the implementation of PeopleSoft HCM for the University of Wisconsin
• Directed the implementation of five PeopleSoft Financials modules
(version 9.0) for the University of Oklahoma Health Sciences Center.
• Managed complex implementation of multiple PeopleSoft Financials
modules (version 8.9) for the University of Wisconsin.
Education
Bachelor of Science, Management Information Systems and Organizational Behavior majors, Miami University, Oxford, Ohio
Speaking Engagements
Frequent presenter at HIUG and HEUG conferences
Host for multiple Huron Consulting Group Webinars on technology and project management
Professional Associations
Member, Project Management Institute (PMI)
Member, Educause
Member, HIMSS

THANK YOU