trends for the brazilian foundry industry · • considering investments in petrochemical industry,...
TRANSCRIPT

TRENDS FOR THE BRAZILIAN FOUNDRY INDUSTRYBrazilian Foundry Association – ABIFA
Oct/2013
MAIN TOPICS
1) Brazil in figures2) Infrastructure3) Cast Metal in Brazil and Worldwide4) Cast Metal - Characteristics5) Exports – Evaluation6) Trends of Brazilian Industry

BRAZIL
POPULATION: 201 MILLION
AREA: 8.5 MILLION km2.
GDP: 2.39 TRILLION US$ (2012)
Economy: The largest in Latin America and 6th in the world
Car fleet: 32.1 million (2010)
Export 2012: 242,6 billion US$
Import 2012: 223,1 billion US$

MAIN TOPICS
1) Brazil in figures2) Infrastructure3) Cast Metal in Brazil and Worldwide4) Cast Metal - Characteristics5) Exports – Evaluation6) Trends of Brazilian Industry

Foundry IndustryRaw Material (%)
Surplus to export
5
100
28,8
100
36,5
100
40
0
20
40
60
80
100
Pig Iron Aluminum Ferroalloys
production exports

95,7
258,8
0
50
100
150
200
250
300
Installed Energy Potential
Foundry IndustryElectric Power
Hydro Generation is the main source
6

• Foundry Technical Courses
• Metallurgical Engineering
• Foundry MBA
• Foundry Engineering
Foundry IndustryWell-Trained Manpower
7

MAIN TOPICS
1) Brazil in figures2) Infrastructure3) Cast Metal in Brazil and Worldwide4) Cast Metal - Characteristics5) Exports – Evaluation6) Trends of Brazilian Industry

Foundry in BRAZILRegional Production
South + Southeast = 91%
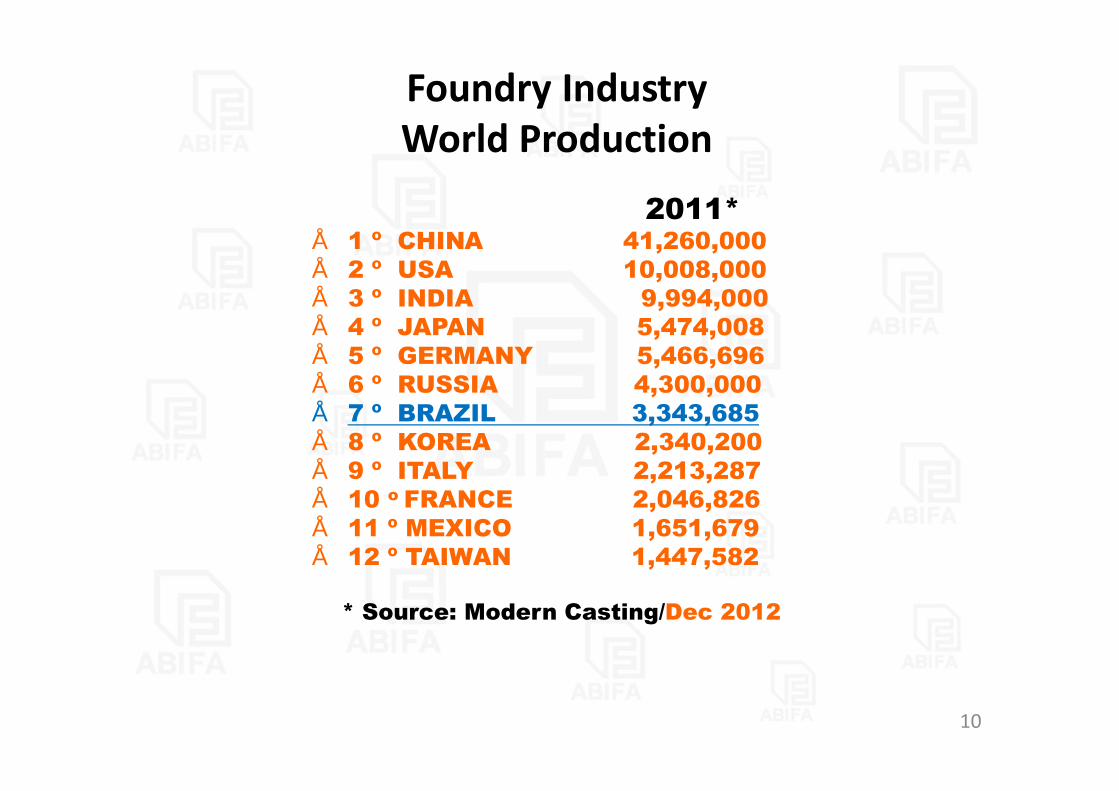
Foundry Industry World Production
2011*• 1 º CHINA 41,260,000• 2 º USA 10,008,000• 3 º INDIA 9,994,000• 4 º JAPAN 5,474,008• 5 º GERMANY 5,466,696• 6 º RUSSIA 4,300,000• 7 º BRAZIL 3,343,685• 8 º KOREA 2,340,200• 9 º ITALY 2,213,287• 10 o FRANCE 2,046,826• 11 º MEXICO 1,651,679• 12 º TAIWAN 1,447,582
* Source: Modern Casting/Dec 2012
10
MAIN TOPICS
1) Brazil in figures2) Infrastructure3) Cast Metal in Brazil and Worldwide4) Cast Metal - Characteristics5) Exports – Evaluation6) Trends of Brazilian Industry

Foundry IndustryIron Casting – Characteristics
Distribution of the Production
7th. World Production
BASE YEAR 2012
Sales Revenue billion US$ 6.56Direct Jobs (thousand) 40.45
Production t/year 2.4MillionInstalled Capacity t/year 3.5Million
Nb. of Companies 521 – 95% Small/Medium
12

Foundry Industry Gray Iron + malleable / nodular (2012)
unit: thousand ton
13

Foundry Industry Steel Casting - Characteristics
Distribution of the Production
6th. World Production
BASE YEAR 2012
Sales Revenue billion US$ 1.72
Directs Job (thousand) 4.18
Production thousand t/year 258.1
Installed Capacity (th) t/year 320
Nb. of Companies 192 - 95% Small/Medium
14
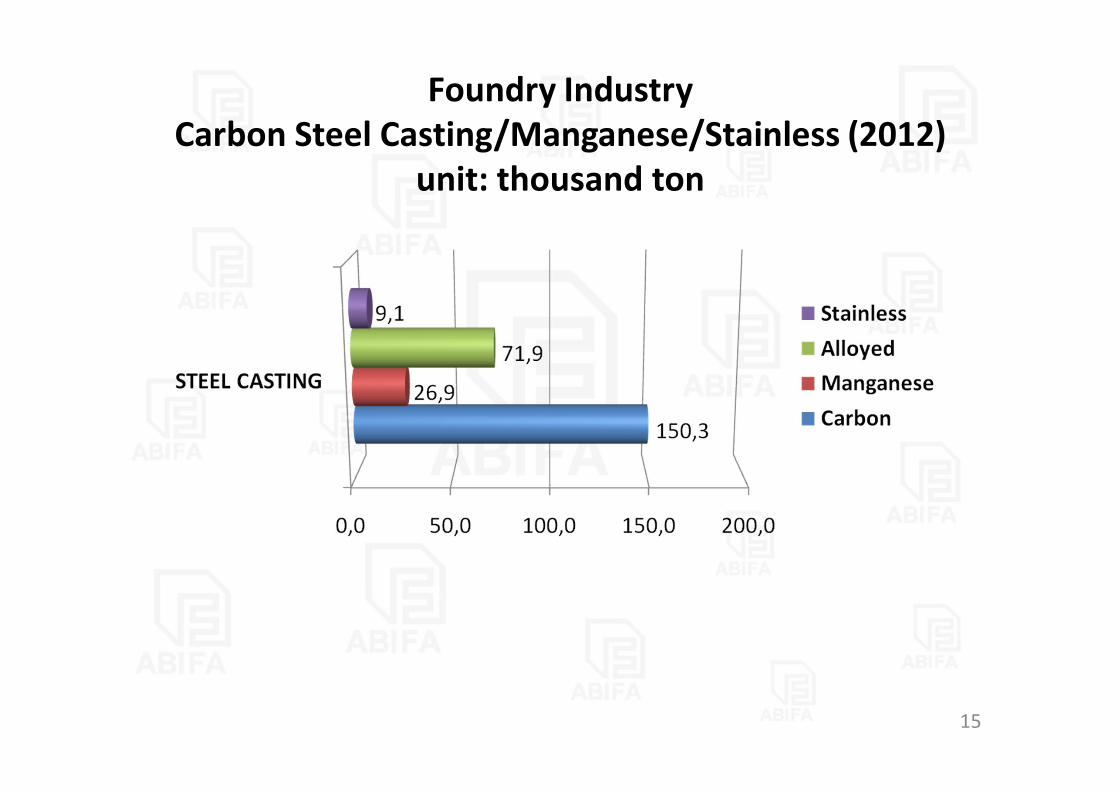
Foundry Industry Carbon Steel Casting/Manganese/Stainless (2012)
unit: thousand ton
15

Foundry Industry Aluminum Casting – Characteristics
Distribution of the Production
13st. World Production
BASE YEAR 2012
Sales Revenue billion US$3.64
Directs Job (thousand) 4.3
Production th t/year 241
Instal. Cap. th t/year 320
Nb. of Companies 334 - 95% Small/Medium
7
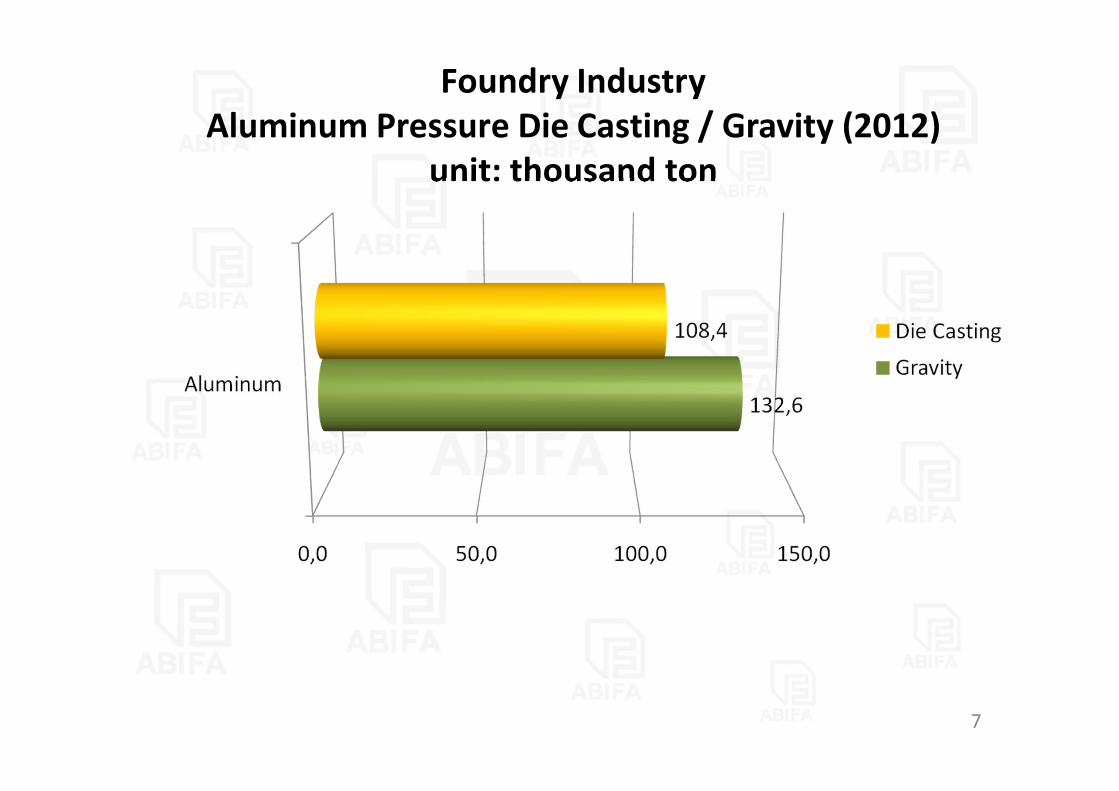
Foundry Industry Aluminum Pressure Die Casting / Gravity (2012)
unit: thousand ton
7

Foundry Industry General Characteristics (Iron+Steel+Non Ferrous)
BASE YEAR 2012Sales Revenue billion US$ 11.4
Directs Job (thousand) 64.1
Production Million (t/year) 2.9
Installed Capacity (t/year) 4.2 million
Companies132595%
Small/Medium
7th. World Production18

MAIN TOPICS
1) Brazil in figures2) infrastructure3) Cast Metal in Brazil and Worldwide4) Cast Metal - Characteristics5) Exports – Evaluation6) Trends of Brazilian Industry

Foundry IndustryMetalcasting Exports – ton and thousand US$ (2000-11)
Iron + Steel + Non Ferrous

Foundry Industry Exports by Metal – ton (2000-11)
(Iron, Steel and Non Ferrous)
21

Foundry IndustryMetalcasting Exports by Metal – (thousand US$)
Iron, Steel and Non Ferrous
22
2000 2001 2002 2003 2004 2005 2006 2007 2008 2009 2010 2011 2012
280244
332
421
555
702
811873
990
476
881
1.129917
52 41 54 50129
215
329 245 272
136164 207 191
66 52 61 94168
178234 236 232 151
140185
254
Ferro Aço Não FerrososIRON STEEL NON FERROUS

Foundry Industry Exports by Destination – US$ - %
Iron + Steel + Non Ferrous
23

MAIN TOPICS
1) Brazil in figures2) Infrastructure3) Cast Metal in Brazil and Worldwide4) Cast Metal - Characteristics5) Exports – Evaluation6) Trends of Brazilian Industry
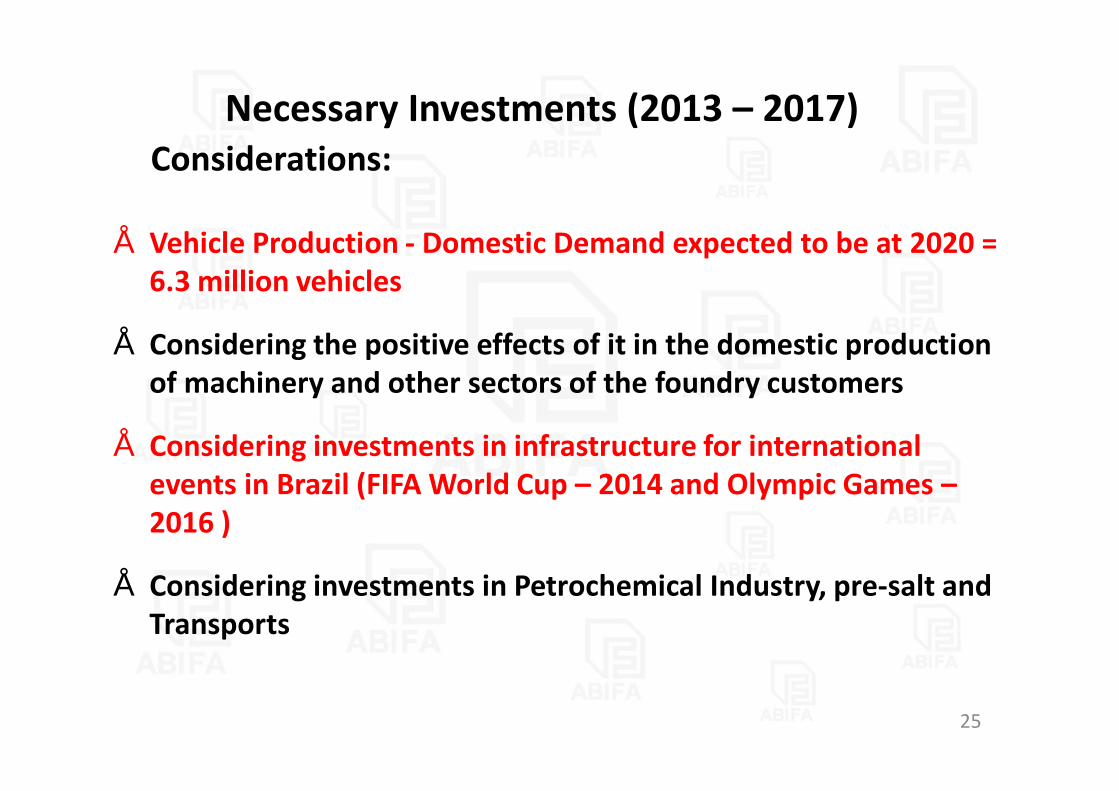
• Vehicle Production - Domestic Demand expected to be at 2020 = 6.3 million vehicles
• Considering the positive effects of it in the domestic production of machinery and other sectors of the foundry customers
• Considering investments in infrastructure for international events in Brazil (FIFA World Cup – 2014 and Olympic Games –2016 )
• Considering investments in Petrochemical Industry, pre-salt and Transports
Necessary Investments (2013 – 2017) Considerations:
25
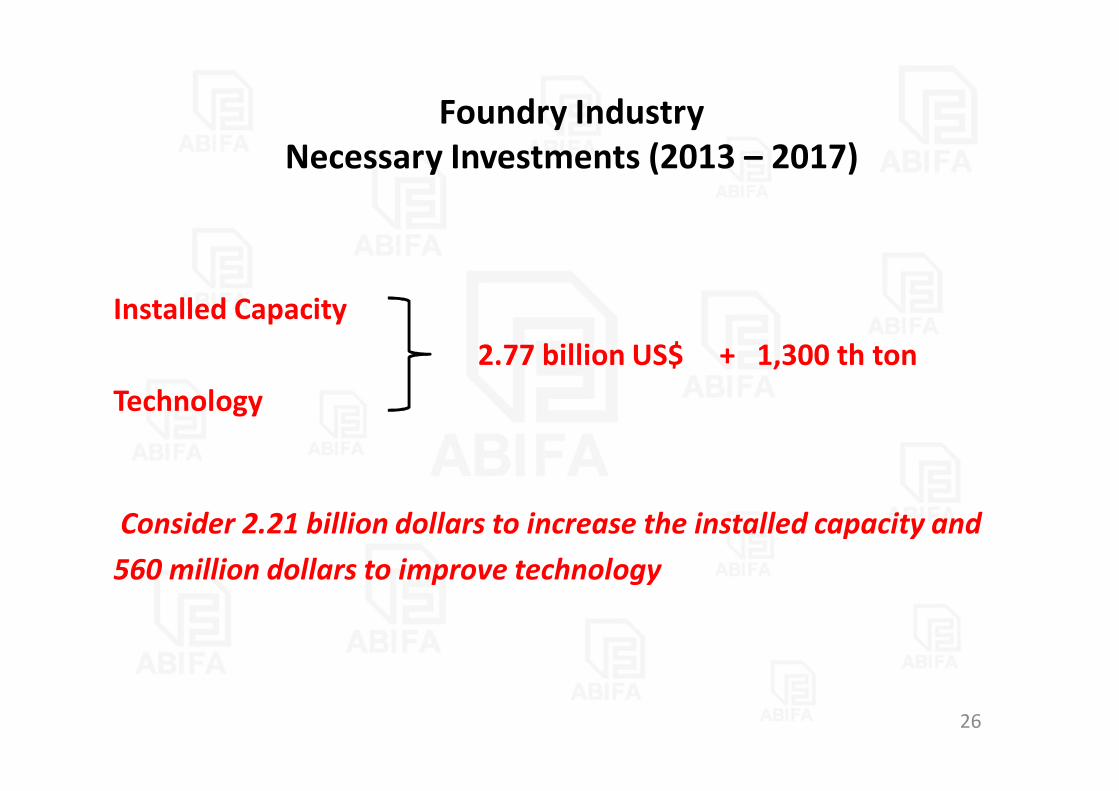
Installed Capacity 2.77 billion US$ + 1,300 th ton
Technology
Consider 2.21 billion dollars to increase the installed capacity and560 million dollars to improve technology
Foundry Industry Necessary Investments (2013 – 2017)
26

PRODUCTION FORCAST – 2013
METALS (t) FORCAST INSTALLED CAPACITY
OCCUPANCY RATE
IRON 2700 3530 76%
STEEL 230 320 72%
NON FERROUS 270 350 77%
TOTAL 3200 4200 76%
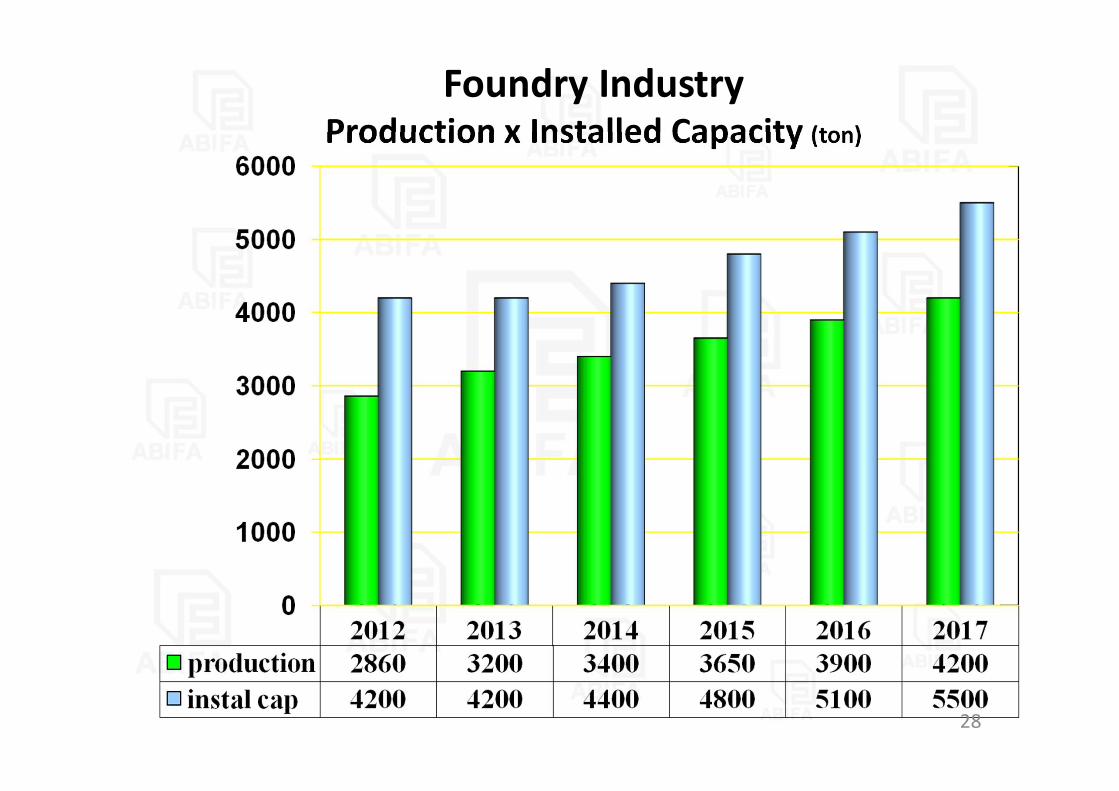
Foundry Industry Production x Installed Capacity (ton)
28

Associação Brasileira de Fundição - ABIFABrazilian Foundry Association – ABIFA Av. Paulista, 1274 – 20o. Andar – S.Paulo-SP - BrasilPh: (+55 11) 3549-3344 and Fac (+55 11) 3549-3355www.abifa.org.br Oct/2013
29
THANK YOU !
謝謝