trends in cardiovascular deaths (aihw)€¦ · heart attack mortality ... close to 200,000 deaths...
TRANSCRIPT

bulle
tin 1
41Bulletin 141 • September 2017
Trends in cardiovascular deaths
SummaryDeath rates from cardiovascular disease have fallen considerably in Australia. These declines began in the late 1960s, and have continued to 2015, at varying rates, depending on diseases and age groups.
While cardiovascular disease death rates continue to fall across all age groups, the rate of decline in younger age groups has slowed in recent years.
For coronary heart disease, falls in death rates continue to improve among older age groups (those aged 75 and over), but have slowed among younger age groups.
For example, for those aged 35–54, the fall in coronary heart disease deaths has slowed from an average of 7.2% each year (1980–1993) to an average of 3.1% (1993–2015).
For cerebrovascular disease (including stroke), falls in death rates have remained steady for older age groups (those aged 75 and over), but have also slowed among most younger age groups.
For those aged 55–64, the fall in cerebrovascular disease deaths has slowed from an average of 6.0% each year (1980–2005) to an average of 2.2% (2005–2015).
These findings are consistent with previous reporting. Continued monitoring of changes in cardiovascular disease death rates provides the evidence that is needed to improve population-level prevention strategies for cardiovascular disease.
Since 1968, the cardiovascular disease death rate has fallen by 82%.
down82%
7.2
3.1%
1980-1993 1993-2015
%
6.0
2.2
1980-2005 2005-2015
%
%
35–54 years
Fall in CHD deaths has slowed
Fall in cerebrovascular disease deaths has slowed
55–64 years

Trends in cardiovascular deathsBulletin 141
2
ContentsSummary �������������������������������������������������������������������������������������������������������������������������������������������������1
Introduction ��������������������������������������������������������������������������������������������������������������������������������������������3
Long-term trends in cardiovascular mortality ���������������������������������������������������������������������������������4
Cardiovascular disease mortality �������������������������������������������������������������������������������������������������������6
Coronary heart disease mortality�������������������������������������������������������������������������������������������������������8
Heart attack mortality ������������������������������������������������������������������������������������������������������������������������10
Cerebrovascular disease mortality ��������������������������������������������������������������������������������������������������� 12
Prevention, treatment, and mortality rates �����������������������������������������������������������������������������������14
Mortality rate declines in other countries ���������������������������������������������������������������������������������������15
Appendix �����������������������������������������������������������������������������������������������������������������������������������������������16
Statistical tables �����������������������������������������������������������������������������������������������������������������������������������18
Acknowledgments �������������������������������������������������������������������������������������������������������������������������������20
Abbreviations ���������������������������������������������������������������������������������������������������������������������������������������20
References ��������������������������������������������������������������������������������������������������������������������������������������������21

3
IntroductionCardiovascular disease—including coronary heart disease and cerebrovascular disease—is a leading and serious disease in Australia.
In 2014–15, an estimated 643,000 adults had coronary heart disease, including angina and previous heart attack, and 308,000 were living with the effects of stroke or other cerebrovascular diseases (ABS 2015; AIHW 2016a). In 2011, cardiovascular disease was the second most burdensome disease group in Australia, behind cancers, causing 15% of the total 4.5 million disability-adjusted life years lost (AIHW 2016b).
Cardiovascular disease is largely preventable, and many of its risk factors can be modified, including tobacco smoking, high blood pressure and cholesterol, physical inactivity, poor nutrition, and obesity (AIHW 2015).
Controlling risk factors for cardiovascular disease can result in large health gains in the population. It reduces the risk of onset of disease, the progression of disease, and the development of complications in those people with established disease.
Despite the magnitude of the current cardiovascular disease burden, deaths from both coronary heart disease and stroke have declined substantially in Australia over the past 50 years. Levels peaked in the late 1960s and early 1970s, with cardiovascular disease responsible for 55% of all deaths each year (about 60,000 deaths). In 2015, cardiovascular disease was responsible for 29% of all deaths.
These falls are the result of a combination of improvements in preventing and detecting the disease, as well as clinical management of people who have it.
While the falls in death rates for cardiovascular disease in Australia have been widely reported, trends in specific age groups have received less attention. There is evidence that falls in the death rate from some forms of cardiovascular disease have accelerated in some older age groups, but have slowed in younger age groups in the recent past (AIHW 2010, 2014; O’Flaherty et al. 2012).
The slowing of falls in cardiovascular disease death rates are concerning, given the high disease burden, and the potential social and economic impacts. They highlight the need for effective and targeted prevention strategies (Sidney et al. 2016).
This bulletin helps readers to understand recent trends in cardiovascular disease mortality in Australia, and how these trends have differed across age groups (see Box 1).
It considers cardiovascular disease in total, followed by sections on coronary heart disease, heart attack (acute myocardial infarction), and cerebrovascular disease. This report focuses on the total population, and does not include trends by sex and population groups. These have been described in greater detail in previous reports, where similar patterns were found in age-specific coronary heart disease mortality trends for men and women (AIHW 2014).
Trends in cardiovascular deathsBulletin 141
4
Box 1: Trends in cardiovascular disease mortality rates
This bulletin provides details of recent trends in cardiovascular disease death rates by age groups, including from coronary heart disease, heart attack (acute myocardial infarction), and cerebrovascular disease.
Data from the AIHW National Mortality Database were used to calculate age-specific death rates between 1980 and 2015. Joinpoint regression analysis show points in time at which significant changes in the direction of the trend occurred, and the annual percentage change (APC) over these periods.
For further details, see the Appendix.
Long-term trends in cardiovascular mortalitySince the late 1960s and early 1970s, deaths from cardiovascular disease, coronary heart disease, and cerebrovascular disease have fallen markedly (Figure 1).
The age-standardised death rate for cardiovascular disease rose steadily over the first half of the 20th century. Between the early 1950s and the late 1960s it levelled, reaching a peak in 1968 of 830 deaths per 100,000 population. From 1968, the age-standardised rate fell by 82% to 151 per 100,000 population in 2015.
The large fall in the cardiovascular disease death rate since 1968 represents a substantial public health gain in terms of deaths delayed and years of life extended (AIHW 2009). If the cardiovascular disease death rate had remained at its 1968 peak, there would have been close to 200,000 deaths from cardiovascular disease alone in 2015—more than the total number of deaths from all causes that year.
The main driver of this decline was an 85% fall in coronary heart disease deaths between 1968 and 2015, from 428 to 66 deaths per 100,000 population.
The fall in the cerebrovascular disease death rate also made a large contribution, falling by 82%, from 202 deaths per 100,000 population in 1974 to 36 deaths per 100,000 in 2015.

5
Note: Rates have been standardised to the Australian population as at 30 June 2001.
Source: AIHW National Mortality Database.
Figure 1: Death rates for cardiovascular disease, coronary heart disease, and cerebrovascular disease, 1950–2015
As the death rate from cardiovascular disease fell, rates from other diseases, such as dementia rose. Dementia might soon overtake coronary heart disease as the single leading cause of death in Australia (ABS 2016). There are close associations between dementia and cardiovascular disease—cardiovascular disease itself is a major cause of dementia, and it is often listed as an associated cause when dementia is the underlying cause of death.
0
200
400
600
800
1,000
1,200
Year
Cardiovascular disease—malesCardiovascular disease—females
Coronary heart disease—malesCoronary heart disease—females
Cerebrovascular disease—malesCerebrovascular disease—females
Per 100,000 population
1950 1960 1970 1980 1990 2000 2010

Trends in cardiovascular deathsBulletin 141
6
Cardiovascular disease mortality The term ‘cardiovascular disease’ is used to describe many different conditions affecting the heart and blood vessels. The most common and serious forms of cardiovascular disease in Australia are coronary heart disease, stroke, and heart failure.
When considered as a broad group of diseases, cardiovascular disease has been a major cause of death in Australia for many decades. In 2015, it was the second leading cause of death (almost 45,400 deaths, or 29% of total deaths), closely following all types of cancer. More than three quarters (78%) of these cardiovascular disease deaths were of people aged 75 and over, and slightly more than half (52%) were women.
Over the 35 years from 1980 to 2015, the steady decline in cardiovascular disease death rates that began in the late 1960s has continued (Figure 1). The age-standardised death rate for cardiovascular disease fell by 73%, from 560 to 151 deaths per 100,000 population, or 3.9% per year.
Age-specific trendsWhile cardiovascular disease death rates fell substantially in each age group between 1980 and 2015, the rate of decline has varied across age groups (Figure 2).
• For older age groups, rates of decline have improved from an APC of 1.9% to 2.8% for those aged 85 and over, and from an APC of 2.8% to 5.1% for those aged 75–84.
• In other age groups, rates of decline have been slowing from an APC of 7.4% to 4.9% for those aged 65–74, from 6.6% to 2.8% for those aged 55–64, and from 3.5% to 1.9% for those aged 35–54.

7
Note: APC refers to annual percentage change, based on joinpoint regression analysis.
Source: AIHW National Mortality Database.
Figure 2: Age-specific death rates for cardiovascular disease, 1980–2015
0
2,000
4,000
6,000
8,000
10,000
12,000
14,000
1980 1985 1990 1995 2000 2005 2010 2015Year
85 and over
75–84
1994
APC –5.1%
APC –2.8%
APC –2.8%
Per 100,000 population
1997
fitted line, and turning pointAPC –1.9%
0
200
400
600
800
1,000
1,200
1,400
1,600
1,800
1980 1985 1990 1995 2000 2005 2010 2015Year
65–7455–6435–54
2006
199119842005
1989
1999
1997
1985fitted line, and turning point
APC –1.9%APC –3.5%APC –6.6%
APC –8.5%APC –2.8%
APC –6.6%
APC –4.6%
APC –4.9%
APC –7.4%
APC –4.7%
APC –3.1%
Per 100,000 population

Trends in cardiovascular deathsBulletin 141
8
Coronary heart disease mortalityCoronary heart disease (or ischaemic heart disease) is the most common form of cardiovascular disease. There are 2 major clinical manifestations—heart attack (often known as acute myocardial infarction) and angina.
For many decades, coronary heart disease has been the single leading cause of death in Australia. In 2015, it was the underlying cause of death for almost 19,800 Australians, or 12% of total deaths. Three-quarters (74%) of these coronary heart disease deaths were of people aged 75 and over, and less than half (44%) were women.
Among deaths attributed to coronary heart disease in 2015, heart attack was the underlying cause of more than 8,400 deaths, while chronic coronary heart disease was the underlying cause of more than 10,900 deaths.
Over the 35 years from 1980 to 2015, the steady decline in coronary heart disease death rates that began in the late 1960s has continued (Figure 1). The age-standardised death rate for coronary heart disease fell by more than three-quarters (78%), from 297 to 66 deaths per 100,000 population, or 4.5% per year.
Age-specific trendsAs for cardiovascular disease, coronary heart disease death rates fell substantially in each age group, with the rate of decline improving for older age groups (those aged 75 and over), but slowing among younger age groups.
• For older age groups, rates of decline have improved from an APC of 0.5% to 4.9% for those aged 85 and over, and from an APC of 2.2% to 6.3% for those aged 75–84.
• The rate of decline has slowed from an APC of 7.2% to 3.7% for those aged 55–64, and from 7.2% to 3.1% for those aged 35–54 (Figure 3).

9
Note: APC refers to annual percentage change, based on joinpoint regression analysis.
Source: AIHW National Mortality Database.
Figure 3: Age-specific death rates for coronary heart disease, 1980–2015
0
1,000
2,000
3,000
4,000
5,000
6,000
1980 1985 1990 1995 2000 2005 2010 2015Year
85 and over
75–84
2008
1994
APC –6.3%
APC –2.2%
APC –4.9%
APC –2.9%
APC –0.5%
Per 100,000 population
1994
fitted line, and turning point
0
200
400
600
800
1,000
1,200
1980 1985 1990 1995 2000 2005 2010 2015Year
65–7455–6435–54
2006
19932006
1988
1988
fitted line, and turning point
APC –3.1%APC –7.2% APC –3.7%
APC –7.2%
APC –4.3%
APC –6.1%
APC –5.7%
APC –3.3%
APC –8.8%
1998
Per 100,000 population
Trends in cardiovascular deathsBulletin 141
10
Heart attack mortalityHeart attack (or acute myocardial infarction) is the major clinical form of coronary heart disease.
In 2014–15, an estimated 428,000 adults had previously had a heart attack (ABS 2015). In 2013, an estimated 65,300 people aged 25 and over had an acute coronary event in the form of a heart attack or unstable angina—or about 200 events every day (AIHW 2016a).
In 2015, heart attack was the underlying cause of death for 8,440 Australians, or 5% of total deaths.
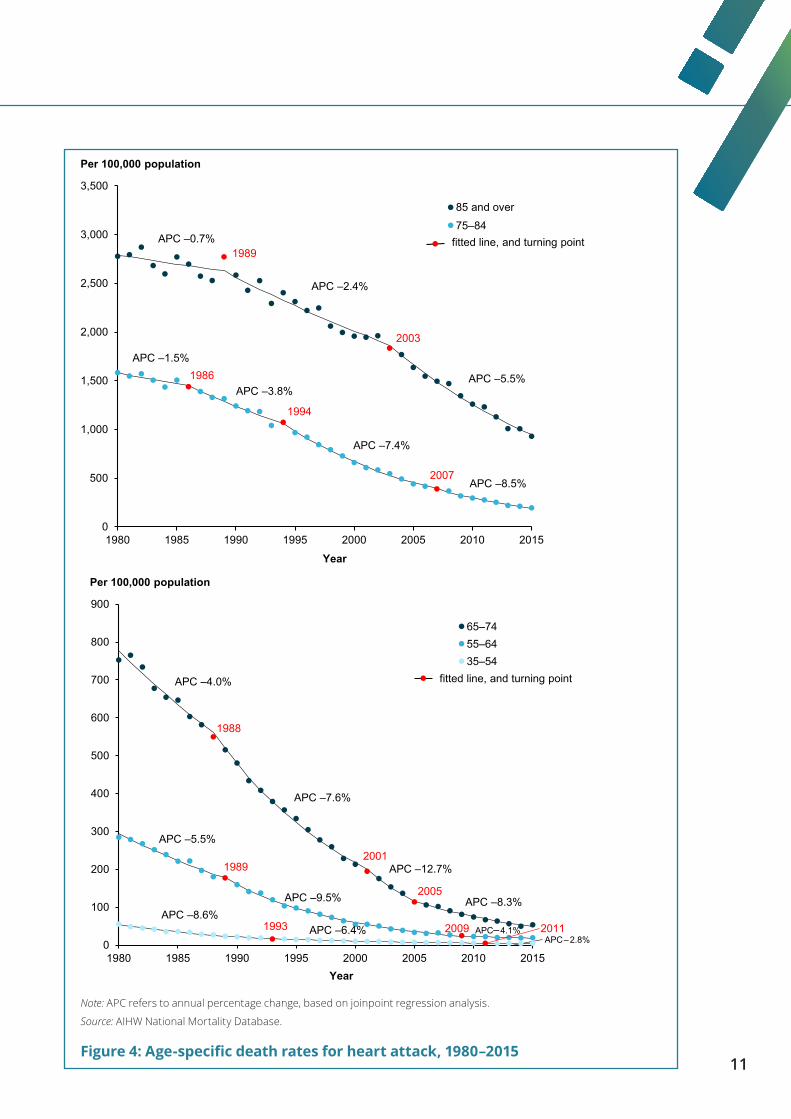
Over the 35 years from 1980 to 2015, the age-standardised death rate for heart attack fell by 86%, from 204 to 28 deaths per 100,000 population, or 5.8% per year.
Age-specific trendsHeart attack death rates fell substantially in each age group (Figure 4). But, as for coronary heart disease, while rates of decline have continued to improve for older age groups (those aged 75 and over), they have slowed among other age groups.
• For those aged 65–74, the rate of decline improved from an APC of 4.0% to 12.7% between 1980 and 2005, but slowed to its current APC of 8.3%. Similarly, for those aged 55–64, the rate of decline has slowed from 9.5% to 4.1%.
• For those aged 35–54, the rate of decline continued to slow from an APC of 8.6% to 2.8%, but there are fewer deaths in this age group, so the slowing in the rate of decline should be interpreted with caution (Table A4).
11
Note: APC refers to annual percentage change, based on joinpoint regression analysis.
Source: AIHW National Mortality Database.
Figure 4: Age-specific death rates for heart attack, 1980–2015
0
500
1,000
1,500
2,000
2,500
3,000
3,500
1980 1985 1990 1995 2000 2005 2010 2015
Year
85 and over
75–84
1986
2003
1994
APC –7.4%
APC –3.8%
APC –1.5%
APC –5.5%
APC –2.4%
APC –0.7%
APC –8.5%2007
Per 100,000 population
1989fitted line, and turning point
0
100
200
300
400
500
600
700
800
900
1980 1985 1990 1995 2000 2005 2010 2015Year
65–7455–6435–54
2005
1993 2009
19892001
1988
fitted line, and turning point
APC –6.4%APC –8.6%
APC –4.1%
APC –9.5%
APC –5.5%
APC –8.3%
APC –12.7%
APC –7.6%
APC –4.0%
APC –2.8%
Per 100,000 population
2011

Trends in cardiovascular deathsBulletin 141
12
Cerebrovascular disease mortalityCerebrovascular disease is a broad category of diseases that includes stroke and other disorders of the blood vessels supplying the brain or its covering membranes. Stroke is the most common form of cerebrovascular disease, accounting for 75% of cerebrovascular disease deaths.
Cerebrovascular disease is often fatal. In 2015, cerebrovascular disease claimed almost 10,900 lives, or 7% of all deaths in Australia. Of these cerebrovascular disease deaths 84% were people aged 75 and over, and 60% were women. Cerebrovascular diseases (including strokes) were the third leading cause of death in 2015, exceeded only by coronary heart disease and dementia, including Alzheimer’s disease (ABS 2016).
Among deaths attributed to cerebrovascular disease in 2015, haemorrhagic stroke was the underlying cause of 2,400 deaths, and ischaemic stroke the underlying cause of 1,200 deaths. Additionally, 4,700 deaths had stroke not specified as haemorrhagic or ischaemic as the underlying cause, another 2,000 deaths were due to the sequelae (or late effects) of cerebrovascular disease, and 510 deaths were due to other cerebrovascular disease.
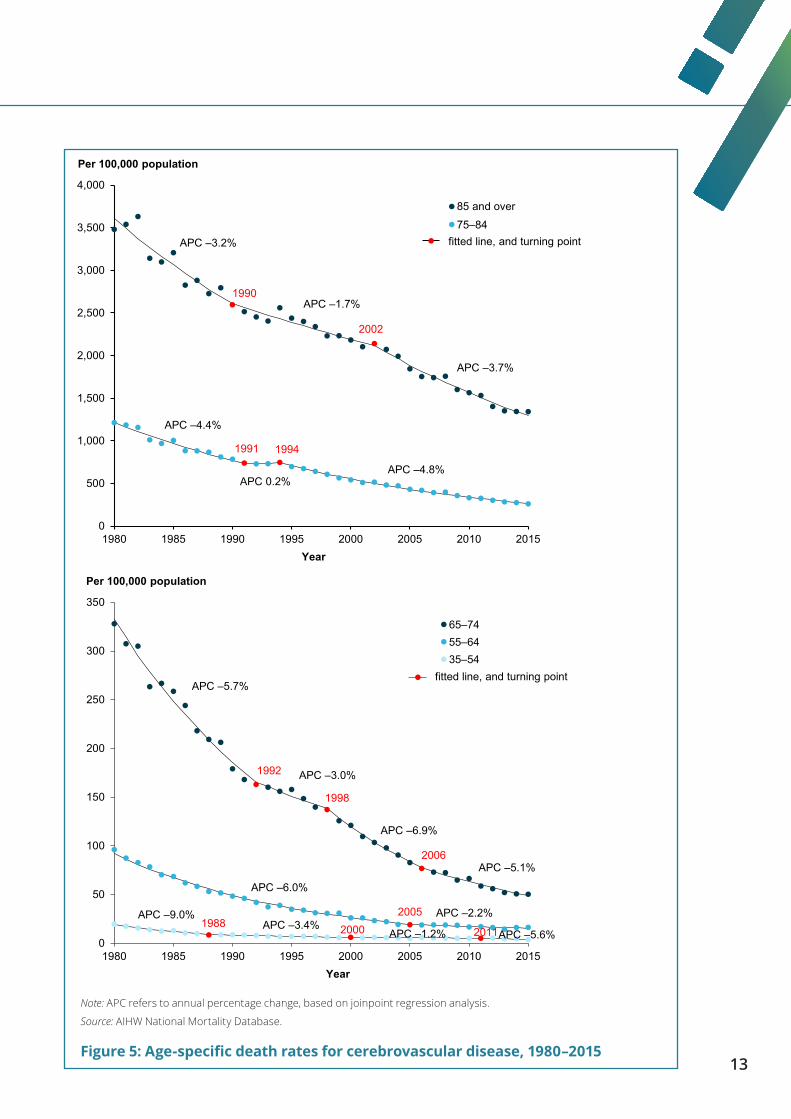
Over the 35 years from 1980 to 2015, the age-standardised death rate for cerebrovascular disease fell by three-quarters (74%), from 140 to 36 deaths per 100,000 population, or 3.8% per year.
Age-specific trendsCerebrovascular disease death rates fell substantially in each age group, with the rates of decline varying across age groups (Figure 5).
• In older age groups, the fall in cerebrovascular disease death rates has remained steady since 1980. For example, for those aged 75–84, the APC in cerebrovascular disease death rates changed little from 4.4% to 4.8%. This differs from coronary heart disease, where death rates among older age groups continue to improve.
• In younger age groups, rates of decline of cerebrovascular disease deaths have slowed, from an APC of 6.0% to 2.2% in those aged 55–64, and from 9.0% to 5.6% in those aged 35–54. But the number of deaths in the 35–54 age group are small, so changes in the rate should be interpreted with caution (Table A4).
13
Note: APC refers to annual percentage change, based on joinpoint regression analysis.
Source: AIHW National Mortality Database.
Figure 5: Age-specific death rates for cerebrovascular disease, 1980–2015
0
500
1,000
1,500
2,000
2,500
3,000
3,500
4,000
1980 1985 1990 1995 2000 2005 2010 2015Year
85 and over
75–84
1991
2002
1994
APC –4.8%APC 0.2%
APC –4.4%
APC –3.7%
APC –1.7%
APC –3.2%
Per 100,000 population
1990
fitted line, and turning point
0
50
100
150
200
250
300
350
1980 1985 1990 1995 2000 2005 2010 2015Year
65–7455–6435–54
19882005
1998
1992
fitted line, and turning point
APC –3.4%APC –9.0% APC –2.2%
APC –6.0%
APC –6.9%
APC –3.0%
APC –5.7%
2000 2011APC –5.6%
2006APC –5.1%
APC –1.2%
Per 100,000 population

Trends in cardiovascular deathsBulletin 141
14
Prevention, treatment, and mortality rates The large fall in cardiovascular disease deaths in Australia over the past 50 years represents a public health success. It can be attributed to both prevention and treatment—a combination of reductions in risk factor levels, clinical research, improvements in detection and secondary prevention, and major advances in treatment and care (Ford & Capewell 2011).
Treatment and medical careAdvances in diagnosis and treatment of cardiovascular disease include the development of effective medications for treatment and control of high blood pressure, widespread use of statins to lower cholesterol levels, greater numbers of specialists and other health-care providers focusing on cardiovascular disease, better emergency medical services for heart attack and stroke, and an increase in specialised coronary care and stroke units. Each have contributed to lower case fatality rates and lengthened survival times (Briffa 2009, Ford & Capewell 2011).
Risk factorsAlthough cardiovascular disease death rates continue to decline overall in Australia, the rate of decline in younger age groups has slowed. In Australia and in other countries, this has been associated with a growing incidence of disease, and adverse changes in major risk factors at earlier ages (Mensah et al. 2017; O’Flaherty et al. 2012; Wilmot et al. 2015). In addition, diabetes presents risks for cardiovascular disease, and its increased prevalence in younger people in recent decades is also thought to have contributed to the slowdown (O’Flaherty et al. 2012).
The risk factors that are most closely associated with the cardiovascular disease burden in Australia include poor nutrition, high levels of blood pressure and cholesterol, physical inactivity, overweight and obesity, and tobacco use (AIHW 2016c, 2017).
While there have been improvements in some of these risk factors, the vast majority (about 95%) of Australian adults still have at least 1 modifiable risk factor, and two-thirds (66%) have 3 or more risk factors at the same time (AIHW 2015; Taylor et al. 2006).
In 2014–15 (ABS 2013, 2015), an estimated:
• 34% of adults had high blood pressure, a slight rise from 32% in 2011–12 (including those with uncontrolled high blood pressure, and whose blood pressure was controlled by medication)
• 63% of adults were overweight or obese, a rise from 56% in 1995
• 15% of adults still smoked daily, although prevalence has declined
• 45% of those aged 18–64 did not participate in sufficient physical activity in the previous week
• 1.2 million people (5.1% of the total population) had diabetes.

15
Absolute riskThe potential to reduce cardiovascular disease events is closely related to a person’s absolute risk—the probability that they will have a cardiovascular event such as a heart attack or stroke in a given time period.
Based on an assessment of multiple risk factors, in 2011–12 about 1 in 5 Australians aged 45–74 (or 1.4 million people) were estimated to have a high absolute risk of a future cardiovascular event (Banks et al. 2016). The proportions at risk rise with age, from 4% of those aged 45–54 with no prior cardiovascular disease, to 25% of those aged 65–74. Most people aged 45–74 at high absolute risk (67% or 970,000) were not receiving recommended therapies to control their levels of blood pressure and cholesterol.
Many Australians remain at risk of cardiovascular disease. These elevated levels of risk factors suggest that there is potential for further declines in cardiovascular disease death rates in the future. Reducing these levels in young and middle-aged adults also has the potential of halting the slowing of the decline in cardiovascular disease death rates.
Mortality rate declines in other countriesThe slowing of the rate of decline in cardiovascular disease deaths among young adults in recent decades have occurred not only in Australia, but in other countries including the United States and the United Kingdom.
In the United States, young men and women aged less than 55 showed a clear decline in coronary heart disease deaths between 1979 and 1989, but there was little improvement during the 2 subsequent decades (Wilmot et al. 2015). A slowing of the decline of all cardiovascular disease, coronary heart disease, and stroke death rates might impede progress towards reducing the burden of cardiovascular disease in the United States (Mensah et al. 2017; Sidney et al. 2016).
In the United Kingdom, the decline in death rates from coronary heart disease in those aged 45–54 slowed between 1984 and 2004, and death rates in men aged 35–44 rose in 2002 for the first time in 2 decades (O’Flaherty et al. 2008). But falls in cardiovascular disease death rates improved in women aged 35–54 between 2003 and 2013 (Wilson et al. 2017).
The decline in death rates in other countries has not slowed. In the Netherlands, the decline in deaths from both coronary heart disease and cerebrovascular disease continued for all ages and sex in 2009, speeding up in the late 1990s and early 2000s (Peeters et al. 2011).

Trends in cardiovascular deathsBulletin 141
16
Appendix
AIHW National Mortality DatabaseData are sourced from the AIHW National Mortality Database.
Cause of Death Unit Record File data are provided to the AIHW by the registries of births, deaths and marriages and the National Coronial Information System (managed by the Victorian Department of Justice), and include the cause of death coded by the Australian Bureau of Statistics (ABS).
‘Year’ refers to year of registration of death. Deaths registered in 2012 and earlier are based on the final version of cause of death data; deaths registered in 2013 are based on the revised version; and deaths registered in 2014 and 2015 are based on preliminary versions, and are subject to further revision by the ABS.
Cause of death information is sourced from death certificates, which are certified by either a doctor or a coroner. Causes of death are classified according to the International Classification of Diseases and Related Health Problems (ICD), which is revised periodically. Deaths registered in 1997 onwards are classified according to the 10th revision (ICD-10).
Cause of death coding produces an underlying cause—that is, the disease or injury that initiated the train of events leading directly to death, or the circumstances of the accident or violence that produced the fatal injury. This bulletin includes deaths with an underlying cause of cardiovascular disease. Cause of death information on death certificates is influenced by various factors, including accuracy in diagnosis, changing perceptions of the causal role of diseases, changes in certification practices and coding processes, and variation in interpreting causal sequences leading to death. These are issues that can be problematic for reporting cause of death in people with multiple chronic conditions (AIHW 2012).
The data quality statements underpinning the AIHW National Mortality Database can be found in the:
• ABS quality declaration summary for Deaths, Australia (ABS cat. no. 3302.0), at: <www.abs.gov.au/ausstats/abs%40.nsf/mf/3302.0>
• ABS quality declaration summary for Causes of death, Australia (ABS cat. no. 3303.0), at: <www.abs.gov.au/ausstats/abs%40.nsf/mf/3303.0>.
For more information on the AIHW National Mortality Database see Deaths data at AIHW, at: <www.aihw.gov.au/deaths/aihw-deaths-data>.
Disease classificationsCauses of death presented in this bulletin have been classified according to rules in versions of the ICD, published by the World Health Organization. The codes used to classify cardiovascular disease are presented in Table A1.

17
Table A1: ICD codes for cardiovascular disease
Disease ICD-9 codes ICD-10 codesCardiovascular disease 390–459 I00–I99Coronary heart disease 410–414 I20–I25 Angina 413 I20 Acute myocardial infarction 410 I21 Chronic coronary heart disease 414 I25Cerebrovascular disease 430–438 I60–I69 Haemorrhagic stroke 430–432 I60–I62 Ischaemic stroke 433–434 I63
Comparability factorsIn processing deaths registered from 1 January 1997, Australia adopted the use of the automated coding system, and introduced ICD-10 codes. As a result, there is a break in the underlying cause of death series between 1996 and 1997. Comparability factors have been calculated that can be applied to death counts before 1997 to make them comparable with data from 1997 onwards. Comparability factors close to 1.0 indicate there were no significant coding differences between automated ICD-10 and manual ICD-9 coding.
These comparability factors were calculated at the population level, not at the age group level. That is, the same comparability factor was applied to the number of deaths for each age group.
Table A2: Comparability factors for the ICD-9 to ICD-10 transition for various cardiovascular diseases
Condition Comparability factorCardiovascular disease 1.00Coronary heart disease 1.01 Acute myocardial infarction 0.96Cerebrovascular disease 0.97
Defining periods of changeA joinpoint regression provided the estimated annual percentage change in death rates and detected points in time at which significant changes in the trend occurred (Table A3).
APC is the percentage change over a defined period, averaged over the number of years in the period. It is derived from the slope of the trend line, based on a regression of the age-specific death rates and the year of death.
The software used was the Joinpoint Regression Program, Version 4.4.0.0 (January 2017), developed by the Statistical Methodology and Applications Branch, U.S. National Cancer Institute.
Trend data in the form of age-standardised death rates are fitted to the simplest joinpoint model possible. A maximum of 3 joinpoints was allowed for estimations. The models assume constant variance, with a minimum of 5 observations from a joinpoint to either end of the data. For each annual percentage change estimate, the corresponding 95% confidence interval was also calculated.

Trends in cardiovascular deathsBulletin 141
18
Tabl
e A
3: A
nnua
l rat
e of
cha
nge
of c
ardi
ovas
cula
r di
seas
e de
aths
bet
wee
n 19
80 a
nd 2
015
Peri
od I
Peri
od II
Peri
od II
IPe
riod
IV
Age
gro
up (y
ears
)Ye
ars
Rate
cha
nge
(%)
Year
sRa
te c
hang
e (%
)Ye
ars
Rate
cha
nge
(%)
Year
sRa
te c
hang
e (%
)
Card
iova
scul
ar d
isea
se
35–5
419
80–1
984
–8.5
(–10
.1, –
6.9)
1984
–199
1–6
.6 (–
7.4,
–5.
7)19
91–1
999
–3.5
(–4.
2, –
2.8)
1999
–201
5–1
.9 (–
2.1,
–1.
7)
55–6
419
80–1
989
–4.6
(–5.
2, –
3.9)
1989
–200
5–6
.6 (–
6.9,
–6.
3)20
05–2
015
–2.8
(–3.
4, –
2.3)
65–7
419
80–1
985
–3.1
(–4.
6, –
1.6)
1985
–199
7–4
.7 (–
5.1,
–4.
3)19
97–2
006
–7.4
(–8.
1, –
6.7)
2006
–201
5–4
.9 (–
5.5,
–4.
3)
75–8
419
80–1
994
–2.8
(–3.
1, –
2.5)
1994
–201
5–5
.1 (–
5.2,
–4.
9)
85+
1980
–199
7–1
.9 (–
2.2,
–1.
7)19
97–2
015
–2.8
(–3.
1, –
2.6)
Coro
nary
hea
rt d
isea
se
35–5
419
80–1
993
–7.2
(–7.
6, –
6.7)
1993
–201
5–3
.1 (–
3.3,
–2.
9)
55–6
419
80–1
988
–4.3
(–5.
1, –
3.4)
1988
–200
6–7
.2 (–
7.5,
–6.
9)20
06–2
015
–3.7
(–4.
4, –
3.0)
65–7
419
80–1
988
–3.3
(–4.
1, –
2.5)
1988
–199
8–5
.7 (–
6.3,
–5.
0)19
98–2
006
–8.8
(–9.
7, –
7.8)
2006
–201
5–6
.1 (–
6.7,
–5.
4)
75–8
419
80–1
994
–2.2
(–2.
6, –
1.9)
1994
–201
5–6
.3 (–
6.5,
–6.
1)
85+
1980
–199
4–0
.5 (–
0.9,
–0.
1)19
94–2
008
–2.9
(–3.
3, –
2.5)
2008
–201
5–4
.9 (–
5.9,
–3.
8)
Hea
rt a
ttac
k
35–5
419
80–1
993
–8.6
(–9.
1, –
8.2)
1993
–201
1–6
.4 (–
6.7,
–6.
1)20
11–2
015
–2.8
(–5.
8, 0
.2)
55–6
419
80–1
989
–5.5
(–6.
5, –
4.5)
1989
–200
9–9
.5 (–
9.8,
–9.
2)20
09–2
015
–4.1
(–5.
9, –
2.3)
65–7
419
80–1
988
–4.0
(–4.
9, –
3.0)
1988
–200
1–7
.6 (–
8.1,
–7.1
)20
01–2
005
–12.
7 (–
16.6
, –8.
6)20
05–2
015
–8.3
(–8.
9, –
7.6)
75–8
419
80–1
986
–1.5
(–2.
6, –
0.3)
1986
–199
4–3
.8 (–
4.7,
–2.
9)19
94–2
007
–7.4
(–7.
8, –
7.0)
2007
–201
5–8
.5 (–
9.1,
–7.
8)
85+
1980
–198
9–0
.7 (–
1.4,
0.1
)19
89–2
003
–2.4
(–2.
8, –
2.0)
2003
–201
5–5
.5 (–
6.0,
–5.
0)
Cere
brov
ascu
lar
dise
ase
35–5
419
80–1
988
–9.0
(–10
.5, –
7.5)
1988
–200
0–3
.4 (–
4.4,
–2.
4)20
00–2
011
–1.2
(–2.
4, 0
.0)
2011
–201
5-–
5.6
(–10
.1, –
1.0)
55–6
419
80–2
005
–6.0
(–6.
3, –
5.8)
2005
–201
5–2
.2 (–
3.1,
–1.
2)
65–7
419
80–1
992
–5.7
(–6.
2, –
5.1)
1992
–199
8–3
.0 (–
4.9,
–1.
0)19
98–2
006
–6.9
(–8.
0, –
5.8)
2006
–201
5–5
.1 (–
5.9,
–4.
3)
75–8
419
80–1
991
–4.4
(–4.
9, –
3.9)
1991
–199
40.
2 (–
7.6,
8.6
)19
94–2
015
–4.8
(–5.
0, –
4.6)
85+
1980
–199
0–3
.2 (–
3.9,
–2.
5)19
90–2
002
–1.7
(–2.
3, –
1.1)
2002
–201
5–3
.7 (–
4.2,
–3.
3)
Stat
isti
cal t
able
s
Not
e: T
he a
nnua
l rat
e of
cha
nge
in e
ach
perio
d is
sig
nific
antly
diff
eren
t fro
m th
e pr
eced
ing
perio
d, a
s de
term
ined
by
join
poin
t ana
lysi
s. T
he 9
5% c
onfid
ence
inte
rval
is s
how
n in
bra
cket
s.

19
Table A4: Number of cardiovascular disease deaths, selected years, 1980 to 2015
Age group (years) 1980 1985 1990 1995 2000 2005 2010 2015
Cardiovascular disease
35–54 3,818 2,892 2,372 2,211 2,076 2,001 1,875 1,789
55–64 7,412 6,709 5,124 3,727 2,912 2,729 2,727 2,610
65–74 14,616 14,087 12,399 10,910 7,947 5,537 5,117 5,160
75–84 17,928 19,749 19,927 19,350 17,233 15,489 12,842 11,170
85+ 11,624 13,697 14,132 16,932 19,246 20,103 22,662 24,442
Coronary heart disease
35–54 2,508 1,939 1,516 1,395 1,276 1,202 1,026 968
55–64 5,100 4,702 3,557 2,497 1,900 1,715 1,594 1,446
65–74 9,320 9,252 8,223 6,885 4,898 3,141 2,654 2,611
75–84 9,198 10,851 11,245 10,716 9,216 7,878 6,162 4,765
85+ 4,508 5,779 6,557 8,047 9,158 9,562 10,226 9,934
Heart attack
35–54 1,896 1,409 1,011 775 564 455 345 307
55–64 3,942 3,389 2,438 1,546 961 732 578 536
65–74 7,166 6,813 5,765 4,449 2,784 1,571 1,201 1,087
75–84 6,616 7,679 7,698 6,812 5,357 4,131 2,928 2,125
85+ 2,856 3,500 3,964 4,589 4,919 4,948 4,872 4,369
Cerebrovascular disease
35–54 661 501 397 367 338 298 314 242
55–64 1,317 1,037 732 543 457 411 419 446
65–74 3,090 2,695 2,125 2,080 1,576 1,139 1,074 1,012
75–84 5,014 5,067 4,819 4,854 4,400 4,037 3,288 2,842
85+ 3,542 4,009 3,939 4,788 5,482 5,577 6,053 6,303
Note: Deaths registered in 2014 and 2015 are based on preliminary data, and are subject to further revision by the ABS.
Source: AIHW National Mortality Database.
Trends in cardiovascular deathsBulletin 141
20
AcknowledgmentsThe authors of this bulletin are Michael de Looper and Alison Dias of the Cardiovascular, Diabetes and Kidney Unit at the Australian Institute of Health and Welfare.
Valuable guidance and advice was provided by Sushma Mathur, Lynelle Moon, Lany Trinh, Michelle Gourley, and Andrew Kettle of the AIHW. The authors gratefully acknowledge the valuable contributions from the Cardiovascular Disease Expert Advisory Group, whose members are: Andrew Tonkin (Chair), Tom Briffa, Derek Chew, Annette Dobson, Mark Nelson, and Mandy Thrift.
This project was funded by the Australian Government Department of Health.
AbbreviationsABS Australian Bureau of Statistics
AIHW Australian Institute of Health and Welfare
APC annual percentage change
ICD International Classification of Diseases
ICD-10 International Classification of Diseases 10th revision

21
ReferencesABS (Australian Bureau of Statistics) 2013. Australian Health Survey: biomedical results for chronic diseases, 2011–12. ABS cat. no. 4364.0.55.005. Canberra: ABS.
ABS 2015. National Health Survey: first results, 2014–15. ABS cat. no. 4364.0.55.001. Canberra: ABS.
ABS 2016. Causes of death, Australia, 2015. ABS cat. no. 3303.0. Canberra: ABS.
AIHW (Australian Institute of Health and Welfare) 2009. Impact of falling cardiovascular disease death rates: deaths delayed and years of life extended. Bulletin no. 70. Cat. no. AUS 113. Canberra: AIHW.
AIHW 2010. Cardiovascular disease mortality: trends at different ages. Cardiovascular series no. 31. Cat. no. 47. Canberra: AIHW.
AIHW 2014. Trends in coronary heart disease mortality: age groups and populations. Cardiovascular disease series no. 38. Cat. no. CVD 67. Canberra: AIHW.
AIHW 2015. Cardiovascular disease, diabetes and chronic kidney disease—Australian facts: risk factors. Cat. no. CDK 4. Canberra: AIHW.
AIHW 2016a. Australia’s health 2016. Cat. no. AUS 199. Canberra: AIHW.
AIHW 2016b. Australian Burden of Disease Study: impact and causes of illness and death in Australia 2011. Cat. no. BOD 4. Canberra: AIHW.
AIHW 2016c. Australian Burden of Disease Study: impact and causes of illness and death in Australia 2011—summary report. Cat. no. BOD 5. Canberra: AIHW.
AIHW 2017. Impact of overweight and obesity as a risk factor for chronic conditions: Australian Burden of Disease Study. Cat. no. BOD 12. Canberra: AIHW.
Banks E, Crouch SR, Korda RJ, Stavreski B, Page K, Thurber KA & Grenfell R 2016. Absolute risk of cardiovascular disease events, and blood pressure- and lipid-lowering therapy in Australia. Medical Journal of Australia 204: 320e1–e8.
Briffa T, Hickling S, Knuimen M, Hobbs M, Hung J, Sanfilippo FM et al. 2009. Long term survival after evidence-based treatment of acute myocardial infarction and revascularisation: follow-up of population based Perth MONICA cohort 1984–2005. British Medical Journal 338:b36.
Ford ES & Capewell S 2011. Proportion of the decline in cardiovascular mortality disease due to prevention versus treatment: public health versus clinical care. Annual Review of Public Health 32:5–22.
Mensah GA, Wei GS, Sorlie PD, Fine LJ, Rosenberg Y, Kaufmann PG et al. 2017. Decline in cardiovascular mortality: possible causes and implications. Circulation Research 120: 366–80.

Trends in cardiovascular deathsBulletin 141
22
O’Flaherty M, Ford E, Allender S, Scarborough P & Capewell S 2008. Coronary heart disease trends in England and Wales from 1984 to 2004: concealed levelling of mortality rates among young adults. Heart 94:178–81.
O’Flaherty M, Allender S, Taylor R, Stevenson C, Peeters A & Capewell S 2012. The decline in coronary heart disease mortality is slowing in young adults (Australia 1976–2006): a time trend analysis. International Journal of Cardiology 158:193–8.
Peeters A, Nusselder WJ, Stevenson C, Boyko EJ, Moon L & Tonkin A 2011. Age-specific trends in cardiovascular mortality rates in the Netherlands between 1980 and 2009. European Journal of Epidemiology 26:369–73.
Sidney S, Quesenberry CP, Jaffe MG, Sorel M, Nguyen-Huynh MN, Kushi LH et al. 2016. Recent trends in cardiovascular mortality in the United States and public health goals. JAMA Cardiology 1(5):594–9.
Taylor R, Dobson A & Mirzaei M 2006. Contribution of changes in risk factors to the decline of coronary heart disease mortality in Australia over three decades. European Journal of Cardiovascular Prevention and Rehabilitation 13:760–8.
Wilmot KA, O’Flaherty M, Capewell S, Ford ES & Vaccarino V 2015. Coronary heart disease mortality declines in the United States from 1979 through 2011. Circulation 132:997–1002.
Wilson L, Bhatnagar P & Townsend N 2017. Comparing trends in mortality from cardiovascular disease and cancer in the United Kingdom, 1983–2013: joinpoint regression analysis. Population Health Metrics 15:23. doi: 10.1186/s12963-017-0141-5.

23

Stronger evidence, better decisions, improved health and welfare
aihw.gov.au
bulletin 141The Australian Institute of Health and Welfare is a major national agency
whose purpose is to create authoritative and accessible information and statistics that inform decisions and improve the health and welfare of all Australians.
© Australian Institute of Health and Welfare 2017
This product, excluding the AIHW logo, Commonwealth Coat of Arms and any material owned by a third party or protected by a trademark, has been released under a Creative Commons BY 3.0 (CC BY 3.0) licence. Excluded material owned by third parties may include, for example, design and layout, images obtained under licence from third parties and signatures. We have made all reasonable efforts to identify and label material owned by third parties.
You may distribute, remix and build upon this work. However, you must attribute the AIHW as the copyright holder of the work in compliance with our attribution policy available at <www.aihw.gov.au/copyright/>. The full terms and conditions of this licence are available at <http://creativecommons.org/licenses/by/3.0/au/>.
Enquiries relating to copyright should be addressed to the Head of the Website & Publishing Unit, Australian Institute of Health and Welfare, GPO Box 570, Canberra ACT 2601.
This publication is part of the Australian Institute of Health and Welfare’s bulletin series. A complete list of the Institute’s publications is available from the Institute’s website <www.aihw.gov.au>.
ISSN 2205-5010 (PDF) ISSN 1446-9820 (Print)
ISBN 978-1-76054-187-3 (PDF)ISBN 978-1-76054-188-0 (Print)
Suggested citationAustralian Institute of Health and Welfare 2017. Trends in cardiovascular deaths. Bulletin no. 141. Cat. no. AUS 216. Canberra: AIHW.
Australian Institute of Health and WelfareBoard ChairMrs Louise Markus
DirectorMr Barry Sandison
Any enquiries about or comments on this publication should be directed to:Website & Publishing UnitAustralian Institute of Health and WelfareGPO Box 570Canberra ACT 2601Tel: (02) 6244 1000Email: [email protected]
Published by the Australian Institute of Health and Welfare
Please note that there is the potential for minor revisions of data in this report.Please check the online version at <www.aihw.gov.au> for any amendments.