trends in firm entry and new entrepreneurship in canada · trends in firm entry and new...
TRANSCRIPT

Discussion Paper/Document d’analyse
2015-11
Trends in Firm Entry and New
Entrepreneurship in Canada
by Shutao Cao, Mohanad Salameh, Mai Seki and Pierre St-Amant

2
Bank of Canada Discussion Paper 2015-11
October 2015
Trends in Firm Entry and New Entrepreneurship in Canada
by
Shutao Cao,1 Mohanad Salameh,1 Mai Seki2 and Pierre St-Amant1
1Canadian Economic Analysis Department Bank of Canada
Ottawa, Ontario, Canada K1A 0G9 [email protected]
2Japan International Cooperation Agency Research Institute Tokyo, Japan
Bank of Canada discussion papers are completed research studies on a wide variety of technical subjects relevant to central bank policy. The views expressed in this paper are those of the authors.
No responsibility for them should be attributed to the Bank of Canada.
ISSN 1914-0568 © 2015 Bank of Canada

ii
Acknowledgements
The authors would like to thank for their comments Dany Brouillette, Glen Keenleyside,
Ben Tomlin, participants in an internal Bank of Canada seminar and participants in the
workshop “Recent Developments in Productivity Measurement and Analysis” held in
Ottawa in March 2015.

iii
Abstract
Recently released data show downward trends for both the firm entry rate and the rate
of new entrepreneurship since the early 1980s in Canada. This paper documents these
trends and discusses potential explanations. A shift-share analysis suggests that changes
to Canada’s industrial and demographic structures cannot explain the long-term
downward trends, although population aging accounts for part of the decline in new
entrepreneurship since around 2000. The paper also discusses other factors potentially
contributing to the downward trends: increased industrial concentration, changing
labour market conditions, an increased college wage premium and higher student debt.
In-depth analysis of these factors is left for future research.
JEL classification: L11, M13
Bank classification: Firm dynamics; Market structure and pricing; Productivity
Résumé
Des données publiées récemment font ressortir une tendance à la baisse qui touche aussi
bien le taux de création d’entreprises que le taux d’entrepreneuriat depuis le début des
années 1980 au Canada. Les auteurs mettent en évidence cette tendance et en examinent
les explications possibles. Une analyse structurelle-résiduelle montre que l’évolution des
structures industrielles et démographiques au Canada n’explique pas les tendances à long
terme à la baisse, bien que le vieillissement de la population motive en partie la
diminution du taux d’entrepreneuriat depuis l’année 2000 environ. Les auteurs étudient
aussi d’autres facteurs qui pourraient contribuer aux tendances observées : la
concentration industrielle accrue, l’évolution des conditions sur le marché du travail, la
hausse du surplus de rémunération lié à l’éducation post-secondaire et l’augmentation des
dettes des étudiants. Une analyse plus exhaustive des ces facteurs pourrait faire l’objet
d’études futures.
Classification JEL : L11, M13
Classification de la Banque : Dynamique des entreprises; Structure de marché et fixation
des prix; Productivité

1
1. Introduction
Statistics Canada data show a clear downward trend in the firm entry rate in Canada since the early 1980s (the exit rate is also trending down).1 A related secular decline in the rate of new entrepreneurship is also observed since the 1990s. In addition, the numbers of new firms and new entrepreneurs are currently lower than in the early 1980s (much lower in the case of new entrepreneurs). These observations have potentially important consequences because firm creation2 can contribute to aggregate labour productivity growth (e.g., Haltiwanger 2012, 2015; Diez 2014; Clementi and Palazzo 2013).3 The simplest mechanism for the positive contribution of firm creation to productivity growth is called churning and results from more-productive firms replacing less-productive ones (the exit rate is also important for this). This mechanism has been quantified in empirical research on decomposing labour productivity growth in various industries.4 But firm creation can also contribute to productivity growth through other channels. For instance, new firms can be a source of innovation and they can push incumbents to become more productive. A lower trend firm creation rate could therefore imply lower trend productivity growth.
The possible implications of slower firm creation for productivity growth are important given that productivity is a main contributor to an economy’s long-run potential to grow, which is itself an important input into monetary and fiscal policy decisions.5 However, many factors affect both entrepreneurship and productivity growth and they need to be better understood before we can draw solid conclusions about such implications. In this paper, we document the downward trend in firm creation, and examine possible factors behind it, from both a firm and worker perspective. On the firm side, we use data from the Longitudinal Employment Analysis Program (LEAP) and examine the entry rates of firms. On the worker side, we use data from the Labour Force Survey and examine the trends of new entrepreneurship out of the working-age population. We find that the secular decline in firm creation is observed widely across sectors and regions, as well as by social demographic groups (i.e., age, gender and education). Further, we use a shift-
1 Decker et al. (2012) observe a similar trend for firm turnover and job reallocation in the United States. Criscuola et al. (2014) report evidence that many OECD countries are affected by the decline in job reallocation. 2 We use “firm creation” as a concept encompassing both firm entry and new entrepreneurship. 3 Firm creation can also be a determinant of other important variables such as employment (Davis and Haltiwanger 2014). 4 See Baldwin and Gu (2006) for a review of methods used to decompose productivity growth and for Canadian estimations. Bérubé, Dostie and Vilhuber (2013) provide an updated review and estimations. 5 See the appendix in Bank of Canada (2015) for an illustration of how a central bank analyzes trend labor productivity and of how these analyses feed into broader monetary policy analysis. See Parliamentary Budget Officer (2014) for a discussion in the context of fiscal policy analysis.

2
share analysis to examine whether compositional changes account for the decline. We find that the overall decline in firm creation came primarily from the declines within sectors, instead of sectoral shifts. For the age-group analysis, we highlight the population-aging effect, which became more pronounced in the post-2000 period.
The causes of the secular decline in firm creation are not well understood and existing studies have focused on selected sectors individually. To the extent that firm creation has declined in most sectors in Canada (and other countries such as the United States), it appears that it may be caused by some common factors. We briefly discuss possible causes of the declining trend, and leave the more in-depth analysis to future research. In the rest of the paper, we first describe the long-run trend of firm turnover and new entrepreneurship (section 2). We then analyze the roles played by compositional changes in accounting for this trend (section 3). In section 4, we provide a list of possible causes for the downward trend within industrial sectors and age groups. We conclude in section 5.
2. Historical Firm Entry and New Entrepreneurship
2.1 Firm entry
The firm entry rate (number of entrants as a fraction of total number of firms) in the Canadian business sector has displayed a downward trend over the past 30 years.6 It has declined from 24.5 per cent in 1984 to 12.7 per cent in 2013. The exit rate has also declined, from 16.5 per cent in 1984 to 11.6 per cent in 2013.
6 The data on firm entry are also described by Macdonald (2014).

3
The pace of these declines has varied over different subperiods. The decline of the entry rate was the fastest in the 1980s to the early 1990s, and in the late 1990s. The entry rate, however, increased in the mid-1990s, coinciding with the North American Free Trade Agreement (NAFTA), and also increased from 2001 to 2007, a period characterized by the oil price boom and overall favourable economic conditions. Overall, the firm exit rate has followed a similar trend, except in the late 1980s and early 1990s, when it tended to rise, likely in response to difficult economic conditions (including the early 1990s recession). While the entry rate declined during the 2009 recession, the exit rate increased. Both have remained around historically low levels since that time.
Firm entry and exit rates at the sector level (2-digit North American Industry Classification System) have also been trending down (Chart A1). In most sectors, the firm entry rate declined at a fast pace in the 1980s and in the late 1990s, whereas it was more stable in the mid-1990s and in the 2000s (similar to Chart 1). The exit rates in most sectors were rising from 1983 until the early 1990s, but this was followed by a fast decline in most of the 1990s and no significant change in the 2000s.
Manufacturing is characterized by downward trends in both entry and exit rates that are somewhat different from the aggregate trend (Chart A2). Overall, the firm turnover rates (entry rate plus exit rate) were lower in 2013 than in 1984. However, this decline was mainly shaped in
10
15
20
25
1984 1988 1992 1996 2000 2004 2008 2012
%
Entry rate Exit rate
Chart 1: Aggregate entry and exit rates have been declining Annual data
Last observation: 2013 Sources: Statistics Canada and Bank of Canada calculations

4
the period after 1998. The entry rate in this sector increased over the period 1992–98, around the time the economy was recovering from the early 1990s recession. Moreover, the Canada–U.S. Free Trade Agreement and the NAFTA were coming into effect, and the high-tech sector was booming. Since then, the firm entry rate has been weak, dropping by 10 percentage points from 1998 to 2009. At the same time, the exit rate has been declining, but at a fairly stable and slow pace. As a result, the entry rate has been lower than the exit rate since 2001.
The mining, quarrying, oil and gas (MOG) sector is an outlier. Its rates of entry and exit do not display strong declines (Chart A3). This may be linked with the positive impact on this industry of the higher commodity prices since around 2000.
Not only has the entry rate declined, the number of firms entering has also declined, from about 164 thousand in 1984 to about 138 thousand in 2013 (Chart 2).7
7 The number of firms entering has tended to be higher than the number of firms exiting (Chart 1). This has kept the population of firms growing most of the time.
0
15000
30000
45000
60000
75000
90000
0
40000
80000
120000
160000
200000
1983 1986 1989 1992 1995 1998 2001 2004 2007 2010 2013
Level Level
Number of entrants (left axis) Number of new entrepreneurs (right axis)
Chart 2: Declining number of entrants and new entrepreneurs Annual data
Last observation: 2014 Sources: Statistics Canada and Bank of Canada calculations

5
2.2 New entrepreneurship
The downward trend in firm creation is also reflected in a measure of new entrepreneurship. We define new entrepreneurship as the number of new self-employed workers who hire employees.8 The number of new entrepreneurs (Chart 2) and the rate of new entrepreneurship, defined as the number of new entrepreneurs as a fraction of the working-age population (Chart 3), have both been declining.9
8 A self-employed worker is new if that worker’s current job tenure is less than 13 months. This information is available in Statistics Canada’s Labour Force Survey data. 9 The rate of new entrepreneurship is similar to the index of new entrepreneurial activity created by the Business Development Bank of Canada (BDC 2012). The difference is that the BDC index divides new entrepreneurship by the labour force (participants in the labour market) instead of the working-age population. We prefer the latter because the working-age population is more likely to be exogenous. However, findings in this paper remain the same, qualitatively, if we use the BDC index. While the BDC index starts in 2000, our measure starts in 1981.
0
5
10
15
20
25
30
0.00
0.10
0.20
0.30
0.40
1980 1984 1988 1992 1996 2000 2004 2008 2012
% %
Entrepreneurship rate (left axis) Entry rate (right axis)
Chart 3: Both the new entrepreneurship rate and the firm entry rate have been declining Annual data
Last observation: 2014 Sources: Statistics Canada and Bank of Canada calculations

6
Chart 3 shows that the rate of new entrepreneurship has displayed a downward trend similar to that of the aggregate firm entry rate, with a slight difference in the timing of major declines.10 The new entrepreneurship rate was relatively stable during the 1980s, but then started a long trend decline.
Has the decline in the rate of new entrepreneurship been driven by variations in the number of individuals entering the labour force? Given that new entrepreneurs tend to be relatively young, a fall in that number could have affected the numerator (number of new entrepreneurs) faster than the denominator (working-age population), which could have led to a persistent decline. But data show that the number of individuals flowing into the labour force has not declined since the early 1980s. Instead, it has increased (Chart 4). Therefore, the evolution of this flow cannot explain the decline in the rate of new entrepreneurship. And indeed it is not only the new entrepreneurship rate that has been declining. Despite the larger flows into the working-age population, the number of new entrepreneurs has also been declining. In 1981, there were 56,000 new self-employed workers who hired employees. By contrast, in 2013 there were 36,000 new self-employed workers who hired employees, a decline of 20,000 new entrepreneurs.
10 The share of self-employed workers without paid help, however, increased from the mid-1990s toward 2000 and has roughly plateaued since then (CANSIM Table 282-0012). Although this group might include new entrepreneurs, we prefer to exclude this group since it includes passive self-employment that may not represent new business creation.
200
250
300
350
400
1984 1987 1990 1993 1996 1999 2002 2005 2008 2011 2014
Thousands
Chart 4: No trend decline of flows into working-age population (x1000) Annual data
Last observation: 2014 Sources: Statistics Canada and Bank of Canada calculations

7
At a disaggregated level, the new entrepreneurship rate displays downward trends, too, with a variation in the paces of decline. Interestingly, the decline has been more accentuated among the subgroups for which it was higher at the beginning of the sample period. For example, while younger individuals, among all age groups, are more likely to become new entrepreneurs, they also represent the group that experienced the sharpest decline (Chart A4).11 Similarly, while males are more likely to become self-employed workers who hire employees, their rate of new entrepreneurship has declined more than that for females (Chart A5). The trends across workers’ regions of residence exhibit patterns that are roughly consistent with the results found in the sectoral analysis (Chart A6). The new entrepreneurship rate has declined faster in Quebec and Ontario than in the Prairies since the early 2000s. This partially reflects the roughly unchanging rates of firm entry in the MOG sector (more present in the Prairies).12 Lastly, the decline of new entrepreneurship has been most pronounced among workers with a university degree (the group most likely to become self-employed workers who hire employees) (Chart A7). As a result, new entrepreneurship rates have converged to similar levels across all education groups. The same pattern holds for both males and females.
3. Compositional Changes and the Trend Decline in Firm Creation
In this section, we examine whether shifts across sectors were a main factor in the decline in the aggregate entry rate and exit rate. We also decompose new entrepreneurship into contributions from within and between age groups. It is natural to examine these factors, given the long-run structural changes in both the overall economy and the labour market.
3.1 Sectoral shifts and firm entry
Over the past 30 years, the Canadian economy has experienced structural changes. While the share of manufacturing employment has been declining, employment has increased in services (and in the commodity sectors in more recent years). How much of the secular trend in entry and exit can be accounted for by sectoral shifts? It turns out that the contribution of sectoral shifts to entry and exit rates has been slightly positive.13 The secular decline in entry and exit at the aggregate level arose entirely from entry and exit rates within most sectors.14
11 Simple probit regressions, with new entrepreneurship as the dependent variable, support the analysis in this paragraph (available upon request). 12 Note that the number of new entrepreneurs has been relatively flat in the Prairies, while the increase in the labour force itself contributed to the decline of the new entrepreneurship rate. 13 Haltiwanger (2015) reports a similar result for the United States. 14 Macdonald (2014) reached the same conclusion after noticing that most sectors experienced a decline.

8
To quantify the contribution of sectoral shifts to the secular decline of entry, we decompose the change in the aggregate entry rate into three components: within, between and cross effects. Appendix B describes the decomposition. Fixing the weights of sectors at the reference year level, the “within” effect captures the contribution of changes in the entry rates within sectors.15 The “between” effect captures the contribution of shifts between sectors assuming the entry rates did not change over time. Finally, the “cross” effect captures the contribution owing to changes in both shares and entry rates among the sectors. The aggregate exit rate can be decomposed in the same way. Table 1 shows the decomposition of the aggregate entry rate and exit rate from 1984 (the reference year) to 2013. The aggregate entry rate dropped 11.90 percentage points from 1984 to 2013. This drop came entirely from the “within” effect. Had changes in the industrial structure been the only influence on the secular trend in firm entry, the aggregate entry rate would have increased. Similarly, the declined aggregate exit rate from 1984 to 2013 is entirely accounted for by the within-sector declines in firm exit.
Table 1: Decomposing aggregate entry and exit rates (percentage points), 1984 to 2013
Entry Exit Total change -11.90 -4.88 Within -13.07 -5.38 Between 0.31 0.63 Cross 0.87 -0.13
At the subsector level, the “within” effect has been particularly large in Other Services, Agriculture and Retail (Chart A8). The MOG sector made the smallest contribution to the decline.
3.2 Aging and new entrepreneurship
Population aging is an important trend characterizing the Canadian labour market. A natural question to ask is whether the downward trend in new entrepreneurship reflects changes in the demographic structure of the population. We find that, although aging explains a small portion of the secular decline since the early 1980s, it accounts for a more important portion of it since 15 In this decomposition, the weight for each sector is the number of active firms in that sector as a share of total number of active firms, where active firms include incumbent firms and entrants. Of course, this weight is affected by entry and exit, making the firm counts less appealing as weights. But, over the long period, there are other important factors affecting the firm counts at the sector level, e.g., mergers and acquisitions as well as firms switching sectors. We also used employment (for the period 1991 to 2012) and real output, respectively, as the weights; findings using them are qualitatively the same as reported here.

9
around 2000. Nevertheless, demographic changes are not a dominant factor explaining the aggregate decline in the new entrepreneurship rate.16
As we discussed in section 2, most age groups experienced a decrease in the rate of new entrepreneurship. One exception is the 55+ age group, which experienced a much smaller change. However, the rate of new entrepreneurship for the 55+ group remains much lower than that of other age groups. The share of the 55+ group in the total population has been rising rapidly, particularly since the late 1990s. The decline in the number of new entrepreneurs could therefore potentially be attributed, in part, to changes in the relative size of age groups.17 To assess this possibility we use the same decomposition method as in section 3.1.
From 1981 to 2014, the fraction of new entrepreneurs in the total labour force dropped 0.19 percentage points (Table 2).18 Most of this decline is accounted for by the within-age drops in new entrepreneurship. Although all age groups show a decline, the age group 25–34 made the largest contribution to the drop in aggregate new entrepreneurship, followed by the age group 35–44 (Chart A9). The impact of shifts between age groups (i.e., the increasing share of older individuals) is relatively small for the period.
The result that aging does not account for more of the decline in new entrepreneurship since 1981 could reflect the fact that the weight of the 15–24 age group in the total population was decreasing in the early part of the sample (the entrepreneurship rate is relatively low in this group), while that of the 55+ group picked up markedly only in the late 1990s. We therefore
16 We also decomposed the decline in aggregate new entrepreneurship by educational attainment (Chart A10). We found that the decline is mainly accounted for by the within-group changes in new entrepreneurship, but that there is a small positive contribution to new entrepreneurship coming from the fact that the share of more-educated people (more likely to be entrepreneurs) has increased. 17 This would be consistent with past studies on the demographics of entrepreneurship finding that population aging tends to be associated with less entrepreneurship (e.g., Lamothe and Colovic 2013). 18 In this decomposition, the weight for each age group is the size of the labour force for that age group as a share of the size of the aggregate labour force.
Table 2: Decomposing the decline in the rate of new entrepreneurship (percentage points)
Period Within Between Cross Total change 1981 to 2014 -0.185 -0.024 0.021 -0.189 2000 to 2014 -0.075 -0.017 0.007 -0.085

10
conducted the same decomposition for the period 2000 to 2014 (Table 2) and found that aging has contributed to about 20 per cent of the decline in entrepreneurship since 2000. Given the expected rise in the share of the 55+ group, aging will likely continue to put downward pressures on firm creation/entrepreneurship in the coming years.
In addition to the increased contribution by older workers in more recent years, population aging could potentially be related to the decline in the aggregate new entrepreneurship through mechanisms that are not captured by the simple decompositions used in this section. Liang, Wang and Lazear (2014) hypothesize that an increase in the share of older workers in the labour force can be a barrier to becoming a new entrepreneur for younger workers. The authors assume that a larger number of older workers occupying key positions in the workplace can prevent younger workers from acquiring skills in forming businesses. This hypothesis needs to be tested using micro-level data.
4. Other Potential Explanations for the Trend Decline in Firm Creation
In section 3, we concluded that the decline in firm creation is primarily accounted for by within-group changes, instead of by shifts between groups. In this section, we briefly discuss some factors that could account for these changes. The decline in firm creation suggests that the expected net payoff, or gain, of creating a new firm must have dropped relative to alternative choices (e.g., working as an employee). We consider the following factors:
• increased industry concentration, • improved labour market conditions since the early 1980s, • increased college wage premium, • increased work flexibility for employed work, and • higher student debt.
Other potential causes are higher training costs and government tax policies. Exploring these factors requires further research and more evidence from the data.
4.1 Increased concentration and declining firm turnover
Factors that increase industry concentration can be a barrier to entry for new firms. Such factors range from regulations to technological progress that favours larger incumbents. One example is the retail trade sector. The number of employer enterprises in the retail trade sector was 102,000 in 1983 and peaked at 116,000 in 1987. It then declined to 100,000 in 2011. Both entry and exit rates have declined since the early 1990s. The timing of these declines roughly coincided with

11
the entry of Walmart in 1994, whose market share in general merchandise had risen to 41.5 per cent in 2011, as reported in Industry Canada (2013). Foster, Haltiwanger and Krizan (2006) suggest that changes in information and communications technology have played an important role in transforming the retail trade sector in the United States. The intensive adoption of advanced information technology, such as electronic scanners, has allowed better services and sales without increasing labour costs. It has also improved inventory management and sales tracking, to reduce costs. Cost reduction allows large firms such as Walmart to operate at a large and increasing scale, discouraging new entry. The result is that firm size has become larger (Chart A11).
Of course, both market structure and production technology differ across sectors. The role of information technology in contributing to increased concentration may be different in sectors other than retail trade.
4.2 Unemployment and new entrepreneurship
It is possible that improved labour market conditions since the early 1980s have contributed to the decline in the rate of new entrepreneurship. This is suggested by Chart A12.19 Difficult labour market conditions may have at times induced some people to start a new business instead of aiming for a regular job. To the extent that the unemployment rate is a good proxy for labour market conditions, the decline in that variable could account for the trend decline in the new entrepreneurship. It is of course possible that other factors have caused both the unemployment rate and the new entrepreneurship index to decline. For instance, it could be that aging has contributed to both the lower unemployment rate (the unemployment rate of older workers tends to be lower than that of other age groups) and the lower rate of new entrepreneurship (we saw in section 2.2 that older people are less likely to become new entrepreneurs). Structural modelling may be needed to disentangle these links.
4.3 Increased college wage premium
Labour market participants can be divided into two groups: workers with a high school degree or less, and workers with a post-secondary education. Real wages for both education groups have increased steadily over time. However, the college wage premium, measured as the hourly earnings ratio between the two groups, has increased since the early 1980s (1.19 in 1981, 1.33 in 1990, 1.39 in 2000 and 1.37 in 2012). Chart A13 plots the new entrepreneurship rate against the
19 We tested for cointegration between the two and found the evidence mixed (results available upon request).

12
wage differential between the post-secondary degrees or above group and the primary or secondary education group. Except for the period of the commodity price boom, which improved the returns to labour supply for primary or secondary degree holders (Fortin and Lemieux 2015), the two indicators appear to be negatively correlated.20 This leads to the conjecture that the increased return to schooling for post-secondary degrees and certificates not only increased the supply of more-educated workers, but might have induced them to choose to work as employees, as opposed to becoming entrepreneurs. One possibility is that a post-secondary education adds useful skills for becoming a member of existing firms and organizations, more so than enhancing entrepreneurial skills. This could induce more people at the margin to choose to work for others rather than start a business.
4.4 Increased workplace flexibility
Recent studies argue that the decision to become an entrepreneur is affected by the flexibility of the labour market for employees (Yurdagul 2015). For instance, an individual may decide to become an entrepreneur in order to attain more flexible working hours than would be possible as an employee. The individual could make that choice for family or other reasons. One implication is that more flexible working conditions in the labour market arrangement could lead to reduced new entrepreneurship. Has the Canadian labour market become more flexible? One indicator of such flexibility would be an increased prevalence of freely chosen part-time work. Chart A14 shows that the share of voluntary part-time workers increased significantly from the 1980s to the 1990s and has remained relatively stable, with a slight increase in recent years. Moreover, there was substantial growth in the proportion of employees working at home (either full- or part-time, excluding overtime) in the 1990s (Turcotte 2010). This is consistent with the hypothesis and the timing of the major decline in the new entrepreneurship rate.
4.5 Student debt and new entrepreneurship
The decline in the overall new entrepreneurship rate largely arises from younger groups (e.g., 25–34 and 35–44). Moreover, this rate declined the most for the group that has a college degree. Is the decline in the new entrepreneurship rate associated with increased student debt? More graduates holding debt or a higher average student debt per borrower could reduce the ability of potential young entrepreneurs to borrow. In Canada, the majority of student loans are issued by the government (e.g., the Canada Student Loans Program). The most recent data show that the average debt owed to government at
20 A simple regression of the new entrepreneurship rate on the wage ratio leads to negative and statistically significant coefficient estimates.

13
graduation was around $22,000 in 2010 and around $26,000 owed to all sources (both at current prices).21 Close to half of graduates held student loans in 2010. To compare with the United States, in 2010, the average debt per borrower among the graduates was slightly higher than US$25,000 (current price).22 Ambrose, Cordell and Ma (2015), using U.S. county-level data, find a strong negative correlation between changes in student loan debt and net business creation. Chart A15 plots the average student loan per full-time student borrower and the new entrepreneurship rate for the age groups 15–24 and 25–34 with higher education (the data do not include Quebec, since there are no historical data for Quebec in the Canada Student Loans Program). We calculated the correlation between the student loan per borrower five years ago and the current-year new entrepreneurship, and found that this correlation is slightly negative. 5. Conclusion and Future Direction
In this paper we presented data showing a downward trend in both firm entry and new entrepreneurship in Canada since the early 1980s. The decline is observed in most economic sectors and demographic groups. We also examined possible explanations for this phenomenon. First, we used shift-share analysis to examine whether sectoral shifts and the move toward an older population structure could explain the downward trend. We found that sectoral shifts cannot account for the downward trend in firm creation and that aging of the labour force can account for only a small part of the decline in new entrepreneurship. However, the shift toward an older population accounts for a larger part of the decline since around 2000, and should continue to put downward pressure on new entrepreneurship. Still, developments within sectors and within age groups account for most of the downward trend in the firm entry rate and new entrepreneurship. We discussed potential explanations for this: forces leading to increased industry concentration, changing labour conditions (including lower unemployment, improved labour market flexibility, and higher high-skill premium), and higher student debt. These appear promising as potential explanations, but more research is needed before definitive conclusions can be reached. Alternative explanations also need to be studied, including tax policies and regulation. The implications of the secular decline in firm creation for productivity and output growth can be better understood only if the nature and the causes of such a decline are better understood.
21 See CANSIM Tables 477-0070 and 477-0068. 22 See the Wall Street Journal, “Congratulations to Class of 2014, Most Indebted Ever,” http://blogs.wsj.com/numbers/congatulations-to-class-of-2014-the-most-indebted-ever-1368/.

14
References
Ambrose, B., L. Cordell and S. Ma. 2015. “The Impact of Student Loan Debt on Small Business Formation.” Federal Reserve Bank of Philadelphia Working Paper No. 15-26.
Baldwin, J. R. and W. Gu. 2006. “Plant Turnover and Productivity Growth in Canadian Manufacturing.” Industrial and Corporate Change, 5 (3), 417–65.
Bank of Canada. 2015. Monetary Policy Report. April.
Bérubé, C., B. Dostie and L. Vilhuber. 2013. “Contribution de la Réallocation de la Main-D’œuvre à la Croissance de la Productivité au Canada.” Centre sur la productivité et la prospérité. HEC Montréal.
Business Development Bank of Canada (BDC). 2012. BDC Index of New Entrepreneurial Activity.
Clementi, G. L. and B. Palazzo. 2013. “Entry, Exit, Firm Dynamics, and Aggregate Fluctuations.” NBER Working Paper No. 19217.
Criscuolo, C., P. N. Gal and C. Menon. 2014. “The Dynamics of Employment Growth: New Evidence from 18 Countries.” OECD Science, Technology and Industry Policy Papers, No. 14, OECD Publishing, Paris.
Davis, S. J. and J. Haltiwanger. 2014. “Labor Market Fluidity and Economic Performance.” NBER Working Paper No. 20479 (published in the Federal Reserve Bank of Kansas City Jackson Hole Conference Symposium).
Decker, R., J. Haltiwanger, R. Jarmin and J. Miranda. 2012. “The Secular Decline in Business Dynamism in the U.S.” Working paper presented at Association for Public Policy Analysis and Management Fall Research Conference, November 2012.
Decker, R., J. Haltiwanger, R. Jarmin and J. Miranda. 2014. “The Role of Entrepreneurship in US Job Creation and Economic Dynamism.” Journal of Economic Perspectives, 28 (3), 3–24.
Diez, F. 2014. “The Great Recession, Entrepreneurship, and Productivity Performance.” Current Policy Perspective No. 14-8, Federal Reserve Bank of Boston.
Fairlie, R. 2014. “Kauffman Index of Entrepreneurial Activity.” Ewing Marion Kauffman Foundation.
Fortin, N. and T. Lemieux. 2015. “Changes in Wage Inequality in Canada: An Interprovincial Perspective.” CLSSRN Working Paper No. 2015-3, Vancouver School of Economics.

15
Foster, L., J. Haltiwanger and J. Krizan. 2006. “Market Selection, Reallocation, and Restructuring in the U.S. Retail Trade Sector in the 1990s.” Review of Economics and Statistics, MIT Press, 88 (4), 748–58.
Haltiwanger, J. 2012. “Job Creation and Firm Dynamics in the United States.” In Innovation Policy and the Economy, National Bureau of Economic Research, volume 12, p. 17–38, University of Chicago Press.
Haltiwanger, J. 2015. “Top Ten Signs of Declining Business Dynamism and Entrepreneurship in the U.S.” Paper written for the Kauffman Foundation New Entrepreneurial Growth Conference in June 2015.
Industry Canada. 2013. Consumer Trends Update: Canada’s Changing Retail Market.
Lamothe, O. and A. Colovic. 2013. “Do Demographics Influence Aggregate Entrepreneurship?” Applied Economic Letters, 20 (13), 1206–10.
Leung, D. 2015. “Quarterly Business and Employment Dynamics: Experimental Estimates, First Quarter 2001 to Third Quarter 2014.” Statistics Canada.
Liang, J., H. Wang and E. Lazear. 2014. “Demographics and Entrepreneurship.” NBER Working Paper No. 20506.
Macdonald, R. 2014. “Business Dynamism in Canada: A 30-year Perspective.” Statistics Canada.
Parliamentary Budget Officer. 2014. Economic and Fiscal Outlook. April.
Turcotte, M. 2010. “Working at Home: An Update.” Canadian Social Trends, Statistics Canada, December.
Yurdagul, E. 2015. “Production Complementarities and Flexibility in a Model of Entrepreneurship.” Draft working paper.

16
Appendix A: Data Description
Longitudinal Employment Analysis Program (LEAP)
The historical series on firm turnover were recently released by Statistics Canada (Macdonald 2014). These series were produced by Statistics Canada using a firm-level data set, the Longitudinal Employment Analysis Program (LEAP). LEAP is based on the payroll data from the annual statements of remuneration paid (T4 slips). It is currently the primary data source for firm turnover and the associated job reallocation at both the aggregate level and the 2-digit North American Industry Classification System level.23 A firm in LEAP refers to an enterprise with employees, while an enterprise is defined as the organizational unit of a business that directs and controls the allocation of resources relating to its domestic operations. Firm creation and exit are identified using changes in employment. A firm is an entrant if it had zero employees in the previous year and has at least one employee in the current year. A firm is called “exit” if it had at least one employee in the previous year but has zero employees in the current year. A firm is called incumbent if it had at least one employee in the previous year and has at least one employee in the current year. Incumbents and entrants together form the population of active firms. Statistics Canada developed a new methodology for producing more timely data on firm dynamics and the associated job creation and destruction (Leung 2015). Under the new methodology, it uses quarterly payroll data to estimate firm turnover and firm population that are comparable to previously published data. Statistics Canada released data for 2015Q1 based on the new methodology. The new data are available at the sectoral level (the quarterly data released last September were available only at the aggregate level).
The BDC index of new entrepreneurial activity
The BDC index was developed by the Business Development Bank of Canada (BDC) to measure new entrepreneurship. This measure is similar to the Kauffman index of new entrepreneurial activity in the United States.24 The BDC index is calculated as the number of new self-employed workers who hire employees, as a share of the labour force. A self-employed worker is new if that worker’s job tenure is 12 months or less. The index can be calculated for the total economy and by demographic groups (e.g., age, education, immigration status) using Labour Force Survey data. 23 NAICS is the North American Industry Classification System. 24 See Fairlie (2014) for more details on the Kauffman index of entrepreneurial activity.

17
Appendix B: Decomposing Aggregate Entry and Exit Rates
For each sector j, let 𝑒0 and 𝑒𝑡 be the number of entrants in the base year and in year t, and let 𝑛0 and 𝑛𝑡 be the population of firms in the base year and in year t. Further, let 𝜔𝑗 be the share of firm counts of sector j in the total firm population, 𝜔𝑗𝑡= 𝑛𝑗𝑡 /∑ 𝑛𝑗𝑡𝑗 . The change in the aggregate entry rate between the base year and year t is decomposed as follows:25
𝐸𝑡𝑁𝑡− 𝐸0
𝑁0= ∑ 𝜔𝑗0∆
𝑒𝑗𝑡𝑛𝑗𝑡𝑗 + ∑ ∆𝜔𝑗𝑡
𝑒𝑗0𝑛𝑗0𝑗 + ∑ ∆𝜔𝑗𝑡∆
𝑒𝑗𝑡𝑛𝑗𝑡𝑗 .
On the right-hand side, the first term is called the within effect, i.e., the contribution of changes in the entry rates in all sectors, holding the shares of sectors at the reference year levels. The second term is called the between effect, which is the contribution of shifts in sectors assuming the entry rates did not change over time. The last term is called the cross effect, capturing the contribution of changes in both shares and entry rates. The aggregate exit rate can be decomposed in the same way.
25 This decomposition has been used in the literature of productivity growth. See Decker et al. (2014) for a similar decomposition.

18
Appendix C: Additional Charts
Aggregate (business sector)Other services (except public administration)
Accommodation and food servicesArts, entertainment and recreation
Administration and support, waste managementProfessional, scientific and technical services
Finance, insurance, real estate and leasingInformation and cultural industries
Transportation and warehousingRetail trade
Wholesale tradeManufacturing
ConstructionMining, oil and gas extraction
Agriculture, forestry, fishing and hunting
-30 -25 -20 -15 -10 -5 0
Entry rate Exit rate
Chart A1: Generalized declines in sectoral entry and exit rates from 1984 to 2012
Annual data
Last observation: 2012 Source: Statistics Canada

19
0
5
10
15
20
1984 1988 1992 1996 2000 2004 2008 2012
%
Entry rate Exit rate
Chart A2: Declining entry rate in manufacturing since the late 1990s Annual data
Last observation: 2012 Sources: Statistics Canada and Bank of Canada calculations
0
5
10
15
20
25
1984 1988 1992 1996 2000 2004 2008 2012
%
Entry rate Exit rate
Chart A3: No clear trend in the entry and exit rates of the mining, quarrying, oil and gas sector Annual data
Last observation: 2012 Sources: Statistics Canada and Bank of Canada calculations

20
0.00
0.15
0.30
0.45
0.60
15-24 25-34 35-44 45-54 55-64 65+
%
1981 1990 2000 2014
Chart A4: Large declines in rates of new entrepreneurship among younger groups Annual data
Last observation: 2014 Sources: Statistics Canada and Bank of Canada calculations
0.00
0.10
0.20
0.30
0.40
0.50
Men Women
%
1981 1990 2000 2014
Chart A5: New entrepreneurship rates of both men and women have declined Annual data
Last observation: 2014 Sources: Statistics Canada and Bank of Canada calculations

21
0.00
0.10
0.20
0.30
0.40
0.50
0.60
Canada Quebec Ontario Atlantic Region Prairie Region British Columbia
%
1981 1990 2000 2014
Chart A6: Rates of new entrepreneurship have declined in all regions Annual data
Last observation: 2014 Sources: Statistics Canada and Bank of Canada calculations
0.00
0.10
0.20
0.30
0.40
0.50
0.60
Primary or secondary education Some or completed post-secondary certificate or diploma
University degree
%
1981 1990 2000 2014
Chart A7: New entrepreneurship has declined the most among university degree holders Annual data
Last observation: 2014 Sources: Statistics Canada and Bank of Canada calculations

22
Agriculture[11]
Mining[21]
Construction[23]
Manufacturing[31-33]
Wholesale[41]
Retail[44-45]
Transportation[48-49]
Information[51]
FIRE[52-53]
Professional[54]
Administration[56]
Arts[71]
Accommodation[72]
Other services[81]
UB[99]
-4 -3 -2 -1 0
Percentage points
Chart A8: Other services, Agriculture and the Retail sector have seen particularly large entry rate declines from 1984 to 2012 Annual data
Last observation: 2012 Sources: Statistics Canada and Bank of Canada calculations
65+
55-64
45-54
35-44
25-34
15-24
-0.10 -0.08 -0.06 -0.04 -0.02 0.00 0.02
Percentage points
Chart A9: Within age group effect: 1981 and 2014 Annual data
Last observation: 2014 Sources: Statistics Canada and Bank of Canada calculations

23
University degree
Some or completed post-secondary certificate or diploma
Primary or secondary education
-0.14 -0.12 -0.10 -0.08 -0.06 -0.04 -0.02 0.00
Percentage points
Chart A10: Within education group effect: 1981 and 2014 Annual data
Last observation: 2014 Sources: Statistics Canada and Bank of Canada calculations
10
12
14
16
18
20
1983 1987 1991 1995 1999 2003 2007 2011
Employees per firm
Chart A11: Average firm size in the retail sector
Last observation: 2012 Sources: Statistics Canada and Bank of Canada calculations

24
0.00
0.08
0.16
0.24
0.32
0.40
0
2
4
6
8
10
12
14
1981 1985 1989 1993 1997 2001 2005 2009 2013
% %
Unemployment rate (left axis) Entrepreneurship rate (right axis)
Chart A12: Unemployment and new entrepreneurship appear to be related
Annual data
Last observation: 2014 Sources: Statistics Canada and Bank of Canada calculations
1.00
1.05
1.10
1.15
1.20
1.25
1.30
1.35
1.40
1.45
0.00
0.08
0.16
0.24
0.32
0.40
1981 1985 1989 1993 1997 2001 2005 2009 2013
% %
Entrepreneurship rate (left axis) Wage ratio (right axis)
Chart A13: College wage premium and entrepreneurship rate are negatively correlated
Annual data
Last observation: 2014 Sources: Statistics Canada and Bank of Canada calculations
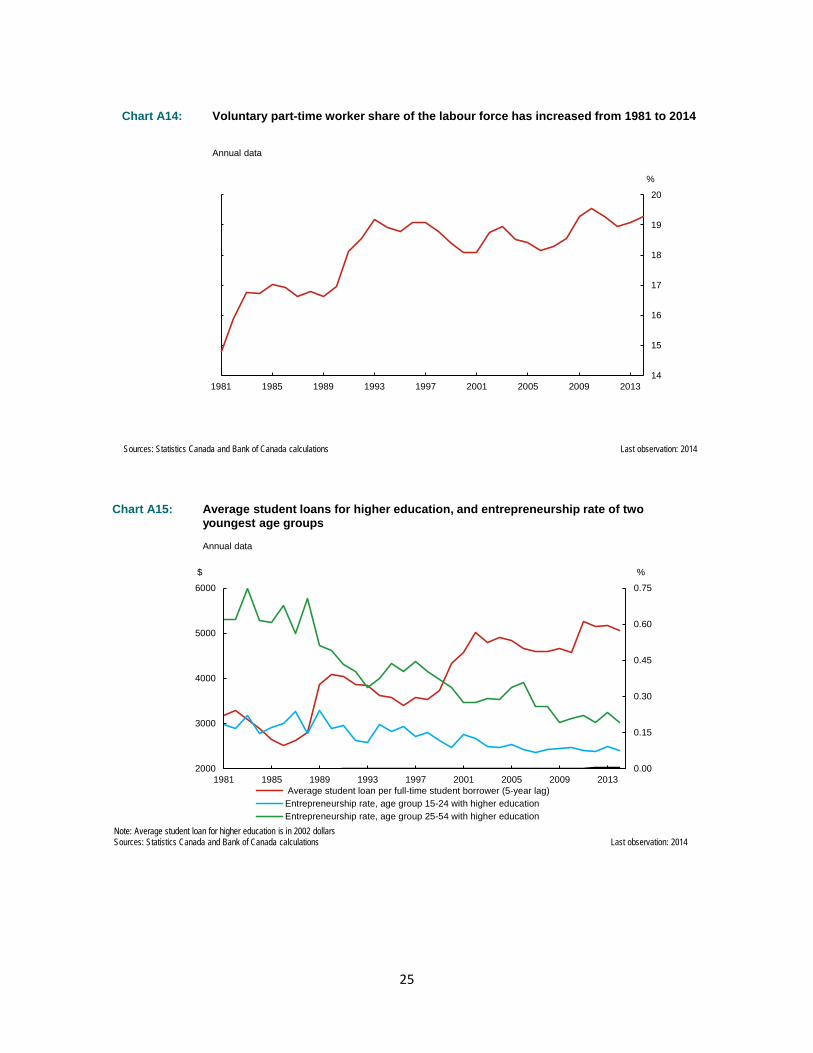
25
14
15
16
17
18
19
20
1981 1985 1989 1993 1997 2001 2005 2009 2013
%
Chart A14: Voluntary part-time worker share of the labour force has increased from 1981 to 2014
Annual data
Last observation: 2014 Sources: Statistics Canada and Bank of Canada calculations
0.00
0.15
0.30
0.45
0.60
0.75
2000
3000
4000
5000
6000
1981 1985 1989 1993 1997 2001 2005 2009 2013
% $
Average student loan per full-time student borrower (5-year lag)Entrepreneurship rate, age group 15-24 with higher educationEntrepreneurship rate, age group 25-54 with higher education
Chart A15: Average student loans for higher education, and entrepreneurship rate of two youngest age groups
Annual data
Last observation: 2014 Sources: Statistics Canada and Bank of Canada calculations Note: Average student loan for higher education is in 2002 dollars