trends in national and regional economic distress: 1960 … · trends in national and regional...
TRANSCRIPT

Trends in National and Regional Economic Distress: 1960-2000
Prepared for the Appalachian Regional Commission
by Lawrence E. Wood Assistant Professor
College of Communication Ohio University
Athens, Ohio
April 2005

Table of Contents
Part I: Introduction …………………………………………………………………… 1
Part II: The Federal Government and Regional Development …………………… 3
Part III: Research Design …………………………………………………………… 6
Part IV: Result of Distressed Counties Analysis ……………..…………………… 13
Part V: Socioeconomic Characteristics of Distress Nationally and Regionally ………. 30
U.S. ……………………………………………………………………… 31
Appalachia …………………………………………………………………… 37
Central Appalachia …………………………………………………………… 39
Southern Appalachia ………………………………………………………… 43
Northern Appalachia …………………………………………………………… 47
The Mississippi Delta Region ……………………………………………… 49
The South …………………………………………………………………… 53
The Southwest ……………………………………………………………… 57
The U.S.-Mexico Border Region ……………………………………………… 61
Historically Non-Distressed Regions …………………………………………… 65
Part VI: Conclusion …………………………………………………………………… 72
Bibliography …………………………………………………………………………… 76
Appendix A: Information about Economic Distress Status and Variables …..…………. A-1
Appendix B: Regions as Identified in this Research ………………………………… B-1
Appendix C: Logistic Regression Models ……………………………………………. C-1
2

Part I: Introduction The 1960s marked an era when the federal government had become increasingly concerned with addressing the socioeconomic problems of lagging regions and communities in the U.S. Emblematic of this concern was the creation of agencies such as the Area Redevelopment Administration (ARA), the Economic Development Administration (EDA), and the Appalachian Regional Commission (ARC). While the EDA and ARC have continued in their attempts to promote development and social well being since the 1960s – the EDA operating throughout much of the nation and the ARC working within the Appalachian Region – since the early 1980s federal funding to these agencies has dropped considerably. In the meantime, while a number of other regional development commissions have either been created or proposed at the federal level in recent years, including the Delta Regional Authority, the Denali Commission, and the Southwest Regional Border Authority, these commissions have invariably been poorly funded or have not yet gathered the political support necessary to gain Congressional approval. From the perspective of federal regional planning and development initiatives, the ARC is rather unique in scope, especially in its mandate and efforts to address issues of social and economic concern in a specifically defined, historically lagging region of the U.S. In short, the ARC is the one federal regional development commission that has a long history of trying to improve the socioeconomic conditions of a specifically defined region. Since 1965 the commission has attempted to address development concerns in Appalachia by providing support for a wide range of projects, including the Appalachian Development Highway System (ADHS); public works projects such as water and sewer lines for homes, businesses, and industries; health initiatives aimed at creating subregional health networks; and educational projects for children as well as adults. The trajectory of federal support for ARC activities reflects changing perspectives regarding the federal government’s role in addressing issues of regional socioeconomic concern in the United States. In the 1960s and 1970s there was bipartisan agreement in Congress that problems of regional economic distress could not be solved by market forces alone. Beginning in 1980, however, a market-oriented standpoint became ascendant and gained momentum over the next two decades as bipartisan view that held that the market mechanism should be relied on to resolve regional economic problems. The history of activities within the ARC itself also demonstrates changing views over time regarding how best to address issues of socioeconomic distress. The commission has gone from a congressional mandate that initially focusing its efforts in the urban growth centers of the Appalachian Region, to a shift in the mid-1980s towards concentrating its resources on the rural, distressed counties of Appalachia. Other recently created or proposed commissions share a similar focus on distressed areas. This research addresses the question of what has happened between the 1960s─the time when the federal government took on a previously unparalleled commitment to address regional socioeconomic concerns─and the present, where approximately two decades have passed since the federal government considerably backed off from these earlier efforts. This report attempts to answer this question by examining changing socioeconomic conditions throughout the U.S. between 1960 and 2000. Specifically, this research assesses national and regional socioeconomic conditions directly prior to the inauguration of agencies such as the EDA and
3

ARC, and then examines how various regions in the U.S. have fared since that time. In particular, this research analyzes the following issues:
1) The changing nature of economic distress between 1960 and 2000, nationally as well as regionally, utilizing a consistent measure of economic distress, specifically an economic distress measure developed by the ARC.
2) Regional economic trends throughout the U.S. in terms of the individual indicators that comprise the ARC’s distress measure, which includes poverty rates, levels of income, and unemployment rates.
3) Social and economic trends at the national and regional level utilizing various indicators that are not included within the ARC’s distress measure, including, for example, rates of educational attainment, levels of urbanization, and a measure of economic diversity.
This report is an extension of previous research that examined changing patterns of economic distress over time in Appalachia during the period 1960 to 1990.1 Similar to the previous research, this report utilizes the ARC’s current measure of economic distress to assess the economic status of counties in the Appalachian Region over time, though it extends the previous research by utilizing recently released data from the 2000 census to examine distress conditions in Appalachia in the year 2000. Moreover, this research further extends the previous research by providing a more precise understanding of the changing nature of economic distress in other regions of the U.S. These regions include those that, like Appalachia, have historically had economically distressed conditions, such as the Mississippi Delta Region and the South, as well as regions that have had relatively strong economic conditions over time, including New England and the Mid-Atlantic Region.2 Moreover, as this research will demonstrate, amidst at least some economic improvement throughout much of the U.S. since the 1960s, regional economic distress has grown in some parts of the country, including in the U.S.-Mexico Border Region. Like the previous report, an important component of this research is the determination of socioeconomic factors associated with persistent economic distress, as well as factors associated with counties graduating out of economic distress status over time. Thus, this analysis not only calculates economic distress over time, but it also provides corresponding statistical analyses that offer an indication as to why some counties, at the national as well as regional levels, have been able to move out of economic distress since the 1960s, while others have remained mired in distress throughout much of the past forty years. Again, this research extends the previous analysis by examining in detail these issues in various regions of the U.S. This analysis details socioeconomic change in Appalachia and other regions of the U.S., and provides relevant benchmarks for assessing regional and national socioeconomic change from the period directly prior to the establishment of agencies such as the ARC, to the present. Results of this research indicate that the trend over the past couple of decades of limited federal support for regional development activities may not be very well justified.
1 See Wood and Bischak (2000). 2 For information on all the regions assessed in this research, see Appendix B.
4

Part II: The Federal Government and Regional Development While the 1960s marked a time when the federal government became particularly concerned with addressing the socioeconomic problems of lagging regions, the federal government has a long history of being involved in activities that have had a direct effect upon regional and local economic development. For example, federal road building efforts of the early 20th century are understood to have affected local and regional development throughout parts of the U.S. However, in spite of such activities, federal planning and development efforts prior to and extending through the first few decades of the 1900s should be understood as without particular regional focus.3 This practice changed in 1933 with the inauguration of the Tennessee Valley Authority (TVA), which is typically recognized as the federal government’s first foray into multi-state, regionwide development activity.4 At the same time, and despite the improvement in socioeconomic conditions that resulted from its efforts, the TVA’s activities were primarily rooted in an effort to control floods and develop resources and means for energy rather than to address regional socioeconomic concerns in particular. Nonetheless, TVA development projects as well as similar projects elsewhere in the U.S. throughout the 1930s, 1940s, and 1950s, led to outcomes directly related to regional development, including the provision of electricity; the development of water resources; flood control; the development of recreational facilities; and increased agricultural land use through erosion control and reforestation projects.5
Despite these activities, federal government initiatives principally focused on regional economic and social development did not begin until the early 1960s. At that time relatively wide bipartisan agreement had developed in Congress that the economic problems of some parts of the country could not be resolved by market processes and private initiative alone.6 In general it was understood by members of Congress, as well as President Kennedy, that the federal government could and should play a clear and obligatory role in improving the social and economic conditions of historically lagging regions such as Appalachia. This attitude helped contribute to the establishment of the Area Redevelopment Act (ARA), which was created in the early 1960s to fund projects in impoverished areas throughout the country. Such efforts, however, lacked the specific regional focus that agencies such as the ARC would eventually encompass. Despite these developments, some Appalachian politicians grew dissatisfied with ARA efforts, particularly in light of increased media attention on Appalachian poverty, and record floods in Central Appalachia in the early 1960s. As a result support grew during the early 1960s for the creation of a regional commission dedicated solely to Appalachia. An important step towards establishing this commission began in 1963, when President Kennedy created the President’s Appalachian Regional Commission (PARC). The President appointed the PARC with the task of specifically identifying the socioeconomic problems of Appalachia and to develop a framework for addressing such problems. The PARC’s eventual findings, which documented the "realities of deprivation" in Appalachia that included low income, high unemployment, lack 3 See Friedmann (1964); and Thoman (1976). 4 See Selznick (1966). 5 See Friedmann (1964); Thoman (1976); and Selznick (1966). A range of other information is also available in relation to the TVA and other early development activities. 6 Congressional Record (1960).
5

of urbanization, and deficits in educational attainment as well as in quality of housing, led to the passage of the Appalachian Regional Development Act (ARDA) in 1965.7 The ARDA created the ARC and encompassed a programmatic framework, largely based upon the PARC’s findings and suggestions, for addressing Appalachia’s socioeconomic problems.8
Concerns about local and regional economic distress in other areas of the country also led to the passage of the Public Works and Economic Development Act (PWEDA) of 1965. This Act created and directed the EDA to address issues of persistent unemployment in economically distressed areas and regions.9 In short, by 1965, with the establishment of the EDA and the ARC, the federal government had made a clear and previously unparalleled commitment to addressing issues of regional economic distress. In retrospect, however, these efforts came at the tail end of the federal government’s decades-long foray into social welfare oriented activities that had begun with New Deal programs of the 1930s and perhaps peaked with the “War on Poverty” and “Great Society” efforts of the 1960s Thus, the momentum and idealism that led to the creation of the ARC and EDA would be relatively short-lived. In the early 1980s the federal government began a considerable retreat from many of the social welfare programs it had established in the 1960s.10 Agencies such as the ARC and EDA began working with only a tenth, or even less, of the budgets that they had worked with in the 1960s and 1970s.11 As will be indicated in the analysis that follows, the federal government’s allocations to the ARC, the EDA, and poverty programs more generally mirror patterns of growth and decline in economic distress over time. Whether by coincidence or not, as federal regional development and poverty expenditures were at their height in the 1960s and 1970s, the number of distressed counties declined in the U.S. during that same period of time. Then, when the federal government began allocating less to such programs in the 1980s, the number of distressed counties began to grow. This trend somewhat reversed itself between 1990 and 2000, a time when federal poverty and economic development spending similarly changed direction and began to rise. As suggested, however, federal allocations to the ARC, as well as to the EDA, are currently far from their historic highs of the 1960s and 1970s, and federal allocations to both of these agencies have remained relatively low for the past two decades.12 Recently, a number of regional development agencies modeled after the ARC have either been established by Congress or proposed by members of Congress. However, as has been the case with the ARC in recent years, these agencies, once established, have received relatively limited funding from the federal government.13 Newly created agencies include the Delta Regional Authority (DRA), which serves the historically distressed Mississippi Delta Region; the Denali Commission, which focuses on rural economic distress in Alaska; and the Northern Great 7 PARC (1964). 8 ARDA (1965). 9 PWEDA (1965). 10 See Wood and Bischak (2000) for a chart depicting “Federal Poverty Expenditures as a Percent of GDP 1962-2000,” as well as a chart depicting “Federal Economic Development Spending 1962-2000.” 11 See Wood and Bischak (2000) for a chart and information about ARC budgets over time. See Wood and Glasmeier (2003) for information about federal allocations to the EDA over time. 12 Again see Wood and Bischak (2000) and Wood and Glasmeier (2003). 13 For information about funding to these agencies, see for example information in relation to budget allocations to the Delta Regional Authority at www.dra.gov. Information about allocations to the Denali Commission is available at www.denali.gov.
6

Plains Regional Authority, which is the most newly established regional development commission and operates in the states of Iowa, Minnesota, Nebraska, North Dakota, and South Dakota. Recent bills in Congress have also focused on the establishment of regional development commissions, again modeled after the ARC, in the Southwest Border Region, in the Southeast Crescent, and in the Southern Black Belt, with these latter two areas having some overlap. Pending federal approval, the Southwest Regional Border Authority would address economic distress in a 93 county region along the U.S.-Mexico border, while initiatives related to the Southern Crescent and the Southern Black Belt typically relate to addressing regional poverty in the South, including states such as Virginia, North Carolina, South Carolina, Georgia, Alabama, Mississippi, and Florida. The establishment of agencies such as the Delta Regional Authority, and discussions around creating regional commissions in the Border Region or in historically impoverished areas of the South, are an indication that regionally concentrated poverty in these areas is recognized by at least some politicians at the federal level. At the same time, this recognition has often not been met with the sufficient political support necessary to create these commissions and in instances where commissions have been established, such as in the Mississippi Delta Region, this recognition has not been greeted with significant financial support. In many respects, and despite continued assistance to the ARC, the EDA, and the creation of new regional development commissions, the federal government’s attitude towards regional development policy and programs over the past twenty years has been one of indifference.
7
Part III: Research Design This analysis utilizes the ARC’s current measure of distress to assess the number of economically distressed counties in Appalachia as well as in other regions throughout the U.S. in the following years: 1960; 1970; 1980; 1990; and 2000. To assess county-level economic conditions, the ARC incorporates in its distress measure indicators of poverty, unemployment, and per capita market income (hereafter referred to as PCMI, which is income excluding transfer payments). A more detailed discussion of the distress measure is included below. As previously mentioned, this analysis is an extension of previous research that examined distressed counties in Appalachia as well as in the entire U.S. during the period 1960 to 1990.14 Prior to that report, no research had assessed distress in Appalachia using a consistent measure over such an extended time period. This research updates and builds upon the previous report, while adding a few new details to expand the prior analysis. These additions include a similar analysis as is done for Appalachia for other regions throughout the U.S. Like the previous report, this analysis also examines socioeconomic factors associated with regional distress in Appalachia over time. These factors are also examined in relation to changing patterns of distress in other regions of the U.S. as well. The measure of economic distress utilized in this analysis can be traced back to the inception of the ARC’s Distressed Counties Program. While in the 1960s and early 1970s the ARC attempted to implement an urban-oriented growth center policy, a significant shift in commission policy began in the early 1980s when the ARC embarked upon a concerted effort to identify the most economically distressed counties in the Appalachian Region and to increase agency development activities in such counties.15 Thus, in 1983 the ARC began what it termed its “Distressed Counties Program,” and since that time this initiative has grown to become the predominate framework for ARC development efforts.16 For detailed information about the Distressed Counties Program, readers are referred to the previous report, which dealt with the background and development of this program in more detail.17 Thus, this current analysis does not discuss the details of the Distressed Counties Program per se; however, it is pertinent to describe the ARC’s distress measure itself. The ARC’s Distress Measure The ARC’s current distress measure relies on county-level rates of poverty, unemployment, and PCMI. The ARC has made various adjustments to its distress measure since it first began measuring economic distress. For example, when the ARC initially began assessing economic distress in the Appalachian Region, the commission included along with rates of poverty, unemployment, and PCMI, infant mortality rates, but in the late 1980s the ARC stopped utilizing the infant mortality indicator as a part of its distress measure. In general, the ARC has made a number of, though largely subtle, changes to its distress measure over time, primarily in attempts to improve the consistency and relevancy of the measure. As is the case with the Distressed Counties Program more generally, readers are referred to the previous report for 14 Wood and Bischak (2000). 15 For a discussion of the ARC’s growth center policy, see ARC (1968); ARC (1970), and Wood (2001). For further details about the ARC’s distressed counties program readers are referred to Wood and Bischak 2000. 16 Based on an analysis of ARC expenditure patterns over time conducted by the author of this report 17 Wood and Bischak (2000).
8

information regarding the specifics of the changing nature of the ARC’s distress measure over time.18 This report utilizes the ARC’s current distress measure as a consistent measure of distress for all years in the analysis. More precisely, at this time the commission considers any given county in the Appalachian Region to be distressed if it meets the following criteria:
• A poverty rate that is 150 percent or more of the U.S. average • PCMI that is no more than 2/3 of the U.S. average • And an unemployment rate that is 150 percent or more of the U.S. average
A county also qualifies as being distressed if it has a poverty rate that is at least 200 percent of the national average and matches only one of the two remaining criteria (150 percent unemployment or two-thirds PCMI). Thus, poverty rates can be an especially important factor in determining whether or not the ARC considers a county to be distressed, especially in that if poverty rates are especially high then a county needs to only meet the agency’s unemployment criterion or the PCMI criterion to be considered distressed. The distress measure as described above is utilized in the reminder of this report to identify patterns of distress in Appalachia as well as in other regions of the U.S. over time. Rates of poverty, unemployment, and income are utilized for each of their respective years to calculate distress thresholds for any given year in the analysis. Thus, the ARC’s current measure of distress is used to benchmark changes in distress levels within Appalachia and other regions of the U.S. for each period in this analysis. Thresholds for the individual distress indicators as well as other information related to the variables utilized to calculate distress are included in Appendix A. All counties in the contiguous U.S. are included in this analysis, and a discussion of the individual regions for which distress is analyzed is included below. The ARC is not unique in its efforts to designate distressed areas for purposes of policy implementation within its jurisdiction. Other agencies, such as the U.S. Department of Agriculture (USDA), the EDA, and the TVA also identify and address what might be considered individually distressed areas within their jurisdictions. Furthermore, the ARC’s distress measure is similar to measures used by other federal and state agencies.19 Moreover, the Delta Regional Authority utilizes a distress measure based upon the ARC’s measure, and other pending regional development commissions have indicated that they too would utilize the ARC’s current distress measure for purposes of resource allocation.20 As will be discussed in the next section, however, developing a rational and effective measure of distress is by no means without its difficulties.
18 Again see Wood and Bischak (2000). 19 See Fullenbaum and McNeill (1995). 20 See www.dra.gov. This also relates to the author’s understanding of operations as they would relate to the activities of the Southwest Regional Border Authority.
9

Criticisms of the Distress Measure As is the case with virtually any indicator, the ARC’s distress measure is open to a number of criticisms, many of which are acknowledged by the ARC itself. Indeed, one of the biggest concerns that the ARC has with its distress indicator is the lack of annual poverty data, as data to determine official poverty rates are collected only once every ten years through the U.S. census. Thus, the agency’s assessment of county-level distress includes a measure that over time becomes increasingly outdated, so that, for example, in 1999 the agency was utilizing 1990 U.S. census poverty rates to assess distress in the region. ARC has explored using annual poverty estimates by the U.S. Census to address this problem, but the lack of timely annual estimates confounds this approach.21 The ARC has also been criticized for its use of the unemployment variable, especially in that the variable as collected by the federal government does not account for the long-term unemployed or the underemployed.22 ARC has explored developing county-level underemployment estimates, but such estimates depend on the U.S. Census Bureau’s Current Population Survey (CPS) which does not provide adequate coverage to permit detailed county-level estimates. In order to overcome these limitations, researchers have developed statistical models to provide county-level estimates, but such models are time-consuming and costly.23 More generally, the ARC has attempted to develop its distress measure so to identify structurally poor economic conditions that are persistent over time. Other criticisms of the ARC’s distress measure have included the issue of the indicator being bivariate, with the measure thus offering no indication of degrees of distress.24 By not accounting for varying degrees of distress, it may be the case that some counties identified as being “distressed” by the ARC have much better, or much worse, economic conditions than other counties that are similarly identified as such. On the other hand, though addressing a somewhat different issue, the ARC has taken measures to differentiate between economic conditions in counties that are not considered distressed. Through using poverty, unemployment, and PCMI variables, the agency identifies all non-distressed counties as being either attainment, competitive, or transitional counties, and the agency has what it considers to be appropriate policies to address economic circumstances in counties exhibiting each of these types of economic conditions. In summary, while it is true that there are perhaps some flaws with the ARC’s distress indicator, it is also important to understand that there is no “perfect” indicator of economic conditions, and it is of note that the ARC has made a somewhat consistent effort over time to evaluate, reevaluate, and improve its distress measure. Considering that there are potential shortcomings with the ARC’s distress measure, this analysis not only assesses distressed conditions over time in relation to the distress measure in particular, but it further evaluates changing patterns of economic conditions in relation to each of the individual indicators that comprise the ARC’s distress measure as well. This is done to provide particular insight into regional economic conditions that may not be captured by the distress measure as a whole. To provide one example, in some instances it may be the case that counties have particularly bad economic conditions in relation to PCMI alone, but rates of
21 Hammer (August 2000). 22 Couto (1992). 23 Bradley, Herzenberg, and Wail (2001). 24 Glasmeier and Fuellhart (1999).
10

poverty, unemployment, and PCMI, when considered together, do not qualify such counties as being distressed. By examining each of the individual indicators that comprise the distress index – over time as well as at regional levels – and along with the examination of conditions of economic distress in relation to the ARC’s distress measure more generally, this analysis provides a range of indications of economic conditions in the U.S. during the period 1960 to 2000. As will be suggested, this series of analyses allows for a number of interpretations of economic conditions regionally as well as nationally.
Regions Included in the Analysis The previous analysis of distressed conditions in Appalachia and the U.S. did not examine distress patterns in individual regions in the U.S., aside from Appalachia. However, the previous analysis did provide an indication that a number of regions had demonstrated either worsening or improving economic conditions during the study period. These regions included the South, which demonstrated clear improvement in economic conditions between 1960 and 1990; the Southwest, which demonstrated some improvement but lingering economic distress over time; the Mississippi Delta Region, which also demonstrated improvement but nonetheless had relatively high levels of economic distress over time; and the U.S.-Mexico Border Region, which for the most part demonstrated an increasing number of counties experiencing economic distress between 1960 and 1990. This current analysis more formally examines patterns of economic distress in these regions. Thus, along with Appalachia, this research assesses changing regional economic conditions in the Mississippi Delta Region, the U.S.-Mexico Border Region, the South, and the Southwest. This analysis refers to each of these five regions as “historically distressed regions,” though it is important to reiterate that while many of these regions have had fairly widespread, chronic conditions of economic distress, some of these regions, such as the South, have experienced rapidly improving economic conditions over the past 40 years. In contrast other regions, particularly the U.S.-Mexico Border Region, have experienced increasing economic problems during the same period of time. The remaining areas of the contiguous 48 states are divided into what are referred to as “non-distressed regions.” These regions, and again at least in the past, have not had a particularly large number of distressed counties, and include the New England, Plains, West, Rocky Mountains, Mid-Atlantic, and Great Lakes regions. These designations, as well as the designations for the aforementioned South and Southwest Regions, are based upon Bureau of Economic Analysis (BEA) “economic regions.” The BEA bases these regional definitions upon homogeneity of socioeconomic characteristics, including industrial composition and demographic characteristics. The BEA’s economic regions include a total of 8 regions in the contiguous 48 states. Further information about BEA regions is included in Appendix B. In this analysis, Appalachian, Mississippi Delta, and U.S.-Mexico Border counties that would otherwise be included within any of the given BEA regions are included, instead, within their respective politically defined regions, resulting in there being a total of 11 regions analyzed in this research (See Figure 1). More precisely, the “Appalachian Region” in this analysis is based upon the ARC’s current definition of the region (See Figure 2); the “Mississippi Delta Region” is largely based upon the Delta Regional Authority’s definition of the region; and the U.S.-Mexico Border Region is chiefly based upon a current proposal before Congress for what would be the Southwest Border Regional Authority and the counties that would be associated
11

with that commission. Further information about these regions is included in Appendix B. As suggested, the two remaining “historically distressed regions,” the South and the Southwest, are based upon BEA “economic region” designations. In short, the Appalachian Region, the Mississippi Delta Region, and the U.S.-Mexico Border Region as defined in this analysis include counties within their politically defined regions. All remaining counties that are not included within these three regions are included within their respective BEA economic regions. While it is true that this analysis could have included other historically distressed regions, it was deemed that the BEA “economic regions” along with the politically defined regions of Appalachia, the Mississippi Delta, and the U.S.-Mexico Border provided a rational and useful means for examining economic distress on a regional basis in the U.S. over time. Figure 1: Regions in Analysis
BEA Regions Great Lakes: Illinois; Indiana; Michigan; Ohio; and Wisconsin. Mid-Atlantic: Delaware; District of Columbia; Maryland; New Jersey; New York; and Pennsylvania. New England: Connecticut; Maine; Massachusetts; New Hampshire; Rhode Island; and Vermont. Plains: Iowa; Kansas; Minnesota; Missouri; Nebraska; North Dakota; and South Dakota. Rocky Mountain: Colorado; Idaho; Montana; Utah; and Wyoming. South: Alabama; Arkansas; Florida; Georgia; Kentucky; Louisiana; Mississippi; North Carolina; South Carolina; Tennessee; Virginia; and West Virginia. Southwest: Arizona; New Mexico; Oklahoma; and Texas. West: California; Nevada; Oregon; and Washington.
12

Figure 2: Appalachian Subregions
Northern Appalachia Central Appalachia Southern Appalachia
13

Socioeconomic Patterns Associated with Economic Distress In addition to analyzing national and regional trends in distressed counties and trends associated with the individual indicators that comprise the distress measure itself, this analysis also examines a range of socioeconomic conditions associated with patterns of distress. In particular this research assesses national and regional socioeconomic issues associated with the following: counties that are currently distressed compared to those that are not distressed; counties that were distressed in 1960 and 2000, often referred to in this analysis as persistently distressed counties; counties that were distressed in 1960 but not in 2000, typically referred to in this analysis as counties that have graduated from distress; and counties that were not distressed in 1960 but had become distressed by 2000. This particular aspect of the analysis, included as Part V of the report, utilizes descriptive statistics, statistical modeling, and the visualization of maps to identify patterns and trends associated with current and changing economic distress. It is the most detailed component of this report. While Part V of the report is mostly written in narrative form, it is primarily based upon statistical evidence. Information about the socioeconomic variables utilized in Part V, as well as information about the statistical modeling techniques used to support the various findings discussed in section V, are included in relevant appendices. Thus, while Part IV of this report will primarily convey the results of distress calculations at national and regional levels over time, Part V examines some of the socioeconomic factors related to current and historical patterns of distress. An important hypothesis for the socioeconomic aspect of this analysis is as follows: if patterns of distress in various regions throughout the U.S. are related to similar socioeconomic conditions, then which factors are statistically associated with distress on a cross between regional basis. However, as the results of this research will indicate, while there are some consistent trends related to economic distress at the national level, in any given region there is a somewhat unique mix of factors that contribute to economic distress. It is also important to note that, as opposed to the analysis of total numbers of distressed counties more generally, Part V of this report examines trends at the subregional level within Appalachia. In particular, and because conditions of economic distress have been largely uneven within Appalachia itself, Part V inspects particular trends associated with distress in Northern, Central, and Southern Appalachia. More generally, for the nation as a whole as well as for the individual regions in this analysis, this research identifies important patterns and processes associated with economic distress, from a contemporary as well as from an historical perspective. The framework for this research as well as the various issues covered in this report make this analysis one of the most systematic and detailed assessments of its kind to date. At the very least, this report provides insights into historical and current patterns of economic distress, as well as issues that explain the changing patterns of economic distress over time. The next section includes the results of the analysis of the number of distressed counties within each of the regions as previously defined. Part V then includes information about socioeconomic factors associated with economic distress at the national and regional levels over time.
14

Part IV: Results of Distressed Counties Analysis This section of the report provides an overview of changing patterns of distress at the national and regional levels over time. Part V of this analysis then expands on this issue by assessing, in relative detail, some of the socioeconomic factors associated with economic distress. In general, in examining issues such as the total number of distressed counties in the U.S., this section of the report is somewhat beset by an overabundance of numbers. An attempt to compensate for this abundance is made through providing an overview of distress, as well as the individual indicators associated with distress, in a somewhat narrative form. The distress indicator as a whole indicates a broad pattern of improving economic conditions in the U.S. when comparing 1960 to 2000. In 1960, 29 percent of all counties in the U.S. met the ARC’s distress criteria. By 2000 this number had dropped to only 12 percent. National patterns of distress over time can broadly be described as having declined tremendously between 1960 and 1980, and then, for the most part, largely stabilizing since then. In particular, the total number of distressed counties declined between 1960 and 1970, and dropped again considerably between 1970 and 1980, so that by 1980 only 11 percent of the counties in the U.S. were distressed. This number increased to 16 percent in 1990, but then dropped to 12 percent in 2000. Though trends in some regions did not mirror this pattern exactly, many of the regions as assessed in this analysis, especially the historically distressed regions, demonstrated a similar pattern of decline in distress between 1960 and 1980; a rise in distress between 1980 and 1990; and then a decline in distress thereafter, with 1980 having been when the number of distressed counties in many regions were at their historic lows (see Table 2, on page 17). As previously suggested, the patterns of economic distress as viewed at the national level virtually are inversely related to federal poverty alleviation efforts. As federal expenditures in relation to poverty, regional development, and other social welfare oriented activities reached historic highs throughout the 1970s, economic distress in the U.S. declined. Comparable observations could be made relating trends in distress to associated federal expenditure patterns during the 1980 to 2000 period as well. While such associations are largely speculative, the general leveling off in improvement in the number of distressed counties since the 1980s has occurred at the same time when federal programs that address issues of poverty and regional economic distress have similarly leveled off, or in some instances declined. Moreover, the growth in economic distress since 1980 suggests that some of the earlier gains made through federal regional development and poverty alleviation efforts may be eroding. Such erosion may be less evident when viewing the distress measure itself than it is when considering some of the individual components of the measure. For example, and as will be indicated in more detail below, the PCMI indicator alone provides a considerably different picture in terms of national and regional economic trends than does the distress indicator. While the PCMI indicator, as is the case with the distress measure more generally, demonstrates dramatic improvement in economic conditions between 1960 and 1980, it further indicates growing problems since that time, to where current patterns in relation to PCMI are more reflective of trends in the 1960s than they were in the 1980s (See Table 3 on page 23). The unemployment indicator, as well, when compared to the distress measure also depicts largely different economic trends occurring in the U.S. over time (See Table 4 on page 25). In short, the PCMI and unemployment indicators depict far more growing economic disparity
15

since the 1980s, nationally and in many instances intraregionally, than does the distress indicator alone. Finally, in terms of national trends but as is often the case at regional levels as well, it is of note that issues of economic distress, no matter what indicator one examines, are persistent for many counties. Most counties that were distressed in 2000 were also distressed in 1960 and indeed have been distressed throughout most of the study period. For example, more than three-quarters of the counties that were distressed in 2000 had been distressed in 4 of the 5 years included in this analysis, and more than half were distressed in all years.25 In short, distress is not random. On the contrary, the counties that were distressed in 2000 were, for the most part, counties that were also distressed in 1960, and have remained distressed since that time. Table 1: Counties Remaining Distressed, Graduating from Distress, and Becoming Distressed (Percent in Parentheses)
Region
Total Counties
Distressed 1960 and 2000
Distressed 1960 not 2000
Distressed 2000 not 1960
Appalachia
410
85 (20.7)
138 (33.7)
4 (1.0)
Mississippi Delta
213
80 (37.6)
82 (38.5)
3 (1.4)
South
548
82 (15.0)
244 (44.5)
5 (0.9)
Southwest
292
19 (6.5)
68 (23.3)
7 (2.4
U.S.-Mexico Border
92
18 (19.6)
8 (8.7)
22 (23.9)
Great Lakes
391
1 (0.3)
6 (1.5)
0 (0)
Mid-Atlantic
109
1 (0.9)
0 (0)
2 (1.8)
New England
67
1 (1.5)
0 (0)
0 (0)
Plains
589
9 (1.5)
41 (7.0)
5 (0.8)
Rocky Mountains
215
4 (1.9)
2 (0.9)
11 (5.1)
West
143
0 (0)
1 (0.7)
14 (9.8)
Total
3069
300 (9.8)
590 (19.2)
73 (2.4)
Non-Appalachia U.S.
2659
215 (8.1)
452 (17.0)
69 (2.6)
Patterns of Regional Distress Between 1960 and 2000 25 76 percent of the counties that were distressed in 2000 were distressed in 4 of the 5 years studied, and 52 percent of the distressed counties in 2000 were distressed in all years, including 1960, 1970, 1980, and 1990.
16

As economic distress has improved nationally over time, at least as is indicated by the distress indicator specifically, improvement has generally taken place within any given region as well, especially in the historically distressed regions of the nation. However, each region has experienced somewhat unique circumstances over time as measured by the distress measure, and while the number of distressed counties in the U.S. has declined between 1960 and 2000, some regions have experienced completely opposite trends. Perhaps nowhere is potential variation in distress – over time as well as intraregionally – more apparent than it is within the Appalachian Region (See Table 2 on page 17). As a whole, Appalachia improved dramatically over time in relation to the distress measure, with the number of distressed counties in the region dropping from a total of 223 in 1960 to 89 by 2000. Change within the region itself, however, has been somewhat uneven. Northern Appalachia has historically had few, if any, distressed counties, with only 4 distressed counties in 1960 and no distressed counties in 2000. On the other hand, Southern Appalachia had fairly widespread conditions of economic distress in 1960, with 64 percent of its counties meeting the distress criteria at that time. This subregion, however, has witnessed dramatic improvement in its economic conditions since the 1960s, with only 13 percent of its counties qualifying as distressed in 2000. Indeed, in comparison to every other region in this analysis, Southern Appalachia has experienced the most remarkable improvement in distressed conditions over time. Contrasting this improvement is Central Appalachia, an area of persistent and relatively widespread economic distress. A total of 72 percent of the counties in Central Appalachia were distressed in 1960, and by 2000 this figure had only dropped to 46 percent. Over time, Central Appalachia has remained one of the most distressed areas of the U.S., in comparison to the rest of the nation, and in comparison to the rest of Appalachia as well.26
More generally, the pattern of distress in the Appalachian Region is in many ways reflective of the previously mentioned national trends: distress within the region hit its historic low in 1980; grew between 1980 and 1990; and then decreased between 1990 and 2000. Again, while such comments are speculative in nature, it is nonetheless true that the greatest improvement within the Appalachian Region occurred precisely at the time when the federal government was providing the most funding to the ARC. Since the 1980s, when appropriations to the ARC were dramatically reduced, Appalachia has stagnated, and for some areas distressed economic conditions have returned.27 Similar to Appalachia in the 1960s, at least in terms of having relatively high rates of economic distress, were the Mississippi Delta and the South regions. Like Appalachia, the South had more than half of its counties qualifying as distressed in 1960, while the Mississippi Delta Region had more than three-quarters of its counties qualifying as such at that time. In the other two historically distressed regions, particularly the U.S.-Mexico Border Region and the Southwest, problems of economic distress were not as bad in 1960 as they were in the Appalachian, South, and Delta Regions. In both the Border and Southwest regions, slightly more than a quarter of the counties were distressed at that time. In general, however, and as will 26 Note that for the sake of brevity, the remaining sections of Part IV do not assess trends regarding individual aspects of the distress measure in relation to Appalachian subregions. These issues, however, are again taken up in Part V of the report. 27 For example, a number of counties that had graduated from distress between 1960 and 1980 had fallen back into economic distress thereafter.
17

be discussed in more detail below, conditions of economic distress were far worse in the historically distressed regions of Appalachia, the South, the Delta, the Southwest, and the Border than they were in the historically non-distressed regions of the U.S., with any given non-distressed region typically having less than 10 counties qualifying as distressed in 1960. In short, in the historically distressed regions of the U.S., and especially in the Delta, Appalachia, and in the South, regional economic distress was far more substantial than it was in other parts of the country in 1960. Like Appalachia, most of the historically distressed regions have experienced relative improvement in distressed conditions over time. Aside from the Southern Appalachian subregion, the region that has improved the most since the 1960s has been the South, with the number of distressed counties dropping from 59 percent in 1960 to 16 percent in 2000. Furthermore, the improvement in the South has been steady over time, with the total number of distressed counties in the region dropping between every ten-year period beginning in 1960. The Delta has also experienced relatively dramatic improvement over time, especially considering the large percentage of distressed counties in the region in 1960. However, and in some ways similar to Central Appalachia, close to 40 percent of the counties in the Delta Region remained distressed in 2000. In some respects, the Southwest has perhaps experienced the greatest improvement in economic conditions over time, especially in that the percentage of distressed counties in the region had dropped to below 10 percent by 2000. Such rates of distress are more closely associated, at this time, with levels of distress in some of the historically non-distressed regions than they are with some of the historically distressed regions of the U.S. In contrast to the Southwest, as well as to all of the other historically distressed regions, is the U.S.-Mexico Border Region. The Border Region has actually witnessed a growth in the number of distressed counties between 1960 and 2000, from 28 percent of the counties in the region being distressed in 1960 to 43 percent in 2000. Though there were similar cyclical patterns found in the U.S.-Mexico Border Region as found in many other areas of the country – with the number of distressed counties reaching a low in the region in 1980 – the Border Region’s growth in the number of distressed counties after the 1980s has been somewhat dramatic, almost doubling since that time. In short, the Border Region stands out as the one historically distressed region that has seen economic conditions grow notably worse over time. The historically non-distressed regions of the U.S. had exceptionally low rates of distress in the 1960s. In all but the Plains Region, less than 3 percent of the counties were distressed in each of the historically non-distressed regions in 1960, with New England, the West, and the Mid-Atlantic Region each having only 1 distressed county in 1960. The Plains Region, which of all the historically non-distressed regions had the highest percentage of counties meeting the distress criteria in 1960, saw the number of its distressed counties drop from 8 percent to 2 percent between 1960 and 2000. Meanwhile, the Great Lakes, New England, and Mid-Atlantic regions saw the number of their distressed counties remain exceptionally low and stable between 1960 and 2000, and in these three areas combined only 5 counties in total qualified as distressed in 2000.
18

Table 2: Total Number of Distressed Counties by Year (Percent Total in Parentheses)
Region
Total Counties
Distressed 1960
Distressed 1970
Distressed 1980
Distressed 1990
Distressed 2000
Appalachia
410
223 (54.4)
169 (41.2)
75 (18.3)
121 (29.5)
89 (21.7)
Mississippi Delta
213
162 (76.1)
142 (66.7)
69 (32.4)
118 (55.4)
83 (39.0)
South
548
326 (59.5)
239 (43.6)
108 (19.7)
106 (19.3)
87 (15.9)
Southwest
292
87 (29.8)
83 (28.4)
23 (7.9)
56 (19.2)
26 (8.9)
U.S.-Mexico Border
92
26 (28.3)
31 (33.7)
22 (23.9)
43 (46.7)
40 (43.5)
Great Lakes
391
7 (1.8)
8 (2.1)
3 (0.8)
6 (1.5)
1 (0.3)
Mid-Atlantic
109
1 (0.9)
1 (0.9)
0 (0)
1 (0.9)
3 (2.8)
New England
67
1 (1.5)
1 (1.5)
2 (3.0)
0 (0)
1 (1.5)
Plains
589
50 (8.5)
36 (6.1)
21 (3.6)
22 (3.7)
14 (2.4)
Rocky Mountains
215
6 (2.8)
8 (3.7)
7 (3.3)
16 (7.4)
15 (7.0)
West
143
1 (0.7)
0 (0)
0 (0)
3 (2.1)
14 (9.8)
Total
3069
890 (29.0)
718 (23.4)
330 (10.8)
492 (16.0)
373 (12.2)
Non-Appalachia
U.S.
2659
667 (25.1)
549 (20.7)
255 (9.6)
371 (14.0)
284 (10.7)
(See maps appearing on the next three pages).
19

Distressed Counties in the U.S. 1960
Met Distress Criteria in 1960 Distressed Counties in the U.S. 1970
Met Distress Criteria in 1970
20

Distressed Counties in the U.S. 1980
Met Distress Criteria in 1980 Distressed Counties in the U.S. 1990
Met Distress Criteria in 1990
21

Distressed Counties in the U.S. 2000
Met Distress Criteria in 2000 Distressed Counties in the U.S. in both 1960 and 2000
Met Distress Criteria in 1960 as well as in 2000
22

By contrast, the Rocky Mountain Region and especially the West both saw considerable growth in the number of distressed counties between 1960 and 2000. While the total number of distressed counties in the Rocky Mountain Region was only 3 percent in 1960, this figure had grown to 7 percent by 1990 and remained at 7 percent in 2000. Meanwhile, the increase in number of distressed counties was especially dramatic in the West. While only one county in the West met the distressed standard in 1960, 14 counties in the region met the distress criteria in 2000, with this increase occurring primarily between 1990 and 2000. In general, between 1960 and 2000 some notable changes took place in regional patterns of distress throughout the U.S. The Great Lakes, Mid-Atlantic, and New England regions remained areas of relative economic strength during the second half of the 20th century, while other parts of the country, including the Southwest, the Delta, Appalachia, and the South, witnessed fairly dramatic improvements according to the ARC’s measure of distress. Meanwhile, the West, the Rocky Mountain Region, and especially the U.S.-Mexico Border Region, all experienced significant growth in the number of distressed counties between 1960 and 2000. On the other hand, in spite of there having been dramatic improvements in areas such as the Mississippi Delta and Appalachian regions, a relatively large number of distressed counties remain in each of these regions. The rate of distress in Appalachia, for example, was more than twice that of the non-Appalachian U.S. in 2000, while the rate of distress in Central Appalachia alone is currently approximately four times the national rate. Meanwhile, the rate of distress in the Delta Region was more than three times the U.S. average in 2000. As previously suggested, the pattern of distress for many counties in the historically distressed regions has been one of persistence. Meanwhile, some areas of the country have seen a somewhat steady encroachment of economic distress since the 1960s, including the U.S.-Mexico Border Region and, more recently, parts of the West and the Rocky Mountain regions. In these regions of the country, rather than there being a process of persistence in relation to economic distress, there has been entrance. Whether newfound distress in the West and the Rocky Mountain states will be persistent is not yet known. For the U.S.-Mexico Border Region, however, economic conditions have clearly been growing decisively worse over time. As will be further specified below, however, perceptions of increasing and decreasing distress can be different when considering the individual indicators that comprise the ARC’s distress measure. The individual indicators do not tell a particularly heartening story. Individual Distress Indicators: Per Capita Market Income In terms of the PCMI indicator alone, a considerably different picture emerges in terms of national and regional economic conditions and trends. At the national level, while there was a clear pattern of income convergence amongst counties between 1960 and 1980, there was a complete reversal in this trend between 1980 and 1990, with this trend continuing between 1990 and 2000. In general, the PCMI indicator suggests that while there was notable income convergence amongst counties between 1960 and 1980, this pattern reversed itself thereafter. Unlike the distress indicator more generally, which demonstrated a growth in the number of distressed counties between 1980 and 1990, and then a decline in the number of counties meeting the distress criteria thereafter, the PCMI indicator demonstrates continued growth in the number of counties meeting this individual distress indicator throughout the 1980 to 2000 period. Moreover, and in stark contrast to the distress indicator, which identified the number of
23

distressed counties in the U.S. as a whole as having dropped from 29 percent in 1960 to 12 percent in 2000, the percentage of counties meeting the PCMI criterion was virtually the same in 2000 as it was in 1960, with 44 percent of all counties meeting this criterion in 1960 and 42 percent of all counties meeting the PCMI criterion in 2000. In terms of individual regions, the PCMI indicator provides a somewhat different impression than does the distress criteria in relation to changing economic conditions. The historically distressed regions exhibit a general lack of improvement over time. For example, while the U.S.-Mexico Border Region has seen significant setbacks over time in terms of the distress criteria alone, these setbacks are even more severe when viewed in terms of the PCMI indicator. While 40 percent of the counties in the Border Region met the PCMI criterion for distress in 1960, this already large number grew to a substantial 77 percent of all counties in the region meeting the criterion in 2000. Similarly, approximately three-quarters of the counties in the Delta Region would have qualified as distressed according to the PCMI indicator alone in 2000. Thus, while the distress measure as a whole suggested significant improvement in the economic conditions of the Delta Region over time, the PCMI indicator alone suggests somewhat less improvement, with a relatively small drop in the number of counties in the region meeting the PCMI criterion when comparing 2000 with 1960. Similarly, the Appalachian Region demonstrated only marginal improvement in terms of the PCMI indicator between 1960 and 2000. Amongst all the historically distressed regions the greatest improvement in relation to the PCMI indicator came in the South, where close to three-quarters of the counties in the region met the PCMI criterion in 1960, but slightly less than half met the criterion in 2000. The Southwest, which was the other historically distressed region that improved over time, did not experience similar progress in relation to the PMCI measure. While the region demonstrated improvement in the number of distressed counties between 1960 and 2000, a greater number of counties qualified as distressed according to the PCMI indicator in 2000 than in 1960. It may be reasonable to speculate that relatively strong economic performance in the region more generally, but poor performance in terms of the PCMI indicator, is reflective of a significant amount of transfer payments going into the region, especially to retirees. Such transfer payments are not reflected in the PCMI measure. In any event, while there has clearly been improvement in the Southwest in terms of the distress indicator more generally, the poor performance of the region over time in terms of the PCMI indicator may suggest that the economy of the region is somewhat tenuous and is in a large part reliant upon government transfer payments. To summarize patterns in relation to the PCMI indicator in the historically distressed regions, progress in these regions seems less impressive when measured through the PCMI indicator alone. While regions such as the Mississippi Delta and Appalachia have nonetheless improved over the course of time according to this indicator, this improvement has been minor. Moreover, while the distress indicator suggested improvement in the Southwest Region over time, the PCMI indicator offers an opposite impression. Finally, while the distress indicator depicted deteriorating economic conditions in the U.S.-Mexico Border Region over time, the PCMI indicator clearly demonstrates that income conditions in the region have become especially more disparate since the 1960s.
24

Table 3: Counties Meeting ARC PCMI Indicator (Percent Total in Parentheses)
Region
Total Counties
Low PCMI 1960
Low PCMI 1970
Low PCMI 1980
Low PCMI 1990
Low PCMI 2000
Appalachia
410
269 (65.6)
233 (56.8)
191 (46.6)
223 (54.4)
242 (59.0)
Mississippi Delta
213
181 (85.0)
166 (77.9)
120 (56.3)
162 (76.1)
157 (73.7)
South
548
401 (73.2)
292 (53.3)
246 (44.9)
255 (46.5)
267 (48.7)
Southwest
292
126 (43.2)
118 (40.4)
59 (20.2)
136 (46.6)
153 (52.4)
U.S.-Mexico Border
92
29 (31.5)
36 (39.1)
28 (30.4)
61 (66.3)
71 (77.2)
Great Lakes
391
43 (11.0)
40 (10.2)
38 (9.7)
69 (17.6)
82 (21.0)
Mid-Atlantic
109
1 (0.9)
3 (2.8)
7 (6.4)
4 (3.7)
11 (10.1)
New England
67
5 (7.5)
3 (4.5)
6 (9.0)
3 (4.5)
9 (13.4)
Plains
589
250 (42.4)
104 (17.7)
60 (10.2)
155 (26.3)
172 (29.2)
Rocky Mountains
215
33 (15.3)
41 (19.1)
41 (19.1)
83 (38.6)
90 (41.9)
West
143
1 (0.7)
0 (0)
2 (1.4)
17 (11.9)
45 (31.5)
Total
3069
1339 (43.6)
1036 (33.8)
798 (26.0)
1168 (38.1)
1299 (42.3)
Non-Appalachia
U.S.
2659
1070 (40.2)
803 (30.2)
607 (22.8)
945 (35.5)
1057 (39.8)
Similar to the Border Region, in the historically non-distressed regions some perhaps disturbing trends start to emerge when assessing the PCMI indicator over time. Aside from the Plains Region, the other five historically non-distressed regions demonstrated poorer performance in terms of the PCMI indictor in 2000 than in 1960, with the West and Rocky Mountain regions both performing particularly poorly. While less than 1 percent of the counties in the West met the distress criterion for PCMI in 1960, close to one-third of the counties in the region met this criterion in 2000. In the Rocky Mountain Region, the percentage of counties meeting the PCMI criterion grew from only 15 percent in 1960 to more than 40 percent in 2000. Furthermore, the regions that demonstrated ostensibly strong and stable economic conditions over time according to the distress indicator, including the Great Lakes, New England, and Mid-Atlantic Regions, all experienced setbacks in terms of the PCMI indicator. For example, the Great Lakes Region saw the number of counties meeting the PCMI criterion approximately double between 1960 and 2000, from 43 counties meeting the criterion in 1960 to 82 counties in 2000.
25

In general, while the distress indicator demonstrated economic improvement nationally as well as throughout most regions of the U.S. between 1960 and 2000, the PCMI indicator tells a much different story: one of growing income disparity throughout much of the U.S. over time. Of the 11 regions studied in this analysis, 7 witnessed an increase in the number of counties meeting the PCMI criterion when comparing 2000 to 1960. And unlike the distress criteria more generally, which saw a drop in the total number of distressed counties in 1980, and then a surge in 1990, only to see a drop again in 2000, the pattern for the PCMI indicator has been a bit different. The majority of regions experienced their best performance according to the PCMI indicator in 1980; however, this performance worsened not only in 1990, but continued to worsen between 1990 and 2000. Thus, while the distress indicator depicted improving economic conditions between 1990 and 2000, the PCMI indicator suggests steady growth in income disparity over the past two decades, to the point where county-level income disparity in the U.S. in 2000 mirrors the unequal conditions of 1960. It is worth remembering that all indicators utilized in this analysis, including the distress indicator as well as the individual indicators that make up the distress indicator, are relative measures. The growing number of counties meeting the PCMI indicator provides evidence of a growing trend in county-level income disparity within many regions of the U.S. as well as throughout the U.S. in general, and more than half of all counties in regions such as Appalachia, the Mississippi Delta, the Southwest, and the U.S.-Mexico Border Region have levels of PCMI that are far below national averages. Individual Distress Indicators: Unemployment As is the case with the PCMI indicator, the unemployment indicator gives a somewhat different impression of economic conditions in many regions of the U.S. than does the distress indicator. Virtually all of the regions in the U.S., whether historically distressed or non-distressed, either had the same percentage of counties or a relatively greater percentage of counties meeting the unemployment indicator in 2000 when compared to 1960. At the national level the number of counties that met this criterion in 2000 had increased by close to 75 percent when compared to 1960. It is of note that in 2000 the unemployment rate was only slightly lower than it was in 1960: 4.6 percent in 2000 compared to 5.1 percent in 1960. In short, the unemployment indictor suggests a trend of a growing disparity in employment opportunities within regions as well as across the U.S. over time, where in the 1960s, 1970s, and 1980s a relatively few counties met this criterion when compared to the 1990s and 2000. Since the 1980s, employment conditions within all but 2 of the 11 regions studied in this analysis have grown more disparate according to the unemployment component of the distress measure. In many regions, this growing disparity has been quite profound. For example, in the Delta Region the number of counties meeting the unemployment criterion tripled between 1980 and 2000. The U.S.-Mexico Border Region saw the number of counties meeting the unemployment criterion grow from 9 percent to 46 percent between 1960 and 2000, while the Southwest saw its number of counties meeting the unemployment criterion grow from 5 percent to 17 percent during that time period. In the South, the number of counties meeting this criterion grew from 7 percent to 24 percent when comparing 1960 to 2000. Patterns in regions such as the South and Southwest completely contradict the patterns evident in the distress indicator more generally.
26

On the other hand, Appalachia has seemingly fared better than the other historically distressed regions since 1960. Nonetheless, the Appalachian Region saw the number of counties within the region meeting the unemployment criterion grow from 31 percent in 1960 to 36 percent in 2000, and median county-level rates of unemployment in Appalachia were virtually the same in 2000 as they were in 1960. In terms of the historically non-distressed regions, three regions, including New England, the Great Lakes Region, and the Plains Region, remained fairly stable in terms of the number of counties meeting the unemployment criterion when comparing 2000 to 1960. By contrast, the Mid-Atlantic Region saw the number of counties meeting this criterion grow from 12 percent in 1960 to 18 percent in 2000; the Rocky Mountain region experienced a growth from 15 to 21 percent in this regard; and the West experienced by far the largest growth in the number of Table 4: Counties Meeting ARC Unemployment Indicator (Percent Total in Parentheses)
Region
Total Counties
High Unem. 1960
High Unem. 1970
High Unem. 1980
High Unem. 1990
High Unem. 2000
Appalachia
410
129 (31.5)
87 (21.2)
51 (12.4)
155 (37.8)
146 (35.6)
Mississippi
Delta
213
41 (19.2)
78 (36.6)
35 (16.4)
136 (63.8)
105 (49.3)
South
548
40 (7.3)
29 (5.3)
18 (3.3)
106 (19.3)
132 (24.1)
Southwest
292
16 (5.5)
16 (5.5)
10 (3.4)
55 (18.8)
51 (17.5)
U.S.-Mexico Border
92
8 (8.7)
9 (9.8)
18 (19.6)
37 (40.2)
42 (45.7)
Great Lakes
391
49 (12.5)
75 (19.2)
48 (12.3)
88 (22.5)
42 (10.7)
Mid-Atlantic
109
13 (11.9)
7 (6.4)
23 (21.1)
7 (6.4)
20 (18.3)
New England
67
7 (10.4)
2 (3.0)
6 (9.0)
1 (1.5)
6 (9.0)
Plains
589
29 (4.9)
31 (5.3)
6 (1.0)
25 (4.2)
24 (4.1)
Rocky Mountains
215
33 (15.3)
41 (19.1)
18 (8.4)
44 (20.5)
45 (20.9)
West
143
43 (30.1)
97 (67.8)
46 (32.2)
57 (39.9)
77 (53.8)
Total
3069
408 (13.3)
472 (15.4)
279 (9.1)
711 (23.2)
690 (22.5)
Non-Appalachia
U.S.
2659
279 (10.5)
385 (14.5)
228 (8.6)
556 (20.9)
544 (20.5)
27

counties meeting the unemployment criterion, with 54 percent of the counties meeting the unemployment criterion in 2000 compared to only 30 percent in 1960. In short, while unemployment rates at the national level were largely similar in 2000 when compared to 1960, the growth in the number of counties over time meeting the ARC’s unemployment indicator implies a pattern of increasingly disparate employment opportunities intraregionally as well as nationally. Individual Distress Indicators: Poverty As previously suggested, the ARC’s poverty indicator is the one indicator that all counties must meet to qualify as distressed.28 Perhaps not surprisingly, then, in all years assessed in this analysis, the distress measure is most highly correlated with at least one, and often both, of its component poverty measures.29 Thus, in many ways the poverty measures incorporated within the distress measure are driving the distress measure itself, having the greatest effect upon determining whether counties qualify as distressed or not. As rates of poverty have more generally converged amongst counties at the national level since the 1960s, so too has the number of distressed counties declined over time according to the distress indicator. Trends in poverty levels and distress rates largely mirror one another. To be sure, for the Appalachian, Delta, Border, Southwest, and South regions, the pattern of growth and decline in distressed counties as well as in counties that met the poverty criteria mirror one another in virtually exactly the same manner. In the Mid-Atlantic, New England, and Great Lakes regions, there is somewhat less of a pattern of these trends emulating one another, though there have been so few counties qualifying as distressed in these regions over time that making any broad statements related to these trends is meaningless. In the historically non-distressed regions that have experienced the most significant change in economic patterns over time, at least according to the distress indicator, the patterns of change in terms of counties meeting the poverty indicator as well as the distress indicator mirror one another as well.30 Thus, rather than elaborating on the more general national and regional trends in relation to counties meeting the distress measure’s poverty criteria, only a few salient issues will be noted in this regard. First, the individual poverty indicator in relation to poverty rates of more than twice the national average provides an important benchmark for identifying exceptionally impoverished conditions, especially considering, for example, that counties with more than twice the national average for poverty in 2000 had, at a minimum, a quarter of their populations living in poverty. Approximately 7 percent of all counties in the U.S. were above the 200 percent poverty threshold in 2000. Aside from the U.S.-Mexico Border Region, all of the
28 In terms of county-level poverty rates being twice the national average (as opposed to one and a half times the national average). If poverty rates are twice the national average in a county, then it only needs to meet either the PCMI or the unemployment criteria to be considered distressed. 29 As previously mentioned, the ARC essentially has two poverty thresholds: 150 percent of the U.S. average and 200 percent of the U.S. average. In all years the distress indicator as a whole was most highly correlated with at least one of these individual poverty measures. In 1980, 1990, and 2000, the distress measure was correlated with both of the poverty thresholds to a greater extent than it was with either the PCMI or unemployment measures. The correlation between the poverty variable and the distress variable more generally suggests that the poverty variable is the largest contributor to determining distress. 30 This includes the Plains, West, and Rocky Mountain regions.
28

Table 5: Counties Meeting 150 Percent National Average for Poverty Indicator (Percent Total in Parentheses)
Region
Total Counties
150% Poverty
1960
150% Poverty
1970
150% Poverty
1980
150% Poverty
1990
150% Poverty
2000
Appalachia
410
289 (70.5)
237 (57.8)
146 (35.6)
154 (37.6)
114 (27.8) Mississippi
Delta
213
194 (91.1)
187 (87.8)
142 (66.7)
152 (71.4)
118 (55.4)
South
548
458 (83.6)
393 (71.7)
264 (48.2)
218 (39.8)
175 (31.9)
Southwest
292
183 (62.7)
196 (67.1)
103 (35.3)
146 (50.0)
79 (27.1) U.S.-Mexico
Border
92
55 (59.8)
62 (67.4)
43 (46.7)
63 (68.5)
52 (56.5)
Great Lakes
391
18 (4.6)
15 (3.8)
4 (1.0)
13 (3.3)
4 (1.0) Mid-
Atlantic
109
7 (6.4)
3 (2.8)
5 (4.6)
5 (4.6)
7 (6.4) New
England
67
3 (4.5)
1 (1.5)
3 (4.5)
0 (0)
2 (3.0)
Plains
589
190 (32.3)
153 (26.0)
105 (17.8)
75 (12.7)
38 (6.5) Rocky
Mountains
215
23 (10.7)
30 (14.0)
30 (14.0)
33 (15.3)
30 (14.0)
West
143
1 (0.7)
4 (2.8)
3 (2.1)
11 (7.7)
20 (14.0)
Total
3069
1421 (46.3)
1281 (41.7)
848 (27.6)
870 (28.3)
639 (20.8) Non-
Appalachia U.S.
2659
1132 (42.6)
1044 (39.3)
702 (26.4)
716 (26.9)
525 (19.7)
historically distressed regions have witnessed an especially large drop in the number of counties meeting this criterion between 1960 and 2000. However, the Mississippi Delta, Appalachian, and South regions all had an exceptionally large number of counties with poverty rates of more than twice the national average in 2000, with 51, 46, and 41 counties meeting this criterion in these regions respectively in that year. By this measure alone, these three regions, along with the U.S.-Mexico Border Region, clearly have a significant number of people living in impoverished conditions. Furthermore, perhaps one of the more telling statistics in relation to national poverty trends more generally relates to absolute numbers rather than percentages of people living in poverty. Considering percentages alone one would think that the number of people living in poverty has declined dramatically in the U.S. since 1960. For example, in 1960, 22 percent of the American
29

Table 6: Counties Meeting 200 Percent National Average for Poverty Indicator (Percent Total in Parentheses)
Region
Total Counties
200% Poverty
1960
200% Poverty
1970
200% Poverty
1980
200% Poverty
1990
200% Poverty
2000
Appalachia
410
197 (48.0)
153 (37.3)
66 (16.1)
72 (17.6)
46 (11.2) Mississippi
Delta
213
155 (72.8)
139 (65.3)
79 (37.1)
83 (39.0)
51 (23.9)
South
548
324 (59.1)
264 (48.2)
109 (19.9)
76 (13.9)
41 (7.5)
Southwest
292
87 (29.8)
101 (34.6)
34 (11.6)
50 (17.1)
9 (3.1) U.S.-Mexico
Border
92
30 (32.6)
42 (45.7)
24 (26.1)
39 (42.4)
27 (29.3)
Great Lakes
391
0 (0)
0 (0)
0 (0)
1 (0.3)
0 (0) Mid-
Atlantic
109
1 (0.9)
1 (0.9)
1 (0.9)
1 (0.9)
2 (1.8) New
England
67
0 (0)
0 (0)
0 (0)
0 (0)
0 (0)
Plains
589
40 (6.8)
36 (6.1)
30 (5.1)
17 (2.9)
15 (2.5) Rocky
Mountains
215
4 (1.9)
8 (3.7)
9 (4.2)
11 (5.1)
8 (3.7)
West
143
0 (0)
0 (0)
0 (0)
0 (0)
1 (0.7)
Total
3069
838 (27.3)
744 (24.2)
352 (11.5)
350 (11.4)
200 (6.5) Non-
Appalachia U.S.
2659
641 (24.1)
591 (22.2)
638 (24.0)
628 (23.6)
354 (13.3)
population was living in poverty, compared to only 12 percent in 2000. Measured in terms of absolute numbers, however, 38.5 million people were living in poverty in the U.S. in 1960, compared to 33.7 million in 2000, a drop that seems far less significant. Thus, the total number of people living in poverty in the U.S. at this time is still largely similar to what it was in 1960. Moreover, approximately 15 million of the people currently living in poverty are either children or elderly – members of American society who are typically not in, or at least arguably should not be in, the workforce, and have little opportunity to help themselves financially.31
31 According to the 2000 U.S. census, 14,958,036 people either below 18 or 65 and older were living in poverty in 2000. 11,684,275 children below 18 years of age were living in poverty.
30

Even absolute numbers of people living in poverty may not be particularly telling. A range of contemporary literatures suggests that the poverty measure as developed and utilized by the federal government has become largely anachronistic. Created for the Social Security Administration in the mid-1960s, and having changed very little over time, some scholars argue that the poverty measure no longer offers a realistic indication of levels of economic and social accessibility for the relatively poor members of American society. It has been similarly claimed that current poverty measures largely under represent the number of people truly living in impoverished conditions in the U.S.32 In sum, while it may be difficult to argue that much of America has not prospered economically during the second half of the 20th century, whether using the distress measure or its individual indicators of poverty, unemployment, and income, it is clear that many localities and regions in the U.S. have not entirely shared in this prosperity. Furthermore, an examination of the distress measure’s individual indicators reveals that many areas of the U.S. – far more than the distress measure would otherwise reveal – are experiencing relatively poor economic conditions, even worse than they were experiencing in the 1960s. On the other hand, the distress measure as utilized in this analysis is seemingly useful in that it identifies the areas and regions in the U.S. that have the most profound economic problems. Indeed, if a given county is, in fact, meeting all of the ARC’s criteria for measuring distress, it should perhaps take little persuasion for one to believe that the county is confronting a wide range of economic problems. In many instances, these problems are indicative of broader regional trends of economic distress. The next section of this report will more thoroughly examine what is behind this distress.
32 For a discussion of these issues see Ruggles (1990), Schiller (1995), and a range of other literatures related to poverty and poverty measures.
31

Part V: Socioeconomic Characteristics of Distress Nationally and Regionally This aspect of the analysis considers factors associated with distress and changing distress at the national level and within each of the individual regions as previously discussed. This section begins with a broad overview of socioeconomic factors related to economic distress for the entire U.S., followed by similar discussions in relation to individual regions. This segment of the report primarily utilizes maps of distress, descriptive statistics, and statistical modeling to assess distress on a national as well as a regional basis. Unless otherwise indicated, all information as discussed below is derived from the data (see Tables 7-27)33 and models included in Appendix C. The information as presented here is largely narrative in form so that the reader does not get bogged down in an excess of numbers and specific statistical observations. Nevertheless, the explanations included below are fully supported by the statistical examinations that have served as the basis for this research. Many of the issues discussed in this section, such as the relationships between race and economic distress for example, have been covered by a range of research and policy literature. To keep the following discussion consistent, direct and brief, this analysis does not draw upon these various literatures. The readers are encouraged to examine the various literatures to probe more deeply into such matters. Indeed, questions of race, education, economic structure, and other matters as they relate to economic distress are far more complex and nuanced than as described below. The following assessment primarily lets the numbers developed in this analysis to “speak for themselves,” providing a consistent comparisons across regions of factors associated with economic distress. On the other hand, this analysis depicts some very clear patterns associated with economic distress in the U.S. Thus, while this study is far from exhaustive assessment of regional and national factors of distress, it provides insight into patterns of distress, specifically in relation to the ARC’s distress measure. Before examining some of the details of economic distress at the national level, two issues are of particular note. First, fairly common trends relate to current and persistent distress in the U.S. as a whole. Patterns of race, education, occupational structure, and geographic location, and their relationships to economic distress, are fairly consistent throughout much of the U.S. Thus, economic distress throughout the entire nation is somewhat uniformly defined by some fairly common characteristics. For example, economic distress in counties in the U.S. at this time, and in counties that have remained persistently distressed over time, is typically associated with large minority populations, low rates of educational attainment, low employment in professional service based occupations, and issues of metropolitan location. In many respects, to generally understand economic distress in the U.S., at least at the county level, simply requires understanding these broad relationships. Secondly, and perhaps equally as important, while each of the individual regions as analyzed in this research share at least some characteristics in common in relation to economic distress, each region also exhibits
33 Note: For all of the data tables in Part V of the report (Tables 7-27), data for 1960 and 2000 are largely comparable, though there are almost invariably some definitional differences when comparing 1960 and 2000 figures. Also, “Percent Population White” is not included for 1960. For many regions, race-related data for 1960 and 2000 are not comparable, especially considering that 1960 census information does not distinctively capture populations identifying as Hispanic. The same is the case for “Percent Within or Proximate to Metro Area,” where comparable information is not available for 1960.
32

somewhat unique socioeconomic circumstances in terms of intraregional economic distress as well. Socioeconomic Factors Associated with Economic Distress in the U.S. As previously suggested, the distressed counties throughout the U.S. in 2000 exhibited some fairly common characteristics, with these characteristics being related to geographic, social, and economic circumstances.34 It is important to consider that these circumstances are in many ways fundamentally interrelated. Examining specific trends in particular, one finds that currently distressed counties, as well as those that have tended to be persistently distressed over time, typically have a high percentage of minority populations, such as a high percentage of Blacks, Native Americans, or Hispanics. Specifically, while in the non-distressed counties the median population identifying as being “White alone” according to the 2000 census was 92 percent, the median population identifying as such in distressed counties was only 68 percent. Race is strongly associated with economic distress in the U.S., suggesting relatively limited opportunities and underprivileged social and economic circumstances for many of the nation’s minorities.35 America’s currently distressed counties also tend to be highly rural, having smaller populations and lower levels of urbanization compared to non-distressed counties. Relatedly, distressed counties are less likely to be either within or proximate to metropolitan areas, meaning that residents in distressed counties are often not within commuting distance of the economic and social opportunities often found in such areas. Distressed counties also typically have low rates of educational attainment relative to the rest of the U.S. These low levels of educational attainment may in some ways be associated with migration patterns, with relatively high levels of outmigration of the young and educated being common in rural, economically distressed areas.36
Aside from these more general social and geographic characteristics, an important contributor to current distress relates to the economic structure of distressed counties. Many of the counties that are presently distressed and have remained distressed over time had economies that in the past were largely reliant upon natural resource based activities, such as agriculture, forestry, and mining. These types of activities served as the foundations of local economies in many rural areas of the U.S. in the past, though throughout the 20th Century employment in these sectors declined dramatically. The persistently distressed counties in the U.S. experienced a relatively precipitous drop in these sectors over time. For example, counties that were distressed in both 1960 and 2000 had 25 percent of their population employed in agriculture 34 In the logistic regression models in Appendix C that assessed distress in the U.S. in 2000, factors that had statistically significant relationships with current distress included high minority populations; low levels of educational attainment; low employment in manufacturing; low employment in agriculture; low employment in professional services; and metropolitan location, with counties that were neither within nor proximate to a metropolitan area more likely to be distressed. In terms of counties that remained distressed between 1960 and 2000 and counties that graduated from distress during that period of time, the same factors were associated with changing distress. However, in this model higher employment in mining was also statistically significant and was associated with a greater likelihood of counties remaining distressed over time. 35 In the logistic regression models for the entire nation, as well as for most regions, race was the strongest predictor of economic distress. 36 For information related to outmigration, see Galston and Baehler (1995).
33

and 5 percent employed in mining in 1960, compared to 4 percent and 2 percent working in each of these industries respectively in 2000.37 Data prior to 1960 would indicate even more dramatic decline in employment in natural resource based activities in rural areas of the U.S. over time.38 The decline in the natural resource based sectors is indicative of growing mechanization that occurred within these industries over time, a process that has resulted in capital increasingly replacing labor in industries such as mining and agriculture throughout much of the 20th century. In general, many rural areas and towns in the U.S. developed around agricultural, fishing, forestry, and mining employment. While employment in natural resource based industries remains a somewhat important part of the local economies in many distressed areas, employment has declined dramatically in these sectors throughout much of the 20th century. Counties that have never been distressed have generally experienced less dramatic change in relation to employment in these sectors, at least since the 1960s.39
Over the past few decades the American economy has generally transformed into being largely based upon service sector activities. For example, while in 1960 approximately 58 percent of the U.S. labor force was employed in service industries, by 2000 this number had expanded to 77 percent.40 The range of service based economic activities in the U.S. is vast. Broadly speaking, approximately 20 percent of the labor force is currently employed in professional service activities.41 More so than any other employment activity in the U.S., professional service occupations correlate with higher incomes. Thus, these occupations typically offer better earnings than not only non-professional service activities, but employment in other industries as well.42 A notable contrast in occupational characteristics between distressed and non-distressed counties at the national level is that the non-distressed counties have a higher percentage of their populations employed in professional service based activities. In non-distressed counties, employment in professional service activities in 2000, at about 20 percent, was slightly above the national average. By contrast, in 2000 the percent employed in
37 These figures are based upon summing employment characteristics across all counties at each given point in time. Median figures as found in tables 7-27 below are slightly different. Similar patterns are found when considering distress in 2000 rather than persistent distress over time. For example, in 1960 the counties that were distressed in 2000 had approximately 3.1 percent of their populations employed in mining; 13.8 percent employed in agriculture, and 21.1 percent employed in manufacturing. This compares to the non-distressed counties in 2000 having, in 1960, less than 1 percent of their population employed in mining, 6.5 percent employed in agriculture, and 28.8 percent employed in manufacturing. 38 For further information on the history of natural resource based activities in rural areas of the U.S., see Galston and Baehler (1995). 39 For example, in counties that were not distressed in 1960 nor in 2000, 6 percent of the population worked in agriculture in 1960 and only 1 percent worked in this sector in 2000. In 1960 as well as in 2000, less than 1 percent of the population worked in the mining sector in these counties. These rates are not medians, but are based upon summing the employment characteristics of non-distressed counties at given points in time. 40 These figures are based upon 1960 census and 2000 census employment by industry variables. These figures are sums related to employment by industry. 41 P50. SEX BY OCCUPATION FOR THE EMPLOYED CIVILIAN POPULATION 16 YEARS AND OVER: Employed civilian population 16 years and over, Census 2000 Summary File 3 (SF 3) - Sample Data. 42 Comparing county level employment by industry variables to PCMI in 2000 indicated that higher income and employment in professional services was highly correlated (significant at .001) with a correlation coefficient of .73. Employment in all other industries had a negative correlation with income, meaning that as employment in industries such as agriculture, mining, manufacturing, and non-professional services increased, county level per capita market income levels tended to be relatively lower. All correlations were significant at .001.
34

professional services in distressed counties was only 14 percent.43 Much of the remaining population in the U.S., in distressed as well as in non-distressed areas, is often employed in non-professional service activities, with almost two-thirds of the population in distressed areas being employed in this sector.44
Along with the growth in service based activities, as well as the decline in employment in natural resource based sectors, jobs have declined in manufacturing over time. While in 1960 manufacturing accounted for 28 percent of all employment in the U.S., by 2000 this number had dropped to 14 percent.45 Although median employment rates in manufacturing are similar in distressed and non-distressed counties, as will be indicated later in this report, in certain regions of the country relatively low employment in manufacturing is associated with distressed economic conditions. However, perhaps it is most important to note that manufacturing jobs do not necessarily appear to be a primary solution for reconciling conditions of economic distress. Median rates of employment in manufacturing actually grew in counties that remained persistently distressed over time, and fell in counties that emerged from distress between 1960 and 2000. Nonetheless, for some communities across the U.S., either maintaining or developing a manufacturing base has been associated with having relatively sound economic conditions. In general, however, employment in the U.S. over four decades has become largely bifurcated. The majority of Americans work in the service sector; yet within this sector there is a stark contrast of opportunity, between professional and non-professional service based activities. This bifurcation extends to issues of economic distress, with economically distressed counties having lower levels of employment in professional service activities when compared to non-distressed counties. In many respects the employment base in distressed counties, and even in many non-distressed counties, can typically be understood as being dependent upon non-professional service activities, with these jobs typically offering relatively low wages. A reflection of the more general patterns of employment in the U.S. between distressed and non-distressed counties, at this time as well as in the past, is the issue of limited economic diversity in distressed counties. While distressed counties often tend to have at least some employment in agriculture, forestry, or mining ─often a legacy of the past when these industries were much more important to their local economies─ the distressed counties now typically have only a very small percentage of their populations working in such industries. And while manufacturing may be important to the economic base of some distressed and non-distressed counties at this time, in rural areas of the U.S.─ the areas identified in this report as the ones most likely to be economically distressed ─ if there is any manufacturing at all in a
43 Based on summing total employment figures across distressed and non-distressed counties. Note that the median values demonstrate a similar pattern but somewhat less disparity than when summing for distress and non-distressed counties in the entire U.S. Professional service based jobs are especially congregated in metropolitan areas. Cities such as New York, Denver, San Francisco, and Washington, DC, typically have in the range of 30 to 40 percent of their populations employed in professional service activities. 44 Summing across all counties, 58 percent of the population in non-distressed counties is employed in non-professional services, compared to 62 percent in distressed counties. 45 Also based upon summing employment characteristics for the entire U.S. in each of the years noted.
35

Table 7: U.S. (Distressed and Non-Distressed Counties) Median Values for 1960 and 2000
Non-Distressed 1960
(N = 2,179)
Distressed 1960
(N = 890)
Non-Distressed 2000
(N = 2,696)
Distressed 2000
(N = 373) Percent in Poverty 25.2 54.7 12.2 25.1
Percent Unemployed 4.4 5.7 4.3 8.7 Per Capita Market Income $1,294 $755 $18,472 $12,541
Per Capita Income $1,496 $894 $22,529 $17,374 Total Population 21,338 14,440 27,160 16,395
Total Urban Population 7,700 2,675 9,554 4,433 Percent Urban Population 38.7 11.8 41.4 27.0 Percent Population White na na 92.4 68.0
Percent Dependent Population
47.3 50.0 40.0 41.1
Percent H.S. Graduates 39.6 22.3 80.2 65.4 Percent with “Some College” 13.7 8.4 43.4 30.4
Percent Employed in Agriculture
15.7 24.7 3.6 5.0
Percent Employed in Mining .3 .4 .2 .8 Percent Employed in
Manufacturing 17.1 18.6 15.0 14.3
Percent Employed in Professional Services
13.2 10.0 10.8 8.4
Percent Employed in Non-Prof. Services
36.3 34.2 57.0 59.0
Percent Within or Proximate to Metro Area
na na 70.4 55.2
Diversity Index .73 .57 .83 .70 given area there are typically only one or a few manufacturing plants.46 In general, without a well-diversified mix of economic activity, distressed rural communities are vulnerable to sudden economic change. For example, the closing of a manufacturing plant in a rural area, or the sudden loss of jobs in a natural resource based sector, can have a harsh impact upon a rural community, leading to sudden and severe unemployment and affecting issues of poverty, income, and social well-being more generally. Indeed, many communities in the U.S. can attribute economic distress to an abrupt loss of jobs in manufacturing or a natural resource based industry.47 In general, the economies of distressed areas tend to be less diversified than the economies of non-distressed areas, leaving the economies of distressed areas vulnerable to sudden economic change. In some respects, the growth of non-professional service jobs in distressed rural areas makes the economies of such areas more stable; at the same time, continued low wages in this sector will almost undoubtedly correlate with continued, relatively anemic economic conditions in such areas.
46 This is based upon the author’s own general understanding of manufacturing in rural areas of the U.S. For further information in this regard see Galston and Baehler (1995). 47 Based on the author’s familiarity with these issues. For further information in this regard see Galston and Baehler (1995).
36

Table 8: U.S. (Counties Remaining Distressed and Graduating from Distress between 1960 and 2000) Median Values
Distressed 1960 not 2000 (1960 rates)
(N = 590)
Distressed 1960 and 2000
(1960 rates) (N = 300)
Distressed 1960 not 2000 (2000 rates)
(N = 590)
Distressed 1960 and 2000
(2000 rates) (N = 300)
Percent in Poverty 51.9 61.5 16.2 25.4 Percent Unemployed 5.3 7.0 5.2 8.9
Per Capita Market Income $800 $679 $15,581 $12,362 Per Capita Income $940 $818 $19,914 $17,332
Total Population 13,853 15,680 20,082 15,660 Total Urban Population 0 3,273 3,956 3,969
Percent Urban Population 0 17.0 21.1 24.7 Percent Population White na na 84.0 65.0
Percent Dependent Population
49.0 52.1 39.5 40.6
Percent H.S. Graduates 23.1 21.0 70.8 64.7 Percent with “Some College” 8.5 8.3 34.2 29.7
Percent Employed in Agriculture
24.0 25.9 3.9 4.8
Percent Employed in Mining .4 .7 .3 .8 Percent Employed in
Manufacturing 20.4 15.1 18.9 18.0
Percent Employed in Professional Services
9.9 10.2 9.5 8.2
Percent Employed in Non-Prof. Services
34.0 34.2 55.5 57.9
Percent Within or Proximate to Metro Area
na na 73.3 55.5
Diversity Index .61 .48 .81 .73 In understanding and assessing patterns of economic distress at the national level, a few other issues are also of note. First, and as suggested in the previous section of the report, the pattern of distress over time has been one of persistence for many counties. A total of 80 percent of the counties that were distressed in 2000 had also been economically distressed in 1960. Secondly, counties that have managed to emerge from distress status over time had somewhat different, and in some cases relatively better, socioeconomic conditions in the 1960s when compared to counties that have remained distressed. For example, counties that graduated from distress between 1960 and 2000 had lower rates of poverty and unemployment, higher levels of income, and greater economic diversity in 1960 compared to counties that remained distressed between 1960 and 2000. Counties that graduated from distress also tended to have lower percentages of minorities in 1960 than did the counties that have remained distressed. In short, the counties that emerged from distress between 1960 and 2000, when compared to counties that have remained distressed over time, in many instances had socioeconomic conditions in the 1960s that favored emergence from distress. This trend is apparent nationally as well as regionally. The fact that counties that graduated from distress over time had what might be considered a
37

“head start” when compared to counties that have remained distressed can perhaps not be overstated. On the other hand, it is also important to understand that while a number of counties have emerged from distress over time, the socioeconomic circumstances in these counties, while comparing favorably with the counties that have remained persistently distressed, do not necessarily compare favorably with national averages. For example, rates of poverty, unemployment, income, economic diversity, and various other socioeconomic circumstances in counties that were once distressed, but have emerged from distress, are on average not as good as in counties that have never been distressed. In general, counties that have emerged from distressed status over time still exhibit socioeconomic characteristics that are not only unfavorable compared to much of the rest of the nation, but may also put them in a susceptible position as economic processes continue to evolve in the U.S. In short, despite improvements over the past few decades, many of the counties that emerged from distress remain exposed to potential economic problems and are precipitously close to meeting the ARC’s distress criteria. While this section has more generally identified fairly common patterns related to distress at the national level, as will be evident in the analysis of distress on a regional basis the ability to emerge from economic distress is not a “one size fits all” proposition. Although there are a number of trends that are apparent in relation to economic distress nationally, including issues of race, rurality, and employment opportunities, individual regions typically exhibit their own, unique combinations of socioeconomic circumstances relating to current and persistent economic distress. Thus, while it is important to not lose sight of some of the more general trends that affect issues of economic distress at the national level, it is also important to understand that patterns of distress within individual regions can be relatively distinct. All distressed counties in the U.S., as indicated by the ARC’s distress measure itself, are marked by high rates of poverty and unemployment as well as low incomes relative to the rest of the U.S. Other socioeconomic factors related to distress, however, are not always as consistent, and even regions that have historically had relatively strong economic conditions, such as the Plains and Mid-Atlantic Regions, can be far from alike in terms of various socioeconomic and geographic circumstances. In sum, macroeconomic change has occurred in the American economy over the past few decades, and distressed areas are seemingly unable to benefit from this change. Marked in many instances by a past of albeit uncertain resource based economic activities, distressed counties are seemingly not in an advantageous position to adapt to an economy that provides the greatest benefits to professionally service based employment. Issues of low urbanization, limited proximity to metropolitan areas, and low educational attainment rates are some of the issues that make distressed areas disadvantaged in this regard. In general, the counties that are currently distressed and have been consistently distressed over time are characterized by various geographic, social, and economic conditions. These characteristics can be understood as being largely interrelated and include issues of racial makeup, low rates of educational attainment, rurality, non-proximity to metropolitan areas, and economic structure. Certain characteristics clearly stand out in relation to patterns of distress across the U.S. as a whole, and these trends are unmistakable in terms of counties that have been distressed in the past and currently remain distressed.
38

At the same time, and as will be indicated in the following sections of this analysis, there are at least some regional differences in patterns of distress. Thus, while in many respects some common characteristics more generally define the geographic and socioeconomic characteristics of distress across the U.S., there are also at least some regional variations in these trends. The remaining part of this section notes socioeconomic and geographic differences as related to economic distress at regional levels in the U.S. It is believed that while it is important to understand current patterns of distress in the U.S. at a more general level – where broad issues such as race, rurality, and economic structure somewhat consistently affect all distressed counties – there are important regional variations that are essential to understanding distress in the U.S. as well. Appalachia Viewed as an entire region, the current and changing nature of distress in Appalachia is in many ways reflective of national patterns.48 Issues of educational attainment, race, occupational structure, and metropolitan proximity affect economic conditions in many Appalachian counties much as they do in counties throughout the rest of America. Importantly, however, while socioeconomic circumstances in Appalachia’s distressed and non-distressed counties in some ways mirror distress and non-distress at the national level, in other ways they do not. This difference is especially apparent when assessing distressed conditions in the Northern, Central, and Southern subregions of Appalachia itself. Each of these subregions has exhibited somewhat different characteristics in relation to patterns of distress over time. In short, to truly understand the changing nature of Appalachian distress requires considering economic and social patterns at the subregional level. To be sure, in many respects the pattern of distress over time in Appalachia has been a tale of three subregions: Northern Appalachia has consistently had a low number of distressed counties, with no counties qualifying as distressed in 2000; Central Appalachia has been an area of persistent distress, and amongst the three Appalachian subregions it had the largest number and percentage of counties qualifying as distressed in 2000; and Southern Appalachia has witnessed tremendous improvement in economic conditions over time. Varying circumstances related to distress within these subregions is perhaps best highlighted, quite simply, by the following: when viewed in comparison to all the historically distressed regions assessed in this analysis, Southern Appalachia has experienced the greatest improvement while Central Appalachia has experienced the least improvement in conditions of economic distress over time. Considered along with Northern Appalachia, an area that has consistently experienced relatively strong economic conditions compared to the other two Appalachian subregions as well as to other historically distressed regions of the U.S., Appalachia is best understood as three subregions when it comes to social and economic issues, and each of these subregions has a somewhat different story behind patterns of continuity and change related to economic distress. 48 In the logistic regression models in Appendix C that assessed distress in Appalachia in 2000, factors that had statistically significant relationships with current distress included high minority populations; low educational attainment; low employment in manufacturing; high employment in mining; low employment in professional services; and metropolitan location, with counties that were neither within nor proximate to a metropolitan area more likely to be distressed. In terms of counties that remained distressed between 1960 and 2000 and counties that graduated from distress during that period of time, the same factors were associated with changing distress.
39
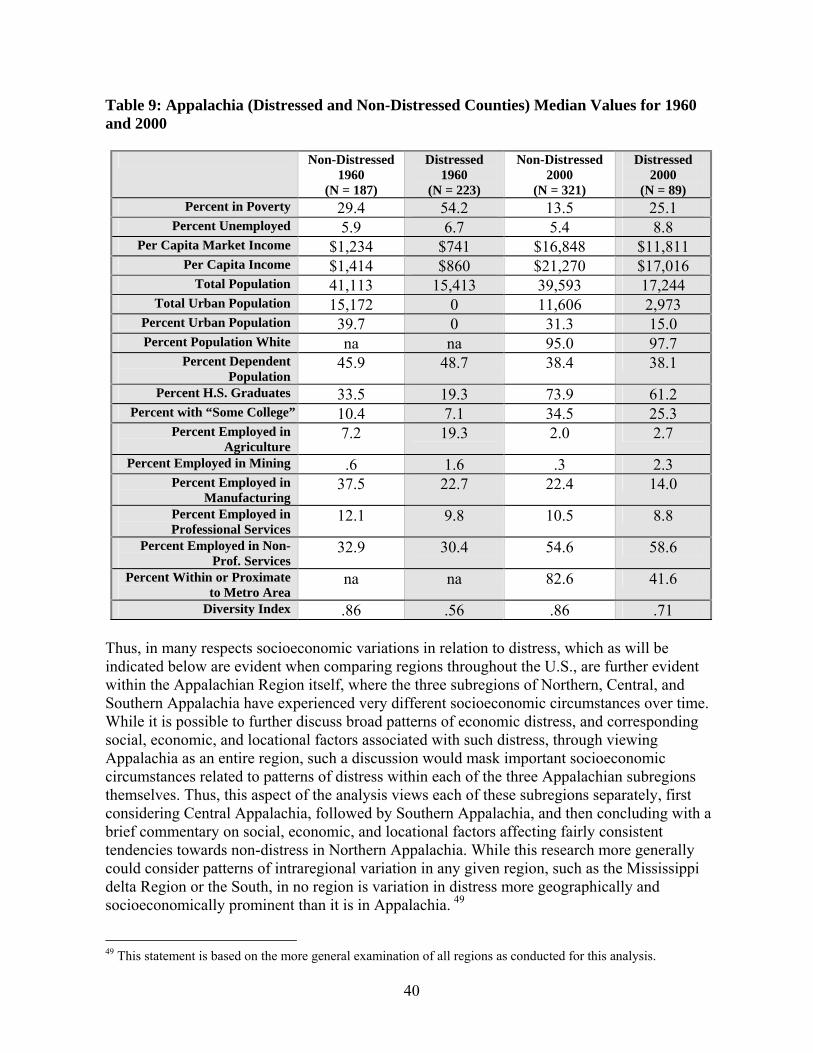
Table 9: Appalachia (Distressed and Non-Distressed Counties) Median Values for 1960 and 2000
Non-Distressed 1960
(N = 187)
Distressed 1960
(N = 223)
Non-Distressed 2000
(N = 321)
Distressed 2000
(N = 89) Percent in Poverty 29.4 54.2 13.5 25.1
Percent Unemployed 5.9 6.7 5.4 8.8 Per Capita Market Income $1,234 $741 $16,848 $11,811
Per Capita Income $1,414 $860 $21,270 $17,016 Total Population 41,113 15,413 39,593 17,244
Total Urban Population 15,172 0 11,606 2,973 Percent Urban Population 39.7 0 31.3 15.0 Percent Population White na na 95.0 97.7
Percent Dependent Population
45.9 48.7 38.4 38.1
Percent H.S. Graduates 33.5 19.3 73.9 61.2 Percent with “Some College” 10.4 7.1 34.5 25.3
Percent Employed in Agriculture
7.2 19.3 2.0 2.7
Percent Employed in Mining .6 1.6 .3 2.3 Percent Employed in
Manufacturing 37.5 22.7 22.4 14.0
Percent Employed in Professional Services
12.1 9.8 10.5 8.8
Percent Employed in Non-Prof. Services
32.9 30.4 54.6 58.6
Percent Within or Proximate to Metro Area
na na 82.6 41.6
Diversity Index .86 .56 .86 .71 Thus, in many respects socioeconomic variations in relation to distress, which as will be indicated below are evident when comparing regions throughout the U.S., are further evident within the Appalachian Region itself, where the three subregions of Northern, Central, and Southern Appalachia have experienced very different socioeconomic circumstances over time. While it is possible to further discuss broad patterns of economic distress, and corresponding social, economic, and locational factors associated with such distress, through viewing Appalachia as an entire region, such a discussion would mask important socioeconomic circumstances related to patterns of distress within each of the three Appalachian subregions themselves. Thus, this aspect of the analysis views each of these subregions separately, first considering Central Appalachia, followed by Southern Appalachia, and then concluding with a brief commentary on social, economic, and locational factors affecting fairly consistent tendencies towards non-distress in Northern Appalachia. While this research more generally could consider patterns of intraregional variation in any given region, such as the Mississippi delta Region or the South, in no region is variation in distress more geographically and socioeconomically prominent than it is in Appalachia. 49
49 This statement is based on the more general examination of all regions as conducted for this analysis.
40

Table 10: Appalachia (Counties Remaining Distressed and Graduating from Distress between 1960 and 2000) Median Values
Distressed 1960 not 2000 (1960 rates)
(N = 138)
Distressed 1960 and 2000
(1960 rates) (N = 85)
Distressed 1960 not 2000 (2000 rates)
(N = 138)
Distressed 1960 and 2000
(2000 rates) (N = 85)
Percent in Poverty 50.6 60.0 15.5 25.1 Percent Unemployed 6.1 8.7 5.8 8.8
Per Capita Market Income $787 $663 $14,953 $11,731 Per Capita Income $920 $803 $19,415 $16,677
Total Population 15,161 15,490 22,575 17,185 Total Urban Population 0 0 3,468 2,864
Percent Urban Population 0 0 16.6 12.0 Percent Population White na na 95.4 97.7
Percent Dependent Population
47.7 51.3 38.2 38.1
Percent H.S. Graduates 20.7 16.4 68.0 60.6 Percent with “Some College” 7.4 6.6 30.6 25.2
Percent Employed in Agriculture
20.1 17.2 2.8 2.9
Percent Employed in Mining .8 6.3 .4 2.3 Percent Employed in
Manufacturing 25.9 13.0 24.5 14.9
Percent Employed in Professional Services
9.4 11.5 9.2 8.8
Percent Employed in Non-Prof. Services
29.4 31.3 51.0 58.5
Percent Within or Proximate to Metro Area
na na 68.1 40.0
Diversity Index .62 .31 .79 .71 Central Appalachia Of all the regions in this analysis, Central Appalachia has been one of the poorest performers in relation to the ARC’s economic distress measure over time. Furthermore, and unlike all other regions in the U.S., current and persistent economic distress within the Central Appalachian Region has been associated with employment in the mining industry, particularly coal mining.50 In terms of the relationship between mining and distress in Central Appalachia, it is perhaps most useful to understand this relationship in the context of the changing nature of
50 See logistic regression models in Appendix C related to Central Appalachia. Central Appalachia is the only region where higher employment in mining was associated with current and persistent economic distress. In general, in the logistic regression models that assessed distress in Central Appalachia in 2000, factors that had statistically significant relationships with current distress included low educational attainment; low employment in manufacturing; high employment in mining; and low employment in professional services. In terms of Central Appalachian counties that remained distressed between 1960 and 2000 and counties that graduated from distress during that period of time, the same factors were associated with changing distress.
41

employment in the coal mining industry over time. In the past, many Central Appalachian communities were
42

Table 11: Central Appalachia (Distressed and Non-Distressed Counties) Median Values for 1960 and 2000
Non-Distressed
1960 (N = 40)
Distressed 1960
(N = 102)
Non-Distressed
2000 (N = 76)
Distressed 2000
(N = 66)
Percent in Poverty 30.7 47.4 15.4 25.8 Percent Unemployed 6.7 8.1 5.7 9.2
Per Capita Market Income $1,143 $833 $15,619 $11,240 Per Capita Income $1,348 $970 $20,060 $16,477
Total Population 28,161 19,546 28,798 17,000 Total Urban Population 10,323 2,663 8,467 2,931
Percent Urban Population 39.2 9.3 28.6 11.7 Percent Population White na na 96.5 97.9
Percent Dependent Population
45.7 48.8 38.2 37.9
Percent H.S. Graduates 31.1 21.7 73.6 60.3 Percent with “Some College” 11.0 7.4 32.1 25.1
Percent Employed in Agriculture
7.8 12.4 2.2 2.5
Percent Employed in Mining 1.2 3.8 .6 3.4 Percent Employed in
Manufacturing 31.4 16.7 19.9 11.9
Percent Employed in Professional Services
12.4 11.7 10.5 9.1
Percent Employed in Non-Prof. Services
35.3 34.0 56.8 61.4
Percent Within or Proximate to Metro Area
na na 76.3 36.4
Diversity Index .87 .53 .85 .68 largely dependent upon coal mining for income and employment. In some instances, employment in mining offered relatively high wages, though boom and bust cycles often affected the dependability of jobs within the industry. Employment in mining throughout much of Central Appalachia was often marked by uncertainty, as mines would open and close, or layoff large numbers of workers, in relation to national and global trends in energy costs and needs as well as in relation to increasing mechanization within the mining industry itself.51
Even in the past, then, mining dependent counties often experienced relatively high rates of poverty, unemployment, and low levels of income, typically in combination with other socioeconomic problems such as low levels of educational attainment. As employment in Central Appalachia’s mining sector has declined over time, with levels of employment in the mining industry being 10 percent in 1960 and declining to only 2 percent in 2000, many
51 Readers are referred to Wood and Bischak (2000) for more details about coal mining in Central Appalachia. A host of other literatures, and films as well, also address this issue.
43

Table 12: Central Appalachia (Counties Remaining Distressed and Graduating from Distress between 1960 and 2000) Median Values
Distressed 1960 not 2000 (1960 rates)
(N = 40)
Distressed 1960 and 2000
(1960 rates) (N = 62)
Distressed 1960 not 2000 (2000 rates)
(N = 40)
Distressed 1960 and 2000
(2000 rates) (N = 62)
Percent in Poverty 49.6 60.0 17.3 25.9 Percent Unemployed 8.2 10.6 6.0 9.4
Per Capita Market Income $813 $679 $14,447 $10,869 Per Capita Income $959 $824 $18,791 $16,348
Total Population 15,311 15,482 21,149 16,355 Total Urban Population 0 0 2,976 2,727
Percent Urban Population 0 0 17.7 10.2 Percent Population White na na 97.1 97.9
Percent Dependent Population
48.1 51.4 38.2 37.9
Percent H.S. Graduates 22.3 15.3 70.7 59.3 Percent with “Some College” 8.2 6.4 29.6 24.4
Percent Employed in Agriculture
22.0 12.4 3.2 2.6
Percent Employed in Mining 2.5 14.0 .8 3.8 Percent Employed in
Manufacturing 17.2 10.9 20.5 11.9
Percent Employed in Professional Services
11.0 12.3 9.6 9.0
Percent Employed in Non-Prof. Services
34.2 31.3 55.4 60.9
Percent Within or Proximate to Metro Area
na na 57.5 33.9
Diversity Index .55 .27 .80 .66 counties that were already typically experiencing relatively poor and tenuous economic circumstances in the past have been unable to successfully adapt to changing economic conditions.52 Furthermore, and aside from characteristics associated with employment in the mining industry in particular, Central Appalachian counties that have remained distressed over time have tended to have low levels of employment in key industries, such as in manufacturing and professional services. In 2000, distressed counties in the region had median levels of only 12 percent and 9 percent employed in manufacturing and professional services respectively, while in the non-distressed counties in Central Appalachia these rates were 20 percent and 11 percent respectively. In short, low levels of employment in manufacturing and professional services, along with a somewhat continued dependency on the relatively few coal mining jobs in the region, have been associated with Central Appalachian counties remaining distressed. The counties that have emerged from distress in the region have consistently had fewer jobs in mining and a greater number of jobs in manufacturing when compared to the counties that have remained 52 Based on calculations that summed total employed in mining in Central Appalachia in 1960 and 2000.
44

persistently distressed. When compared to other regions of the U.S., the trend of high employment in manufacturing in non-distressed counties relative to distressed counties is somewhat unique to Central Appalachia. More generally, and reflective of economic distress at the national level, distressed Central Appalachian counties have limited economic diversity, and non-professional service based activity accounts for the majority of jobs in the region. Clear geographic and population differences relate to economic distress within Central Appalachia as well. In general, economic distress in Central Appalachia is in a geographically contiguous area within the subregion, an area that is highly rural and not proximate to metropolitan areas. Only 37 percent of the distressed counties in the region are either within or proximate to a metropolitan area. This compares to approximately 76 percent of the non-distressed counties in the region that are either within or proximate to such areas. Furthermore, the median level of urbanization in non-distressed Central Appalachian counties is 29 percent, compared to 12 percent in the region’s distressed counties. With low levels of urbanization being commonly associated with economic distress throughout much of the nation, it is worth noting that Central Appalachia has the lowest levels of urbanization in the entire U.S.53
While Central Appalachia’s distressed counties exhibit some patterns in relation to distress that are fairly common to regional distress throughout much of the U.S., along with mining a factor that makes Central Appalachia relatively unique in terms of patterns of distress relates to race, which is not associated with economic distress in the region. Thus, and as will be discussed in more detail below, in contrast to virtually every other historically distressed region in the U.S., and in contrast to some of the historically non-distressed regions as well, race is not linked with economic distress in Central Appalachia. This characteristic, however, is largely reflective of the region having a population that is almost exclusively White. In general, Central Appalachia is plagued by a number of socioeconomic problems. The region has some of the lowest levels of educational attainment in the U.S.54 Furthermore, in 2000 the region had the highest levels of poverty, the highest levels of unemployment, and the lowest PCMI of all regions in the U.S.55 While issues of poverty, income, educational attainment, and limited economic diversity are patterns associated with economic distress in Central Appalachia as well as throughout much of the rest of the U.S., the region is somewhat unique in terms of its largely homogeneous racial make-up. The association in Central Appalachia between distress and mining, as well as patterns in manufacturing employment, also somewhat uniquely define economic distress in Central Appalachia when compared to other regions of the U.S. Long-standing distress in Central Appalachia’s mining communities is worth scrutinizing, 53 This figure is based upon the median percent urban populations in each of the regions in the U.S. In Central Appalachia the county-level median urban population in 2000 was 21 percent. The second lowest median in this regard was in Southern Appalachia, at 24 percent, and the U.S. county-level median was 40 percent in 2000. 54 Central Appalachia was the region with the lowest level of population with “some college” and one of the regions with the lowest levels of its population that had a high school degree. Levels of educational attainment in terms of those with a high school degree were virtually the same in Central Appalachia as the other poorest regional performers in this category. 55 Median county level poverty in Central Appalachia in 2000 was 19.8 percent, followed by 19.3 percent in the U.S.-Mexico Border Region and 19.1 percent in the Mississippi Delta Region. Median county level unemployment in Central Appalachia was 7.3 percent, followed by 7.1 percent in the West, 6.8 in the Delta Region, and 6.4 in the U.S-Mexico Border Region. In 2000 the median PCMI in Central Appalachia was $13,282, the lowest in the U.S. For purposes of comparison, median PCMI in the Mid-Atlantic Region in 2000 was $24,009.
45

and a range of literatures, and even films, explore this notion in greater detail than provided here. In any event, as is indicated in this analysis, in Central Appalachian areas where there has been a lot of coal mining activity there have typically been various socioeconomic problems over time. Southern Appalachia As previously suggested, according to the ARC’s distress measure Southern Appalachia is the region that has experienced the greatest improvement in distress conditions between 1960 and 2000. As is the case with virtually every other region in the U.S., characteristics associated with current and, over time, changing distress in the region share similarities, as well as differences, with other regions throughout the country.56 Persistent distress in the Southern Appalachian region exists within a band of contiguous counties spanning the Mississippi Delta Region, Southern Appalachia, and the South. These distressed counties are found in the Appalachian portions of Mississippi and Alabama, along with part of the Mississippi Delta Region and a part of Alabama that neighbors Southern Appalachia.57 The band of distress that spans the Mississippi Delta Region, Southern Appalachia, and a part of the South is perhaps the first signal that the albeit few, yet remaining, distressed counties in Southern Appalachia may share some common characteristics associated with distress with these two neighboring regions. Indeed, patterns of changing distress in Southern Appalachia most closely resemble patterns found in the Mississippi Delta Region and are somewhat similar to patterns of changing distress in the South.58 In all three of these regions, current and persistent distress points to issues of race. In particular, and as can be found throughout much of the Mississippi Delta Region as well as parts of the South, distress in the Appalachian South is largely associated with concentrated Black populations. Counties in Southern Appalachia that were distressed in 2000 had especially high Black populations relative to counties in region that were not distressed in that year: 31 percent compared to 4 percent. Similar patterns are found in Southern Appalachian counties that remained distressed over time when compared to counties that graduated from distress, with counties that graduated from distress between 1960
56 In the logistic regression models in Appendix C that assessed distress in Southern Appalachia in 2000, factors that had statistically significant relationships with current distress included high minority populations; low educational attainment; low employment in manufacturing; and low employment in professional services. In terms of counties that remained distressed between 1960 and 2000 and counties that graduated from distress during that period of time, all of the same factors, aside from educational attainment, were associated with changing distress. 57 See maps of distress for further identification of this pattern. 58 This statement is based upon comparisons of logistic regression models that assessed the nature of persistent distress and counties being able to graduate from distress in all three regions. In Southern Appalachia, race, manufacturing and employment in professional services were associated with changing distress patterns in the same way as they were in the Mississippi Delta Region. The only factor that was associated with changing distress in the Delta that was not associated with changing distress in Southern Appalachia was educational attainment. While race and employment in professional services were associated with changing distress in the South, educational attainment and metropolitan location were, unlike in Southern Appalachia, associated with changing distress in the region. In general, the South, Southern Appalachia, and the Mississippi Delta Region shared much in common with one another in terms of changing patterns of distress over time. The South and the Mississippi Delta Region shared more in common with one another than any other two regions in the analysis in terms of changing patterns of economic distress and socioeconomic characteristics associated with such patterns, at least according to the logistic regression models, though Southern Appalachia and the Mississippi Delta Region also shared a lot in common with one another in this regard.
46

Table 13: Southern Appalachia (Distressed and Non-Distressed Counties) Median Values for 1960 and 2000
Non-Distressed
1960 (N = 66)
Distressed 1960
(N = 117)
Non-Distressed
2000 (N = 160)
Distressed 2000 (N = 23)
Percent in Poverty 35.9 54.9 13.9 23.5 Percent Unemployed 4.7 5.6 4.5 8.1
Per Capita Market Income $1,125 $732 $16,839 $12,453 Per Capita Income $1,240 $846 $21,206 $17,610
Total Population 39,422 15,093 37,299 19,440 Total Urban Population 14,114 0 9,612 3,021
Percent Urban Population 38.1 0 24.5 16.6 Percent Population White na na 92.3 68.0
Percent Dependent Population
45.7 48.0 37.9 39.3
Percent H.S. Graduates 26.0 20.2 69.9 62.1 Percent with “Some College” 9.8 7.2 35.3 29.3
Percent Employed in Agriculture
7.2 20.7 1.8 3.8
Percent Employed in Mining .2 .4 .2 .3 Percent Employed in
Manufacturing 40.9 28.1 26.5 26.2
Percent Employed in Professional Services
10.0 8.9 10.4 7.8
Percent Employed in Non-Prof. Services
32.4 29.1 50.4 50.9
Percent Within or Proximate to Metro Area
na na 81.9 56.5
Diversity Index .86 .64 .83 .74 and 2000 having a median Black population of 2 percent, compared to 31 percent in the counties that remained distressed. In short, race is an important factor associated with economic distress in the Appalachian South, and in this regard Southern Appalachia is not unlike many other regions in the U.S. The relationship between distress and race in Southern Appalachia is especially similar to the surrounding Mississippi Delta and South regions, especially in that economic distress is largely associated with concentrated Black populations. At the same time, further scrutiny of factors associated with distress in Southern Appalachia points to a mix of circumstances that contribute to such distress, and while distress and race are highly correlated throughout much of the U.S., trends in persistent distress in Southern Appalachia exhibit somewhat more of an even mix between race and occupational characteristics than when compared to some other regions of the U.S., especially the Mississippi Delta and the South.59 A clear difference that has made Southern Appalachia relatively unique in comparison to many other regions throughout the U.S. over time is 59 This statement is based upon a comparison of logistic regression models in Appendix C for all regions of the U.S. For example, while race was by far the strongest contributor to persistent economic distress relative to all
47

Table 14: Southern Appalachia (Counties Remaining Distressed and Graduating from Distress between 1960 and 2000) Median Values
Distressed 1960 not 2000 (1960 rates)
(N = 94)
Distressed 1960 and 2000
(1960 rates) (N = 23)
Distressed 1960 not 2000 (2000 rates)
(N = 94)
Distressed 1960 and 2000
(2000 rates) (N = 23)
Percent in Poverty 52.1 61.0 15.2 23.5 Percent Unemployed 5.7 5.4 5.6 8.1
Per Capita Market Income $764 $656 $15,506 $12,453 Per Capita Income $888 $762 $19,848 $17,610
Total Population 15,081 16,826 22,575 19,440 Total Urban Population 0 3,087 3,656 3,021
Percent Urban Population 0 11.4 15.8 16.6 Percent Population White na na 94.3 68.0
Percent Dependent Population
47.6 51.3 38.2 39.3
Percent H.S. Graduates 20.1 20.5 67.1 62.1 Percent with “Some College” 7.2 7.9 32.1 29.3
Percent Employed in Agriculture
20.3 25.1 2.4 3.8
Percent Employed in Mining .4 .3 .3 .3 Percent Employed in
Manufacturing 31.0 24.5 28.5 26.2
Percent Employed in Professional Services
8.8 9.0 9.1 7.8
Percent Employed in Non-Prof. Services
28.7 31.3 49.2 50.9
Percent Within or Proximate to Metro Area
na na 71.3 56.5
Diversity Index .65 .57 .77 .74 relatively high levels of manufacturing employment in the region. In 1960, 35 percent of the labor force in Southern Appalachia was employed in manufacturing, a rate well above the national average. Though this figure dropped to 27 percent in 2000, Southern Appalachia currently has the highest rates of manufacturing employment in the U.S., with manufacturing employment in the region being approximately twice the national average.60 In short, compared to the rest of the U.S., Southern Appalachia has consistently had relatively high rates of employment in manufacturing, and the region has sustained these high rates of employment over time.
other independent variables in models for the South and the Mississippi Delta Region, its contribution to persistent economic distress in models for Southern Appalachia were relatively similar to the contributions of manufacturing and professional services. However, in regions such as the Southwest and U.S.-Mexico Border, race plays a somewhat similar or even less of a role in persistent economic distress than it does in Southern Appalachia, at least as interpreted through the logistic regression models as employed in this analysis. 60 Total employment in manufacturing in the region is based upon summing total employment across the region for 1960 and 2000. Median county-level values indicate similar trends.
48

To the extent that manufacturing jobs can help local economies from being distressed, or can help them move out of distress, having such high employment in manufacturing in the 1960s, and being able to sustain such employment over time, has likely been key to maintaining and improving economic vibrancy throughout much of the Southern Appalachian Region. And indeed, high employment in manufacturing was generally associated with non-distressed conditions in the region in 2000, as well as with counties being able to graduate from distress within the region over time. However, an important trend to note is that the median levels of employment in manufacturing are virtually the same in the distressed and non-distressed counties of Southern Appalachia at this time. Similar levels of employment in manufacturing occurring in the distressed as well as the non-distressed counties within Southern Appalachia, and at times in other areas of the U.S., points to disparities in wages within the manufacturing industry as a whole. Though beyond the scope of this analysis, it seems apparent that some manufacturing industries in Southern Appalachia are paying relatively high wages, while others are not. Aside from high employment in manufacturing, relatively high employment in professional service industries is also associated with non-distressed economic conditions within Southern Appalachia. As previously noted, this pattern is common throughout much of the U.S. A trend that is somewhat unique in relation to changing distress in Southern Appalachia when compared to other regions of the U.S. is the low levels of urbanization within the Southern Appalachian Region. The counties that have graduated from distress in Southern Appalachia have done so despite having some of the lowest levels of urbanization in the U.S. Low levels of urbanization in the entire region are second only to Central Appalachia, and the counties that graduated from distress in Southern Appalachia between 1960 and 2000 actually had slightly lower levels of urbanization than counties that remained distressed over time.61 This trend was perhaps offset somewhat due to issues of metropolitan location, as 71 percent of the counties that graduated from distress in Southern Appalachia were either within or proximate to metropolitan areas in 2000. Compared to the U.S. as a whole, as well as many individual regions, Southern Appalachia has a relatively high number of counties that are either within or proximate to metropolitan areas. Despite tremendous improvement in the region over time, Southern Appalachia is still beset by problems, particularly in relation to issues of educational attainment. In 2000, Southern Appalachia had some of the lowest levels of educational attainment in the U.S.62 Trends in the region’s distressed as well as non-distressed counties are somewhat similar in this regard, as reflected in educational attainment not being a significant factor when comparing counties that graduated from distress to counties that remained distress between 1960 and 2000. The only other historically distressed region in the U.S. that shared this characteristic was the Southwest.63
61 Levels of urbanization for the region as a whole are based upon summing urban population totals for the entire region. 62 In 2000, of all the regions in the U.S., Southern Appalachia had the lowest levels of educational attainment in terms of those with a high school degree, and had the third worst levels of educational attainment in terms of those with some college. 63 This is corroborated by logistic regression models in relation to persistent distress and counties moving out of distress for all regions in the U.S.
49

In general, changing distress within the Southern Appalachian Region has been somewhat unique. Employment in manufacturing and professional services has been important to improving the economic conditions in many counties in the region. At the same time, a number of counties with high employment in manufacturing have remained distressed since the 1960s. Considering the high levels of manufacturing employment in the region, continued trends of manufacturing plants moving overseas may not bode well for the Southern Appalachian Region. A number of counties in the Appalachian South have already been hurt by the loss of manufacturing jobs over the past few years.64 Meanwhile, counties with a high percentage of Black populations in the region have typically been unable to move out of persistent economic distress. In short, while the region has managed to improve at a faster rate than any other region in the U.S. over time, there remains persistent distress in a geographically concentrated area of Southern Appalachia, particularly in counties found in Mississippi and Alabama. Northern Appalachia Northern Appalachia is a region that has experienced very little economic distress over time, having only 4 counties that were distressed in 1960 and no counties meeting the ARC’s distress criteria in 2000. In many ways, these and other socioeconomic trends are more reflective of patterns found in the neighboring New England, Great Lakes, and Mid-Atlantic Regions, rather than in the other two Appalachian subregions. However, it is perhaps most accurate to describe the socioeconomic conditions of Northern Appalachia as being somewhere in between the conditions found in its neighboring, historically non-distressed regions, and the historically distressed areas of the U.S., including Central and Southern Appalachia. In short, over time the economic conditions of Northern Appalachia have tended to be better than those found in Central and Southern Appalachia, as well as in other historically distressed regions of the U.S., but typically not quite as good as the conditions found in historically non-distressed areas of the nation. For example, poverty rates in the Northern Appalachian Region compared favorably with the national average in 2000 and were more in line with historically non-distressed regions rather than historically distressed regions. Similarly, in 1960 PCMI in Northern Appalachia was above the U.S. average and typical of PCMI levels found in areas such as the Great Lakes and New England regions rather than in Central and Southern Appalachia, the Mississippi Delta Region, or the South. Similar patterns are currently evident as well, with PCMI in Northern Appalachia being the highest amongst all of the historically distressed regions in 2000. At the same time, however, PCMI in Northern Appalachia is only about 80 percent of PCMI levels found in the New England and Mid-Atlantic Regions. Thus, while some economic conditions in Northern Appalachia, seen in the context of it being at the very least a part of a broader historically distressed region, compare somewhat favorably with other historically distressed regions in the nation, economic circumstances in the Northern Appalachian subregion are not necessarily ideal. Northern Appalachia is also not without some particular problems. For example, population growth in the region has occurred at a much slower rate than it has throughout most of the rest
64 This comment is based upon the author’s familiarity with particular circumstances in some towns in the Appalachian South.
50

Table 15: Northern Appalachia (All Counties) Median Values for 1960 and 2000
1960 (N = 85)
2000 (N = 85)
Percent in Poverty 21.7 12.0 Percent Unemployed 6.7 6.0
Per Capita Market Income $1,343 $17,771 Per Capita Income $1,525 $22,529
Total Population 46,792 51,401 Total Urban Population 18,450 20,536
Percent Urban Population 40.0 45.7 Percent Population White na 96.7
Percent Dependent Population 46.3 40.1 Percent H.S. Graduates 37.1 80.7
Percent with “Some College” 10.1 34.6 Percent Employed in Agriculture 6.8 2.2
Percent Employed in Mining 1.7 .4 Percent Employed in Manufacturing 35.9 20.1
Percent Employed in Professional Services 13.1 10.5 Percent Employed in Non-Prof. Services 33.1 58.9
Percent Within or Proximate to Metro Area na 89.4 Diversity Index .84 .90
Note: No Northern Appalachian counties were distressed in 2000. Four counties graduated from distress between 1960 and 2000, but due to the limited number of counties having graduated from distress in this region, a table is not included with this information. of the U.S. during the period 1960 to 2000, with his trend being reflective of out-migration patterns, often of the young and educated.65 Though out-migration and low levels of population growth are also found in the neighboring Great Lakes, Mid-Atlantic, and New England regions, Northern Appalachia is far different from these historically non-distressed areas in that it has some of the lowest rates of educational attainment in the U.S., rates that are far more in line with other historically distressed regions than they are with historically non-distressed regions.66 Northern Appalachia has also seen tremendous job loss in manufacturing over time, with county-level median employment in manufacturing dropping from 36 percent in 1960 to 20 percent in 2000. While these trends are again similar to patterns found in the neighboring Mid-Atlantic and New England regions, unemployment in Northern Appalachia is currently higher than it is in all but one other region in the U.S. More precisely, unemployment in Northern Appalachia was approximately one-third above the U.S. average in 2000, and unemployment
65 While population more than doubled in the U.S. between 1960 and 2000, the change in population when comparing county-level medians in Northern Appalachia in 1960 and 2000 was only 48 percent. 66 For example, the median percent of those with some college in Northern Appalachia in 2000 was 35 percent, compared to the national median of 42 percent, and medians in the Plains, Mid-Atlantic, Rocky Mountain, West, and New England Regions being closer to 50 percent.
51

rates in Northern Appalachia are more analogous to those found in areas such as the U.S.-Mexico Border Region and the Mississippi Delta Region than they are to those found in many of the historically non-distressed areas of the U.S. Moreover, the median rate of unemployment in the non-distressed counties of Northern Appalachia, when compared to non-distressed counties in all remaining regions of the U.S., is higher than in any other region except the West.67 In general, it is important to understand that Northern Appalachia, unlike other parts of the Appalachian Region, is a region that has witnessed very little economic distress over time. However, if patterns of outmigration and the loss of manufacturing jobs persist in the future, the economies of many communities in this region may suffer, and indeed a number of communities in Northern Appalachia have already been adversely affected by the loss of manufacturing jobs and outmigration of the young.68 In some ways, though conditions in Northern Appalachia have compared somewhat favorably with much of the rest of the U.S. over time, current trends suggest that the region may be vulnerable to economic decline now and in the future. The Mississippi Delta Region The Mississippi Delta Region spans parts of seven states, from Missouri, Illinois, and Kentucky in the north, through Arkansas and Tennessee, and into Mississippi and Louisiana in the south. The region includes counties in these states that border either side of the Mississippi River, as well as counties that extend away from this area. As previously suggested, patterns of change in economic distress in the Mississippi Delta Region are at least somewhat similar to those found in Southern Appalachia, and they are especially similar to those found in the South. Again as previously noted, the Delta, Southern Appalachia, and the South share a somewhat contiguous area of distressed counties that spans much of Central Mississippi and continues into an area in southwest Alabama. In terms of the Mississippi Delta Region alone, current and persistent distress has been largely concentrated in the southern part of the region, especially in southern Delta counties that border or are especially proximate to the Mississippi River. In short, distress in the Mississippi Delta Region is particularly concentrated in Louisiana and Mississippi, and to a lesser extent, Arkansas. Current and persistent patterns of distress in the Delta Region are largely associated with what can be described as Black, rural poverty. Similar to trends found in Southern Appalachia as well as in the South, the clear distinction between distress and non-distress in the Mississippi Delta Region relates to race.69 In 2000, the median percent black population in the 67 It is important to remember in this regard that these figures include all counties in Northern Appalachia, as no counties were distressed in that region in 2000. In the Northern Appalachian counties, median unemployment in 2000 was 6.0 percent. Only the West Region was higher with a median county-level unemployment rate of 6.8 percent in the region’s non-distressed counties. 68 Like the previous comment related to the loss of manufacturing jobs in Southern Appalachia, this comment is related to the author’s own understanding of changes taking place in some areas of Northern Appalachia at this time. 69 In the logistic regression model in Appendix C related to changing patterns of distress in the region, race, when considered in relation to all of the other independent variables in the model, was by far the largest contributor to economic distress. The only other region that demonstrated similar results was the South. In general, the logistic regression model that assessed distress in the Mississippi Delta Region in 2000 indicated that factors having a
52

Table 16: Mississippi Delta Region (Distressed and Non-Distressed Counties) Median Values for 1960 and 2000
Non-Distressed
1960 (N = 51)
Distressed 1960
(N = 162)
Non-Distressed
2000 (N = 130)
Distressed 2000
(N = 83)
Percent in Poverty 35.7 57.3 16.2 26.0 Percent Unemployed 5.4 6.0 5.8 8.6
Per Capita Market Income $1,136 $738 $16,348 $12,657 Per Capita Income $1,290 $868 $20,636 $17,467
Total Population 30,021 18,112 24,431 18,698 Total Urban Population 11,123 3,777 9,352 6,057
Percent Urban Population 43.0 19.9 36.1 36.8 Percent Population White na na 88.5 59.8
Percent Dependent Population
46.5 50.5 39.6 41.9
Percent H.S. Graduates 27.6 20.8 72.4 65.0 Percent with “Some College” 8.7 7.6 34.4 30.0
Percent Employed in Agriculture
11.7 28.3 3.1 5.6
Percent Employed in Mining 1.4 .3 .5 .7 Percent Employed in
Manufacturing 21.4 15.7 18.8 18.2
Percent Employed in Professional Services
12.4 10.0 9.5 8.1
Percent Employed in Non-Prof. Services
38.6 34.2 56.6 59.3
Percent Within or Proximate to Metro Area
na na 58.5 53.0
Diversity Index .81 .53 .83 .72 distressed counties in the Delta was 38 percent, compared to only 9 percent in the region’s non-distressed counties. Analogous trends are found when comparing persistently distressed counties in the region and counties that graduated from distress between 1960 and 2000, where the persistently distressed counties had a median black population of 39 percent in 2000, compared to 10 percent in counties that moved out of distress over time. In some respects, it appears that race alone does more to explain persistent distress in the Mississippi Delta Region than it does in any other region included in this analysis except for the South.70 In general, patterns of persistent distress in Southern Appalachia, the South, and the Mississippi Delta Region share a lot in common with one another, with the primary factor relating to persistent distress in these areas being directly associated with issues of relentless Black poverty.
statistically significant relationship with current distress included high minority populations; low educational attainment; low employment in manufacturing; and low employment in professional services. In terms of counties that remained distressed between 1960 and 2000 and counties that graduated from distress during that period of time, all of the same factors were associated with changing distress. 70 See the previous footnote.
53

Table 17: Mississippi Delta Region (Counties Remaining Distressed and Graduating from Distress between 1960 and 2000) Median Values
Distressed 1960 not 2000 (1960 rates)
(N = 82 )
Distressed 1960 and 2000
(1960 rates) (N = 80 )
Distressed 1960 not 2000 (2000 rates)
(N = 82)
Distressed 1960 and 2000
(2000 rates) (N = 80)
Percent in Poverty 52.4 61.8 16.9 26.2 Percent Unemployed 5.7 6.1 5.9 8.6
Per Capita Market Income $780 $674 $15,222 $12,624 Per Capita Income $939 $823 $19,768 $17,421
Total Population 16,691 20,461 19,467 18,327 Total Urban Population 2,829 4,884 5,743 6,265
Percent Urban Population 16.7 23.8 29.4 36.8 Percent Population White na na 88.0 58.7
Percent Dependent Population
48.9 52.3 40.3 41.9
Percent H.S. Graduates 21.1 20.1 70.8 64.9 Percent with “Some College” 7.2 7.8 32.3 30.1
Percent Employed in Agriculture
27.2 29.9 4.2 5.6
Percent Employed in Mining .3 .3 .3 .6 Percent Employed in
Manufacturing 18.6 13.9 20.2 18.2
Percent Employed in Professional Services
9.9 10.3 9.2 8.1
Percent Employed in Non-Prof. Services
33.0 35.1 55.3 59.2
Percent Within or Proximate to Metro Area
na na 61.0 53.8
Diversity Index .56 .48 .78 .74 Like other regions in the U.S., the Delta has been forced to adjust to fairly dramatic economic transition over time. The region has gone from being largely dependent upon agriculture to having lost a tremendous number of jobs in the industry throughout the course of much of the 20th Century. Of all the historically distressed regions in the analysis, the Delta Region had the highest percent of its population working in the agricultural sector in the 1960s, and the region was second only to the Plains Region in terms of the percent employed in agriculture at that time. In total, the Delta Region had approximately 16 percent of its entire workforce employed in agriculture in 1960, though quite a few counties in the region had in the range of 50-60 percent of its workforce employed in agriculture at that time.71 Yet by 2000, only 2 percent of the entire workforce in the Delta was employed in agriculture. Between 1960 and 2000 counties such as Carroll, Mississippi, had seen rates of employment in agriculture drop from 52 percent to only 6 percent. Similar trends were not at all uncommon in other counties in the region.72 71 Total employed in agriculture is based upon summing across all counties in the region. 72 To cite a few other examples, Fayette, Tennessee, experienced a drop from 56 percent to 3 percent; Tunica, Mississippi, from 67 percent to 10 percent; and DeSoto, Mississippi, from 42 percent to less than 1 percent.
54

Further inspection of potential associations between occupational structure and economic distress in the region indicates that counties in the Mississippi Delta that have historically been non-distressed have tended to have low levels of employment in agriculture over time, even back in the 1960s.73 On the other hand, distressed counties in the region in 1960 tended to have relatively higher rates of employment in agriculture at that time. Thus, it has indeed been the case that counties that have remained distressed, as well as those that graduated from distress between 1960 and 2000, have both gone from having relatively high levels of employment in agriculture in the 1960s to low levels of current employment in the industry. More specifically, the counties that were distressed in 1960 as well as in 2000 saw their total employment in agriculture drop from 30 percent in 1960 to 6 percent in 2000; counties that moved out of distress saw a drop from 27 percent to 4 percent over the same period of time.74 Clearly then, and in terms of patterns of changing distress, some areas have adjusted better than others to the transition away from agricultural employment in the region. However, considering various other employment characteristics in the Delta Region indicates that current variations in employment patterns are largely minimal in persistently distressed counties when compared to those that have graduated from distress in region. In 2000, rates of employment in manufacturing and professional services, as well as economic diversity in general, were largely similar in counties in the region that had graduated from distress when compared to those that had remained persistently distressed over time. Indeed, current levels of economic diversity are virtually identical between persistently distressed counties and counties that have graduated from distress in the region: the region demonstrates the least disparity of any region in the U.S. in this regard. Nevertheless, statistical modeling indicates relatively weak, but nonetheless significant, trends associated between improving economic conditions in the region and levels of employment in both manufacturing and professional services. The similar patterns found in manufacturing in distressed and non-distressed counties in the region, yet the more general disparity in distressed conditions between such places, suggests the possibility of a notable discrepancy in wages between different types of manufacturing jobs in the region. Unlike some areas in the U.S., metropolitan location and issues of urbanization have seemingly not been especially important in the region in relation to counties either being distressed in 2000 or being able to move out of distress between 1960 and 2000. In terms of metropolitan characteristics, the disparity between distressed and non-distressed counties in the Delta Region is less stark than it is in all other regions of the U.S. For example, while 53 percent of the distressed counties in the region were either within or proximate to a metropolitan area in 2000, only 59 percent of the counties that were not distressed in 2000 were in such areas. Similar patterns are found in counties that remained distressed and graduated from distress within the region between 1960 and 2000, with there being only a small difference between the metropolitan characteristics of such counties. Other demographic trends are also fairly similar when comparing distressed and non-distressed counties in the region, including, in some respects, levels of urbanization and population size, though it is clear that the persistently
73 Counties that were non-distressed in both 1960 and 2000 had only 5 percent of their total workforce employed in agriculture in 1960. 74 These are median values as found in Table 17, though summing across both sets of counties gives virtually identical results.
55

distressed counties in the region have experienced relatively greater outmigration over time when compared to counties that have graduated from distress.75 Finally, and as is the case in most other regions of the U.S., issues of educational attainment also have a relatively strong association with economic distress in the region, though there is somewhat less variation in terms of rates of educational attainment in distressed and non-distressed counties in the Delta than is found in most other regions. In general, the many similarities between persistently distressed and non-distressed counties in the Mississippi Delta Region are in contrast to the one trend that seemingly most differentiates such areas: racial composition. Though the analytical techniques utilized in this research – and census variables in particular – in many ways cannot capture some of the subtleties and issues of discrimination associated with Black, or in general minority, poverty in the U.S., census figures can in fact demonstrate some very clear trends: high rates of poverty and unemployment, low levels of income, and other underprivileged socioeconomic circumstances for many minorities living in the nation. These patterns are consistent at various scales of analysis, from individual neighborhoods in urban areas, to entire regions, such as the Delta and the South.76 A broad range of literature examines in detail issues related to race, class, and poverty in the U.S. Results of analyses such as the one presented here, which clearly indicates disadvantaged circumstances in relation to race in regions such as the Mississippi Delta, perhaps unquestionably justify the need for greater attention to literatures and issues associated with race, poverty, and opportunity in the U.S.
The South Aside from Southern Appalachia, the South has performed the best in terms of changing patterns of distress over time. In this analysis, the South includes perhaps the most geographically wide-ranging group of counties of any region, extending north to south from Virginia to Florida and as far west as Arkansas and Louisiana. It is also the one region that is not entirely contiguous in this analysis, as it includes areas on either side of Appalachia as well as on both sides of the Mississippi Delta Region. As is the case with most regions discussed in this report, distress in the South is geographically concentrated, though this concentration occurs in two particular areas. One area includes, as indicated in discussions relating to Southern Appalachia and the Mississippi Delta regions, a contiguous group of counties in southwestern Alabama. The other area of distress is found in a band of counties stretching from Georgia into the Carolinas. Economic distress in the South more generally, including the distressed counties in Alabama, Georgia, South Carolina, and North Carolina, is found in what
75 Based on median population change in such counties over time. 76 An analysis of 2000 U.S. census data indicated that, for example, at the national level there are statistically significant relationships between high percentages of Blacks living in an area and high rates of poverty, high unemployment, and low income. Similar patterns are found at subregional levels as well, and can be demonstrated using census variables at various scales of analysis, including the census tract and block group levels.
56

Table 18: The South (Distressed and Non-Distressed Counties) Median Values for 1960 and 2000
Non-Distressed
1960 (N = 222 )
Distressed 1960
(N = 326 )
Non-Distressed
2000 (N = 461)
Distressed 2000
(N = 87)
Percent in Poverty 34.7 56.4 14.1 23.9 Percent Unemployed 4.5 5.0 4.3 8.4
Per Capita Market Income $1,175 $738 $17,664 $13,853 Per Capita Income $1,336 $875 $21,759 $18,557
Total Population 39,178 13,943 34,780 15,752 Total Urban Population 14,929 2,885 11,776 4,499
Percent Urban Population 44.6 16.3 38.5 26.4 Percent Population White na na 76.5 55.3
Percent Dependent Population
46.0 50.3 38.4 40.7
Percent H.S. Graduates 32.6 22.9 73.7 65.7 Percent with “Some College” 12.3 8.6 38.4 29.9
Percent Employed in Agriculture
9.3 24.1 2.6 5.1
Percent Employed in Mining .2 .1 .1 .1 Percent Employed in
Manufacturing 21.5 21.8 17.2 22.6
Percent Employed in Professional Services
13.2 9.2 11.7 8.0
Percent Employed in Non-Prof. Services
40.5 34.3 57.0 54.5
Percent Within or Proximate to Metro Area
na na 90.5 69.0
Diversity Index .83 .65 .88 .75 is often referred to as the “Black Belt.”77 In short, as is the case with Southern Appalachia as well as the Delta Region, areas in the South that have remained persistently distressed over time are those with a high percentage of Blacks.78 77 For example, a current Bill before Congress is aimed at addressing poverty in the “Black Belt.” See www.usda.ers.gov for reports in relation to poverty in the “Black Belt” as well. 78 The logistic regression model in Appendix C related to distress in the South Region in 2000 indicated that factors having a statistically significant relationship with current distress included high minority populations; low educational attainment; low employment in professional services, and metropolitan location, with counties that were neither within nor proximate to a metropolitan area more likely to be distressed. In terms of counties that remained distressed between 1960 and 2000 and counties that graduated from distress during that period of time, all of the same factors were associated with changing distress. It is also of note that in the logistic regression models related to the South Region, race, in relation to all of the other variables in both models, had a greater relative contribution to explaining economic distress than was the case in models for any other region. At the same time, the results of the model for the South were largely the same as they were in the Delta Region, and to some extent Southern Appalachia, and it is probably best to understand issues of race playing a somewhat similar role in terms of patterns of distress in these as well as other areas.
57

Table 19: The South (Counties Remaining Distressed and Graduating from Distress between 1960 and 2000) Median Values
Distressed 1960 not 2000 (1960 rates) (N = 244 )
Distressed 1960 and 2000
(1960 rates) (N = 82 )
Distressed 1960 not 2000 (2000 rates)
(N = 244)
Distressed 1960 and 2000
(2000 rates) (N = 82)
Percent in Poverty 54.0 63.2 16.4 24.0 Percent Unemployed 4.9 5.2 4.9 8.5
Per Capita Market Income $786 $660 $15,869 $13,790 Per Capita Income $915 $765 $20,039 $18,454
Total Population 13,456 16,266 20,809 14,444 Total Urban Population 2,584 3,579 4,436 3,949
Percent Urban Population 12.1 20.6 23.9 25.1 Percent Population White na na 70.3 54.9
Percent Dependent Population
49.6 52.4 39.1 40.8
Percent H.S. Graduates 23.5 21.9 70.1 65.4 Percent with “Some College” 8.5 8.9 33.8 29.9
Percent Employed in Agriculture
22.2 28.1 3.8 5.2
Percent Employed in Mining .1 0 .2 .1 Percent Employed in
Manufacturing 22.1 20.8 20.5 22.8
Percent Employed in Professional Services
9.3 9.1 9.8 7.9
Percent Employed in Non-Prof. Services
34.9 33.7 56.2 54.4
Percent Within or Proximate to Metro Area
na na 84.8 67.1
Diversity Index .69 .57 .84 .75 Thus, and as is the case throughout much of the U.S., race is strongly associated with issues of economic distress in the South, and the Black poverty in the South in many respects imitates patterns of distress in the Delta and Southern Appalachian Regions.79 Although the differences in race as it relates to distress are not as disparate in the South Region as they are in the Mississippi Delta and Southern Appalachian regions, there is still a clear link between economic distress in the South and areas with a high percentage of Black residents. For example, in the South’s non-distressed counties in 2000, the median black population was 18 percent, compared to 43 percent in counties that were distressed in that year. Similar trends are found when comparing counties that have graduated from distress over time to those that have remained persistently distressed, where counties that graduated from distress between 1960 and 2000 had a median black population of 29 percent, compared to 43 percent in counties that had remained distressed. In some respects, then, the contrasts in the racial make-up of distressed and non-distressed counties in the South, whether understood in terms of current distress or in a county’s ability to graduate from distress, do not appear to be quite as vast in the South as they are in the Mississippi Delta Region as well as in Southern Appalachia. More generally, 79 See previous sections on the Delta and Southern Appalachia in relation to this statement.
58
however, and as previously noted, patterns of persistent distress in Southern Appalachia, the South, and the Mississippi Delta Region share a lot in common with one another, with all three of these regions having economic distress directly associated with issues of persistent Black poverty. On the other hand, patterns of current as well as persistent distress in the South are somewhat different than are found in the neighboring regions of the Delta and Southern Appalachia, as well as in other regions throughout the U.S. Manufacturing trends as they relate to distress in the South contradict patterns in other regions in the U.S. In particular, and in contrast to all other regions in the analysis, median employment in manufacturing is actually higher in distressed rather than in non-distressed counties in the South, and it is also higher in counties that remained distressed over time when compared to counties that graduated from distress. Aside from the Southwest Region, the South is the only historically distressed region included within this research where manufacturing was not associated with counties graduating from distress over time.80 Thus, while higher employment in manufacturing had a positive association with counties graduating from distress in areas such as Central and Southern Appalachia and the Mississippi Delta Region, this pattern does not hold true for the South Region. That distressed counties in the South actually have higher rates of employment in manufacturing than do the non-distressed counties in the region suggests the possibility that many manufacturing firms in the region are paying relatively low wages. One issue that stands out in relation to positively affecting the changing patterns of distress in the South is that of metropolitan location. In many respects, metropolitan location in the South played perhaps a greater role in contributing to improving economic conditions in the region than it did for any other region in the analysis aside from the Southwest.81 In 2000, 91 percent of the non-distressed counties in the region were either a part of or proximate to a metropolitan area. Only 69 percent of the distressed counties shared this characteristic. Similar patterns are found when comparing counties that graduated from distress to those that remained distressed over time.82 Perhaps related to these trends of metropolitan location are patterns in professional service-based employment in the South, with the region having relatively higher employment in this sector than most other regions of the U.S.83 In general, aside from issues of race, current distress as well as the ability to graduate from distress in the South is linked to issues of metropolitan location as well as employment in professional services, though such employment similarly affects county-level distress patterns in other areas of the U.S. as well. Furthermore, as is also the case in many other regions, levels of educational attainment have also had a positive effect upon improving distress in the South Region.
80 See pertinent logistic regression model in Appendix C in this regard. 81 The Southwest was the only other region aside from the South where metropolitan location was associated with improving trends in distress. 82 Of all the counties in the South that graduated from distress, 85 percent were either within or proximate to a metropolitan area, compared to 67 percent of the distressed counties in the region that met this criteria. 83 For the entire region, the county-level median employed in professional services in 2000 was 10.9 percent, slightly above the U.S. county-level median of 10.1 percent and higher than the county-level median found in any other persistently distressed region in this analysis.
59

In general, the story of economic distress in the South is similar to that found in many other regions throughout the U.S. Current and persistent distress in the region largely relates to issues of race. As suggested, perhaps the most notable difference in the South when compared to the other regions is that the percent employed in manufacturing is actually higher in the distressed counties than it is in the non-distressed counties. This is in stark contrast to trends in areas such as Central Appalachia, where the exact opposite is true. Metropolitan location is also clearly important to current and changing economic conditions for counties in the South. While over time the South has experienced similar structural economic change in relation to agriculture as found in the neighboring Mississippi Delta Region, this change has not been quite as dramatic as that found in the Delta.84 Also in contrast to the Delta and regions such as Central Appalachia, the South has witnessed relatively greater improvement in conditions of economic distress over time. The areas that have been left behind in the region are those that have relatively large Black populations. The Southwest Spanning from Texas and Oklahoma in the east to Northern New Mexico and Northern Arizona in the western part of the region, the Southwest, like the South and Southern Appalachian regions, has witnessed relatively dramatic improvement in economic distress over time. The number of distressed counties in the region dropped from 30 percent in 1960 to slightly less than 10 percent in 2000, making the region, in many ways, currently more comparable to some of the historically non-distressed regions than to the historically distressed regions as defined in this analysis. In fact, in 2000 the percentage of distressed counties in the region was actually lower than found in the West and only slightly above rates of distress in the Rocky Mountain Region. The Southwest is in many ways similar to these more western regions of the U.S. in that it has witnessed relatively rapid population growth over the past few decades: people that are leaving areas such as the Mid-Atlantic and Northern Appalachian regions are often migrating to southern and western areas of the country, helping to cause the populations in parts of these regions to swell.85 Although distress in the Southwest Region is not quite as extensive as found in many other parts of the U.S., this region exhibits similar characteristics associated with distress as are found in other regions of the nation. For example, as is the case in areas such as Central and Southern Appalachia and the South, economic distress is geographically clustered, with two particular clusters of distress in the region. The first is found in Eastern Oklahoma, while the second bridges areas of Northern New Mexico and Northern Arizona. Not surprisingly, considering the national and regional trends as previously discussed, distress in Oklahoma, New Mexico, and Arizona is largely associated with issues of race. In particular, economic distress in the Southwest is associated with areas that have relatively large percentages of Native American populations, including, for example, the Navajo Indian Reservation, which
84 As a whole, the South had 10 percent of its population employed in agriculture in 1960, and then 1 percent employed in agriculture in 2000. See the section on the Mississippi Delta Region for a comparison in employment levels in agriculture over time. 85 For example, between 1960 and 2000 population in the U.S.-Mexico Border Region grew by 129 percent. In the West, Rocky Mountain, and South Regions it grew by 120, 114, and 109 percent respectively. In the Appalachian Region population grew by only 27 percent, and in the Mid-Atlantic Region by only 25 percent. These patterns are somewhat indicative of people migrating to the more southern and western areas of the country.
60
extends through parts of Arizona and New Mexico. In short, and as has become a somewhat common theme in this analysis, persistent distress in the Southwest Region is marked by patterns of race.86 In currently non-distressed areas of the Southwest, the Native American population is slightly less than 2 percent, while in the region’s distressed counties it is 31 percent. Similar patterns are found in counties that either stayed distressed or graduated from distress between 1960 and 2000, with counties that graduated from distress having Native American populations of slightly below 4 percent, compared to 23 percent in the counties that remained distressed over time.87 Counties such as Adair, Oklahoma, McKinley, New Mexico, and Apache, Arizona have remained persistently distressed over time and have Native American populations of 43 percent, 75 percent, and 77 percent respectively.88
Again as is the case with other regions, issues of distress are not necessarily entirely related to race. However, in terms of counties either remaining distressed or moving out of distress over time, only two factors – race and metropolitan location – are statistically significant in explaining these trends.89 Thus, the only other factor aside from race that was shown to be associated with counties moving out of distress over time in the region was metropolitan location, with 82 percent of the counties that graduated from distress being either within or proximate to a metropolitan area, compared to 60 percent of the counties that remained distressed. In some respects, then, moving out of distressed status in the Southwest is somewhat less complex than in other regions of the U.S., with issues of race and metropolitan location being the primary factors in relation to this process. As was the case with Central Appalachia and the South, metropolitan location has played an important role in determining the ability of counties in the Southwest to move out of distress over time. And as has been virtually the case in all regions aside from Central Appalachia, issues of race are strongly associated with persistent distress. The Southwest is somewhat unique in comparison to many of the other regions in this analysis in that current patterns of distress are related to a somewhat broader array of factors than changing patterns of distress in the region. While issues of race and metropolitan location are associated with current distress in the same way as they are associated with persistent distress in the region, unlike patterns assessed in relation to persistent distress and counties graduating from distress, occupational characteristics in the Southwest have an association with current distress in the region.90 Specifically examining employment in the region indicates that counties that are currently distressed in the Southwest tend to have lower employment in agriculture than counties that are non-distressed. The Southwest is the one region aside from
86 The logistic regression model in Appendix C related to distress in the Southwest Region in 2000 indicated that factors having a statistically significant relationship with current distress included high minority populations; low educational attainment; low employment in manufacturing; low employment in agriculture; and metropolitan location, with counties that were neither within nor proximate to a metropolitan area more likely to be distressed. In terms of counties that remained distressed between 1960 and 2000 and counties that graduated from distress during that period of time, only race and metropolitan location were associated with persistent distress, with the same types of relationships as found in the model measuring distress in 2000 alone. 87 These figures are based upon summing population variables for distressed as well as non-distressed counties in the region. 88 Similar trends in terms of Native American populations are found in many other distressed counties in the region. 89 Based on the related logistic regression model in Appendix C. 90 See previous footnote to note the differences between the models that measured current and persistent distress.
61

the U.S.-Mexico Border region where agriculture, particularly lower employment in agriculture, is related to distress. Many of the non-distressed counties in the region, particularly in Texas, have exceptionally high rates of employment in agriculture relative to the rest of the U.S., with the total labor force employed in agriculture often in the range of 20-30 percent in such areas.91
Counties that are currently distressed also tend to have lower employment in manufacturing than their non-distressed counterparts in the region. However, like other regions in the more western areas of the U.S., including the U.S.-Mexico Border, the Rocky Mountain, and the Table 20: Southwest Region (Distressed and Non-Distressed Counties) Median Values for 1960 and 2000
Non-Distressed 1960
(N = 205)
Distressed 1960
(N = 87)
Non-Distressed
2000 (N = 266)
Distressed 2000
(N = 26)
Percent in Poverty 32.4 53.4 15.8 22.1 Percent Unemployed 3.8 5.1 4.3 8.5
Per Capita Market Income $1,277 $816 $16,806 $11,807 Per Capita Income $1,468 $1,006 $21,136 $16,605
Total Population 15,016 15,682 20,256 15,207 Total Urban Population 6,638 3,799 8,034 5,555
Percent Urban Population 50.2 24.6 43.1 31.7 Percent Population White na na 81.0 69.2
Percent Dependent Population
46.7 49.3 42.0 42.7
Percent H.S. Graduates 35.5 24.4 75.4 69.9 Percent with “Some College” 13.6 9.9 41.1 34.8
Percent Employed in Agriculture
18.8 21.0 5.1 5.3
Percent Employed in Mining 3.0 1.2 1.5 1.2 Percent Employed in
Manufacturing 7.6 10.6 11.3 9.4
Percent Employed in Professional Services
12.7 12.5 10.3 8.4
Percent Employed in Non-Prof. Services
41.5 40.0 58.8 60.5
Percent Within or Proximate to Metro Area
na na 70.3 57.7
Diversity Index .53 .64 .76 .72
91 To further elaborate, approximately one-quarter of the counties in the region had rates of employment in agriculture that were above 10 percent, and only 5 of these counties were distressed in 2000. A total of 18 counties had rates of employment above 20 percent, 14 of which were in Texas and 2 each in Oklahoma and New Mexico. Only 1 of these counties was distressed in 2000.
62

West regions, the Southwest has some of the lowest employment in manufacturing in the U.S., with the regionwide county-level median being somewhat below the U.S. average.92 Percent employed in professional services is also, on a regionwide basis, slightly lower than the U.S. average.93 However, unlike all other historically distressed regions included in this analysis, and in contrast to the West and Rocky Mountain regions as well, percent employed in professional services is not statistically significant in its association with economic distress.94 Furthermore, though not associated with distress in particular, it is worth noting that there are relatively high rates of employment in mining in some parts of the region, in a large part indicative of the oil and gas industry in the Southwest, especially in areas of Texas. Table 21: Southwest Region (Counties Remaining Distressed and Graduating from Distress between 1960 and 2000) Median Values
Distressed 1960 not 2000 (1960 rates)
(N = 68)
Distressed 1960 and 2000
(1960 rates) (N = 19)
Distressed 1960 not
2000 (2000 rates)
(N = 68)
Distressed 1960 and 2000 (2000
rates) (N = 19)
Percent in Poverty 52.3 58.9 16.6 22.4 Percent Unemployed 4.7 8.4 4.5 9.7
Per Capita Market Income $849 $708 $15,926 $11,345 Per Capita Income $1,035 $889 $20,248 $16,315
Total Population 15,920 15,637 22,501 15,342 Total Urban Population 4,266 2,587 7,130 5,779
Percent Urban Population 28.2 18.6 30.9 30.7 Percent Population White na na 77.6 68.1
Percent Dependent Population
49.0 51.9 41.7 41.7
Percent H.S. Graduates 24.7 21.6 72.5 69.8 Percent with “Some College” 10.1 9.3 37.1 35.3
Percent Employed in Agriculture
23.5 15.1 4.9 5.2
Percent Employed in Mining 1.1 1.9 1.4 1.2 Percent Employed in
Manufacturing 10.7 10.1 13.4 9.5
Percent Employed in Professional Services
12.4 14.6 10.2 8.3
Percent Employed in Non-Prof. Services
40.0 40.9 58.5 62.0
Percent Within or Proximate to Metro Area
na na 82.1 60.0
Diversity Index .61 .73 .81 .78
92 County-level median employment in manufacturing for the entire region in 2000 was 11.2 percent, compared to a 15 percent county-level median for the U.S. as a whole. 93 This difference is not especially large, with the U.S. county level median being 10.4 percent and the county-level median in the Southwest being 10.1 percent. 94 Again, see the logistic regression model for distress and non-distress in the region in 2000.
63

In general, the economic structure of the Southwest is somewhat different in comparison to other areas of the U.S. At times, various occupational characteristics within the region contribute to conditions of economic distress. In relation to distress in the region, however, issues of occupational structure should perhaps not be overstated. Rather, it is likely best to understand economic distress in the Southwest as being marked by two trends in particular: decreasing distress more generally, but persistent distress in areas with high percentages of Native American populations. Metropolitan location is also related to improving economic conditions in the region, with the general patterns of metropolitan and urban growth being related to migration patterns in the U.S. more generally. As is the case in many other areas of the U.S., rural areas with high percentages of minority populations are the areas that have remained persistently distressed in the Southwest over time. The U.S.-Mexico Border Region In contrast to patterns found in every other historically distressed region in the U.S., the U.S.-Mexico Border Region has experienced growth in its number of distressed counties over time. The U.S.-Mexico Border Region extends through the southern areas of the states of Texas, New Mexico, Arizona, and California. Many of the counties in the region border Mexico and all of the region’s counties are within, at most, approximately 125 miles of the border. There are a number of metropolitan areas in the region, many of which neighbor, and in various respects are socially and economically connected to, large cities in Mexico. For example, El Paso, Texas, is directly across the Rio Grande River from Ciudad Juárez, Mexico. The same is true for Brownsville, Texas, which sits across the Rio Grande from Matamoros, Mexico. And other cities, such as San Diego, California, which is adjacent to Tijuana, Mexico, essentially merge with large urban areas in neighboring Mexico to the south. In 1960, distress in the U.S.-Mexico Border Region was concentrated in southern Texas, with some of the larger urban areas in South Texas, such as the cities of Laredo, McAllen, and Brownsville, being at the heart of distress in the region. This area of once relatively concentrated economic distress has expanded to include many of the counties along the U.S.-Mexico border in the remaining states of the region, as well as a few counties along the Texas-Mexico border that were not distressed in 1960. Also noteworthy are conditions of economic distress that have developed over time in a number of counties, not directly bordering Mexico, in New Mexico. Thus, whereas distress in the Border Region was largely, at one time, concentrated in South Texas, distress in the region has expanded, growing to include counties that are home to cities such as Nogales, Arizona, Las Cruces, New Mexico, and El Paso, Texas. That distress has developed in areas such as El Paso and Las Cruces, and remains persistent in some of the more metropolitan locations of South Texas such as Brownsville and Laredo, is perhaps the first indication, aside from growing distress in the region more generally, that factors associated with economic distress in the U.S.-Mexico Border Region are somewhat different than found in other regions of the U.S.95 To be sure, in the Border Region’s distressed 95 The logistic regression model in Appendix C related to distress in the U.S.-Mexico Border Region in 2000 indicated that factors having a statistically significant relationship with current distress included high minority populations; low educational attainment; low employment in mining; low employment in agriculture; and low employment in professional services. The second model for the region was different than models for previous regions in that it measured associations between counties being non-distressed in both 1960 and 2000 and counties
64

counties, median levels of urbanization are actually higher than in the region’s non-distressed counties, a trend that is in contrast to all other regions in the U.S.96 In general, the Border Region has some of the highest rates of urbanization in the U.S., second only to the Mid-Atlantic Region.97 Compared to all other regions in this analysis, population growth has occurred most rapidly over time in the Border Region. The region’s population more than doubled between 1960 and 2000, growing at a faster rate than in areas often associated with having especially rapid population growth, including the South, the Southwest, the West, and the Rocky Mountain Table 22: U.S.-Mexico Border Region (Distressed and Non-Distressed Counties) Median Values for 1960 and 2000
Non-Distressed
1960 (N = 66 )
Distressed 1960
(N = 26 )
Non-Distressed
2000 (N = 52)
Distressed 2000
(N = 40)
Percent in Poverty 31.4 56.9 15.6 26.9 Percent Unemployed 4.5 6.8 4.3 10.0
Per Capita Market Income $1,385 $823 $16,126 $11,469 Per Capita Income $1,562 $945 $19,349 $15,481
Total Population 11,733 13,333 18,528 19,080 Total Urban Population 6,566 6,370 8,842 11,555
Percent Urban Population 57.6 51.6 61.1 69.1 Percent Population White na na 77.6 75.9
Percent Dependent Population
46.5 51.8 41.5 44.0
Percent H.S. Graduates 39.5 23.6 74.5 59.6 Percent with “Some College” 17.1 10.3 46.5 33.0
Percent Employed in Agriculture
17.4 28.8 4.3 5.9
Percent Employed in Mining 1.9 3.5 1.6 1.8 Percent Employed in
Manufacturing 5.6 4.9 5.7 5.1
Percent Employed in Professional Services
13.0 10.9 12.7 8.9
Percent Employed in Non-Prof. Services
45.0 42.2 60.5 66.2
Percent Within or Proximate to Metro Area
na na 73.1 62.5
Diversity Index .49 .43 .68 .54 that entered distress during that period of time. Counties that entered distress shared similar characteristics as those that were distressed in the region in 2000. 96 This includes all historically distressed regions, including the subregions of Appalachia, as well as the historically non-distressed regions of the U.S. as a whole. Note, however, that in the Mississippi Delta Region median levels of urbanization in distressed and non-distressed counties in 2000 were virtually identical. 97 This is based upon the entire region. Median county-level urban population in the region is 66 percent. In the Mid-Atlantic Region it is 72 percent. The U.S. county-level median is 40 percent.
65

regions.98 At least some of the population growth in the region is associated with birth rates, which are to some extent higher than in much of the remaining U.S.; the growing population over time has also been at least somewhat associated with legal as well as illegal immigration into the region.99 In the meantime, and as is indicative in the extremely high unemployment rates in some parts of the U.S.-Mexico Border region, job growth has not kept pace with rapid population growth in the region over time. Eight of the ten counties in the U.S. with the highest unemployment rates in the U.S. are found in the Border Region.100 Counties such as Presidio, Table 23: U.S.-Mexico Border Region (Counties Never Distressed and Entering Distress Between 1960 and 2000) Median Values
Non-Distressed
1960 and 2000 (1960 rates)
(N = 44)
Distressed 2000 not 1960 (1960 rates)
(N = 22)
Non-Distressed
1960 and 2000 (2000 rates)
(N = 44)
Distressed 2000 not 1960 (2000 rates)
(N = 22)
Percent in Poverty 25.5 35.9 15.3 24.5 Percent Unemployed 4.2 5.0 4.7 8.4
Per Capita Market Income $1,458 $1,278 $17,332 $12,740 Per Capita Income $1,658 $1,495 $21,218 $16,513
Total Population 8,896 13,849 18,528 28,009 Total Urban Population 4,450 7,130 8,842 14,900
Percent Urban Population 55.7 60.7 66.4 63.7 Percent Population White na na 77.3 75.0
Percent Dependent Population
46.5 46.6 41.8 42.7
Percent H.S. Graduates 40.9 38.7 75.5 66.6 Percent with “Some College” 17.3 16.3 48.4 38.1
Percent Employed in Agriculture
14.2 19.4 4.2 5.9
Percent Employed in Mining 2.1 1.6 1.5 2.0 Percent Employed in
Manufacturing 5.7 5.6 5.4 6.2
Percent Employed in Professional Services
13.3 12.5 12.7 9.8
Percent Employed in Non-Prof. Services
43.3 48.1 59.6 65.0
Percent Within or Proximate to Metro Area
na na 72.7 54.5
Diversity Index .48 .50 .61 .49 98 In general, the U.S.-Mexico Border, West, Southwest, Rocky Mountain, and South Regions have all seen their populations more than double since 1960, though population growth has occurred most rapidly in the Border Region. See previous footnote for comparison of rates of growth in these 5 regions. 99 See Gilmer et al. (2001) for information in relation to these particular issues. 100 Based upon three-year unemployment averages between 1997 and 1999. The worst ten counties in the U.S. in this regard were as follows, with three-year unemployment rates included in parentheses: Presidio, TX (30.9); Starr, TX (26.7); Yuma, AZ (26.7); Imperial, CA (25.3); Luna, NM (25.0); Maverick, TX (24.9); Zavala, TX (21.1); West Carroll, LA (20.4); East Carroll, LA (20.3); Willacy, TX (20.0).
66

Starr, Maverick, Willacy, and Zavala, Texas, Yuma, Arizona, Imperial, California, and Luna, New Mexico, all had unemployment in the range of 20-30 percent for the most recent three-year period studied in this analysis.101 All but two of these counties had unemployment rates in the range of 4-7 percent in 1960. Similar trends in growing unemployment over time are found in other counties throughout much of the region. The economic structure of the Border Region is somewhat unique compared to much of the rest of the U.S. This uniqueness is to some extent epitomized by the relatively high number of jobs in border-related activities, including jobs associated with immigration, customs, and border security.102 On the other hand, employment in manufacturing is especially low relative to much of the rest of the U.S. Along with the Rocky Mountain Region, the U.S.-Mexico Border Region has the lowest rates of employment in manufacturing in the entire nation.103 While there are some manufacturing jobs in the region that are associated with manufacturing processes in the maquiladoras found in neighboring Mexico, such jobs are far from enough to bring the region in line with rates of manufacturing employment found throughout much of the rest of the U.S.104 Trends related to economic distress and agricultural as well as mining activities in the region are largely in contrast to trends elsewhere in the U.S., though a few issues are of note in this regard. First, the Border and Southwest regions are the only two regions in the U.S. where increased employment in agriculture is associated with lower levels of distress, and indeed they are the only two regions where there is any association between agriculture and economic distress.105 Not surprisingly, then, the counties with high employment in agriculture in the U.S.-Mexico Border Region are those typically found away from the border, on the northern edge of the region in somewhat close proximity to the Southwest Region. Many of these counties are in Texas, where ranching activities often help support the local economy. Similar trends are found in the way of mining activities in the region, where a number of counties in the northern areas of Texas have historically had a relatively high number of jobs in the oil and gas industry and have remained non-distressed over time.106
101 See previous footnote. 102 Of all the regions in the U.S., the U.S.-Mexico Border Region has the highest percentage of its labor force employed in what the census defines as ‘public administration.” This type of employment is associated with some of the employment activities as cited. Median employment in public administration in the Border Region is 7 percent. For comparative purposes, the region with the second highest employment in public administration is the Southwest, with 5.8 percent employed in such activities. Regions such as the Mississippi Delta, the Great Lakes, the Plains, New England, and Appalachia all have less than 5 percent, and in some cases less than 4 percent, of their populations working in public administration. At the national level, the county-level median is 4.5 percent. 103 Median county-level employment in manufacturing in the region is 5.5 percent, compared to 5.4 percent in the Rocky Mountain Region and a U.S. county-level median of 15 percent. 104 For information about some of the manufacturing firms’ relationships to manufacturing in Mexico’s maquiladoras, see Vargas (2001), where the author discusses relationships between manufacturing between areas such as El Paso, Texas, and Ciudad Juárez, Mexico. Also note that many manufacturing jobs in Mexico have actually been lost over the past few years, as manufacturers in the region have moved overseas, to countries such as China, to take advantage of lower wages found in such areas. For more information on trends in the loss of manufacturing jobs in Mexico, see for example Forero (2003). 105 See logistic regression models in Appendix C in this regard. 106 For information on some of the particular employment characteristics of such areas, see U.S. Census Bureau “Nonemployer Statistics,” available at www.census.gov.
67

While race was the most important factor related to patterns of distress in virtually all other regions in this analysis aside from Central Appalachia, in combination with other factors related to distress in the region, race does relatively less to explain current as well as growing county-level distress in the Border Region than do other trends, such as issues of educational attainment and occupational structure.107 On the other hand, in the distressed counties in the region, only 54 percent of the population identified as being “White alone” according to the 2000 census, compared to 71 percent identifying as such in the region’s non-distressed counties.108 In general, the Border Region includes a relatively large Hispanic population, and as an entire region it had the largest percent of its population not identifying as “White alone” according to the 2000 census.109 That the racial structure, regionwide, has a relatively greater share of minorities than is found anywhere else in the U.S., and that the Border is the one region in the U.S. that has witnessed exceptionally growing distress over time, is perhaps indicative of trends associated with race and distress in the U.S. more generally. In short, the region has the highest minority population in the U.S. It is also the region that in many ways has fared most poorly according to this analysis. In some respects, increasing distress within the U.S.-Mexico Border Region is somewhat more complex than changing patterns of distress found elsewhere in the U.S. The fact that the region was the one historically distressed region that witnessed growing distress over time is perhaps the first sign of this complexity. Of all the regions in this analysis, the Border Region, along with the Mississippi Delta and Central Appalachian regions, has some of the highest levels of poverty in the U.S. Its current levels of PCMI are the second lowest in the nation, with lower levels found only in Central Appalachia. The region also has the most poorly diversified economy in the U.S.110 These and other various trends do not bode well for the region’s future. In the past, economic distress was not as intense as it is in the region today. Of all the historically distressed regions in this analysis, including Central and Southern Appalachia, the Mississippi Delta Region, the Southwest, and the South, the U.S.-Mexico Border Region had the lowest levels of economic distress in 1960. Along with Central Appalachia, it is now the most economically distressed region in the nation. Historically Non-Distressed Regions of the U.S. The focus of this report has been on patterns of economic distress nationally as well as regionally. As previously indicated, some regions of the U.S. have experienced relatively little economic distress over time, including the New England, Mid-Atlantic, Great Lakes, Plains, Rocky Mountain, and West regions. However, within each of these regions there have been at least 2 or more counties that have had economically distressed conditions during at least one
107 In the logistic regression models in Appendix C related to distress in the region, race was a relatively weak contributor compared to the other variables in the models. It was the weakest statistically significant contributor in the model related to growing distress, and the second least statistically significant contributor in the model related to current distress. 108 These figures are based upon summing across all distressed and non-distressed counties in the region. 109 These figures are based upon summing across the individual counties in any given region. In the Border Region 63 percent of the population identified as being “White alone” according to the 2000 census. The next closest region was the Mid-Atlantic Region, with 69 percent identifying as such. 110 The region as a whole had a diversity index score for 2000 that indicated the region was the least diversified in relation to the entire U.S.
68

Table 24: Historically Non-Distressed Regions (Distressed and Non-Distressed Counties) Median Values for 1960 and 2000
Non-Distressed
1960 (N = 1448)
Distressed 1960
(N = 66)
Non-Distressed
2000 (N = 1466)
Distressed 2000
(N = 48)
Percent in Poverty 22.0 46.1 10.3 25.3 Percent Unemployed 4.3 7.8 3.9 9.3
Per Capita Market Income $1,348 $810 $19,648 $12,524 Per Capita Income $1,543 $976 $23,634 $16,955
Total Population 19,000 6,276 23,774 11,900 Total Urban Population 6,238 0 9,145 1,363
Percent Urban Population 35.3 0 43.6 4.0 Percent Population White na na 95.4 59.5
Percent Dependent Population
47.9 50.9 40.9 43.2
Percent H.S. Graduates 41.8 31.4 83.4 73.9 Percent with “Some College” 14.2 11.1 46.7 43.7
Percent Employed in Agriculture
18.9 44.3 4.7 11.2
Percent Employed in Mining .3 .1 .1 .2 Percent Employed in
Manufacturing 15.8 4.1 14.0 4.8
Percent Employed in Professional Services
13.4 11.2 10.9 8.4
Percent Employed in Non-Prof. Services
35.5 31.0 57.2 63.8
Percent Within or Proximate to Metro Area
na na 62.5 52.1
Diversity Index .69 .30 .80 .52 period of time. Moreover and as previously noted, some areas, particularly the West and Rocky Mountain regions, have recently witnessed growing economic distress. As will be discussed below, even though this analysis largely treats the “historically non-distressed regions” as a single unit of analysis, the social and economic circumstances within each of these regions are in some ways unique. Quite simply, the one trait that many of these regions perhaps share most in common with one another is that they each have had relatively few distressed counties over time, especially in comparison to the more economically distressed regions of the U.S. On the other hand, and as indicated in the previous section of this report, issues of growing income disparity, for example, in some of these areas suggests that the economic circumstances for many people living in these regions may in some ways be difficult. Despite relatively consistent, strong economic conditions in the historically non-distressed regions over time, it is nonetheless worth commenting upon patterns of distress as found in this grouping of regions. Factors associated with economic distress in these areas are in many ways
69

Table 25: Historically Non-Distressed Regions (Counties Remaining Distressed and Graduating from Distress between 1960 and 2000) Median Values
Distressed 1960 not 2000 (1960 rates)
(N = 50)
Distressed 1960 and 2000
(1960 rates) (N = 16)
Distressed 1960 not 2000 (2000 rates)
(N = 50)
Distressed 1960 and 2000
(2000 rates) (N = 16)
Percent in Poverty 45.9 51.6 14.8 32.3 Percent Unemployed 5.0 10.2 4.6 9.1
Per Capita Market Income $814 $793 $16,089 $10,593 Per Capita Income $988 $908 $20,458 $14,960
Total Population 6,851 5,298 6,946 7,186 Total Urban Population 0 0 0 0
Percent Urban Population 0 0 0 0 Percent Population White na na 97.3 37.2
Percent Dependent Population 50.4 52.8 44.7 46.9 Percent H.S. Graduates 32.3 29.0 79.0 73.0
Percent with “Some College” 11.5 10.7 39.8 41.8 Percent Employed in
Agriculture 46.3 40.4 13.3 10.3
Percent Employed in Mining .2 0 .1 .2 Percent Employed in
Manufacturing 4.3 2.6 9.3 2.5
Percent Employed in Professional Services
11.0 13.3 9.0 7.8
Percent Employed in Non-Prof. Services
30.8 32.0 57.0 65.4
Percent Within or Proximate to Metro Area
na na 40.0 25.0
Diversity Index .28 .36 .47 .58 similar to those found in the historically distressed regions of the U.S. For example, county-level distress in the historically non-distressed regions is largely associated with issues of race.111 In particular, in 2000 the median county-level “White alone” population in the non- distressed counties in the historically non-distressed regions was 95 percent, compared to 60 percent in the distressed counties. In the West and Rocky Mountain regions, some of the counties with a relatively large percentage of Hispanic or Native American populations are those that have become distressed in recent years. Moreover, in the Plains Region, the only other historically non-distressed region with more than 3 distressed counties in 2000, economic distress is found in counties with high minority populations, particularly high percentages of
111 The logistic regression model in Appendix C related to distress in the historically non-distressed regions of he U.S. (grouped together as one unit) indicated that, in 2000, factors having a statistically significant relationship with distress included high minority populations; low employment in manufacturing; low employment in professional services; and were counties that tended to be either within or proximate to metropolitan areas (a trend not seen elsewhere except in the model for the West and Rocky Mountain regions alone, which will be discussed below). The unexpected association between distress and metropolitan location in all likelihood is evident of patterns in the West and Rocky Mountain regions in particular, which accounted for 60 percent of all the distressed counties in the model.
70

Table 26: Rocky Mountain and West Regions (Distressed and Non-Distressed Counties) Median Values for 1960 and 2000
Non-Distressed
1960 (N = 351)
Distressed 1960
(N = 7)
Non-Distressed
2000 (N = 329)
Distressed 2000
(N = 29)
Percent in Poverty 18.5 47.9 12.6 21.5 Percent Unemployed 5.5 10.1 5.2 9.4
Per Capita Market Income $1,468 $918 $18,751 $13,371 Per Capita Income $1,689 $1,113 $22,395 $17,795
Total Population 11,620 4,219 19,161 14,413 Total Urban Population 3,982 0 9,069 4,204
Percent Urban Population 35.1 0 52.2 27.7 Percent Population White na na 91.7 72.1
Percent Dependent Population
47.6 51.3 40.5 41.9
Percent H.S. Graduates 46.1 34.4 84.5 76.4 Percent with “Some College” 17.6 14.6 52.2 45.2
Percent Employed in Agriculture
17.6 39.9 5.9 12.3
Percent Employed in Mining .5 1.2 .3 .4 Percent Employed in
Manufacturing 9.5 4.3 7.3 5.2
Percent Employed in Professional Services
13.6 11.8 11.9 8.6
Percent Employed in Non-Prof. Services
39.4 34.6 59.4 63.0
Percent Within or Proximate to Metro Area
na na 58.4 62.1
Diversity Index .60 .36 .74 .49 Native Americans. Furthermore, while the relatively limited number of distressed counties in the historically non-distressed regions are, for the most part, geographically scattered, in the Plains Region economic distress is somewhat clustered, a pattern that reflects trends found in the more distressed regions of the U.S. In particular, distress in the Plains Region is congregated in two areas, particularly those associated with the Pine Ridge, Rosebud, Standing Rock, and Cheyenne River Indian Reservations. The boundaries of economic distress and Indian Reservations in the two clusters of distress in the Plains Region all but precisely match one another. Other factors contribute to economic distress in the historically non-distressed regions of the U.S. as well. As a whole, counties that are distressed in these regions have much lower levels of manufacturing than counties that are not distressed, and the same is true for employment in professional services. At the same time, the distressed counties have much higher levels of employment in agriculture as well as in non-professional services than their non-distressed counterparts. In general, the distressed counties in these regions are very poorly diversified compared to their non-distressed counterparts. On the other hand, it may be of note that many
71

Table 27: Rocky Mountain and West Region (Counties Never Distressed and Entering Distress Between 1960 and 2000) Median Values
Non-Distressed
1960 and 2000 (1960 rates)
(N = 326)
Distressed 2000 not 1960 (1960 rates)
(N = 25)
Non-Distressed
1960 and 2000 (2000 rates)
(N = 326)
Distressed 2000 not 1960 (2000 rates)
(N = 25)
Percent in Poverty 18.2 22.0 12.6 21.3 Percent Unemployed 5.4 7.5 5.2 9.6
Per Capita Market Income $1,480 $1,379 $18,813 $14,000 Per Capita Income $1,695 $1,555 $22,397 $17,856
Total Population 11,371 12,537 19,436 26,507 Total Urban Population 3,968 4,058 9,357 7,681
Percent Urban Population 35.6 33.9 52.7 58.0 Percent Population White na na 91.7 72.2
Percent Dependent Population
47.6 48.8 40.5 41.7
Percent H.S. Graduates 46.3 40.9 84.5 77.1 Percent with “Some College” 17.7 15.4 52.2 45.9
Percent Employed in Agriculture
16.9 30.2 5.9 12.3
Percent Employed in Mining .5 .4 .3 .4 Percent Employed in
Manufacturing 9.9 9.1 7.4 6.0
Percent Employed in Professional Services
13.5 14.0 11.9 9.3
Percent Employed in Non-Prof. Services
39.5 38.0 59.3 62.5
Percent Within or Proximate to Metro Area
na na 58.6 68.0
Diversity Index .62 .50 .74 .50 of the historically non-distressed regions of the U.S. had the greatest losses in manufacturing jobs during the study period. Despite this loss, many counties within these regions have obviously been able to adapt and succeed economically. One issue that has likely helped the economies of these regions over time has been high levels of urbanization. As a group, the historically non-distressed regions currently have some of the highest levels of urbanization in the U.S. Urban agglomerations likely promote issues of economic diversity and employment in professional service-based activities. On the other hand, in the distressed counties of these regions, levels of urbanization are the lowest for any area of the U.S. In the historically non-distressed regions, median county levels of urbanization are only 4 percent in distressed counties, compared to 44 percent in the non-distressed counties. In short, in the historically non-distressed regions of the U.S., the counties that have failed to share in the relative prosperity of their surrounding regions are, quite literally, some of the most rural areas in the entire U.S. In sum, the counties that were distressed in 2000 in the historically non-distressed regions were highly rural, relatively non-White, and had limited economic diversity.
72

The growing economic distress in the West and Rocky Mountain regions warrants at least some comment. As opposed to the historically distressed regions of the U.S., as well as the Plains Region, distress in the Rocky Mountain and West regions is, for the most part, geographically scattered. In 2000, Montana and California had the most distressed counties of all the states in these regions, with 10 and 9 counties meeting the distress criteria respectively. No other state had more than 4 distressed counties, though only Nevada and Wyoming had no distressed counties in these regions in 2000. Trends towards rising distress began in the West and Rocky Mountain regions somewhat recently. In the Rocky Mountain Region, the number of distressed counties grew from 7 in 1980, to 16 in 1990, and then fell to 15 in 2000. In the West the trend of growing distress is even more recent, with the West never having more than 3 distressed counties, and sometimes no distressed counties at all, prior to 2000; however, at that time its number of distressed counties grew to 14. The relatively sudden increase in the number of distressed counties in these regions may only be short-lived and may not be indicative of patterns of long term distress. On the other hand, and what might be a bad sign for many of the counties that have become distressed in the West and Rocky Mountain regions at least in terms of whether or not they will stay distressed, the newly distressed counties in these regions share some similar socioeconomic characteristics with counties that have remained persistently distressed in other regions of the U.S. over time. As previously suggested, trends in growing distress in the West and Rocky Mountain regions are in some ways related to issues of race.112 Most of the counties in Montana that have become distressed over time have relatively high percentages of Native American populations. Counties such as Big Horn, Glacier, Roosevelt, Blaine, and Rosebud, Montana, have 60, 59, 55, 45, and 31percent Native American populations respectively. Other counties in the Rocky Mountain Region that have become distressed over time have relatively high percentages of Native American populations as well, including San Juan, Utah, and Ferry, Washington.113 In the distressed counties of Conejos and Costilla in Colorado, more than half of the population in each is Hispanic, and similar trends are found in the distressed counties of California’s San Joaquin Valley.114 In short, the distressed counties of these regions exhibit trends that are often seen in relation to distress elsewhere: high minority populations; low rates of educational attainment; and low employment in manufacturing as well as in professional services. Some of the currently distressed counties also have especially high employment in agriculture, forestry, and to a
112 A logistic regression model found in Appendix C was developed to assess issues related to growing distress in the West and Rocky Mountain regions combined. The dependent variable was whether a county had not been distressed in 1960 and 2000 or had become distressed by 2000. Statistically significant factors associated with counties becoming distressed in these regions included high minority populations; low employment in manufacturing; and low employment in professional services. Also, and in contrast to all historically distressed regions, counties that were either within or proximate to metropolitan areas were more likely to become distressed in this model. However, and more generally, it is important to remember that this model had a relatively limited number of counties that had become distressed. 113 San Juan, Utah, has a 57 percent Native American population; Ferry, Washington, has an 18 percent Native American population. 114 Based upon 2000 U.S. Census data that defines persons as being “Hispanic alone.” These data are available at www.census.gov.
73

lesser extent, mining.115 The only other region with greater employment in agriculture than the Rocky Mountain Region is the Plains Region, and the West has some of the highest employment in agriculture in the entire U.S. as well.116 Furthermore, the Rocky Mountain and West regions have some of the lowest levels of employment in manufacturing in the U.S., with the Rocky Mountain Region having the lowest employment in manufacturing in the entire nation, followed by the U.S.-Mexico Border and West regions.117 Current high unemployment rates in the West in particular – second only to Central Appalachia – are perhaps a signal of potential long-term problems for much of the region.118 In general, considering some of the social and economic conditions of the counties that have become distressed in the West and Rocky Mountain regions over time, it should perhaps not be surprising that these areas have become distressed. Recent, growing distress in the Rocky Mountain and West regions in some ways typifies how the historically non-distressed regions in this analysis, and indeed all of the regions of this analysis, have experienced somewhat different economic and social circumstances over time. Even amongst the historically non-distressed regions of the U.S., the range of socioeconomic circumstances has been, and continues to be, by some measures vast. Comparing the Plains Region to the Mid-Atlantic Region, for example, indicates the potential for considerable contrasts in socioeconomic characteristics even in historically non-distressed regions, with population and urbanization differences between these two regions being enormous.119 Similar differences are apparent when comparing the economies of these two regions. For example, in comparison to all other regions in the U.S., the Plains Region currently has the greatest percent of its workforce employed in agriculture, the Mid-Atlantic Region the least.120 It would indeed be possible to point out a number of other differences between the various, historically non-distressed regions of the U.S. as well. In short, the varying social and economic experiences of each of these historically non-distressed regions suggest that maintaining economic vibrancy does not necessarily follow a prescribed course of action. In general, whether assessing why a particular county or region is distressed or non-distressed, patterns can often be consistent when compared to counties or regions elsewhere. They can also be different.
115 To cite a few examples in this regard, the following counties had the following percent of its labor force employed in agriculture according to the 2000 census: Glacier, Montana, 59 percent; Saguache, Colorado, 22 percent; Valley, Kings, and Madera counties in California, 14 percent; Malheur, Oregon, 14 percent. In terms of mining, Rosebud, Montana had 9 percent of its labor force employed in that sector. 116 The median county-level employment in agriculture in the Plains Region in 2000 was 9.6 percent. In the Rocky Mountain Region it was 8.4 percent and in the West it was 5 percent. The U.S. county-level median in this regard was 3.8 percent. 117 For the regions as a whole, the county-level medians for employment in manufacturing in 2000 was 5.4 percent in the Rocky Mountain Region, 5.5 percent in the Border Region, and 9.7 percent in the West. The U.S. county-level median in 2000 was 15 percent. 118 In 2000, median county-level rates of unemployment in the West Region were 7.1 percent. Only Central Appalachia had higher rates of unemployment. 119 For example, the Mid-Atlantic Region had the highest median county-level population in the U.S., almost 20 times that of the Plains Region. 120 Median county-level employment in agriculture in the Plains Region in 2000 was 9.6 percent, compared to 0.9 percent in the Mid-Atlantic Region.
74

Part VI: Conclusion This analysis provides a range of interpretations of historical and contemporary economic conditions in the U.S. When gauged utilizing the ARC’s distress measure, there are clear indications of improving economic conditions throughout much of the nation over time. Appalachia, for example, has seen its number of distressed counties drop by more than half between 1960 and 2000. The South has also experienced significant improvement according to the ARC’s distress measure, as has the Mississippi Delta Region and the Southwest. Nevertheless, a large number of counties are still distressed, and have remained persistently distressed, in many of these regions. In Appalachia, for example, more that 20 percent of all counties were distressed in 2000, while in the subregion of Central Appalachia close to half of all counties currently meet the distress criteria. Furthermore, areas such as the U.S.-Mexico Border, West, and Rocky Mountain regions have witnessed growing economic problems over time according to the ARC’s distress indicator. While a distress measure may be a useful mechanism for understanding economic processes and change, some of these processes can be masked by the measure itself. As has been shown in this analysis, for many counties and regions throughout much of the U.S., absolute levels of unemployment are no different now than they were in the 1960s. In some areas unemployment has grown much worse. Meanwhile, income disparities have intensified in many regions of the nation. Indeed, some of the individual components of the distress measure suggest that, at least in some parts of the U.S., greater economic problems exist in 2000 than existed in the 1960s. Thus, while the distress measure as a whole provides an indication of broadly improving economic conditions throughout the U.S. over time, the individual components of the measure indicate a pattern of economic disparity emerging within and between regions, especially over the past two decades. In short, this analysis indicates that difficulty of measuring regional and national economic distress. On the other hand, the ARC’s distress measure is not without merit. By utilizing a number of economic indicators, the measure offers the ability to identify counties with the absolute worst economic conditions in the U.S. or within any given region. This identification is a necessary procedure for agencies such as the ARC, the Delta Regional Authority, and others when attempting to allocate scarce resources to areas that are perhaps most in need of assistance. From a political perspective, the process of creating federally supported regional development commissions through the passage of federal legislation depends upon widespread support from congressional delegates representing a geographic subset of states. Often the regions identified for federal government assistance have been much larger than the chronically distressed areas within such regions.121 However, once created, such commissions are then confronted with the need to identify and direct resources to areas of greatest concern, usually through measures of economic distress. 121 See Widner (1990) for a discussion of the broad political support necessary from a number of states, including those in the northeast and southern parts of the U.S., to get the ARDA passed. The Northern Great Plains Regional Authority is also fairly broad in geographic scope, and several proposals before Congress at this time, including for commissions that would serve areas such as the “Black Belt” and “Southern Crescent,” would involve areas that are especially broad in geographic scope.
75

The ARC has been successful in focusing on distressed areas, especially during the more recent years of its existence. The commission currently allocates approximately 50 percent or more of its resources to distressed counties in the Appalachian Region. In addition, by utilizing an extension of the distress measures, the ARC has directed the majority of its remaining funds to counties recognized as being borderline distressed – counties that do not quite qualify as being distressed according to the ARC’s distress measure, but nonetheless have relatively poor economic conditions compared to the remaining counties in Appalachia.122 On the other hand, and perhaps not coincidentally, the ARC has managed to concentrate its resources in the region’s relatively worst areas during the last couple of decades when the ARC has worked with relatively limited resources. By contrast, at the federal government level, over the past couple of decades national policy efforts to direct funding to distressed areas of the U.S. have been absent. The ARC is not unique in its efforts to designate distressed areas for purposes of resource allocation, and indeed the ARC’s distress measure has served as a model to other agencies, such as the Delta Regional Authority. The distress measure and similar measures provide a useful means for regional development agencies to identify long term, structural economic problems in local and regional economies. However, whether or not agencies such as the ARC and the Delta Regional Authority will ever have sufficient resources to address such problems is an entirely different issue. Indeed, the success that such commissions might have in identifying and allocating resources to the areas of greatest need must be understood within the context of the limited budgets with which these commissions operate. Moreover, many regions of the U.S. that are experiencing persistent or growing economic distress do not even have federally supported commissions to address such concerns. Another finding of this report is that regional patterns of economic distress in areas such as the South, the Southwest, the Mississippi Delta, and the U.S.-Mexico Border Region, are often geographically contiguous and typically transcend state borders. Widespread areas of distress found within these regions are logical candidates for federally coordinated, regionwide efforts, especially when considering the multi-state areas in which distress is often found. Addressing issues of economic distress in such regions may in fact not be possible without significant financial support from the federal government, as the fiscal capacities of local and state governments within these regions may be insufficient for addressing relatively widespread and historically entrenched economic problems. Addressing such distress may also necessarily require coordination at the federal level, as it is unclear that the individual localities and states that share problems of regionwide distress have the political means in place to effectively address these issues. Agencies such as the ARC can lend insight into how local, state, and federal authorities might work together to address regional economic distress. Indeed, the ARC and similar regional development commissions operate and are founded upon coordinated federal, state, and local efforts. In short, endeavors to alleviate economic distress in particular
122 This is based on another analysis conducted by the author that assessed ARC funding provided to distressed, transitional, competitive, and attainment counties within the Appalachian Region, with the distressed counties having the worst economic conditions in Appalachia, followed by transitional and then competitive counties. Attainment counties have economic conditions that are generally better than the national average. Distressed and transitional counties have received approximately 90 percent or more of all ARC non-highway development funds in recent years. The remaining non-highway funds have generally gone to competitive counties in the region, with attainment counties having received relatively little, if any, ARC non-highway funding in recent years.
76

regions of the country may necessarily require initiation at the federal level, and federal support and coordination will almost undoubtedly be necessary for such efforts to be successful. An additional finding of this report is that there are unique socioeconomic circumstances giving rise to particular regional concentrations of economic distress. This finding provides an additional rationale for the formation of specific regional commissions to address distressed regions. For example, relatively high employment in manufacturing in Appalachia has had different associations with economic fortunes for some counties in the region, with some rising out of distress due to manufacturing growth, while others have declined into distress due to industrial shutdowns. Meanwhile other areas, such as the U.S.-Mexico Border, West, and Rocky Mountain regions, have historically had very little employment in manufacturing and in all likelihood will never have much employment in that sector. Another example is the varied role of metropolitan location in economic development, with counties in some regions emerging from economic distress due to spillover effects from urbanization, while counties in other regions of the country will never find themselves in close proximity to large urban areas. In short, economic distress and potential can be regionally specific. Meanwhile, some trends associated with economic distress are fairly consistent across space, such as low rates of educational attainment, limited employment in professional service activities, and narrow economic diversity. Similarly, one fairly consistent trend that emerges in this analysis is the association between race and economic distress. In fact, it is quite possible that the results of this analysis may underemphasize issues of race as this research does not capture economic problems experienced by a number of people living in the nation’s larger cities. As a regional analysis, this report captures only broad trends related to economic distress. At this level, the trends are very clear: issues of unemployment, low income, high poverty, and race frequently go hand in hand. Whether it is rural Black poverty in the South, entrenched poverty found on many Native American reservations, or the growing distress found in the U.S.-Mexico Border Region, associations between regional distress and race are undeniable. Yet this is not to say that there are not a lot of Whites living in poverty in the U.S. as well. One needs to look no farther than Central Appalachia for evidence. And while it is certainly true that a number of counties throughout the U.S. with high minority populations are currently not distressed and have never been distressed, the counties and regions that have been persistently distressed invariably share one characteristic in common: a relatively high level of minorities. In conclusion, this analysis points to the existence of clear pockets of economic distress that exist in various regions of the country. No matter what indicator is used, certain trends and patterns remain consistent, including persistent distress in areas such as the Mississippi Delta Region, Central Appalachia, and areas of the South and Southwest. Meanwhile there are growing economic problems in the West and Rocky Mountain regions, areas that are now teetering on more widespread regional distress; and a deepening pattern of distress found in the U.S.-Mexico Border Region, which in the 1960s had relatively few distressed counties but can now be considered a region of full blown economic distress. The current economic structures and social circumstances found in many if not all of these regions suggest a likelihood for continued problems in the future.
77

In the existing political climate, however, it seems unlikely that such problems will be actively addressed. The political mindset has disappeared that led to the establishment of agencies such as the ARC and EDA in the 1960s, and that funded these agencies with significant budgets. Current funding for federal regional development efforts clearly reflects indifference to such matters. Nevertheless, whether by coincidence or not, one thing is clear: as the federal government has retreated from its regional development activities, a pattern of stagnation and in some instances increasing economic distress in the U.S. has emerged. Whether or not increasing economic distress and the retreat from regional development ambitions are related to one another, a number of questions certainly arise, including whether it is reasonable for the federal government to continue backing off from regional development programs precisely at a time when the regions examined in this report are experiencing economic distress, if not even greater distress, than they were in the 1960s. This analysis has identified patterns associated with economic distress, regionally as well as nationally. In taking a broad regional view, this study does not identify issues associated with economic distress at relatively small scales of analysis, such as within some of the major urban areas of the U.S. Indeed, similar pockets of poverty exist within most of our nation’s cities, but in assessing issues of economic distress at the national and regional levels, this research does not necessarily capture such trends. It is certainly true that any given community in the U.S. has people living in poverty. Some federal programs attempt to address problems of individual poverty, while state and local agencies often have various initiatives to address similar social and economic concerns. This report has assessed and identified issues of economic distress that are regional in scope. Regional economic problems, at least to some extent, likely merit a regional response. The federal government has made various attempts over time to address such issues, but funding for these efforts has remained low over the past two decades. At this time, many Americans are not wanting for decent jobs, large homes, and luxury commodities. Other Americans, however, are clearly not enjoying such prosperity. By many measures, modern American society is the richest nation the world has ever known, but within this nation tens of millions of people are living in poverty. Poor people are found in perhaps any given community. Widespread poverty is found in very distinct regions of the country. America certainly has the financial resources to attempt to address regional economic distress. Whether or not the nation does so will be a matter of political and social judgment.
78

Bibliography Appalachian Regional Commission (ARC). Appalachian Regional Development Act. Originally
U.S. Congress Public Law 94-188. Washington, DC: Government Printing Office, 1965. Reprinted by the Appalachian Regional Commission.
Appalachian Regional Commission (ARC). State and Regional Development Plans in
Appalachia: 1968. Washington, DC: Appalachian Regional Commission, 1968. Appalachian Regional Commission (ARC). The Urban-Rural Growth Strategy in Appalachia.
Washington, DC: Appalachian Regional Commission, 1970. Bradley, David H., Herzenberg, Stephen A., and Wail, Howard, An Assessment of Labor
Forces Participation Rates and Underemployment in Appalachia, Harrisburg, PA, Keystone Research Center, August 2001.
Congressional Record. December 27, 1960: 10-13. Couto, Richard. Beyond Distress: New Measures of Economic Need in Appalachia. Knoxville,
TN: Commission on Religion in Appalachia, 1992. Ebdon, David. Statistics in Geography. Oxford: Blackwell Publishers, 1985. Forero, Juan. “As China Gallops, Mexico Sees Factory Jobs Slip Away.” New York Times,
September 3, 2003. Friedmann, John. "The Concept of a Planning Region: The Evolution of an Idea in the United
States." In Regional Development and Planning: A Reader, ed. John Friedmann and William Alonso. Cambridge, MA: The M.I.T. Press, 1964
Fullenbaum, Richard, and Mariana McNeill. Survey and Comparison of Distressed Area
Definitions. Washington, DC: Appalachian Regional Commission, 1995. Galston, William A., and Karen J. Baehler. Rural Development in the United States:
Connecting Theory, Practice, and Possibilities. Washington, D.C.: Island Press, 1995. Gilmer, Robert W., Matthew Gurch, and Thomas Wang. Texas Border Cities: An Income
Growth Perspective. Dallas, TX: Federal Reserve Bank of Dallas, 2001. Glasmeier, Amy K., and Kurtis G. Fuellhart. Building on Past Experiences: Creating a New
Future for Distressed Counties. State College, PA: Institute for Policy Research and Evaluation, 1999.
Hammer, Roger. Recent Trends in Poverty in the Appalachian Region: Implications of the U.S. Census Bureau Small Area Income and Poverty Estimates on the ARC Distressed Counties Designations. Madison, WI: Applied Population Laboratory, University of Wisconsin, August 2000.
79

President's Appalachian Regional Commission (PARC). Appalachia: A Report by the President's Appalachian Regional Commission. Washington, DC: US Government Printing Office, 1964.
Public Works and Economic Development Act (PWEDA) of 1965, 89th Congress, 1st session,
May 14, 1965. Rothblatt, Donald N. Regional Planning: The Appalachian Experience. Lexington, MA: D.C.
Heath and Company, 1971. Ruggles, Patricia. Drawing the Line: Alternative Poverty Measures and Their Implications for
Public Policy. Washington DC: Urban Institute, 1990. Schiller, Bradley. The Economics of Poverty and Discrimination. Englewood Cliffs, NJ:
Prentice Hall, 1995. Selznick, Philip. TVA and the Grass Roots. New York, NY: Harper and Row Publishers, Inc.,
1966. Thoman, Richard S. Appalachia After Ten Years. A paper delivered at the Paper Presented to
the Third Symposium, Commission on Regional Aspects of Development, International Geographical Union, Dushanbe, USSR, July 1976.
Vargas, Lucinda. Maquiladoras Impact on Texas Border Cities. Dallas, TX: Federal Reserve
Bank of Dallas, 2001. Widner, Ralph R. "Appalachian Development After 25 Years: An Assessment." Economic
Development Quarterly 4, no. 4: 291-312, 1990. Wood, Lawrence E. "From Theory to Implementation: An Analysis of the Appalachian
Regional Commission's Growth Center Policy." Environment and Planning A 33(3): 551-565, 2001
Wood, Lawrence, and Amy Glasmeier. EDA Expenditures Analysis: Preliminary Findings.
Working paper available at www.onenation.psu.edu, 2003. Wood, Lawrence E., and Gregory A. Bischak. Progress and Challenges in Reducing
Economic Distress in Appalachia: An Analysis of National and Regional Trends Since 1960. Washington, DC: Appalachian Regional Commission, 2000.
80