trends in quantity of political advertising by alyssa ray
TRANSCRIPT

Trends in Quantity of Political Advertising
Trends in Quantity of Political Advertising
By Alyssa Ray

Has Political Advertising Has Political Advertising Increased or Decreased in Increased or Decreased in
Recent Years?Recent Years?

0
500
1,000
1,500
2,000
2,500
3,000
3,500
1998 2000
By the Numbers….Congressional Elections
0
100,000
200,000
300,000
400,000
500,000
600,000
700,000
800,000
900,000
1,000,000
1998 2000
Number of Ads Number of Times Aired
*Source: Buying Time 2000 Executive Summary

By the Numbers…Independent Groups’ Ads
0
20000
40000
60000
80000
100000
120000
140000
160000
1998 20000
10
20
30
40
50
60
70
80
90
100
1998 2000
Number of Ads Cost (In Millions)
*Source: Buying Time 2000 Executive Summary

0100200300400500600700800900
1000
2000 2002 2004
Presidential
Senate
House
Governors
Local
Issues
Cost (In
Millio
ns)
Year
Total Spending on Political Media, by Candidates
Total Presidential Senate House Governors Local Issues
2004 $2,681 $990 $525 $556 $149 $213 $248
2002 $1,617 $0 $278 $293 $752 $141 $154
2000 $1,205 $305 $301 $258 $92 $119 $129
*Source: PQ Media

Trend FactorsTrend Factors
1. Quantity of Advertising Sources
2. Start of Campaign
3. Quantity of Funds
4. Number of Candidates
5. Interest of Voters
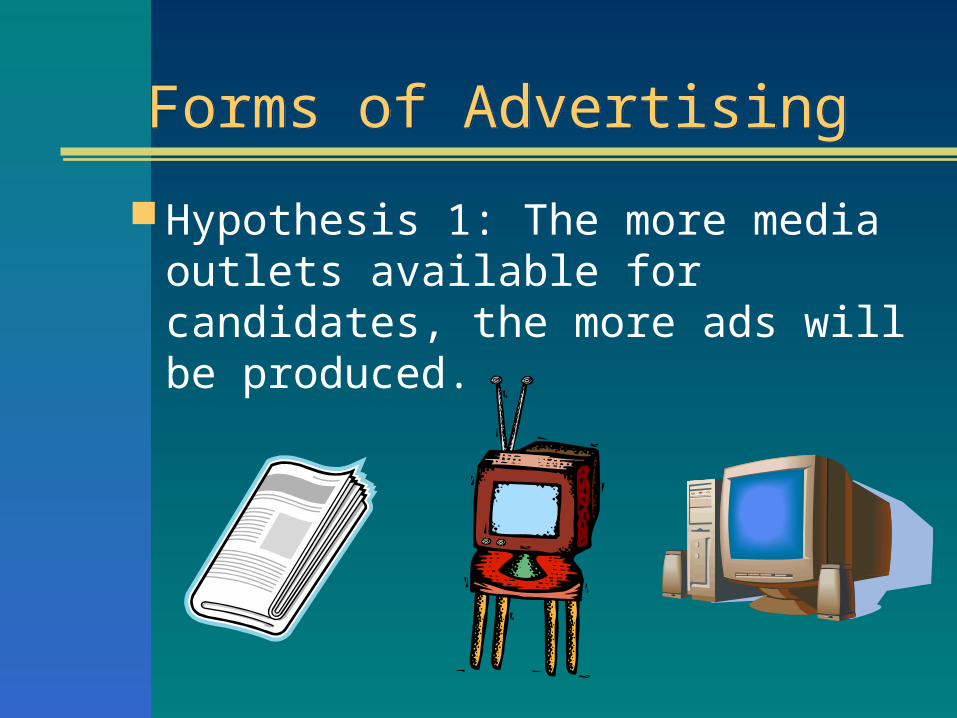
Forms of AdvertisingForms of Advertising
Hypothesis 1: The more media outlets available for candidates, the more ads will be produced.

Forms of Political Forms of Political AdvertisingAdvertising
Forms of Political Forms of Political AdvertisingAdvertising
Newspaper/Print Media: (1704) Newspaper Ads, Flyers, Pamphlets.
Radio: (1924) Campaign Speeches, Debates, Ads.
Television: (1952) Spot Ads, Speeches, Debates, News Reports.
Internet: (1990’s) Campaign Ads, YouTube, Websites, Speeches, Debates.
0
200
400
600
800
1000
1200
1400
1600
2000 2002 2004
Broadcast TV
Direct Mail
PR/Promo
Radio
Cable
Newspapers
Online
Outdoor
Magazines
Cost (in
m
illion
s)
Year
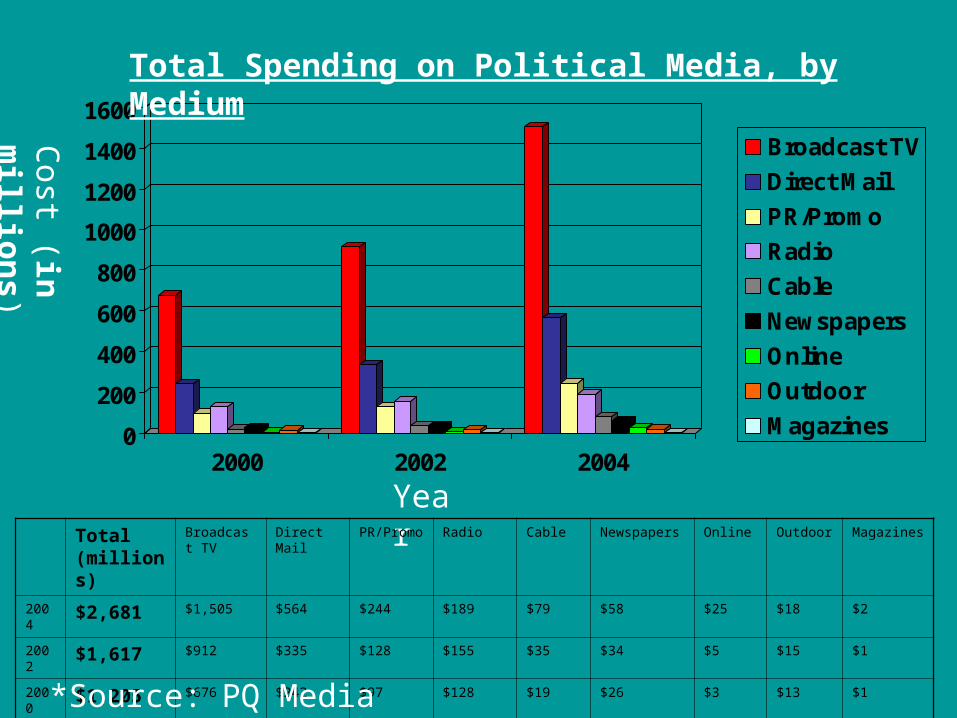
Total Spending on Political Media, by Medium
Total (millions)
Broadcast TV
Direct Mail PR/Promo Radio Cable Newspapers Online Outdoor Magazines
2004 $2,681 $1,505 $564 $244 $189 $79 $58 $25 $18 $2
2002 $1,617 $912 $335 $128 $155 $35 $34 $5 $15 $1
2000 $1,205 $676 $242 $97 $128 $19 $26 $3 $13 $1
*Source: PQ Media

Start of CampaignStart of Campaign
Hypothesis 2: The earlier the entrance into the campaign, the more ads will be produced.

2000 Election vs. 2008 Election
2000 Election vs. 2008 Election
20001) George W. Bush (R): 821 days before election
2000 Total Spending: $865.4 million, 71.8% of total expenses
20081) Duncan Hunter (R): 625 days before election
2) Mitt Romney (R): 622 days before election– Ads: 10,000 thus far: record breaking for one candidate
2008 Total Spending?
*Source: Nielsen Market Research, PQ Media, TNS Media Intelligence

2008 PRESIDENTIAL CAMPAIGN TELEVISION & RADIO SPOTSThe Number of Television & Local Radio Ads (TV through-6/10/07, Radio 5/27/07)
CandidateTV
TotalNat'l Cable
Local Radio
Local TV
Total
IA NH VT SC FL GA MI DC CA
Mitt Romney (R) 4,549 297 378 4,252 2,036 788 572 386 319 96 55 - -
Bill Richardson (D) 2,232 - - 2,232 1,931 301 - - - - - - -
Chris Dodd (D) 1,664 4 - 1,660 1,280 380 - - - - - - -
John Edwards (D) 68 - - 68 45 - - - - - - 23 -
Duncan Hunter (R) 34 - - 34 - - - 22 - - - 12
Rudolph Giuliani (R) - - 642 - - - - - - - - - -
Total 8,547 301 1,020 8,246 5,292 1,469 572 408 319 96 55 23 12
*Source: Nielsen Monitor-Plus

Quantity of FundsQuantity of Funds
Hypothesis 3: The more money a candidate raises, the more ads will be produced.

Quantity of Funds

Democratic Candidates
Candidate Home State Q2 Raised Q2 Spent Total Raised Total Spent Cash on Hand Debts
Clinton, Hillary NY$27,021,358
$12,769,306
$63,075,927
$17,849,095
$45,226,832
$3,026,522
Obama, Barack IL$33,120,440
$16,042,388
$58,912,520
$22,648,832
$36,263,688
$922,848
Edwards, John NC$9,097,495
$6,485,422
$23,129,158
$9,785,203
$13,343,954
$333,586
Richardson, Bill NM$7,090,278
$4,983,067
$13,339,633
$6,209,949
$7,129,684
$61,104
Dodd, Chris CT$3,280,384
$4,384,580
$12,076,091
$5,697,820
$6,378,271
$0
Biden, Joe DE$2,451,180
$2,517,654
$6,461,745
$3,691,828
$2,772,442
$0
Kucinich, Dennis OH$757,035
$707,653
$1,117,566
$902,355
$213,269
$0
Gravel, Mike AK$130,510
$99,866
$238,745
$207,604
$31,141
$64,716
Democratic Fundraising 2008

Republican Candidates
Candidate Home State Q2 Raised Q2 Spent Raised Spent Cash on Hand Debts
Romney, Mitt MA$20,997,715
$20,739,814
$44,432,350
$32,310,796
$12,121,554
$8,945,028
Giuliani, Rudy NY$17,599,292
$11,222,806
$35,629,265
$17,303,045
$18,326,220
$0
McCain, John AZ$11,591,044
$13,071,657
$25,328,694
$21,926,631
$3,224,428
$1,783,523
Brownback, Sam KS$1,425,767
$1,798,493
$3,321,965
$2,861,729
$460,236
$0
Paul, Ron TX$2,369,453
$539,517
$3,009,997
$655,142
$2,354,855
$0
Tancredo, Tom CO$1,466,188
$1,474,791
$2,807,879
$2,209,606
$598,451
$15,000
Hunter, Duncan CA$814,417
$874,042
$1,352,941
$1,140,014
$212,927
$0
Huckabee, Mike AR$765,873
$702,622
$1,310,753
$873,584
$437,169
$31,045
Thompson, Tommy WI$486,555
$504,631
$890,398
$768,750
$121,648
$127,434
Republican Fundraising 2008

RegulationsRegulations
1. Source Requirements: Who May Fund?• Politicians’ funding, government, donations from
individuals, interest groups, etc.• Online (YouTube)?
2. Disclosure Requirements: Of Advertisers• Explain to FEC (Federal Election Commission)
3. Sponsorship Requirements: What Advertisers Can Say• Self-Promotion vs. Candidate Focus
(1934) “Equal Time Provision” of Communication Act
Federal Regulations on $ Given to Candidates

Number of CandidatesNumber of Candidates
Hypothesis 4:
The more serious candidates in the race, the more ads will be run.

Number of CandidatesNumber of Candidates Increase in number of serious candidates running for office
(Includes Republicans, Democrats, Green, Independent, Libertarian, etc.)
– 1980: 10– 1984: 11– 1988: 19– 1992: 14– 1996: 14– 2000: 15– 2004: 17– 2008: 47* 0
5101520253035404550
1980 1988 1996 2004
Candidates
1984 1990 2000 2008
*Source: politics1.com informtaion

Interest of VotersInterest of Voters
Hypothesis 5:
Due to the increase in candidates (Hypothesis 4), more ads are run in order to grab viewers attention.

Interest of VotersInterest of Voters
Candidate Awareness: 3-4 ads weekly Messages Retained:
– Empty Field: 6-7 ads weekly
– Crowded Field: 10-12 ads weekly
*Source: J.M. Hutchens The Manship School guide to Political Communicating

ConclusionsConclusions
1998-2000: Increase in money, increase in ads.
2000-present: HUGE increase in money spent on ads, but percentage wise, less focus on the quantity of ads themselves.
IN GENERAL: Increase in money!