trends in stadium and arena …afenn/web/ec 389...trends in stadium and arena construction,...
TRANSCRIPT
TRENDS IN STADIUM AND ARENA CONSTRUCTION, 1995-2015
Mayya M. Komisarchik and Aju J. Fenn*
Department of Economics and Business, Colorado College, Colorado Springs CO
USA *Corresponding author: Aju J. Fenn 14 E Cache La Poudre St., Colorado Springs, CO 80903. Phone: 719-389-6409 (voice), 719-389-6927 (fax). E-mail: [email protected]

2
TRENDS IN STADIUM AND ARENA CONSTRUCTION, 1995-2015
3
Abstract: A total of 56 stadiums and arenas opened between 1995 and 2009 including: 17 new baseball stadiums, four basketball arenas, nine hockey arenas, seven dual use NBA/NHL venues and 19 football fields. And it’s far from over: the San Francisco 49ers, San Diego Chargers, New York Giants, New York Jets, Minnesota Vikings, Oakland Athletics, Florida Marlins, Tampa Bay Rays, Minnesota Twins, Sacramento Kings, Orlando Magic, New Jersey Nets, New York Islanders and Pittsburgh Penguins anticipate new arenas by 2015. This paper summarizes recent and emerging trends associated with the capacity, cost, public subsidy and accompanying legislative characteristics of stadium and arena construction.

4
Introduction
“You get two messages from the voters: Don’t use public money for ball parks to pay for the greedy owners, but don’t you
dare let these teams leave;” then – Mayor Tom Murphy responded to Pittsburgh voters’ 1997 rejection of a referendum that would
have raised taxes to finance PNC Park (Delaney and Eckstein 2003). Regardless, PNC Park was completed in 2001 after the city
Regional Asset District, and subsequently state legislators, met to approve $5632 million worth of public funds for the project in 1998.
Friction between the public demand for major league stadiums and its willingness to subsidize them has hardly abated in the past
decade. Reservations about public expenditures have not appeared to dampen the stadium-building momentum; perhaps this is why a
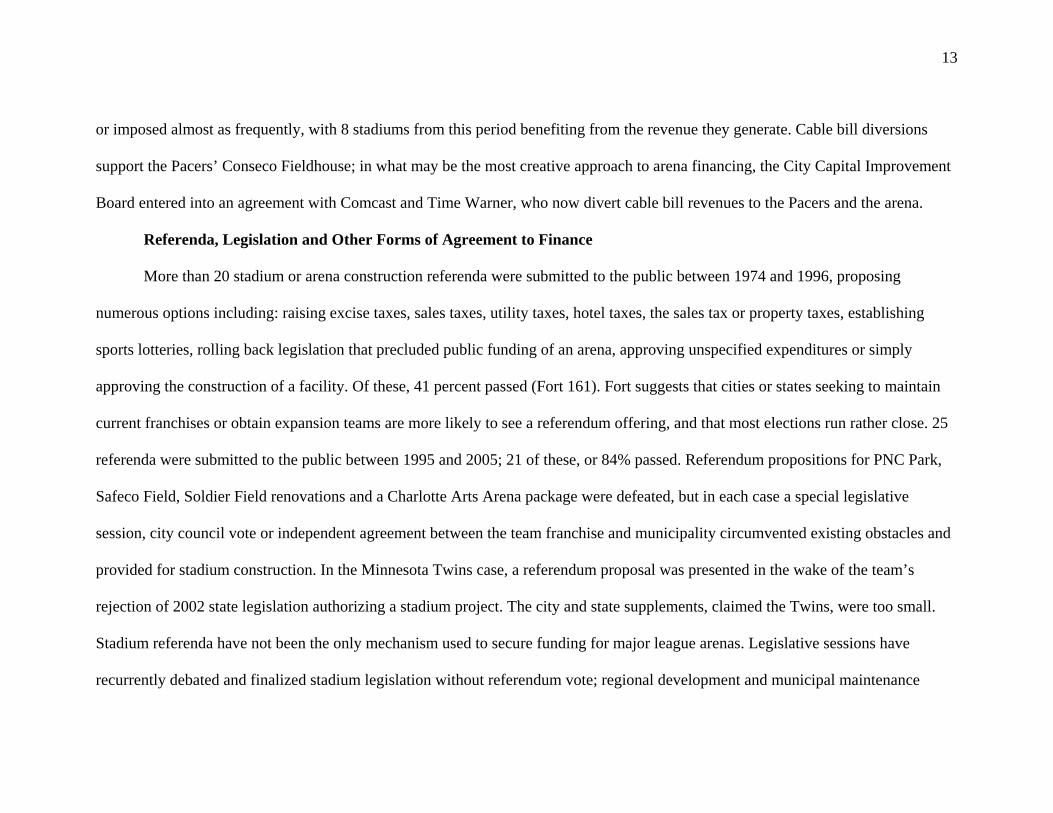
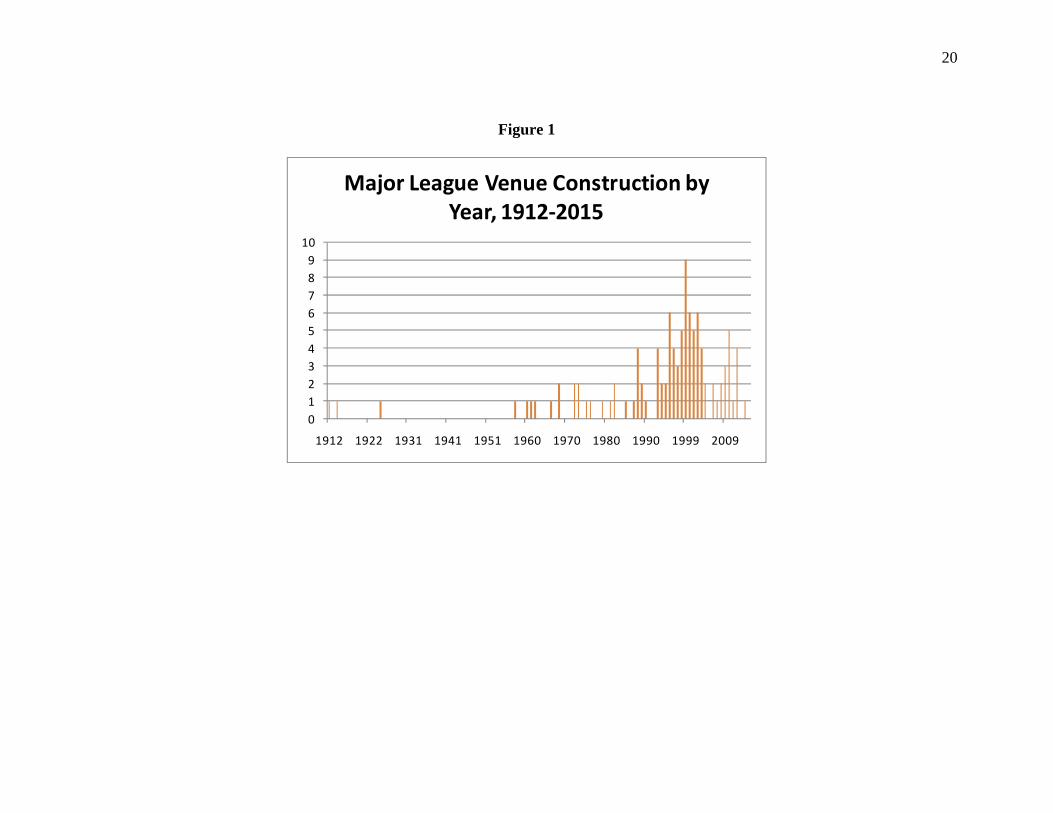
total of 56 stadiums and arenas opened between 1995 and 2009, including: 17 new baseball stadiums, four basketball arenas, nine
hockey arenas, seven dual use NBA/NHL venues and 19 football fields. On face arena construction has visibly accelerated; in the 15
years between 1995 and 2010, US major league sports teams will have built more new arenas than were erected between 1960 and
1990 (Quirk and Fort 1997). Figure 1 compares numbers of athletic venues opened since the 1912. The stadium boom is far from over:
the San Francisco 49ers, San Diego Chargers, New York Giants, New York Jets, Minnesota Vikings, Oakland Athletics, Florida

5
Marlins, Tampa Bay Rays, Minnesota Twins, Sacramento Kings, Orlando Magic, New Jersey Nets, New York Islanders and
Pittsburgh Penguins anticipate new arenas between 2010 and 2015.
The purpose of this paper is to summarize recent and emerging trends in stadium and arena construction for all four U.S. major
league sports. Stadiums consume substantial portions from state and municipal coffers, and current, relevant evaluations of their
impact become increasingly critical as each new project breaks ground. Such a synoptic study of stadium characteristics has not been
published recently. We focus on stadiums and arenas built between 1995 and 2009, paying additional attention to franchise-
municipality arrangements that should yield stadiums between 2010 and 2015. Section 1 compares numbers of arenas in use built
before and after 1995. Section 2 describes changes in the capacities of stadiums and arenas built before and during this period; section
3 contains observations about the costs of newer stadiums and arenas, and compares them to parallel figures for older venues.
Financing options and patterns evident in municipal stadium financing behavior are outlined in section 4, and complementary
legislative measures are detailed in section 5.
Data Description
Data in the first half of the paper presents opening dates of stadiums and arenas, their capacities, total costs and the breakdown
of public and private shares. Newer facilities are highlighted. Any comparative costs in the text are expressed in 2000 U.S. dollars;
CPI data provided by the Bureau of Labor Statistics was used to deflate nominal stadium costs. Data in the second half elaborates on
public financing methods and the legislative or administrative histories of stadium initiatives by sport and stadium. Note that public
6
and private shares will not always sum to the total listed cost. This occurs because public funding packages frequently include
additional resources for infrastructure, or cover sports and other entertainment facilities in clusters; the exact uses of public stadium
funds are consequently impossible to distinguish in some cases. Tables 3 and 4 show different capacity values for the same facilities
because venues shared by the NBA and NHL have different seating structures for the two sports as well as concerts and other events
(these are not included in the data). The costs of dual use arenas are figured into the average costs of NBA and NHL arenas because
both teams have historically contributed resources to those construction projects. To avoid double counting, these values are omitted
from total numbers of arenas constructed, costs and referenda.

7
Overview of Current Stadium Studies
A wealth of literature examines the economic and political consequences of stadium and arena construction. Contemporary
studies of major league facilities can be classified broadly into four categories: studies in the first group assess the real economic
benefits of stadiums to their host cities or counties (Baade and Dye 1990, 2001, Noll and Zimbalist 1997); accounts in the second
category model the impacts of a new stadium on the value of a franchise (Alexander and Kern 2004, Clapp and Hakes 2005, Coates
and Humphreys 2005, Leadley and Zygmont 2005); papers in the third group are characterized by examinations of the motivations for,
and outcomes of, public financing for stadiums (Carlino and Coulson 2004, Groothius, Whitehead and Johnson 2001, Groothius and
Whitehead 2004, Keating 1999, Grant-Long 2005, Baade and Matheson 2005, Owen 2003, Weiner 2004), and the final collection of
studies addresses particular legislative cases or patterns (Turner and Marichal 1998, Coates and Humphreys 2003). One additional
2005 study by Baade and Matheson supplies a nearly exhaustive analysis of stadium construction trends up to 2003 for the NFL only.
Their most salient findings are reviewed later in this paper. Our contribution to what is a rich body of work will be a comprehensive,
up to date index of stadium information providing insight on trends across both the four major league sports and accompanying
movements in finance and legislation. We likewise include available data on future major league stadiums and arenas; these facilities
drastically shift the aggregate figures describing stadium trends, and have pivotal ramifications for the public sector.

8
Stadium and Arena Construction 1995-2010
The number of functional stadiums and arenas opened to the public before 1990 is dwindling. Nine MLB venues remain,
among them Fenway Park (1912) and Wrigley Field (1914). Seven NBA arenas are still in use, three NHL arenas, one shared
NBA/NHL arena, 11 NFL fields and Oakland-Alameda Coliseum (formerly McAfee Coliseum) – the only facility still shared by
baseball and football - remain. Arena sharing has virtually disappeared from the NFL and MLB, while numerous relatively new
facilities continue to serve both NBA and NHL teams in the same location.
Capacity Trends
In 1950, the median capacity for a Major League Baseball field was 36,677, 10,000 for an NBA arena3, 13,350 for an NHL
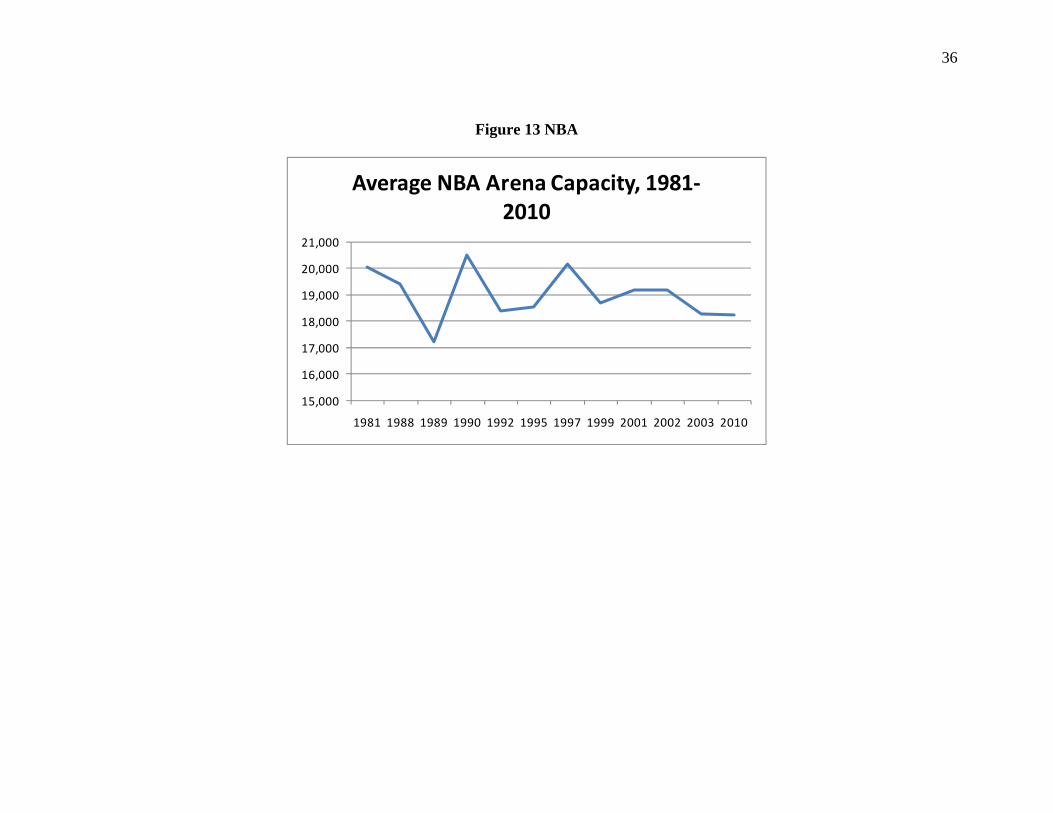
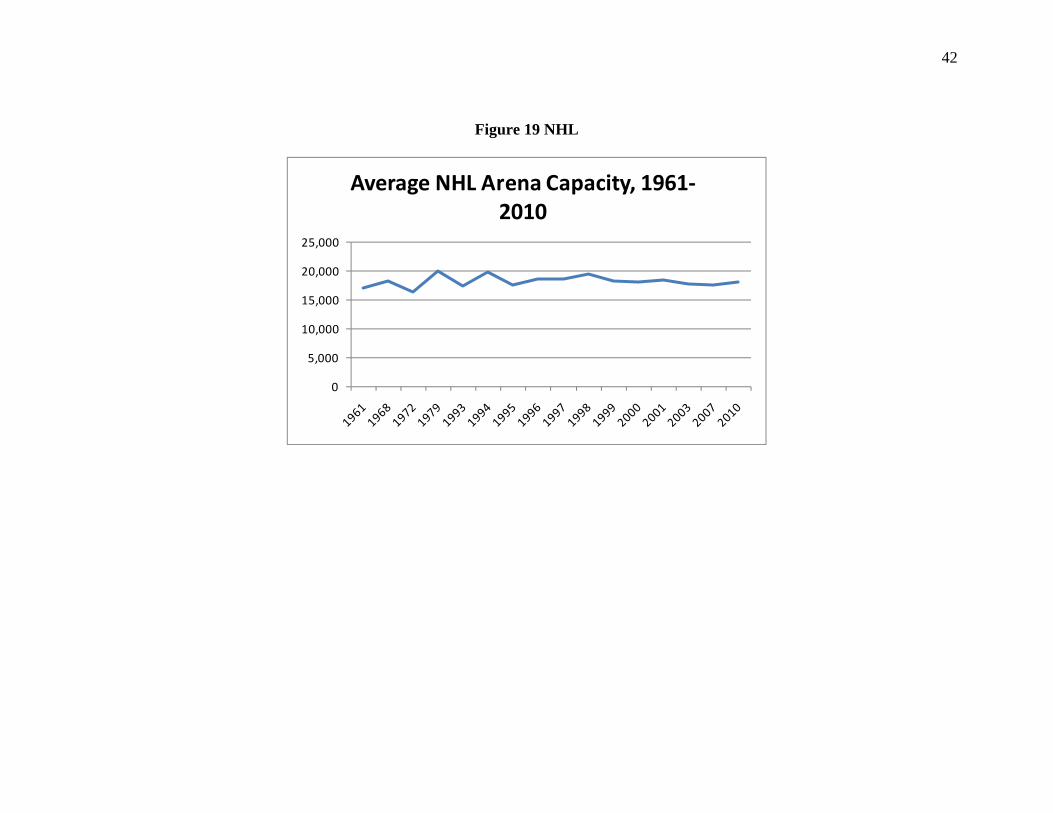
arena and 47,246 for an NFL field (Quirk and Fort 133). Figs. 3, 9, 13 and 19 show the average capacity for stadiums built by major
league sport and by year. Major League Baseball stadiums built before 1995 could seat an average of 45,368 people, while more
recent ballparks seat an average of 44,419 people. The average capacity of older NBA arenas is 19,652 patrons, while new NBA
arenas seat 19,1591. Old National Hockey League arenas have an average capacity of 18,244, and modern of 18,381. Finally, seasoned
football fields hold 71,162, whereas new stadiums house only 70,563 fans. These averages excluded planned facilities for all sports.
Newer stadiums constructed for the NHL have been larger on average than older models, while the opposite is true for more recently
built football, baseball and basketball venues. The largest stadium in Major League Baseball is the Minnesota Twins’ current

9
Metrodome, with a seating capacity of 56,144. Target Field, the planned Twins’ ballpark, has a smaller planned seating capacity of
42,000. The New Yankee Stadium finished in 2009 is among the largest of MLB stadiums with a seating capacity of 52,325. The
Washington Redskins’ FedEx field is still the largest stadium in the NFL, seating 91,704. Planned football stadiums have an average
seating capacity of 75,700, which is significantly higher than average for football fields completed before 1995.
Trends in Stadium and Arena Costs
Arguably some of the most heated debates in industry and government erupt over the public financing implications of new
stadiums and arenas. More than $6.614 billion was allocated to Major League Baseball facilities constructed or proposed between
1995 and 2009; a total of $6.93 billion was apportioned to National Football League venues. In addition, over $1.86 billion was
designated for dual use NHL/NBA arenas, $1.6 billion for NBA only arenas and approximately $1.42 billion on venues for NHL use -
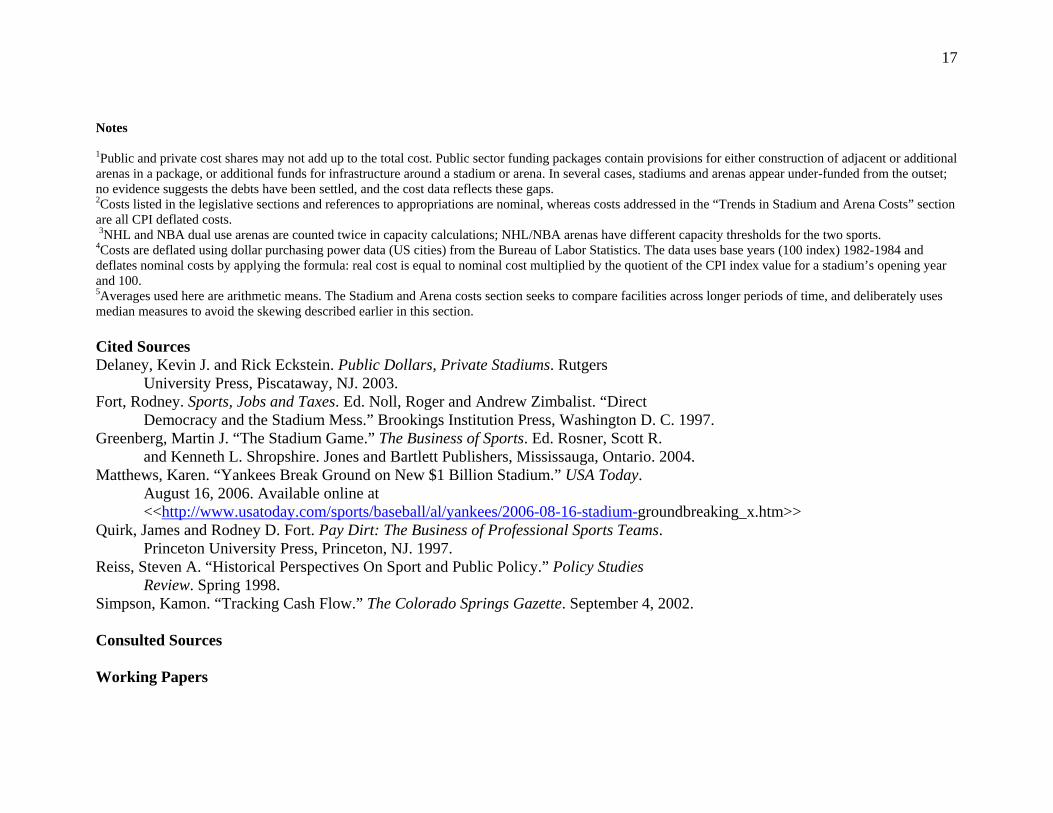
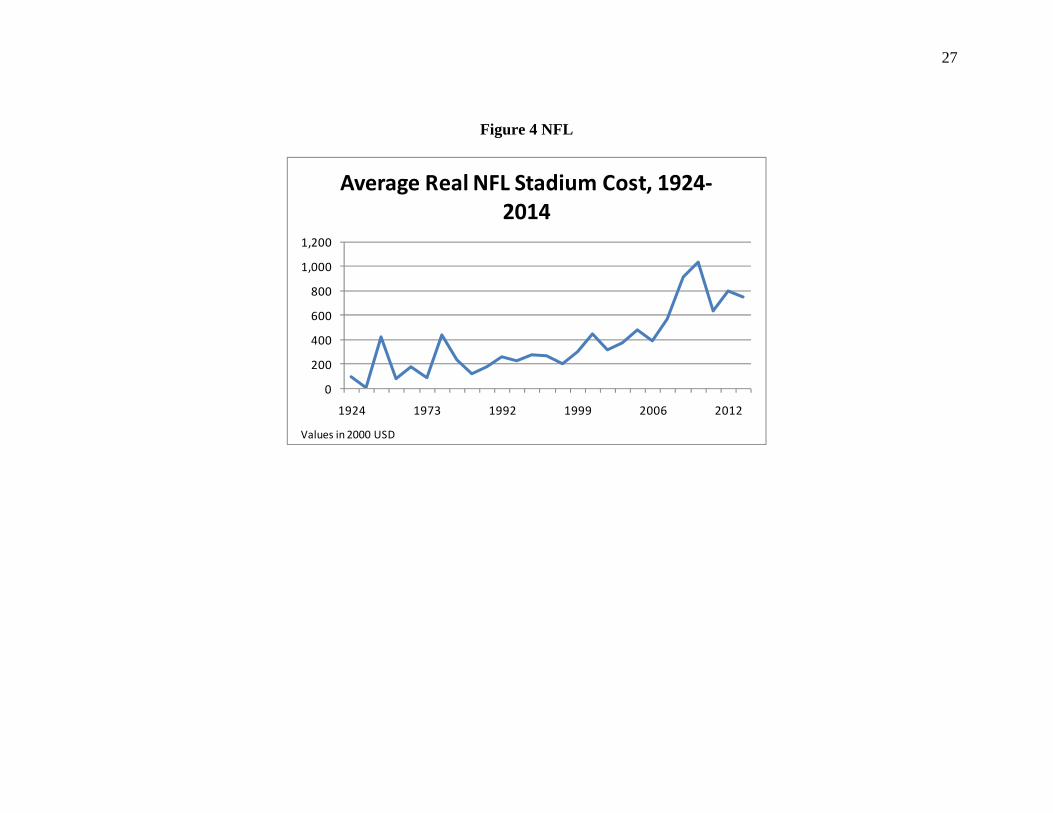
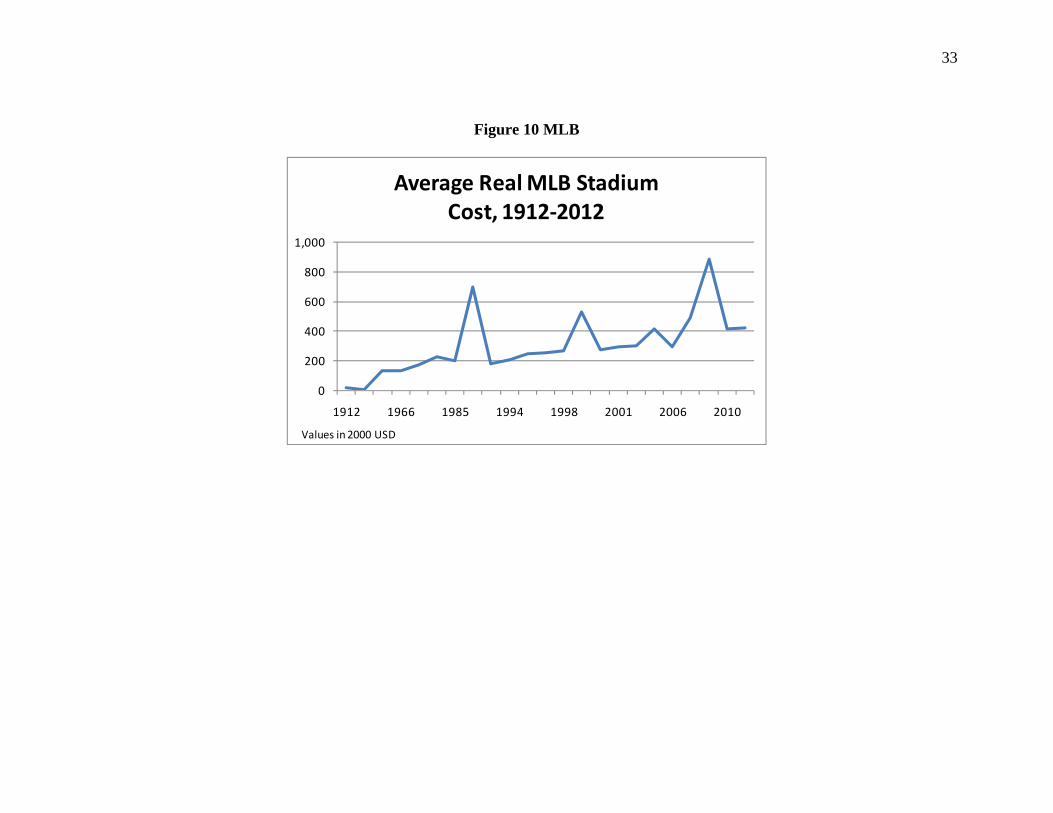
amounting to a total of roughly $17.96 billion in real dollars. Figs 4, 10, 14 and 20 compare average stadium costs by sport and by
year. The average real cost of a Major League Baseball field before 1995 was $187 million, while the current bill stands at $389
million. Average NBA arena costs have climbed from $177 million before 1995 to $316 million 1995-2009, while NHL arenas have
actually fallen from an average of $217 million before 1995 to $205 million after 1995. The most notable change in construction costs
arises among stadiums of the National Football League, whose facilities carried an average price tag of $182 million until 1995, after
which average costs rose to $365 million.
10
Private sources contributed $7.08 billion to major league facility construction deals negotiated between 1995 and 2009,
financing: $2.19 billion worth of Major League Baseball’s stadium projects, $2.82 billion for the NFL and $2.07 billion between the
NBA and NHL1. Public costs outweigh this figure, though not staggeringly. $10.34 billion in government funds were committed to
major league venue projects 1995-2009, with $3.15 billion for baseball, $4.03 billion for football and $3.11 billion for basketball and
hockey arenas. Public monies are still enthusiastically sought by sports franchises aiming to obtain new facilities. 94% of all MLB
ballparks are at least partially financed by public dollars, as are 95% of NFL stadiums, 86% of dual use NBA/NHL arenas, 94% of
NBA arenas and 88% of arenas serving the NHL. This data is not contrary to trends identified by previous literature; comparative
statistics for stadiums and arenas of the 1950s show that public funds endowed 12% of MLB stadiums, 46% of NBA arenas, 36% of
NFL stadiums and virtually no proportion of NHL arena costs. By 1991 these percentages exploded to 80.5%, 65%, 65% and 93%,
respectively (Quirk and Fort 133). This distribution has hardly changed; NBA, NHL and shared NBA/NHL arenas are both more
likely to utilize completely private resources, and have slightly higher private to public funding ratios.
Financing Strategies and Legislation
Brief History of Private Financing Options
Faced with markedly compounding costs and increasingly intricate legal barriers, team owners and sponsors turned to new
financing options. They found a wellspring in seating prices and options. Miami Dolphins’ owner Joe Robbie pioneered club seating,
extra revenues from which would buttress stadium costs. Luxury suites followed in the 1970s, in addition to personal seat licenses

11
(PSLs) that permitted the purchase and trade of stadium and arena seats on consumer markets. Sales of naming rights, parking
advertising and concessions also became staples of the private finance strategy (Greenberg 116). The increasing availability of
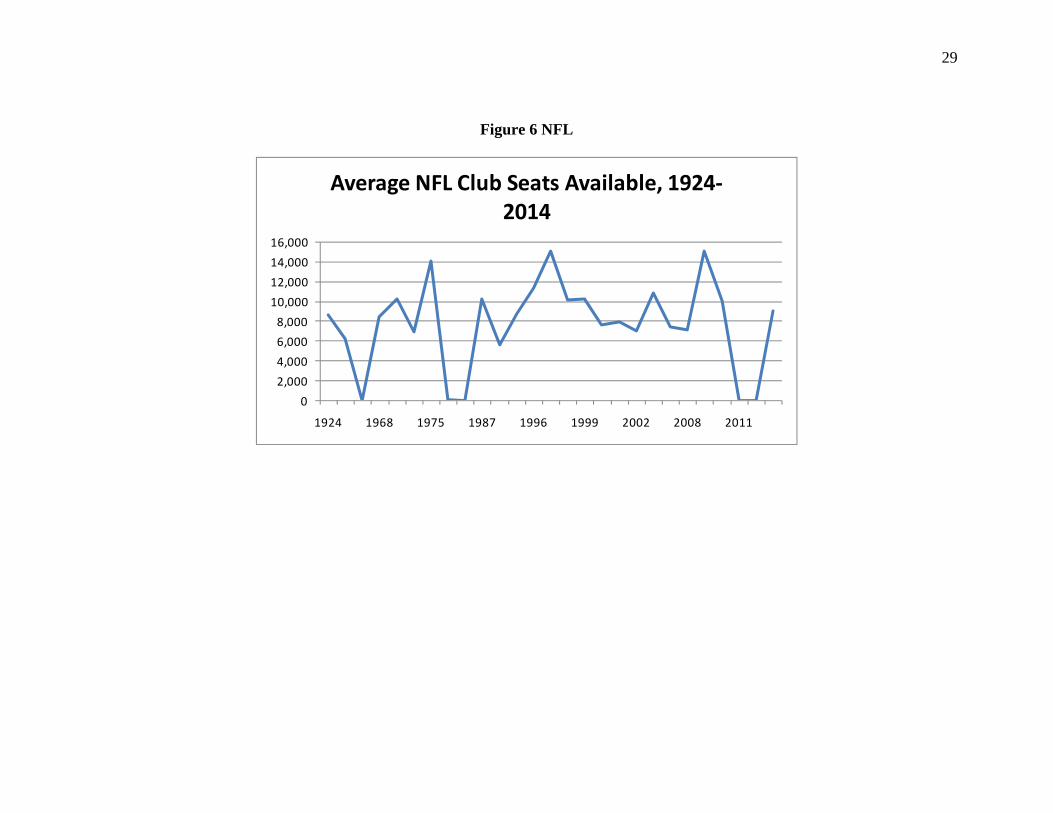
premium seating options in the 1995-2009 period is worth some discussion. Specific data on premium seating was not available for
Major League Baseball, so this paper focuses on premium seating in the NFL, NBA and NHL. National Football League venues
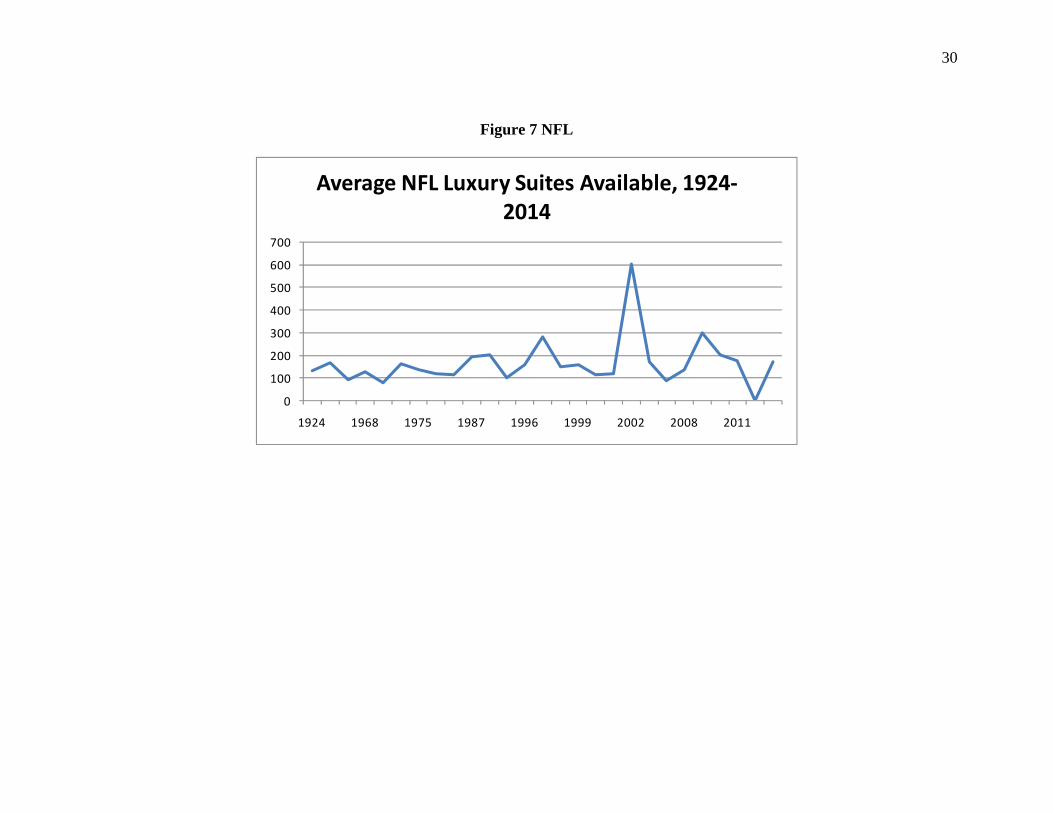
averaged 6,569 available club seats before 1995. This number rose to 9,424 on average between 1995 and 2009. The average number
of available luxury suites per NFL stadium rose from 138 before 1995 to 248 between 1995 and 2009. NBA arenas built before 1995
provided an average of 1,515 club seats, while newer arenas raised this number to 2,487. Available NBA luxury suites actually fell
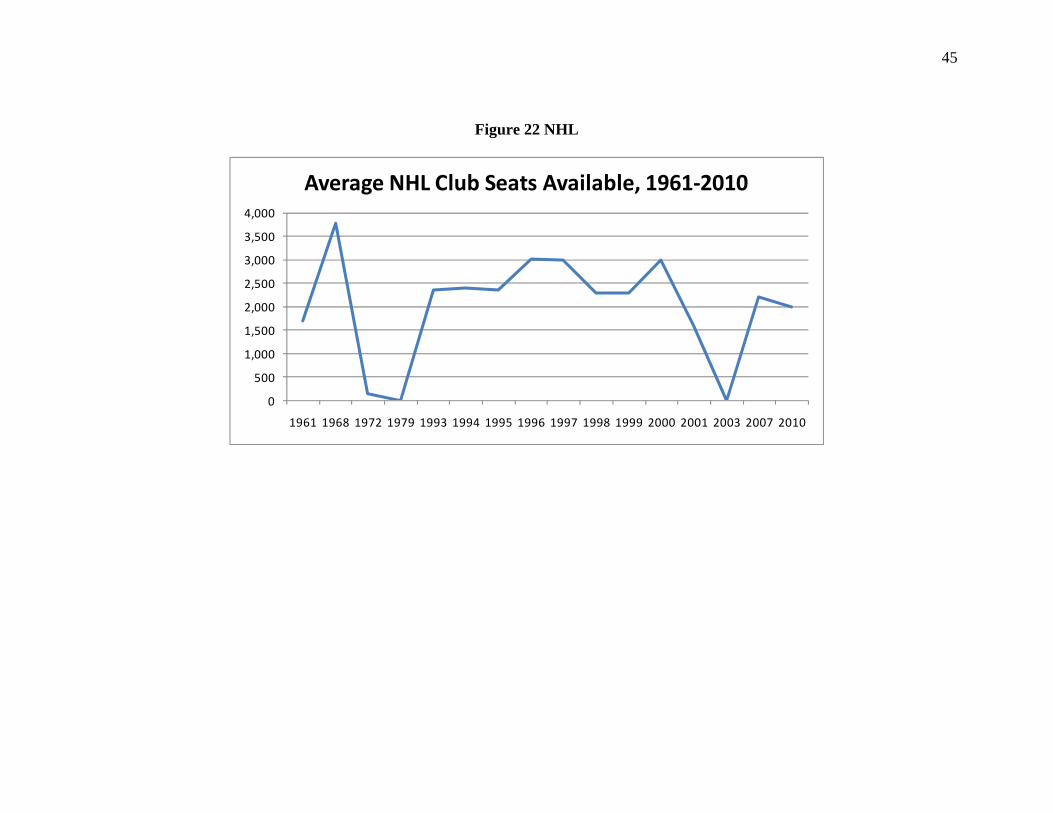
from an average of 96 before 1995 to 77 between 1995 and 2009. Hockey arenas provided 1,891 club seats on average before 1995,
and an average of 2,578 between 1995 and 2009. Like the NBA, NHL arenas decreased the number of available luxury suites from an
average of 110 before 1995 to 86 between 1995 and 2009. Each major league sport venue type for which data is available has nearly
doubled seating sold to the public at a premium.
Premium seating is but one example of a major league venue revenue stream. Other revenue sources include naming rights
agreements, concessions, parking, ticket sales, non-sporting events, and advertising. The amounts of revenue received from each vary
significantly by venue, so a case study approach may provide insight into the proportion each stream occupies in a stadium budget.
Invesco Field revenues totaled approximately $105 million in 1999 (unadjusted), of which $29.8 million came from ticket sales; $4.4
million from local television and radio; $567,000 from premium seating and roughly $1.0 million from concessions. Municipalities

12
also benefit from private revenue options. The operating city, county or district is eligible to receive gross receipts taxes for clothing
and memorabilia sold at a venue, as well as sales tax on concessions, special parking taxes and ticket surcharges.
The Evolution of Public Financing for Stadiums and Arenas
In 1871 Chicago’s White Stockings played the first season in Major League Baseball history on publicly owned lakefront land.
Ensuing decades saw an expansion of publicly financed sports facilities; the city of San Diego Board of Park Commissions opened a
$150,000 facility in 1914, followed by investments from Pasadena in 1922 and Los Angeles in 1923 (Reiss 4). Stemming Olympic
hopes spurred the stadium financing trend forward; municipalities financed new arenas primarily through the sale of bonds serviceable
through taxes or general fund appropriations.
Modern government approaches to athletic venue financing are far more heterogeneous. Public funding methods for arenas
opened during the 1995-2009 period include bond issuances, sales taxes, excise taxes, commemorative license plate sales, diversions
of cable bill revenues, PILT payments, general fund appropriations, lotteries and ticket sale revenue sharing. Taxes on: rental cars,
hotels, casinos, restaurants, player wages, property, tourism, alcohol, tobacco and entertainment facilities have likewise found state
and municipal approval as financing strategies. The most prevalent options by far are bond issuances and hotel taxes. Numerous
stadium construction plans are accompanied by blueprints for adjacent or nearby hotels, making hotel tax increases a popular option.
Sales taxes have been raised to finance new stadiums and arenas on several occasions, though these increases are frequently, as in
Denver, limited to the county or multi-county area most immediately affected by stadium construction. Rental car taxes are augmented
13
or imposed almost as frequently, with 8 stadiums from this period benefiting from the revenue they generate. Cable bill diversions
support the Pacers’ Conseco Fieldhouse; in what may be the most creative approach to arena financing, the City Capital Improvement
Board entered into an agreement with Comcast and Time Warner, who now divert cable bill revenues to the Pacers and the arena.
Referenda, Legislation and Other Forms of Agreement to Finance
More than 20 stadium or arena construction referenda were submitted to the public between 1974 and 1996, proposing
numerous options including: raising excise taxes, sales taxes, utility taxes, hotel taxes, the sales tax or property taxes, establishing
sports lotteries, rolling back legislation that precluded public funding of an arena, approving unspecified expenditures or simply
approving the construction of a facility. Of these, 41 percent passed (Fort 161). Fort suggests that cities or states seeking to maintain
current franchises or obtain expansion teams are more likely to see a referendum offering, and that most elections run rather close. 25
referenda were submitted to the public between 1995 and 2005; 21 of these, or 84% passed. Referendum propositions for PNC Park,
Safeco Field, Soldier Field renovations and a Charlotte Arts Arena package were defeated, but in each case a special legislative
session, city council vote or independent agreement between the team franchise and municipality circumvented existing obstacles and
provided for stadium construction. In the Minnesota Twins case, a referendum proposal was presented in the wake of the team’s
rejection of 2002 state legislation authorizing a stadium project. The city and state supplements, claimed the Twins, were too small.
Stadium referenda have not been the only mechanism used to secure funding for major league arenas. Legislative sessions have
recurrently debated and finalized stadium legislation without referendum vote; regional development and municipal maintenance

14
boards have also independently secured agreements with franchises to finance facilities, though tax issues are seldom delegated to
non-legislative authorities.
Conclusion
Stadium building in the last decade has been aggressive, extensive and extremely consequential. Major league facilities have
been assembled more quickly between 1995 and 2005 than in any other decade.
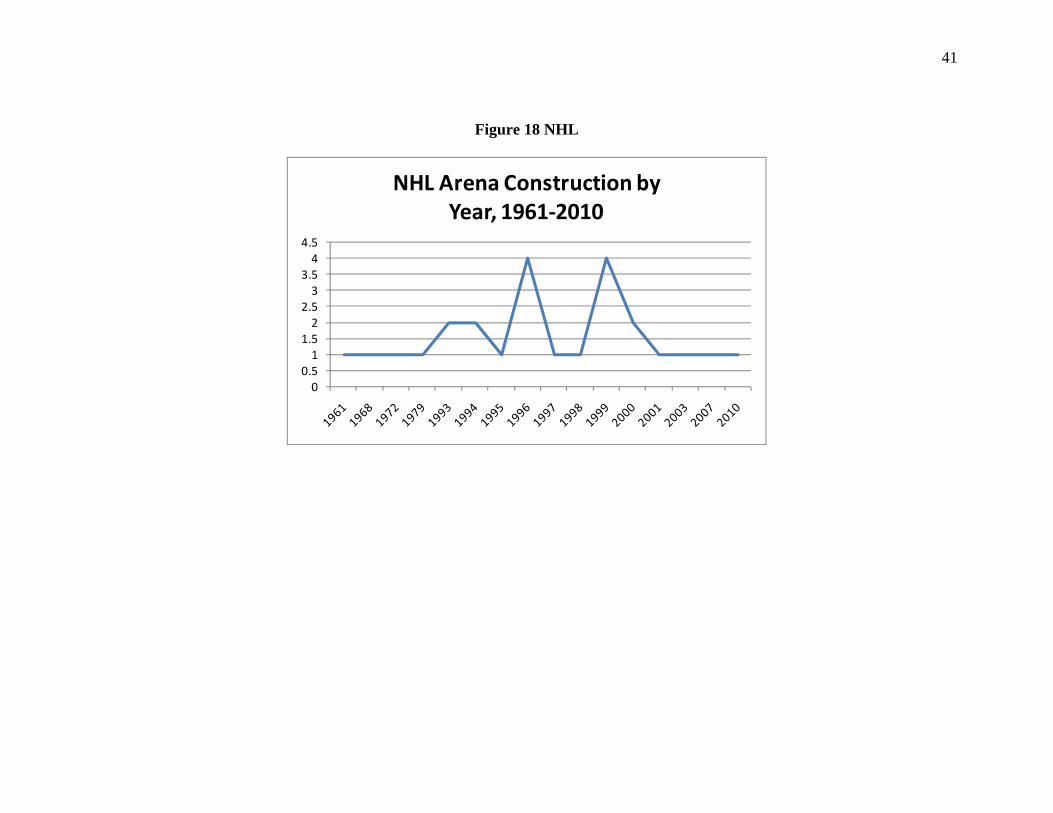
Construction peaks between 1996 and 2005 at a rate of 9 new venues in 1999, rates above a single stadium per year are not
even evident before 1966. Major league athletic venues were built at a rate of 0.36 arenas per year, or one arena every 2.8 years,
before 1990. The average rate of construction after 1990 is comparably astounding at 3.63 stadiums per year.
Average costs per arena5 increased in all cases except for the NHL, and total venue construction costs soared for all four major
league sports throughout the decade; total costs to the public sector burgeoned with them.
This analysis indicates that individual arena costs have weighed most heavily – certainly for football and baseball – at the
earliest and latest periods in construction history. Only after 1989 did the construction costs of football and baseball stadiums
consistently exceed those of NBA and NHL arenas. Early costs for NBA and NHL arenas are thrust upward by the price of Madison
Square Garden, which cost $608.9 million in real terms. The Garden is likewise by far the highest costing venue used by the National
Hockey League; the Dallas Stars’ American Airlines Center follows with a real cost of $404.9 million.

15
Perhaps surprisingly, the data illustrates a substantial decline in average costs per arena after the first peak in 1950-1969. The
1970s and early 1980s constitute a particularly anemic period for major league sports construction. Costs for NFL arenas began to
grow gradually after 1995, while MLB arenas show consistent growth in average costs only after 2000. The period shows significant
variation in NHL and NBA facility costs. For the NFL, average real arena costs for venues planned for 2010 through 2015 outweigh
average costs for earlier arenas of the 1950s and 1960s. This observation holds for baseball, though the difference is less salient. The
average real cost of planned NBA arenas is significantly higher than the average real cost of an arena in the 1980s, while the opposite
is true for a comparison between average real NHL arena costs of the 1960s and the future. What remains to be discerned is whether
the amount of public responsibility for the financing of early and later facilities has shifted in concert with their costs.
In fact, the composition of arena financing shifted in favor of increased private funding for every major league sport after the
1970s. Overall private contributions to major league venue financing projects have grown faster than public contributions since 1995.
In the National Football League, the bulk of the financing burden still rests upon public shoulders, yet the relative public contribution
is declining. The public financed 84% of NFL venue projects before 1995, 62% of stadium costs incurred between 1995 and 2009, and
is scheduled to pay for only 19% of stadiums to be built between 2010 and 2015. Baseball’s Fenway Park and Wrigley Field were
wrought entirely by private means. Public funds did begin to contribute 1950-1969, when the public bore up to 100% of the cost
burden for stadiums. The public share of MLB venue financing has remained above 50% since 1966 with the exception of 2000, 2006
and 2009. The public will cover 65% of the cost for ballparks opening 2010-2015.

16
While public funds accounted for 60% of NBA arena financing between 1995 and 2009, the public portion of financing has
historically averaged 38% before 1995. The public share of NBA arena financing has fluctuated year to year. The public share
remained generally below 50% between 1992 and 2001, yet rebounded between 2002 and 2005. The public will finance only 24% of
planned NBA facilities.
In his “Stadium Game,” Martin Greenberg predicted the onset of a “New Frontier” era for major league stadium and arena
construction. The ‘New Frontier’ would feature more, and larger, venues than had any preceding time – and the 1995-2009 period
certainly has. Contrary to a slew of other conjectures, however, individual arena costs do not appear to have advanced as dramatically
as the total funds spent on facilities. Nor has the public share of stadium cost, which appears to be declining steadily in the four major
league sports. It is the sheer volume of construction projects in the late 1990s and early 2000s that has driven total costs
astronomically upward during this period. Still, higher capacity construction between 1995 and 2010 will translate into the highest
sums of public dollars ever spent on major league sports, as well more of the increasingly intense public confrontations over the return
on these investments. The new Yankees and Giants stadiums are exemplary of the brewing controversies over municipal roles in
financing. “It’s a pleasure to give this to you people,” remarked Yankees owner George Steinbrenner at the groundbreaking of the new
Yankees stadium; “enjoy the new stadium. I hope it’s wonderful” (Matthews 2006). The pleasure may in fact be all his own. (Fig. 14-
17 below)
17
Notes
1Public and private cost shares may not add up to the total cost. Public sector funding packages contain provisions for either construction of adjacent or additional arenas in a package, or additional funds for infrastructure around a stadium or arena. In several cases, stadiums and arenas appear under-funded from the outset; no evidence suggests the debts have been settled, and the cost data reflects these gaps. 2Costs listed in the legislative sections and references to appropriations are nominal, whereas costs addressed in the “Trends in Stadium and Arena Costs” section are all CPI deflated costs. 3NHL and NBA dual use arenas are counted twice in capacity calculations; NHL/NBA arenas have different capacity thresholds for the two sports. 4Costs are deflated using dollar purchasing power data (US cities) from the Bureau of Labor Statistics. The data uses base years (100 index) 1982-1984 and deflates nominal costs by applying the formula: real cost is equal to nominal cost multiplied by the quotient of the CPI index value for a stadium’s opening year and 100. 5Averages used here are arithmetic means. The Stadium and Arena costs section seeks to compare facilities across longer periods of time, and deliberately uses median measures to avoid the skewing described earlier in this section. Cited Sources Delaney, Kevin J. and Rick Eckstein. Public Dollars, Private Stadiums. Rutgers
University Press, Piscataway, NJ. 2003. Fort, Rodney. Sports, Jobs and Taxes. Ed. Noll, Roger and Andrew Zimbalist. “Direct
Democracy and the Stadium Mess.” Brookings Institution Press, Washington D. C. 1997. Greenberg, Martin J. “The Stadium Game.” The Business of Sports. Ed. Rosner, Scott R.
and Kenneth L. Shropshire. Jones and Bartlett Publishers, Mississauga, Ontario. 2004. Matthews, Karen. “Yankees Break Ground on New $1 Billion Stadium.” USA Today.
August 16, 2006. Available online at <<http://www.usatoday.com/sports/baseball/al/yankees/2006-08-16-stadium-groundbreaking_x.htm>>
Quirk, James and Rodney D. Fort. Pay Dirt: The Business of Professional Sports Teams. Princeton University Press, Princeton, NJ. 1997.
Reiss, Steven A. “Historical Perspectives On Sport and Public Policy.” Policy Studies Review. Spring 1998.
Simpson, Kamon. “Tracking Cash Flow.” The Colorado Springs Gazette. September 4, 2002. Consulted Sources Working Papers

18
Baade, Robert A. and Victor A. Matheson. “Have Public Finance Principles Been Shut
Out in Financing New Sports Stadiums for the NFL in the United States?” Department of Economics Faculty Research Series, College of the Holy Cross
Coates, Dennis and Brad Humphreys. “Voting on Stadium and Arena Subsidies.”
Department of Economics, UMBC. Coates, Dennis and Brad Humphreys. “Professional Sports Facilities, Franchises and
Urban Economic Development.” Department of Economics Working Paper 03-103, UMBC Journal Articles Grant-Long, Judith. “Full Count: The Real Cost of Public Funding for Major League
Sports Facilities.” Journal of Sports Economics. Vol. 6, No. 2. pp. 119-141. May 2005.
Weiner, Ross D. “Financing Techniques and Stadium Subsidies in the United States.”
Journal of Urban Technology. Vol 11. No 2. pp.41-59. 2004 Data Sources Chapin, Timothy C. “A New Era of Professional Sports in the Northwest: Facility Location as an Economic Development Strategy in Seattle, Portland, and Vancouver.” Available online at Chapin’s Stadia Homepage, http://garnet.acns.fsu.edu/~tchapin/stadia/new-rsrch.html Ballparks index by Munsey and Suppes, 1996-2006. Available online at http://www.ballparks.com/index.html Byrd, Alan. “Dueling Views on Arena Cash.” Orlando Business Journal. April 20, 2001. Dvorchak, Robert. “The political struggle over financing PNC Park went into extra
Innings.” Pittsburgh Post-Gazette. April 15, 2001. Heath, Thomas and David Montgomery. “Pollin: With Opening of MCI Center, 'I've Got
Everything I've Ever Done in My Life on the Line.” The Washington Post. November 30, 1997. Official Site of the National Football League,

19
http://www.nfl.com Official Site of the National Basketball Association http://www.nba.com Official Site of Major League Baseball http://www.mlb.com Official Site of the National Hockey League http://www.nhl.com Legislative Database of the City of Minneapolis. “Financing of the Target Center.” 1997
2006. Available online at http://www.ci.minneapolis.mn.us/legislativeaffairs/TargetCenter.asp Moore, Paula. “Meet the Pepsi Center Team.” Denver Business Journal. January 30,
1998 “National Basketball Association.” Sports Facility Reports, Appendix 2 to Volume 5,
Number 1. National Sports Law Institute of Marquette University Law School. 2004. Rosentraub, Mark S. Major League Losers. Basic Books, New York, NY. 1999
20
Figure 1
012345678910
1912 1922 1931 1941 1951 1960 1970 1980 1990 1999 2009
Major League Venue Construction by Year, 1912‐2015

21
Table 1 NFL
Team Current VenueOpening Year
Nominal Cost
Real Cost
Nominal Private Funds
Real Private Funds
Nominal Public Funds
Real Public Funds
Public Share Capacity
Luxury Suites
AvailableClub Seats
Average Ticket (2005)
Average Ticket (2008)
49ers Candlestick Park 1960 $24.60 $423.72 $0.00 $0.00 $24.60 $423.72 100.0% 70,207 93 0 $64.00 $70.55Bears Soldier Field 1924 $10.00 $97.57 $0.00 $0.00 $10.00 $97.57 100.0% 61,500 133 8,600 $68.89 $88.33Bengals Paul Brown Stadium 2000 $450.00 $450.00 $25.00 $25.00 $424.00 $424.00 94.2% 65,790 114 7,620 $55.72 $69.85Broncos Invesco Field at Mile High 2001 $364.20 $364.20 $91.05 $91.05 $273.15 $273.15 75.0% 76,125 106 8,500 $63.94 $76.75Browns Cleveland Browns Stadium 1999 $290.00 $297.94 $71.00 $72.94 $210.00 $215.75 72.4% 73,200 145 8,754 $48.79 $54.41
Buccaneers Raymond James Stadium 1998 $168.50 $176.01 $0.00 $0.00 $168.50 $176.01 100.0% 65,657 195 12,332 $63.59 $90.13Buffalo Bills Ralph Wilson Stadium 1973 $22.00 $87.17 $0.00 $0.00 $22.00 $87.17 100.0% 73,967 164 6,878 $39.37 $51.24Cardinals University of Phoenix Stadium 2006 $455.00 $387.31 $169.00 $143.86 $285.00 $242.60 62.6% 63,400 88 7,400 $44.98 $65.08Chargers Qualcomm Stadium 1968 $27.00 $138.53 $27.00 $138.53 $0.00 $0.00 0.0% 71,294 113 7,882 $54.82 $81.39Chiefs Arrowhead Stadium 1972 $43.00 $176.60 $0.00 $0.00 $43.00 $176.60 100.0% 79,451 80 10,199 $66.49 $80.69Colts Lucas Oil Stadium 2008 $720.00 $571.95 $108.00 $85.79 $612.00 $486.16 85.0% 63,000 137 7,100 N/A $81.13
Cowboys Cowboys Stadium 2009 $1,150.00 $913.53 $675.00 $536.20 $325.00 $258.17 28.3% 80,000 300 15,000 $66.20 $84.12Dolphins Land Shark Stadium 1987 $115.00 $174.57 $103.50 $157.11 $11.50 $17.46 10.0% 75,235 195 10,209 $51.96 $66.11Eagles Lincoln Financial Field 2003 $518.00 $481.22 $330.00 $306.57 $188.00 $174.65 36.3% 68,532 172 10,828 $66.09 $69.00Falcons Georgia Dome 1992 $214.00 $261.57 $0.00 $0.00 $214.00 $261.57 100.0% 71,228 203 5,600 $52.67 $63.95Giants Giants Stadium 1976 $78.00 $236.81 $0.00 $0.00 $78.00 $236.81 100.0% 78,741 119 124 $71.59 $88.06Jaguars Jacksonville Municipal Stadium 1995 $121.00 $135.89 $17.00 $19.09 $102.00 $114.55 84.3% 76,877 75 11,000 $40.16 $55.30Jets Giants Stadium 1976 $78.00 $236.81 $0.00 $0.00 $78.00 $236.81 100.0% 78,741 119 124 $71.59 $88.06Lions Ford Field 2002 $430.00 $409.85 $210.70 $200.83 $219.30 $209.02 51.0% 65,000 120 7,000 $56.90 $66.39Packers Lambeau Field 1957 $0.96 $5.87 $0.00 $0.00 $0.96 $5.87 100.0% 72,292 167 6,260 $56.13 $63.39Panthers Bank of America Stadium 1996 $248.00 $278.53 $248.00 $278.53 $50.00 $56.15 20.2% 73,298 159 11,358 $54.86 $63.32Patriots Gillette Stadium 2002 $325.00 $309.77 $325.00 $309.77 $0.00 $0.00 0.0% 68,756 2,000 6,000 $90.89 $117.84Raiders Oakland Coliseum 1968 $25.50 $27.88 $0.00 $0.00 $25.50 $27.88 100.0% 63,026 143 9,000 $58.89 $62.23Rams Edward Jones Dome 1995 $280.00 $314.46 $11.20 $12.58 $268.80 $301.89 96.0% 66,000 124 6,500 $60.92 $68.28Ravens M&T Bank Stadium 1998 $220.00 $229.80 $22.00 $22.98 $198.00 $206.82 90.0% 71,008 108 7,904 $62.01 $77.20Redskins FedEx Field 1997 $250.50 $265.77 $180.00 $190.97 $70.50 $74.80 28.1% 91,704 280 15,044 $67.53 $79.13Saints Superdome 1975 $134.00 $434.15 $0.00 $0.00 $134.00 $434.15 100.0% 72,968 137 14,077 $51.31 N/A
Seahawks Qwest Field 2002 $360.00 $343.13 $108.00 $102.94 $251.00 $239.24 69.7% 67,000 100 N/A $44.78 $61.25Steelers Heinz Field 2001 $281.00 $270.89 $109.20 $105.27 $171.00 $164.85 60.9% 65,050 129 7,300 $59.19 $67.47Texans Reliant Stadium 2002 $449.00 $427.96 $256.00 $244.00 $194.00 $184.91 43.2% 71,500 187 8,200 $56.73 $66.69Titans LP Field 1999 $290.00 $297.94 $70.50 $72.43 $219.50 $225.51 75.7% 68,798 175 11,800 $47.82 $58.55Vikings Metrodome 1982 $68.00 $121.72 $0.00 $0.00 $68.00 $121.72 100.0% 64,035 113 0 $67.94 $73.23

Table 2 MLB
Team Current VenueOpening Year
Nominal Cost Real Cost
Nominal Private Funds
Real Private Funds
Nominal Public Funds
Real Public Funds
Public Share Capacity
Angels Angel Stadium of Anaheim 1966 $24.00 $127.40 $0.00 $0.00 $24.00 $127.40 100.0% 45,113Astros Minute Maid Park 2000 $250.00 $250.00 $85.00 $85.00 $180.00 $180.00 72.0% 40,950Athletics Oakland Coliseum 1968 $25.50 $126.23 $0.00 $0.00 $25.50 $126.23 100.0% 34,007Blue Jays Rogers Centre 1989 $500.00 $696.94 $185.00 $257.87 $315.00 $439.08 63.0% 50,516Braves Turner Field 1997 $239.00 $253.57 $0.00 $0.00 $239.00 $253.57 100.0% 50,096Brewers Miller Park 2001 $382.00 $368.26 $90.00 $86.76 $252.12 $243.05 66.0% 41,900Cardinals Busch Stadium (New) 2006 $344.00 $292.83 $302.72 $257.69 $41.28 $35.14 12.0% 46,700Cubs Wrigley Field 1914 $0.03 $0.51 $0.03 $0.51 $0.00 $0.00 0.0% 41,118
Devil Rays Tropicana Field 1998 $115.00 $152.37 $0.00 $0.00 $115.00 $152.37 100.0% 43,772Diamondbacks Chase Field 1998 $354.00 $369.77 $102.66 $107.23 $251.34 $262.54 71.0% 49,033
Dodgers Dodger Stadium 1962 $23.00 $129.41 $23.00 $129.41 $0.00 $0.00 0.0% 56,000Giants SBC Park 2000 $255.00 $255.00 $291.00 $291.00 $15.00 $15.00 5.9% 41,600Indians Progressive Field 1994 $175.00 $202.05 $38.50 $44.45 $136.50 $157.60 78.0% 43,405Mariners Safeco Field 1999 $517.00 $531.16 $144.76 $148.72 $372.24 $382.44 72.0% 47,447Marlins Land Shark Stadium 1985 $125.00 $200.00 $67.50 $108.00 $57.50 $92.00 46.0% 47,662Mets Citi Field 2009 $632.00 $502.04 $528.00 $419.43 $164.40 $130.59 26.0% 42,000
Nationals Nationals Park 2008 $611.00 $485.36 $0.00 $0.00 $611.00 $485.36 100.0% 41,888Orioles Camden Yards 1992 $110.00 $134.45 $4.40 $5.38 $105.60 $129.08 96.0% 48,190Padres PETCO Park 2004 $449.40 $409.60 $146.00 $133.07 $303.40 $276.53 67.5% 42,500Phillies Citizens Bank Park 2004 $458.00 $417.44 $229.00 $208.72 $229.00 $208.72 50.0% 43,647Pirates PNC Park 2001 $216.00 $208.23 $40.00 $38.56 $151.20 $145.76 70.0% 38,496Rangers Rangers Ballpark 1992 $191.00 $220.53 $38.20 $44.11 $152.80 $176.42 80.0% 48,911Red Sox Fenway Park 1912 $0.65 $11.20 $0.65 $11.20 $0.00 $0.00 0.0% 39,928Reds Great American Ballpark 2003 $320.00 $297.28 $57.60 $53.51 $262.40 $243.77 82.0% 42,271Rockies Coors Field 1995 $215.00 $241.46 $53.00 $59.52 $162.00 $181.94 75.3% 50,381Royals Kauffman Stadium 1973 $43.00 $170.38 $0.00 $0.00 $43.00 $170.38 100.0% 38,177Tigers Comerica Park 2000 $300.00 $300.00 $111.00 $111.00 $189.00 $189.00 63.0% 40,120Twins Metrodome 1982 $124.00 $221.96 $8.68 $15.54 $115.32 $206.43 93.0% 56,144
White Sox U.S. Cellular Field 1991 $150.00 $188.11 $0.00 $0.00 $150.00 $188.11 100.0% 40,615Yankees Yankee Stadium II 2009 $1,600.00 $1,270.99 $800.00 $635.50 $220.00 $174.76 13.8% 52,325

Table 3 NBA
Team Current VenueOpening Year
Nominal Cost
Real Cost
Nominal Private Funds
Real Private Funds
Nominal Public Funds
Real Public Funds
Public Share Capacity
Luxury Suites
AvailableClub Seats
Average Ticket (2005)
Average Ticket (2008)
76ers Wachovia Center Complex 1996 $206.00 $225.21 $170.50 $186.40 $35.50 $38.81 17.2% 21,600 126 1,880 $44.47 $43.00Bobcats Time Warner Cable Arena 2005 $265.00 $234.57 $0.00 $0.00 $265.00 $234.57 100.0% 19,026 51 2,300 $36.13 $29.10Bucks Bradley Center Arena 1988 $90.00 $131.31 $90.00 $131.31 $0.00 $0.00 0.0% 18,717 68 0 $42.78 $47.64Bulls United Center 1994 $175.00 $202.05 $162.75 $187.91 $12.25 $14.14 7.0% 21,711 376 3,100 $52.54 $63.00
Cavaliers Quicken Loans Arena 1994 $152.00 $175.50 $79.04 $91.26 $72.96 $84.24 48.0% 20,562 92 2,000 $42.52 $56.10Celtics TD Banknorth Garden 1995 $160.00 $179.69 $160.00 $179.69 $0.00 $0.00 0.0% 18,624 104 2,350 $55.93 $65.43Clippers Staples Center 1999 $375.00 $385.27 $271.50 $278.94 $58.50 $60.10 15.6% 18,997 32 2,500 $43.38 $57.00
Golden State Warriors Oracle Arena 1966 $25.50 $135.36 $0.00 $0.00 $25.50 $135.36 100.0% 19,596 72 3,900 $23.82 $31.13Grizzlies FedEx Forum 2004 $250.00 $227.86 $20.06 $18.28 $228.00 $207.81 91.2% 21,165 75 2,500 $35.29 $36.82Hawks Philips Arena 1999 $213.50 $219.35 $20.25 $20.80 $193.25 $198.54 90.5% 18,729 96 2,893 $41.43 $38.00Heat Miami Arena 1988 $213.00 $218.83 $213.00 $218.83 $0.00 $0.00 0.0% 19,600 78 Unknown $50.87 $58.55
Hornets New Orleans Arena 1999 $84.00 $86.30 $0.00 $0.00 $84.00 $86.30 100.0% 18,000 44 2,800 $28.61 $24.58Jazz EnergySolutions Arena 1991 $94.00 $117.88 $94.00 $117.88 $0.00 $0.00 0.0% 19,911 56 668 $39.50 $41.31Kings ARCO Arena 1988 $40.00 $58.36 $40.00 $58.36 $0.00 $0.00 0.0% 17,317 30 412 $59.80 $59.80Knicks Madison Square Garden 1968 $123.00 $608.87 $123.00 $608.87 $0.00 $0.00 0.0% 19,763 89 3,775 $70.51 $70.51Lakers Staples Center 1999 $375.00 $385.27 $271.50 $278.94 $58.50 $60.10 15.6% 18,997 32 2,500 $79.21 $57.00Magic Amway Arena 1989 $98.00 $136.60 $0.00 $0.00 $98.00 $136.60 100.0% 17,248 26 0 $37.66 $38.46
Mavericks American Airlines Center 2001 $420.00 $404.89 $210.00 $202.44 $210.00 $202.44 50.0% 19,200 144 1,600 $53.00 $60.56Nets Izod Center 1981 $85.00 $164.92 $0.00 $0.00 $85.00 $164.92 100.0% 20,049 29 1,060 $55.44 $60.98
Nuggets Pepsi Center 1999 $164.50 $169.01 $159.57 $163.94 $4.94 $5.07 3.0% 19,099 95 1,800 $36.98 $44.29Pacers Conseco Fieldhouse 1999 $183.00 $188.01 $95.00 $97.60 $88.00 $90.41 48.1% 18,345 66 2,500 $45.79 $42.39Pistons Palace of Auburn Hills 1988 $70.00 $102.13 $70.00 $102.13 $0.00 $0.00 0.0% 22,076 180 1,000 $36.75 $47.50Rockets Toyota Center 2003 $235.00 $218.32 $0.00 $0.00 $235.00 $218.32 100.0% 18,300 80 2,900 $55.59 $41.98Spurs AT&T Center 2002 $186.00 $177.28 $0.00 $0.00 $186.00 $177.28 100.0% 18,797 50 Unknown $45.00 $51.45Suns US Aiways Center 1992 $90.00 $110.01 $54.90 $67.10 $35.10 $42.90 39.0% 18,422 88 2,270 $51.66 $58.26
Supersonics Key Arena 1995 $94.00 $108.53 $19.74 $22.79 $74.26 $85.74 79.0% 17,072 N/A N/A N/A N/ATailblazers Rose Garden 1995 $262.00 $294.25 $46.00 $51.66 $216.00 $242.59 82.4% 19,980 70 2,397 $42.59 $47.34Thunder Ford Center 2002 $89.00 $84.83 $0.00 $0.00 $89.00 $84.83 100.0% 19,599 56 3,380 Unknown $36.35
Timberwolves Target Center Arena 1990 $104.00 $137.80 $0.00 $0.00 $104.00 $137.80 100.0% 20,500 68 0 $40.60 $39.37Wizards Verizon Center 1997 $260.00 $275.85 $200.00 $212.19 $60.00 $63.66 23.1% 20,173 110 3,000 $46.83 $30.89

Table 4 NHL
Team Current VenueOpening Year
Nominal Cost
Real Cost
Nominal Private Funds
Real Private Funds
Nominal Public Funds
Real Public Funds
Public Share Capacity
Luxury Suites
AvailableClub Seats
Average Ticket (2005)
Average Ticket (2008)
Avalanche Pepsi Center 1999 $164.50 $169.01 $159.57 $163.94 $4.94 $5.07 3.0% 18,007 95 1,800 $38.48 $40.62Blackhawks United Center 1994 $175.00 $202.05 $175.00 $202.05 $0.00 $0.00 0.0% 20,500 376 3,100 $34.88 $52.22Blue Jackets Nationwide Arena 2000 $175.00 $175.00 $175.00 $175.00 $0.00 $0.00 0.0% 18,138 78 3,200 $44.08 $47.76
Blues Scottrade Center 1994 $170.00 $196.28 $135.50 $156.45 $34.50 $39.83 20.3% 19,260 91 1,684 $28.23 $29.94Bruins TD Banknorth Garden 1995 $160.00 $179.69 $160.00 $179.69 $0.00 $0.00 0.0% 17,565 104 2,350 $56.44 $61.40
Buffalo Sabres HSBC Arena 1996 $127.50 $139.39 $72.00 $78.72 $55.00 $60.13 43.1% 18,690 80 5,000 $30.07 $36.43Capitals Verizon Center 1997 $260.00 $275.85 $200.00 $212.19 $60.00 $63.66 23.1% 18,672 110 3,000 $38.15 $41.66Coyotes Jobing.com Arena 2003 $180.00 $167.22 $0.00 $0.00 $180.00 $167.22 100.0% 17,799 Unknown Unknown $25.41 $37.45Devils Prudential Center 2007 $375.00 $312.72 $100.00 $83.39 $275.00 $229.33 73.3% 17,625 76 2,200 $54.67 $57.15Flyers Wachovia Center Complex 1996 $206.00 $225.21 $170.50 $186.40 $35.50 $38.81 17.2% 19,519 126 1,880 $55.66 $60.25
Hurricanes RBC Center 1999 $158.00 $162.33 $20.00 $20.55 $138.00 $138.00 87.3% 18,730 75 2,000 $37.91 $38.38Islanders Nassau Veterans Memorial Coliseum 1972 $31.00 $127.32 $0.00 $0.00 $31.00 $127.32 100.0% 16,297 32 153 $44.01 $48.84Kings Staples Center 1999 $375.00 $385.27 $271.50 $278.94 $58.50 $60.10 15.6% 18,118 32 2,500 $45.98 $47.20
Lightning St. Pete's Times Forum 1996 $139.00 $151.96 $0.00 $0.00 $139.00 $151.96 100.0% 19,500 72 3,300 $44.27 $42.41Mighty Ducks Honda Center 1993 $123.00 $145.60 $0.00 $0.00 $123.00 $145.60 100.0% 17,174 84 1,716 $30.32 $43.50Panthers BankAtlantic Center 1998 $212.00 $22.98 $27.30 $0.00 $184.70 $22.98 87.1% 19,452 70 2,300 $44.28 $52.61Penguins Mellon Arena 1961 $22.00 $124.62 $0.00 $0.00 $22.00 $124.62 100.0% 16,958 56 1,696 $36.61 $51.45Predators Sommet Center 1996 $144.00 $157.43 $0.00 $0.00 $144.00 $157.43 100.0% 17,133 70 1,850 $40.78 $47.22Rangers Madison Square Garden 1968 $123.00 $608.87 $123.00 $608.87 $0.00 $0.00 0.0% 18,200 89 3,775 $45.83 $54.96Red Wings Joe Louis Arena 1979 $57.00 $140.87 $0.00 $0.00 $57.00 $140.87 100.0% 20,066 86 0 $43.13 $46.60Sharks HP Pavilion 1993 $162.50 $192.36 $30.00 $35.51 $132.50 $156.84 81.5% 17,496 68 3,000 $33.00 $43.07Stars American Airlines Center 2001 $420.00 $404.89 $210.00 $202.44 $210.00 $202.44 50.0% 18,532 144 1,600 $36.36 $37.80
Thrashers Philips Arena 1999 $213.50 $219.35 $20.25 $20.80 $193.25 $198.54 90.5% 18,545 96 2,893 $43.54 $48.51Wild Xcel Energy Arena 2000 $130.00 $130.00 $0.00 $0.00 $130.00 $130.00 100.0% 18,064 64 2,800 $51.37 $61.28

Figure 2 NFL
0
1
2
3
4
5
1924 1973 1992 1999 2006 2012
NFL Stadium Construction by Year, 1924‐2014

26
Figure 3 NFL
0
20,000
40,000
60,000
80,000
100,000
1924 1973 1992 1999 2006 2012
Average NFL Stadium Capacity, 1924‐2014
27
Figure 4 NFL
0
200
400
600
800
1,000
1,200
1924 1973 1992 1999 2006 2012
Average Real NFL Stadium Cost, 1924‐2014
Values in 2000 USD

28
Figure 5 NFL
0.0%
20.0%
40.0%
60.0%
80.0%
100.0%
1924 1973 1992 1999 2006 2012
Average Public Share of NFL Stadium Financing, 1924‐2014
Average Percent Public Share Average Percent Private Share
29
Figure 6 NFL
0
2,000
4,000
6,000
8,000
10,000
12,000
14,000
16,000
1924 1968 1975 1987 1996 1999 2002 2008 2011
Average NFL Club Seats Available, 1924‐2014
30
Figure 7 NFL
0
100
200
300
400
500
600
700
1924 1968 1975 1987 1996 1999 2002 2008 2011
Average NFL Luxury Suites Available, 1924‐2014

31
Figure 8 MLB
0
0.5
1
1.5
2
2.5
3
3.5
1912 1966 1985 1994 1998 2001 2006 2010
MLB Stadium Construction by Year, 1912‐2012

32
Figure 9 MLB
0
10,000
20,000
30,000
40,000
50,000
60,000
1912 1966 1985 1994 1998 2001 2006 2010
Average MLB Stadium Capacity, 1912‐2012
33
Figure 10 MLB
0
200
400
600
800
1,000
1912 1966 1985 1994 1998 2001 2006 2010
Average Real MLB Stadium Cost, 1912‐2012
Values in 2000 USD

34
Figure 11 MLB
0.0%
20.0%
40.0%
60.0%
80.0%
100.0%
1912 1966 1985 1994 1998 2001 2006 2010
Average Public Share of MLB Stadium Financing, 1912‐2012
Average Percent Public Share Average Percent Private Share

35
Figure 12 NBA
0
1
2
3
4
5
6
1981 1988 1989 1990 1992 1995 1997 1999 2001 2002 2003 2010
NBA Arena Construction by Year, 1981‐2010
36
Figure 13 NBA
15,000
16,000
17,000
18,000
19,000
20,000
21,000
1981 1988 1989 1990 1992 1995 1997 1999 2001 2002 2003 2010
Average NBA Arena Capacity, 1981‐2010

37
Figure 14 NBA
0
100
200
300
400
500
600
1981 1988 1989 1990 1992 1995 1997 1999 2001 2002 2003 2010
Average Real NBA Arena Cost, 1981‐2010

38
Figure 15 NBA
0.0%
20.0%
40.0%
60.0%
80.0%
100.0%
1981 1988 1989 1990 1992 1995 1997 1999 2001 2002 2003 2010
Average Public Share of NBA Arena Financing, 1981‐2010

39
Figure 16 NBA
0
500
1,000
1,500
2,000
2,500
3,000
3,500
4,000
1981 1988 1989 1990 1992 1995 1997 1999 2001 2002 2003 2010
Average NBA Club Seats Available, 1981‐2010

40
Figure 17 NBA
0
20
40
60
80
100
120
140
160
1981 1988 1989 1990 1992 1995 1997 1999 2001 2002 2003 2010
Average NBA Luxury Suites Available, 1981‐2010
41
Figure 18 NHL
00.51
1.52
2.53
3.54
4.5
NHL Arena Construction by Year, 1961‐2010
42
Figure 19 NHL
0
5,000
10,000
15,000
20,000
25,000
Average NHL Arena Capacity, 1961‐2010

43
Figure 20 NHL
0
100
200
300
400
500
600
700Average Real NHL Arena Cost, 1961‐2010
Values in 2000 USD

44
Figure 21 NHL
0.0%
20.0%
40.0%
60.0%
80.0%
100.0%
Average Public Share of NHL Arena Financing, 1961‐2010
45
Figure 22 NHL
0
500
1,000
1,500
2,000
2,500
3,000
3,500
4,000
1961 1968 1972 1979 1993 1994 1995 1996 1997 1998 1999 2000 2001 2003 2007 2010
Average NHL Club Seats Available, 1961‐2010

46
Figure 23 NHL
0
50
100
150
200
250
1961 1968 1972 1979 1993 1994 1995 1996 1997 1998 1999 2000 2001 2003 2007 2010
Average NHL Luxury Suites Available, 1961‐2010

47
Table 5 NFL
Team Arena Opened Total Cost Private Financing
Public Financing Public Financing Legislation Referendum?
49ers 49ers Stadium 2014 937 823 114The City of Santa Clara will subsidize stadium construction with non‐tax
revenues.
A timeframe for public vote is currently being established. The original proposal establishes the Santa Clara Stadium Authority to own and operate the stadium, in order to ensure that City General Fund revenues are not used. Stadium construction
costs are to be offset by facility revenues.
Y
Bengals Paul Brown Stadium 2000 450 25 424 Bond sales and parking revenues Hamilton County voters approve half cent sales tax to pay off $322 million bond in 1996 Y
Broncos Invesco Field at Mile High 2001 364.2 91.05 273.15 Denver passes 1 cent per 10 dollar tax
on retail goods in Metro Denver
Voters in the six‐county area that comprises Metro Denver approved a plan for the stadium that included an extended sales tax increase on
November 3, 1998.
Y
Browns Cleveland Browns Stadium 1999 290 71 210 Taxpayer subsidy from alcohol and
tobacco tax Taxpayers pass alcohol and tobacco taxes in 1996 Y
Buccaneers Raymond James Stadium 1998 168.5 0 168.5
Financed by 0.05 percent rebate and tourist development tax, $20 million in Florida state sales tax revenue and $11 million in community development tax.
City of Tampa, Hillsborough County legislatures pass community development tax in 1995 Y
Cardinals University of Phoenix Stadium 2006 455 169 285 Arizona Sports and Tourism Authority
issues bonds secured by tax revenueMaricopa county voters approve stadium financing
legislation by referendum vote in 2000 Y
Chargers New Chargers Stadium N/A 400 N/A N/A No information available No information available
Colts Lucas Oil Stadium 2008 720 108 612 Tax passed on pull tab machines and slot machines in Marion county
Legislators pass tax on slot Machines in Marion county. Plan also approved in pan City‐County
council. No referendum vote.
Cowboys Cowboys Stadium 2009 1150 675 325
Arlington measure raises the city sales tax by a half‐cent, hotel occupancy tax by 2 percent, and car rental tax by 5
percent.
Arlington voters approve stadium financing package in November 2004 Y
Eagles Lincoln Financial Field 2003 518 330 188
City contributes $304 million in tax funds, $170 million furnished by the
state.
State of Pennsylvania approves its share of stadium funding 2 Feb 1999. Philadelphia approves its share 9 Dec. 2000. Non referendum vote
Expansion Team LA Stadium 2011 800 800 0
Stadium is privately financed, but will benefit from $500 million bond package
for infrastructure.
Voters of Industry, CA approve property tax‐secured bonds to fund major commercial
development including and surrounding the new LA stadium in January 2009.
Y
48
Team Arena Opened Total Cost Private Financing
Public Financing Public Financing Legislation Referendum?
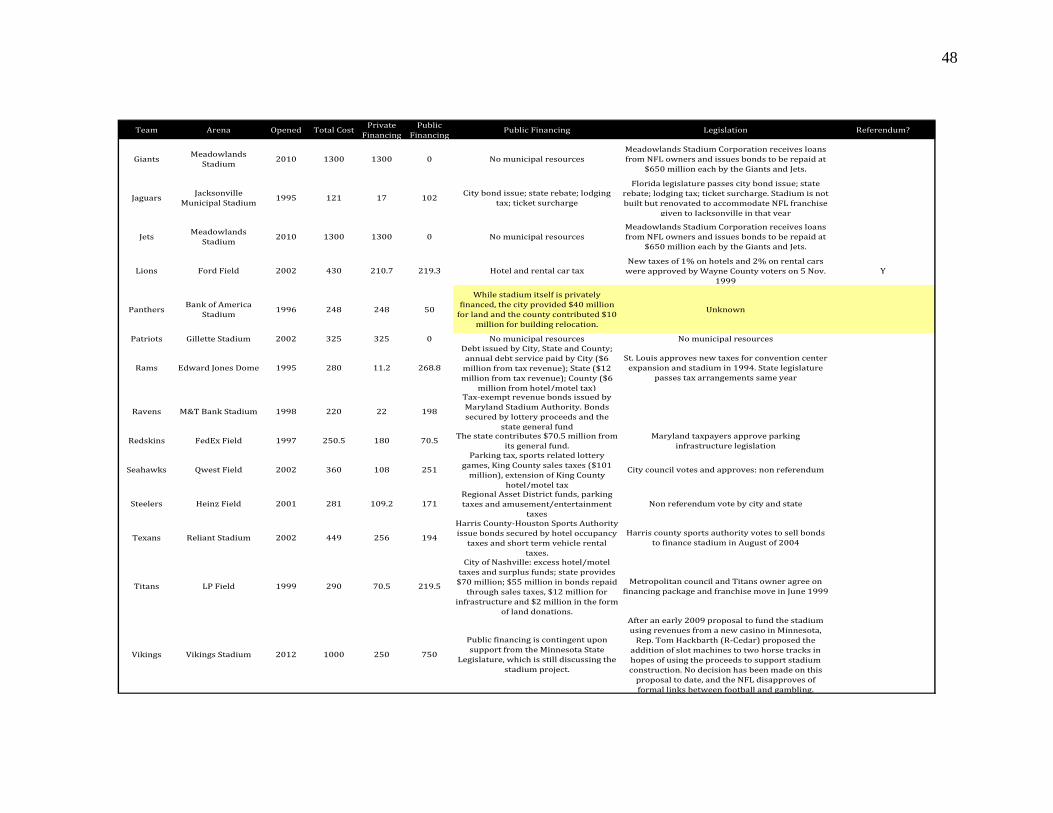
Giants Meadowlands Stadium 2010 1300 1300 0 No municipal resources
Meadowlands Stadium Corporation receives loans from NFL owners and issues bonds to be repaid at
$650 million each by the Giants and Jets.
Jaguars Jacksonville Municipal Stadium 1995 121 17 102 City bond issue; state rebate; lodging
tax; ticket surcharge
Florida legislature passes city bond issue; state rebate; lodging tax; ticket surcharge. Stadium is not built but renovated to accommodate NFL franchise
given to Jacksonville in that year
Jets Meadowlands Stadium 2010 1300 1300 0 No municipal resources
Meadowlands Stadium Corporation receives loans from NFL owners and issues bonds to be repaid at
$650 million each by the Giants and Jets.
Lions Ford Field 2002 430 210.7 219.3 Hotel and rental car taxNew taxes of 1% on hotels and 2% on rental cars were approved by Wayne County voters on 5 Nov.
1999Y
Panthers Bank of America Stadium 1996 248 248 50
While stadium itself is privately financed, the city provided $40 million for land and the county contributed $10
million for building relocation.
Unknown
Patriots Gillette Stadium 2002 325 325 0 No municipal resources No municipal resources
Rams Edward Jones Dome 1995 280 11.2 268.8
Debt issued by City, State and County; annual debt service paid by City ($6 million from tax revenue); State ($12 million from tax revenue); County ($6
million from hotel/motel tax)
St. Louis approves new taxes for convention center expansion and stadium in 1994. State legislature
passes tax arrangements same year
Ravens M&T Bank Stadium 1998 220 22 198
Tax‐exempt revenue bonds issued by Maryland Stadium Authority. Bonds secured by lottery proceeds and the
state general fund
Redskins FedEx Field 1997 250.5 180 70.5 The state contributes $70.5 million from its general fund.
Maryland taxpayers approve parking infrastructure legislation
Seahawks Qwest Field 2002 360 108 251
Parking tax, sports related lottery games, King County sales taxes ($101 million), extension of King County
hotel/motel tax
City council votes and approves: non referendum
Steelers Heinz Field 2001 281 109.2 171Regional Asset District funds, parking taxes and amusement/entertainment
taxesNon referendum vote by city and state
Texans Reliant Stadium 2002 449 256 194
Harris County‐Houston Sports Authority issue bonds secured by hotel occupancy taxes and short term vehicle rental
taxes.
Harris county sports authority votes to sell bonds to finance stadium in August of 2004
Titans LP Field 1999 290 70.5 219.5
City of Nashville: excess hotel/motel taxes and surplus funds; state provides $70 million; $55 million in bonds repaid through sales taxes, $12 million for
infrastructure and $2 million in the form of land donations.
Metropolitan council and Titans owner agree on financing package and franchise move in June 1999
Vikings Vikings Stadium 2012 1000 250 750
Public financing is contingent upon support from the Minnesota State
Legislature, which is still discussing the stadium project.
After an early 2009 proposal to fund the stadium using revenues from a new casino in Minnesota, Rep. Tom Hackbarth (R‐Cedar) proposed the addition of slot machines to two horse tracks in hopes of using the proceeds to support stadium construction. No decision has been made on this proposal to date, and the NFL disapproves of formal links between football and gambling.

49
Table 6 MLB
Team Arena Opened Total Cost
Public Financing
Private Financing Public Financing Legislation Referendum?
Astros Minute Maid Park 2000 250 180 85 Harris County approves 2% hotel tax and 5% rental car tax
Voters of Harris County approve ballot measure for downtown Houston park on 5 Nov. 1996 Y
Athletics Cisco Field 2012 500 Unknown UnknownBraves Turner Field 1997 239 239 0 No municipal resources No municipal resources
Brewers Miller Park 2001 382 252 90 0.10 cent sales tax passed in 5 county area Voters approve 0.10 cent sales tax enforced by Southeast Wisconsin Professional Baseball District; takes effect in 1996 Y
Giants SBC Park 2000 255 15 291 Tax increment funds secured by City Redevelopment Agency.
No legislation: private funds take loan out against personal credit and finance remainder of field directly
Mariners Safeco Field 1999 517 372 145
King county approves 0.5‐cent tax on prepared food in restaurants and bars, two‐percent rental car tax, commemorative license plates, sports theme lottery scratch games,.071 percent of an
existing sales tax.
Proposal to increase the sales tax by 0.01% in King County is narrowly defeated by voters 19 Sept. 1995. Special session of the legislature is called 14 Oct. 1995 to
authorize funding package for new stadium that includes credit against the state sales tax, sale of special stadium license plates, lottery funds, food & beverage tax in King County restaurants and bars and car rental surcharge in King County, and ballpark
admissions tax. King County Council approves package on 23 Oct.
Y
Mets Citi Field 2009 632 164 528
City contributes $89.7 million in capital funds, New York State provides 74.7 million in rent
credits. Mets receive $528 million in bonds from the City, subject to gradual reimbursement.
$632 million in bonds were approved for financing construction in March 2006. An additional $83 million were approved in January 2009 in order to complete the final phases of construction. In addition to tax‐exempt bond financing, New York City and New York State financially supported construction by paying for infrastructure
improvements needed (totaling approximately $177 million) as well as bestowing sales tax exemptions on construction materials and equipment and giving the Mets a
property tax exemption. The City’s Industrial Development Agency (IDA) owns the land under Citi Field but does not require the Mets to pay rent for use of the property; the Mets do pay for maintenance and upkeep of the land. As part of their agreement with the City, the Mets have entered a non‐relocation agreement, promising to stay in New York City for another 35 years. According to a 2009 joint report by the IBO and the IDA, the total public sector cost of subsidies – from New York City, New York State, and the
Metropolitan Transportation Authority (MTA) – total $371 million.

50
Team Arena Opened Total Cost
Public Financing
Private Financing Public Financing Legislation Referendum?
Nationals Nationals Park 2008 611 611 0City sells 610.8 million in bonds secured by taxes on stadium tickets, concessions and merchandise;
new business tax.City council adopts stadium financing package by vote of 7 to 6 in 2004.
Pirates PNC Park 2001 216 151 40
The Regional Asset District (RAD) contributes $13.4M annually to finance $170M in bonds. The county hotel tax contributes $8M annually to
finance $99M in bonds. A 5% surcharge on Pirates and Steelers tickets raises $3M annually to finance $22M in bonds. A 1% wage tax is levied on players who do not live in the city, and will add $7M to the project. $300M in matching funds from the state.
$36M in interest earnings. $28M in federal infrastructure improvements
Voters reject 1997 referendum to raise taxes; Regional Asset District approves 143 million dollar financing share in July 1998, and state legislators agree to provide 75
million in the 1998 legislative sessionY
Reds Great American Ballpark 2003 320 262 58 Sales tax increase of .05/1 dollar
In March 1996, Cincinnati voters approved a half‐cent‐per‐dollar sales tax increase to build separate stadiums for Cincinnati's Reds and Bengals. The budget for both stadiums was $544 million. However, the Bengals new stadium alone exceed that amount. In November of 1998, Cincinnati voters chose to build a stadium on the waterfront and ruled out a popular ballpark proposal referred to as Broadway
Commons.
Y
Twins Metrodome 1982 124 115 9 Countywide .15 percent sales tax increaseTwins reject 2002 legislation from Minnessota to approve ballpark because
county/state contribution is too small. Hennepin County votes on a .15 percent tax increase to fund its share of the construction costs
Y
Yankees Yankee Stadium II 2009 1,600 220 800
New York City contributes for parking facilities ($75 million), parkland along the waterfront ($135 million) and other work related to the stadium
Voters approve legislation that provides for Bronx development in 2005 Y

51
Table 7 NBA
Team Arena Opened Total Cost
Public Financing
Private Financing Public Financing Legislation Referendum?
76ers Wachovia Center Complex 1996 206 36 171 None
Primarily private financing from loans and Spectator; city and state make contributions for infrastructure: legislation will feature re‐
design and transportation
Bobcats Time Warner Cable Arena 2005 265 265 0 GHotel and rental car tax
Voters reject an arts package referendum to build arena and other complexes in 2001.
Charlotte‐Mecklenburg city council approved proposal to build in 2002 without
a referendum vote
Y
Celtics TD Banknorth 1995 160 0 160 None Financing is private: no legislationClippers Staples Center 1999 375 59 272
Hawks Philips Arena 1999 214 193 20 3% rental car tax and bonds to be repaid in arena revenues
Georgia legislature authorizes car rental tax in 1996 to repay bonds for arena
Heat Miami Arena 1988 213 0 213 No municipal resources No municipal resources
Hornets New Orleans Arena 1999 84 84 0Metropolitan Area Projects imposes a 1
cent sales tax to fund arena construction
Voters approve sales tax on December 14, 1993 Y
Lakers Staples Center 1999 375 59 272 No municipal resources No municipal resources
Magic Amway Center 2010 480 322 158
Orange County Tourist Tax on hotel occupancy raised to 6% in 2006. $100 million of arena cost covers land and
infrastructure.
Orange County, FL commission approved construction of events and recreation center
by 5‐2 vote in 2007. City of Orlando approved construction project by vote of 6‐1
in 2008.
Mavericks American Airlines Center 2001 420 210 210 Hotel and rental car tax Dallas taxpayers approved a new hotel tax
and rental car tax in 1998 Y
Nets Barclays Center 2010 637 150 487
Arena financing contingent upon IRS ruling to allow $800 million in tax‐
exempt bonds. Community opposition to use of eminent domain for land
seizures has delayed groundbreaking.
Unknown
Nuggets Pepsi Center 1999 165 5 160 No municipal resources No municipal resources
Pacers Conseco Fieldhouse 1999 183 88 95
City Capital Improvement Board enters into franchise agreement with Comcast and Time Warner to divert portions of cable bill revenues to Pacers and arena
funding
Capital Improvement Board approves fund diversion to Conseco project in 1998
Spurs AT&T Center 2002 186 186 0County sells bonds to finance arena in December 2000; bonds are repaid through hotel and car rental taxes
Bexar county voters pass tax referendum in November 1999 Y
Wizards Verizon Center 1997 260 60 200 No municipal resources No municipal resources
52
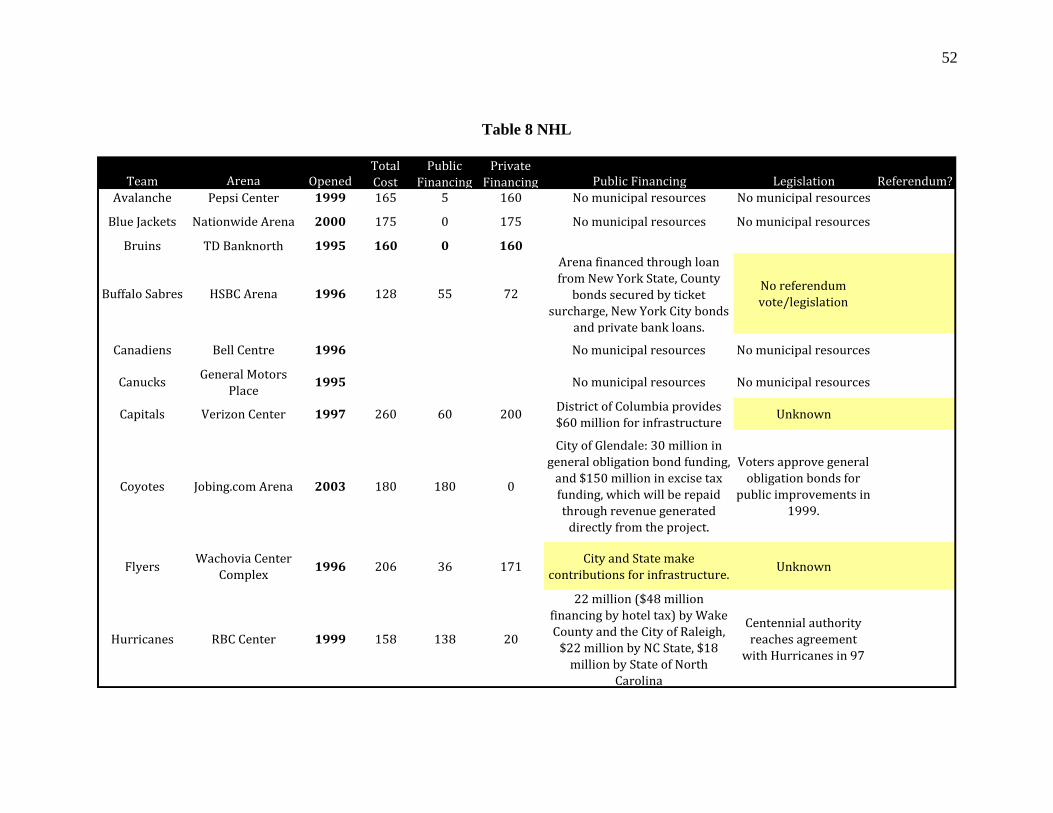
Table 8 NHL
Team Arena OpenedTotal Cost
Public Financing
Private Financing Public Financing Legislation Referendum?
Avalanche Pepsi Center 1999 165 5 160 No municipal resources No municipal resources
Blue Jackets Nationwide Arena 2000 175 0 175 No municipal resources No municipal resources
Bruins TD Banknorth 1995 160 0 160
Buffalo Sabres HSBC Arena 1996 128 55 72
Arena financed through loan from New York State, County bonds secured by ticket
surcharge, New York City bonds and private bank loans.
No referendum vote/legislation
Canadiens Bell Centre 1996 No municipal resources No municipal resources
Canucks General Motors Place 1995 No municipal resources No municipal resources
Capitals Verizon Center 1997 260 60 200 District of Columbia provides $60 million for infrastructure Unknown
Coyotes Jobing.com Arena 2003 180 180 0
City of Glendale: 30 million in general obligation bond funding, and $150 million in excise tax funding, which will be repaid through revenue generated directly from the project.
Voters approve general obligation bonds for
public improvements in 1999.
Flyers Wachovia Center Complex 1996 206 36 171 City and State make
contributions for infrastructure. Unknown
Hurricanes RBC Center 1999 158 138 20
22 million ($48 million financing by hotel tax) by Wake County and the City of Raleigh, $22 million by NC State, $18 million by State of North
Carolina
Centennial authority reaches agreement with Hurricanes in 97

53
Team Arena OpenedTotal Cost
Public Financing
Private Financing Public Financing Legislation Referendum?
Kings Staples Center 1999 375 59 272
Lightning St. Pete's Times Forum 1996 139 139 0
State sales tax bonds; county tourist tax bonds; city parking bonds; county ticket surcharge; city ticket surcharge; private
revenue bonds.
Legislature passes bonds and tax
increases for financing
Maple Leafs Air Canada Centre 1999 No municipal resources No municipal resources
Panthers BankAtlantic Center 1998 212 185 27 Broward county bonds secured
by 2% tourism tax
Legislature passes tax increases and bond
payments
Penguins Consol Energy Center 2010 321 0 321 No municipal resources No municipal resources
Predators Sommet Center 1996 144 144 0 General obligation bonds issued by city of Nashville
Nashville city council passes bonds to fund
arena
Stars American Airlines Center 2001 420 210 210
City issues bonds secured by 5% rental car tax, 2% hotel tax and $3.4 million per year lease
agreement.
Initial $125 million funding package passed by 1,600 votes in 1998
Thrashers Philips Arena 1999 214 193 20
Taxable revenue bonds secured by stadium revenues. $62
million in public infrastructure costs financed by 3% car rental tax and $20 million from Time
Warner Cable.
Unknown
Wild Xcel Energy Arena 2000 130 130 0 Property taxes (PILT) and city of St. Paul
State of Minnesota voters pass legislation to fund portion of arena
on 10 Apr 1998
Y