trends in the canadian mortgage market: before and during
TRANSCRIPT

Catalogue no. 11‑621‑M ISSN 1707‑0503 ISBN 978‑0‑660‑37482‑6
by Michael Daoust, Matthew Hoffarth and Thomas Haines
Trends in the Canadian mortgage market: Before and during COVID-19
Release date: February 17, 2021
Analysis in Brief

How to obtain more informationFor information about this product or the wide range of services and data available from Statistics Canada, visit our website, www.statcan.gc.ca. You can also contact us by Email at STATCAN.infostats‑[email protected] Telephone, from Monday to Friday, 8:30 a.m. to 4:30 p.m., at the following numbers:
• Statistical Information Service 1‑800‑263‑1136 • National telecommunications device for the hearing impaired 1‑800‑363‑7629 • Fax line 1‑514‑283‑9350
Depository Services Program
• Inquiries line 1‑800‑635‑7943 • Fax line 1‑800‑565‑7757
Note of appreciationCanada owes the success of its statistical system to a long‑standing partnership between Statistics Canada, the citizens of Canada, its businesses, governments and other institutions. Accurate and timely statistical information could not be produced without their continued co‑operation and goodwill.
Standards of service to the publicStatistics Canada is committed to serving its clients in a prompt, reliable and courteous manner. To this end, Statistics Canada has developed standards of service that its employees observe. To obtain a copy of these service standards, please contact Statistics Canada toll‑free at 1‑800‑263‑1136. The service standards are also published on www.statcan.gc.ca under “Contact us” > “Standards of service to the public.”
Published by authority of the Minister responsible for Statistics Canada
© Her Majesty the Queen in Right of Canada as represented by the Minister of Industry, 2021
All rights reserved. Use of this publication is governed by the Statistics Canada Open Licence Agreement.
An HTML version is also available.
Cette publication est aussi disponible en français.

Table of contents
Acknowledgements .................................................................................................................................. 4
Introduction .............................................................................................................................................. 5
Household mortgage debt leading into and during the pandemic .......................................................... 5
New mortgage lending hits record level as home sales post sharp but short‑lived decline .................... 7
Strength in new lending fuelled by originations and renewals ................................................................. 9
Household borrowers react to interest rate environment and shift term preferences ............................ 10
Chartered banks provide the bulk of mortgage financing and deferrals ................................................ 12
Debt service ratios drop as households defer mortgage payments ...................................................... 13
Expected credit losses grow, but represent only a small proportion of overall mortgage debt ............. 13
Growth in overall household debt during COVID‑19 led by mortgage borrowing ................................. 14
References ............................................................................................................................................. 15
Statistics Canada – Catalogue no. 11-621-M 3
Trends in the Canadian mortgage market: Before and during COVID-19

Acknowledgements
This work would not have been possible without the invaluable contributions and expertise of innumerable dedicated staff from Statistics Canada including Carolina Cabañas‑Leòn, Gilbert Côté, Lydia Couture, Yves Gauthier, Lei He, Dragos Ifrim, Matthew Kelly, Dave Krochmalnek, Denise Lafleur, Alexander Li, Alexander McGuire, Daniela Ravindra, Étienne Saint‑Pierre, Akram Sirag, and Jennifer Withington.
Statistics Canada – Catalogue no. 11-621-M4
Trends in the Canadian mortgage market: Before and during COVID-19

Trends in the Canadian mortgage market: Before and during COVID-19
by Michael Daoust, Matthew Hoffarth and Thomas Haines
Introduction
This is the first in a series of papers exploring the trends in borrowing activity observed among Canadian households and businesses leading up to and during 2020. It draws analysis from a wide array of sources, including Statistics Canada’s National Balance Sheet Accounts and Monthly Credit Aggregates, as well as information from Statistic Canada’s Mortgage Loans Report and the Bank of Canada’s Report on New and Existing Lending. The focus of this paper is on household mortgage borrowing, that is, the debt acquired to finance the purchase of a property.
Household mortgage debt leading into and during the pandemic
Following the financial crisis in 2008, significant attention was directed to ensuring stability in financial markets around the world and avoiding the type of risky lending that could result in a new contagion in the financial system. By late 2015, concerns about the strength of Canada’s housing market were beginning to grow, with fears that the markets were overheating in several Canadian cities. In January 2017, in an attempt to address these risks, the Office of the Superintendent of Financial Institutions (OSFI) implemented several new restrictions. These included an interest‑rate stress test for all mortgages and, to help curb property speculation, new rules that exempt foreign buyers from earning tax‑free capital gains on residential properties.1 As property prices and debt levels continued to rise in many parts of the country, additional concerns grew about the mortgage market’s exposure to interest rate risks resulting from historically low interest rates and record high loan‑to‑value ratios.2 To help limit risk in this type of lending, in January 2018, OSFI updated its mortgage underwriting guidelines (known as the B‑20 guidelines) to require more stringent stress tests for all uninsured mortgages.3
Source: Statistics Canada, Table 36-10-0639-01, Credit liabilities of households; Canadian Mortgage and Housing Corporation (CMHC), Residential Mortgage Industry Report, September 2020.
Chart 1Year-over-year growth rate of household residential mortgage debt
percent
0
2
4
6
8
10
12
14
16
20% down payment implemented for rental
properties
Max amortization period shortened to 30 years
Interest rate stress tests implemented
B-20 guidelines implemented
Max amortization period shortened to 35 years; 5% minimum down payment
established
Max amortization period shortened to 25 years
Feb-
00
Oct-00
Feb-1
4
Jun-1
3
Oct-12
Feb-1
2
Jun-1
1
Jun-
07
Jun-
09
Oct-10
Feb-1
0
Oct-08
Feb-
08
Oct-06
Feb-
06
Jun-
05
Oct-04
Feb-
04
Jun-
03
Oct-02
Feb-
02
Jun-
01
Jun-1
9
Oct-20
Feb-
20
Oct-18
Feb-1
8
Jun-1
7
Oct-16
Feb-1
6
Jun-1
5
Oct-14
Updated
1. Canada Mortgage and Housing Corporation, Residential Mortgage Industry Report – September 2020.2. In July 2017, the balance of uninsured mortgages surpassed the balance of insured mortgages for the first time since 2011. Uninsured mortgages as a proportion of total mortgage balances
have accelerated. Statistics Canada, Table 10-10-0134-01, Chartered banks, mortgage loans report, end of period, Bank of Canada.3. Office of the Superintendent of Financial Institutions, Residential Mortgage Underwriting Practices and Procedures Guideline (B-20).
Statistics Canada – Catalogue no. 11-621-M 5
Trends in the Canadian mortgage market: Before and during COVID-19

In the years leading up to the financial crisis of 2008, the stock of outstanding household residential mortgage debt maintained double‑digit or near double‑digit annual growth. Following the crisis, growth remained above 4.5% year‑over‑year. This persisted until 2018 when, at the same time as mortgage underwriting standards began to tighten, the Bank of Canada implemented a series of increases to their policy rate. What ensued was a period of relatively tepid growth in the stock of outstanding mortgage debt, slowing to just above 3% in 2019 and marking a moderate departure from prior trends. On a year‑over‑year basis, the growth in mortgage debt hit its lowest point in nearly two decades, falling to 3.0% in February 2019, after which mortgages rebounded and continued on a path of accelerating growth for the remainder of 2019.
Throughout 2020, mortgage borrowing has remained relatively strong, with households adding nearly $108 billion in mortgage debt by November compared with less than two‑thirds of that amount in 2019 and just under $46 billion in 2018.4 Government‑orchestrated measures, such as the Canadian Economic Recovery Benefit, the six‑month mortgage deferral option offered by financial institutions and reductions to the Bank of Canada’s policy rate to its lowest level since the 2009 financial crisis have helped support the housing market while mortgage borrowing has remained resilient.
Source: Statistics Canada, Table 38-10-0238-01, Household sector credit market summary table, seasonally adjusted estimate; Table 36-10-0112-01 Current and capital accounts - Households, Canada, quarterly.
Chart 2Household mortgage debt as a proportion of household disposable income
percent
60
70
80
90
100
110
120
130
2000Q
1
2001
Q1
2002
Q1
2003
Q1
2004Q
1
2005
Q1
2006Q
1
2007
Q1
2008
Q1
2009Q
1
2010
Q1
2011
Q1
2012
Q1
2013
Q1
2014
Q1
2015
Q1
2016
Q1
2017
Q1
2018
Q1
2019
Q1
2020
Q1
Household mortgage debt as a proportion of disposable income has risen since early 2001. This ratio is an indicator of how well households can manage their debt with their current income. The oil‑induced economic shock that occurred in early 2015 pushed the ratio up sharply as household incomes felt the pinch of lower compensation. The ratio subsequently plateaued and remained relatively stable over the period of 2016 to 2019, during which mortgage borrowing guidelines were tightened. This persisted until the second quarter of 2020, when the ratio experienced a significant contraction, not as a result of reduced borrowing, but because of strong growth in disposable income. This was fuelled by assistance from all levels of government to help diminish the economic impact of COVID‑19. Disposable incomes rose 12.7% on a seasonally adjusted basis in the second quarter of 2020 from the fourth quarter of 2019, with government transfers up 103.4% over the same period; mortgage credit rose a more modest 3.3%.5,6 If mortgage borrowing remains robust and income decreases back to pre‑pandemic levels, then households may find themselves with record levels of mortgage debt relative to their current disposable income in subsequent quarters.
4. Statistics Canada, Monthly Credit Aggregates, Table 36-10-0639-01 Credit liabilities of households.5. Statistics Canada table 36-10-0112-01 Current and capital accounts – households, Canada, quarterly.6. Statistics Canada table 38-10-0238-01 Household sector credit market summary table, seasonally adjusted estimates.
Statistics Canada – Catalogue no. 11-621-M6
Trends in the Canadian mortgage market: Before and during COVID-19

New mortgage lending hits record level as home sales post sharp but short-lived decline
The amount of new lending by chartered banks reached record levels in the first half of 2020, driven in part by significant declines in the costs of borrowing and resilient demand for housing. This lending, which represents the origination of new mortgages for the purchase of residential properties and the refinancing and renewals of existing mortgages, surpassed $42 billion on a seasonally adjusted basis for the first time in March. The change in the outstanding stock of mortgage debt is a combination of this new lending less the repayment of existing debt, with the expansion of new lending persisting in the latter half of the year.
Source: Bank of Canada Report on New and Existing Lending (A4). Statistics Canada, Table 36-10-0639-01, Credit liabilities of households.
Chart 3Monthly new mortgage lending versus growth in outstanding mortgage balances
billions $CAD percent
0.0
0.1
0.2
0.3
0.4
0.5
0.6
0.7
0.8
0.9
1.0
0
5
10
15
20
25
30
35
40
45
50
55
Jan-17 Apr-17 Jul-17 Oct-17 Jan-18 Apr-18 Jul-18 Oct-18 Jan-19 Apr-19 Jul-19 Oct-19 Jan-20 Apr-20 Jul-20 Oct-20
Monthly new residential mortgage lending to indviduals, seasonally adjusted (left axis)
Monthly growth in seasonally adjusted household residential mortgage debt (right axis)
With only essential services able to operate in late March, many parts of the economy were brought to a standstill. Stay‑at‑home orders severely restricted the ability of home sellers to hold open houses, which prevented visits from interested property buyers. While buyers and sellers coped with these limitations, climbing unemployment and increased uncertainty about the future put considerable downward pressure on the housing market, with April marking the lowest sales figure since the late 1980s.7 However this decline was short lived and as restrictions eased, the number of homes sold rebounded quickly, setting records for monthly growth in May, June and July.8,9 Despite the initial slowdown caused by COVID‑19 restrictions, cumulative January‑to‑December resales were 12.6% higher in 2020 than over the same period a year earlier.
7. On an unadjusted basis, the number of MLS units sold experienced a record 52.1% monthly decline from March to April, down 57.3% from April 2019.8. Housing sales can be measured as the number of existing residential units sold within a period or the combined dollar value of these unit sales.9. On an unadjusted basis, the number of MLS units sold in July rose to a record 63,402 units, up 32.0% from July 2019.
Statistics Canada – Catalogue no. 11-621-M 7
Trends in the Canadian mortgage market: Before and during COVID-19

Source: Canadian Real Estate Association (CREA), Haver Analytics, Statistics Canada calculations. Bank of Canada Report on New and Existing Lending (A4).
Chart 4Number of Multiple Listing Service (MLS) units sold and mortgage related lending, monthly
billions $CAD
Jan-1
0
May-10
Jan-1
7
Sep-16
May-16
Jan-1
6
Sep-15
Sep-13
Sep-14
May-15
Jan-1
5
May-14
Jan-1
4
May-13
Jan-1
3
Sep-12
May-12
Jan-1
2
Sep-11
May-11
Jan-1
1
Sep-10
Sep-19
May-2
0
Jan-
20
May-19
Jan-1
9
Sept-1
8
May-18
Jan-1
8
Sep-17
May-17
0
10,000
20,000
30,000
40,000
50,000
60,000
70,000
0
10
20
30
40
50
60
units sold
Sep-2
0
New mortgage lending, seasonally adjusted (left axis) MLS units sold, seasonally adjusted (right axis)
Table 1 Monthly growth in seasonally adjusted mortgage lending and Multiple Listing Service sales
Reference Period20-Jan 20-Feb 20-Mar 20-Apr 20-May 20-Jun 20-Jul 20-Aug 20-Sep 20-Oct Nov-20 Dec-20
percent
New mortgage lending, seasonally adjusted 2.2 7.5 1.6 0.7 -11.9 -14.1 7.6 23.4 12.6 2.2 -0.6 1.6MLS units sold, seasonally adjusted 0.4 11.0 -14.7 -68.2 71.6 104.9 28.8 1.3 3.2 -2.9 -6.2 -2.6
Source: Canadian Real Estate Association (CREA), Haver Analytics, Statistics Canada calculations. Bank of Canada Report on New and Existing Lending (A4). MLS – Multiple Listing Service.
Although resale activity fell significantly in March, followed by a record monthly decline in April, the impact on new lending would not become apparent until May, when the demand for funds declined in response to the preceding drop in sales activity. Typically, there can be a lag of up to three months between when a sales agreement is signed and when the funds are actually transferred. Despite this decline in sales through April, new lending decreased only modestly in May and June as mortgage refinancing and renewals helped dampen the impact of the decline in sales. Similarly, the sharp recovery in housing demand was mirrored by growth in new lending later in the year.
As time spent at home increased during the pandemic, shifting housing preferences coupled with pent up demand pushed home sales to record levels throughout the summer. As of October, over one‑quarter of Canadians (2.4 million individuals) who would not normally work from home were doing so, while the number of Canadians working at locations other than home was little changed.10 Working from home continues to be an important adaptation to COVID‑19 health risks, and this new reality has likely increased the importance of securing suitable housing options. According to the Bank of Canada’s Monetary Policy Report, more than one‑quarter of respondents to the Canadian Survey of Consumer Expectations for the third quarter of 2020 reported that they would like to move to a larger or single family home because of the pandemic.11
10. Statistics Canada Labour Force Survey - October 2020. 11. Bank of Canada Monetary Policy Report – October 2020.
Statistics Canada – Catalogue no. 11-621-M8
Trends in the Canadian mortgage market: Before and during COVID-19
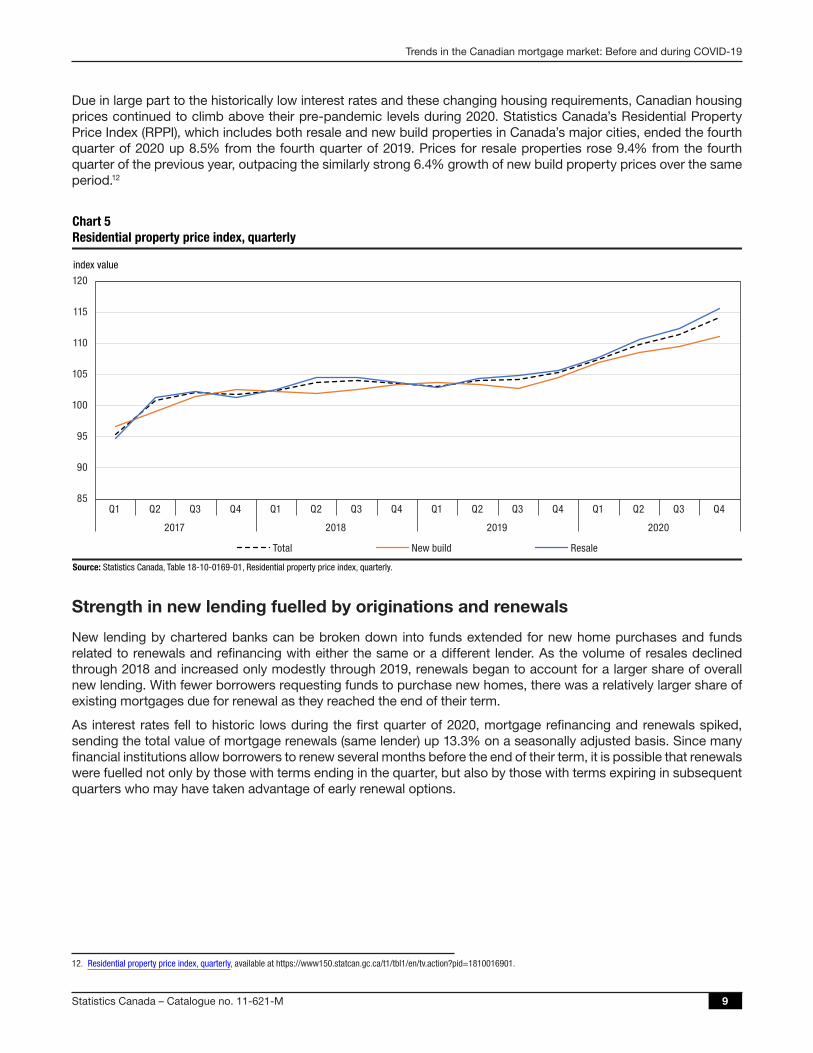
Due in large part to the historically low interest rates and these changing housing requirements, Canadian housing prices continued to climb above their pre‑pandemic levels during 2020. Statistics Canada’s Residential Property Price Index (RPPI), which includes both resale and new build properties in Canada’s major cities, ended the fourth quarter of 2020 up 8.5% from the fourth quarter of 2019. Prices for resale properties rose 9.4% from the fourth quarter of the previous year, outpacing the similarly strong 6.4% growth of new build property prices over the same period.12
Source: Statistics Canada, Table 18-10-0169-01, Residential property price index, quarterly.
Chart 5Residential property price index, quarterly
index value
Total New build Resale
85
90
95
100
105
110
115
120
Q1 Q2 Q3 Q4 Q1 Q2 Q3 Q4 Q1 Q2 Q3 Q4 Q1 Q2 Q3 Q4
2017 2018 2019 2020
Strength in new lending fuelled by originations and renewals
New lending by chartered banks can be broken down into funds extended for new home purchases and funds related to renewals and refinancing with either the same or a different lender. As the volume of resales declined through 2018 and increased only modestly through 2019, renewals began to account for a larger share of overall new lending. With fewer borrowers requesting funds to purchase new homes, there was a relatively larger share of existing mortgages due for renewal as they reached the end of their term.
As interest rates fell to historic lows during the first quarter of 2020, mortgage refinancing and renewals spiked, sending the total value of mortgage renewals (same lender) up 13.3% on a seasonally adjusted basis. Since many financial institutions allow borrowers to renew several months before the end of their term, it is possible that renewals were fuelled not only by those with terms ending in the quarter, but also by those with terms expiring in subsequent quarters who may have taken advantage of early renewal options.
12. Residential property price index, quarterly, available at https://www150.statcan.gc.ca/t1/tbl1/en/tv.action?pid=1810016901.
Statistics Canada – Catalogue no. 11-621-M 9
Trends in the Canadian mortgage market: Before and during COVID-19

Source: Statistics Canada, Mortgage Loans Report (ES).
Chart 6Seasonally adjusted lending by purpose
billions $CAD
0
10
20
30
40
50
60
70
New purchase Same refinancing Same renewal Other refinancing and renewal
2018 Q1 2018 Q2 2018 Q3 2018 Q4 2019 Q1 2019 Q2 2019 Q3 2019 Q4 2020 Q1 2020 Q2 2020 Q3
Household borrowers react to interest rate environment and shift term preferences
Mortgage lending data from chartered banks show that Canadians generally prefer five‑year fixed‑rate mortgages, with this loan type accounting for 49% of the total outstanding balance of existing mortgages in late 2020 compared with just under 42% in early 2019.13 New loan preferences fluctuate as the interest rate environment changes, for example, the popularity of five‑year fixed‑rate mortgages has grown substantially since the beginning of 2019 as fixed‑term mortgages became available at similar or even lower rates than their variable‑term counterparts. As interest rates dropped in March 2020, the demand for variable‑rate mortgages spiked, while longer‑term rates were slower to adjust. As longer‑term rates began to mirror the decline in variable rates, growth in demand for five‑year fixed‑rate mortgages accelerated into the summer.
13. Bank of Canada Report on New and Existing Lending (A4).
Statistics Canada – Catalogue no. 11-621-M10
Trends in the Canadian mortgage market: Before and during COVID-19

Source: RateHub – Historical Mortgage Rates in Canada.
Chart 7Discount mortgage rates by type and term
percent
Five-year variable-rate mortgage Five-year fixed-rate mortgage
0.0
0.5
1.0
1.5
2.0
2.5
3.0
3.5
Jan-16 May-16 Sep-16 Jan-17 May-17 Sep-17 Jan-18 May-18 Sep-18 Jan-19 May-19 Sep-19 Jan-20 May-20 Sep-20
Source: Bank of Canada, Report on New and Existing Lending (A4).
Chart 8Seasonally adjusted monthly residential mortgage new funds advanced by loan term
billions $CAD
0
5
10
15
20
25
Jan-16 May-16 Sep-16 Jan-17 May-17 Sep-17 Jan-18 May-18 Sep-18 Jan-19 May-19 Sep-19 Jan-20 May-20 Sep-20
Less than three years Three to < five years Five years+ Variable
Statistics Canada – Catalogue no. 11-621-M 11
Trends in the Canadian mortgage market: Before and during COVID-19

Chartered banks provide the bulk of mortgage financing and deferrals
Historically, non‑bank lending institutions have held about a quarter of the total household residential mortgage market’s outstanding debt. As the lockdown took effect in March 2020, the growth in outstanding household mortgage debt provided by non‑banks slowed, with chartered banks providing the bulk of the funds. As businesses reopened in April, the amount of mortgage lending administered by both chartered banks and non‑banks surged to record levels. With the accelerating growth of home sales into the summer, non‑bank mortgage lending was outpaced by that of banks as they represented a smaller portion of mortgage lending in each month through the end of November, while posting a sizable increase in this final month.
Source: Statistics Canada, Table 36-10-0639-01, Credit liabilities of households.
Chart 9Monthly change in seasonally adjusted household residential mortgage debt by lender sector
billions $CAD
-2
0
2
4
6
8
10
12
14
16
Jan-18 Mar-18 May-18 Jul-18 Sep-18 Nov-18 Jan-19 Mar-19 May-19 Jul-19 Sep-19 Nov-19 Jan-20 Mar-20 May-20 Jul-20 Sep-20 Nov-20
Chartered banks Government Non-bank financial corporations Other lenders
As the employment rate fell and businesses closed for the first time in March, many Canadians found themselves out of work or working reduced hours. To support borrowers and reduce the risk of near‑term mortgage defaults, OSFI announced a special capital treatment for federally regulated deposit‑taking institutions granting payment deferrals to borrowers. This gave many lenders leeway to provide relief without the need to reclassify loans with payment deferrals as non‑performing. As of November 30, 2020, chartered banks had provided mortgage payment deferrals to more than 797,900 Canadians.14 In comparison, non‑bank lenders, while not subject to the guidelines outlined by OSFI, also provided payment deferrals on a further 100,372 mainly uninsured mortgages during the second quarter.15
14. Canadian Bankers Association, “Relief through deferred mortgage payments,” available at https://cba.ca/fast-facts-on-bank-measures-in-response-to-the-covid-19-pandemic.15. Survey of Non-Bank Mortgage Lenders, second quarter 2020, available at https://www150.statcan.gc.ca/n1/daily-quotidien/201210/dq201210c-eng.htm.
Statistics Canada – Catalogue no. 11-621-M12
Trends in the Canadian mortgage market: Before and during COVID-19

Debt service ratios drop as households defer mortgage payments
The household debt service ratio is a measure of total obligated payments of principal and interest as a proportion of household disposable income and excludes deferred principal payments, resulting in a lower ratio than if borrowers had been obligated to pay. Between the first and third quarters of 2020, the size of these deferrals as a proportion of total obligated payments of mortgage principal grew from less than 1% to a high of over 18% in the second quarter. By the third quarter, the proportion had fallen considerably as the special capital treatment provided by OSFI on new approvals came to an end on October 1st, 2020.
E
Source: Statistics Canada, Table 11-10-0065-01, Debt service indicators of households, national balance sheet account. Statistics Canada calculations.
Chart 10Household mortgage debt service ratio and payment deferrals
billions $CAD
Total interest payment (left axis) Total principal payment (left axis)
Total deferred principal (left axis) Debt service ratio (right axis)
percent
5.2
5.4
5.6
5.8
6.0
6.2
6.4
6.6
6.8
7.0
0
10
20
30
40
50
60
2018Q2 2018Q3 2018Q4 2019Q1 2019Q2 2019Q3 2019Q4 2020Q1 2020Q2 2020Q3
xpected credit losses grow, but represent only a small proportion of overall mortgage debt
As part of their risk management activities, financial institutions estimate the proportion of their loan portfolios that may enter default each period. These expected credit losses (ECL) are based on actuarial assumptions that attempt to anticipate the default rates on their loans and subsequently the amount of impaired loans that may need to be written off in a given period. While ECL on mortgage loans had been rising slowly from 2017 to the end of 2019, as the pandemic hit, banks’ ECL increased sharply. With non‑essential businesses unable to operate, most of the growth in anticipated credit losses occurred on non‑mortgage loans. Despite the increasing ECL through 2020, the risks in the mortgage market were seen as very minor, with total ECL on mortgage loans as a proportion of total household mortgage debt reaching only 0.1% in the third quarter of 2020.
Statistics Canada – Catalogue no. 11-621-M 13
Trends in the Canadian mortgage market: Before and during COVID-19

Source: Statistics Canada, Mortgage Loans Report (ES); Table: 36-10-0580-01, National Balance Sheet Accounts.
Chart 11Expected credit losses (ECL) on outstanding mortgage balances
billions $CAD
0.00
0.01
0.02
0.03
0.04
0.05
0.06
0.07
0.08
0.09
0.10
0.0
0.2
0.4
0.6
0.8
1.0
1.2
1.4
1.6
Q1 Q2 Q3 Q4 Q1 Q2 Q3 Q4 Q1 Q2 Q3 Q4 Q1 Q2 Q3 Q4 Q1 Q2 Q3 Q4 Q1 Q2 Q3 Q4 Q1 Q2 Q3 Q4 Q1 Q2 Q3 Q4 Q1 Q2 Q3 Q4 Q1 Q2 Q3 Q4 Q1 Q2 Q3 Q4 Q1 Q2 Q3
2009 2010 2011 2012 2013 2014 2015 2016 2017 2018 2019 2020
ECL related to mortgage lending (left axis) ECL as a proportion of total household mortgage debt (right axis)
percent
Growth in overall household debt during COVID-19 led by mortgage borrowing
The growth in outstanding mortgage balances had been declining since the financial crisis, peaking in October 2007, then decreasing to a low of 3.0% in February 2019. As mortgage rates began to decline through 2019, home sales started to accelerate and the growth of outstanding balances once again began to rise. COVID‑19 restrictions forced non‑essential businesses to close in March 2020 and it seemed that the housing market would be especially adversely impacted. Instead, government support measures, coupled with historically low interest rates, helped to prop up the housing market in 2020, demonstrated by cumulative housing sales exceeding those of 2019 and annual growth in outstanding mortgage balances reaching 7.5% in November 2020. Despite rising mortgage balances, historically low interest rates and robust incomes have kept mortgage debt burdens from surpassing their pre‑pandemic levels.
While this article has focused on trends in mortgage borrowing, it does not tell the whole story on household debt over the last 12 months. Non‑mortgage loans, which are funds used primarily for consumption, were impacted significantly by the various social‑distancing measures that were implemented. The outstanding stock of non‑mortgage debt exhibited a sharp contraction in the first half of 2020 as household consumption declined by a record amount.16 By the end of November, households had added $108.0 billion to their outstanding mortgage debt while simultaneously shedding almost $8 billion from non‑mortgage debt since December 2019.
This will be examined further in a future article in this series on debt.
16. Household final consumption expenditure declined 14.2% from the first quarter of 2020 to the second quarter 2020—down 14.8% from the second quarter of 2019. Statistics Canada, Table 36-10-0124-01, Detailed household final consumption expenditure, Canada, quarterly.
Statistics Canada – Catalogue no. 11-621-M14
Trends in the Canadian mortgage market: Before and during COVID-19

Source: Statistics Canada, Table 36-10-0639-01, Credit liabilities of households.
Chart 12Year-over-year growth in household mortgage and non-mortgage loans
percent
-2
-1
0
1
2
3
4
5
6
7
8
Jan-18 Apr-18 Jul-18 Oct-18 Jan-19 Apr-19 Jul-19 Oct-19 Jan-20 Apr-20 Jul-20 Oct-20
Non-mortgage loans Mortgage loans
References
Bank of Canada (December 2020). “Historical selected credit measures (formerly E2).” Available at https://www.bankofcanada.ca/rates/banking‑and‑financial‑statistics/selected‑credit‑measures‑formerly‑e2/.
Bank of Canada (December 2020). Monetary Policy Report – October 2020. Available at https://www.bankofcanada.ca/2‑2‑/10/mpr‑2020‑10‑28.
Canada Mortgage and Housing Corporation (October 2020). Residential Mortgage Industry Report – September 2020. Available at https://www.cmhc‑schl.gc.ca/en/data‑and‑research/publications‑and‑reports/housing‑market‑assessment.
Office of the Superintendent of Financial Institutions (December 2020). Residential Mortgage Underwriting Practices and Procedures Guideline (B-20). Available at https://www.osfi‑bsif.gc.ca/Eng/fi‑if/rg‑ro/gdn‑ort/gl‑ld/Pages/b20‑nfo.aspx.
Rate Hub – Historical Mortgage Rates in Canada (December 2020). Available at www.ratehub.ca/historical‑mortgage‑rates‑widget.
Rate Spy (December 2020). History of Mortgage Rule Changes in Canada. Available at https://www.ratespy.com/history‑of‑mortgage‑rule‑changes‑03255560.
Statistics Canada (December 2020). “Credit liabilities of households.” Available at https://www150.statcan.gc.ca/t1/tbl1/en/cv.action?pid=3610063901.
Statistics Canada (October 2020). “Current and capital accounts – households, Canada, quarterly.” Available at https://www150.statcan.gc.ca/t1/tbl1/en/cv.action?pid=3610011201.
Statistics Canada (December 2020). “Debt service indicators of households, national balance sheet accounts.” Available at https://www150.statcan.gc.ca/t1/tbl1/en/cv.action?pid=1110006501.
Statistics Canada – Catalogue no. 11-621-M 15
Trends in the Canadian mortgage market: Before and during COVID-19

Statistics Canada (October 2020). “Household sector credit market summary table, seasonally adjusted estimates.” Available at https://www150.statcan.gc.ca/t1/tbl1/en/cv.action?pid=3810023801.
Statistics Canada (December 2020). Labour Force Survey, October 2020. Available at https://www150.statcan.gc.ca/n1/daily‑quotidien/201106/dq201106a‑eng.htm.
Statistics Canada (December 2020). “Residential mortgage credit, outstanding balances of major private lenders, Bank of Canada.” Available at https://www150.statcan.gc.ca/t1/tbl1/en/cv.action?pid=1010012901.
Statistics Canada (October 2020). “Residential property price index, quarterly.” Available at https://www150.statcan.gc.ca/t1/tbl1/en/tv.action?pid=1810016901.
Statistics Canada – Catalogue no. 11-621-M16
Trends in the Canadian mortgage market: Before and during COVID-19