trends in the u.s. lamb slaughter industry
TRANSCRIPT

OREGON STATE UNIVERSITYEXTENSION SERVICE
5-6--
Cop. -
Trends in the U.S.Lamb Slaughter IndustryImplications for the Feasibilityof Locating a Plant in Oregon

This study is not intended to advise whether a plant should be built. However, information contained inthis report may be useful for anyone interested in the feasilibity of a lamb slaughter facility in Oregon.

ITT1-11"
60 _155
50
45 -
40 -
35 -
30 -
25 -
20 -
15 -
10 -
5
Trends in the U.S. Lamb Slaughter IndustryImplications for the Feasibility of Locating a Plant in Oregon
John NalivkaExtension Market Information Specialist
Oregon State University
Since 1960, there has been a general downwardtrend in the U.S. sheep inventory. Several factors havecontributed to this decline, including labor and predatorcontrol at the production level and a shift in consumerdemand. Accompanying the decline in the nation'ssheep flock has been a drop in slaughter and demand forthe services of the packing industry. This has led toproducer concerns about concentration in the lambpacking industry and its effect on procurement practicesas the number of facilities has declined to 13 majorplants.
The lamb slaughter industry and more specifically,the feasibility of building a new packing facility in
Oregon, is the focus of this analysis. This paperprovides a discussion of factors affecting the U.S. lambslaughter industry because those same factors will alsoaffect a plant in Oregon. In addition to the economicand financial aspects of a project, feasibility analysisalso includes social, political, and technical concerns.This paper will deal with only the economic aspects ofthe subject. The economic viability of a meat packingfacility depends largely upon economies of scale andlivestock procurement. This analysis will focus uponthese two factors, as well as a brief discussion of lambdemand.
Figure 1
U.S. SHEEP AND LAMBS INVENTORYJanuary 1
1920 1930
1940
1950 1960 1970 1980
1166um x` 10576/92 315
State
State
Pounds of Lomb SoldNegotiated en. Formula
RI Formula
U.S. Meat ConsumptionA brief discussion of the factors affecting meat
demand is vital to a sectoral study of the livestock/meat industry. Consumer demand is defined as thequantity of product that will be purchased at givenprices under a given set of conditions. This quantity isa function of population, tastes and preferences,consumer income, and prices of competing products.Demand for meat is not just the willingness toconsume which is largely reflected in tastes andpreferences, but also the ability to purchase which islargely a function of consumer incomes.
USDA's per capita disappearance figures serve asa proxy to measure the quantity demanded at the retaillevel. These figures are sometimes incorrectly referredto as per capita consumption, but they are reflective ofproduction rather than actual consumption. Only U.S.statistics are available for per capita disappearance. So,trends in meat demand and the derived demand will beviewed on a national leveL
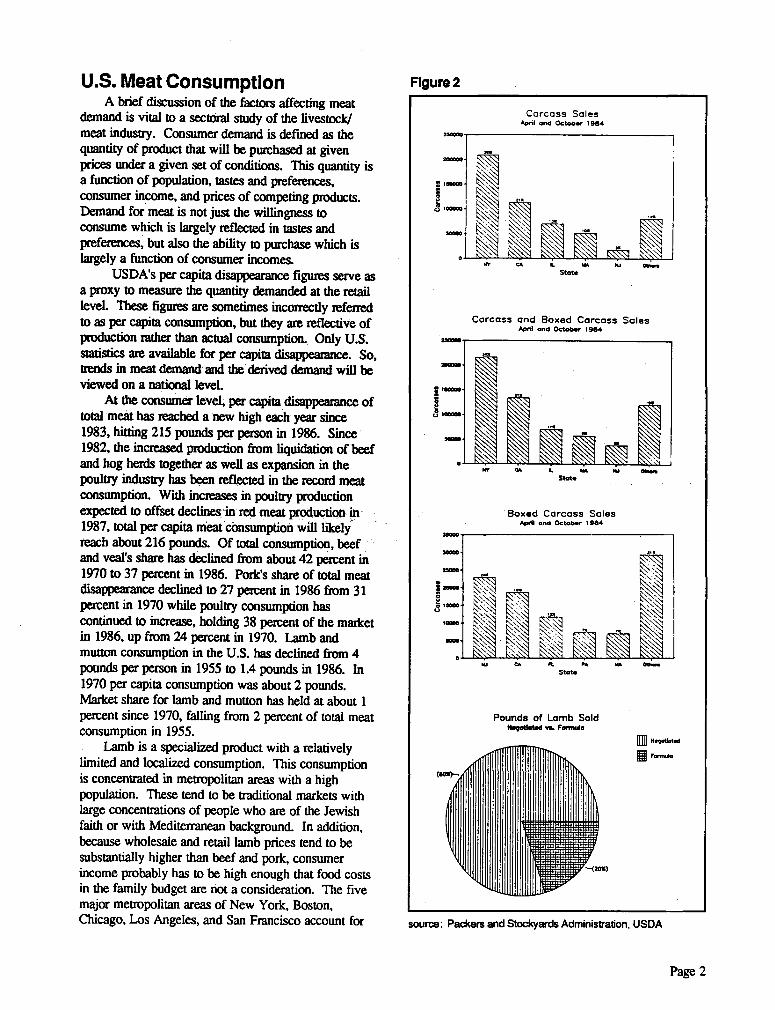
At the consumer level, per capita disappearance oftotal meat has reached a new high each year since1983, hitting 215 pounds per person in 1986. Since1982, the increased production from liquidation of beefand hog herds together as well as expansion in thepoultry industry has been reflected in the record meatconsumption. With increases in poultry productionexpected to offset declines in red meat production in1987, total per capita meat consumption will likelyreach about 216 pounds. Of total consumption, beefand veal's share has declined from about 42 percent in1970 to 37 percent in 1986. Pork's share of total meatdisappearance declined to 27 percent in 1986 from 31percent in 1970 while poultry consumption hascontinued to increase, holding 38 percent of the marketin 1986, up from 24 percent in 1970. Lamb andmutton consumption in the U.S. has declined from 4pounds per person in 1955 to 1.4 pounds in 1986. In1970 per capita consumption was about 2 pounds.Market share for lamb and mutton has held at about 1percent since 1970, falling from 2 percent of total meatconsumption in 1955.
Lamb is a specialized product with a relativelylimited and localized consumption. This consumptionis concentrated in metropolitan areas with a highpopulation. These tend to be traditional markets withlarge concentrations of people who are of the Jewishfaith or with Mediterranean background. In addition,because wholesale and retail lamb prices tend to besubstantially higher than beef and pork, consumerincome probably has to be high enough that food costsin the family budget are not a consideration. The fivemajor metropolitan areas of New York, Boston,Chicago, Los Angeles, and San Francisco account for
Figure 2
source: Packers and Stockyards Administration, USDA
Page 2
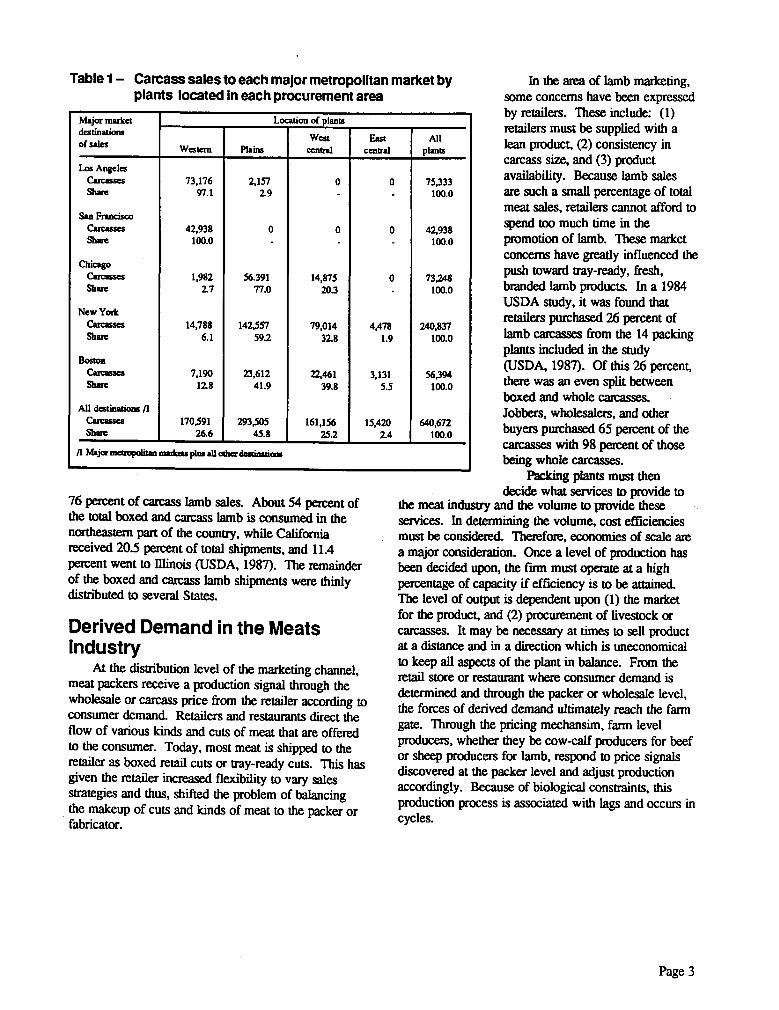
Table 1– Carcass sales to each major metropolitan market byplants located in each procurement area
Major marketdestinationsof sales
Location of plants
Western PlainsWest
centralEast
centralAll
plants
Los AngelesCarcasses 73,176 2,157 0 0 75,333Share 97.1 2.9 100.0
San FranciscoCarcasses 42,938 0 0 0 42,938Share 100.0 100.0
ChicagoCarcasses 1,982 56.391 14,875 0 73,248Share 2.7 77.0 20.3 100.0
New YorkCarcasses 14,788 142,557 79,014 4,478 240,837Share 6.1 59.2 32.8 1.9 100.0
BostonCarcasses 7,190 23,612 22,461 3,131 56,394Share 12.8 41.9 39.8 5.5 100.0
All destinations /1Carcasses 170.591 293,505 161,156 15,420 640,672Share 26.6 45.8 25.2 2.4 100.0
/1 Major metropolitan markets plus all other destinations
76 percent of carcass lamb sales. About 54 percent ofthe total boxed and carcass lamb is consumed in thenortheastern part of the country, while Californiareceived 20.5 percent of total shipments, and 11.4percent went to Illinois (USDA, 1987). The remainderof the boxed and carcass lamb shipments were thinlydistributed to several States.
Derived Demand in the MeatsIndustry
At the distribution level of the marketing channel,meat packers receive a production signal through thewholesale or carcass price from the retailer according toconsumer demand. Retailers and restaurants direct theflow of various kinds and cuts of meat that are offeredto the consumer. Today, most meat is shipped to theretailer as boxed retail cuts or tray-ready cuts. This hasgiven the retailer increased flexibility to vary salesstrategies and thus, shifted the problem of balancingthe makeup of cuts and kinds of meat to the packer orfabricator.
In the area of lamb marketing,some concerns have been expressedby retailers. These include: (1)retailers must be supplied with alean product, (2) consistency incarcass size, and (3) productavailability. Because lamb salesare such a small percentage of totalmeat sales, retailers cannot afford tospend too much time in thepromotion of lamb. These marketconcerns have greatly influenced thepush toward tray-ready, fresh,branded lamb products. In a 1984USDA study, it was found thatretailers purchased 26 percent oflamb carcasses from the 14 packingplants included in the study(USDA, 1987). Of this 26 percent,there was an even split betweenboxed and whole carcasses.Jobbers, wholesalers, and otherbuyers purchased 65 percent of thecarcasses with 98 percent of thosebeing whole carcasses.
Packing plants must thendecide what services to provide to
the meat industry and the volume to provide theseservices. In determining the volume, cost efficienciesmust be considered. Therefore, economies of scale area major consideration. Once a level of production hasbeen decided upon, the rum must operate at a highpercentage of capacity if efficiency is to be attained.The level of output is dependent upon (1) the marketfor the product, and (2) procurement of livestock orcarcasses. It may be necessary at times to sell productat a distance and in a direction which is uneconomicalto keep all aspects of the plant in balance. From theretail store or restaurant where consumer demand isdetermined and through the packer or wholesale level,the forces of derived demand ultimately reach the farmgate. Through the pricing mechansim, farm levelproducers, whether they be cow-calf producers for beefor sheep producers for lamb, respond to price signalsdiscovered at the packer level and adjust productionaccordingly. Because of biological constraints, thisproduction process is associated with lags and occurs incycles.
Page 3
Description of Lamb SlaughterIndustry
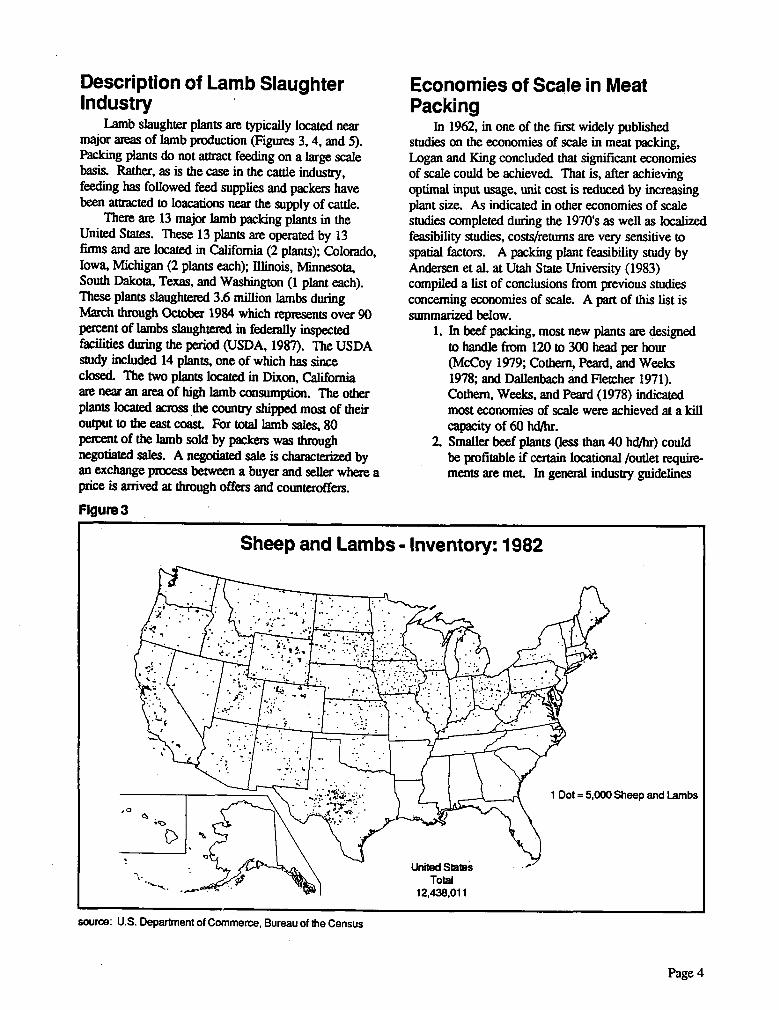
Lamb slaughter plants are typically located nearmajor areas of lamb production (Figures 3, 4, and 5).Packing plants do not attract feeding on a large scalebasis. Rather, as is the case in the cattle industry,feeding has followed feed supplies and packers havebeen attracted to loacations near the supply of cattle.
There are 13 major lamb packing plants in theUnited States. These 13 plants are operated by 13firms and are located in California (2 plants); Colorado,Iowa, Michigan (2 plants each); Illinois, Minnesota,South Dakota, Texas, and Washington (1 plant each).These plants slaughtered 3.6 million lambs duringMarch through October 1984 which represents over 90percent of lambs slaughtered in federally inspectedfacilities during the period (USDA, 1987). The USDAstudy included 14 plants, one of which has sinceclosed. The two plants located in Dixon, Californiaare near an area of high lamb consumption. The otherplants located across the country shipped most of theiroutput to the east coast. For total lamb sales, 80percent of the lamb sold by packers was throughnegotiated sales. A negotiated sale is characterized byan exchange process between a buyer and seller where aprice is arrived at through offers and counteroffers.
Figure 3
Economies of Scale in MeatPacking
In 1962, in one of the first widely publishedstudies on the economies of scale in meat packing,Logan and King concluded that significant economiesof scale could be achieved. That is, after achievingoptimal input usage, unit cost is reduced by increasingplant size. As indicated in other economies of scalestudies completed during the 1970's as well as localizedfeasibility studies, costs/returns are very sensitive tospatial factors. A packing plant feasibility study byAndersen et al. at Utah State University (1983)compiled a list of conclusions from previous studiesconcerning economies of scale. A part of this list issummarized below.
1. In beef packing, most new plants are designedto handle from 120 to 300 head per hour(McCoy 1979; Cothern, Peard, and Weeks1978; and Dallenbach and Fletcher 1971).Cothem, Weeks, and Peard (1978) indicatedmost economies of scale were achieved at a killcapacity of 60 hd/hr.
2. Smaller beef plants (less than 40 hd/hr) couldbe profitable if certain locational /outlet require-ments are met. In general industry guidelines
Sheep and Lambs - Inventory: 1982
, tdi• • 2.4
111111111dII* 1
1 Dot = 5,000 Sheep and Lambs
source: U.S. Department of Commerce, Bureau of the Census
Page 4

Plants Slaughtering Over 100,000 Lambs Annually, 1986
• Closed Since 1984n Opened Since 1984o Open
Figure 4
source: U.S. Department of Commerce, Bureau of the Census
Figure 5
source: Packers and Stockyards Administration, USDA
Page 5
Y aaaaa le Costs
30 nets/hour
Size of *aeration
50 heap/haw 75 hew/how 300 need/hour
Retain 1 maintenance 2.819.25 4.698.75 7,048.13 63,953.12
Labor 4 frame olnefits 695.024.00 1,129.414.00 1,650,682.00 1019,051.00
Supplies 4165.611 8123.08 8196.59 11277
Electricity 1,160.20 832.59 1.204.74 6,781.16
pores and massaging 179,041.20 299,687.42 449,898.40 3,304.343.08
Total annual variable costs 882,210.33 1,447,755.84 2,117,029.86 8.405,405.56
Cost on cnt boxed /2 2.42 2.38 2.33 2.33
Fixed Costs
Depreciation 10,746.50 17.067.50 26,127.00 35.037.67
Interest 8.063.71 112:3.75 18.902.50 33.927.40
Insurance 3,223.02 4.999.35 7,550.64 12,939.86
Tales 2,127.27 3,233.71 5.021.33 8.837.27
Installation 2,247.63 3,266.88 4,932.00 2,956.83
Total annual lixed Costs 26,408.17 40,701.19 62,613.55 93,699.03
Cast per cut Posed /2 0.07 0.07 0.07 0.03
Annual Total Costs 908,618.50 1.483,457.03 2.179,643.41 8.499,104.39
Cost per cat balsa /2 2.49 2.45 2.40 2.36
- - - - - - - - - - - - - - - - - - - - - - - - - - - - - - - - - - - - -/I Source: Glover and samisen (University oh Idaho,
i2 This cast is on a carcass eight oasis, assuming a 647.4 lb carcass
Size of operation
47 needinour ed ntaolhour 75 heap/hour 90 Peacubour 110 heap /hour 300 head/hourharm', Costs
Repairs & maintenance
Law 4 fringe oenefits
Electricity
Leases. licenses
& selling expense
Fuel. supplies,
misc. expense
Sanitation, sewage
boiler
Total annual varlaole costs
Cost per cwt processed /2
Fixed Casts
Otoreciation
Interest
Insurance
Tales
Installation
Total annual fixed costs
Cost per cot processed /2
142.246.50 180,906.56
1,381.595.00 1,724,575.00
34,698.22 48,402.81
384,406.50 509,305.84
166,640.57 273,180.81
51.074.38 65,418.41
2,160,669.17 2,801.789.43
3.79 3.85
96,052.49 135,077.14
90,443.94 127,888.01
41,024.59 50,357.81
24.351.52 34,508.39
4,838.68 7,791.71
257,511.22 355,623.06
0.45 0.49
213.260.27
244.135.77
286.621.24
366.596.48
2,016.789.00
2,290.267.00
2,617,232.00
5,644.069.00
59,632.82
60,860.90
85.140.24
155,287.43
655.760.12
727.521.31
890,039.19
1.195.182.60
343,451.08
389.459.76
469,137.22
2,129.341.24
81.013.13
97,052.66
117.203.66
275,694.48
3,369,906.42
3,817.297.40
4,465,373.55
9,766.171.23
3.64
3.49
3.34
2.68
154,326.70
105.260.90
216.464.82
519,483.43
151,465.18
178,365.84
205,573.57
510,262.45
59,665.90
70.516.52
84.324.89
198.973.52
40,993.47
49,251.19
56.026.74
140,837.49
8,414.43
10.827.50
12,405.24
16,741.57
414,865.76 493,229.95 574,795.26 1,386.299.46
0.46 0.45 0.43 0.38
Annual Total Costs 2.418,180.39 3,157,412.49 3,784,772.18 4,310,527.35 5,040,168.81 11.152,469.69
Cast per art processed /2 4.24 4.34 4.10 3.94 3.77 3.06
_ --/1 Source: Slow and narOndik (University of Idaho)_ -- -_-
/2 This cost is on a carcass weight basis. assusing a 647.4 lb carcass
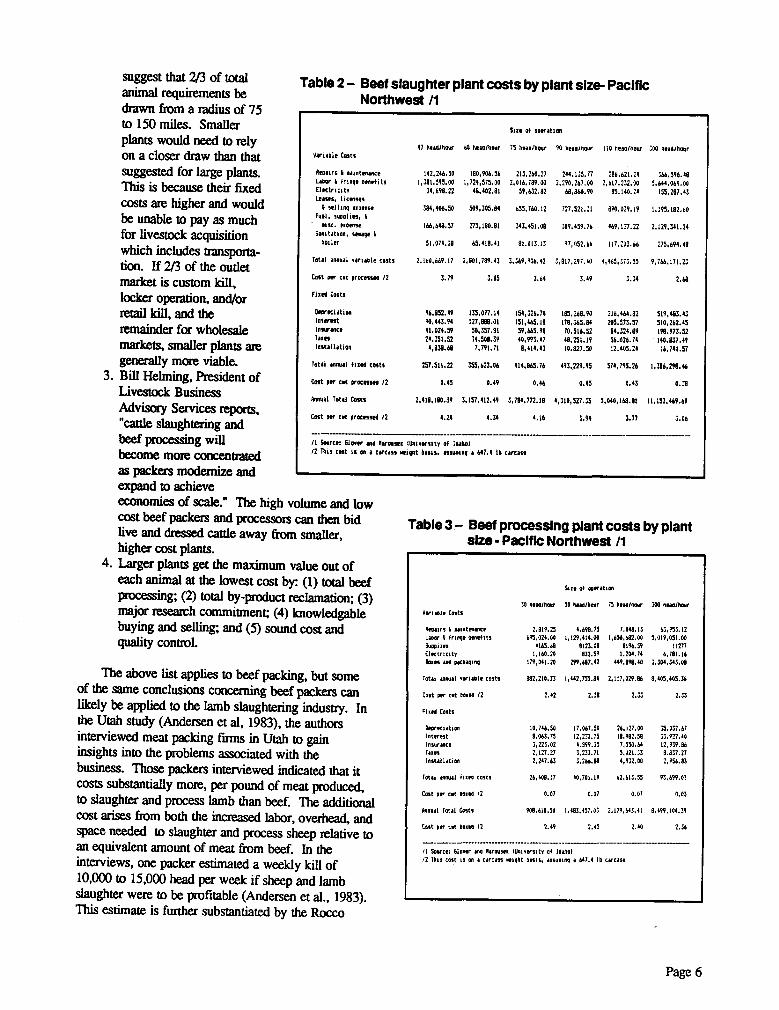
Table 2 - Beet slaughter plant costs by plant size- PacificNorthwest /1
suggest that 2/3 of totalanimal requirements bedrawn from a radius of 75to 150 miles. Smallerplants would need to relyon a closer draw than thatsuggested for large plants.This is because their fixedcosts are higher and wouldbe unable to pay as muchfor livestock acquisitionwhich includes transporta-tion. If 2/3 of the outletmarket is custom kill,locker operation, and/orretail kill, and theremainder for wholesalemarkets, smaller plants aregenerally more viable.
3. Bill Helming, President ofLivestock BusinessAdvisory Services reports,"cattle slaughtering andbeef processing willbecome more concentratedas packers modernize andexpand to achieveeconomies of scale." The high volume and lowcost beef packers and processors can then bidlive and dressed cattle away from smaller,higher cost plants.
4. Larger plants get the maximum value out ofeach animal at the lowest cost by: (1) total beefprocessing; (2) total by-product reclamation; (3)major research commitment; (4) knowledgablebuying and selling; and (5) sound cost andquality control.
The above list applies to beef packing, but someof the same conclusions concerning beef packers canlikely be applied to the lamb slaughtering industry. Inthe Utah study (Andersen et al, 1983), the authorsinterviewed meat packing firms in Utah to gaininsights into the problems associated with thebusiness. Those packers interviewed indicated that itcosts substantially more, per pound of meat produced,to slaughter and process lamb than beef. The additionalcost arises from both the increased labor, overhead, andspace needed to slaughter and process sheep relative toan equivalent amount of meat from beef. In theinterviews, one packer estimated a weekly kill of10,000 to 15,000 head per week if sheep and lambslaughter were to be profitable (Andersen et al., 1983).This estimate is further substantiated by the Rocco
Table 3 - Beef processing plant costs by plantsize - Pacific Northwest /1
Page 6

operation in Shenandoah Valley, Virginia. Before theplant was opened in 1985, a preliminary study wascontracted with Winrock International to determine ifthe supply of lambs in the Shenandoah Valley couldsupport a weekly slaughter of 10,000 lambs (LivestockIndustry Institute, 1986).
As indicated earlier in this report, a recent USDAstudy indicates there are 14 federally inspected plantsslaughtering in excess of 90 percent of total sheep andlambs slaughtered from March through October 1984.Smaller plants tend to deal with a localized and morespecialized market. These plants need a close, adequateflow of animals as well as product differentiationthrough price, quality, and type of cut.
Glover and Marousek (Idaho, 1984) studiedinterregional competition of boxed beef. Informationin a study by Cothem, Peard, and Weeks (California,1978) on economies of scale in slaughtering plantsprovided the basis for this Idaho study with all costsregionalized and updated to 1979. The PacificNorthwest region included Washington, Oregon, andIdaho. As in the California study, plants with hourlykill capacities of 47, 60, 75, 90, 110, and 300 headwere modeled. For this study, it was assumed that theplants operated 250 days per year and 8 hours per daywith 7.5 hours for killing cattle and .5 hours forcleanup. Another study by Cothem, Peard, and Weeks(California, 1978) provided processing plant costs forGlover and Marousek's study which consideredprocessing plant sizes of 30, 50, 75, and 300 head perhour. Processing in this study referred to breaking andboxing of primal cuts, not the manufacture of preparedmeats. The variable costs for slaughtering declined inall regions as the size of the plant increased except the
cost to slaughter 60 head per hour was higher than 47head per hour (Table 2 and Figure 6). Costs for theboxing operation also declined as the size of the plantincreased (Table 3 and Figure 7).
Davis (Texas A & M, 1975) studied the relativecompetitive position for feeding and/or slaughteringlambs in Texas as opposed to other states or regions.Included in the study were the estimated regional lambslaughtering costs. Region 1 (Washington andOregon) costs at $5.29 per hundredweight were thehighest of the 21 regions in the study.
The American Meat Institutes 1984 FinancialReview of Meat Packing Industry (AMI,1985)indicates that earnings are greater for meat processorsthan for slaughter plants. In 1984, the net earnings per$100 dollars of sales for processing companies was$.0296, while for all meat packing companies, thesame figure was only $.008. Local meat packers'earnings on sales were somewhat better in 1984.Livestock and raw materials took up a smallerproportion of the sales dollar leaving realized netearnings on sales at $.013 as opposed to $.011 forregional meat packers and $.007 for national meatpackers. Meat packers earnings on sales will declineover the next few years as live animal prices are bidhigher because of reduced supplies going to slaughter.
AMI also reported in 1984 that net income in themeat packing industry was only .8 percent of totalsales which in turn amounted to $49.5 billion (Table5). This was the same as for 1983 (AMI, 1986).Total operating expenses accounted for 19.7 percent oftotal sales, down from 20 percent in 1983, while thegross margin after the purchase of livestock and otherraw materials was 21 percent of sales (Table 5).
Table 4 - Percentage breakdown of the sales dollar by company classifications. 1984
Item Melt PackingRegional
Meat Processing Companies
NationalCompanies
Local Total
Total Sales 100.00% 100.00% 100.00% 100.00% 100.00%
Cost of Livestock andRaw Materials 79.09 79.66 76.23 79.14 60.25
Gross Margin 20.91 20.34 21.77 20.86 39.75
Operating ExpensesWages and Salaries 6.89 6.90 8.96 6.94 12.03
Employee Benefits:Retirement Expense .23 .26 .33 .24 37
Payroll Taxes .55 .59 .74 .56 1.05
Insurance & Hospitalization .76 .72 .76 .75 1.20
Vacation, Holiday & Sick Leave .37 .40 .30 .37 .80
All Other .13 .08 .06 12 .19
Total Benefits 2.04 2.06 2.18 2.05 3.62
Interest .35 .24 .42 .33 .62
Depreciation .73 .69 1.03 .73 1.57
Rents .36 .25 .32 .34 .63
Taxes' .13 .13 17 .13 25
Su?plies & Containers All Other Expenses
3.405.89
2.695.33
3.435.07
3.265.76
5.709.93
Total Operating Expenses 19.79 18.29 21.57 19.54 34.34
Income Before Taxes 1.12 2.05 2.21 1.32 5.41
Income Taxes .45 .88 .90 .54 2.45
Net Income .67 1.17 1.31 .78 2.96
'brat rnen Social Security and Income Taxes. Totals may nor add due to rounding.
source: AMI, Washington, DC
Page 7

Beef Slaughter Plant Costs by Plant Size — Pacific Northwest$5.00
-
54.60 -
54.40 -
$4.20
54.00
$3.80
$3.60
$3.40
53.20
53.00
$2.80
52.60
52.40
0 47 60 75
Head per hour
90 110 300
Figure 6
Figure 7
Beef Processing Plant Costs — Pacific Northwest52.90 -
52.80 -
52.70 -
52.60 -
52.50 -
52.40 -
52.30 -
$2.20
30 50
75
300
Head per hour
Page 8

ITEM
1973
MILLION DOLLARS
1974 1975 1976 1977 1978 1979 1980
MILLION DOLLARS
1981 1982 1983 1984
Total Sales 533,225 $35,500 $36,650 537,450 537,275 543,625 $47,650 $47,925 $48,525 549,500 548,950 549,475
Cost of Livestock and Other Raw Materials 26,935 28,260 28,950 29,475 28,925 34,425 37,850 37,575 38,125 38,950 38.425 39.025
Gross Margin 6,290 7,240 7,700 7,975 8,350 9,200 9,800 10,350 10,400 10,550 10,525 10,450
Operating ExpensesWages and Salaries 2,540 2,725 2,830 2,915 3.125 3,465 3,511 3,761 3,795 3,660 3,581 3,495
Employee Benefits:Retirement Expense 111 130 146 161 190 207 227 234 216 184 171 123
Payroll Taxes 151 172 179 192 208 242 253 282 287 293 290 283
Insurance 8 Hospitalization 136 155 178 196 234 264 268 317 370 373 380 367
Vacation, Holiday 8 Sick Leave 168 184 201 213 230 252 252 268 285 281 251 242
All Other Benefits 40 43 45 47 56 54 48 52 52 54 71 52
Total Benefits 606 684 749 809 918 1,019 1,048 1,153 1,210 1,185 1,163 1,067
Interest 105 141 138 109 112 139 161 161 168 162 161 151
Depreciation 200 214 243 245 268 307 298 306 316 328 344 357
Rents 86 95 103 108 113 129 106 109 122 1311 157 154
Taxes' 65 74 78 85 84 93 77 • 77 66 62 67 63
Supplies & Containers 845 995 1,165 1,210 1,200. 1,290 1,444 1,574 1,568 1,570 1,574 1,620
All Other Expenses 1,240 1,645 1,720 1,860 2,030 2,190 2,313 2,387 2,525 2.680 2,758 2,816
Total Operating Expenses 5,687 6,573 7,026 7,341 7,850 8,632 8,958 9,528 9,770 9,778 9,805 9,723
Income Before Taxes 603 667 674 634 500 568 842 822 630 772 720 727
Income Taxes 263 292 294 285 225 235 354 342 287 344 325 308
Net Income 340 375 ' 380 349 275 333 488 480 343 428 395 419
PERCENT OF TOTAL SALES PERCENT OF TOTAL SALES
Total Sales 100.0% 100.0% 100.0% 100.0% 100 . 0% 100 . 0% 100.0% 100.0% 100.0% 100.0% 100.0% 100.0%
Cost of Livestock and Other Raw Materials 81.1 79.6 79.0 78.7 77.6 78.9 79.4 78.4 78.6 78.7 78.5 78.9
Gross Margin 18.9 20.4 21.0 21.3 22.4 21.1 20.6 21.6 21.4 21.3 21.5 21.1
Operating ExpansesWages and Salaries 7.6 7.7 7.7 7.8 8.4 ' 7.9 7.4 7.8 7.8 7.4 7.3 7.1
Employee Benefits:Retirement Expense .3 .4 .4 .4 .5 .5 .5 .5 .4 .4 .4 .3
Payroll Taxes .5 .5 .5 .5 .6 .6 .5 .6 .6 .6 .6 .6
Insurance 8 Hospitalization .4 .4 .5 .5 .6 .6 .6 .7 .8 .7 .8 .7
Vacation, Holiday 8 Sick Leave .5 .5 .5 .6 .6 .6 .5 .6 .6 .6 .5 .5All Other Benefits .1 .1 .1 .1 .2 .1 .1 1 .1 .1 .2 .1
Total Benefits 1.8 1.9 2.0 2.1 2.5 2.4 2.2 2.5 2.5 2.4 2.4 2.2
Interest .3 .4 .4 .3 .3 .3 .3 .3 .3 .3 .3 .3
Depreciation .6 . .6 .7 .7 .7 .7 .6 .6 .8 .6 .7 .7
Rents .3 .3 .3 .3 .3 .2 .2 .3 .3 .3 .3
Taxes' .2 .2 .2 .2 .2 .2 .2 .2 .1 .1 .1 .1
Supplies & Containers 2.6 2.8 3.2 3.2 3.2 3.0 3.0 3.3 3.2 3.2 3.2 3.3
All Other Expenses . 3.7 4_6 4.7 5.0 5.5 5.0 4.9 5.0 5.2 5.4 5.6 5.7
Total Operating Expenses 17.1 18.5 19.2 19.6 21.1 19.9 18.8 19.9 20.1 19.7 20.0 19.7
Income Before Taxes 1.8 1.9 1.8 1.7 1.3 1.3 1.8 1.7 1.3 1.6 1.5 1.4
Income Taxes .8 .8 .8 .8 .6 • .5 .8 .7 .6 .7 .7 .6
Net Income 1.0 1.1 1.0 .9 .7 : .8 1.0 1.0 .7 .9 .9 .8
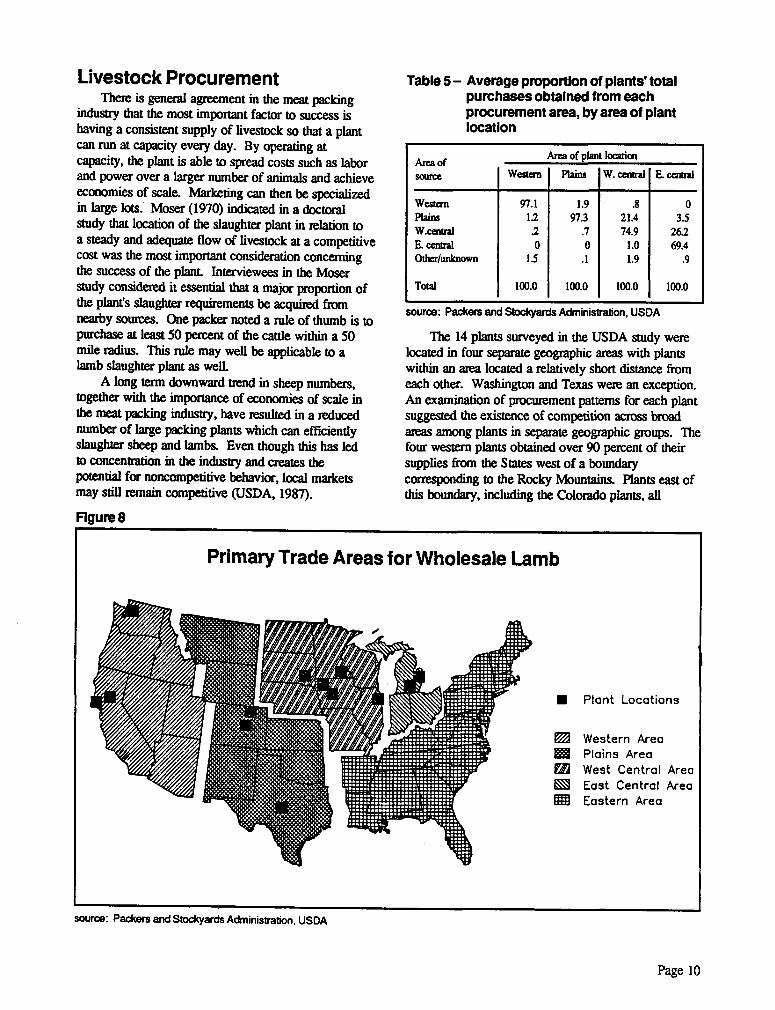
Livestock ProcurementThere is general agreement in the meat packing
industry that the most important factor to success ishaving a consistent supply of livestock so that a plantcan run at capacity every day. By operating at.capacity, the plant is able to spread costs such as laborand power over a larger number of animals and achieveeconomies of scale. Marketing can then be specializedin large lots: Moser (1970) indicated in a doctoralstudy that location of the slaughter plant in relation toa steady and adequate flow of livestock at a competitivecost was the most important consideration concerningthe success of the plant. Interviewees in the Moserstudy considered it essential that a major proportion ofthe plant's slaughter requirements be acquired fromnearby sources. One packer noted a rule of thumb is topurchase at least 50 percent of the cattle within a 50mile radius. This rule may well be applicable to alamb slaughter plant as well.
A long term downward trend in sheep numbers,together with the importance of economies of scale inthe meat packing industry, have resulted in a reducednumber of large packing plants which can efficientlyslaughter sheep and lambs. Even though this has ledto concentration in the industry and creates thepotential for noncompetitive behavior, local marketsmay still remain competitive (USDA, 1987).
Figure 8
Table 5— Average proportion of plants' totalpurchases obtained from eachprocurement area, by area of plantlocation
Area of
SOUTCC
Area of plant location
Western Plains W. central E. central
Western 97.1 1.9 .8 0Plains 12 97.3 21.4 3.5W.central .2 .7 74.9 26.2E. central 0 0 1.0 69.4Other/unknown 1.5 .1 1.9 .9
Total 100.0 100.0 100.0 100.0
source: Packers and Stockyards Administration, USDA
The 14 plants surveyed in the USDA study werelocated in four separate geographic areas with plantswithin an area located a relatively short distance fromeach other. Washington and Texas were an exception.An examination of procurement patterns for each plantsuggested the existence of competition across broadareas among plants in separate geographic groups. Thefour western plants obtained over 90 percent of theirsupplies from the States west of a boundarycorresponding to the Rocky Mountains. Plants east ofthis boundary, including the Colorado plants, all
n Plant Locations
Western AreaPlains AreaWest Central AreaEast Central AreaEastern Area
Primary Trade Areas for Wholesale Lamb
source: Packers and Stockyards Administration, USDA
Page 10

Table 6 - Share of state totals bought by each plant
State TotalWestern Plante Plains Flames V. C I Plante
JC 1 Plante
L E
WA1/6RCANVIDUTAZMTWYCONM1/YiOKESNESDNDMNIAMOILWIMIONINKYVACANUNE
(Source) (Head)
241,910 .33 25.80 30.46 39.82
471,267 22.38 44.39 31.52 .55 .84 .33
73,579 12.46 64.00 22.90 .64
88,941 12.81 46.12 27.85 2.81
6.48 1.41
74.390 57.25 24.87 15.93 .60 1.14
38,796 43.27 9.95 14.53 • 28.34
31,235 .28 2.61
29.16
65,587 2.74 1.29 1.27
29.34 1.84
834,778 .62
35.39 58.53
517.049 .09 3.42 .73
42.649 1.43
138,007 19.49
132,174 5.17 .32
245.869 .1814,892
109,066 1.26235.90122,16758.81038,91440,51555.82717,2115.347
763
7,441 10.80
30,393 12.79 12.49 5.19 2.53
1/ States combined to avoid disclosure of plant identity
(Percent)
3.59
1.51 1.00.21
3.92.62 4.75 62.58
17.95 28.03 16.29 1.25.56 .18 .26 2.68 1.79
89.23 5.58 .80 .15
5.55 12.07 17.13 40.87 9.92 4.10 7.97 .971.30 .81 10.58 3.40 14.56 49.33 .53
12.67 10.13 26.11 21.56 21.08 2.9614.64 8.36 5.61 26.81 44.40
52.36 12.29 25.32 5.12 4.9221.93 51.27 6.38 17.52 1.54 .10
18.41 26.11 16.90 34.24 3.12 .76 .4677.69 .76 18.49 1.22 1.39 .44
21.02 1.52 30.44 20.50 3.35 4.61 18.562.79 3.94 12.17 7.62 40.00 10.91 22.57
58.88 41.1218.20 68.43 13.36
.41 14.30 42.76 42.547.31 8.94 83.75
100.0051.24 33.48 '4.48
.07 6.26 58.91 1.77
source: Packers and Stockyards Administration, USDA
purchased lambs from States east of the RockyMountains and few from Far Western States. Coloradoplants did obtain a small proportion of supplies fromthe Far West.
In terms of more closely defined procurementareas, the four western plants shared a region boundedby the Rockies as their common procurement area andcompeted with each other for supplies within thisregion. Colorado and Texas plants obtained the bulkof lambs from the Plains States, while the four plantsin the Iowa-Minnesota-South Dakota corner purchasedentirely from the west-central States. The east-centralStates were the primary procurement area for the twoplants located farthest east.
Table 6 indicates the share of state lamb suppliespurchased by the major plants in each region. Forexample, plant B of the Western plants purchasesabout 25.8 percent of Washington-Oregon lambsupplies.
These procurement patterns indicate that: (1) lambslaughter is relatively concentrated, and (2) plants to alarge extent experience competition from within aprocurement area rather than from the outside. Reducedsupplies of lambs available for slaughter in the futuremay result in increased competition between regions.
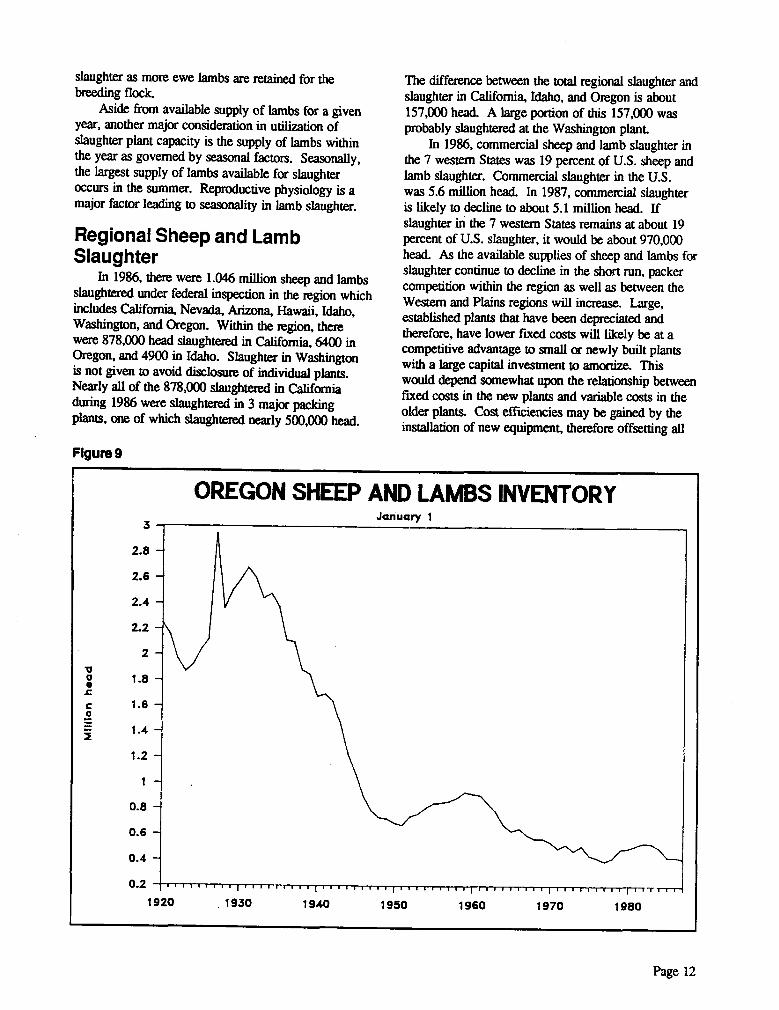
Oregon Lamb SuppliesUSDA's January 1, 1987 Sheep and Lamb
Inventory indicated Oregon's sheep and lamb inventoryhad declined 3 percent from a year earlier to 415,000head. Of this total inventory, stock sheep and lambsnumbered 320,000, 2 percent lower than a year earlier.The State's 1986 lamb crop at 290,000 was down 9percent. The number of sheep and lambs on feed inOregon on January 1 at 95,000 was down 10 percentfrom a year ago.
The highest concentration of sheep in the State islocated in the tri-county area of Douglas, Coos, andCurry counties. According to an annual Oregon StateUniversity Extension survey, there were an estimated110,000 ewes in this three county area in the fall of1986. Douglas county has the highest reported sheepinventory with about 70,000 ewes and Coos countyranks second with an estimated 25,000 ewes.
In 1986, 215,000 lambs were marketed in Oregon.Most of these lambs likely went directly to slaughteror were placed on feed and slaughtered later in the year.This marketing figure was down 8 percent from theprevious year as a result of the continued liquidation ofthe State's flocks. With stronger prices since 1986,expansion is likely to begin taking place this year.This will further reduce the lambs available for
Page 11
slaughter as more ewe lambs are retained for thebreeding flock.
Aside from available supply of lambs for a givenyear, another major consideration in utilization ofslaughter plant capacity is the supply of lambs withinthe year as governed by seasonal factors. Seasonally,the largest supply of lambs available for slaughteroccurs in the summer. Reproductive physiology is amajor factor leading to seasonality in lamb slaughter.
Regional Sheep and LambSlaughter
In 1986, there were 1.046 million sheep and lambsslaughtered under federal inspection in the region whichincludes California, Nevada, Arizona, Hawaii, Idaho,Washington, and Oregon. Within the region, therewere 878,000 head slaughtered in California, 6400 inOregon, and 4900 in Idaho. Slaughter in Washingtonis not given to avoid disclosure of individual plants.Nearly all of the 878,000 slaughtered in Californiaduring 1986 were slaughtered in 3 major packingplants, one of which slaughtered nearly 500,000 head.
The difference between the total regional slaughter andslaughter in California, Idaho, and Oregon is about157,000 head. A large portion of this 157,000 wasprobably slaughtered at the Washington plant.
In 1986, commercial sheep and lamb slaughter inthe 7 western States was 19 percent of U.S. sheep andlamb slaughter. Commercial slaughter in the U.S.was 5.6 million head. In 1987, commercial slaughteris likely to decline to about 5.1 million head. Ifslaughter in the 7 western States remains at about 19percent of U.S. slaughter, it would be about 970,000head. As the available supplies of sheep and lambs forslaughter continue to decline in the short run, packercompetition within the region as well as between theWestern and Plains regions will increase. Large,established plants that have been depreciated andtherefore, have lower fixed costs will likely be at acompetitive advantage to small or newly built plantswith a large capital investment to amortize. Thiswould depend somewhat upon the relationship betweenfixed costs in the new plants and variable costs in theolder plants. Cost efficiencies may be gained by theinstallation of new equipment, therefore offsetting all
Figure 9
OREGON SHEEP AND LAMBS INVENTORYJanuary 1
2.8 —
2.6
2.4 —
2.2 —V
2 —
1 .8 —
1.6 —
1 .4 —
1 .2 —
0.8 —
0 .6 —
0.4 —
0.2 i,,
1920 .1930 1940
1950 1960 1970 1980
Page 12

Table 7 - Federally inspected sheep and lamb slaughter - Western regions /1
1984Mature Percent Percent Sheep &
Sheep of total Lambs
1000 hd
of total Lambs
Jan 5.2 0.04 120.1 0.96 125.3Feb 5,9 0.04 131.6 0.96 137.5Mar 6.3 0.04 151.4 0.96 157.7Apr 6.4 0.04 138.3 0.96 144.7May 10.6 0.07 132.3 0.93 142.9Jun 10.4 0.08 123.7 0.92 134.1Jul 7.8 0.06 113.1 0.94 120.9Aug 9.1 0.07 126.7 0.93 135.8Sep 7.2 0.06 112.6 0.94 119.8Oct 8.4 0.06 129.1 0.94 137.5Nov 7.4 0.06 114.8 0.94 122.2Dec 4.9 0.04 106.4 0.96 111.3
Year 89.6 0.06 1500.1 0.94 1589.7
1985
Mature Percent Percent Sheep &
Sheep of total Lambs of total
1000 hd
Lambs
Jan 5.2 0.04 114.3 0.04 119.5Feb 4.5 0.04 110.8 0.04 115.3Mar 5.2 0.04 132.8 0,04 138.0Apr 6.4 0.05 112.8 0.05 119.2May 9.1 0.06 135.9 0.06 145.0Jun 8.2 0.07 102.5 0.07 110.7Jul 7.1 0.06 104.8 0.06 111.9Aug 6.4 0.06 108.3 0.06 114.7Sep 5.7 0.06 91.8 0.06 97.5Oct 5.9 0.06 96.3 0.06 102.2Nov 4.0 0.05 82.6 0.05 86.6Dec 4.5 0.05 82.7 0.05 87.2
Year 72.2 0.05 1275.6 0.05 1347.8
1986Mature
SheepPercent
of totalPercent
Lambs of total
1000 hd
Sheep &Lambs
Mar 3.2 0.03 105.8 0,97 109.0Apr 4.5 0.04 107.9 0.96 112.4May 5.7 0.06 91.1 0.94 96.8Jun 5.3 0.07 73.2 0.93 78.5Jul 4.4 0.05 81.6 0.95 86.0Aug 3.9 0.04 85.0 0.96 88.9Sep 4.4 0.05 85.2 0.95 89.6Oct 3.6 0.05 75.7 0.95 79.3Nov 2.2 0.04 55.3 0.96 57,5Dec 3.3 0.05 66.3 0.95 69.6
Year 46.9 0.04 999.0 0.96 1045.9
/1 Includes CA, NV, AZ, HI, ID, OR, and WAsource: Livestock Slaughter - 1984, 1985, and 1986 Summaries USDA/NASS/ASB
Page 13

or part of the increased fixed cost of the new plant.Large, established plants may be able to raise bids forlambs to a level with which the small plants cannotcompete. Consequently, small or new plants may beunable to operate near capacity.
SummaryThis paper has provided a discussion of issues
involved in the U.S. lamb slaughter industry, namelyeconomies of size in meat packing and livestockprocurement. Even though both factors will affect thesuccess of a lamb packing plant in Oregon,procurement appears to be the most important issue.Competition from two major existing plants inCalifornia and Washington would likely hamper theability of a new plant to obtain a consistent supply ofsheep and lambs to operate at a capacity which wouldallow the plant to benefit from economies of scale.Seasonality of marketings are also a majorconsideration in evaluating a plant's ability to procurelambs.
With reduced slaughter likely over the next coupleof years, supplies will be further reduced and packingplant competition is likely to increase not only withinregions, but also between regions. This could lead to
further concentration in the Iamb slaughter industry.Concerning a new lamb slaughter facility in Oregon,the major points in this paper are:
• On January 1, 1987, Oregon's sheep inventoryhad declined 3 percent from a year earlier. Thehighest concentration of sheep in the state is inthe tri-county area of Douglas, Coos, and Currycounties.
• The supply of lambs available for slaughter in1986 was down 8 percent from 1985. Availablesupplies will likely further decline in 1987 asexpansion may begin this year and more ewelambs will be retained for the breeding flock
• In 1986, most of the sheep and lambsslaughtered in the region including California,Nevada, Arizona, Hawaii, Idaho, Washington,and Oregon were slaughtered in 2 plants inCalifornia and 1 plant in Washington.
• Competition to obtain a smaller supply ofavailable lambs to slaughter in this region willincrease. This would likely make it difficult fora new plant to succeed.
Page 14

References
American Meat Institute. 1985. Annual Financial Review of the Meat Packing Industry, 1984. Washington, D.C.:American Meat Institute.
Andersen, Jay C., Roice H. Anderson, Rondo A. Christiansen, Herbert H. Fullerton, Terrence F. Glover, and DonaldL. Snyder. 1983. A Study of Meat Packing in Utah. Research Report 72, Utah Agricultural ExperimentStation.
Davis, Ernest Edwin. 1975. "An Economic Study of the Domestic Lamb Marketing Sector--An InterregionalAnalysis." Unpublished doctoral dissertation, Texas A & M University.
Glover, Micheal K. and Gerald Marousek. 1984. Interregional Competition in the Production of Boxed Beef.Research Bulletin No. 131, Agricultural Experiment Station, University of Idaho.
Livestock Industry Institute. 1986. A Special Report: Livestock Industry Forum. Kansas City, Mo.: LivestockIndustry Institute.
Nelson, Kenneth E. 1985. Issues and Developments in the U.S. Meatpacking Industry. ERS Staff Report No.AGES 850502, USDA, National Economics Div., Economic Research Service, Washington, D.C.
U.S. Department of Agriculture. 1987. Livestock Slaughter, 1986 Summary. National Agricultural StatisticsService, Agricultural Statistics Board.
U.S. Department of Agriculture. 1987. Meat Animals Production, Disposition, and Income, 1986 Summary.
National Agricultural Statistics Service, Agricultural Statistics Board.
U.S. Department of Agriculture. 1987. Sheep and Goats. National Agricultural Statistics Service, AgriculturalStatistics Board.
U.S. Department of Agriculture. 1987. Slaughter Lamb Marketing: A Study of the Lamb Industry. Packers andStockyards Administration.
Page 15

APPENDIX

: Lamb : : Red meatmChicken
Year : Eggs : Young : Mature : Total: Turkey :Chicken and: Beef : Veal : Pork : and : Red : and
C : turkey : :mutton: meat : poultry
8 . : 1/ D. 13- - - - Pounds, RTC basis 2/ - - - - Pounds, retail basis ••n
01955 360.2 13.8 7.5 21.3 5.0 26.3 64.0 7.8 61.9 4.1 137.80)1956 : 358.2 17.3 7.1 24.4 5.2 29.6 66.2 7.9 62.3 4.0 140.4 Ilrfl. li1957 : 351.3 19.1 6.4 25.5 5.9 31.4 65.1 7.3 56.6 3.7 132.7 164.11958 : 343.3 22.0 6.1 28.1 127.1 161.1 85.9 34.0 61.6 5.8 56.0 3.7 1271959 341.3 22.8 5.9 28.7 6.3 35.0 61.9 4.9 62.7 4.3 133.8
11.1 7168.8 Ch
1960 : 320.5 23.4 4.4 27.8 6.2 34.0 64.2 5.2 60.3 4.3 134.0 168.0
c3
1961 : 318.1 25.9 314.0 29.9 7.4 37.3 65.8 4.7 57.7 4.5 132.7 170.01962 319.5 25.8 4.0 29.8 7.0 36.8 66.2 4.6 59.1 4.6 134.5 171.3 Er
71963 313.8 27.1 3.7 30.8 6.8 37.6 69.9 4.1 61.0 4.4 139.4 177.01964 317.8 27.7 3.5 31.2 7.3 38.5 73.9 4.3 61.0 3.7 142.9 181.4
"ci,
1• 3
1975 276.4 36.7 3.4 40.1 8.5 48.6 87.9 3.4 50.7 1.8 143.7 192.31976 269.9 39.9 2.9 42.8 9.1 51.9 94.4 3.3 53.7 1.6 153.0 204.9 3
to1977 267.6 41.1 3.1 44.2 9.1 53.3 91.8 3.2 55.8 1.5 152.31978 : 272.6 43.8 2.9 46.7 9.1 55.8 87.2 2.4 55.9 1.4 146.9 222.
.Ad.Y1979 : 277.7 47.7 2.9 50.6 9.9 60.5 78.0 1.7 63.8 1.3 144.9 205.4C.M1980 : 272.4 47.0 3.1 50.1 10.5 60.6 76.5 1.5 68.3 1.4 147.6N
1981 265.4 48.5 3.1 51.6 10.7 62.3 77.1 1.6 64.9 1.4 145.0208.2
I207.3 ,,
1982 : 265.0 49.9 3.1 53.1 10.8 63.9 77.2 1.6 59.0 1.5 139.31983 : 260.8 50.8 3.0 53.8 11.3 65.1 78.7 1.6 62.2 1.5 144.0
203.
209.1 U121984 : 260.9 52.9 2.6 55.6 11.4 66.9 78.5 1.8 61.8 1.5 143.51985 •. 254.6 55.5 2.5 58.0 12.1 70.1 79.1 -1.8 62.0 1.4 144.4 221(4.45
1965 : 313.1 29.6 3.7 33.3 7.4 40.7 73.6 4.3 54.7 3.3 135.9 176.6•. 312.3 32.0
,a1966
3.6 35.6 7.8 43.4 77.0 3.8 54.4 3.6 138.81967 : 320.7 32.4 4.1 36.5 8.5 45.0 78.8 3.2 60.0 3.5 145.5
182.190.5
go
1968 : 315.5 32.8 3.9 7.9 44.6 81.2 3.0 61.4 3.3 148.9 193.5@
1969 : 310.3 34.8 3.636.7
38.4
8.3 46.7 82.0 2.7 60.5 3.1 148.3 195.0 i......19701971
309.0
310.636.8
36.53.6
3.8 40.3
40.4 8.0
8.348.4
48.684.0
83.4 2.2
2.4 62.3
68.3 2.8 156.7
3. .2.9 151.6
220005.(3)1972 302.9 38.2 3.6 41.8
8
.9 50.7 85.4 1.9 62.9 2.9 153.1 203.8
13
C
1974 : 283.7 37.2 3.5 40.7 8.8 49.5 85.6 1.9 61.8 2.0 151.3 200.8
Zr.1973 : 289.2 37.2 3.3 40.5 8.5 49.0 80.5 1.5 57.3 2.4 141.7 190.7 *Z7
it
1/ Exclude, ducks, geese, wild fowl, rabbits, and game animals. 2/ RTC - Ready-to-cook basis.

Number of Sheep Operations Lambs on Feed
1983 1984 1985 1986 87/86 87/avg
ARIZ 450 500 550 600 1092 120ZCALIF 7030 6000 6000 6200 1032 982
COL 2200 2400 2500 2600 1042 1102IDAHO 2600 2900 2500 2600 1042 982
KANSAS 2900 2800 2600 2000 772 722MONT 2700 2800 2900 2900 100% 1042NEBEL 3500 3300 3400 3300 972 972
NTS 300 270 270 300 1112 107%NMEX 1600 1600 1500 1500 1002 962HOAK 2000 2100 2000 1800 902 89ZOKLA 2400 2500 2300 2400 1042 1002
ORE 6000 5800 5400 5600 1042 982SOAK 5200 5400 5400 5100 94Z 962
7SX 9000 9000 8800 8500 97; 95ZUTAH 600 600 2500 2300 922 1862WASH 2200 2400 2200 2200 1002 972
WY0 1400 1400 1400 1400 1002 100%
17 States 52050 51770 52220 51300U.S. total 126390 123500 111730 114800
All Sheep and Lambs
1984 1985 1986 1987 87/86 87/avg
1000 headAriz 306 266 278 283 102% 1002Calif 1115 1065 1065 980 92Z 912Colo 690 690 600 690 1152 1052Idaho 383 313 320 314 982 932Kane 225 245 210 236 112% 104ZMont 564 515 473 523 111% 1012Nebr 195 165 160 173 1082 1002Nev 103 100 81 86 1062 91%N Max 589 538 525 480 912 87%N Dak 219 215 180 185 103% 90ZOkla 115 85 90 105 117% 1092Ore 495 430 430 415 972 92%S Dak 740 639 540 605 1122 952Tex 1970 1810 1810 1930 1072 1042Utah 568 515 484 464 96Z 89%Wash 62 53 58 59 L02% 102%Wyo 1090 860 819 775 95Z 842
17 states 9429 8504 8123 8303 104% 96%U.S. Total 11487 10443 9983 10328
1983 1984 1985 1986 1987 87/86 87/avg
1000 heedAria 57 50 34 32 64 2002 1482Calif 200 195 195 205 185 902 932Colo 230 300 300 240 310 1292 1/62Idaho 28 19 18 19 15 79Z 71ZKane 60 60 75 60 70 1172 1102Moot 16 20 45 23 23 1002 882Nebr 85 85 65 65 53 82Z 712Near 13 8- 10 3 0 02 02N Mex 20 45 52 85 30 352 592N Oak 50 47 50 40 25 632 532Okla 15 22 20 20 25 125Z 1302Ore 100 130 100 105 95 902 87ZS Oak 50 50 75 80 55 69Z 862Tex 200 175 140 150 150 1002 902Utah 26 30 25 24 24 1002 912Wyo 130 110 120 99 85 862 742
17 n tates 1280 1346 1324 1250 1209 972 932U.S. total 1641 1718 1596 1492 1504
Replacement Ewes
1984 1985 1986 1987 87/86 87/avg
1000 headAriz 48 48 44 41 93% 882Calif 65 63 89 69 782 952Colo 55 45 45 55 1222 1142Idaho 35 40 42 42 100% 1082Kane 12 13 8 10 1252 912Mont 72 60 60 106 177% 166%Nebr 15 11 9 15 1672 1292Nev 11 12 10 14 140% 1272N Mex 57 63 58 80 1382 1352N Dak 21 15 13 29 223% 1782Okla 8 5 8 10 125% 143ZOre 36 35 33 44 133% 1272S Dak 99 58 30 74 247% 1192Tex 215 160 230 290 1262 1442Utah 60 54 45 50 1112 942Wash 9 7 9 10 1112 120%Wyo 180 114 113 119 1052 88%
17 states 998 803 846 1058 137% 1212U.S. total 1237 1016 1047 1296 1242 1242
Stock Sheep One Year and Older
1984 1985 1986 1987 87/86 87/avg
1000 headAriz 178 148 L61 144 892 89%Calif 796 770 725 685 942 902Colo 350 325 295 300 1022 932Idaho 308 246 250 245 98% 912Kane 143 147 133 145 1092 103%Mont 432 390 370 370 1002 932Nebr 93 83 80 94 118% 110%Nev 78 75 65 69 106% 952N Mex 435 391 355 342 962 87%N Dak 134 140 120 120 1002 91%Okla 60 54 55 60 1092 107%Ore 292 270 275 255 93% 91ZS Dak 530 480 413 434 105% 91%Tex 1410 1350 1260 1300 1032 97%Utah 465 420 400 375 942 882Wash 45 41 44 44 100% 1022Wyo 735 590 570 530 932 842
17 states 6484 5920 5571 5512 1012 942U.S. total 7874 7233 6817 6841
1984 1985 1986 1987 87/86 87/avg
Ariz 212 242 212 222 1032 99%Calif 8% 82 112 92 842 105ZColo 142 12% 132 15Z 117% 1192Idaho 102 142 14% 152 102% 1142Kane 82 8% 62 6% 1142 90%Mont 14Z 13% 142 222 1602 161%Nebr 142 122 102 14% 1362 116ZNev 122 14% 13% 172 1272 128%N Melt 122 142 142 192 135% 144%N Dak 14% 10% 102 192 199% 1772Okla 122 8% 132 14% 1132 130%Ore 11% 112 112 15% 1372 133%S Dak 16% 112 72 15% 2152 1312Tex 132 112 152 18Z 1182 139%Utah 112 11% 10% 122 1162 107%Wash 172 152 172 192 1092 1152
Wyo 202 16Z 17Z 18% 1112 105%
Replacement Laub I a Percent of Stock Sheep Moodier,y as
A - 2

ALASKA 2
US TOTAL
1986 - 9983
1987 - 10328
SHEEP AND LAMB NUMBERS JAN 1, 19871000 HEAD
1/ ESTIMATES NOT AVAILABLE
S-N-5WESTERN LIVESTOCK MARKETING INFORMATION PROJECT 2/10/87
A - 3

*elk
44NO*7.
O. OAR. MINN.
04 4. 18ANG 370 120 130255 I. DAL
,,,,,, 245n Ao.
4.34.Rik 530 IOWA
NOM
69 OW.
375300
685LUIZ.
ILL.
79 200NO.
8068 98lea IP O. 9
94255
Aze-40
6853
ALASKA 1
US TOTAL
1986 - 6817
1987 - 6841
1/ ESTIMATES NOT AVAILABLE
144 342 60
1300
ANL.
1/
LA.
6
EWE NUMBERS JAN 1, 19871000 HEAD
S-N-6WESTERN LIVESTOCK MARKETING INFORMATION PROJECT 2/10/87
A - 4

00.11
-..,1too- 9
—..x.10
0,1/—0.16
ALASKA 1
US TOTAL
1985 — 7412
1986 — 7349
LAMB CROP 19861000 HEAD
1/ ESTIMATES NOT AVAILABLES—N-9
WESTERN LIVESTOCK MARKETING INFORMATION PROJECT 2/10/87
A - 5

60 60
. ALL SHEEP AND LAMBS.IV
.,
\ LAMB CROP
COMMERCIAL SHEEPAND LAMB SLAUGHTER
50 50
40 40
30 30
20 20
10 10
0 0
SHEEP LAMBSANNUAL DATA SERIES
MIL. HO. MIL. HD.
1930 1935 1940 1945 1950 1955 1960 1965 1970 1975 1980 1985
Western Livestock Marketing Information ProjectCooperative Extension Service
19
17
130
110
90
701
150
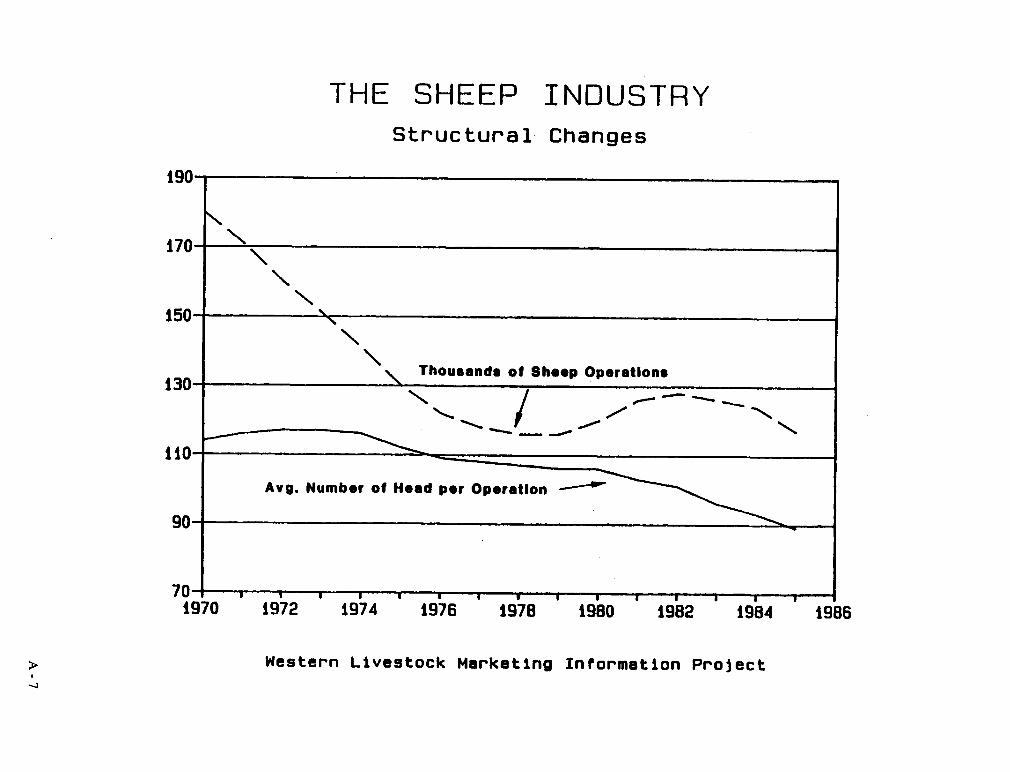
THE SHEEP INDUSTRYStructural Changes
N
\
NN
N
\Thousands of Sheep Operations
..--• ---.„....
..---
— ..,.
\
Avg. Number of Head per Operation ---4.-
970II I I III . II I I
1972 1974 1976 1978 1980 1982III
1984 19E
> Western Livestock Marketing Information Project

TOTAL LAMB SUPPLIES
MIL LBS40
MIL LBS40
35
30
25
20
15
10
TOTAL IMPORTS
• • • • • • • • • • • • • • • • • • • • • • • • • • • • • • • • • • •• •• • •• • • • • • • • • • • • • • • • • • • • • • • • •• • •
• • • • • • • 1• • • • • • • • • • • • • • • • • • • •••• ••••• • • • •• • •
• • • •
• • • • • • • • • • 4 • • • • • • • • • • • • • • • • • • • • • • • • • • • • • • •• • ••
• • • • • • • • • • • • • • •• • • • • • • • • • • • • • • • • • • • • • • •
• • • • • • • • • • • • • • • • • • • • • • • • • • • • •• • • • • • •• • • •
• • •
• • • • • • • • • • • • • • • • • • • • • • • • • • • • • • • • • • • • • •• • • • • • • • • • • • • • • • • • • •• • • • • • • • • • • • • • • • • • . • • • • • • • • • • • • • • • • • • • • • • • • • • • • • • • • • • • • • • • • • • • • • •
• • • • • • • • • • • • • • • • • • • • • • • • • • • • • • • • • • • • • • • • • • • • • • • • • • • • • • • • • • • • • • • • •• • • • • • • • • • • • • • • • • • • • • • • • • • • • •• • • • • • • • • • • • • • • • • • • • • • • • • a • • • • • • • • • • •
• • • • • • • • • • • • • • • • • • • • • • • • • • • • • • • • • • • • • • . • • • • • • • • • • • • • • • • • • • • • • • • • •• • • • • • • • • • • • • • • • • • • • • • • • • • • • • • • • • • • • • • • • • • • • • • • • • • • • • • • • • • • • • • • • •
• • • • • • • • • • • a • • . • • • a • • • • . • a • • • • • • • • • • • • • • • • • • • • • • • • • • • • • • • • • • • • • • •• • • • • • • • • • • • • • • • • • • • • • • • • • • • • • • • • • • • • • • • • • • • • • • • • • • • • • • • • • • • • • • • •
• • • • • . • • • • • • • • • • • • • • • • • • • • • • • • • • • • • • • • • • • • • • • • • • • • • • • • • • • • • • • • • • •• • • • • • • • • • • • • • • • • • • • • • • • • • • • • • • • • • • • • • • • • • • • • . • • • • • • • • • • • • • • • • • • •
• • • • • • • • • • • • • • • • • • • • • • • • • • • • • • • • • • • • • • • • • • • • • • • • • • • • • • • • • • • • • • • • •• • • • • .• • • • • • • • • • • • • • • • • • • • • • • • • • • • • • • • • • • • • • • • • • • • • • • • • • • • • •• • • • • • •
•••••••••••••••••••••••••••••••••••••••••••••••••••••••••••••••••••••••••••••••••••••••••••••••••••••••••••••••••••••••••••••••••
• • • • • • • • • • • • • • • • • • • • • • • • • • • • • • • • • • • • • • • • • • • • • • • • • • • • • • • • • • • • • • • • •• • • • • • • • • • • • • • • • • • • a • • • • • • • • • • • • • • • • • • • • • • • • • • • • • • • • • • • • • • • • • • • • •
• • • • • • • • • • • • • • • • • • • • • • • • • • • • • • • • • • • • • • • • • • • • • • • • • • • • • • • • • • • • • • • • •• • • • • • • • • • • • • • • • • • • • • • • • • • • • • • • • • • • • • • • • • • • • • • • • • • • • • • • • • • • • • • • •
• • • • • • • • • • • • • • • • • • • • • • • • • • • • • • • • • • • • • • • • • • • • • • • • • • • • • • • • • • • • • • • • •• • • • • • • • • • • • • • • • • • • • • • • • • • • • • • • • • • • • • • • • • • • • • • • • • • • • • • • • • • • • • • • •
• • • • • • • • • • • • • • • • • • • • • • • • • • • • • • • • • • • • • • • • • • • • • • • • • • • • • • • • • • • • • • • • •• • • • • • • • • • • • • • • • • • • • • • • • • • • • • • • • • • • • • • • • • • • • • • • • • • • • • • • • • • • • • • • •
• • • • • • • • • • • • • • • • • • • • • • • • • • • • • • • • • • • •
• • • • • • • • • • • • • • • • • • • • • • • • •• • • • • • • • • • • • • • • • • • • • • • • • • • • • • • • • • • • • • • • • • • • • • • • • • • •• • • • • • • • • • •
• • • • • •
1983 1984 1985 1986
Western Livestock Marketing Information ProjectCooperative Extension Service
• • • • • • • • • •• • • • • • • • • •
• • • • • • • • • • •• • • • • • • • • • •
• • • • • • • • • • •• • • • • • • • • • •
• • • • • • • a • • •• • • • • • • • • • • • • • • • • • • • • • • • • • • • • • • • • • • • • • • • • • • • • • • • • • •• • • • • • • • ••• • • • • • • • • • • • • • • • • • • • • • • • • •• • • • • • • • • • • • • • • • • • • • • ,• • • • • • • • • • • • • • • • • • • • • • • • • • • • • • • • • •
• • • • • • • • • • • • • • • • • • • • • • • • • • • • • • • • • • • • • • . • • • • • • • • • • • • • • • • • • • • • • • • • •• • • • • • • • • • • • • • • • • • • • • • • • • • • • • • • • • • • • • • • • • • • • • • • • • • • • • • • • • • • • • • • • •
• • • • • • • • • • • • • • • • • • • • • • • • • • • • • • • • • • • • • • • • • • • • • • • • • • • • • • • • • • • • • • • • •• • • • • • • • • • • • • • • • • • • • • • • • • • • • • • • • • • • • • • • • • • • • • • • • • • • • • • • • • • • • • • • • •
• • • • • • • • • • • • • • • • • • • • • • • e • • • • • e• • • • • • • • • • • • • • • • • • • • • • • • • • • • • e• • • • •• • • • • • • • • • • • • • • • • • • • • • • • • • • • • • • • • • • • • • • • • • • • • • • • • • • • • • • • • • • • • • • • •
• • • • • • • • • • • • • • • • • • • s • • • • • • • • • • • • • • • • • • • • • • • • • • • • • • • • • • • • • • • • • • • • •• • • • • • • • • • • • • • • • • • • • • • • • • • • • • • • • • • • • • • • • • • • • • • • • • • • • • • • • • • • • • • • • •
• • • • • • • • • • • • • • • • • • • • • • • • • • • • • • • • • • • • • • • • • • ,• • • • • • • • • • • • • • • • • • • • • • •• • • • • • • • • • • • • • • • • • • • • • • 4 • • • • • • • • • • • • • • • • a • • • • • • • • • • • • • • • • • • • • n•• • •
• • • • • • • • • • • • • • • • • • • • • • • • • • • • • • • • • • • • • • • • a • • • • • • • • • • • • • • • • • • • • • • • •• • • • • • • • • • • • • • • • • • • • • • • • • • • • • • • • • • • • • • • • • • • • • • • • • • • • • • • • • • • • • • • • ••••••••••••••••••••.“•••-•••,-11-/-0-,_*•••!..•••••••••••••••••••••••• ••• ••• • • • •••• ••• Il• •• • ••••• ••• • • •••••PRODUCTION • • • • • • • • • • • • • • • • • • • •
• ••• ••••• • • • • • • • • • . DOMESTIC• • • • • • • • • • • • • • • • • • • • • • • • • • • • • • • • • • • • • • •
••• • •• •• • • •
Si• • • • • • • • .
•• ••••• • •• • • • • • • • .•• • • • • • • • • • •• . .••• • • • • •• • • •• • • • • • • • • • • • • • • • e e •
• . • • . •
• • • • • • • • • • • • • • • • • • • • • •• • • • •. • • • • •. • • • • • • • • • • • • • • • • • • • • • • • • • • • • • • •
• • • • • • • • • • • • • •
• • • • • • • • • • • • • • • • • • • • • • • • • •• • • • • • • • • • • • • Ai • • • • • • • • • • • • • • • • • • • • • • • • • • • • • • • •
• • • •
• • • • • • • • • • •• • • • • • • • • •
• • • • • • • • • • •• • • • • • • • • •
• • • • • • • • • • •• • • • • • • • • •
• • • • • • • • • • •• • • • • • • • • a
• • • • • • • • • • • • • • •• • • • • • • • • • • • • • • • • • • • • • • • • • • • • • • • • • • • • • • • • • • • ••• • • • • • •
• • • • • • • • • • • • • • • • • • • • • • • • • • • • • • • • • • • • • • • • • • • • •• • • • • • • • • .• • • • • • • • • • • • • • • • • • • • • • • • • • • • • • • • • • • • • • • • • • • • • • • • • • • • • •
• • • • • • • • • • • • • • • • • • • • • • • • • • • • • • • • • • ... a • • • • • • • • • • • • • • • • • •• • • • • • • • • • • • • • • • • • • • • • • • • • • • • • • • • • • • • • • • • • • • • • • • • • • • •
• • • • • • • • • • • • • • • • • • • • • • • • • • • • • • • • • • • • • • • • • • • • • • • • • • • • •• •• • • • • • • • • • • • • • • • • • • • • • • • • • • • • • • • • • • • • • • • • • • • • • • • • • • • • •
• • • • • • • • • • • • • • • • • • • • • • • • • • • • • • • • • • • • • •
• • • •
35
30
25
20
15
10

COMMERCIAL SHEEP IS LAMB SLAUGHTERSEASONAL INDEX
10 10
• • •• • • •
• • • • • •• • • • • • •
• • • • • • • •• • • • • • • •
• • • • • • • • •• • • • • • • • • •
a--• •
• ••
•
• ••
• ••
• •
••
• ••
• •
••
• •• • •
••
• ••
•• •
•• •
•• •
• ••
• ••
•
•• •
•
•
• ••
• ••
••
•• •
• •
•• •
•
•
•
•
•
••
=Mb 9• • • •
• • ••••••••
• • • • • • • • • •• • • • • • • • • •
• • • • • • • • • • •
8
7-
•ID ••
11n ••••
•• •• •
•• •
••
•• •
•• •
••
••
•• •
••
••
•• •
••
••
••
••
• ••
• •
••
• •• • •
• • •• • • •••
•
• •
••
• •• •
••
••••••• •
• • •• ••
••
•••••••
• •• • •• •
• ••
••
•
••
• •• •
• •• ••
••
••
••
• •• •
• ••• •
• •••
••
•
••
• ••
• ••
• ••
•
•• •
•• ••• •
•• •
•• •
••
• ••
• ••
• ••
• ••
• ••
• ••
• ••
• ••
•• •
• • • •• • • ••
• • • • •• • • •
• • • • •• • • •
• • • •• • • • •
• • • • •• •
• • •• •• ••• • • • •
• • • • •• • • •
• • • •
AVERAGE
•• •
• • • •• • •
• • • ••
•• • •
• • • • •• • • •
• • • • ••• •• ••
•
••
• •• •
• • •• • •
•••••• •
•• • •
• •• • •
• • •• • • •• •
• •
• ••
• ••
• ••
••
•• •
•• •
••
•• •
••
••
• ••
• ••
• ••
•
•• •
•• ••
• ••
•
••••••••••• • • • • •
• •• •
• • • •• • • • • •
• • •• •
• ••
•
•
••
••
•
•
•
••
• ••
• •
• ••
• ••
•••
••
• •••••
•
•• •
•• •
•• •
••
• ••
• ••
• ••
••
• ••
• ••
•
• ••
• ••
•
••
• I•
• I•
•
MIND 7
6 6
JAN FEB MAR APR MAY JUN JUL AUG SEP OCT NOV DEC
Western Livestock Marketing Information ProjectCooperative Extension Service

FEEDER LAMB PRICES1986 ACTUAL VS EXPECTED RANGE
$/CWT $/CWT85 85
el..@OM14:11111 1111b
1-.mil
41•11 1110
1111 118101h,AMMON mmmmmmmm mom mmmmmmm ob. 1 . ..r" i
.d•ep• mmmmm memempoomme r ........
.4reiriIIIIM1411124111WOMM1111111111141.. Ar 1.,......,........emommummummommorni mmmmm mmemommomemmuomisommed pftih iwee mmummp as I
mmmmmmmmm Ornirr ill:1111 1 .1111110 nIiii 14bb
AI mmmmmm I
.........1......-pripelilimaldwirrims: i ult....I. geommellummeney Urns .11 ..... I immosimild 11:011
misomommoloomm• imensmon• iN
1 memmums, ilIONOMMOOOMA,IM • , m i Emeememememeni• A mmmmmm moommos 11 holiewAsrummallul gummillmvi ____ _J.,
1: ,11:61:miN marrAmAmos m mu mmmm i mmmm wpm@ Arnow!
1 11111 ,A1
A db -monsem-- ..immemmamon r I i
Tliiiiripi d ALIE mmmmm n Engimams • 1 im - .dol. lo mmig i mmmmm ussollmilimpooldell me so m • • A mom milempomme Ismilumgiumems Isom= le my::::11:mili PP I PPI P IP , rm. • i 1 mom Ern memommok Emu mmmmm mom
so • II 1 mom mmmmm • oillmi mmommoomm.imissommommiFji mmmmmmm momillMEOW. Ak . Is' • A seem mmmmm me mom • e 011e8M , A1Omb. '''' 1 'AO mom mmmmmmmmm m memmemmob 41 r0i MOW .11p,' !4 OM
pow Ase Amminimmommisommor EXPECTED nRANGE....A..
Ana .......VANOR , IliedlienilieddiOMOMMMUOMONSOU m I mm MOOMMAiiinilibidaleihriliklelpilliiielird nn WPr ge nl o :111111111Ygliiir•Pr
mai .1 P-
e p "1111" r1""
'MM. s•!emmome1111111mieselem1986 ACTUAL Amoroso women'mum soppeimpsommei
' Iii.:Iiilliiiiii:i il Piii 111111"
60JAN F63 MAR APR MAY JUN JUL AUG SEP OCT NOV DEC
9"
Western Livestock Marketing Information Project
o Cooperative Extension Service
80
75
70
80
75
70
65
60

MMMMMMMMMMMMMMMMMMMMMM momemassommapplimpl ommummomgmr-
glim-.'"Pmmempo w -• .- -.spry • - -, w7 7
. -.I ...um ono MMMMMMMM Immi.,... .- .
....—ummum....`Atli
MOSNOW MMMMM OMOOMOSOOOPSOOMOOSOO'OMOOOMOO'WOOOMOWMOO.
ism... Gammons
A rd
SEASONAL LAMB PRICE INDEXU.S. AVERAGE PRICES 1970-1984
120
85 -
80 F. I
JAN FEB MAR APR MAY JUN JUL AUG SEP OCT NOV DEC
WESTERN LIVESTOCK MARKETING INFO. PROJ.

SHEEP El LAMBS ON FEED
26 STATES UNTIL 1979 - 24 STATES CURRENTLY
Western Livestock Marketing Information ProjectCooperative Extension Service
Extension Service, Oregon State University, Corvallis, O.E. Smith, direc-tor. This publication was produced and distributed in furtherance of theActs of Congress of May 8 and June 30, 1914. Extension work is a coopera-tive program of Oregon State University, the U.S. Department of Agricul-ture, and Oregon counties.
Oregon State University Extension Service offers educational programs,activities, and materials—without regard to race, color, national origin,sex, or disability—as required by Title VI of the Civil Rights Act of 1964,Title IX of the Education Amendments of 1972, and Section 504 of theRehabilitation Act of 1973. Oregon State University Extension Sevice is