trends - annualreports.com€¦ · our financial trends (a) ... its sap system for about 70% of its...
TRANSCRIPT

13
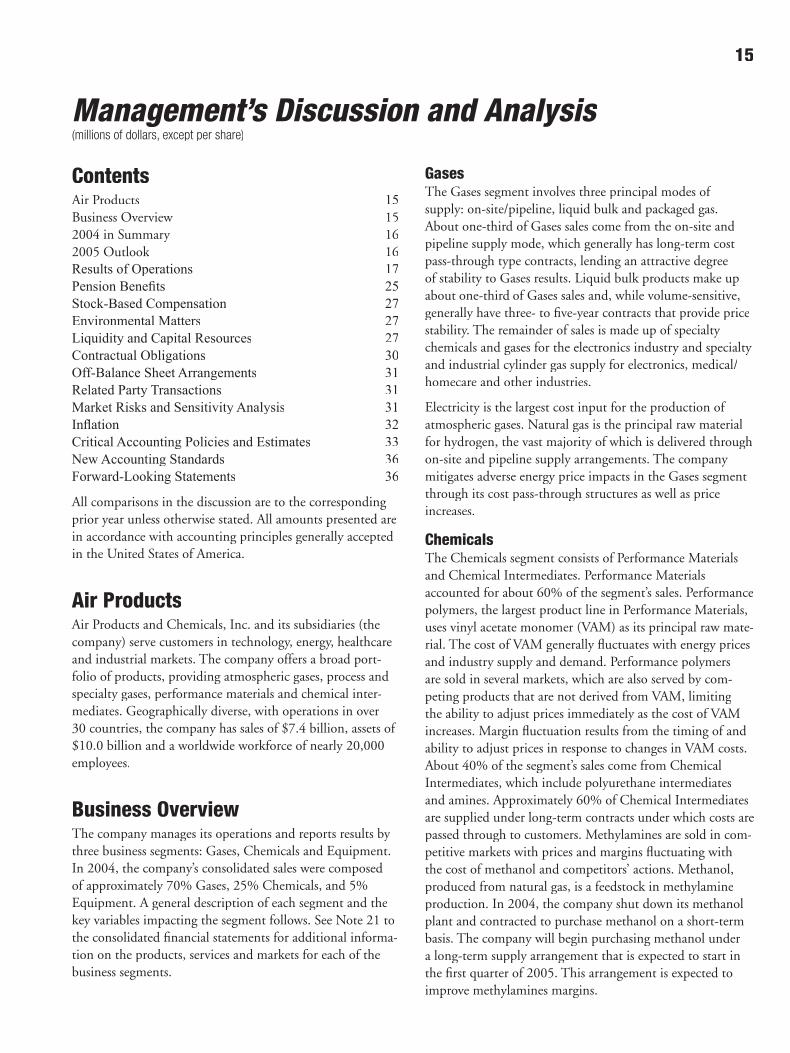
our financial Trends
(A) Operating income divided by fi ve-quarter average of total assets less investments in equity affi liates.(B) Assumes reinvestment of all dividends.
Sales(billions of dollars)
5.6 5.9 5.4 6.3 7.4
00 01 02 03 04
Earnings per Share(dollars—diluted basis)
0.57 2.12 2.36 1.78 2.64
00 01 02 03 04
Operating Return on Net Assets(A) (percentage)
10.3 9.5 10.0 7.1 9.5
00 01 02 03 04
Cash from Operations (millions of dollars)
1,174 1,084 1,064 1,036 1,086
00 01 02 03 04
Operating Income(millions of dollars)
818 734 761 595 880
00 01 02 03 04
Shareholder Return(B)
(percentage)
25.9 9.3 10.8 9.6 23.0
00 01 02 03 04
13.2 (26.6) (20.5) 24.4 13.9
Air Products
S&P
Return on Equity(percentage)
4.3 15.8 15.9 10.9 14.7
00 01 02 03 04
Capital Expenditures (billions of dollars)
1.0 0.8 0.8 1.2 0.8
00 01 02 03 04
Acquisitions
Investmentin Affi liates
Plant andEquipment

14
Management’s Discussion and Analysis 15
Report of Independent Registered Public Accounting Firm 37
The Consolidated Financial Statements 38
Notes to the Consolidated Financial Statements 42
Five-Year Summary of Selected Financial Data 68
contents
our Financials
15
Management’s Discussion and Analysis(millions of dollars, except per share)
Contents Air Products 15Business Overview 152004 in Summary 162005 Outlook 16Results of Operations 17Pension Benefi ts 25Stock-Based Compensation 27Environmental Matters 27Liquidity and Capital Resources 27Contractual Obligations 30Off-Balance Sheet Arrangements 31Related Party Transactions 31Market Risks and Sensitivity Analysis 31Infl ation 32Critical Accounting Policies and Estimates 33New Accounting Standards 36Forward-Looking Statements 36
All comparisons in the discussion are to the corresponding prior year unless otherwise stated. All amounts presented are in accordance with accounting principles generally accepted in the United States of America.
Air ProductsAir Products and Chemicals, Inc. and its subsidiaries (the company) serve customers in technology, energy, healthcare and industrial markets. The company offers a broad port-folio of products, providing atmospheric gases, process and specialty gases, performance materials and chemical inter-mediates. Geographically diverse, with operations in over 30 countries, the company has sales of $7.4 billion, assets of $10.0 billion and a worldwide workforce of nearly 20,000 employees.
Business OverviewThe company manages its operations and reports results by three business segments: Gases, Chemicals and Equipment. In 2004, the company’s consolidated sales were composed of approximately 70% Gases, 25% Chemicals, and 5% Equipment. A general description of each segment and the key variables impacting the segment follows. See Note 21 to the consolidated fi nancial statements for additional informa-tion on the products, services and markets for each of the business segments.
GasesThe Gases segment involves three principal modes of supply: on-site/pipeline, liquid bulk and packaged gas. About one-third of Gases sales come from the on-site and pipeline supply mode, which generally has long-term cost pass-through type contracts, lending an attractive degree of stability to Gases results. Liquid bulk products make up about one-third of Gases sales and, while volume-sensitive, generally have three- to fi ve-year contracts that provide price stability. The remainder of sales is made up of specialty chemicals and gases for the electronics industry and specialty and industrial cylinder gas supply for electronics, medical/homecare and other industries.
Electricity is the largest cost input for the production of atmospheric gases. Natural gas is the principal raw material for hydrogen, the vast majority of which is delivered through on-site and pipeline supply arrangements. The company mitigates adverse energy price impacts in the Gases segment through its cost pass-through structures as well as price increases.
ChemicalsThe Chemicals segment consists of Performance Materials and Chemical Intermediates. Performance Materials accounted for about 60% of the segment’s sales. Performance polymers, the largest product line in Performance Materials, uses vinyl acetate monomer (VAM) as its principal raw mate-rial. The cost of VAM generally fl uctuates with energy prices and industry supply and demand. Performance polymers are sold in several markets, which are also served by com-peting products that are not derived from VAM, limiting the ability to adjust prices immediately as the cost of VAM increases. Margin fl uctuation results from the timing of and ability to adjust prices in response to changes in VAM costs. About 40% of the segment’s sales come from Chemical Intermediates, which include polyurethane intermediates and amines. Approximately 60% of Chemical Intermediates are supplied under long-term contracts under which costs are passed through to customers. Methylamines are sold in com-petitive markets with prices and margins fl uctuating with the cost of methanol and competitors’ actions. Methanol, produced from natural gas, is a feedstock in methylamine production. In 2004, the company shut down its methanol plant and contracted to purchase methanol on a short-term basis. The company will begin purchasing methanol under a long-term supply arrangement that is expected to start in the fi rst quarter of 2005. This arrangement is expected to improve methylamines margins.
16 Management’s Discussion and Analysis continued
EquipmentThe Equipment segment designs and manufactures cryo-genic and gas processing equipment for air separation, gas processing, natural gas liquefaction (LNG), and hydrogen purifi cation. The segment also builds cryogenic transpor-tation containers for liquid helium. Equipment is sold worldwide to companies involved in oil and gas recovery and processing, chemical and petrochemical manufacturing, power generation, and steel and primary metals process-ing. This business is cyclical, primarily impacted by capital spending for expansion of LNG and general manufacturing capacity.
2004 in Summary As the economy and manufacturing environment improved globally, volume growth across the company’s businesses was strong. The Gases business demonstrated improvements in both sales and operating income. Liquid bulk gas pricing improved, while electronics specialty materials average pric-ing continued to decline. Higher raw material costs not con-tractually passed through to customers had a negative effect on the Chemicals segment results. Although the company has implemented price increases across a number of products and is beginning to see success in passing these cost increases through to customers, the Chemicals segment has not yet reached acceptable profi t levels. Equipment sales increased from higher air separation plant sales.
As part of its ongoing portfolio management activities, the company continued to execute its growth strategies, includ-ing the acquisition of several small U.S. homecare compa-nies. At the end of 2004, the company had implemented its SAP system for about 70% of its businesses, setting the foundation for future productivity improvement. The com-pany remained focused on capital discipline, loading its existing asset base, and improving its return on capital.
Sales of $7,411 were up 18% from the prior year, due to higher volumes across the company’s businesses, acquisitions, and favorable currency effects. Sales benefi ted from acquisi-tions, which included Ashland Electronic Chemicals, U.S. homecare companies, and Sanwa Chemical Industry Co., Ltd. (Sanwa). Currency contributed favorably to results, as the U.S. dollar weakened, with the majority of the impact coming from the strengthening of the Euro.
Operating income was $880, compared to $595 in the prior year, which included a net expense of $153 for global cost reduction plans. Operating income benefi ted from the higher volumes, favorable currency effects, and acquisitions.
Partially offsetting these favorable variances, costs increased, driven by higher raw material costs not contractually passed through to customers in the Chemicals segment, higher pen-sion expense, higher incentive compensation expense result-ing from increased earnings, and higher operating costs.
Net income was $604, compared to $397 in the prior year, which included an after-tax net expense of $97 for global cost reduction plans. Diluted earnings per share of $2.64 compared to $1.78 in the prior year, which included a $.43 impact for global cost reduction plans. A summary table of changes in earnings per share is presented below:
Changes in Earnings per Share Increase 2004 2003 (Decrease)
Diluted Earnings per Share $2.64 $1.78 $.86
Operating Income (after-tax)
Global cost reduction plans, net .43
Acquisitions .08
Divestitures (.01)
Currency .16
Underlying business Volume .70 Price/raw materials (.12) Costs (excluding pension) (.24) Pension expense (.15)
Operating Income .85
Other (after-tax)
Interest expense .01
Other —
Other .01
Total Change in Earnings per Share $.86
2005 OutlookThe company is forecasting earnings per share growth again in 2005. This is inclusive of productivity implementation costs. As we enter 2005, we expect domestic manufactur-ing growth between 3% and 6% for the year. Across our Electronics businesses and in line with external forecasts, we anticipate more modest silicon growth next year, somewhere in the range of 0–5%. Flat-panel display growth is expected to reach double-digit levels. For natural gas, we expect the 2005 price to be comparable with the 2004 average cost. Foreign currencies are expected to be relatively stable. Two risks to this forecast are raw material and energy price volatil-ity and lower economic growth. Both Gases and Chemicals 2005 operating income should benefi t from operating lever-age on our existing assets and our increased productivity

17
.
efforts. Gases is also expected to benefi t from new invest-ments across Energy Process Industries (EPI), Electronics and Healthcare. Equipment 2005 profi ts should be almost double those achieved in 2004.
The company faces challenges in some of its Chemicals businesses. While certain businesses are delivering returns at or above their cost of capital, others are below their cost of capital. The volatility and increase in some raw material costs have reduced margins. The company plans on reducing the volatility of its raw material costs and striving to continue to raise prices aggressively. For all of 2005, our goal is for returns in the Chemicals segment to exceed its cost of capital.
The company also is determined to signifi cantly improve its productivity. Historically, productivity has offset cost infl ation. The company expects increased benefi ts across its supply chains and support functions as a result of its produc-tivity initiatives. In 2005, the company anticipates after-tax implementation costs of $.10 to $.15 per share to achieve productivity savings.
For additional information on the opportunities, challenges and risks on which management is focused, refer to the 2005 Outlook discussions provided throughout the Management’s Discussion and Analysis which follows.
Results of OperationsConsolidated Results 2004 2003 2002
Sales $7,411.4 $6,297.3 $5,401.2
Cost of sales 5,463.6 4,613.1 3,815.7
Selling and administrative 969.4 842.6 718.1
Research and development 126.7 121.1 120.3
Other (income) expense, net (27.9) (26.5) (37.1)
Global cost reduction plans, net — 152.5 23.1
Operating Income 879.6 594.5 761.1
Equity affiliates’ income 92.8 94.4 90.0
Gain on sale of U.S. packaged gas business — — 55.7
Interest expense 121.0 123.5 122.3
Effective tax rate 27.3% 26.9% 31.4%
Net Income 604.1 397.3 525.4
Basic Earnings per Share $2.70 $1.81 $2.42
Diluted Earnings per Share $2.64 $1.78 $2.36
Discussion of Consolidated ResultsSales
% Change from Prior Year 2004 2003
Acquisitions 5% 6%Divestitures (1)% (2)%Currency 4% 4% Natural gas/raw material cost pass through 1% 4%Underlying business Volume 9% 5% Price/mix — —
Total Consolidated Sales Change 18% 17%
2004 vs. 2003SalesSales of $7,411.4 increased 18%, or $1,114.1. Acquisitions, including Ashland Electronic Chemicals, U.S. homecare companies, and Sanwa, accounted for 5% of the increase. Favorable currency effects, driven primarily by the weaken-ing of the U.S. dollar against the Euro, accounted for an additional 4% of the sales growth. Underlying base business growth of 9% resulted primarily from improved volumes in the Gases and Chemicals businesses, as further discussed in the Segment Analysis which follows. Equipment sales increased from higher air separation plant sales, also contrib-uting to the underlying base business sales growth.
Operating IncomeOperating income of $879.6 compared to $594.5 in the prior year, which included a net expense of $152.5 for global cost reduction plans. (Refer to Note 3 to the consolidated fi nancial statements for information on the global cost reduction plans.)
Favorable operating income variances resulted from higher volumes for $222, favorable currency effects for $49, and acquisitions for $25. Operating income decreased by $31 from higher raw material costs not contractually passed through to customers or recovered via price increases within the Chemicals segment. Operating income declined $119 from higher costs, including higher pension and incentive compensation expense, and higher operating costs.
Equity Affi liates’ IncomeIncome from equity affi liates of $92.8 decreased $1.6. Current year results, including favorable currency effects and higher income from the Gases Asian and Latin American affi liates, partially offset the impact of $23 in favorable adjustments recorded in 2003 related to prior period divestitures.

18 Management’s Discussion and Analysis continued
2003 vs. 2002SalesSales of $6,297.3 increased 17%, or $896.1. Acquisitions, including the U.S. homecare companies in 2003 and San Fu Gas Company, Ltd. (San Fu) in July 2002, accounted for 6% of the increase. Favorable currency effects, driven pri-marily by the weakening of the U.S. dollar against the Euro, accounted for 4% of the sales growth. Sales increased an additional 4% from the impact of higher natural gas and raw material costs contractually passed through to customers. Underlying base business growth of 5% resulted principally from improved volumes in the Chemicals and Gases busi-nesses, as discussed in the Segment Analysis which follows.
Operating IncomeOperating income in 2003 included a net expense of $152.5 for global cost reduction plans as compared to 2002, which included a net expense of $23.1 for global cost reduction plans.
Operating income of $594.5 declined $166.6, with $129.4 of the decline from higher global cost reduction plan expenses. Operating income declined $154 from higher costs, including pension and SAP implementation expenses and operating costs. Favorable operating income variances resulted from higher volumes for $77, acquisitions for $72, and favorable currency effects for $59. Within the Chemicals segment, operating income decreased by $55 from higher raw material and energy costs. Operating losses not associated with business segments (included in All Other) increased $19 due to expenses associated with the Honeywell litigation in 2003 and favorable adjustments recorded in 2002 related to a divested business and insurance settlements.
Equity Affi liates’ IncomeIncome from equity affi liates of $94.4 increased $4.4. Favorable adjustments of $23 were recorded in 2003 related to divestitures recorded in prior years, partially offset by the impact of consolidating San Fu in the fourth quarter of 2002 and a tax benefi t related to an asset revaluation at an Italian affi liate recorded in 2002.
Selling and Administrative Expense (S&A)
% Change from Prior Year 2004 2003
Acquisitions 6% 12%Divestitures (1)% (3)%Currency 4% 3% Other Costs 6% 5%
Total S&A Change 15% 17%
2004 vs. 2003S&A expense of $969.4 increased 15%, or $126.8. S&A as a percent of sales declined to 13.1% from 13.4% in 2003. Acquisitions, including Ashland Electronic Chemicals and the U.S. homecare companies, increased S&A by 6%. Currency effects, driven by the weakening of the U.S. dollar against the Euro and the Pound Sterling, increased S&A by 4%. Underlying costs increased 6%, primarily due to infl a-tion, higher pension and incentive compensation expenses, and increased spending due to higher volumes in the busi-ness, partially offset by cost reduction and productivity efforts.
2003 vs. 2002S&A increased 17%, or $124.5. S&A as a percent of sales was 13.4%, comparable to 13.3% in the prior year. Acquisitions, principally the U.S. homecare companies, increased S&A by 12%. Divestitures reduced S&A by 3%, primarily from the sale of the U.S. packaged gas business. Currency effects, driven by the strengthening of the Euro, increased S&A by 3%. Underlying costs increased 5%, primarily due to infl ation, SAP implementation and pension expenses. These increases in S&A were partially offset by lower incentive compensation costs and improved productivity.
2005 Outlook S&A will increase in 2005 as a result of acquisitions, pri-marily the full-year impact of U.S. homecare acquisitions made during 2004 and planned U.S. homecare acquisitions for 2005. The homecare business has a signifi cantly higher level of S&A, as a percent of sales, than the average mix of the company’s historic businesses. In addition, the company expects increases in S&A due to infl ation and higher incen-tive compensation expense resulting from increased earnings, and implementation costs to achieve productivity savings. Partially offsetting these impacts, the company expects to realize cost savings from productivity initiatives and savings in the businesses where SAP was implemented in 2004 and earlier.
Research and Development (R&D) 2004 vs. 2003R&D increased 5%, or $5.6, due to cost infl ation and increased pension expense. R&D spending declined as a percent of sales from 1.9% to 1.7% in 2004, as project port-folio management focused R&D on key technologies and eliminated lower-value programs. About 75% of R&D was focused on the company’s key growth platforms.
19
2003 vs. 2002R&D increased 1% and declined as a percent of sales, from 2.2% to 1.9% in 2003, as the project portfolio was aligned with the company’s key growth platforms.
2005 OutlookThe company expects R&D spending at a level comparable to 2004. R&D investment will follow the growth of the company’s key growth platforms and the requirements of emerging businesses.
Other (Income) Expense, NetItems recorded to other income arise from transactions and events not directly related to the principal income earning activities of the company.
2004 vs. 2003Other income of $27.9 increased $1.4. Results in 2004 included higher favorable impacts from insurance settle-ments and the sale of assets and investments. Results in 2004 were unfavorably impacted by higher costs associated with legal matters, including the Honeywell litigation, and higher intangible asset amortization expense.
2003 vs. 2002Other income of $26.5 declined $10.6. Amortization expense increased, resulting primarily from the intangible assets associated with the U.S. homecare companies acquired in 2003. Results in 2002 included higher favorable impacts from the sale of assets and investments.
Global Cost Reduction Plans 2003 PlanIn 2003, the company recorded an expense of $152.7 for a global cost reduction plan (2003 Plan). This expense included $56.8 for severance and pension-related benefi ts and $95.9 for asset disposals and facility closures in the Gases and Chemicals segments. The results for 2003 also included the reversal of the balance of the 2002 global cost reduction plan accrual of $.2.
During the third quarter of 2003, the company completed a capacity utilization analysis in several businesses in the Gases segment. To reduce capacity and costs, several facili-ties ceased operation as of 30 June 2003. An expense of $37.6 was recognized for the closure of these facilities, net of expected recovery from disposal. A decision was made to terminate several incomplete capacity expansion projects. An expense of $13.0 was recognized for the cost of terminating these projects, net of expected recovery from disposal and redeployment. An expense of $3.6 was also recognized for the planned sale of two real estate properties and the termi-nation of several leases for small facilities. These expenses were principally in the North American merchant and ton-
nage businesses, with a modest amount in the Electronics business.
The rationalization of excess capacity in certain products resulted in a decision to exit certain Chemical Intermediates operations. Late in the quarter ended 30 June 2003, the company decided to pursue the sale of its European methyl-amines and derivatives business. Expected proceeds from the sale were determined and a loss was recognized for the difference between the carrying value of the assets and the expected net proceeds from the sale. Additional expenses for the closure of the methanol and ammonia plants in Pensacola, Florida, which made products for internal con-sumption, were also recognized. The total expense for these actions was $41.7.
In addition to the capacity reduction initiatives, the com-pany implemented cost reduction and productivity-related efforts. The divestitures, the capacity reductions and the cost control initiatives will result in the elimination of approximately 460 positions from the company after the completion of the European methylamines and derivatives business divestiture. Approximately 30% of the position reductions relates to capacity rationalization and divestitures. An additional 40% relates to ongoing productivity efforts and balancing engineering resources with project activity, and the remaining 30% relates to a reduction in the number of management positions. The 2003 Plan was completed as expected in June 2004, with the exception of the planned sale of the European methylamines and derivatives business. In April 2004, the company announced the proposed sale of this business, which is pending regulatory approval.
Cost savings from the 2003 Plan realized in 2003 were approximately $3. Cost savings of approximately $38 were realized in 2004. Beyond 2004, the company expects the 2003 Plan to provide annualized cost savings of $59, of which the majority is related to reduced personnel costs. As a result of actions taken in the 2003 and prior years’ global cost reduction plans, operating income in 2004 included $36 of incremental benefi ts over those realized in 2003.
2002 PlanIn 2002, the company recorded an expense of $30.8 for a global cost reduction plan (2002 Plan), including U.S. packaged gas divestiture-related reductions. This expense included $27.1 for severance and pension-related benefi ts and $3.7 for asset impairments related to the planned sale or closure of two small chemical facilities. The 2002 Plan included 333 position eliminations in the areas of manufac-turing, engineering, distribution and overheads. The 2002 Plan was completed as expected in March 2003. The results for 2002 also included the reversal of the balance of the accrual for the 2001 global cost reduction plan of $7.7.

20 Management’s Discussion and Analysis continued
Cost savings from the 2002 Plan realized in 2002 were approximately $3. Cost savings of approximately $16 and $17 were realized in 2003 and 2004, respectively. Beyond 2004, the company expects the 2002 Plan to provide annu-alized incremental cost savings of $17, of which the majority is related to reduced personnel costs.
Gain on Sale of U.S. Packaged Gas BusinessIn 2002, the company completed the sale of the majority of its U.S. packaged gas business, excluding the electronic gases and magnetic resonance imaging-related helium operations, to Airgas, Inc. The results for 2002 included a gain of $55.7. Refer to Note 5 to the consolidated fi nancial statements for additional information.
Interest Expense 2004 2003 2002
Interest incurred $126.5 $127.7 $131.7
Less: interest capitalized 5.5 4.2 9.4
Interest expense $121.0 $123.5 $122.3
2004 vs. 2003Interest incurred decreased $1.2. The decrease resulted from lower average interest rates and a lower average debt balance excluding currency effects, partially offset by the impact of a weaker U.S. dollar on the translation of foreign currency interest.
2003 vs. 2002Interest incurred decreased $4.0. This decrease resulted from lower average interest rates and a lower average debt balance excluding currency effects, partially offset by the impact of a weaker U.S. dollar on the translation of foreign currency interest. Interest capitalized decreased from the lower level of construction in progress for plant and equipment built by the company.
2005 OutlookThe company expects a modest decrease in interest incurred, due primarily to the expectation of a lower average debt bal-ance and a lower debt portfolio average interest rate in 2005. The 2005 estimate is based on the current estimate of earn-ings and spending and excludes the possible effects of any future acquisitions other than the ongoing homecare acqui-sitions, any change in stock repurchase or dividend policy, any change in currency exchange rates or any change in risk management policy.
Effective Tax RateThe effective tax rate equals the income tax provision divided by income before taxes less minority interest.
2004 vs. 2003The effective tax rate was 27.3% compared to 26.9%. In 2004, there were increased credits and adjustments from the company’s ongoing tax planning process, including such items as improved utilization of foreign tax credits, foreign tax holidays, and certain donations that are eligible for tax deductions. However, the effective tax rate was lower in 2003 due to the relatively low level of book taxable income as a result of the 2003 global cost reduction plan expense.
2003 vs. 2002The 2003 effective tax rate was 26.9% compared to 31.4%. The difference in the rates was due to higher tax credits and adjustments in 2003 and the nondeductible costs included in the sale of the U.S. packaged gas business in 2002.
2005 Outlook The company expects the effective tax rate in 2005 to increase slightly, principally attributable to higher income. This estimate is based on current tax law, the current estimate of earnings and credits and adjustments, and the expected distribution of income among various tax jurisdictions.
Net Income2004 vs. 2003Net income was $604.1 compared to $397.3 in 2003, which included an after-tax net expense of $96.5 for global cost reduction plans. Diluted earnings per share was $2.64 com-pared to $1.78 in 2003, which included a $.43 impact from global cost reduction plans. A summary table of changes in earnings per share is presented on page 16.
2003 vs. 2002Net income was $397.3, or $1.78 diluted earnings per share, as compared to net income of $525.4, or $2.36 diluted earn-ings per share. 2003 results included a net expense for global cost reduction plans ($96.5 after-tax, or $.43 per share). 2002 results included a gain on the sale of the U.S. pack-aged gas business ($25.7 after-tax, or $.12 per share) and a net expense for global cost reduction plans ($14.1 after-tax, or $.07 per share). The effective tax rate of 26.9% was lower than the 2002 rate of 31.4%.

21
Segment AnalysisThe company manages its operations and reports results by three business operating segments: Gases, Chemicals and Equipment. Refer to the Business Overview discussion on page 15 for a description of the business segments.
Gases 2004 2003 2002
Sales $5,221.8 $4,438.3 $3,673.9
Operating income 800.5 574.8 600.2
Equity affiliates’ income 78.2 68.3 75.7
Gases Sales
% Change from Prior Year 2004 2003
Acquisitions 6% 9%Divestitures (1)% (4)%Currency 4% 5% Natural gas/raw material cost pass through 1% 6%Underlying business Volume 8% 5% Price/mix — —
Total Gases Sales Change 18% 21%
2004 vs. 2003The Gases business demonstrated improvements in both sales and operating income, driven by strong volume growth as discussed in more detail below. Strong growth continued in the global healthcare business as the company continued to execute its growth strategy through acquisitions. Spending on acquisitions in 2004 included $75.1 for six small U.S. homecare businesses.
Gases SalesSales of $5,221.8 increased 18%, or $783.5. Acquisitions, including U.S. homecare companies and Ashland Electronic Chemicals, accounted for 6% of the increase. Favorable currency effects, driven primarily by the weakening of the U.S. dollar against the Euro and also the Pound Sterling, accounted for an additional 4% sales increase.
Underlying base business sales growth of 8% resulted from improved volumes across the Gases segment, including Electronics, EPI, and the merchant and tonnage businesses.
• Electronic specialty materials volumes increased, as elec-tronics markets continued to improve, including strong growth in the silicon and fl at-panel display markets.
• On-site and pipeline volumes in EPI were up 11%, led by stronger hydrogen, oxygen and nitrogen volumes.
Hydrogen growth versus the prior year is tracking the ongoing trend for refi ners to meet lower sulfur specifi ca-tions. Volumes benefi ted from production at a new facility in Lake Charles, Louisiana, which came onstream in the third quarter of 2004.
• Liquid bulk volumes in North America increased 1%. Liquid oxygen (LOX) and liquid nitrogen (LIN) volumes improved along with general U.S. manufacturing growth. Partially offsetting this increase, liquid hydrogen volumes declined from weakness in the government and chemical and process industries sectors.
• Liquid bulk volumes in Europe declined 2%, with the conversion of several liquid customers to on-site supply and lost business.
• Packaged gas volumes in Europe increased 3%, refl ecting continued positive manufacturing growth and also benefi ting from continued success with new product introductions.
• Asian liquid bulk volumes were up 13%, driven by demand growth across the region.
Overall, the impact of pricing decreased sales slightly, with anticipated lower average selling prices of electronic spe-cialty materials offsetting higher liquid bulk prices in North America and Europe and higher packaged gas prices in Europe.
• Pricing for electronic specialty materials decreased due to a decline in average selling price and customer conversions from cylinder to bulk supply.
• On average, prices for LOX/LIN in North America remained fl at.
• LOX/LIN pricing in Europe increased 4%, infl uenced by continued pricing actions as well as the customer mix effect from the conversion of liquid customers to on-site supply.
Gases Operating IncomeOperating income of $800.5 increased $225.7. Operating income in 2003 included a net expense of $92.0 for global cost reduction plans. Favorable operating income variances resulted from higher volumes for $163, favorable currency effects for $35, and acquisitions for $22. Operating income declined $67 from higher costs, including higher pension and incentive compensation expense.
Gases Equity Affi liates’ IncomeGases equity affi liates’ income of $78.2 increased $9.9. Current year results, including favorable currency effects and higher income from the Asian and Latin American affi liates, more than offset the impact of favorable adjustments of $8 recorded in 2003 associated with two divested cogeneration plant investments.
22 Management’s Discussion and Analysis continued
2003 vs. 2002Gases SalesSales of $4,438.3 increased 21%, or $764.4. Acquisitions, including U.S. homecare companies and Ashland Electronic Chemicals in 2003 and San Fu in July 2002, accounted for 9% of the increase. Divestitures, including the sale of the Canadian packaged gas business in 2003 and the sale of the U.S. packaged gas business in 2002, reduced sales by 4%. Sales increased 5% from favorable currency effects, driven primarily by the weakening of the U.S. dollar against the Euro, and 6% from the impact of higher natural gas cost contractually passed through to customers.
Underlying base business sales growth of 5% resulted from improved volumes across most businesses.
• Electronic specialty materials increased, driven primarily by increased Asian demand.
• On-site and pipeline volumes in EPI were up 5%, led by stronger oxygen, nitrogen and hydrogen volumes.
• Liquid bulk volumes in North America declined 3%, due to weak economic conditions.
• Liquid bulk volumes in Europe during 2003 were at a similar level to 2002.
• Asian liquid bulk volumes were up 12%, driven by strong economic growth, a new plant onstream in southern China, and the loading of existing assets in Southeast Asia.
Overall, the impact of pricing decreased sales slightly.
• Pricing for electronic specialty materials decreased, due to the prolonged nature of the downturn in the electronics industry, excess supply capacity, and customer mix effects.
• On average, prices for LOX/LIN in North America remained fl at. Underlying price increases of about 3% were offset by the negative year-on-year impact of lower surcharges.
• LOX/LIN pricing in Europe increased by 2%, consistent with infl ation.
Gases Operating IncomeOperating income of $574.8 decreased $25.4. Operating income included a net expense of $92.0 for global cost reduction plans as compared to 2002, which included a net expense of $21.0 for global cost reduction plans. Operating income was favorably impacted by higher volumes for $75, acquisitions for $53, and favorable currency for $35. Divestitures resulted in a favorable operating income vari-
ance of $18 compared to 2002, which included costs related to the U.S. packaged gas business incurred subsequent to the divestiture in February 2002. Partially offsetting these gains were higher costs of $125, including higher pension and SAP implementation expenses and higher operating costs. Lower electronics specialty material pricing also unfavorably impacted operating income.
Gases Equity Affi liates’ IncomeGases equity affi liates’ income of $68.3 decreased 10%, or $7.4. The decrease was due primarily to the consolidation of San Fu and the tax benefi t related to an asset revaluation at an Italian affi liate recorded in 2002, partially offset by $8 in favorable adjustments to customary post-sale liabilities asso-ciated with two divested cogeneration plant investments and the impact of currency effects.
2005 Outlook Gases sales are expected to increase based upon volume growth driven by higher manufacturing activity and the impact of U.S. homecare acquisitions. Increased volumes are expected for Electronics during the year based on estimates of modestly higher wafer production and demand from the fl at-panel display market. Hydrogen volumes are expected to continue to grow as regulatory drivers for clean fuels continue and new plants to serve such demand are brought onstream during the year. Based on favorable demographics and other trends in the healthcare industry, the company’s healthcare business is expected to grow organically, as well as through acquisitions. Other industrial end markets are expected to more closely track the general state of the manufacturing economies of the world. The company’s current outlook for U.S. manufacturing growth is 3% to 6% in 2005, and volume growth assumptions for the U.S. liquid bulk gases business are tied to this range. Liquid bulk volumes outside the U.S. are also tied to manufacturing growth. The company expects that manufacturing growth in the European region will be below the U.S., while growth in Asia will exceed the U.S. Pricing in the liquid bulk busi-ness globally is expected to remain relatively fi rm. Pricing in electronics specialty materials is expected to decline in 2005 due to the full year impact of the 2004 price decrease, which resulted from a decline in average selling price and customer conversions from cylinder to bulk supply.

23
Chemicals 2004 2003 2002
Sales $1,828.9 $1,591.2 $1,451.7
Operating income 116.0 67.1 172.5
Equity affiliates’ income 14.6 10.8 11.7
Chemicals Sales
% Change from Prior Year 2004 2003
Acquisitions 1% 1%Divestitures — (1)%Currency 3% 4% Natural gas/raw material cost pass through 3% 3%Underlying business Volume 7% 4% Price/mix 1% (1)%
Total Chemicals Sales Change 15% 10%
2004 vs. 2003Chemicals sales increased, driven by strong volumes across most businesses. Higher raw material costs not contractu-ally passed through to customers had a negative impact on Chemicals segment results during 2004. The company has implemented price increases across a number of products, including performance polymers and several amines prod-uct lines. While the company has begun to pass these cost increases through to customers, the Chemicals segment has not yet reached acceptable profi t levels. A long-term supply arrangement to purchase methanol for domestic methyl-amines production and reduce raw material cost volatility was expected to start in the second half of 2004. However, the start of this supply arrangement has been delayed, and the company now anticipates to begin receiving product late in the fi rst quarter of 2005.
Chemicals SalesSales of $1,828.9 increased 15%, or $237.7. Sales increased 3% from favorable currency effects, driven primarily by the weakening of the U.S. dollar against the Euro. Underlying base business sales increased 7% from higher volumes across most of the company’s Chemical Intermediates and Performance Materials businesses. Base business Performance Materials volumes increased 7%, with improvements in most businesses and regions, refl ecting the improved economic environment. In Chemical Intermediates, base business vol-umes increased 7%. Higher amines volumes increased from a better herbicide market. Methylamines and polyurethane volumes increased from new contractual volumes. Sales increased 3% from higher raw material costs contractually passed through to customers.
Chemicals Operating IncomeOperating income of $116.0 increased $48.9. Operating income in 2003 included an expense of $58.1 for the 2003 global cost reduction plan. Other favorable operating income variances resulted from favorable currency effects for $13 and higher volumes for $52. Operating income declined $31 from higher raw material costs not contractually passed through to customers or recovered via price increases. Additionally, operating income decreased $51 from higher costs, including higher manufacturing costs and higher pen-sion and incentive compensation expense.
Chemicals Equity Affi liates’ IncomeChemicals equity affi liates’ income was $14.6 compared to $10.8 in 2003. Chemicals equity affi liates’ income consists primarily of a global polymer joint venture.
2003 vs. 2002Chemicals SalesSales of $1,591.2 increased 10%, or $139.5. Sales increased 4% from currency effects, driven primarily by the strength-ening of the Euro, and 3% from the impact of higher natural gas and raw material costs contractually passed through to customers. Underlying base business sales increased 4%, resulting primarily from improved volumes. In Chemical Intermediates, base business volumes increased 8%, led by polyurethane intermediates (PUI) and higher amines, due to stronger PUI demand, as well as a better market for her-bicides. Base business Performance Materials volumes were down 1%, principally due to performance polymers.
Chemicals Operating IncomeOperating income of $67.1 decreased $105.4. Operating income included a net expense of $58.1 for global cost reduction plans as compared to 2002, which included a net expense of $2.7 for global cost reduction plans. Operating income declined $55 from higher raw material and energy costs and $27 from other costs, including pension and SAP implementation expense and operating costs. This decline in operating income was partially offset by favorable currency effects of $24 and a favorable volume impact of $7.
Chemicals Equity Affi liates’ IncomeChemicals equity affi liates’ income decreased $.9. Chemicals equity affi liates’ income consists primarily of a global poly-mers joint venture.

24 Management’s Discussion and Analysis continued
2005 OutlookIn Performance Materials, the company anticipates higher volumes driven by economic growth and the increased sale of new products across the portfolio. In Chemical Intermediates, volumes are expected to expand in 2005 in line with the assumed U.S. manufacturing growth range of 3% to 6% and a normal agricultural cycle. The company intends to complete the divestiture of its European methyl-amines and derivatives business during the fi rst quarter.
The company faces challenges in its Chemicals business. While some businesses are delivering returns at or above their cost of capital, other businesses are not generating suffi cient returns. Higher raw material costs in these busi-nesses are reducing margins. In emulsions, the company has been aggressively raising prices, and margins have started to improve. The company plans to continue to aggressively raise prices. In higher amines, raw material costs increased signifi cantly over the last six months of 2004. The company plans to continue to raise prices here as well. And in methyl-amines, the startup of a long-term purchased methanol supply arrangement should materially reduce raw mate-rial costs going forward. This is expected to signifi cantly improve methylamines margins. For all of 2005, our goal is for returns in the Chemicals segment to exceed its cost of capital.
A long-term supplier of sulfuric acid, used in the production of dinitrotoluene (DNT), emerged from Chapter 11 bank-ruptcy protection in June 2003. To facilitate the supplier’s ability to emerge from bankruptcy and to continue sup-plying product, the company agreed to participate in the supplier’s fi nancing and has continued to provide additional fi nancing. Total loans to the supplier at 30 September 2004 were $55.3. If the supplier does not continue to operate, the sales and profi tability of the Chemicals segment could be materially impacted on an annual basis because of the com-pany’s inability to supply all of its customers’ base require-ments. The company does not expect a material loss related to this supplier.
Equipment 2004 2003 2002
Sales $360.7 $267.8 $275.6
Operating income 10.8 4.2 20.7
2004 vs. 2003 Sales of $360.7 increased $92.9, primarily from higher air separation plant sales. Currency effects improved sales by 1%, due primarily to the weakening of the U.S. dollar against the Pound Sterling.
Operating income of $10.8 increased $6.6 from 2003, which included a $2.4 net expense for global cost reduction plan charges. Operating income increased from air separa-tion plant sales and profi tability across other product lines.
The sales backlog for the equipment segment at 30 Sep-tember 2004 was $297 compared to $259 at 30 September 2003. It is expected that approximately $220 of the backlog will be completed during 2005.
2003 vs. 2002Sales decreased $7.8, while operating income decreased $16.5. The 2003 results included a net expense of $2.4 for global cost reduction plans. Operating income declined due to lower helium container sales, lower LNG activity and lower margins in non-LNG product lines. Sales backlog for the Equipment segment increased to $259 at 30 September 2003, compared to $114.
2005 OutlookThe company’s outlook for the Equipment segment is for signifi cantly higher operating income in 2005. This forecast is based on an improved order backlog, having received four orders in 2004 for a total of fi ve LNG main cryogenic heat exchangers.
All OtherAll other comprises corporate expenses and income not allocated to the segments, primarily corporate research and development expense.
2004 2003 2002
Operating loss $(47.7) $(51.6) $(32.3)
Equity affiliates’ income — 15.1 —
2004 vs. 2003The operating loss of $47.7 decreased $3.9. No individual items created a material variance in the comparison to the prior year.
Equity affi liates’ income of $15.1 in 2003 represented favor-able adjustments to customary post-sale liabilities for a divested business not associated with any of the company’s current segments.
2003 vs. 2002Operating loss increased $19.3. This increase refl ected expenses associated with the Honeywell litigation in 2003 and favorable adjustments recorded in 2002 related to a divested business and insurance settlements.

25
Pension BenefitsThe company and certain of its subsidiaries sponsor defi ned benefi t plans that cover a substantial portion of its world-wide employees. Pension benefi ts earned are generally based on years of service and compensation during active employ-ment. Assets under the company’s defi ned benefi t plans consist primarily of equity and fi xed-income securities. The amounts recognized in the consolidated fi nancial statements for pension benefi ts are determined on an actuarial basis uti-lizing numerous assumptions.
For 2004, the fair market value of pension plan assets for the company’s defi ned benefi t plans as of their valuation date increased to $1,510.9 from $1,147.5 in 2003. The accumu-lated benefi t obligation for these plans as of their measure-ment date was $1,961.5 and $1,815.8 for 2004 and 2003, respectively.
Approximately 66% of the total company defi ned benefi t pension plan assets were held in the U.S. plans at the end of 2004, while the assets of the U.K. pension plans represented 27%. The actual allocation of total plan assets at the end of 2004 was 68% in equity securities, 27% in debt securities, 4% in real estate and 1% in other investments. This alloca-tion was in line with the targeted allocations.
Pension FundingPension funding includes both contributions to funded plans and benefi t payments under unfunded plans. With respect to funded plans, the company’s funding policy is that con-tributions, combined with appreciation and earnings, will be suffi cient to pay benefi ts without creating unnecessary surpluses. In addition, the company makes contributions to satisfy all legal funding requirements while managing its capacity to benefi t from tax deductions attributable to plan contributions. External actuarial fi rms analyze the liabilities and demographics of each plan, which helps guide the level of contributions. During 2004 and 2003, the company contributed $277.0 and $61.6, respectively, to the pension plans.
2005 OutlookCash contributions are estimated to be approximately $80 in 2005. Actual future contributions will depend on future funding legislation, discount rates, investment perfor-mance, plan design and various other factors. Refer to the Contractual Obligations discussion on page 30 for a projec-tion of future contributions.
Significant AssumptionsThe company accounts for pension benefi ts using the accrual method, consistent with the requirements of SFAS No. 87, “Employers’ Accounting for Pensions.” Actuarial models are used in calculating the pension expense and liability related to the various plans. These models have an underly-ing assumption that the employees render service over their service lives on a relatively consistent basis; therefore, the expense of benefi ts earned should follow a similar pattern.
Several assumptions and statistical variables are used in the models to calculate the expense and liability related to the plans. The company, in consultation with its actuaries, deter-mines assumptions about the discount rate, the expected rate of return on plan assets and the rate of compensation increase. Note 18 to the consolidated fi nancial statements includes disclosure of these rates on a weighted average basis, encompassing both the domestic and international plans. The actuarial models also use assumptions on demographic factors such as retirement, mortality and turnover rates. The company believes the actuarial assumptions are reasonable. However, these actuarial assumptions could vary materially from actual results due to economic events and different rates of retirement, mortality and turnover.
One of the critical assumptions used in the actuarial models is the discount rate. This rate is determined at the annual measurement date for each of the various plans and is therefore subject to change each year. The rate refl ects the prevailing market rate for high-quality fi xed-income debt instruments with maturities corresponding to the expected duration of the benefi t obligations on the measurement date. The rate is used to discount the future cash fl ows of benefi t obligations back to the measurement date. A lower discount rate increases the present value of the benefi t obligations and results in higher pension expense. A 50 basis point decrease in the discount rate increases pension expense by approxi-mately $20 per year.
The expected rate of return on plan assets represents the average rate of return to be earned by plan assets over the period that the benefi ts included in the benefi t obligation are to be paid. Lower returns on the plan assets result in higher pension expense. The company uses historic market return trends combined with current market conditions for each asset category to develop this rate of return. The weighted average actual compound rate of return earned on plan assets for the last ten years was 9.5%. For the last 20 years the actual rate was 11.1%. A 50 basis point decrease in the esti-mated rate of return on plan assets increases pension expense by approximately $7 per year.
26 Management’s Discussion and Analysis continued
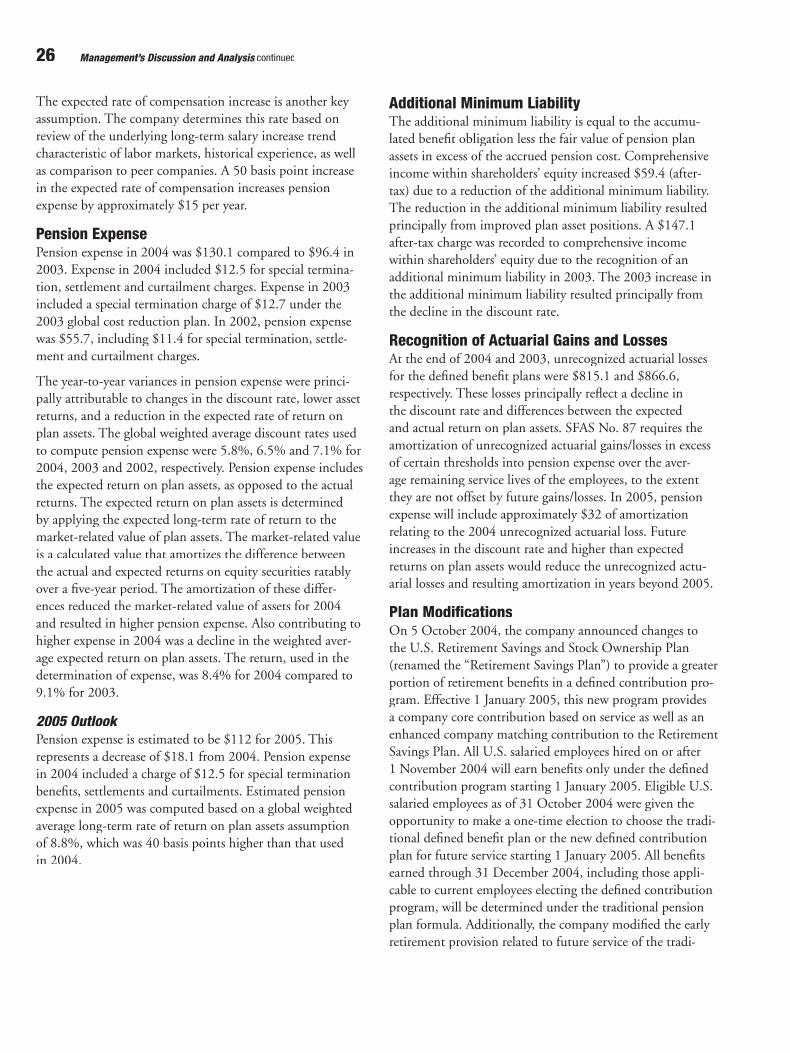
The expected rate of compensation increase is another key assumption. The company determines this rate based on review of the underlying long-term salary increase trend characteristic of labor markets, historical experience, as well as comparison to peer companies. A 50 basis point increase in the expected rate of compensation increases pension expense by approximately $15 per year.
Pension Expense Pension expense in 2004 was $130.1 compared to $96.4 in 2003. Expense in 2004 included $12.5 for special termina-tion, settlement and curtailment charges. Expense in 2003 included a special termination charge of $12.7 under the 2003 global cost reduction plan. In 2002, pension expense was $55.7, including $11.4 for special termination, settle-ment and curtailment charges.
The year-to-year variances in pension expense were princi-pally attributable to changes in the discount rate, lower asset returns, and a reduction in the expected rate of return on plan assets. The global weighted average discount rates used to compute pension expense were 5.8%, 6.5% and 7.1% for 2004, 2003 and 2002, respectively. Pension expense includes the expected return on plan assets, as opposed to the actual returns. The expected return on plan assets is determined by applying the expected long-term rate of return to the market-related value of plan assets. The market-related value is a calculated value that amortizes the difference between the actual and expected returns on equity securities ratably over a fi ve-year period. The amortization of these differ-ences reduced the market-related value of assets for 2004 and resulted in higher pension expense. Also contributing to higher expense in 2004 was a decline in the weighted aver-age expected return on plan assets. The return, used in the determination of expense, was 8.4% for 2004 compared to 9.1% for 2003.
2005 OutlookPension expense is estimated to be $112 for 2005. This represents a decrease of $18.1 from 2004. Pension expense in 2004 included a charge of $12.5 for special termination benefi ts, settlements and curtailments. Estimated pension expense in 2005 was computed based on a global weighted average long-term rate of return on plan assets assumption of 8.8%, which was 40 basis points higher than that used in 2004.
Additional Minimum LiabilityThe additional minimum liability is equal to the accumu-lated benefi t obligation less the fair value of pension plan assets in excess of the accrued pension cost. Comprehensive income within shareholders’ equity increased $59.4 (after-tax) due to a reduction of the additional minimum liability. The reduction in the additional minimum liability resulted principally from improved plan asset positions. A $147.1 after-tax charge was recorded to comprehensive income within shareholders’ equity due to the recognition of an additional minimum liability in 2003. The 2003 increase in the additional minimum liability resulted principally from the decline in the discount rate.
Recognition of Actuarial Gains and LossesAt the end of 2004 and 2003, unrecognized actuarial losses for the defi ned benefi t plans were $815.1 and $866.6, respectively. These losses principally refl ect a decline in the discount rate and differences between the expected and actual return on plan assets. SFAS No. 87 requires the amortization of unrecognized actuarial gains/losses in excess of certain thresholds into pension expense over the aver-age remaining service lives of the employees, to the extent they are not offset by future gains/losses. In 2005, pension expense will include approximately $32 of amortization relating to the 2004 unrecognized actuarial loss. Future increases in the discount rate and higher than expected returns on plan assets would reduce the unrecognized actu-arial losses and resulting amortization in years beyond 2005.
Plan ModificationsOn 5 October 2004, the company announced changes to the U.S. Retirement Savings and Stock Ownership Plan (renamed the “Retirement Savings Plan”) to provide a greater portion of retirement benefi ts in a defi ned contribution pro-gram. Effective 1 January 2005, this new program provides a company core contribution based on service as well as an enhanced company matching contribution to the Retirement Savings Plan. All U.S. salaried employees hired on or after 1 November 2004 will earn benefi ts only under the defi ned contribution program starting 1 January 2005. Eligible U.S. salaried employees as of 31 October 2004 were given the opportunity to make a one-time election to choose the tradi-tional defi ned benefi t plan or the new defi ned contribution plan for future service starting 1 January 2005. All benefi ts earned through 31 December 2004, including those appli-cable to current employees electing the defi ned contribution program, will be determined under the traditional pension plan formula. Additionally, the company modifi ed the early retirement provision related to future service of the tradi-
27
tional pension plan. In the near term, the retirement pro-gram changes are not anticipated to have a material impact on retirement program cost levels or funding. However, the new defi ned contribution plan is expected to reduce long-term expense and contribution volatility.
The U.K. defi ned benefi t plan is closed to all new hires effec-tive 1 January 2005. Eligible U.K. employees hired on or after 1 January 2005 will receive retirement benefi ts exclu-sively under a new defi ned contribution plan.
Stock-Based CompensationThe company applies Accounting Principles Board (APB) Opinion No. 25, “Accounting for Stock Issued to Employees,” in accounting for its stock option plans. Accordingly, no compensation expense has been recognized. If the company recognized compensation expense in accor-dance with SFAS No. 123, “Accounting for Stock-Based Compensation,” net income would have been reduced by $30.6, $37.9 and $40.9 in years 2004, 2003 and 2002, respectively. See Note 1 and Note 15 to the consolidated fi nancial statements for further information.
In March 2004, the FASB issued an exposure draft on share-based compensation which would require companies to expense the fair value of employee stock options starting in 2005. The company intends to continue applying its current accounting methodology until a fi nal accounting standard for stock options is issued.
Environmental Matters The company is subject to various environmental laws and regulations in the United States of America and foreign countries where it has operations. Compliance with these laws and regulations results in higher capital expenditures and costs. Additionally, from time to time, the company is involved in proceedings under the Comprehensive Environmental Response, Compensation and Liability Act (the federal Superfund law), similar state laws and the Resource Conservation and Recovery Act (RCRA) relating to the designation of certain sites for investigation and possible cleanup. The company’s accounting policies for environmen-tal expenditures are discussed in Note 1 to the consolidated fi nancial statements.
The amounts charged to earnings on an after-tax basis related to environmental matters totaled $31.8, $29.6 and $24.4 for 2004, 2003 and 2002, respectively. These amounts represent an estimate of expenses for compliance with
environmental laws, as well as remedial activities, and costs incurred to meet internal company standards. Such costs are estimated to be $32 and $33 in 2005 and 2006, respectively.
Although precise amounts are diffi cult to defi ne, the com-pany estimates that in 2004 it spent approximately $18 on capital projects to control pollution versus $16 in 2003. Capital expenditures to control pollution in future years are estimated at $15 in 2005 and $17 in 2006.
It is the company’s policy to accrue environmental investiga-tory, external legal costs and noncapital remediation costs for identifi ed sites when it is probable that a liability has been incurred and the amount of loss can be reasonably estimated. The potential exposure for such costs is estimated to range from $9 to a reasonably possible upper exposure of $19. The balance sheet at 30 September 2004 and 2003 included an accrual of $14.3 and $15.3, respectively.
Actual costs to be incurred at identifi ed sites in future peri-ods may vary from the estimates, given inherent uncertain-ties in evaluating environmental exposures. Subject to the imprecision in estimating future environmental costs, the company does not expect that any sum it may have to pay in connection with environmental matters in excess of the amounts recorded or disclosed above would have a materially adverse effect on its fi nancial condition or results of opera-tions in any one year.
Liquidity and Capital ResourcesThe company maintained a solid fi nancial position through-out 2004. Capital requirements were satisfi ed with cash from operations. The company is currently rated A/A2 (long-term) and A-1/P-1 (commercial paper), respectively, by Standard & Poor’s and Moody’s.
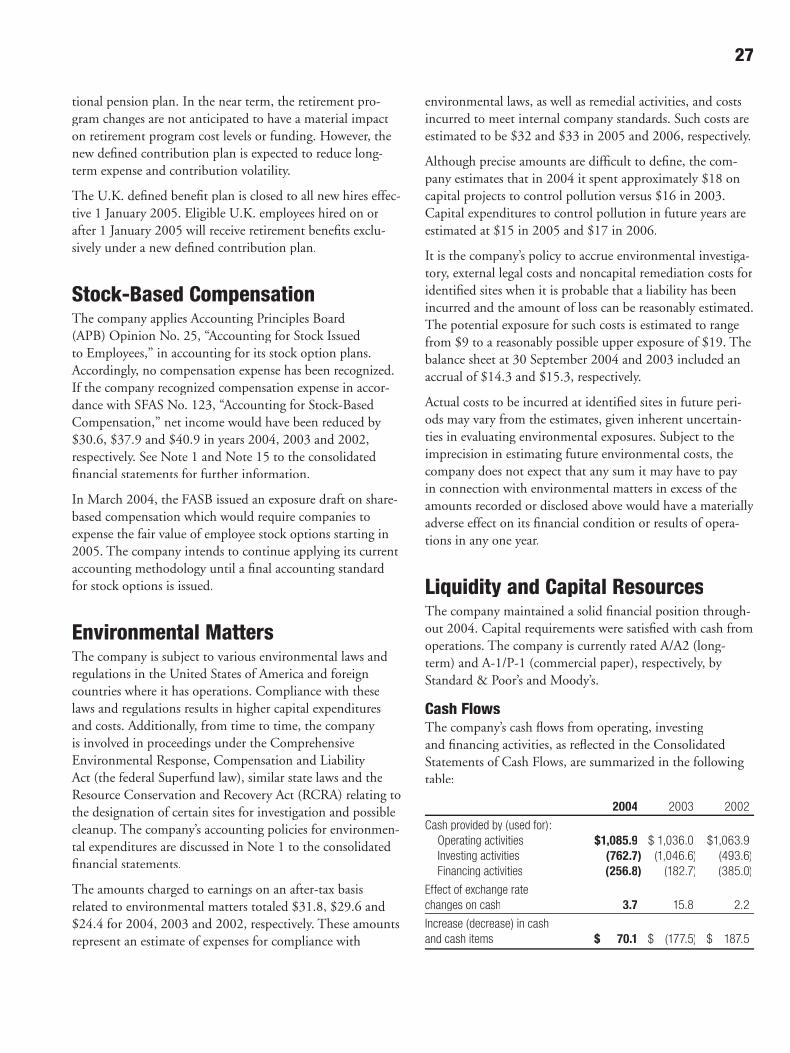
Cash FlowsThe company’s cash fl ows from operating, investing and fi nancing activities, as refl ected in the Consolidated Statements of Cash Flows, are summarized in the following table:
2004 2003 2002
Cash provided by (used for): Operating activities $1,085.9 $ 1,036.0 $1,063.9
Investing activities (762.7) (1,046.6) (493.6) Financing activities (256.8) (182.7) (385.0)
Effect of exchange rate changes on cash 3.7 15.8 2.2
Increase (decrease) in cash and cash items $ 70.1 $ (177.5) $ 187.5

28 Management’s Discussion and Analysis continued
Operating Activities2004 vs. 2003Net cash provided by operating activities increased $49.9, or 4.8%. Before working capital changes, the contribution of net income adjusted for noncash items to cash provided by operating activities increased $209.4. Net income improved by $206.8. The primary noncash adjustment favorably con-tributing to the change in cash provided by operating activi-ties was depreciation and amortization expense. Depreciation and amortization expense increased $60.1, principally due to acquisitions and currency effects from a weaker U.S. dollar. These favorable impacts were partially offset by a decrease in the impairment of long-lived assets due to the 2003 global cost reduction plan and lower dividend payments from equity affi liates. The increase in trade receivables of $165.0 was primarily due to increased sales volumes.
2003 vs. 2002Net cash provided by operating activities decreased $27.9, or 3%. Before working capital changes, the contribution of net income adjusted for noncash items to cash provided by operating activities was up $51.5. Net income decreased by $128.1. Noncash adjustments favorably contributing to the change in cash provided by operating activities included increased depreciation and amortization expense, the larger impairment of long-lived assets in 2003 and a reduced gain on the sale of assets and investments. The increase in depreciation and amortization expense of $63.7 was due principally to currency effects from a weaker U.S. dollar and acquisitions. The expenses for the impairment of long-lived assets increased $88.0, principally due to the 2003 global cost reduction plan. The gain on the sale of assets and investments was higher in 2002 by $58.1, principally due to the gain on sale of the U.S. packaged gas business in 2002. Additionally, cash provided by operating activities in 2003 benefi ted from higher dividend payments from equity affi liates. These favorable impacts were more than offset by deferred income taxes and an increased use of cash for work-ing capital in 2003. The $38.4 unfavorable impact from deferred income taxes resulted primarily from higher foreign tax benefi ts. The increase in accounts receivable was primar-ily due to the impact of natural gas cost contractually passed through to customers. Inventories increased as a result of higher energy and raw material costs. Payables and accrued liabilities increased, primarily due to expenses for the 2003 global cost reduction plan.
Investing Activities2004 vs. 2003In 2004, cash used for investing activities decreased by $283.9, due to lower acquisitions, partially offset by higher additions to plant and equipment and lower proceeds from the sale of assets and investments. Acquisitions in 2004, totaling $84.6, principally included six small U.S. homecare businesses. Acquisitions in 2003, totaling $529.6, included Ashland’s Electronic Chemicals business for $293.2 in August 2003, American Homecare Supply (AHS) for $165.8 in October 2002, additional small homecare businesses, and Sanwa. Proceeds from the sale of assets and investments declined $55.9. The company sold its Canadian packaged gas business in 2003 for proceeds of $41.2.
2003 vs. 2002In 2003, cash used for investing activities increased by $553.0, due principally to acquisitions and lower proceeds from the sale of assets and investments. Acquisitions in 2003 totaled $529.6. Acquisitions in 2002, totaling $114.8, included the purchase of an additional 22% of the outstand-ing shares of San Fu, raising the company’s ownership inter-est to 70%. Proceeds from the sale of assets and investments declined $190.8 from the prior year. In 2002, the company sold the majority of its U.S. packaged gas business for pro-ceeds of $254.5.
Capital ExpendituresPrimarily as a result of lower acquisitions, capital expen-ditures in 2004 totaled $815.5, compared to $1,170.9 in 2003. As in 2003, additions to plant and equipment in 2004 were largely in support of the worldwide Gases busi-ness. Major additions to plant and equipment included spending on EPI North America hydrogen tonnage plants and Asian facilities within the Gases electronics and liquid bulk businesses. Additions to plant and equipment also included support capital of a routine ongoing nature, includ-ing expenditures for distribution equipment and facility improvements.

29
Capital expenditures are detailed in the following table:
2004 2003 2002
Additions to plant and equipment $705.5 $ 612.9 $ 627.6
Acquisitions, less cash acquired 84.6 529.6 114.8
Investments in and advances to unconsolidated affiliates 18.8 6.1 39.2
Long-term debt assumed in acquisitions — 5.2 20.1
Capital leases 6.6 17.1 3.9
$815.5 $1,170.9 $805.6
2005 OutlookCapital expenditures for new plant and equipment in 2005 are expected to be between $850 and $900. The increase in expenditures in 2005 is driven primarily by the growing hydrogen market where the company has the opportunity to expand its franchise positions. In addition, the company intends to continue to evaluate acquisition opportunities and investments in affi liated entities. The company expects to spend between $75 and $100 on homecare acquisitions. It is anticipated that capital expenditures will be funded with cash from operations.
Financing Activities2004 vs. 2003Cash used for fi nancing activities increased $74.1 in 2004. The increase is due to higher debt repayments of $236.8 and dividends to shareholders of $30.3, partially offset by higher long-term debt proceeds of $123.5 and an increase in cash proceeds from stock option exercises of $69.5. Long-term borrowings consisted mainly of a $125.0 seven-year, fi xed-rate borrowing with a coupon rate of 4.125% and an addi-tional $98.7 of Eurobonds as discussed under Financing and Capital Structure below.
2003 vs. 2002Cash used for fi nancing activities declined $202.3 in 2003, primarily due to a $37.6 increase in short-term borrowings in 2003 versus a $170.9 reduction in 2002. Higher pay-ments on long-term debt in 2003 were partially funded by increased long-term debt proceeds.
Financing and Capital Structure Capital needs in 2004 were satisfi ed with cash from opera-tions. At the end of 2004, total debt outstanding was $2.4 billion compared to $2.5 billion, as long- and short-term debt repayments exceeded new debt proceeds by
$183.9. The impact of this debt repayment was partially offset by the impact of the weaker U.S. dollar on the transla-tion of foreign currency debt. Total debt at 30 September 2004 and 2003 expressed as a percentage of the sum of total debt, shareholders’ equity and minority interest was 34.2% and 38.7%, respectively.
Long-term debt fi nancings in 2004 totaled $286.3. This was composed primarily of fi xed- and fl oating-rate U.S. dollar borrowings and fi xed-rate Euro borrowings with terms rang-ing from seven to thirty-fi ve years.
There was no commercial paper outstanding at 30 Sep-tember 2004. Substantial credit facilities are maintained to provide backup funding for commercial paper and to ensure availability of adequate sources of liquidity. During the fi rst quarter of 2004, the company replaced its $600 committed credit facility with a new $700 multicurrency committed revolving credit facility, maturing in December 2008. No borrowings were outstanding under these commitments at the end of 2004.
Additional commitments of $49.6 are maintained by the company’s foreign subsidiaries, of which $8.7 was borrowed and outstanding at 30 September 2004.
On 9 January 2004, the company fi led a Form S-3 Registration Statement with the U.S. Securities and Ex-change Commission, which became effective on 26 January 2004. The shelf registration enables the company to issue up to $1 billion of debt and equity securities. The primary use is for general corporate purposes.
On 8 April 2004, the company exchanged Euro 209.3 ($252.9) of 6% Eurobonds maturing on 30 March 2005 for an issuance of Euro 218.3 ($263.9) of 4.25% Eurobonds maturing 10 April 2012. An additional Euro 81.7 ($98.7) of 4.25% Eurobonds maturing 10 April 2012 were issued for cash, which funded the repayment of outstanding commer-cial paper.
DividendsThe Board of Directors in May 2004 increased the quarterly cash dividend 26%, from 23 cents per share to 29 cents per share. Dividends are declared by the Board of Directors and are usually paid during the sixth week after the close of the fi scal quarter.

30 Management’s Discussion and Analysis continued
Contractual ObligationsThe company is obligated to make future payments under various contracts such as debt agreements, lease agreements, un-conditional purchase obligations and other long-term obligations. The following table summarizes these contractual obliga-tions of the company as of 30 September 2004.
Payments Due By PeriodTotal 2005 2006 2007 2008 2009 Thereafter
Long-term debt obligations
Debt maturities $2,310 $ 564 $176 $514 $ 115 $ 20 $ 921
Contractual interest 522 98 78 66 40 37 203
Capital leases 50 28 7 4 2 1 8
Operating leases 229 56 45 23 17 13 75
Pension obligations 454 80 60 150 130 34 —
Unconditional purchase obligations 1,023 323 64 60 59 58 459
Total Contractual Obligations $4,588 $1,149 $430 $817 $363 $163 $1,666
Long-Term Debt ObligationsThe long-term debt obligations include the maturity pay-ments of long-term debt, including current portion, and the related contractual interest obligations. Refer to Note 12 to the consolidated fi nancial statements for additional informa-tion on long-term debt.
Contractual interest is the interest the company is contracted to pay on the long-term debt obligations without taking into account the interest impact of interest rate swaps related to any of this debt, which at current interest rates would reduce contractual interest. The company had $487 of long-term debt subject to variable interest rates at 30 September 2004, excluding fi xed-rate debt that has been swapped to variable-rate debt. The rate assumed for the variable interest component of the contractual interest obligation was the rate in effect at 30 September 2004. Variable interest rates are primarily determined by inter-bank offer rates and by U.S. short-term tax-exempt interest rates.
Leases Refer to Note 13 to the consolidated fi nancial statements for additional information on capital and operating leases.
Pension ObligationsThe company and certain of its subsidiaries sponsor defi ned benefi t plans that cover a substantial portion of its world-wide employees. The company’s funding policy is that con-tributions, combined with appreciation and earnings, will be suffi cient to pay benefi ts without creating unnecessary surpluses. In addition, the company makes contributions to satisfy all legal funding requirements while managing its capacity to benefi t from tax deductions attributable to plan contributions. The amounts in the table represent the cur-rent estimated cash payments to be made by the company in
the periods indicated, which are signifi cantly higher than the minimum required contributions.
The total accrued liability for pension benefi ts is impacted by interest rates, plan demographics, actual return on plan assets, continuation or modifi cation of benefi ts, and other factors. Such factors can signifi cantly impact the amount of the liability and related contributions.
Unconditional Purchase ObligationsMost of the company’s long-term unconditional purchase obligations relate to feedstock supply for numerous HyCO (hydrogen, carbon monoxide and syngas) facilities. The price of feedstock supply is principally related to the price of natural gas. However, long-term take-or-pay sales contracts to HyCO customers are generally matched to the term of the feedstock supply obligations and provide recovery of price increases in the feedstock supply. Due to the matching of most feedstock supply obligations to customer sales con-tracts, the company does not believe these purchase obliga-tions would have a material effect on its fi nancial condition or results of operations.
Natural gas supply purchase obligations that are not feed-stock supply contracts to HyCO facilities are principally short-term commitments at market prices.
The above unconditional purchase obligations also include the fi xed demand charge for electric power under numer-ous supply contracts. A fi xed demand charge is generally included in electric power supply agreement pricing and is generally reset at least annually; therefore, the fi xed obliga-tion is principally included in 2005. A portion of the power supply requirement relates to long-term take-or-pay sales contracts to industrial gas customers, which provide for recovery of power costs.

31
Purchase commitments to spend approximately $208 for additional plant and equipment are included in the uncon-ditional purchase obligations. Total capital expenditures for plant and equipment in 2005 are expected to be between $850 and $900.
The company also purchases materials, energy, capital equip-ment, supplies and services as part of the ordinary course of business under arrangements which are not unconditional purchase obligations. The majority of such purchases are for raw materials and energy, which are obtained under require-ments-type contracts at market prices. In total, purchases by the company exceed $3 billion annually, including the unconditional purchase obligations in the table.
Deferred Income Tax LiabilityNoncurrent deferred income tax liabilities as of 30 Sep-tember 2004 were $788.0. Refer to Note 17 to the con-solidated fi nancial statements. Deferred tax liabilities are calculated based on temporary differences between the fi nancial reporting and tax bases of assets and liabilities using enacted tax rates. This amount is not included in the Contractual Obligations table because this presentation would not be meaningful. These liabilities do not have any connection with the amount of cash taxes to be paid in any future periods and do not relate to liquidity needs.
Off-Balance Sheet ArrangementsThe company has entered into certain guarantee agreements and an arrangement involving the sale and leaseback of U.S. cryogenic vessel equipment. The company’s guarantee agree-ments are discussed in Note 19 to the consolidated fi nancial statements. Information on the sale and leaseback of U.S. cryogenic vessel equipment is also contained in Note 13 to the consolidated fi nancial statements. The company has not entered into any agreements under which it has an obliga-tion arising out of a variable interest entity. The company does not have any derivative instruments indexed to its own stock. The company’s off-balance sheet arrangements are not reasonably likely to have a material impact on fi nancial con-dition, changes in fi nancial condition, results of operations, or liquidity.
Related Party TransactionsThe company’s principal related parties are equity affi liates operating in industrial gas and chemicals businesses. The company did not engage in any material transactions involv-
ing related parties that included terms or other aspects that differ from those which would be negotiated at arm’s length with clearly independent parties.
Market Risks and Sensitivity AnalysisThe company’s earnings, cash fl ows and fi nancial position are exposed to market risks relating to fl uctuations in interest rates and foreign currency exchange rates. It is the policy of the company to minimize its cash fl ow exposure to adverse changes in currency and exchange rates and to manage the fi nancial risks inherent in funding with debt capital.
The company addresses these fi nancial exposures through a controlled program of risk management that includes the use of derivative fi nancial instruments. Counterparties to all derivative contracts are major fi nancial institutions, thereby minimizing the risk of credit loss. All instruments are entered into for other than trading purposes. The utilization of these instruments is described more fully in Note 6 to the consolidated fi nancial statements. The major accounting policies for these instruments are described in Note 1 to the consolidated fi nancial statements.
The company’s derivative and other fi nancial instruments consist of long-term debt (including current portion), inter-est rate swaps, cross currency interest rate swaps, foreign exchange-forward contracts and foreign exchange-option contracts. The net market value of these fi nancial instru-ments combined is referred to below as the net fi nancial instrument position. The net fi nancial instrument position does not include other investments of $79.3 at 30 September 2004 and $63.4 at 30 September 2003 as disclosed in Note 6 to the consolidated fi nancial statements. These amounts primarily represent an investment in a publicly traded foreign company accounted for by the cost method. The company assessed the materiality of the market risk exposure on these other investments and determined this exposure to be immaterial.
At 30 September 2004 and 2003, the net fi nancial instru-ment position was a liability of $2,531.4 and $2,542.1, respectively. The decrease in the net fi nancial instrument position was due primarily to a reduction in long-term debt and the impact of higher U.S. dollar interest rates on the market value of fi xed-rate debt, largely offset by the impact of a weaker U.S. dollar on the translation of foreign currency debt and the market value of foreign exchange-forward contracts.
32 Management’s Discussion and Analysis continued
The analysis below presents the sensitivity of the market value of the company’s fi nancial instruments to selected changes in market rates and prices. The range of changes chosen refl ects the company’s view of changes which are reasonably possible over a one-year period. Market values are the present value of projected future cash fl ows based on the market rates and prices chosen. The market values for interest rate risk and foreign currency risk are calculated by the company using a third-party software model that utilizes standard pricing models to determine the present value of the instruments based on market conditions (interest rates, spot and forward exchange rates, and implied volatilities) as of the valuation date.
Interest Rate RiskThe company’s debt portfolio, including swap agreements, as of 30 September 2004, primarily comprised debt denomi-nated in Euros (49%) and U.S. dollars (29%). This debt portfolio is composed of 59% fi xed-rate debt and 41% variable-rate debt. Changes in interest rates have differ-ent impacts on the fi xed- and variable-rate portions of the company’s debt portfolio. A change in interest rates on the fi xed portion of the debt portfolio impacts the net fi nancial instrument position but has no impact on interest incurred or cash fl ows. A change in interest rates on the variable por-tion of the debt portfolio impacts the interest incurred and cash fl ows but does not impact the net fi nancial instrument position.
The sensitivity analysis related to the fi xed portion of the company’s debt portfolio assumes an instantaneous 100 basis point move in interest rates from the levels at 30 September 2004 and 2003, with all other variables (including foreign exchange rates) held constant. A 100 basis point increase in market interest rates would result in a decrease of $40 and $41 in the net liability position of fi nancial instruments at 30 September 2004 and 2003, respectively. A 100 basis point decrease in market interest rates would result in an increase of $43 and $44 in the net liability position of fi nancial instruments at 30 September 2004 and 2003, respectively.
Based on the variable-rate debt included in the company’s debt portfolio, including the interest rate swap agreements, as of 30 September 2004 and 2003, a 100 basis point increase in interest rates would result in an additional $10 and $9 in interest incurred per year at 30 September 2004 and 2003, respectively. A 100 basis point decline would lower interest incurred by $10 and $9 per year at 30 September 2004 and 2003, respectively.
Foreign Currency Exchange Rate RiskThe sensitivity analysis assumes an instantaneous 10% change in the foreign currency exchange rates from their levels at 30 September 2004 and 2003, with all other variables (including interest rates) held constant. A 10% strengthening of the functional currency of an entity versus all other currencies would result in a decrease of $199 and $223 in the net liability position of fi nancial instruments at 30 September 2004 and 2003, respectively. A 10% weaken-ing of the functional currency of an entity versus all other currencies would result in an increase of $197 and $217 in the net liability position of fi nancial instruments at 30 September 2004 and 2003, respectively.
The primary currencies for which the company has exchange rate exposure are the U.S. dollar versus the Euro, the U.S. dollar versus the U.K. Pound Sterling, the U.S. dollar versus the Canadian dollar and the Euro versus the U.K. Pound Sterling. Foreign currency debt, cross currency interest rate swaps and foreign exchange-forward contracts are used in countries where the company does business, thereby reduc-ing its net asset exposure. Foreign exchange-forward con-tracts also are used to hedge the company’s fi rm and highly anticipated foreign currency cash fl ows, along with foreign exchange-option contracts. Thus, there is either an asset or cash fl ow exposure related to all of the fi nancial instruments in the above sensitivity analysis for which the impact of a movement in exchange rates would be in the opposite direc-tion and materially equal (or more favorable in the case of purchased foreign exchange-option contracts) to the impact on the instruments in the analysis.
InflationThe fi nancial statements are presented in accordance with accounting principles generally accepted in the United States of America and do not fully refl ect the impact of prior years’ infl ation. While the U.S. infl ation rate has been modest for several years, the company operates in many countries with both infl ation and currency issues. The ability to pass on infl ationary cost increases is an uncertainty due to gen-eral economic conditions and competitive situations. It is estimated that the cost of replacing the company’s plant and equipment today is greater than its historical cost. Accordingly, depreciation expense would be greater if the expense were stated on a current cost basis.

33
Critical Accounting Policies and EstimatesManagement’s Discussion and Analysis of the company’s fi nancial condition and results of operations is based on the consolidated fi nancial statements and accompanying notes that have been prepared in accordance with accounting prin-ciples generally accepted in the United States of America. The preparation of these fi nancial statements requires man-agement to make estimates and assumptions that affect the reported amounts of assets and liabilities and disclosure of contingent assets and liabilities at the date of the fi nan-cial statements and the reported amounts of revenues and expenses during the reporting period. Actual results could differ from those estimates.
Note 1 to the consolidated fi nancial statements describes the company’s major accounting policies. Judgments and estimates of uncertainties are required in applying the com-pany’s accounting policies in many areas. The following are areas requiring signifi cant judgments and estimates: depre-ciable lives of plant and equipment, cash fl ow and valuation assumptions in performing impairment tests of long-lived assets and estimated costs to be incurred for environmental liabilities, income taxes and pension benefi ts.
Application of the critical accounting policies discussed below requires management’s signifi cant judgments, often as the result of the need to make estimates of matters that are inherently uncertain. If actual results were to differ materi-ally from the estimates made, the reported results could be materially affected. However, the company is not currently aware of any reasonably likely events or circumstances that would result in materially different results.
The company’s senior management has reviewed these criti-cal accounting policies and estimates and the Management’s Discussion and Analysis regarding them with its audit committee.
Information concerning the company’s implementation and impact of new accounting standards issued by the Financial Accounting Standards Board (FASB) is discussed in Note 2. Otherwise, the company did not adopt an accounting policy in the past three years that had a material impact on the company’s fi nancial condition, change in fi nancial condition or results of operations.
Depreciable Lives of Plant and EquipmentPlant and equipment is recorded at cost and depreci-ated using the straight-line method, which deducts equal amounts of cost of each asset from earnings every year over its estimated economic useful life. Net plant and equipment at 30 September 2004 totaled $5,702.2, representing 57% of total assets. Depreciation expense during 2004 totaled $696.0, representing 11% of total costs and expenses. Given the signifi cance of plant and equipment and associ-ated depreciation to the company’s fi nancial statements, the determination of an asset’s economic useful life is considered to be a critical accounting estimate. The estimate is criti-cal for the company’s Gases and Chemicals segments, both capital-intensive businesses in which the company owns and operates plant and equipment.
Economic useful life is the duration of time the asset is expected to be productively employed by the company, which may be less than its physical life. Management’s assumptions on the following factors, among others, affect the determination of estimated economic useful life: wear and tear, obsolescence, technical standards, contract life, changes in market demand and raw material availability. The company makes estimates and assumptions regarding its competitive position in various end markets and geographic locations.
The estimated economic useful life of an asset is moni-tored to determine its appropriateness, especially in light of changed business circumstances. For example, changes in technological advances, changes in the estimated future demand for products, or excessive wear and tear may result in a shorter estimated useful life than originally anticipated. In these cases, the company would depreciate the remain-ing net book value over the new estimated remaining life, thereby increasing depreciation expense per year on a prospective basis. Likewise, if the estimated useful life is increased, the adjustment to the useful life decreases depre-ciation expense per year on a prospective basis. Over the past three years, changes in economic useful life assumptions have not had a material impact on the company’s reported results.
The company has numerous long-term customer supply contracts, particularly in the gases on-site business. These contracts principally have initial contract terms of 15 to 20 years. Depreciable lives of the production assets related to long-term contracts are matched to the contract lives. Extensions to the contract term of supply frequently occur prior to the expiration of the initial term. As contract terms are extended, the depreciable life of the remaining net book value of the production assets is adjusted to match the new contract term.
34 Management’s Discussion and Analysis continued
The depreciable lives of merchant gas production facilities are principally 15 years. Major chemical production facili-ties are also generally depreciated over 15 years. The terms of customer contracts associated with products produced at these types of facilities typically have a much shorter term. Management has determined a 15-year life to be appropri-ate based on historical experience combined with its judg-ment on future assumptions such as technological advances, potential for obsolescence, competitors’ actions, etc. Management monitors its assumptions and may potentially need to adjust depreciable life as circumstances change. A change in the depreciable life for all merchant chemical and gas facilities by one year would impact annual depreciation expense by approximately $20.
Impairment of Long-Lived Assets Plant and EquipmentNet plant and equipment at 30 September 2004 totaled $5,702.2. Plant and equipment held for use is grouped for impairment testing at the lowest level for which there are identifi able cash fl ows. Impairment testing of the asset group occurs whenever events or changes in circumstances indicate that the carrying amount of the assets may not be recoverable. The company assesses recoverability by compar-ing the carrying amount of the asset group to the estimated undiscounted future cash fl ows expected to be generated by the assets. If an asset group is considered impaired, the impairment loss to be recognized would be measured as the amount by which the asset group’s carrying amount exceeds its fair value. Assets to be disposed of by sale are reported at the lower of carrying amount or fair value less cost to sell.
The estimate of plant and equipment fair value is based on estimated discounted future cash fl ows expected to be gener-ated by the asset group. The assumptions underlying cash fl ow projections represent management’s best estimates at the time of the impairment review. Factors that manage-ment must estimate include: industry and market condi-tions, sales volume and prices, costs to produce, infl ation, etc. Changes in key assumptions or actual conditions which differ from estimates could result in an impairment charge. The company uses reasonable and supportable assumptions when performing impairment reviews and cannot predict the occurrence of future events and circumstances that could result in impairment charges. Over the past three years, there have been no impairments of asset groups held for use. As part of the actions taken in the company’s global cost reduc-tion plans, recognized impairments of assets to be sold or abandoned were $90.1 and $3.7 in 2003 and 2002, respec-tively. Refer to the Global Cost Reduction Plans discussion on page 19.
GoodwillThe purchase method of accounting for business combina-tions requires the company to make use of estimates and judgments to allocate the purchase price paid for acquisitions to the fair value of the net tangible and identifi able intan-gible assets. Goodwill represents the excess of the aggregate purchase price over the fair value of net assets of an acquired entity. Goodwill, including goodwill associated with equity affi liates, was $897.4 as of 30 September 2004. The major-ity of the company’s goodwill is assigned to reporting units within the Gases segment. Disclosures related to goodwill are included in Note 10 to the consolidated fi nancial statements.
The company performs an impairment test annually in the fourth quarter of the fi scal year. In addition, goodwill would be tested more frequently if changes in circumstances or the occurrence of events indicated potential impairment exists. The impairment test requires the company to compare the fair value of business reporting units to carrying value including assigned goodwill. The results of the impairment tests have indicated fair value amounts exceeded carrying amounts by a substantial margin.
The company primarily uses the present value of future cash fl ows to determine fair value. The company’s valuation model assumes a fi ve-year growth period for the business and an estimated exit trading multiple. Management judgment is required in the estimation of future operating results and to determine the appropriate exit multiple. The exit multiple is determined from comparable industry transactions. Future operating results and exit multiples could reasonably differ from the estimates. However, given the substantial margin by which fair value exceeded carrying amounts in the latest goodwill impairment review, the company does not antici-pate a material impact on the fi nancial statements from dif-ferences in these assumptions.
Equity InvestmentsInvestments in and advances to equity affi liates totaled $629.8 at 30 September 2004. The majority of the com-pany’s investments are nonpublicly traded ventures with other companies in the industrial gas or chemicals business. Summarized fi nancial information of equity affi liates is included in Note 8 to the consolidated fi nancial statements. Equity investments are reviewed for impairment whenever events or changes in circumstances indicate that the carrying amount of the investment may not be recoverable.
In the event that a decline in fair value of an investment occurs, and the decline in value is considered to be other than temporary, an impairment loss would be recognized. Management’s estimate of fair value of an investment is based on estimated discounted future cash fl ows expected to

35
be generated by the investee. Changes in key assumptions about the fi nancial condition of an investee or actual condi-tions which differ from estimates could result in an impair-ment charge. Over the past three years, there have been no impairment charges associated with an equity investment.
Environmental LiabilitiesAccruals for environmental loss contingencies are recorded when it is probable that a liability has been incurred and the amount can reasonably be estimated. The company estimates the exposure for environmental contingencies to range from $9 to a reasonably possible upper exposure of $19. The balance sheet at 30 September 2004 included an accrual of $14.3, primarily as part of other noncurrent liabilities. Management views the measurement of environmental loss contingency accruals as a critical accounting estimate because of the considerable uncertainty surrounding estimation and the need to forecast into the distant future.
In the normal course of business, the company is involved in legal proceedings under the federal Superfund law, similar state environmental laws and RCRA relating to the des-ignation of certain sites for investigation or remediation. Presently, there are approximately 40 sites on which a fi nal settlement has not been reached where the company, along with others, has been designated a potentially responsible party by the Environmental Protection Agency or is other-wise engaged in investigation or remediation. In addition, the company is also involved in cleanup activities at certain of its manufacturing sites. Sites for which the company mon-itors environmental exposure are related to operations within the Gases and Chemicals segments as well as discontinued businesses.
Measurement of environmental accruals is based on the evaluation of currently available information with respect to each individual site and considers factors such as exist-ing technology, presently enacted laws and regulations, and prior experience in remediation of contaminated sites. An environmental accrual related to cleanup of a contaminated site might include, for example, a provision for one or more of the following types of costs: site investigation and testing costs, cleanup costs, costs related to soil and water contamination resulting from tank ruptures, postremedia-tion monitoring costs and outside legal fees. Environmental accruals include costs related to other potentially responsible parties to the extent that the company has reason to believe such parties will not fully pay their proportionate share. The accruals also do not take into account any claims for recover-ies from insurance and are not discounted.
As assessments and remediation progress at individual sites, the amount of the projected cost is reviewed periodically, and the accrual is adjusted to refl ect additional technical and legal information that becomes available. Management has a well-established process in place to identify and monitor the company’s environmental exposures. An environmental accrual analysis is prepared and maintained that lists all envi-ronmental loss contingencies, even where an accrual has not been established. This analysis assists in monitoring the com-pany’s overall environmental exposure and serves as a tool to facilitate ongoing communication among the company’s technical experts, environmental managers, environmental lawyers and fi nancial management to ensure that required accruals are recorded and potential exposures disclosed.
Actual costs to be incurred at identifi ed sites in future periods may vary from the estimates, given the inherent uncertainties in evaluating environmental exposures. Using reasonably possible alternative assumptions of the exposure level could result in an increase to the environmental accrual. Due to the inherent uncertainties related to environmental exposures, a signifi cant increase to the reasonably possible upper exposure level could occur if a new site was desig-nated, the scope of remediation was increased or a signifi cant increase in the company’s proportionate share occurred.
Income TaxesThe company accounts for income taxes under the liability method. Under this method, deferred tax liabilities and assets are recognized for the tax effects of temporary dif-ferences between the fi nancial reporting and tax bases of liabilities and assets measured using the enacted tax rate. At 30 September 2004, accrued income taxes and deferred tax liabilities amounted to $105.9 and $788.0, respec-tively. Income tax expense was $226.6 for the year ended 30 September 2004. Signifi cant management judgment is required in determining income tax expense and the related balance sheet amounts. Judgments are required concerning the ultimate outcome of tax contingencies and the realiza-tion of deferred tax assets.
Actual income taxes paid may vary from estimates depending upon changes in income tax laws, actual results of opera-tions, and the fi nal audit of tax returns by taxing authorities. Tax assessments may arise several years after tax returns have been fi led. The company believes that its recorded tax liabili-ties adequately provide for the probable outcome of these assessments.
36 Management’s Discussion and Analysis continued
Deferred tax assets are recorded for operating losses and tax credit carryforwards. However, when there are not suf-fi cient sources of future taxable income to realize the ben-efi t of the operating loss or tax credit carryforwards, these deferred tax assets are reduced by a valuation allowance. A valuation allowance is recognized if, based on the weight of available evidence, it is considered more likely than not that some portion or all of the deferred tax asset will not be real-ized. The factors used to assess the likelihood of realization include forecasted future taxable income and available tax planning strategies that could be implemented to realize or renew net deferred tax assets in order to avoid the potential loss of future tax benefi ts. The effect of a change in the valu-ation allowance is reported in the current period tax expense.
A 1% point increase in the company’s effective tax rate would have decreased net income by approximately $8.
Pension BenefitsThe company sponsors defi ned benefi t pension plans in vari-ous forms for employees who meet eligibility requirements. Several assumptions and statistical variables are used in actu-arial models to calculate the pension expense and liability related to the various plans. Assumptions about the discount rate, the expected rate of return on plan assets and the future rate of compensation increases are determined by the com-pany. The actuarial models also use assumptions on demo-graphic factors such as retirement, mortality and turnover. Management considers the accounting for pension benefi ts critical because of the signifi cance and number of assump-tions used. Depending on the assumptions selected, pension expense could vary signifi cantly and could have a material effect on reported earnings. The assumptions used can also materially affect the measurement of benefi t obligations. For a detailed discussion of the company’s pension benefi ts, see Pension Benefi ts above and Note 18 to the consolidated fi nancial statements.
New Accounting StandardsIn December 2003, the FASB published a revision to Interpretation No. 46, “Consolidation of Variable Interest Entities,” to clarify some of the provisions of Interpretation No. 46. In December 2003, the FASB also issued a revised Statement of Financial Accounting Standard (SFAS) No. 132, “Employers’ Disclosures about Pensions and Other Postretirement Benefi ts,” which added disclosure
requirements for defi ned benefi t plans. In May 2004, the FASB issued a FASB Staff Position (FSP) No. FAS 106-2, “Accounting and Disclosure Requirements Related to the Medicare Prescription Drug, Improvement and Modernization Act of 2003 (Act).” This FSP provides guid-ance on the accounting for the effects of the Act for employ-ers that sponsor postretirement health care plans that provide prescription drug benefi ts. See Note 2 to the consolidated fi nancial statements for information concerning the com-pany’s implementation and impact of these new accounting standards.
Forward-Looking StatementsThe forward-looking statements contained in this document are based on current expectations at the time the document was originally prepared regarding important risk factors. Management does not anticipate publicly updating any of its expectations except as part of the quarterly earnings announcement process. The forward-looking statements contained in this document are based on current expecta-tions regarding important risk factors.
Actual results may differ materially from those forward-looking statements expressed. In addition to important risk factors and uncertainties referred to in the Management’s Discussion and Analysis, factors that might cause forward-looking statements to differ materially from actual results include, among other things, overall economic and business conditions different than those currently anticipated and demand for the company’s goods and services; competitive factors in the industries in which it competes; interrup-tion in ordinary sources of supply; the ability to recover unanticipated increased energy and raw material costs from customers; uninsured litigation judgments or settlements; spikes in the pricing of natural gas; changes in government regulations; consequences of acts of war or terrorism impact-ing the United States and other markets; charges related to currently unplanned portfolio management and cost reduc-tion actions; the success of implementing cost reduction pro-grams; the timing, impact, and other uncertainties of future acquisitions or divestitures; signifi cant fl uctuations in interest rates and foreign currencies from that currently anticipated; the impact of tax and other legislation and regulations in jurisdictions in which the company and its affi liates operate; and the timing and rate at which tax credits can be utilized.
37
Report of Independent Registered Public Accounting FirmTo the Shareholders and Board of Directors of Air Products and Chemicals, Inc.:
We have audited the accompanying consolidated balance sheets of Air Products and Chemicals, Inc. (a Delaware corpora-tion) and subsidiaries as of 30 September 2004 and 2003, and the related consolidated statements of income, cash fl ows and shareholders’ equity for each of the years in the three-year period ended 30 September 2004. These consolidated fi nancial statements are the responsibility of the Company’s management. Our responsibility is to express an opinion on these fi nancial statements based on our audits.
We conducted our audits in accordance with the standards of the Public Company Accounting Oversight Board (United States). Those standards require that we plan and perform the audits to obtain reasonable assurance about whether the fi nancial statements are free of material misstatement. An audit includes examining, on a test basis, evidence supporting the amounts and disclosures in the fi nancial statements. An audit also includes assessing the accounting principles used and sig-nifi cant estimates made by management, as well as evaluating the overall fi nancial statement presentation. We believe that our audits provide a reasonable basis for our opinion.
In our opinion, the consolidated fi nancial statements referred to above present fairly, in all material respects, the fi nancial posi-tion of Air Products and Chemicals, Inc. and subsidiaries as of 30 September 2004 and 2003, and the results of their opera-tions and their cash fl ows for each of the years in the three-year period ended 30 September 2004 in conformity with U.S. generally accepted accounting principles.
KPMG LLPPhiladelphia, Pennsylvania27 October 2004
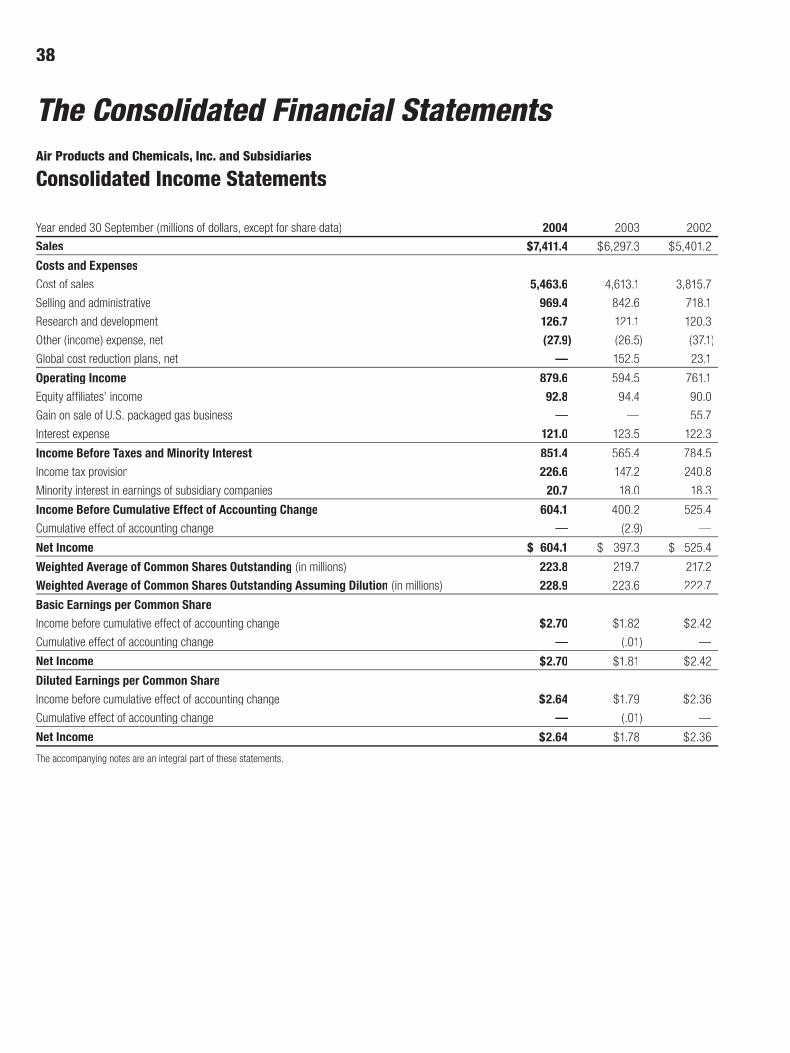
38
The Consolidated Financial StatementsAir Products and Chemicals, Inc. and Subsidiaries
Consolidated Income Statements
Year ended 30 September (millions of dollars, except for share data) 2004 2003 2002
Sales $7,411.4 $6,297.3 $5,401.2
Costs and ExpensesCost of sales 5,463.6 4,613.1 3,815.7
Selling and administrative 969.4 842.6 718.1
Research and development 126.7 121.1 120.3
Other (income) expense, net (27.9) (26.5) (37.1)
Global cost reduction plans, net — 152.5 23.1
Operating Income 879.6 594.5 761.1
Equity affiliates’ income 92.8 94.4 90.0
Gain on sale of U.S. packaged gas business — — 55.7
Interest expense Interest expense Interest expense 121.0 123.5 122.3
Income Before Taxes and Minority Interest 851.4 565.4 784.5
Income tax provision 226.6 147.2 240.8
Minority interest in earnings of subsidiary companies 20.7 18.0 18.3
Income Before Cumulative Effect of Accounting Change 604.1 400.2 525.4
Cumulative effect of accounting change — (2.9) —
Net Income $ 604.1 $ 397.3 $ 525.4
Weighted Average of Common Shares Outstanding (in millions) 223.8 219.7 217.2
Weighted Average of Common Shares Outstanding Assuming Dilution (in millions) 228.9 223.6 222.7
Basic Earnings per Common Share
Income before cumulative effect of accounting change $2.70 $1.82 $2.42
Cumulative effect of accounting change — (.01) —
Net Income $2.70 $1.81 $2.42
Diluted Earnings per Common Share
Income before cumulative effect of accounting change $2.64 $1.79 $2.36
Cumulative effect of accounting change — (.01) —
Net Income $2.64 $1.78 $2.36
The accompanying notes are an integral part of these statements.
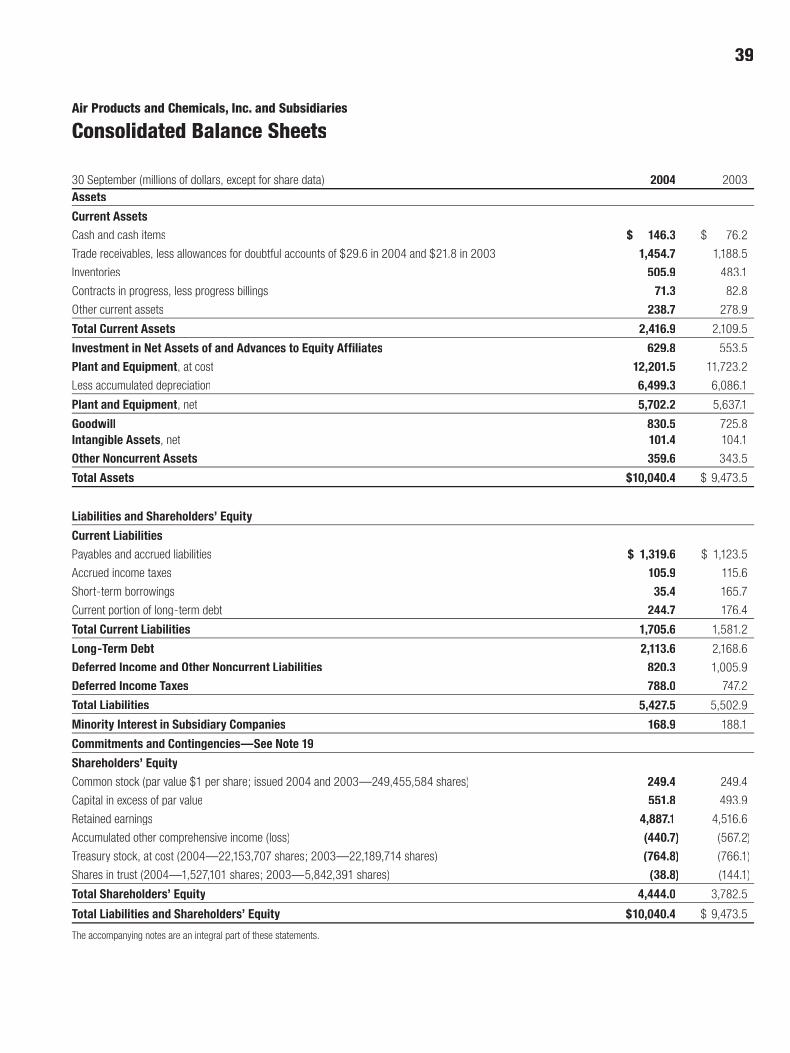
39
Air Products and Chemicals, Inc. and Subsidiaries
Consolidated Balance Sheets
30 September (millions of dollars, except for share data) 2004 2003Assets
Current AssetsCash and cash items $ 146.3 $ 76.2
Trade receivables, less allowances for doubtful accounts of $29.6 in 2004 and $21.8 in 2003 1,454.7 1,188.5
Inventories 505.9 483.1
Contracts in progress, less progress billings 71.3 82.8
Other current assets 238.7 278.9
Total Current Assets 2,416.9 2,109.5
Investment in Net Assets of and Advances to Equity Affiliates 629.8 553.5
Plant and Equipment, at cost 12,201.5 11,723.2
Less accumulated depreciation 6,499.3 6,086.1
Plant and Equipment, net 5,702.2 5,637.1
Goodwill 830.5 725.8Intangible Assets, net 101.4 104.1
Other Noncurrent Assets 359.6 343.5
Total Assets $10,040.4 $ 9,473.5
Liabilities and Shareholders’ Equity
Current LiabilitiesPayables and accrued liabilities $ 1,319.6 $ 1,123.5
Accrued income taxes 105.9 115.6
Short-term borrowings 35.4 165.7
Current portion of long-term debt 244.7 176.4
Total Current Liabilities 1,705.6 1,581.2
Long-Term Debt 2,113.6 2,168.6
Deferred Income and Other Noncurrent Liabilities 820.3 1,005.9
Deferred Income Taxes 788.0 747.2
Total Liabilities 5,427.5 5,502.9
Minority Interest in Subsidiary Companies 168.9 188.1
Commitments and Contingencies—See Note 19
Shareholders’ EquityCommon stock (par value $1 per share; issued 2004 and 2003—249,455,584 shares) 249.4 249.4
Capital in excess of par value 551.8 493.9
Retained earnings 4,887.1 4,516.6
Accumulated other comprehensive income (loss) (440.7) (567.2)
Treasury stock, at cost (2004—22,153,707 shares; 2003—22,189,714 shares) (764.8) (766.1)
Shares in trust (2004—1,527,101 shares; 2003—5,842,391 shares) (38.8) (144.1)
Total Shareholders’ Equity 4,444.0 3,782.5
Total Liabilities and Shareholders’ Equity $10,040.4 $ 9,473.5
The accompanying notes are an integral part of these statements.

40 The Consolidated Financial Statements continued
.
Air Products and Chemicals, Inc. and Subsidiaries
Consolidated Statements of Cash Flows
Year ended 30 September (millions of dollars) 2004 2003 2002
Operating ActivitiesNet income $ 604.1 $ 397.3 $ 525.4
Adjustments to reconcile income to cash provided by operating activities:
Depreciation and amortization 714.9 654.8 591.1
Impairment of long-lived assets 3.9 91.7 3.7
Deferred income taxes 86.2 26.8 65.2
Undistributed earnings of unconsolidated affiliates (44.6) (6.8) (44.4)
Gain on sale of assets and investments (5.3) (8.4) (66.5)
Other 20.4 14.8 44.2
Subtotal 1,379.6 1,170.2 1,118.7
Working capital changes, excluding effects of acquisitions and divestitures:
Trade receivables (253.0) (88.0) (13.1)
Inventories and contracts in progress (27.9) (53.2) 55.1
Payables and accrued liabilities 5.3 (9.6) (143.9)
Other (18.1) 16.6 47.1
Cash Provided by Operating Activities 1,085.9 1,036.0 1,063.9
Investing ActivitiesAdditions to plant and equipment (705.5) (612.9) (627.6)
Acquisitions, less cash acquired (84.6) (529.6) (114.8)
Investment in and advances to unconsolidated affiliates (18.8) (6.1) (39.2)
Proceeds from sale of assets and investments 46.2 102.1 292.9
Other — (.1) (4.9)
Cash Used for Investing Activities (762.7) (1,046.6) (493.6)
Financing ActivitiesLong-term debt proceeds 286.3 162.8 61.3
Payments on long-term debt (335.4) (271.0) (203.6)
Net (decrease) increase in commercial paper and short-term borrowings (134.8) 37.6 (170.9)
Dividends paid to shareholders (218.9) (188.6) (175.6)
Proceeds from stock option exercises 146.0 76.5 103.8
Cash Used for Financing Activities (256.8) (182.7) (385.0)
Effect of Exchange Rate Changes on Cash 3.7 15.8 2.2
Increase (Decrease) in Cash and Cash Items 70.1 (177.5) 187.5
Cash and Cash Items—Beginning of Year 76.2 253.7 66.2
Cash and Cash Items—End of Year $ 146.3 $ 76.2 $ 253.7
Cash paid during the year for: Interest (net of amounts capitalized) $ 122.9 $ 123.6 $ 124.1 Taxes (net of refunds) 107.8 79.1 136.5The accompanying notes are an integral part of these statements.
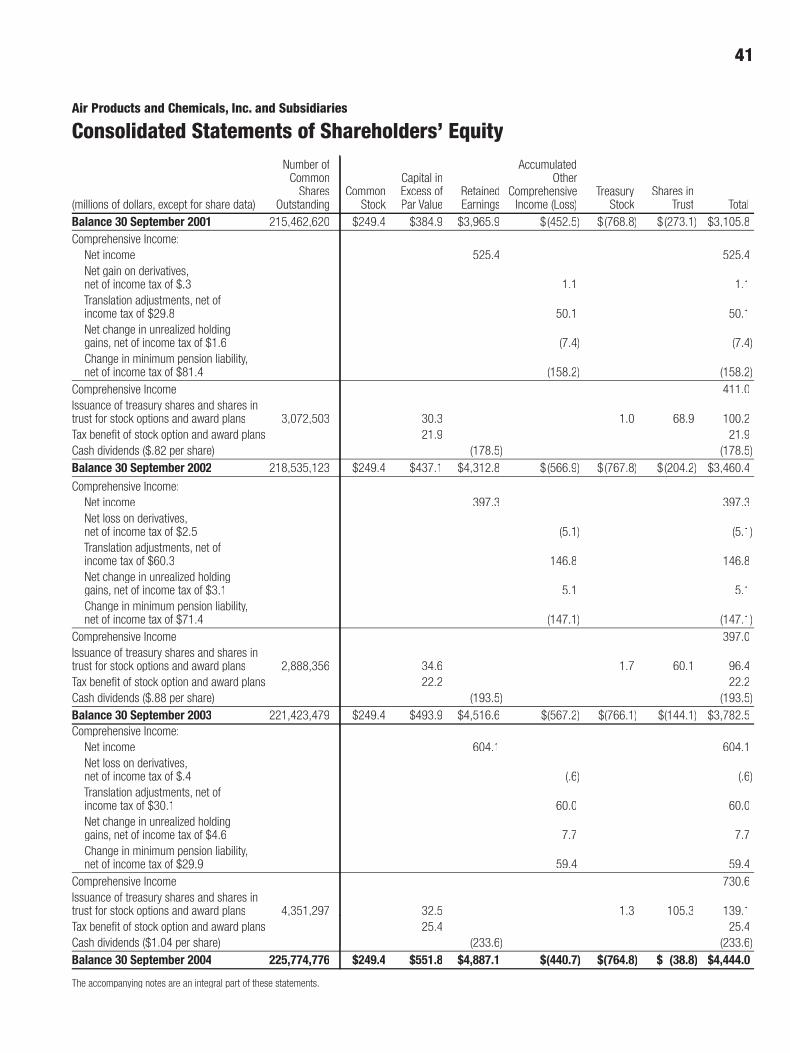
41
Air Products and Chemicals, Inc. and Subsidiaries
Consolidated Statements of Shareholders’ EquityNumber of Accumulated
Common Capital in Other Shares Common Excess of Retained Comprehensive Treasury Shares in
(millions of dollars, except for share data) Outstanding Stock Stock Stock Par Value Earnings Income (Loss) Stock Stock Stock Trust TotalBalance 30 September 2001 215,462,620 $249.4 $384.9 $3,965.9 $(452.5) $(768.8) $(273.1) $3,105.8Comprehensive Income: Net income 525.4 525.4 Net gain on derivatives, net of income tax of $.3 1.1 1.1 Translation adjustments, net of income tax of $29.8 50.1 50.1 Net change in unrealized holding gains, net of income tax of $1.6 (7.4) (7.4) Change in minimum pension liability, net of income tax of $81.4 (158.2) (158.2)Comprehensive Income 411.0Issuance of treasury shares and shares in trust for stock options and award plans 3,072,503 30.3 1.0 68.9 100.2Tax benefi t of stock option and award plans 21.9 21.9Cash dividends ($.82 per share) (178.5) (178.5)Balance 30 September 2002 218,535,123 $249.4 $437.1 $4,312.8 $(566.9) $(767.8) $(204.2) $3,460.4
Comprehensive Income: Net income 397.3 397.3 Net loss on derivatives, net of income tax of $2.5 (5.1) (5.1) Translation adjustments, net of income tax of $60.3 146.8 146.8 Net change in unrealized holding gains, net of income tax of $3.1 5.1 5.1 Change in minimum pension liability, net of income tax of $71.4 (147.1) (147.1)Comprehensive Income 397.0Issuance of treasury shares and shares in trust for stock options and award plans 2,888,356 34.6 1.7 60.1 96.4Tax benefi t of stock option and award plans 22.2 22.2Cash dividends ($.88 per share) (193.5) (193.5)Balance 30 September 2003 221,423,479 $249.4 $493.9 $4,516.6 $(567.2) $(766.1) $(144.1) $3,782.5Comprehensive Income: Net income 604.1 604.1 Net loss on derivatives, net of income tax of $.4 (.6) (.6) Translation adjustments, net of income tax of $30.1 60.0 60.0 Net change in unrealized holding gains, net of income tax of $4.6 7.7 7.7 Change in minimum pension liability, net of income tax of $29.9 59.4 59.4Comprehensive Income 730.6Issuance of treasury shares and shares in trust for stock options and award plans 4,351,297 32.5 1.3 105.3 139.1Tax benefi t of stock option and award plans 25.4 25.4Cash dividends ($1.04 per share) (233.6) (233.6)Balance 30 September 2004 225,774,776 $249.4 $551.8 $4,887.1 $(440.7) $(764.8) $ (38.8) $4,444.0
The accompanying notes are an integral part of these statements.
42
Notes to the Notes to the NoteConsolidated Financial Statements(millions of dollars, except for share data)
Contents 1. Major Accounting Policies 42 2. New Accounting Standards 47 3. Global Cost Reduction Plans 48 4. Acquisitions 49 5. Divestitures 50 6. Financial Instruments 50 7. Inventories 52 8. Summarized Financial Information of Equity Affi liates 53 9. Plant and Equipment 5310. Goodwill 5311. Intangible Assets 5412. Long-Term Debt 5413. Leases 5514. Capital Stock 5515. Stock Option and Award Plans 5516. Earnings Per Share 5717. Income Taxes 5718. Retirement Benefi ts 5819. Commitments and Contingencies 6220. Supplemental Information 6321. Business Segment and Geographic Information 65
1. Major Accounting PoliciesConsolidation PrinciplesThe consolidated fi nancial statements include the accounts of Air Products and Chemicals, Inc. and its majority-owned subsidiary companies (the company). The company consoli-dates all entities that it controls. Intercompany transactions and balances are eliminated in consolidation.
Estimates and AssumptionsThe preparation of fi nancial statements in accordance with accounting principles generally accepted in the United States of America requires management to make estimates and assumptions that affect the reported amounts of assets and liabilities and disclosure of contingent assets and liabilities at the date of the fi nancial statements and the reported amounts of revenues and expenses during the reporting period. Actual results could differ from those estimates.
Revenue RecognitionRevenue from gases and chemicals sales is recognized as risk and title to the product transfers to the customer (which occurs at the time shipment is made), the sales price is fi xed or determinable, and collectibility is reasonably assured. Sales returns and allowances are not a business practice in the industry.
Revenues from equipment sale contracts are recorded pri-marily using the percentage-of-completion method. Under this method, revenues from the sale of major equipment, such as natural gas liquefaction (LNG) heat exchangers and large air separation units, are recognized based on labor hours incurred to date compared with total estimated labor hours. Changes to total estimated labor hours and anticipat-ed losses, if any, are recognized in the period determined.
Amounts billed for shipping and handling fees are classi-fi ed as sales in the consolidated income statements. Costs incurred for shipping and handling are classifi ed as cost of sales.
DepreciationDepreciation is recorded using the straight-line method, which deducts equal amounts of the cost of each asset from earnings every year over its expected useful life. The esti-mated useful lives primarily range from 15 to 30 years (prin-cipally 30 years) for buildings and principally from 15 to 20 years for gas generating and chemical facilities, machinery and equipment.
Global Cost Reduction PlansThe company has a substantive ongoing severance arrange-ment. The benefi ts given as part of the 2003 and 2002 global cost reduction plans (discussed in Note 3) were con-sistent with termination benefi ts in previous, similar restruc-turing plans. Because the company’s plans met the defi nition of an ongoing benefi t arrangement, it was accounted for per Statement of Financial Accounting Standards (SFAS) No. 112, “Employers’ Accounting for Postemployment Benefi ts.” To recognize a liability under SFAS No. 112, the expense must be probable and estimable. These criteria were met when management, with the appropriate level and au-thority, had approved and committed to its plan of action for termination; the plan identifi ed the employees to be terminated and their related benefi ts; and the plan was to be completed within one year. During periods of operations where terminations are made on an as-needed basis, absent a detailed committed plan, terminations are accounted for on an individual basis and a liability is recognized per SFAS No. 112 when probable and estimable.

43
As part of the 2003 and 2002 global cost reduction plans, write-downs of long-lived assets were accounted for under the provisions of SFAS No. 144, “Accounting for the Impairment or Disposal of Long-Lived Assets.” Two types of assets were impacted: assets to be disposed of by sale and assets no longer in use to be abandoned. Assets to be disposed of by sale were measured at the lower of carrying amount or estimated net proceeds from the sale. The recog-nition criteria of SFAS No. 144 were met as management, with the appropriate level and authority, had approved and committed to a plan; the assets were available for immediate sale; management began an active program to locate a buyer; the sales were evaluated as being probable within one year; and it was unlikely that any changes to the plan would be made. The assets to be abandoned were no longer in use and were written down, net of expected recovery from disposal.
Financial InstrumentsThe company addresses certain fi nancial exposures through a controlled program of risk management that includes the use of derivative fi nancial instruments. The types of derivative fi nancial instruments permitted for such risk management programs are specifi ed in policies set by management. The company currently enters into foreign exchange contracts, including forward, option combination and purchased option contracts, to reduce the effects of fl uctuating foreign currency exchange rates. The company currently enters into interest rate swap contracts to reduce interest rate risks and to modify the interest rate characteristics of its outstanding debt. The company is also currently party to cross currency interest rate swap agreements. Major fi nancial institutions are counterparties to these contracts. The company has es-tablished counterparty credit guidelines and only enters into transactions with fi nancial institutions of investment grade or better. Management believes the risk of incurring losses related to credit risk is remote, and any losses would be im-material to consolidated fi nancial results.
The company recognizes derivatives on the balance sheet at fair value. On the date the derivative instrument is entered into, the company generally designates the derivative as either (1) a hedge of the fair value of a recognized asset or liability or of an unrecognized fi rm commitment (fair value hedge), (2) a hedge of a forecasted transaction or of the vari-ability of cash fl ows to be received or paid related to a recog-nized asset or liability (cash fl ow hedge), or (3) a hedge of a net investment in a foreign operation.
Changes in the fair value of a derivative that is designated as and meets all the required criteria for a fair value hedge, along with the gain or loss on the hedged asset or liability that is attributable to the hedged risk, are recorded in current period earnings.
Changes in the fair value of a derivative that is designated as and meets all the required criteria for a cash fl ow hedge are recorded in accumulated other comprehensive income and reclassifi ed into earnings as the underlying hedged item af-fects earnings.
Changes in the fair value of a derivative or foreign currency debt that is designated as and meets all the required criteria for a hedge of a net investment are recorded as translation adjustments in accumulated other comprehensive income.
Changes in the fair value of a derivative that is not designat-ed as a hedge are recorded immediately in earnings.
The company formally documents the relationships between hedging instruments and hedged items, as well as its risk management objective and strategy for undertaking various hedge transactions. This process includes relating derivatives that are designated as fair value or cash fl ow hedges to spe-cifi c assets and liabilities on the balance sheet or to specifi c fi rm commitments or forecasted transactions. The company also formally assesses, both at the inception of the hedge and on an ongoing basis, whether each derivative is highly effective in offsetting changes in fair values or cash fl ows of the hedged item. If it is determined that a derivative is not highly effective as a hedge, or if a derivative ceases to be a highly effective hedge, the company will discontinue hedge accounting with respect to that derivative prospectively.
Foreign CurrencyThe value of the U.S. dollar rises and falls day to day on foreign currency exchanges. Since the company does busi-ness in many foreign countries, these fl uctuations affect the company’s fi nancial position and results of operations.
For most foreign operations, local currencies are considered the functional currency. Generally, foreign subsidiaries trans-late their assets and liabilities into U.S. dollars at current exchange rates—that is, the rates in effect at the end of the fi scal period. The gains or losses that result from this process are shown in accumulated other comprehensive income in the shareholders’ equity section of the balance sheet.
The revenue and expense accounts of foreign subsidiar-ies are translated into U.S. dollars at the average exchange rates that prevailed during the period. Therefore, the U.S. dollar value of these items on the income statement fl uctu-ates from period to period, depending on the value of the dollar against foreign currencies. Some transactions are made in currencies different from an entity’s functional currency. Gains and losses from these foreign currency transactions are generally included in income as they occur.
44 Notes to the Consolidated Financial Statements continued
Environmental ExpendituresAccruals for investigatory, external legal costs and noncapi-tal remediation costs are recorded when it is probable that a liability has been incurred and the amount of loss can be reasonably estimated. Remediation costs are capitalized if the costs improve the company’s property as compared with the condition of the property when originally constructed or ac-quired, or if the costs prevent environmental contamination from future operations. Costs to operate and maintain the capitalized facilities are expensed as incurred.
The measurement of environmental liabilities is based on an evaluation of currently available facts with respect to each individual site and considers factors such as existing technol-ogy, presently enacted laws and regulations and prior experi-ence in remediation of contaminated sites. These liabilities include costs related to other potentially responsible parties to the extent that the company has reason to believe such parties will not fully pay their proportionate share. They also do not take into account any claims for recoveries from in-surance and are not discounted.
As assessments and remediation progress at individual sites, these liabilities are reviewed periodically and adjusted to refl ect additional technical and legal information that becomes available. Actual costs to be incurred at identifi ed sites in future periods may vary from the estimates, given inherent uncertainties in evaluating environmental expo-sures. The accruals for environmental liabilities are refl ected in the balance sheet, primarily as part of other noncurrent liabilities.
LitigationIn the normal course of business, the company is occasion-ally involved in legal proceedings. The company accrues a liability for such matters when it is probable that a liability has been incurred and the amount can be reasonably esti-mated. When only a range of possible loss can be estab-lished, the most probable amount in the range is accrued. If no amount within this range is a better estimate than any other amount within the range, the minimum amount in the range is accrued. The accrual for a litigation loss contingency might include, for example, estimates of potential damages, outside legal fees, and other directly related costs expected to be incurred.
Stock-Based CompensationThe company has various stock-based compensation plans as described in Note 15. The company accounts for its stock option plans under the recognition and measurement prin-ciples of Accounting Principles Board (APB) Opinion No. 25, “Accounting for Stock Issued to Employees,” and related Interpretations. No compensation expense has been recognized in net income for stock options. The following
table illustrates the effect on net income and earnings per share as if the company had applied the fair value recogni-tion provisions of SFAS No. 123, “Accounting for Stock-Based Compensation,” to its stock option plans.
2004 2003 2002
Net Income, as Reported $604.1 $ 397.3 $525.4
Deduct stock option employee compensation expense determined under fair value-based method,net of related tax effects (30.6) (37.9) (40.9)
Pro Forma Net Income $573.5 $359.4 $484.5
Basic Earnings per Share As reported $ 2.70 $ 1.81 $ 2.42
Pro forma 2.56 1.64 2.23
Diluted Earnings per Share As reported $ 2.64 $ 1.78 $ 2.36
Pro forma 2.51 1.61 2.18
For disclosure purposes, the fair value of each stock option granted is estimated on the date of grant using the Black-Scholes option-pricing model with the following weighted average assumptions:
2004 2003 2002
Dividend yield 2.0% 2.0% 2.0%
Expected volatility 30.6% 30.6% 30.1%
Risk-free interest rate 4.0% 3.6% 4.7%
Expected life (years) 7.9 7.9 7.8
Weighted average fair value per option $15.01 $13.71 $12.90
The Black-Scholes option-pricing model was developed for use in estimating the fair value of traded options that have no vesting restrictions and are fully transferable. In addi-tion, option-pricing models require the input of subjective assumptions, including the expected stock price volatility. Because the company’s options have characteristics different from those of traded options, in the opinion of management, the existing models do not necessarily provide a reliable single measure of the fair value of its options.
Income TaxesThe company accounts for income taxes under the liability method. Under this method, deferred tax liabilities and assets are recognized for the tax effects of temporary dif-ferences between the fi nancial reporting and tax bases of assets and liabilities using enacted tax rates. A principal temporary difference results from the excess of tax deprecia-tion over book depreciation because accelerated methods of

45
depreciation and shorter useful lives are used for income tax purposes. The cumulative impact of a change in tax rates or regulations is included in income tax expense in the period that includes the enactment date.
Cash and Cash ItemsCash and cash items include cash, time deposits and certifi -cates of deposit acquired with an original maturity of three months or less.
Allowances for Doubtful AccountsThe allowances for doubtful accounts represent estimated uncollectible receivables associated with potential customer defaults on contractual obligations, usually due to custom-ers’ potential insolvency. The allowances include amounts for certain customers where a risk of default has been specifi cally identifi ed. In addition, the allowances include a provision for customer defaults on a general formula basis when it is deter-mined the risk of some default is probable and estimable but cannot yet be associated with specifi c customers. The assess-ment of the likelihood of customer defaults is based on vari-ous factors, including the length of time the receivables are past due, historical experience and existing economic condi-tions. Provisions to the allowance for doubtful accounts recorded as expense were $18.3, $11.6 and $13.6 in 2004, 2003 and 2002, respectively.
InventoriesInventories are stated at the lower of cost or market. The company writes down its inventories for estimated obsoles-cence or unmarketable inventory based upon assumptions about future demand and market conditions.
The cost of chemical inventories and some gas and equip-ment inventories in the United States is determined using the last-in, fi rst-out (LIFO) method. The cost of other in-ventories is principally determined using the fi rst-in, fi rst-out (FIFO) method.
As of 30 September 2003, the company changed its method of accounting for LIFO inventory by reducing the number of LIFO inventory pools from ten to three pools. This newly adopted accounting principle is preferable as each pool will include items with similar economic activity. The adoption of this new accounting principle did not have a material effect on the company’s fi nancial statements.
Equity InvestmentsThe equity method of accounting is used when the company has a 20% to 50% interest in other companies and exercises signifi cant infl uence. Under the equity method, original in-vestments are recorded at cost and adjusted by the company’s share of undistributed earnings or losses of these companies.
Equity investments are reviewed for impairment whenever events or changes in circumstances indicate that the carrying amount of the investment may not be recoverable.
Financial Accounting Standards Board (FASB) Interpretation No. 46/R defi nes a variable interest entity and establishes standards under which a variable interest entity should be consolidated by the primary benefi ciary. The company has reviewed its investments and has concluded it does not have an interest in a variable interest entity. Therefore, the company accounts for its equity investments under the pro-visions of APB Opinion No. 18, “The Equity Method of Accounting for Investments in Common Stock.”
Plant and EquipmentPlant and equipment is stated at cost less accumulated depre-ciation. Construction costs, labor and applicable overhead related to installations are capitalized. Expenditures for ad-ditions and improvements that extend the lives or increase the capacity of plant assets are capitalized. The costs of main-tenance and repairs of plant and equipment are charged to expense as incurred.
Fully depreciated assets are retained in the gross plant and equipment and accumulated depreciation accounts until they are removed from service. In the case of disposals, assets and related depreciation are removed from the accounts, and the net amounts, less proceeds from disposal, are included in income.
Capitalized InterestAs the company builds new plant and equipment, it in-cludes in the cost of these assets a portion of the interest pay-ments it makes during the year. The amount of capitalized interest was $5.5, $4.2 and $9.4 in 2004, 2003 and 2002, respectively.
Asset Retirement ObligationsThe fair value of a liability for an asset retirement obligation is recognized in the period in which it is incurred. The liabil-ity is measured at discounted fair value and is adjusted to its present value in subsequent periods as accretion expense is recorded. The corresponding asset retirement costs are capi-talized as part of the carrying amount of the related long-lived asset and depreciated over the asset’s useful life. The company’s asset retirement obligations are primarily associ-ated with Gases on-site long-term supply contracts under which the company has built a facility on land leased from the customer and is obligated to remove the facility at the end of the contract term. The company’s asset retire-ment obligations are not material to the company’s fi nancial statements.
46 Notes to the Consolidated Financial Statements continued
Computer SoftwareThe company capitalizes costs incurred to purchase or develop software for internal use. Capitalized costs include purchased computer software packages, payments to vendors/consultants for development and implementation or modifi cation to a purchased package to meet company requirements, payroll and related costs for employees directly involved in development, and interest incurred while soft-ware is being developed. Capitalized computer software costs are included in the balance sheet classifi cation plant and equipment and depreciated over the estimated useful life of the software, generally a period of three to ten years. The company’s newly implemented SAP system will be depreci-ated over a ten-year life.
Impairment of Long-Lived AssetsLong-lived assets are evaluated for impairment whenever events or changes in circumstances indicate that the carrying amount of an asset may not be recoverable. The company assesses recoverability by comparing the carrying amount of the asset to estimated undiscounted future cash fl ows expected to be generated by the asset. If an asset is consid-ered impaired, the impairment loss to be recognized is mea-sured as the amount by which the asset’s carrying amount exceeds its fair value. Long-lived assets to be disposed of are reported at the lower of carrying amount or fair value less cost to sell.
GoodwillThe company’s acquisitions are accounted for using the pur-chase method. The purchase price is allocated to the assets acquired and liabilities assumed based on their estimated fair market values. Any excess purchase price over the fair market value of the net assets acquired, including identifi ed intan-gibles, is recorded as goodwill. Preliminary purchase price allocations are made at the date of acquisition and fi nalized when information needed to affi rm underlying estimates is obtained and/or within a maximum allocation period of one year.
Goodwill is subject to impairment testing at least annually. In addition, goodwill would be tested more frequently if a change in circumstances or the occurrence of events indi-cated that potential impairment exists. Refer to Note 10 for disclosures related to goodwill.
Intangible AssetsIntangible assets with determinable lives primarily con-sist of customer relationships, noncompete covenants and purchased patents and technology. There were no acquired intangible assets with indefi nite lives. The cost of intangible assets with determinable lives is amortized on a straight-line basis over the estimated period of economic benefi t. No re-sidual value is estimated for these intangible assets.
Customer relationships are generally amortized over periods of four to twenty years. Noncompete covenants are gener-ally amortized over periods of three to fi ve years based on contractual terms. Purchased patents and technology and other intangibles are amortized based on contractual terms, ranging from eight to twenty years. Amortizable lives are adjusted whenever there is a change in the estimated period of economic benefi t.
Retirement BenefitsThe cost of retiree benefi ts is recognized over the employ-ees’ service period. The company’s defi ned benefi t pension plans are accounted for in accordance with SFAS No. 87, “Employers’ Accounting for Pensions.” Nonpension post-retirement benefi ts are accounted for in accordance with SFAS No. 106, “Employers’ Accounting for Postretirement Benefi ts Other Than Pensions.” These Statements require the use of actuarial methods and assumptions in the valuation of benefi t obligations and the performance of plan assets. Differences between actual and expected results or changes in the value of obligations and plan assets are not recognized as they occur but rather, systematically and gradually over subsequent periods. Refer to Note 18 for disclosures related to the company’s pension and other postretirement benefi ts.
Shares in TrustThe company has established a trust, funded with trea-sury stock, to provide for a portion of future payments to employees under the company’s existing compensation and benefi t programs. Shares issued to the trust were valued at market price on the date of contribution and refl ected as a reduction of shareholders’ equity in the balance sheet. As shares are transferred from the trust to fund compensation and benefi t obligations, this equity account is reduced based on the original cost of shares to the trust; the satisfaction of liabilities is based on the fair value of shares transferred; and the difference between the fair value of shares transferred and the original cost of shares to the trust is charged or credited to capital in excess of par value.
ReclassificationsAs of 1 October 2003, the company changed its reporting to include overhead expenses incurred by the company related to equity affi liates in selling and administrative expense. Previously, these expenses related to equity affi liates were re-ported in the income statement line item for equity affi liates’ income, net of related expenses. Equity affi liates’ income now includes the company’s proportionate share of earnings of the affi liates and the gain or loss on the sale of investments in equity affi liates. The consolidated income statements of the prior periods were adjusted to refl ect this reclassifi cation.
Certain prior period amounts have been reclassifi ed to con-form to the current period presentation.

47
2. New Accounting StandardsStandards Adopted 2004In December 2003, the FASB published a revision to Interpretation No. 46, “Consolidation of Variable Interest Entities,” to clarify some of the provisions of Interpretation No. 46. The revision to Interpretation No. 46 does not change the company’s determination that it does not have an interest in a variable interest entity.
In December 2003, the FASB also issued a revised SFAS No. 132, “Employers’ Disclosures about Pensions and Other Postretirement Benefi ts,” which added disclosure require-ments for defi ned benefi t plans. The company has included the annual required disclosures in Note 18 to the consoli-dated fi nancial statements.
In May 2004, the FASB issued a FASB Staff Position (FSP) No. FAS 106-2, “Accounting and Disclosure Requirements Related to the Medicare Prescription Drug, Improvement and Modernization Act of 2003 (Act).” This FSP provides guidance on the accounting for the effects of the Act for employers that sponsor postretirement health care plans that provide prescription drug benefi ts. The impact of the Act on the company’s postretirement medical benefi ts is not material.
Standards Adopted 2003The company adopted SFAS No. 143, “Accounting for Asset Retirement Obligations,” on 1 October 2002 and accounts for these obligations as discussed in Note 1. At 1 October 2002, the company recognized transition amounts for existing asset retirement obligation liabilities, associated capitalizable costs and accumulated depreciation. An after-tax transition charge of $2.9 was recorded as the cumulative effect of an accounting change. The ongoing ex-pense on an annual basis resulting from the initial adoption of SFAS No. 143 is approximately $1.
In August 2001, the FASB issued SFAS No. 144, “Accounting for the Impairment or Disposal of Long-Lived Assets.” This Statement establishes a single accounting model for long-lived assets to be disposed of by sale. The Statement retains most of the requirements in SFAS No. 121 related to the recognition of impairment of long-lived assets to be held and used. Additionally, SFAS No. 144 broadens the defi ni-tion of businesses that qualify for reporting as discontinued operations and changes the timing of recognizing losses on such operations. The company adopted this Statement as of 1 October 2002, with no material effect on the company’s fi nancial statements.
In June 2002, the FASB issued SFAS No. 146, “Accounting for Costs Associated with Exit or Disposal Activities.” This Statement addresses the accounting for costs associated with disposal activities covered by SFAS No. 144, “Accounting
for the Impairment or Disposal of Long-Lived Assets,” and with exit (restructuring) activities previously covered by Emerging Issues Task Force (EITF) Issue No. 94-3, “Liability Recognition for Certain Employee Termination Benefi ts and Other Costs to Exit an Activity.” This Statement nullifi es EITF Issue No. 94-3 in its entirety and requires that a liabil-ity for all costs be recognized when the liability is incurred. Generally, the ability to accrue for termination benefi ts at the communication date of a plan in the form of a one-time benefi t arrangement is limited. The cost of the termination benefi ts would be recognized over the future service period of the employees. This Statement does not change the ac-counting for termination benefi ts under ongoing benefi t arrangements such as those included in the company’s global cost reduction plans discussed in Note 3. The company ad-opted SFAS No. 146 as of 1 October 2002. The adoption of this Statement did not have an impact on the company’s fi nancial statements.
In November 2002, the FASB published Interpretation No. 45, “Guarantor’s Accounting and Disclosure Require-ments for Guarantees, Including Indirect Guarantees of Indebtedness of Others.” The Interpretation expands on the disclosure requirements to be made in interim and annual fi nancial statements. The company has included the required disclosures in Note 19. The Interpretation also requires that a liability measured at fair value be recognized for guaran-tees, even if the probability of payment on the guarantee is remote. The recognition provisions applied on a prospective basis for guarantees issued or modifi ed after 31 December 2002. The company has not issued or modifi ed any guaran-tees subsequent to 31 December 2002.
In November 2002, the EITF reached a consensus on Issue No. 00-21, “Accounting for Revenue Arrangements with Multiple Deliverables.” This Issue addresses the appropriate accounting by vendors for arrangements that will result in the delivery of multiple products, services and/or rights to assets that could occur over a period of time. The application of EITF Issue No. 00-21 did not have a material effect on the company’s fi nancial statements.
In December 2002, the FASB issued SFAS No. 148, “Accounting for Stock-Based Compensation—Transition and Disclosure.” SFAS No. 148 amends the disclosure re-quirements of SFAS No. 123 to require more prominent and frequent disclosures in fi nancial statements. Also, SFAS No. 148 provides alternative methods of transition for a vol-untary change to the fair value-based method of accounting for stock-based employee compensation. The company has included the disclosures prescribed by SFAS No. 148 in Note 1. The company does not intend to change its account-ing method for stock-based compensation until a new uni-form accounting standard is issued.
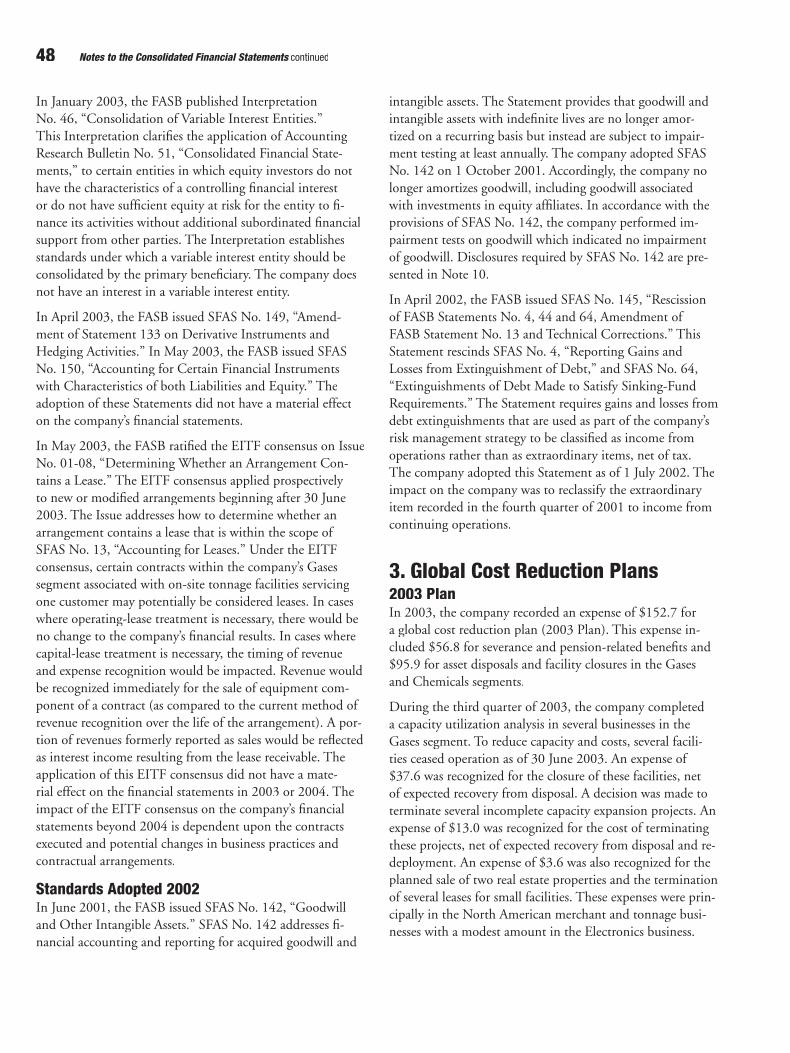
48 Notes to the Consolidated Financial Statements continued
In January 2003, the FASB published Interpretation No. 46, “Consolidation of Variable Interest Entities.” This Interpretation clarifi es the application of Accounting Research Bulletin No. 51, “Consolidated Financial State-ments,” to certain entities in which equity investors do not have the characteristics of a controlling fi nancial interest or do not have suffi cient equity at risk for the entity to fi -nance its activities without additional subordinated fi nancial support from other parties. The Interpretation establishes standards under which a variable interest entity should be consolidated by the primary benefi ciary. The company does not have an interest in a variable interest entity.
In April 2003, the FASB issued SFAS No. 149, “Amend-ment of Statement 133 on Derivative Instruments and Hedging Activities.” In May 2003, the FASB issued SFAS No. 150, “Accounting for Certain Financial Instruments with Characteristics of both Liabilities and Equity.” The adoption of these Statements did not have a material effect on the company’s fi nancial statements.
In May 2003, the FASB ratifi ed the EITF consensus on Issue No. 01-08, “Determining Whether an Arrangement Con-tains a Lease.” The EITF consensus applied prospectively to new or modifi ed arrangements beginning after 30 June 2003. The Issue addresses how to determine whether an arrangement contains a lease that is within the scope of SFAS No. 13, “Accounting for Leases.” Under the EITF consensus, certain contracts within the company’s Gases segment associated with on-site tonnage facilities servicing one customer may potentially be considered leases. In cases where operating-lease treatment is necessary, there would be no change to the company’s fi nancial results. In cases where capital-lease treatment is necessary, the timing of revenue and expense recognition would be impacted. Revenue would be recognized immediately for the sale of equipment com-ponent of a contract (as compared to the current method of revenue recognition over the life of the arrangement). A por-tion of revenues formerly reported as sales would be refl ected as interest income resulting from the lease receivable. The application of this EITF consensus did not have a mate-rial effect on the fi nancial statements in 2003 or 2004. The impact of the EITF consensus on the company’s fi nancial statements beyond 2004 is dependent upon the contracts executed and potential changes in business practices and contractual arrangements.
Standards Adopted 2002In June 2001, the FASB issued SFAS No. 142, “Goodwill and Other Intangible Assets.” SFAS No. 142 addresses fi -nancial accounting and reporting for acquired goodwill and
intangible assets. The Statement provides that goodwill and intangible assets with indefi nite lives are no longer amor-tized on a recurring basis but instead are subject to impair-ment testing at least annually. The company adopted SFAS No. 142 on 1 October 2001. Accordingly, the company no longer amortizes goodwill, including goodwill associated with investments in equity affi liates. In accordance with the provisions of SFAS No. 142, the company performed im-pairment tests on goodwill which indicated no impairment of goodwill. Disclosures required by SFAS No. 142 are pre-sented in Note 10.
In April 2002, the FASB issued SFAS No. 145, “Rescission of FASB Statements No. 4, 44 and 64, Amendment of FASB Statement No. 13 and Technical Corrections.” This Statement rescinds SFAS No. 4, “Reporting Gains and Losses from Extinguishment of Debt,” and SFAS No. 64, “Extinguishments of Debt Made to Satisfy Sinking-Fund Requirements.” The Statement requires gains and losses from debt extinguishments that are used as part of the company’s risk management strategy to be classifi ed as income from operations rather than as extraordinary items, net of tax. The company adopted this Statement as of 1 July 2002. The impact on the company was to reclassify the extraordinary item recorded in the fourth quarter of 2001 to income from continuing operations.
3. Global Cost Reduction Plans2003 PlanIn 2003, the company recorded an expense of $152.7 for a global cost reduction plan (2003 Plan). This expense in-cluded $56.8 for severance and pension-related benefi ts and $95.9 for asset disposals and facility closures in the Gases and Chemicals segments.
During the third quarter of 2003, the company completed a capacity utilization analysis in several businesses in the Gases segment. To reduce capacity and costs, several facili-ties ceased operation as of 30 June 2003. An expense of $37.6 was recognized for the closure of these facilities, net of expected recovery from disposal. A decision was made to terminate several incomplete capacity expansion projects. An expense of $13.0 was recognized for the cost of terminating these projects, net of expected recovery from disposal and re-deployment. An expense of $3.6 was also recognized for the planned sale of two real estate properties and the termination of several leases for small facilities. These expenses were prin-cipally in the North American merchant and tonnage busi-nesses with a modest amount in the Electronics business.
49
The rationalization of excess capacity in certain products resulted in a decision to exit certain Chemical Intermediates operations. Late in the quarter ended 30 June 2003, the company decided to pursue the sale of its European methyl-amines and derivatives business. Expected proceeds from the sale were determined, and a loss was recognized for the difference between the carrying value of the assets and the expected net proceeds from the sale. Additional expenses for the closure of the methanol and ammonia plants in Pensacola, Florida, which made products for internal con-sumption, were also recognized. The total expense for these actions was $41.7.
In addition to the capacity reduction initiatives, the company implemented cost reduction and productivity-related efforts. The divestitures, the capacity reductions and the cost control initiatives will result in the elimination of approximately 460 positions from the company after the completion of the European methylamines and derivatives business divestiture. Approximately 30% of the position reductions relates to capacity rationalization and divestitures. An additional 40% relates to ongoing productivity efforts and balancing engineering resources with project activity, and the remaining 30% relates to a reduction in the number of management positions. The 2003 Plan was completed as expected in June 2004 with the exception of the planned sale of the European methylamines and derivatives business. In April 2004, the company announced the proposed sale of this business, which is pending regulatory approval.
The following table presents the detail of expenses by seg-ment for the global cost reduction plan recorded in 2003:
Severance Pension Other(A) Total
Gases $ 27.1 $10.9 $54.2 $ 92.2
Chemicals 14.4 2.0 41.7 58.1
Equipment 2.2 .2 — 2.4
Provision for 2003 Plan $43.7 $13.1 $95.9 $152.7
Reversal of 2002 Plan (.2) — — (.2)
Net Expense in 2003 $43.5 $13.1 $95.9 $152.5(A) Asset impairments and related expenses are included in the other category.
2002 PlanIn 2002, the company recorded an expense of $30.8 for a global cost reduction plan (2002 Plan), including U.S. packaged gas divestiture-related reductions. This expense included $27.1 for severance and pension-related benefi ts and $3.7 for asset impairments related to the planned sale or closure of two small chemical facilities. The 2002 Plan included 333 position eliminations in the areas of manufac-turing, engineering, distribution and overheads. The 2002 Plan was completed as expected in March 2003.
The following table presents the detail of expenses by seg-ment for the global cost reduction plan recorded in 2002:
Severance Pension Other (A) Total
Gases $15.6 $10.6 $ — $26.2
Chemicals .8 .1 3.7 4.6
Provision for 2002 Plan $16.4 $10.7 $3.7 $30.8
Reversal of 2001 Plan (7.1) — (.6) (7.7)
Net Expense in 2002 $ 9.3 $10.7 $3.1 $ 23.1(A) Asset impairments and related expenses are included in the other category.
Plan AccrualThe following table summarizes changes to the carrying amount of the accrual for global cost reduction plans:
Balance as of Severance Pension Other (A) Total
30 September 2001 $ 49.1 $ — $ 1.5 $ 50.6
Provision 16.4 10.7 3.7 30.8
Noncash expenses — (10.7) (3.7) (14.4)
Cash expenditures (51.6) — (.9) (52.5)
Reverse 2001 Plan balance (7.1) — (.6) (7.7)
30 September 2002 $ 6.8 $ — $ — $ 6.8
Provision 43.7 13.1 95.9 152.7
Noncash expenses — (13.1) (90.1) (103.2)
Cash expenditures (11.7) — (1.7) (13.4)
Reverse 2002 Plan balance (.2) — — (.2)
30 September 2003 $38.6 $ — $ 4.1 $ 42.7
Transfers .9 — (.9) —
Cash expenditures (34.2) — (3.2) (37.4)
30 September 2004 $ 5.3 $ — $ — $ 5.3(A) Asset impairments and related expenses are included in the other category.
4. Acquisitions Acquisitions in 2004, totaling $84.6, included six small U.S. homecare businesses. Acquisitions in 2003, totaling $529.6, included Ashland’s Electronic Chemicals business, American Homecare Supply, LLC (AHS), additional small home-care businesses, and Sanwa Chemical Industry Co., Ltd. Acquisitions in 2002, totaling $114.8, principally included the purchase of an additional 22% of the outstanding shares of San Fu Gas Company, Ltd. (San Fu).
Acquisitions in 2004U.S. Homecare BusinessesDuring 2004, the company acquired six small U.S. home-care businesses for $75.1. Goodwill recognized in these transactions amounted to $61.1, of which $25.3 is deduct-ible for tax purposes. Identifi ed intangibles included in these transactions amounted to $9.2. These acquisitions contrib-uted $46.0 to sales in 2004.
50 Notes to the Consolidated Financial Statements continued
San FuIn February 2004, the company purchased an additional 4% ownership interest in San Fu.
Acquisitions in 2003Ashland’s Electronic Chemicals BusinessOn 29 August 2003, the company acquired the Electronic Chemicals business of Ashland Specialty Chemical Company, a division of Ashland Inc., in a cash transaction valued at $293.2. Goodwill recognized in this transaction amounted to $100.6, of which $21.3 is deductible for tax purposes. Identifi ed intangibles included in this transaction amounted to $27.1. Ashland’s Electronic Chemicals business is a leading global supplier of ultrapure specialty chemicals and services used by the electronics industry to make semi-conductor devices. With annual revenues of approximately $200, the Electronic Chemicals business of Ashland has a global network of sales and marketing offi ces in North America, Europe and Asia.
American Homecare Supply, LLC (AHS)In October 2002, the company acquired AHS, a homecare market leader throughout the northeastern United States, for $165.8. Subsequently, AHS acquired additional small homecare businesses for $52.3 and was renamed Air Products Healthcare. Goodwill recognized in these trans-actions amounted to $153.8, of which $102.1 is deductible for tax purposes. Identifi ed intangibles included in these transactions amounted to $20.7. These acquisitions con-tributed $155.9 to sales in 2003. Prior to these acquisitions, the company and its affi liates had a homecare position serv-ing approximately 180,000 patients in Europe. With these acquisitions, the company and its affi liates provide home medical services to more than 400,000 patients in 14 coun-tries, a signifi cant step in its strategy to be a global healthcare provider.
Acquisitions in 2002San Fu Gas Company, Ltd. (San Fu)In July 2002, the company purchased an additional 22% of the outstanding shares of San Fu, increasing its ownership interest from 48% to 70%. Since 1987, the company has had a joint venture ownership of San Fu, the largest industri-al gas company in Taiwan. San Fu is a full-service industrial gas and chemical company with a broad product portfolio, supplying specialty gases, electronic piping and equipment, liquid bulk gases, on-site/pipeline gases and chemicals to the Taiwan marketplace. This investment is consistent with the company’s strategy of investing in growth markets (Asia) and industries (electronics) and provides a stronger foundation for growth in both Taiwan and China.
As of 30 June 2002, the company accounted for its invest-ment in San Fu using the equity method. In July 2002, the company obtained control through the acquisition of an additional 22% of the outstanding shares and began to consolidate this investment. San Fu had revenues of approxi-mately $215 for the twelve months ended 30 September 2002. Goodwill recognized in this transaction amounted to $51.4, which was not deductible for tax purposes. Identifi ed intangibles included in this transaction amounted to $19.5. As part of this transaction, put options have been issued which give other shareholders the right to sell San Fu stock to the company at market price when exercised. The options are effective from January 2005 through January 2015 and allow for the sale of all stock owned by other shareholders to the company.
5. DivestituresDivestitures in 2003Sale of Canadian Packaged Gas BusinessOn 1 April 2003, the company completed the sale of the majority of its Canadian packaged gas business to the BOC Group for cash proceeds of $41.2.
Divestitures in 2002Sale of U.S. Packaged Gas BusinessOn 28 February 2002, the company completed the sale of the majority of its U.S. packaged gas business, excluding the electronic gases and magnetic resonance imaging-related helium operations, to Airgas, Inc. This sale included approxi-mately 100 facilities in 30 states associated with the fi lling and distribution of cylinders, liquid dewars, tube trailers and other containers of industrial gases and nonelectronic specialty gases and the retail selling of welding hard goods, including customer service centers, warehouses and other related assets. The company also sold its packaged gas opera-tions in the Carolinas and in southern Virginia to National Welders Supply Company, Inc., a joint venture between Airgas and the Turner family of Charlotte, N.C. For the fi ve months ended 28 February 2002, the assets sold generated revenues of approximately $100, with a modest contribution to operating income. These facilities employed 1,200 people. The cash proceeds from these transactions were $254.5. The results for 2002 included a gain of $55.7.
6. Financial InstrumentsCurrency Risk ManagementThe company does business in many foreign countries. Therefore, its earnings, cash fl ows and fi nancial position are exposed to foreign currency risk from foreign currency denominated transactions and net investments in foreign operations.
51
It is the policy of the company to minimize its cash fl ow exposure to adverse changes in currency and exchange rates. This is accomplished by identifying and evaluating the risk that the company’s cash fl ows will decline in value due to changes in exchange rates, and by determining the appro-priate strategies necessary to manage such exposures. The company’s objective is to maintain economically balanced currency risk management strategies that provide adequate downside protection.
The company enters into a variety of foreign exchange con-tracts, including forward, option combination and purchased option contracts, to hedge its exposure to fl uctuations in foreign currency exchange rates. These agreements generally involve the exchange of one currency for a second currency at some future date.
The company enters into foreign exchange contracts, includ-ing forward, option combination and purchased option con-tracts, to reduce the cash fl ow exposure to foreign currency fl uctuations associated with certain monetary assets and liabilities, as well as highly anticipated cash fl ows and certain fi rm commitments. Examples of such exposures are the pur-chase of plant and equipment and export sales transactions. Forward exchange contracts are also used to hedge the value of investments in certain foreign subsidiaries and affi liates by creating a liability in a currency in which the company has a net equity position. The company also uses foreign currency denominated debt to hedge certain net investments in and future cash fl ows from foreign operations.
Certain forward exchange contracts entered into by the com-pany are not designated as hedging instruments. Contracts used to hedge the exposure to foreign currency fl uctuations associated with certain monetary assets and liabilities are not designated as hedging instruments, and changes in the fair value of these items are recorded in earnings to offset the foreign exchange gains and losses of the monetary assets and liabilities. Other forward exchange contracts may be used to economically hedge foreign currency exposures and not be designated as hedging instruments due to the immaterial amount of the underlying hedged exposures. Changes in the fair value of these contracts are also recorded in earnings.
Debt Portfolio ManagementIt is the policy of the company to identify on a continuing basis the need for debt capital and evaluate the fi nancial risks inherent in funding the company with debt capital. Refl ecting the result of this ongoing review, the debt portfo-lio and hedging program of the company is managed with the objectives and intent to (1) reduce funding risk with respect to borrowings made or to be made by the company to preserve the company’s access to debt capital and provide debt capital as required for funding and liquidity purposes,
and (2) manage the aggregate interest rate risk of the debt portfolio in accordance with certain debt management parameters.
The company enters into interest rate swap agreements to change the fi xed/variable interest rate mix of its debt port-folio in order to maintain the percentage of fi xed- and variable-rate debt within the parameters set by management. In accordance with these parameters, the agreements are used to reduce interest rate risks and costs inherent in the compa-ny’s debt portfolio. The notional amount of these agreements is equal to or less than the designated debt instrument being hedged. The variable rate indices of the swap instruments and the debt to which they are designated are the same. It is the company’s policy not to enter into any interest rate swap contracts which lever a move in interest rates on a greater than one-to-one basis.
The company is also party to cross currency interest rate swap contracts. These contracts entail both the exchange of fi xed- and fl oating-rate interest payments periodically over the life of the agreement and the exchange of one cur-rency for another currency at inception and at a specifi ed future date. These contracts effectively convert the currency denomination of a debt instrument into another currency in which the company has a net equity position while changing the interest rate characteristics of the instrument. The con-tracts are used to hedge intercompany and third-party bor-rowing transactions and certain net investments in foreign operations.
Fair Value HedgesFor the years ended 30 September 2004 and 2003, there was no material gain or loss recognized in earnings resulting from hedge ineffectiveness or from excluding a portion of deriva-tive instruments’ gain or loss from the assessment of hedge effectiveness related to derivatives designated as fair value hedges. Also, the amount recognized in earnings in 2004 and 2003 as a result of a hedged fi rm commitment no longer qualifying as a fair value hedge was not material.
Cash Flow HedgesFor the years ended 30 September 2004 and 2003, there was no material gain or loss recognized in earnings resulting from hedge ineffectiveness or from excluding a portion of deriva-tive instruments’ gain or loss from the assessment of hedge effectiveness related to derivatives designated as cash fl ow hedges.
The amount reclassifi ed from accumulated other com-prehensive income into earnings as a result of the discon-tinuance of foreign currency cash fl ow hedges due to the probability of the original forecasted transactions not occur-ring by the original specifi ed time period was not material
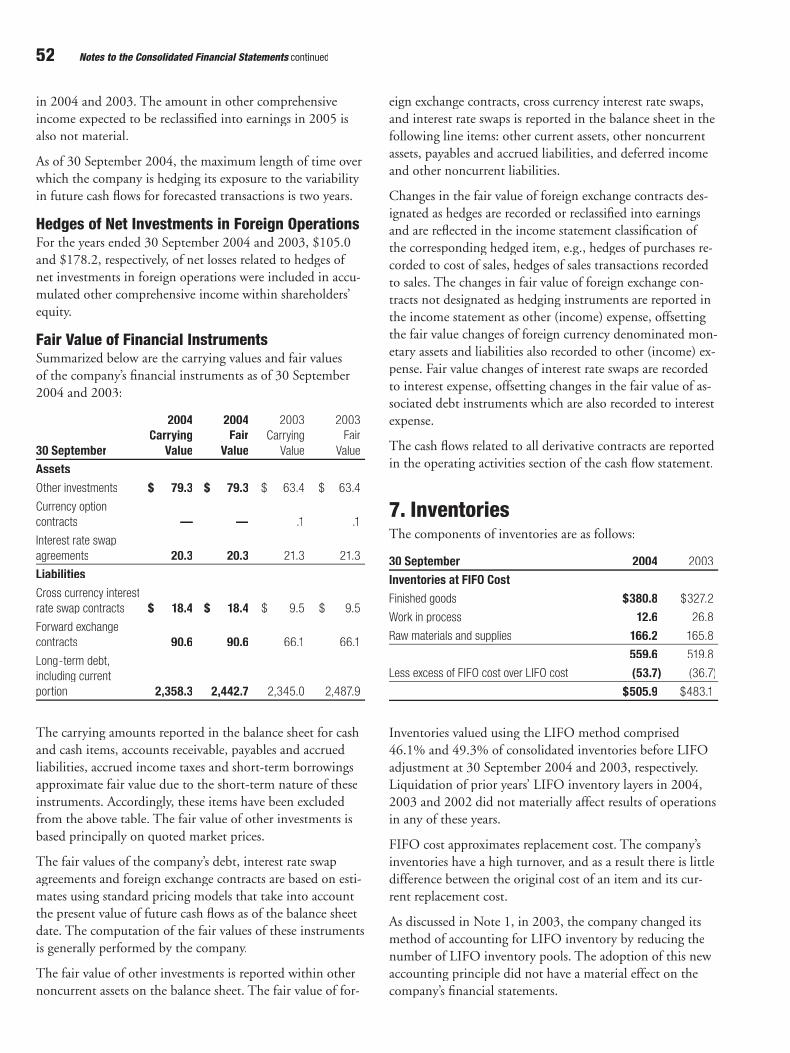
52 Notes to the Consolidated Financial Statements continued
in 2004 and 2003. The amount in other comprehensive income expected to be reclassifi ed into earnings in 2005 is also not material.
As of 30 September 2004, the maximum length of time over which the company is hedging its exposure to the variability in future cash fl ows for forecasted transactions is two years.
Hedges of Net Investments in Foreign OperationsFor the years ended 30 September 2004 and 2003, $105.0 and $178.2, respectively, of net losses related to hedges of net investments in foreign operations were included in accu-mulated other comprehensive income within shareholders’ equity.
Fair Value of Financial Instruments Summarized below are the carrying values and fair values of the company’s fi nancial instruments as of 30 September 2004 and 2003:
2004 2004 2003 2003 Carrying Fair Carrying Fair30 September Value Value Value Value
Assets Other investments $ 79.3 $ 79.3 $ 63.4 $ 63.4
Currency option contracts — — .1 .1
Interest rate swap agreements 20.3 20.3 21.3 21.3
LiabilitiesCross currency interestrate swap contracts $ 18.4 $ 18.4 $ 9.5 $ 9.5
Forward exchange contracts 90.6 90.6 66.1 66.1
Long-term debt, including current portion 2,358.3 2,442.7 2,345.0 2,487.9
The carrying amounts reported in the balance sheet for cash and cash items, accounts receivable, payables and accrued liabilities, accrued income taxes and short-term borrowings approximate fair value due to the short-term nature of these instruments. Accordingly, these items have been excluded from the above table. The fair value of other investments is based principally on quoted market prices.
The fair values of the company’s debt, interest rate swap agreements and foreign exchange contracts are based on esti-mates using standard pricing models that take into account the present value of future cash fl ows as of the balance sheet date. The computation of the fair values of these instruments is generally performed by the company.
The fair value of other investments is reported within other noncurrent assets on the balance sheet. The fair value of for-
eign exchange contracts, cross currency interest rate swaps, and interest rate swaps is reported in the balance sheet in the following line items: other current assets, other noncurrent assets, payables and accrued liabilities, and deferred income and other noncurrent liabilities.
Changes in the fair value of foreign exchange contracts des-ignated as hedges are recorded or reclassifi ed into earnings and are refl ected in the income statement classifi cation of the corresponding hedged item, e.g., hedges of purchases re-corded to cost of sales, hedges of sales transactions recorded to sales. The changes in fair value of foreign exchange con-tracts not designated as hedging instruments are reported in the income statement as other (income) expense, offsetting the fair value changes of foreign currency denominated mon-etary assets and liabilities also recorded to other (income) ex-pense. Fair value changes of interest rate swaps are recorded to interest expense, offsetting changes in the fair value of as-sociated debt instruments which are also recorded to interest expense.
The cash fl ows related to all derivative contracts are reported in the operating activities section of the cash fl ow statement.
7. InventoriesThe components of inventories are as follows:
30 September 2004 2003
Inventories at FIFO CostFinished goods $380.8 $327.2
Work in process 12.6 26.8
Raw materials and supplies 166.2 165.8
559.6 519.8
Less excess of FIFO cost over LIFO cost (53.7) (36.7)
$505.9 $483.1
Inventories valued using the LIFO method comprised 46.1% and 49.3% of consolidated inventories before LIFO adjustment at 30 September 2004 and 2003, respectively. Liquidation of prior years’ LIFO inventory layers in 2004, 2003 and 2002 did not materially affect results of operations in any of these years.
FIFO cost approximates replacement cost. The company’s inventories have a high turnover, and as a result there is little difference between the original cost of an item and its cur-rent replacement cost.
As discussed in Note 1, in 2003, the company changed its method of accounting for LIFO inventory by reducing the number of LIFO inventory pools. The adoption of this new accounting principle did not have a material effect on the company’s fi nancial statements.

53
8. Summarized Financial Information of Equity AffiliatesThe following table presents summarized fi nancial informa-tion on a combined 100% basis of the principal companies accounted for by the equity method. Amounts presented include the accounts of the following equity affi liates: Air Products South Africa (50%); Bangkok Cogeneration Company Limited (48.8%); Bangkok Industrial Gases Company Ltd. (50.6%); Daido Air Products Electronics, Inc. (49%); DuPont Air Products Nanomaterials, LLC (50%); Europoort Utility Partners V.O.F. (50%); Helap S.A. (50%); INFRA Group (40%); INOX Air Products Limited (INOX) (49.6%); Island Pipeline Gas (33%); Pure Air on the Lake, L.P. (50%); Sapio Produzione Idrogeno Ossigeno S.r.L. (49%); SembCorp Air Products (HyCo) Pte. Ltd. (40%); Stockton CoGen Company (50%); Tyczka Industrie-Gases GmbH (50%); Wacker Polymer Systems GmbH & CoKG (20%); and principally, other industrial gas producers.
2004 2003
Current assets $ 868.8 $ 732.7
Noncurrent assets 1,499.4 1,449.3
Current liabilities 508.5 537.5
Noncurrent liabilities 626.7 526.3
Net sales 1,879.7 1,617.8
Sales less cost of sales 717.2 601.9
Net income 240.0 171.7
In 2003, the company recorded favorable adjustments of $22.7 related to prior period divestitures. Dividends received from equity affi liates were $46.4, $64.1 and $42.0 in 2004, 2003 and 2002, respectively.
The investment in net assets of and advances to equity affi li-ates as of 30 September 2004 and 2003 included investment in foreign affi liates of $589.7 and $518.3, respectively.
As of 30 September 2004 and 2003, the amount of invest-ment in companies accounted for by the equity method included goodwill in the amount of $66.9 and $67.7, respectively.
9. Plant and EquipmentThe major classes of plant and equipment, at cost, are as follows:
30 September 2004 2003
Land $ 165.6 $ 164.8
Buildings 789.8 800.8
Gas generating and chemical facilities,machinery and equipment 10,842.8 10,386.8
Construction in progress 403.3 370.8
$12,201.5 $11,723.2
10. GoodwillChanges to the carrying amount of consolidated goodwill by segment are as follows:
Balance as of Gases Chemicals Equipment Total
30 September 2002 $332.1 $89.6 $ 9.4 $ 431.1
Acquisitions and adjustments 251.3 2.7 — 254.0
Goodwill related to the sale of Canadian packaged gas business (9.7) — — (9.7)
Currency translation and other 45.5 4.6 .3 50.4
30 September 2003 $619.2 $96.9 $ 9.7 $725.8
Acquisitions and adjustments 78.8 (.7) — 78.1
Currency translation and other 23.2 3.1 .3 26.6
30 September 2004 $721.2 $99.3 $10.0 $830.5
The 2004 increase in goodwill was principally due to the acquisition of several small U.S. homecare businesses and a 4% increase in ownership of San Fu. In 2003, the increase in goodwill was principally due to the acquisitions of AHS and other U.S. homecare businesses, and Ashland Electronic Chemicals.
The company conducted the required annual test of good-will for impairment in the fourth quarter of 2004. There were no indications of impairment.

54 Notes to the Consolidated Financial Statements continued
11. Intangible AssetsAll acquired intangible assets are subject to amortization. No residual value is estimated for these intangible assets. Acquired intangible assets are as follows:
Accumulated Gross Amortization Net
Customer relationships $ 95.0 $ 27.4 $ 67.6
Patents and technology 70.0 46.9 23.1
Noncompete covenants 15.7 12.1 3.6
Other 25.6 15.8 9.8
30 September 2003 $206.3 $102.2 $104.1
Customer relationships $ 107.3 $ 36.7 $ 70.6
Patents and technology 59.6 40.4 19.2
Noncompete covenants 9.5 6.6 2.9
Other 25.3 16.6 8.7
30 September 2004 $ 201.7 $100.3 $101.4
In 2004, the decrease in intangible assets was due to the expiration of technology agreements and noncompete covenants which more than offset the additional customer relationships related to the acquisition of several small U.S. homecare businesses.
Amortization expense for intangible assets was $18.9, $14.6 and $10.1 in 2004, 2003 and 2002, respectively. Projected annual amortization expense for intangible assets as of 30 September 2004 is as follows:
2005 $ 19.1
2006 18.8
2007 16.8
2008 15.5
2009 11.1
Thereafter 20.1
Total $101.4
12. Long-Term DebtThe following table shows the company’s outstanding debt at the end of 2004 and 2003:
30 September Maturities 2004 2003
Payable in U.S. Dollars:
Debentures: (effective rate)
8.50% (8.55%) 2006 $ — $ 100.0
8.75% (8.95%) 2021 18.4 18.4
Notes: (effective rate)
7.375% (7.54%) 2005 150.0 150.0
Medium-term notes:
Weighted average rate
Series D 6.7% 2007 to 2016 134.0 223.0
Series E 7.6% 2008 to 2026 17.4 17.4
Series F 6.5% 2007 to 2010 133.0 133.0
Series G 4.1% 2010 125.0 —
Other: 2% 2006 to 2038 363.9 348.0
Less: Unamortized discount (12.8) (1.8)
Payable in Other Currencies:
Eurobonds 6.0% 2005 348.9 571.7
Eurobonds 6.5% 2007 372.8 350.1
Eurobonds 4.25% 2012 372.8 —
Other 4.1% 2005 to 2014 287.0 383.4
Capital Lease Obligations:
United States 5.4% 2005 to 2018 17.6 17.0
Foreign 6.5% 2005 to 2007 30.3 34.8
$2,358.3 $2,345.0
Less current portion (244.7) (176.4)
$ 2,113.6 $ 2,168.6
Various debt agreements to which the company is a party include certain fi nancial covenants and other restrictions, including restrictions pertaining to the ability to create prop-erty liens and enter into certain sale and leaseback transac-tions. The company is in compliance with all fi nancial debt covenants.
The company has obtained the commitment of a number of commercial banks to lend money at market rates whenever needed. These committed lines of credit are also used to support the issuance of commercial paper. At 30 September 2004, the company’s committed lines of credit totaled $700, maturing in December 2008. No borrowings were outstand-ing under these commitments at the end of 2004. Additional commitments of $49.6 are maintained by the company’s for-eign subsidiaries, of which $8.7 was borrowed and outstand-ing at 30 September 2004.
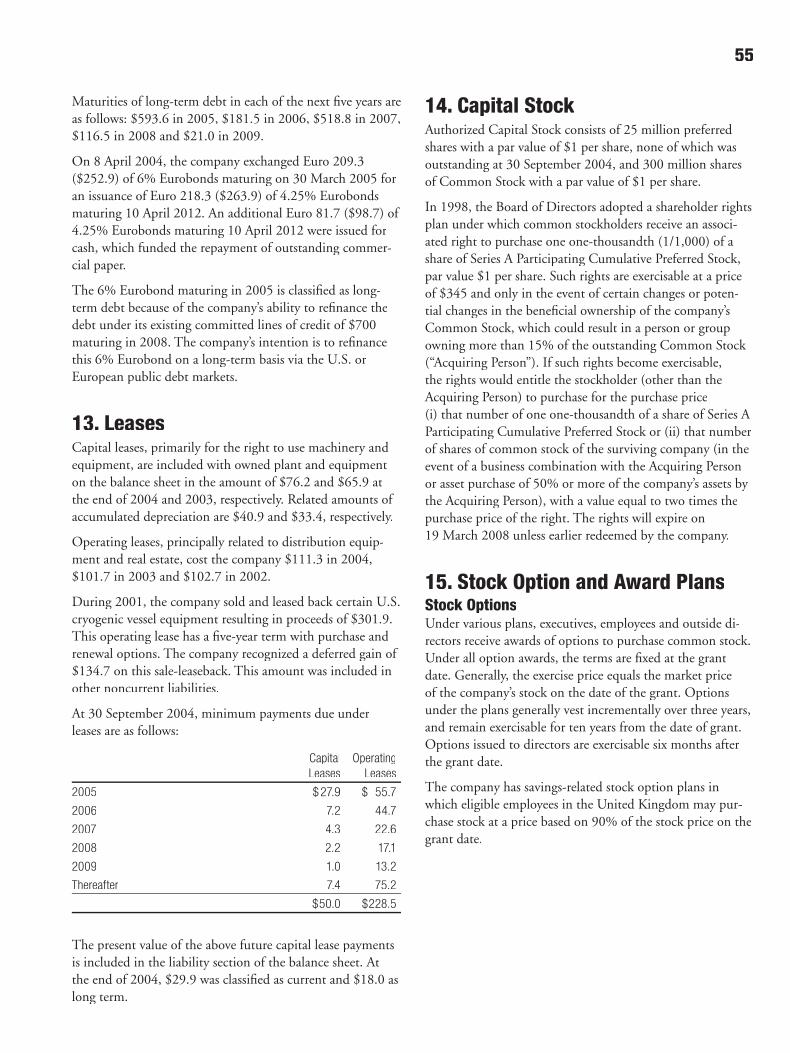
55
Maturities of long-term debt in each of the next fi ve years are as follows: $593.6 in 2005, $181.5 in 2006, $518.8 in 2007, $116.5 in 2008 and $21.0 in 2009.
On 8 April 2004, the company exchanged Euro 209.3 ($252.9) of 6% Eurobonds maturing on 30 March 2005 for an issuance of Euro 218.3 ($263.9) of 4.25% Eurobonds maturing 10 April 2012. An additional Euro 81.7 ($98.7) of 4.25% Eurobonds maturing 10 April 2012 were issued for cash, which funded the repayment of outstanding commer-cial paper.
The 6% Eurobond maturing in 2005 is classifi ed as long-term debt because of the company’s ability to refi nance the debt under its existing committed lines of credit of $700 maturing in 2008. The company’s intention is to refi nance this 6% Eurobond on a long-term basis via the U.S. or European public debt markets.
13. LeasesCapital leases, primarily for the right to use machinery and equipment, are included with owned plant and equipment on the balance sheet in the amount of $76.2 and $65.9 at the end of 2004 and 2003, respectively. Related amounts of accumulated depreciation are $40.9 and $33.4, respectively.
Operating leases, principally related to distribution equip-ment and real estate, cost the company $111.3 in 2004, $101.7 in 2003 and $102.7 in 2002.
During 2001, the company sold and leased back certain U.S. cryogenic vessel equipment resulting in proceeds of $301.9. This operating lease has a fi ve-year term with purchase and renewal options. The company recognized a deferred gain of $134.7 on this sale-leaseback. This amount was included in other noncurrent liabilities.
At 30 September 2004, minimum payments due under leases are as follows:
Capital Operating Leases Leases
2005 $ 27.9 $ 55.7
2006 7.2 44.7
2007 4.3 22.6
2008 2.2 17.1
2009 1.0 13.2
Thereafter 7.4 75.2
$50.0 $228.5
The present value of the above future capital lease payments is included in the liability section of the balance sheet. At the end of 2004, $29.9 was classifi ed as current and $18.0 as long term.
14. Capital StockAuthorized Capital Stock consists of 25 million preferred shares with a par value of $1 per share, none of which was outstanding at 30 September 2004, and 300 million shares of Common Stock with a par value of $1 per share.
In 1998, the Board of Directors adopted a shareholder rights plan under which common stockholders receive an associ-ated right to purchase one one-thousandth (1/1,000) of a share of Series A Participating Cumulative Preferred Stock, par value $1 per share. Such rights are exercisable at a price of $345 and only in the event of certain changes or poten-tial changes in the benefi cial ownership of the company’s Common Stock, which could result in a person or group owning more than 15% of the outstanding Common Stock (“Acquiring Person”). If such rights become exercisable, the rights would entitle the stockholder (other than the Acquiring Person) to purchase for the purchase price (i) that number of one one-thousandth of a share of Series A Participating Cumulative Preferred Stock or (ii) that number of shares of common stock of the surviving company (in the event of a business combination with the Acquiring Person or asset purchase of 50% or more of the company’s assets by the Acquiring Person), with a value equal to two times the purchase price of the right. The rights will expire on 19 March 2008 unless earlier redeemed by the company.
15. Stock Option and Award PlansStock OptionsUnder various plans, executives, employees and outside di-rectors receive awards of options to purchase common stock. Under all option awards, the terms are fi xed at the grant date. Generally, the exercise price equals the market price of the company’s stock on the date of the grant. Options under the plans generally vest incrementally over three years, and remain exercisable for ten years from the date of grant. Options issued to directors are exercisable six months after the grant date.
The company has savings-related stock option plans in which eligible employees in the United Kingdom may pur-chase stock at a price based on 90% of the stock price on the grant date.
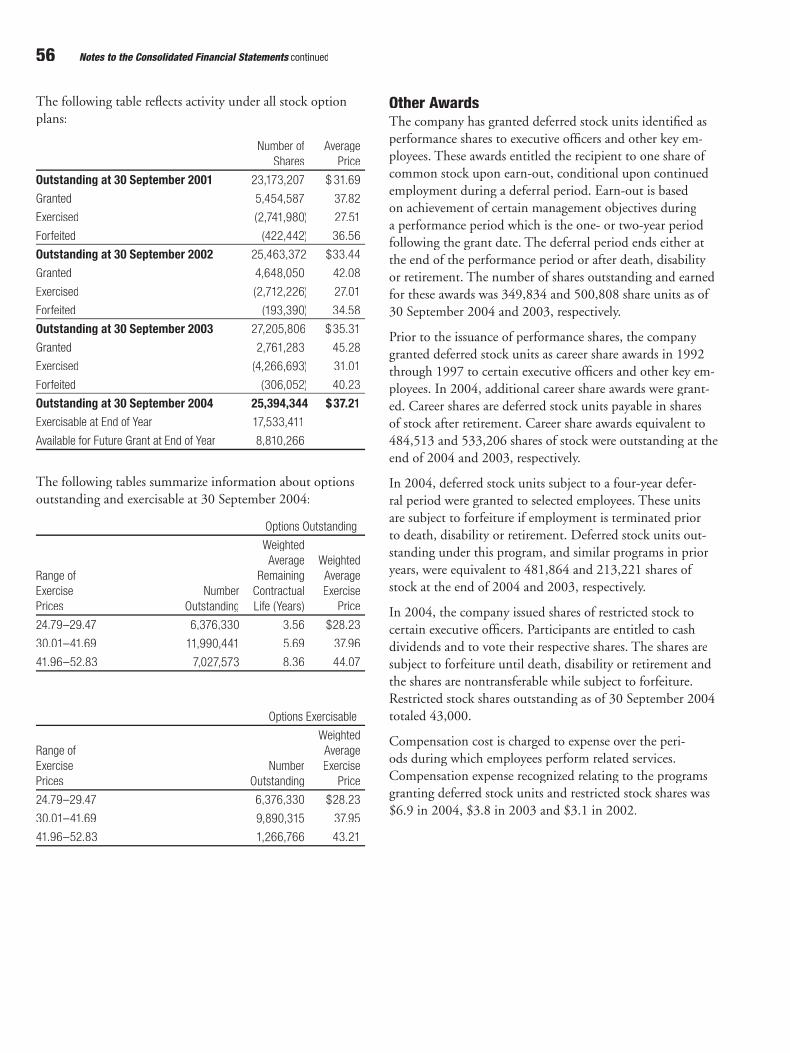
56 Notes to the Consolidated Financial Statements continued
The following table refl ects activity under all stock option plans:
Number of Average Shares Price
Outstanding at 30 September 2001 23,173,207 $ 31.69
Granted 5,454,587 37.82
Exercised (2,741,980) 27.51
Forfeited (422,442) 36.56
Outstanding at 30 September 2002 25,463,372 $33.44
Granted 4,648,050 42.08
Exercised (2,712,226) 27.01
Forfeited (193,390) 34.58
Outstanding at 30 September 2003 27,205,806 $35.31
Granted 2,761,283 45.28
Exercised (4,266,693) 31.01
Forfeited (306,052) 40.23
Outstanding at 30 September 2004 25,394,344 $ 37.21Exercisable at End of Year 17,533,411
Available for Future Grant at End of Year 8,810,266
The following tables summarize information about options outstanding and exercisable at 30 September 2004:
Options Outstanding
Weighted Average WeightedRange of Remaining AverageExercise Number Contractual ExercisePrices Outstanding Life (Years) Price
24.79–29.47 6,376,330 3.56 $28.23
30.01–41.69 11,990,441 5.69 37.96
41.96–52.83 7,027,573 8.36 44.07
Options Exercisable
WeightedRange of AverageExercise Number ExercisePrices Outstanding Price
24.79–29.47 6,376,330 $28.23
30.01–41.69 9,890,315 37.95
41.96–52.83 1,266,766 43.21
Other AwardsThe company has granted deferred stock units identifi ed as performance shares to executive offi cers and other key em-ployees. These awards entitled the recipient to one share of common stock upon earn-out, conditional upon continued employment during a deferral period. Earn-out is based on achievement of certain management objectives during a performance period which is the one- or two-year period following the grant date. The deferral period ends either at the end of the performance period or after death, disability or retirement. The number of shares outstanding and earned for these awards was 349,834 and 500,808 share units as of 30 September 2004 and 2003, respectively.
Prior to the issuance of performance shares, the company granted deferred stock units as career share awards in 1992 through 1997 to certain executive offi cers and other key em-ployees. In 2004, additional career share awards were grant-ed. Career shares are deferred stock units payable in shares of stock after retirement. Career share awards equivalent to 484,513 and 533,206 shares of stock were outstanding at the end of 2004 and 2003, respectively.
In 2004, deferred stock units subject to a four-year defer-ral period were granted to selected employees. These units are subject to forfeiture if employment is terminated prior to death, disability or retirement. Deferred stock units out-standing under this program, and similar programs in prior years, were equivalent to 481,864 and 213,221 shares of stock at the end of 2004 and 2003, respectively.
In 2004, the company issued shares of restricted stock to certain executive offi cers. Participants are entitled to cash dividends and to vote their respective shares. The shares are subject to forfeiture until death, disability or retirement and the shares are nontransferable while subject to forfeiture. Restricted stock shares outstanding as of 30 September 2004 totaled 43,000.
Compensation cost is charged to expense over the peri-ods during which employees perform related services. Compensation expense recognized relating to the programs granting deferred stock units and restricted stock shares was $6.9 in 2004, $3.8 in 2003 and $3.1 in 2002.
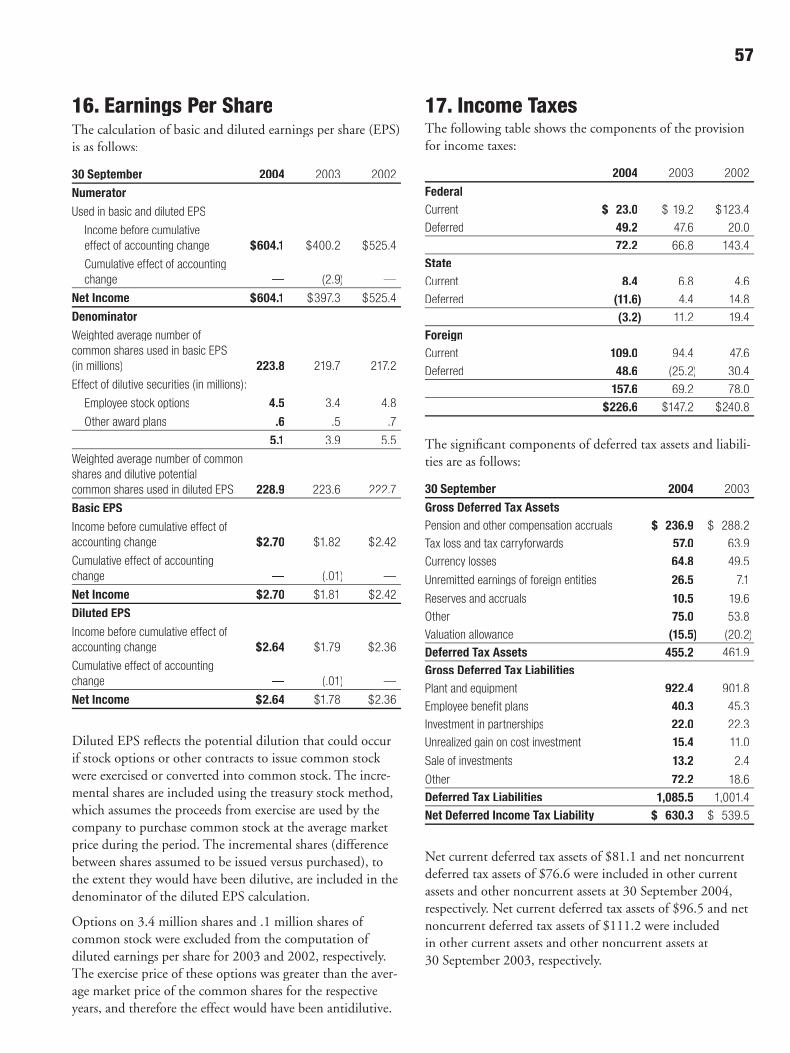
57
16. Earnings Per ShareThe calculation of basic and diluted earnings per share (EPS) is as follows:
30 September 2004 2003 2002
NumeratorUsed in basic and diluted EPS
Income before cumulative effect of accounting change $604.1 $400.2 $525.4
Cumulative effect of accounting change — (2.9) —
Net Income $604.1 $397.3 $525.4
Denominator Weighted average number of common shares used in basic EPS (in millions) 223.8 219.7 217.2
Effect of dilutive securities (in millions):
Employee stock options 4.5 3.4 4.8
Other award plans .6 .5 .7
5.1 3.9 5.5
Weighted average number of common shares and dilutive potential common shares used in diluted EPS 228.9 223.6 222.7
Basic EPSIncome before cumulative effect of accounting change $2.70 $1.82 $2.42
Cumulative effect of accounting change — (.01) —
Net Income $2.70 $1.81 $2.42
Diluted EPSIncome before cumulative effect of accounting change $2.64 $1.79 $2.36
Cumulative effect of accounting change — (.01) —
Net Income $2.64 $1.78 $2.36
Diluted EPS refl ects the potential dilution that could occur if stock options or other contracts to issue common stock were exercised or converted into common stock. The incre-mental shares are included using the treasury stock method, which assumes the proceeds from exercise are used by the company to purchase common stock at the average market price during the period. The incremental shares (difference between shares assumed to be issued versus purchased), to the extent they would have been dilutive, are included in the denominator of the diluted EPS calculation.
Options on 3.4 million shares and .1 million shares of common stock were excluded from the computation of diluted earnings per share for 2003 and 2002, respectively. The exercise price of these options was greater than the aver-age market price of the common shares for the respective years, and therefore the effect would have been antidilutive.
17. Income TaxesThe following table shows the components of the provision for income taxes:
2004 2003 2002
FederalCurrent $ 23.0 $ 19.2 $123.4
Deferred 49.2 47.6 20.0
72.2 66.8 143.4
StateCurrent 8.4 6.8 4.6
Deferred (11.6) 4.4 14.8
(3.2) 11.2 19.4
ForeignCurrent 109.0 94.4 47.6
Deferred 48.6 (25.2) 30.4
157.6 69.2 78.0
$226.6 $147.2 $240.8
The signifi cant components of deferred tax assets and liabili-ties are as follows:
30 September 2004 2003
Gross Deferred Tax AssetsPension and other compensation accruals $ 236.9 $ 288.2
Tax loss and tax carryforwards 57.0 63.9
Currency losses 64.8 49.5
Unremitted earnings of foreign entities 26.5 7.1
Reserves and accruals 10.5 19.6
Other 75.0 53.8
Valuation allowance (15.5) (20.2)
Deferred Tax Assets 455.2 461.9
Gross Deferred Tax LiabilitiesPlant and equipment 922.4 901.8
Employee benefit plans 40.3 45.3
Investment in partnerships 22.0 22.3
Unrealized gain on cost investment 15.4 11.0
Sale of investments 13.2 2.4
Other 72.2 18.6
Deferred Tax Liabilities 1,085.5 1,001.4
Net Deferred Income Tax Liability $ 630.3 $ 539.5
Net current deferred tax assets of $81.1 and net noncurrent deferred tax assets of $76.6 were included in other current assets and other noncurrent assets at 30 September 2004, respectively. Net current deferred tax assets of $96.5 and net noncurrent deferred tax assets of $111.2 were included in other current assets and other noncurrent assets at 30 September 2003, respectively.
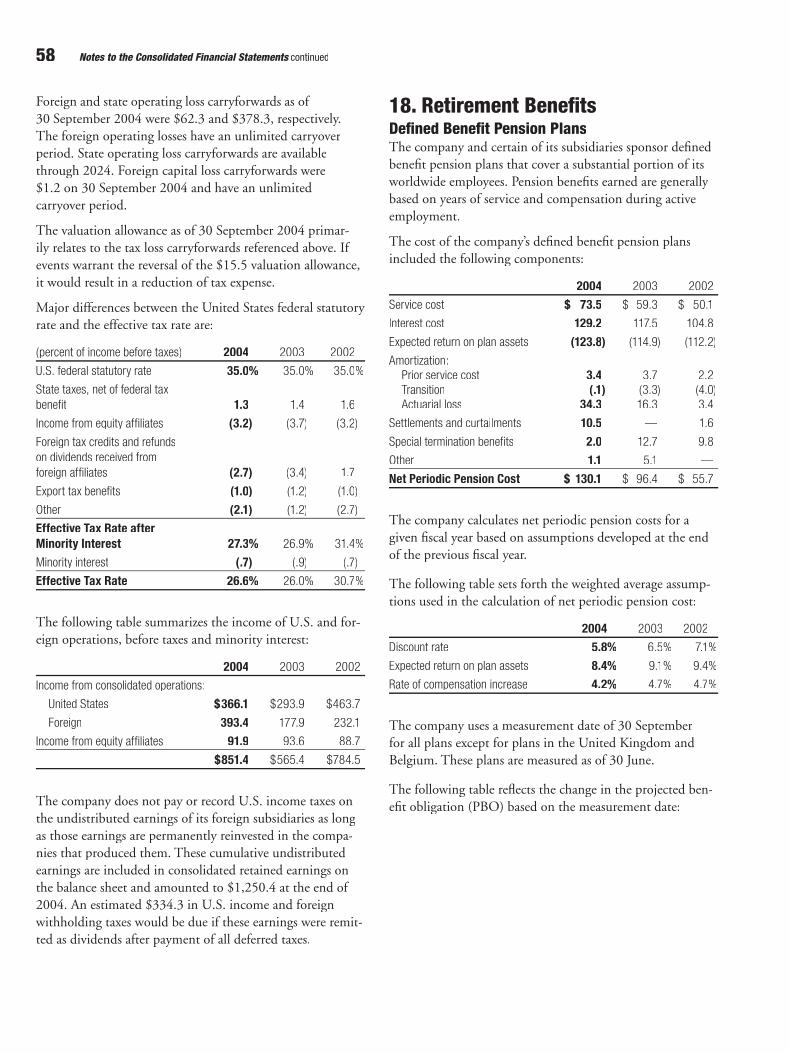
58 Notes to the Consolidated Financial Statements continued
Foreign and state operating loss carryforwards as of 30 September 2004 were $62.3 and $378.3, respectively. The foreign operating losses have an unlimited carryover period. State operating loss carryforwards are available through 2024. Foreign capital loss carryforwards were $1.2 on 30 September 2004 and have an unlimited carryover period.
The valuation allowance as of 30 September 2004 primar-ily relates to the tax loss carryforwards referenced above. If events warrant the reversal of the $15.5 valuation allowance, it would result in a reduction of tax expense.
Major differences between the United States federal statutory rate and the effective tax rate are:
(percent of income before taxes) 2004 2003 2002
U.S. federal statutory rate 35.0% 35.0% 35.0%
State taxes, net of federal tax benefit 1.3 1.4 1.6
Income from equity affiliates (3.2) (3.7) (3.2)
Foreign tax credits and refundson dividends received from foreign affiliates (2.7) (3.4) 1.7
Export tax benefits (1.0) (1.2) (1.0)
Other (2.1) (1.2) (2.7)
Effective Tax Rate after Minority Interest 27.3% 26.9% 31.4%
Minority interest (.7) (.9) (.7)
Effective Tax Rate 26.6% 26.0% 30.7%
The following table summarizes the income of U.S. and for-eign operations, before taxes and minority interest:
2004 2003 2002
Income from consolidated operations:
United States $366.1 $293.9 $463.7
Foreign 393.4 177.9 232.1
Income from equity affiliates 91.9 93.6 88.7
$851.4 $565.4 $784.5
The company does not pay or record U.S. income taxes on the undistributed earnings of its foreign subsidiaries as long as those earnings are permanently reinvested in the compa-nies that produced them. These cumulative undistributed earnings are included in consolidated retained earnings on the balance sheet and amounted to $1,250.4 at the end of 2004. An estimated $334.3 in U.S. income and foreign withholding taxes would be due if these earnings were remit-ted as dividends after payment of all deferred taxes.
18. Retirement BenefitsDefined Benefit Pension PlansThe company and certain of its subsidiaries sponsor defi ned benefi t pension plans that cover a substantial portion of its worldwide employees. Pension benefi ts earned are generally based on years of service and compensation during active employment.
The cost of the company’s defi ned benefi t pension plans included the following components:
2004 2003 2002
Service cost $ 73.5 $ 59.3 $ 50.1
Interest cost 129.2 117.5 104.8
Expected return on plan assets (123.8) (114.9) (112.2)
Amortization: Prior service cost 3.4 3.7 2.2 Transition (.1) (3.3) (4.0) Actuarial loss 34.3 16.3 3.4
Settlements and curtailments 10.5 — 1.6
Special termination benefits 2.0 12.7 9.8
Other 1.1 5.1 —
Net Periodic Pension Cost $ 130.1 $ 96.4 $ 55.7
The company calculates net periodic pension costs for a given fi scal year based on assumptions developed at the end of the previous fi scal year.
The following table sets forth the weighted average assump-tions used in the calculation of net periodic pension cost:
2004 2003 2002
Discount rate 5.8% 6.5% 7.1%
Expected return on plan assets 8.4% 9.1% 9.4%
Rate of compensation increase 4.2% 4.7% 4.7%
The company uses a measurement date of 30 September for all plans except for plans in the United Kingdom and Belgium. These plans are measured as of 30 June.
The following table refl ects the change in the projected ben-efi t obligation (PBO) based on the measurement date:

59
2004 2003
Obligation at Beginning of Year $ 2,215.1 $1,780.1
Service cost 73.5 59.3
Interest cost 129.2 117.5
Amendments .9 10.2
Actuarial (gain) loss (17.3) 247.8
Special termination benefits, settlements and curtailments (23.1) 12.5
Participant contributions 7.4 7.9
Benefits paid (76.0) (70.9)
Currency translation/other 80.0 50.7
Obligation at End of Year $2,389.7 $2,215.1
The PBO is the actuarial present value of benefi ts attribut-able to employee service rendered to date, including the ef-fects of estimated future salary increases.
The following table sets forth the weighted average assump-tions used in the calculation of the PBO:
2004 2003
Discount rate 5.9% 5.8%Rate of compensation increase 4.2% 4.2%
The assets of the company’s defi ned benefi t pension plans consist primarily of equity and fi xed income securities. Except where the company’s equity is a component of an index fund, the plans are prohibited from holding shares of company stock.
Asset allocation targets are established based on the long-term return and volatility characteristics of the investment classes and recognize the benefi t of diversifi cation and the profi les of the plans’ liabilities. The actual and target alloca-tions at the measurement date are as follows:
2004 2004 2003 Target Actual ActualAsset Category Allocation Allocation Allocation
Equity securities 67–73% 68% 71%
Debt securities 20–30 27 23
Real estate 4–8 4 5
Other 0–5 1 1
Total 100% 100%
The company employs a mix of active and passive invest-ment strategies. Over a full market cycle, the total return of plan assets is expected to exceed that of an index tracking the returns achievable with a passive strategy in each asset category.
The company anticipates contributing approximately $80 to the pension plans in 2005.
The following table summarizes the change in the fair value of assets of the pension plans based on the measurement date:
2004 2003
Beginning of Year $ 1,147.5 $1,012.5
Actual return on plan assets 146.9 104.5
Company contributions 270.8 61.6
Participant contributions 7.4 7.9
Benefits paid (76.0) (70.9)
Settlements (24.1) —
Currency translation/other 38.4 31.9
End of Year $1,510.9 $ 1,147.5
To the extent the expected return on plan assets varies from the actual return, an actuarial gain or loss results.
The expected return on plan asset assumption is based on an estimated weighted average of long-term returns of major asset classes. In determining asset class returns, the company takes into account long-term returns of major asset classes, historical performance of plan assets and related value added of active management, as well as the current interest rate environment. Asset allocation is determined by an asset/liability study that takes into account plan demographics, asset returns and acceptable levels of risk.
Projected benefi t payments, which refl ect expected future service, are as follows:
2005 $ 80.8
2006 79.9
2007 85.8
2008 89.3
2009 94.4
2010–2014 557.0
These estimated benefi t payments are based on assumptions about future events. Actual benefi t payments may vary sig-nifi cantly from these estimates.
The funded status of the pension plans (plan assets less pro-jected benefi t obligation) reconciled to the amount recog-nized in the balance sheet is as follows:
2004 2003
Funded status $(878.8) $(1,067.6)
Unrecognized actuarial loss 815.1 866.6
Unrecognized prior service cost 19.9 23.0
Unrecognized net transition liability .6 .7
Employer contributions for U.K. and Belgium after the measurement date 6.2 —
Net Amount Recognized $ (37.0) $ (177.3)

60 Notes to the Consolidated Financial Statements continued
The unrecognized actuarial loss represents the actual changes in the estimated obligation and plan assets that have not yet been recognized in either the balance sheet or income statement. Actuarial gains and losses are not recognized im-mediately, but instead are accumulated as a part of the un-recognized net loss balance and amortized into net periodic pension cost over the average remaining service period of participating employees as certain thresholds are met.
The accumulated benefi t obligation (ABO) is the actuarial present value of benefi ts attributed to employee service ren-dered to date, but does not include the effects of future pay. At a minimum, the consolidated balance sheet as of the fi scal year end should refl ect an amount equal to the unfunded ABO.
The accumulated benefi t obligation for all pension plans was $1,961.5 and $1,815.8 at the end of 2004 and 2003, respectively.
The following table provides information on pension plans where the ABO exceeds the value of plan assets:
2004 2003
PBO $2,370.2 $2,141.0
ABO 1,948.3 1,758.4
Plan assets 1,493.2 1,072.6
Included in the table above are several pension arrangements that are not funded because of jurisdictional practice. The ABO and PBO related to these plans for 2004 were $82.6 and $105.3, respectively.
Comprehensive income within shareholders’ equity increased $59.4 (after-tax) due to the net reduction of an additional minimum liability. The reduction in the additional mini-mum liability resulted principally from improved plan asset positions.
In 2003, a $147.1 after-tax charge was recorded to com-prehensive income within shareholders’ equity due to the recognition of an additional minimum liability. The increase in the additional minimum liability resulted principally from the decline in the discount rate.
The following table summarizes the amounts recognized on the company’s consolidated balance sheet:
2004 2003
Prepaid benefit cost $ 4.9 $ 11.5
Accrued benefit liability (453.9) (689.4)
Intangible asset 21.0 22.8
Accumulated other comprehensive income—pretax 391.0 477.8
Net Amount Recognized $ (37.0) $(177.3)
Defined Contribution PlansThe company maintains a nonleveraged employee stock ownership plan (ESOP) which forms part of the Air Products and Chemicals, Inc. Retirement Savings and Stock Ownership Plan (RSSOP). The ESOP was established in May of 2002. The balance of the RSSOP is a qualifi ed defi ned contribution plan including a 401(k) elective defer-ral component. A substantial portion of U.S. employees are eligible and participate. Dividends paid on ESOP shares are treated as ordinary dividends by the company. Under exist-ing tax law, the company may deduct dividends which are paid with respect to shares held by the plan. Shares of the company’s common stock in the ESOP totaled 6,822,524 as of 30 September 2004.
The company matches a portion of the participants’ con-tributions to the RSSOP. Matching contributions expensed to income in 2004, 2003 and 2002 were $15.0, $13.8 and $14.2, respectively.
On 5 October 2004, the company announced changes to the U.S. Retirement Savings and Stock Ownership Plan (renamed the “Retirement Savings Plan”) to provide a greater portion of retirement benefi ts in a defi ned contribu-tion program. Effective 1 January 2005, this new program provides a company core contribution based on service as well as an enhanced company matching contribution to the Retirement Savings Plan. All U.S. salaried employees hired on or after 1 November 2004 will earn benefi ts only under the defi ned contribution program starting 1 January 2005. Eligible U.S. salaried employees as of 31 October 2004 were given the opportunity to make a one-time election to choose the traditional defi ned benefi t plan or the new defi ned con-tribution plan for future service starting 1 January 2005. All benefi ts earned through 31 December 2004, including those applicable to current employees electing the defi ned contri-bution program, will be determined under the traditional pension plan formula. Additionally, the company modifi ed the early retirement provision related to future service of the traditional pension plan.
The U.K. defi ned benefi t plan is closed to all new hires effec-tive 1 January 2005. Eligible U.K. employees hired on or after 1 January 2005 will receive retirement benefi ts exclu-sively under a new defi ned contribution plan.

61
Other Postretirement BenefitsThe company provides other postretirement benefi ts con-sisting primarily of healthcare benefi ts to U.S. retirees who meet age and service requirements. The healthcare benefi t is a continued medical benefi t until the retiree reaches age 65. Healthcare benefi ts are contributory, with contribution per-centages adjusted periodically. The retiree medical costs are capped at a specifi ed dollar amount with the retiree contrib-uting the remainder.
The cost of the company’s other postretirement benefi t plans included the following components:
2004 2003 2002
Service cost $4.7 $4.2 $4.4
Interest cost 5.6 5.8 4.7
Amortization: Prior service cost (.9) (.7) (.2) Actuarial loss (gain) .5 — (.7)
Settlements and curtailments — — (2.1)
Special termination benefits — .4 1.5
Net Periodic Benefit Cost $9.9 $9.7 $7.6
The company calculates net periodic benefi t costs for a given fi scal year based on assumptions developed at the end of the previous fi scal year. The discount rate assumption used in the calculation of net periodic benefi t cost for 2004, 2003 and 2002 was 6.0%, 6.8% and 7.5%, respectively.
The company measures the other postretirement benefi ts as of 30 September. The following table refl ects the change in the accumulated postretirement benefi t obligation:
2004 2003
Obligation at beginning of year $93.3 $76.8
Service cost 4.7 4.2
Interest cost 5.6 5.8
Amendments (10.8) —
Actuarial loss 6.7 14.7
Special termination benefits — .4
Benefits paid (9.3) (8.6)
Obligation at End of Year $90.2 $93.3
The discount rate assumption used in the calculation of the accumulated postretirement benefi t obligation at the end of 2004 and 2003 was 6.0%.
The assumed healthcare trend rates are as follows:
2004 2003
Healthcare trend rate 9.5% 8.0%
Ultimate trend rate 5.0% 5.0%
Year the ultimate trend rate is reached 2008 2006
The effect of a change in the healthcare trend rate is slightly tempered by a cap on the average retiree medical cost. The impact of a one percent point change in the assumed health-care cost trend rate on periodic benefi t cost and the obliga-tion is not material.
A reconciliation of the benefi t obligation to the amounts recognized in the consolidated balance sheet as a liability is as follows:
2004 2003
Obligation at end of year $(90.2) $(93.3)
Unrecognized actuarial loss 20.4 14.2
Unrecognized prior service cost (13.1) (3.2)
Net Amount Recognized $(82.9) $(82.3)
Projected benefi t payments are as follows:
2005 $ 8.9
2006 9.6
2007 10.4
2008 10.6
2009 10.5
2010–2014 51.0
These estimated benefi t payments are based on assumptions about future events. Actual benefi t payments may vary sig-nifi cantly from these estimates.
On 5 October 2004, the company announced changes to its retiree medical benefi ts. Employees will not be eligible to receive retiree medical benefi ts if they are under the age of 40 as of 31 December 2004, or join the company on or after 1 November 2004. The elimination of the retiree medical benefi t does not affect the disclosed obligation as the attribu-tion period does not begin until age 45.
The retiree medical cost cap was reduced for all eligible participants who retire on or after 1 January 2005. The reduction in the retiree medical cost cap, as well as enhanced retiree contributions, resulted in a prior service cost gain which will be amortized into expense over the employees’ average remaining service period.

62 Notes to the Consolidated Financial Statements continued
19. Commitments and ContingenciesIn the normal course of business the company has com-mitments, lawsuits, contingent liabilities and claims. The company is also party to certain guarantee and warranty agreements. However, the company does not expect that any sum it may have to pay in connection with these matters, or the matters described below, will have a materially adverse effect on its consolidated fi nancial condition, liquidity or results of operations.
Guarantees and WarrantiesThe company is a party to certain guarantee agreements, in-cluding a residual value guarantee, debt guarantees of equity affi liates and equity support agreements. These guarantees are contingent commitments that are related to activities of the company’s primary businesses.
In September 2001, the company entered into an operating lease of U.S. cryogenic vessel equipment, which included a residual value guarantee not to exceed $256. The guarantee extends to September 2006.
The company has guaranteed repayment of some borrowings of certain foreign equity affi liates. At 30 September 2004, these guarantees have terms primarily in the range of one to seven years, with maximum potential payments of $18.
The company has entered into an equity support agree-ment related to the fi nancing of an air separation facility constructed in Trinidad for a venture in which the company, through equity affi liates, owns 50%. The maximum poten-tial payments, under a joint and several guarantee with the partner, are $72 upon commencement of operations. The maximum exposure under the equity support agreement de-clines over time as an underlying loan balance is amortized. Additionally, the company and its partner provided guaran-tees of certain obligations related to the normal operations of this facility. The maximum potential payments, under the joint and several operations guarantees, are $32. The total combined maximum potential payments, under the joint and several equity support agreement and the operations guarantees, are $104. The term of these guarantees is related to the underlying twenty-year customer gas supply contract from the facility.
An equity support agreement was entered into related to the fi nancing of a cogeneration project. At 30 September 2004, the remaining term of this guarantee is 3 months, with maxi-mum potential payments of $15. A partner in this project has agreed to fund approximately half of any required equity contribution.
The company has not accrued any amounts related to these guarantees. To date, no equity contributions or pay-ments have been required since the inception of these guarantees. The fair value of the above guarantees totals approximately $7.
The company, in the normal course of business operations, has issued product warranties in its Equipment segment. Also, contracts often contain standard terms and conditions which typically include a warranty and indemnifi cation to the buyer that the goods and services purchased do not infringe on third-party intellectual property rights. The pro-vision for estimated future costs relating to warranties is not material to the consolidated results of operations.
EnvironmentalThe company has accrued for certain environmental investi-gatory, external legal costs and noncapital remediation costs consistent with the policy set forth in Note 1. The potential exposure for such costs is estimated to range from $9 to a reasonably possible upper exposure of $19. The consolidated balance sheet at 30 September 2004 includes an accrual of $14.3.
LitigationIn July 2003, Honeywell International, Inc. and GEM Microelectronic Materials, LLC fi led suit against the com-pany alleging breach of contract resulting from the termina-tion of a Strategic Alliance Agreement dated 1 October 1998 (“SAA”). On 6 August 2004, the Delaware Chancery Court decided that the company must pay damages in the amount of $8.1. This amount was recorded against previously estab-lished accruals. Honeywell has fi led a notice of appeal of the Court’s decision, and the company has fi led a cross-appeal.
Other Commitments and ContingenciesThe company has entered into put option agreements with certain affi liated companies. In 1999, the company made an investment in INOX, an Indian industrial gases company. As part of this transaction, put options were issued which give other shareholders the right to require the company to purchase shares of INOX (approximately 5.1 million) at a predefi ned exercise price. The option period began January 2004 and extends through January 2006. The option price during the fi rst year is 570 Rupees per share and during the second year 630 Rupees per share. The U.S. dollar price of purchasing all 5.1 million shares in 2004 based on current exchange rates would be approximately $63. In 2002, the company entered into a put option agreement as part of the San Fu acquisition as discussed in Note 4.
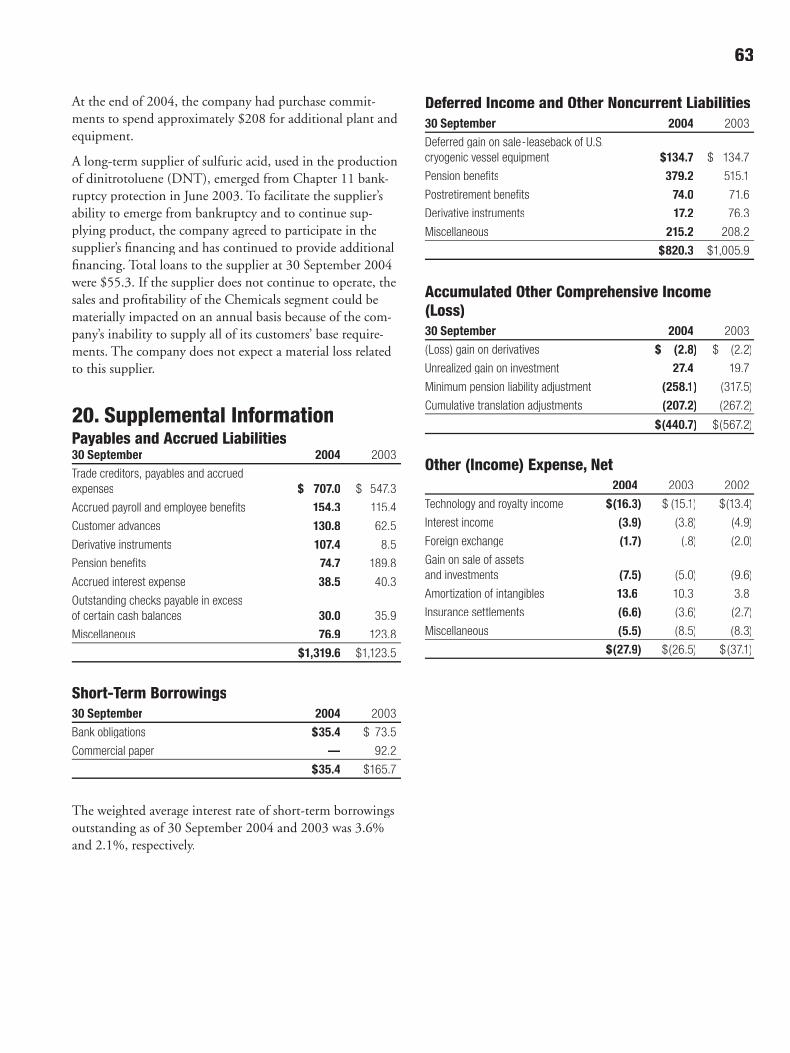
63
At the end of 2004, the company had purchase commit-ments to spend approximately $208 for additional plant and equipment.
A long-term supplier of sulfuric acid, used in the production of dinitrotoluene (DNT), emerged from Chapter 11 bank-ruptcy protection in June 2003. To facilitate the supplier’s ability to emerge from bankruptcy and to continue sup-plying product, the company agreed to participate in the supplier’s fi nancing and has continued to provide additional fi nancing. Total loans to the supplier at 30 September 2004 were $55.3. If the supplier does not continue to operate, the sales and profi tability of the Chemicals segment could be materially impacted on an annual basis because of the com-pany’s inability to supply all of its customers’ base require-ments. The company does not expect a material loss related to this supplier.
20. Supplemental InformationPayables and Accrued Liabilities30 September 2004 2003
Trade creditors, payables and accrued expenses $ 707.0 $ 547.3
Accrued payroll and employee benefits 154.3 115.4
Customer advances 130.8 62.5
Derivative instruments 107.4 8.5
Pension benefits 74.7 189.8
Accrued interest expense 38.5 40.3
Outstanding checks payable in excessof certain cash balances 30.0 35.9
Miscellaneous 76.9 123.8
$1,319.6 $1,123.5
Short-Term Borrowings30 September 2004 2003
Bank obligations $35.4 $ 73.5
Commercial paper — 92.2
$35.4 $165.7
The weighted average interest rate of short-term borrowings outstanding as of 30 September 2004 and 2003 was 3.6% and 2.1%, respectively.
Deferred Income and Other Noncurrent Liabilities30 September 2004 2003
Deferred gain on sale-leaseback of U.S.cryogenic vessel equipment $134.7 $ 134.7
Pension benefits 379.2 515.1
Postretirement benefits 74.0 71.6
Derivative instruments 17.2 76.3
Miscellaneous 215.2 208.2
$820.3 $1,005.9
Accumulated Other Comprehensive Income (Loss)30 September 2004 2003
(Loss) gain on derivatives $ (2.8) $ (2.2)
Unrealized gain on investment 27.4 19.7
Minimum pension liability adjustment (258.1) (317.5)
Cumulative translation adjustments (207.2) (267.2)
$(440.7) $(567.2)
Other (Income) Expense, Net 2004 2003 2002
Technology and royalty income $(16.3) $ (15.1) $(13.4)
Interest income (3.9) (3.8) (4.9)
Foreign exchange (1.7) (.8) (2.0)
Gain on sale of assets and investments (7.5) (5.0) (9.6)
Amortization of intangibles 13.6 10.3 3.8
Insurance settlements (6.6) (3.6) (2.7)
Miscellaneous (5.5) (8.5) (8.3)
$(27.9) $(26.5) $ (37.1)

64 Notes to the Consolidated Financial Statements continued
Summary by QuarterThese tables summarize the unaudited results of operations for each quarter of 2004 and 2003:
First Second Third Fourth Total
2004
Sales $1,684.9 $1,856.5 $1,892.5 $1,977.5 $7,411.4Operating income 198.8 210.1 233.7 237.0 879.6Net income 131.8 141.2 163.0 168.1 604.1Basic earnings per common share .59 .63 .73 .75 2.70Diluted earnings per common share .58 .62 .71 .73 2.64Dividends per common share .23 .23 .29 .29 1.04
Market price per common share: high 53.07 55.40 53.20 55.76low 44.12 46.71 47.49 48.42
First Second Third Fourth Total
2003
Sales $1,447.0 $1,578.1 $1,629.9 $1,642.3 $6,297.3
Operating income 194.0 176.3 37.3(A) 186.9 594.5
Income before cumulative effect of accounting change 128.7 113.6 26.6(A) 131.3 400.2
Net income 125.8 113.6 26.6(A) 131.3 397.3
Basic earnings per share
Income before cumulative effect of accounting change .59 .52 .12(A) .59 1.82
Net Income .57 .52 .12(A) .59 1.81
Diluted earnings per share
Income before cumulative effect of accounting change .58 .51 .12(A) .58 1.79
Net Income .56 .51 .12(A) .58 1.78
Dividends per common share .21 .21 .23 .23 .88
Market price per common share: high 46.50 44.20 44.25 48.78
low 40.34 36.97 40.72 40.50
(A) Included an expense of $152.7 ($96.6 after-tax, or $.43 per share) for the 2003 global cost reduction plan.

65
21. Business Segment and Geographic InformationThe company manages its operations, assesses performance, and reports results by three business segments, which are organized based on differences in products. The company’s three business segments consist of Gases, Chemicals and Equipment.
Gases SegmentThe company’s Gases segment includes its industrial gases, electronic chemicals business, healthcare, power generation and fl ue gas treatment businesses.
The company is a leading international supplier of industrial and specialty gas products. Principal products of the indus-trial gases business are oxygen, nitrogen, argon, hydrogen, carbon monoxide, carbon dioxide, synthesis gas and helium. The largest market segments are chemical processing, elec-tronics, refi ning, metal production, food processing and medical gases. The company has its strongest industrial gas market positions in the United States and Europe.
The global healthcare business of the company is directed at two main markets: institutional and homecare. The insti-tutional market uses medical gases in hospitals, clinics and nursing homes, as well as helium for use in magnetic reso-nance imaging. The homecare business involves the delivery of respiratory therapy services, home medical equipment and infusion services to patients in their homes in Europe, South America and the eastern half of the United States.
The company constructed, operates and has approximately a 50% interest in power generation facilities in California, Rotterdam and Thailand. The company also constructed, operates and has a 50% interest in a fl ue gas treatment facil-ity in Indiana.
Chemicals SegmentThe company’s Chemicals segment consists of businesses organized around two divisions: Performance Materials and Chemical Intermediates.
Principal products of Performance Materials are emulsions, specialty additives, polyurethane additives and epoxy addi-tives. Principal Chemical Intermediates are amines and poly-urethane intermediates. The end markets for the company’s chemical products are extensive, including adhesive, paper, building products, agriculture and furniture. Principal geo-graphic markets for the company’s chemical products are North America, Europe, Asia, and Brazil.
Equipment SegmentThe Equipment segment designs and manufactures cryo-genic and gas processing equipment for air separation, gas processing, natural gas liquefaction and hydrogen puri-fi cation. The segment also designs and builds cryogenic transportation containers for liquid helium and systems for recovering gases using membrane technology. Equipment is sold worldwide to companies involved in chemical and petrochemical manufacturing, oil and gas recovery and pro-cessing, power generation and steel and primary metal pro-duction. Equipment is also manufactured for the company’s industrial gas business. Another important market, particu-larly for air separation equipment, is the company’s interna-tional industrial gas joint ventures.
CustomersThe company has a large number of customers, and no single customer accounts for a signifi cant portion of annual sales.
Accounting PoliciesThe accounting policies of the segments are the same as those described in Note 1. The company evaluates the per-formance of segments based upon reported segment operat-ing income. Operating income of the business segments includes general corporate expenses. Corporate expenses not allocated to the segments, included in all other, are primarily long-term research and development. Intersegment sales are not material and are recorded at selling prices that approxi-mate market prices. Equipment manufactured for the com-pany’s industrial gas business is generally transferred at cost and not refl ected as an intersegment sale. Corporate assets not allocated to the segments are included in all other. These assets include cash and cash items, unallocated administra-tive facilities and certain deferred items. Long-lived assets include investment in net assets of and advances to equity af-fi liates, net plant and equipment, goodwill and intangibles.
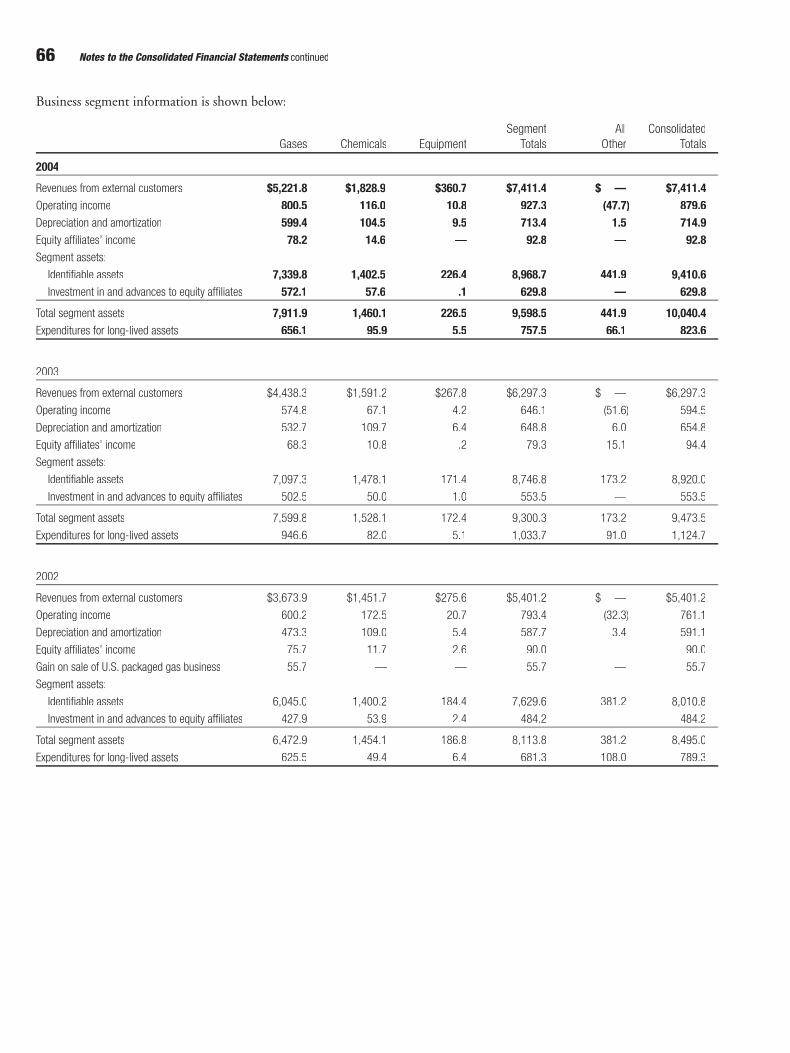
66 Notes to the Consolidated Financial Statements continued
Business segment information is shown below:
Segment All ConsolidatedGases Chemicals Equipment Totals Other Totals
2004
Revenues from external customers $5,221.8 $1,828.9 $360.7 $7,411.4 $ — $7,411.4Operating income 800.5 116.0 10.8 927.3 (47.7) 879.6Depreciation and amortization 599.4 104.5 9.5 713.4 1.5 714.9Equity affi liates’ income 78.2 14.6 — 92.8 — 92.8Segment assets:
Identifi able assets 7,339.8 1,402.5 226.4 8,968.7 441.9 9,410.6 Investment in and advances to equity affi liates 572.1 57.6 .1 629.8 — 629.8
Total segment assets 7,911.9 1,460.1 226.5 9,598.5 441.9 10,040.4Expenditures for long-lived assets 656.1 95.9 5.5 757.5 66.1 823.6
2003
Revenues from external customers $4,438.3 $1,591.2 $267.8 $6,297.3 $ — $6,297.3
Operating income 574.8 67.1 4.2 646.1 (51.6) 594.5
Depreciation and amortization 532.7 109.7 6.4 648.8 6.0 654.8
Equity affi liates’ income 68.3 10.8 .2 79.3 15.1 94.4
Segment assets:
Identifi able assets 7,097.3 1,478.1 171.4 8,746.8 173.2 8,920.0
Investment in and advances to equity affi liates 502.5 50.0 1.0 553.5 — 553.5
Total segment assets 7,599.8 1,528.1 172.4 9,300.3 173.2 9,473.5
Expenditures for long-lived assets 946.6 82.0 5.1 1,033.7 91.0 1,124.7
2002
Revenues from external customers $3,673.9 $1,451.7 $275.6 $5,401.2 $ — $5,401.2
Operating income 600.2 172.5 20.7 793.4 (32.3) 761.1
Depreciation and amortization 473.3 109.0 5.4 587.7 3.4 591.1
Equity affi liates’ income 75.7 11.7 2.6 90.0 — 90.0
Gain on sale of U.S. packaged gas business 55.7 — — 55.7 — 55.7
Segment assets:
Identifi able assets 6,045.0 1,400.2 184.4 7,629.6 381.2 8,010.8
Investment in and advances to equity affi liates 427.9 53.9 2.4 484.2 — 484.2
Total segment assets 6,472.9 1,454.1 186.8 8,113.8 381.2 8,495.0
Expenditures for long-lived assets 625.5 49.4 6.4 681.3 108.0 789.3
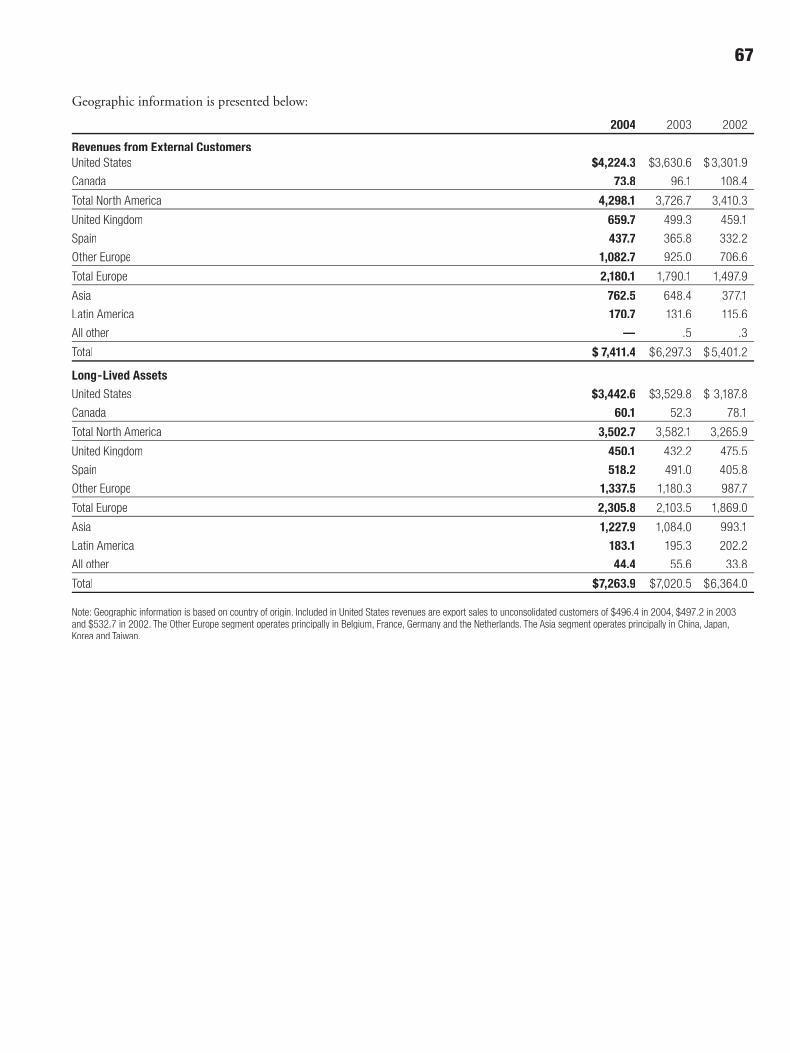
67
Geographic information is presented below:
2004 2003 2002
Revenues from External CustomersUnited States $4,224.3 $3,630.6 $ 3,301.9
Canada 73.8 96.1 108.4
Total North America 4,298.1 3,726.7 3,410.3
United Kingdom 659.7 499.3 459.1
Spain 437.7 365.8 332.2
Other Europe 1,082.7 925.0 706.6
Total Europe 2,180.1 1,790.1 1,497.9
Asia 762.5 648.4 377.1
Latin America 170.7 131.6 115.6
All other — .5 .3
Total $ 7,411.4 $6,297.3 $ 5,401.2
Long-Lived AssetsUnited States $3,442.6 $3,529.8 $ 3,187.8
Canada 60.1 52.3 78.1
Total North America 3,502.7 3,582.1 3,265.9
United Kingdom 450.1 432.2 475.5
Spain 518.2 491.0 405.8
Other Europe 1,337.5 1,180.3 987.7
Total Europe 2,305.8 2,103.5 1,869.0
Asia 1,227.9 1,084.0 993.1
Latin America 183.1 195.3 202.2
All other 44.4 55.6 33.8
Total $7,263.9 $7,020.5 $6,364.0
Note: Geographic information is based on country of origin. Included in United States revenues are export sales to unconsolidated customers of $496.4 in 2004, $497.2 in 2003 and $532.7 in 2002. The Other Europe segment operates principally in Belgium, France, Germany and the Netherlands. The Asia segment operates principally in China, Japan, Korea and Taiwan.

68
(millions of dollars, except per share) 2004 2003 2002 2001 2000
Operating ResultsSales $7,411 $6,297 $5,401 $5,858 $5,610
Cost of sales 5,464 4,613 3,816 4,216 3,947
Selling and administrative 969 843 718 711 702
Research and development 127 121 120 122 123
Global cost reduction plans, net — 153 23 107 55
Operating income 880 595 761 734 818
Equity affiliates’ income 93 94 90 93 100
Interest expense 121 124 122 191 197
Income tax provision (benefit) 227 147 241 191 (14)
Net income 604 397 525 466 124
Basic earnings per common share 2.70 1.81 2.42 2.17 .58
Diluted earnings per common share 2.64 1.78 2.36 2.12 .57
Year-End Financial PositionPlant and equipment, at cost $12,202 $11,723 $10,880 $10,227 $10,311
Total assets 10,040 9,474 8,495 8,084 8,271
Working capital 711 528 653 332 430
Total debt (A) 2,394 2,511 2,385 2,478 3,045
Shareholders’ equity 4,444 3,783 3,460 3,106 2,821
Financial RatiosReturn on sales 8.2% 6.3% 9.7% 7.9% 2.2%
Return on average shareholders’ equity 14.7% 10.9% 15.9% 15.8% 4.3%
Total debt to sum of total debt, shareholders’ equity and minority interest (A) 34.2% 38.7% 39.6% 43.5% 50.9%
Cash provided by operations to average total debt 43.1% 42.8% 46.0% 37.8% 37.5%
Interest coverage ratio 7.7 5.4 6.9 4.3 1.5
Other DataFor the year: Depreciation and amortization $715 $655 $591 $598 $594
Capital expenditures (B) 816 1,171 806 806 973
Cash dividends per common share 1.04 .88 .82 .78 .74
Market price range per common share 56–44 49–36 54–36 49–30 39–23
Weighted average common shares outstanding (in millions) 224 220 217 215 213
Weighted average common shares outstanding assuming dilution (in millions) 229 224 223 219 216
At year end: Book value per common share 19.68 17.08 15.83 14.41 13.17
Shareholders 10,700 11,100 11,100 11,200 11,400
Employees (C) 19,900 19,000 17,500 18,000 17,800
(A) Total debt includes long-term debt, current portion of long-term debt, and short-term borrowings as of the end of the year.(B) Capital expenditures include additions to plant and equipment, investment in and advances to unconsolidated affi liates, acquisitions (including long-term debt assumed
in acquisitions) and capital lease additions. (C) Includes full- and part-time employees.
Five-Year Summary of Selected Financial Data