trendsalert -- workers' comp · csg is the nation’s only organization serving every elected...
TRANSCRIPT

Workers’ Comp

Workers’ Comp
Melissa Taylor Bell
Irakli Khodeli
February 2004
The Council of State Governments
2760 Research Park Dr.—P.O. Box 11910—Lexington, KY 40578-1910 Phone: (859) 244-8000—Fax: (859) 244-8001—www.csg.org

The Council of State Governments
CSG is the nation’s only organization serving every elected and appointed official in all three branches of each state and territorial government through its national office, as well as regional offices based in the East, Midwest, South and West. CSG champions excellence in state government by advocating multi-state shared problem solving and states’ rights; by tracking national conditions, trends and innovations; and through nonpartisan groundbreaking leadership training and support.
Council Officers President Gov. Mike Huckabee, Ark.
Chair Rep. Dan E. Bosley, Mass. President-Elect Gov. Frank Murkowski, Alaska
Chair-Elect Sen. John Hottinger, Minn. Vice President Gov. Ruth Ann Minner, Del.
Vice Chair Assemblyman Lynn Hettrick, Nev.
Headquarters Eastern Southern
Daniel M. Sprague Executive Director
Alan V. Sokolow Director
Colleen Cousineau Director
40 Broad Street, Suite 2050 P.O. Box 98129 Albert C. Harberson
Director of Policy New York, NY 10004-2317
Phone: (212) 482-2320 Atlanta, GA 30359
Phone: (404) 633-1866 Fax: (212) 482-2344 Fax: (404) 633-4896
Washington, D.C. Midwestern Western
Jim Brown Director
Michael H. McCabe Director
Kent Briggs Director
444 N. Capitol Street, Suite 401 614 E. Butterfield Road, Suite 401 1107 9th Street, Suite 650 Washington, D.C. 20001 Lombard, IL 60148 Sacramento, CA 95814 Phone: (202) 624-5460 Phone: (630) 810-0210 Phone: (916) 553-4423
Fax: (202) 624-5462 Fax: (630) 810-0145 Fax: (916) 446-5760

i
Table of Contents
Executive Summary 1
1. Current Trends in Workers’ Compensation 2
Medical Costs 2 Investment Income 2 Effects of Terrorism 3 Slow Economic Growth 3 Workforce Demographics 3 Insurance Fraud 3 Excessive Litigation 4
2. Overview of Workers’ Comp Insurance 4
Workers’ Comp Provision 4 Basics of Workers’ Comp 7 Interstate Differences 7 Intrastate Differences 9 Ups and Downs of Workers’ Comp 10 Workers’ Comp through the Years 10
3. Policy Options 11
Workplace Safety and Return-to-Work Programs 11 Workplace Safety Programs 11 Early Return-to-Work Programs 15
Medical Cost Containment Strategies 16
Provider Choice Laws 17 Health Care Provider Networks 19 Medical Provider Fee Schedules and Bill Review 21 Treatment Guidelines and Utilization Review 22 Case Management 23 Promotion of Generic Drugs 23
General Cost Containment Strategies 23
Deregulation and Competitive Premium Rates 25 Self-Insurance and Pooled Insurance Options 26 Advisory Councils 27 Technological Innovations 28 Streamlined Workers’ Compensation System for State Employees 29 Fraud Prevention 29 Litigation Controls 29
Conclusion 30 Glossary of Terms 31
1
Executive Summary Over the past decade, the number of workers’ comp compensation claims has been declining. That is the good news. The bad news is that workers’ comp costs and benefits paid out are still rising. In fact, workers’ comp costs are experiencing double-digit increases across the country. The average cost of workers’ compensation has risen 50 percent over the past three years.1 Increased costs are leading to higher premiums for employers, and this can affect business and economic development. In some states, it is not only a crisis of affordability but one of access as well. Faced with rising costs, some insurers have pulled out of the workers’ comp market or shut down shop altogether. A variety of factors are leading to a potential workers’ comp crisis. These cost drivers include:
• medical expenses increases; • investment income losses; • effects of terrorist acts; • slow economic growth; • increasing fraud in the system; • excessive litigation; and • workforce demographics.
States are subject to different cost drivers based on their specific circumstances and their reliance on certain economic sectors. A state with a large number of dangerous jobs, for instance, faces a different set of factors than a state with an economy dominated by low-risk industries. States that have had relatively stable costs over the years have several similar characteristics, but they differ in many ways as well. Therefore, it is virtually impossible to list the elements of the “perfect” workers’ comp system. Although there is no magic bullet, there are a number of policies that state officials can introduce to deal with workers’ comp problems. The policies outlined in this report focus on cost containment measures related to:
• enhancing workplace safety and decreasing the number of workers’ comp claims; • containing medical costs; and • dealing with a number of inefficiencies in the system.
Because states may be affected by different cost drivers and to different degrees, policy-makers should choose the combination of policy options that best address the needs of their particular state workers’ comp systems.

2
1. Current Trends in Workers’ Compensation
Claim frequency is beginning to level off, but costs are not.2 This situation is illustrated in Figures 1.1 and 1.2. Because of these increasing costs, insurers are raising their rates. Higher premiums are putting a burden on employers, who pay for workers’ comp insurance for their employees. Figure 1.1 Workplace Injury and Illness Incidence Rates, 1989-2001
Figure 1.2 Costs and Benefits Paid Out for Workers’ Comp (in billions), 1989-2001
0.02.04.06.08.0
10.0
1989
1991
1993
1995
1997
1999
2001
Year
Inci
denc
e ra
te p
er
100
full-
time
wor
kers
Total cases
Lost w orkday cases
Cases w ithout lost w orkdays
Data Source: National Academy of Social Insurance
0
10
20
30
40
50
60
70
1989
1991
1993
1995
1997
1999
2001
Costs Benefits
Data Source: U.S. Department of Labor
A variety of factors are leading to a potential workers’ comp crisis. These cost drivers include:
• medical expenses; • investment income losses; • effects of terrorist acts; • slow economic growth; and • workforce demographics (older and immigrant workers).
Medical Costs The annual average rate of increase in workers’ compensation medical care costs was 8.1 percent from 1996 to 2002, compared with an annual average rise of 3.8 percent for the medical consumer price index over the same period.3 Medical costs for workers’ comp have risen more than general medical inflation, leading some experts to surmise that workers are overusing workers’ comp and underutilizing their health insurance. In other words, as co-payments for health insurance rise, workers may be more prone to classify their injuries as work-related so that workers’ comp, without co-payments, will cover their medical expenses. In addition to overutilization, there are several other factors leading to this rise. For instance, “Some workers’ comp carriers have seen costs for some commonly prescribed drugs rise by more than 100 percent over the past few years.”4 There is also evidence of abuse and fraud, such as doctors billing for more serious ailments than the workers have and workers faking injury. One study by an insurance company suggests medical costs are rising because of a broader definition of workplace injuries, rising number of visits to medical providers and the use of more expensive medical treatments.5 Investment Income In the 1990s, insurers invested some of their premium income in stocks and bonds. During the economic boom of the 1990s, some made a hefty profit from this practice. With the current climate in the stock and bond markets, however, net investment income in the property/casualty insurance industry fell 7.1 percent in 2001 and an estimated 4.9 percent in 2002.6

3
Since market outcomes are out of their hands, insurers must focus on efficient pricing and cost-cutting in order to generate profits. Therefore, many insurers are raising their premiums and trying to limit the effects of current cost drivers. Effects of Terrorism Before September 11, 2001, the effects of terrorism were negligible in the workers’ comp industry. Workers’ comp claims stemming from the terrorist attacks on the World Trade Center in New York, however, are estimated at about $2 billion.7 This is obviously a big loss for the workers’ comp insurance industry. Workers’ comp insurers must provide terrorism insurance, but reinsurers are not required to do so. Therefore, workers’ comp insurers can’t distribute this risk in the reinsurance markets. Consequently, premiums have risen, and insurers are instituting strict underwriting reviews. Slow Economic Growth Workers’ comp insurers pay out $1.07 for every $1 they receive in premiums; this added up to about a $2 billion loss in 2002.8 Slow economic growth, which is interrelated with other cost drivers, contributes to this deficiency. In a sluggish economy, there is not a major increase in wages. During these times, workers’ comp benefit payouts rise more than wages. Because workers are generally compensated until they get a new job, this process can take longer in a slow economy. Also, in slow economic times, there is less business formation and job creation. Therefore, there are fewer employers to serve as customers for workers’ comp insurers. This leads to intense price competition among insurers, which can have damaging effects on the industry. Insurers may engage in a pricing war and actually sell premiums that don’t pay for insurance costs. Insurers can make up these losses with investment income from the stock and bond markets. When these markets take a dive, as noted above, this source of income also dries up. To make up for investment losses, insurers raise their prices, leading to problems with access and affordability. During a recession, average medical costs per claim grow faster than during economic growth. During times of high unemployment, unemployed workers may try to compensate lost income from other sources by over-utilizing workers’ compensation benefits. Also, when unemployment rises, businesses tend to lay off less experienced workers, who tend to be younger and less susceptible to serious injuries, while retaining more experienced workers, who tend to be older and prone to more serious injuries. Consequently, the average severity and the average costs of workers’ compensation claims increase during economic downturns.9 Workforce Demographics One set of cost drivers that some insurers are paying attention to deals with workforce demographics. The American workforce is becoming older and more diverse. This affects workers’ comp rates primarily in two ways. First, as noted above, older workers are more susceptible to injury and work-related illness, so the number and severity of claims may rise in the near future as the workforce ages. Second, due to influx of immigrant workers, insurers or employers may need to hire interpreters and translate workers’ comp materials into other languages; in addition, there are often few work alternatives for certain groups of unskilled immigrants. Interpreters and translation services can be expensive. Since workers’ comp pays until the injured employee finds another job, there are increased costs associated with low-skill workers who cannot easily find other employment. Insurance Fraud According to the National Insurance Crime Bureau, workers’ comp fraud costs the insurance industry approximately $5 billion each year and is partially responsible for a rising trend in insurance premiums for employers. 10

4
• Employee claim abuse is the most common type of fraud and occurs when an employee knowingly files a false claim about an injury that has not occurred or that did not occur at the workplace. This results in unnecessary expense for the insurance carrier and loss of workforce for the employer.
• Employer fraud occurs when an employer intentionally provides inaccurate information about business operations and workforce composition to reduce workers’ comp costs. Also called premium fraud, it is a growing concern for many states because it escalates insurance rates and hurts other businesses that are less able to compete with companies defrauding the system.
• Medical provider fraud results when doctors perform unnecessary tests and procedures on patients, lie about procedures and state of patient’s injuries to share a percentage of employee’s compensation, or otherwise abuse professional discretion to maximize gains from the system.
• Insurance carrier fraud occurs when an insurance provider overcharges on premiums or makes false or misleading claims about coverage.
Organized fraud involving doctors and lawyers have been an ongoing problem, especially in southern California. Fraud rings recruit people to file fraudulent work injury claims and to seek help from medical clinics or legal centers commonly known as “claim mills.” Claim mills, in turn, refer workers to doctors or lawyers who participate in the scheme. Excessive Litigation Excessive litigation and attorney involvement in workers’ compensation claims process can contribute to high costs and system inefficiency. Litigiousness of the system may raise concerns in the states because the very purpose of the workers’ compensation is to create a “no-fault” system that delivers benefits for work injuries in a timely and non-litigious manner.11 Attorneys are now involved in 5 to 10 percent of all worker’s compensation claims, and nearly one-third of all claims for injuries that are serious enough to result in loss-time payments.12 Although claim costs for cases in which attorneys get involved increase by 12 to 15 percent, after paying attorney fees the injured workers enjoys no gains on the actual net benefits received.13 2. Overview of Workers’ Comp Insurance Workers’ comp is a no-fault system. As such, employers pay medical costs and lost wages for injured employees, and employees cannot sue their employers. Workers’ comp is a mandatory program in every state except Texas. According to the Insurance Information Institute, almost nine out of 10 workers are covered by workers’ comp insurance14 even though small businesses with fewer than three to five employees are exempt in 16 states.15 Workers’ Comp Provision As illustrated in Table 1.1, there are basically three ways for employers to get workers’ comp insurance:
• private insurance; • self insurance; or • state-provided insurance.
Table 1.1 Workers’ Comp Insurance Provision, 2003
Insurance Provided By: Self-Insurance Provided By:
State Type of Law State Fund Private Carrier Individual Employer
Group of Employers
Alabama Compulsory No Yes Yes Yes Alaska Compulsory No Yes Yes No Arizona Compulsory Competitive Yes Yes Yes Arkansas Compulsory No Yes Yes Yes

5
Table 1.1 Workers’ Comp Insurance Provision, 2003 (cont.)
California Compulsory Competitive Yes Yes Yes Colorado Compulsory Competitive Yes Yes Yes Connecticut Compulsory No Yes Yes Yes Delaware Compulsory No Yes Yes No Florida Compulsory No Yes Yes Yes Georgia Compulsory No Yes Yes Yes Guam Compulsory No Yes Yes Yes Hawaii Compulsory Competitive Yes Yes Yes Idaho Compulsory Competitive Yes Yes No Illinois Compulsory No Yes Yes Yes Indiana Compulsory No Yes Yes No Iowa Compulsory No Yes Yes Yes Kansas Compulsory No Yes Yes Yes Kentucky Compulsory Competitive Yes Yes Yes Louisiana Compulsory Competitive Yes Yes Yes Maine Compulsory Competitive Yes Yes Yes Maryland Compulsory Competitive Yes Yes Yes Massachusetts Compulsory No Yes Yes Yes Michigan Compulsory No Yes Yes Yes Minnesota Compulsory Competitive Yes Yes Yes Mississippi Compulsory No Yes Yes Yes Missouri Compulsory No Yes Yes Yes Montana Compulsory Competitive Yes Yes Yes Nebraska Compulsory No Yes Yes No Nevada Compulsory No Yes Yes Yes New Hampshire Compulsory No Yes Yes Yes New Jersey Elective1 No Yes Yes No New Mexico Compulsory Competitive Yes Yes Yes New York Compulsory Competitive Yes Yes Yes North Carolina Compulsory No Yes Yes Yes North Dakota Compulsory Exclusive No No No Ohio Compulsory Exclusive No Yes No Oklahoma Compulsory Competitive Yes Yes Yes Oregon Compulsory Competitive Yes Yes Yes Pennsylvania Compulsory Competitive Yes Yes Yes Puerto Rico Compulsory Exclusive No No No Rhode Island Compulsory2 Competitive Yes Yes Yes South Carolina Compulsory No Yes Yes Yes South Dakota Compulsory No Yes Yes Yes Tennessee Compulsory No Yes Yes Yes Texas Elective Competitive Yes Yes No Utah Compulsory Competitive Yes Yes No Vermont Compulsory No Yes Yes No Virginia Compulsory No Yes Yes Yes Virgin Islands Compulsory Exclusive No No No Washington Compulsory Exclusive No Yes Yes West Virginia Compulsory Exclusive No Yes No Wisconsin Compulsory No Yes Yes No Wyoming Compulsory3 Exclusive No No No
1 New Jersey: Technically coverage is elective, but practically compulsory. 2 Rhode Island: Employees are allowed to claim common law rights and opt out of the workers’ compensation system. 3 Wyoming: The law is compulsory for all employers engaged in extra-hazardous occupations and elective for all other occupations. Source: U.S. Department of Labor
6
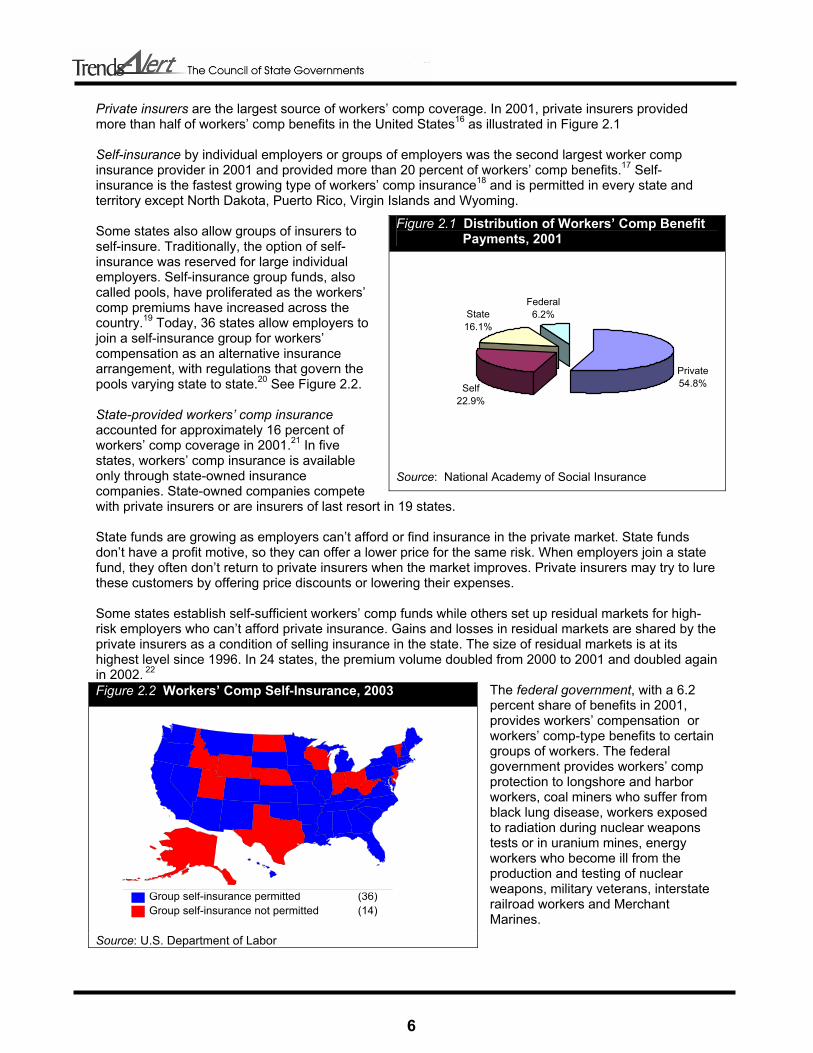
Private insurers are the largest source of workers’ comp coverage. In 2001, private insurers provided more than half of workers’ comp benefits in the United States16 as illustrated in Figure 2.1 Self-insurance by individual employers or groups of employers was the second largest worker comp insurance provider in 2001 and provided more than 20 percent of workers’ comp benefits.17 Self-insurance is the fastest growing type of workers’ comp insurance18 and is permitted in every state and territory except North Dakota, Puerto Rico, Virgin Islands and Wyoming. Some states also allow groups of insurers to self-insure. Traditionally, the option of self-insurance was reserved for large individual employers. Self-insurance group funds, also called pools, have proliferated as the workers’ comp premiums have increased across the country.19 Today, 36 states allow employers to join a self-insurance group for workers’ compensation as an alternative insurance arrangement, with regulations that govern the pools varying state to state.20 See Figure 2.2. State-provided workers’ comp insurance accounted for approximately 16 percent of workers’ comp coverage in 2001.21 In five states, workers’ comp insurance is available only through state-owned insurance companies. State-owned companies compete with private insurers or are insurers of last resort in 19 states. State funds are growing as employers can’t afford or find insurance in the private market. State funds don’t have a profit motive, so they can offer a lower price for the same risk. When employers join a state fund, they often don’t return to private insurers when the market improves. Private insurers may try to lure these customers by offering price discounts or lowering their expenses. Some states establish self-sufficient workers’ comp funds while others set up residual markets for high-risk employers who can’t afford private insurance. Gains and losses in residual markets are shared by the private insurers as a condition of selling insurance in the state. The size of residual markets is at its highest level since 1996. In 24 states, the premium volume doubled from 2000 to 2001 and doubled again in 2002. 22
The federal government, with a 6.2 percent share of benefits in 2001, provides workers’ compensation or workers’ comp-type benefits to certain groups of workers. The federal government provides workers’ comp protection to longshore and harbor workers, coal miners who suffer from black lung disease, workers exposed to radiation during nuclear weapons tests or in uranium mines, energy workers who become ill from the production and testing of nuclear weapons, military veterans, interstate railroad workers and Merchant Marines.
Figure 2.1 Distribution of Workers’ Comp Benefit Payments, 2001
Private54.8%
Federal6.2%State
16.1%
Self22.9%
Source: National Academy of Social Insurance
Figure 2.2 Workers’ Comp Self-Insurance, 2003
Source: U.S. Department of Labor
Group self-insurance permitted (36)Group self-insurance not permitted (14)

7
Basics of Workers’ Comp Premiums are based on industry classification of the employers and occupational classifications of individual workers. Employers in high-risk industries, such as construction, pay higher premiums than lower-risk desk jobs. The vast majority of workers’ comp cases are medical only; that is, most cases do not involve lost work time. While medical-only cases account for almost 80 percent of cases, they account for only 6 percent of benefits paid.23 In contrast, cases involving lost wages account for about 20 percent of workers’ comp cases but 94 percent of all benefits paid.24 There are four types of workers’ compensation benefits for lost wages:
• If a worker returns to work with reduced responsibilities and a lower wage before reaching maximum medical improvement, the injured worker can receive temporary partial disability benefits.
• If a worker is hurt and must miss work for more than the state-mandated waiting period, in most states, temporary total disability benefits generally pay for two-thirds of a worker’s pre-injury wage.
• If an injured worker is able to work at reduced efficiency but is disabled for life, the worker is eligible for permanent partial disability benefits. This category of benefits accounts for 31 percent of workers’ comp cash payments and 63 percent of all workers’ comp spending.25
• If an injured worker is permanently disabled and is unable to work at all, the worker is eligible for permanent total disability. These cases are uncommon.
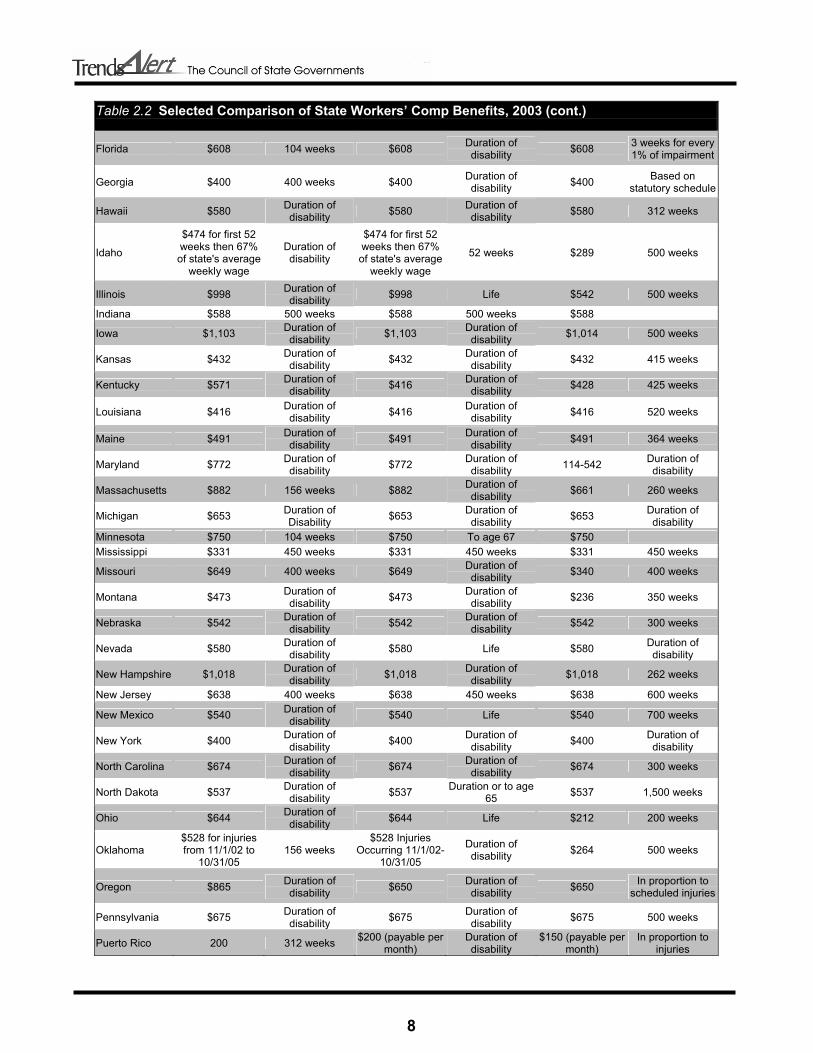
Most workers’ comp cases that involve cash benefits for lost wages are temporary – either temporary partial or temporary total. Interstate Differences States vary in terms of benefit levels and what is compensable. Table 2.2 provides a glimpse of variations in state workers’ comp benefits. Table 2.2 Selected Comparison of State Workers’ Comp Benefits, 2003
Temporary Total Disability Permanent Total Disability Permanent Partial Disability State
Maximum Weekly Benefit
Benefit Duration Limit
Maximum Weekly Benefit
Benefit Duration Limit
Maximum Weekly Benefit
Benefit Duration Limit
Alabama $569 Duration of disability $569 Duration of
disability $220 300 weeks
Alaska $814 Duration of disability $814 Duration of
disability
Based on impairment;
payable in lump sum
Arizona $374 Duration of disability $374 Duration of
disability $374 Duration of disability
Arkansas $440 450 weeks $440 Duration of disability $330 450 weeks
California $602 Duration of disability $602 Life $230 619 weeks
Colorado $659 Duration of disability $645 Life $354 Duration of
disability
Connecticut $909 Duration of disability $909 Duration of
Disability $687 520 weeks
Delaware $491 Duration of disability $491 Duration of
disability $491 300 weeks
8
Table 2.2 Selected Comparison of State Workers’ Comp Benefits, 2003 (cont.)
Florida $608 104 weeks $608 Duration of disability $608 3 weeks for every
1% of impairment
Georgia $400 400 weeks $400 Duration of disability $400 Based on
statutory schedule
Hawaii $580 Duration of disability $580 Duration of
disability $580 312 weeks
Idaho
$474 for first 52 weeks then 67% of state's average
weekly wage
Duration of disability
$474 for first 52 weeks then 67% of state's average
weekly wage
52 weeks $289 500 weeks
Illinois $998 Duration of disability $998 Life $542 500 weeks
Indiana $588 500 weeks $588 500 weeks $588
Iowa $1,103 Duration of disability $1,103 Duration of
disability $1,014 500 weeks
Kansas $432 Duration of disability $432 Duration of
disability $432 415 weeks
Kentucky $571 Duration of disability $416 Duration of
disability $428 425 weeks
Louisiana $416 Duration of disability $416 Duration of
disability $416 520 weeks
Maine $491 Duration of disability $491 Duration of
disability $491 364 weeks
Maryland $772 Duration of disability $772 Duration of
disability 114-542 Duration of disability
Massachusetts $882 156 weeks $882 Duration of disability $661 260 weeks
Michigan $653 Duration of Disability $653 Duration of
disability $653 Duration of disability
Minnesota $750 104 weeks $750 To age 67 $750 Mississippi $331 450 weeks $331 450 weeks $331 450 weeks
Missouri $649 400 weeks $649 Duration of disability $340 400 weeks
Montana $473 Duration of disability $473 Duration of
disability $236 350 weeks
Nebraska $542 Duration of disability $542 Duration of
disability $542 300 weeks
Nevada $580 Duration of disability $580 Life $580 Duration of
disability
New Hampshire $1,018 Duration of disability $1,018 Duration of
disability $1,018 262 weeks
New Jersey $638 400 weeks $638 450 weeks $638 600 weeks
New Mexico $540 Duration of disability $540 Life $540 700 weeks
New York $400 Duration of disability $400 Duration of
disability $400 Duration of disability
North Carolina $674 Duration of disability $674 Duration of
disability $674 300 weeks
North Dakota $537 Duration of disability $537 Duration or to age
65 $537 1,500 weeks
Ohio $644 Duration of disability $644 Life $212 200 weeks
Oklahoma $528 for injuries from 11/1/02 to
10/31/05 156 weeks
$528 Injuries Occurring 11/1/02-
10/31/05
Duration of disability $264 500 weeks
Oregon $865 Duration of disability $650 Duration of
disability $650 In proportion to scheduled injuries
Pennsylvania $675 Duration of disability $675 Duration of
disability $675 500 weeks
Puerto Rico 200 312 weeks $200 (payable per month)
Duration of disability
$150 (payable per month)
In proportion to injuries

9
Table 2.2 Selected Comparison of State Workers’ Comp Benefits, 2003 (cont.)
Rhode Island $702 Duration of disability $702 Duration of
disability $702 Duration of disability
South Carolina $563 500 weeks $563 500 weeks $563 340 weeks
South Dakota $482 Duration of disability $482 Duration of
disability $482 Duration of disability
Tennessee $599 400 weeks $599 Until retirement age $599 400 weeks
Texas $537 104 weeks $537 401 weeks or life
for injuries listed in statute
$373 401 weeks
Utah $562 312 weeks $478 312 weeks or life if
can't be rehabilitated
$375 312 weeks
Vermont $865 Maximum medical improvement $865 Duration of
Disability $865
Virginia $681 500 weeks $681 Duration of disability $681 500 weeks
Virgin Islands $385 Duration of disability $385 Duration of
disability $385 200 weeks
Washington $868 Duration of temporary disability
$868 Life
Based on % of permanent
physical impairment
West Virginia $526 208 weeks $526 Duration or to age 65 $526
Wisconsin $669 Duration of disability $647 Life $222 1,000 weeks
Wyoming $527 Duration of disability $527 350 weeks $364
Source: U.S. Department of Labor Numerous economic, financial, administrative and political factors have contributed to the rising costs of state workers’ comp systems. For instance, a report on workers’ comp for agricultural workers in Minnesota lists the following factors that are influencing the workers’ comp system in the state, some of which correspond with national trends and some of which run counter to these trends:26
• increasing number of claims; • longer periods of disability; • rising medical costs; • increasing number of pre-existing risk factors, such as obesity, diabetes and an aging
workforce; • more social complications, such as chemical dependency; • more benefits extending past retirement age; • more permanent total disability claims; • rising cultural and language barriers; • lower investment income; • higher reinsurance costs with less coverage; and • low pricing in the past decade which can no longer be sustained.
While the number of claims has been declining nationwide, Minnesota’s agricultural sector is experiencing an increase in claims. This divergence highlights how States are subject to different cost drivers based on their specific circumstances and their reliance on certain economic sectors. Intrastate Differences Benefit levels can vary within states across time. There are several possible reasons for these intrastate differences from year to year, 27 including changes in:

10
• mandated coverage; • administrative procedures or court rulings; • industry or occupational mix in the state; • unemployment level (more workers means more risk); • wages (benefits are linked to wages); • health care practices; • claims frequency and severity; and • reporting procedures.
Because of these factors, it is sometimes difficult to analyze workers’ comp data in a single state and to make interstate comparisons. Ups and Downs of Workers’ Comp The workers’ comp system goes through a regular cycle of rising and falling premiums. The causes behind the insurance cycle are not precisely identified, but three different economic trends are known to contribute to the cycle: the employment/unemployment cycle, the investment cycle and the underwriting cycle. First, workers’ comp claims ebb and flow somewhat with changes in unemployment. When unemployment rises, previously injured workers are more likely to file a claim, especially if they have already been laid off. Additionally, workers receiving workers’ comp have an incentive to wait out the unemployment cycle, which increases costs. Second, premiums tend to rise and fall in tandem with changes in the stock and bond markets. When stocks are doing well and interest rates are high, insurers tend to compete with lower premiums to attract more customers. When stock and bond markets aren’t doing as well, insurers tend to increase premiums. Third, during a soft market when insurance is relatively available and affordable, insurers tend to practice aggressive pricing in order to increase market share. Eventually, they realize that the premiums collected fall short of covering the claims costs. They then start to tighten underwriting by setting strict rules regarding who can purchase policies and increasing premium prices, thereby limiting the supply of insurance on the market. This leads to a hard market, meaning that insurance is less available and affordable.28 Workers’ Comp through the Years The workers’ comp system has experienced problems before. Workers’ comp benefits grew by double digits in the late 1980s. There is some evidence that there was a higher tendency to report workers’ comp claims during the late 1980s. 29 However, the primary reason for the crisis, it has been argued, was that premiums did not increase enough to cover the costs of the workers’ comp system. 30 At the time, many states regulated premium increases. Sometimes premiums were not allowed to rise enough to cover the increase in costs. Consequently, some insurers chose not to sell premiums. During the late 1980s and early 1990s, some states set premiums in the residual market that did not take the inherently higher costs of the residual market into account. This contributed to insurance losses. To deal with the losses, some states assessed fees on private sector insurers. This added cost increased the need for private insurers to raise rates. In response to the situation, many states stopped regulating rates in the late 1980s and early 1990s. In addition, many states emphasized worker safety and return-to-work programs. For example, some states started to allow employer deductibles, which provided an incentive for employers to promote worker safety. To deal with rising medical costs, several states began to allow managed care options. Medical costs did not rise very much in the early 1990s, partly because of one-time cost savings from implementation of managed care. By the end of the decade, however, these one-time savings were exhausted but many insurers did not raise their premiums accordingly.

11
Worker injury rates and workers’ comp claims declined in the 1990s. The 1990s also saw lower benefits and costs for other reasons, including rate deregulation. High profits ensued as the economy and the stock market were strong. This, however, led to price undercutting as insurers competed for business by pricing premiums below cost. (This situation is very similar to that of the medical malpractice insurance market. For more information on the medical malpractice crisis, go to www.csg.org; keyword: medical malpractice). 3. Policy Options Several states are experiencing or have experienced problems with workers’ comp pricing and access in the last few years. Recent efforts by policy-makers to control the rapidly rising workers’ comp costs while maintaining access to benefits for injured workers have produced a high degree of experimentation and a rapidly changing legislative and regulatory environment. This TrendsAlert outlines policy and program options that address some of the major cost drivers in the workers’ comp system. This section focuses on cost containment strategies that address:
• worker safety issues; • medical costs; and • system inefficiencies, such as economic inefficiencies, administrative inefficiencies, fraud and
excessive litigation. In addition to changing benefit levels, which is not the focus of this section, states can choose a range of cost containment strategies to address the rising costs of workers’ comp insurance. There is no magic bullet. States that have had relatively stable costs over the years have several similar characteristics, but they differ in many ways as well. Therefore, it is virtually impossible to list the elements of the “perfect” workers’ comp system. Workplace Safety and Return-to-Work Programs Put simply, fewer accidents mean fewer chances of lost workdays. Since the vast majority of workers’ comp costs are related to indemnity or reimbursement for lost wages, workplace safety is a key element in reducing the number of accidents and achieving lower workers’ compensation insurance costs.31 In addition, states can also implement return-to-work programs that lead to lower workers’ comp costs. Workplace Safety Programs During the 1990s, states implemented four types of workplace safety regulations that are more stringent than traditional federal OSHA standards:
• Employer safety committee laws are mandated by general state statutes or workers’ compensation regulations. The purpose of safety committees is to involve employees in achieving and maintaining a safe workplace. Their roles include involvement in workplace inspections and accident investigations.
• Employer safety and health programs are required by general state statutes or regulations. 33 Typical components of such programs include hazard identification and control, as well as safety and health training. While
Figure 3.1 Merits and Drawbacks of Safety and Early Return-to-Work Programs
Workplace Safety Programs Pros
• Reduces number of accidents and therefore decreases costs
Cons • State efforts to mandate workplace safety without
federally approved OSHA plans may be challenged in courts32
Early Return-to-Work Programs Pros
• Offers a “win-win” strategy for both employers and employees
• Helps employer save indemnity costs while allowing employee to resume source of income
Cons • Some injuries may be too serious for early return • Permanent total disability claimants will not be able
to resume work

12
some states make workplace health and safety programs mandatory for either all employers or the ones with high injury rates, other states have encouraged voluntary programs through statutory language.34
• Insurance carrier loss control services employ a strategy of curbing costs through mandating that insurance carriers assist policyholders with drafting and implementing health and safety programs.35
• An increasingly popular approach of targeted initiatives involves imposing mandatory safety requirements on employers with above-average injury or workers’ compensation loss rates.
The statutory initiatives to control workers’ compensation costs through improvements in workplace health and safety are found in two places: state workers’ compensation authority and the state OSHA agency (if the state has an approved OSHA plan). Although currently 24 states operate safety programs that are approved by OSHA, most of them have adopted standards identical to federal ones, and do not include comprehensive safety and health program requirements. With the exception of California, Minnesota and North Carolina, mandatory safety and health programs are found either under a state’s occupational safety and health program or its workers’ compensation program, but not both.36 Some states, such as Oregon, have placed their OSHA and workers’ compensation agencies under the same department to achieve efficiency and increase coordination.37 Refer to Table 3.1 for more information on state worker safety programs. States have also promoted safe workplace environments through financial incentives. In some states that partially regulate worker’s comp insurance rates, a rate credit or discount system rewards employers with superior workplace safety programs.38 Also, in a majority of states, optional medical deductibles are included in workers’ comp insurance policies.39 Legislative changes have raised the allowable deductible limits, encouraging better safety records among employers that have to pay these deductibles.40 Labor safety data indicate that similar legislative reforms in the early 1990s significantly improved workplace safety and contributed to the decline of occupational injury and illness rates. The Insurance Information Institute reported that, between 1980 and 1990, claim costs increased an average of 11 percent.41 Between 1991 and 1995, however, they increased by only 2 percent. The institute identified successful accident prevention regulations enacted in the states in early 1990s as a reason for the decline.42 According to Tony Skiff, director of workers’ education for the Connecticut Compensation Commission, “safety is the most direct, effective method of reducing workers’ compensation caseloads and costs.”43 Workplace safety initiatives, in combination with rate deregulation which is discussed below, have synergistic effects. Deregulation enhances safety initiatives because firms can evaluate individual firm records and reward good prevention practices by lower insurance rates.
Table 3.1 Workplace Safety Programs In the States
State
State OSHA Approved Program
Safety Initiatives to Limit Workers’ Compensation Costs Initiative Description
Alabama
Alaska All employers
Arizona All employers
Insurance Carrier Loss Control Regulations Carriers’ loss control plans reviewed by state Arkansas
Targeting Initiatives Hazardous employer program under WC

13
Table 3.1 Workplace Safety Programs In the States (cont.)
Safety and Health Program Laws All employers
Insurance Carrier Loss Control Regulations Loss certification program (carriers reviewed by state) California All employers
Targeting Initiatives Targeted inspection and consultation programs
Colorado
Safety Committee Laws Employers with 25 or more employees Connecticut Public sector
only Targeting Initiatives Safety committee required if employer has above average rates
Delaware
Safety Committee Laws Employers with 20 or more employees
Insurance Carrier Loss Control Regulations Various requirements affecting carrier loss control services Florida
Targeting Initiatives Employers with above average SIC injury rate plus three or more lost-time injuries within three years must implement a safety and health program
Georgia
Hawaii All employers Safety and Health Program Laws Employers with 25 or more employees
Idaho
Illinois
Indiana All employers
Iowa All employers
Kansas Insurance Carrier Loss Control Regulations Carriers must help policyholders establish a safety and health program
Kentucky All employers
Safety and Health Program Laws Employers with 15 or more employees Louisiana
Targeting Initiatives Hazardous employer law
Insurance Carrier Loss Control Regulations Various requirements affecting carrier loss control services
Maine Targeting Initiatives Employers with WC experience rating of 2 or more
must submit safety plan to state Maryland All employers
Massachusetts
Michigan All employers
Safety Committee Laws Employers with 25 or more employees
Safety and Health Program Laws All employers in certain SIC codes Minnesota All employers
Targeting Initiatives Safety committees required for certain employers who meet WC loss or injury rate criteria; also state targeted inspection program through state OSHA
Mississippi
Insurance Carrier Loss Control Regulations
Carriers must help policyholders establish a safety and health program
Missouri Insurance Carrier Loss Control Regulations Carriers must have safety engineering and management plan approved by state
Safety Committee Laws Employers with 5 or more employees Montana
Safety and Health Program Laws All employers

14
Table 3.1 Workplace Safety Programs In the States (cont.)
Safety Committee Laws All employers
Safety and Health Program Laws All employers Nebraska
Targeting Initiatives Targeted consultation program for certain employers with high injury rates
Safety Committee Laws
Employers with 25 or more employees
Safety and Health Program Laws
Employers with 11 or more employees Nevada All employers
Targeting Initiatives
Safety program required if employer meets experience rating criteria
Safety Committee Laws Employers with 10 or more employees New Hampshire
Safety and Health Program Laws Employers with 5 or more employees
New Jersey Public sector only
Insurance Carrier Loss Control Regulations Carriers must help policyholders establish a safety and health program; annual inspection required New Mexico All employers
Targeting Initiatives Hazardous employer law
New York Public sector only Targeting Initiatives
Certain employers who meet payroll requirements and experience rating criteria must establish safety and loss prevention plan
North Carolina All employers Safety program required if WC experience modification of 1.5 times the average
North Dakota
Ohio
Insurance Carrier Loss Control Regulations Carriers must help policyholders establish a safety and health program Oklahoma
Targeting Initiatives Employers targeted for safety programs if injury/illness rate is 1.25 times the average
Safety Committee Laws Employers with 11 or more employees
Insurance Carrier Loss Control Regulations Insurer loss prevention plan required (state oversight) Oregon All employers
Targeting Initiatives Safety committee required for employers with 10 or fewer employees and if lost-workday incident rate in top 10 percent
Pennsylvania
Rhode Island
South Carolina All employers
South Dakota
Tennessee All employers Targeting Initiatives Safety committees required for certain employers who meet WC experience modification criteria
Insurance Carrier Loss Control Regulations Various requirements affecting carrier loss control services Texas
Targeting Initiatives Hazardous employer law
Utah All employers Targeting Initiatives Employers with above average rates must implement a safety program
Vermont All employers
Virginia All employers
15
Table 3.1 Workplace Safety Programs In the States (cont.)
Safety Committee Laws Employers with 11 or more employees Washington All employers
Safety and Health Program Laws All employers
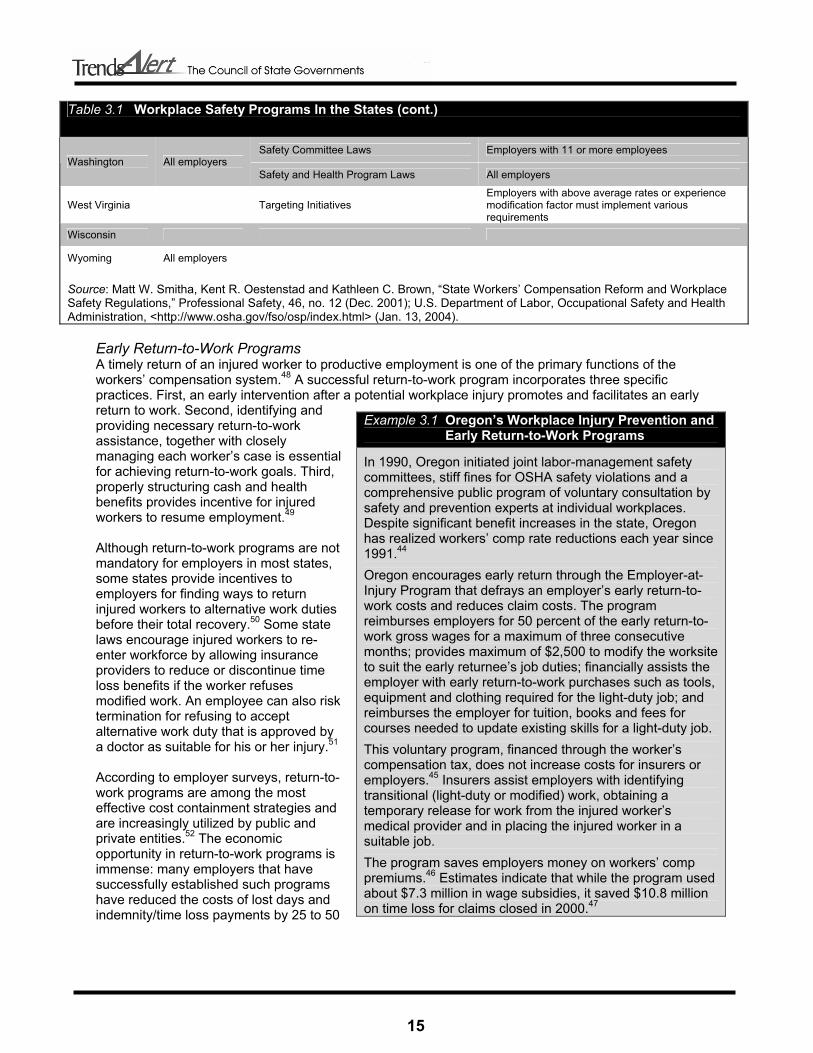
West Virginia Targeting Initiatives Employers with above average rates or experience modification factor must implement various requirements
Wisconsin
Wyoming All employers
Source: Matt W. Smitha, Kent R. Oestenstad and Kathleen C. Brown, “State Workers’ Compensation Reform and Workplace Safety Regulations,” Professional Safety, 46, no. 12 (Dec. 2001); U.S. Department of Labor, Occupational Safety and Health Administration, <http://www.osha.gov/fso/osp/index.html> (Jan. 13, 2004).
Early Return-to-Work Programs A timely return of an injured worker to productive employment is one of the primary functions of the workers’ compensation system.48 A successful return-to-work program incorporates three specific practices. First, an early intervention after a potential workplace injury promotes and facilitates an early return to work. Second, identifying and providing necessary return-to-work assistance, together with closely managing each worker’s case is essential for achieving return-to-work goals. Third, properly structuring cash and health benefits provides incentive for injured workers to resume employment.49 Although return-to-work programs are not mandatory for employers in most states, some states provide incentives to employers for finding ways to return injured workers to alternative work duties before their total recovery.50 Some state laws encourage injured workers to re-enter workforce by allowing insurance providers to reduce or discontinue time loss benefits if the worker refuses modified work. An employee can also risk termination for refusing to accept alternative work duty that is approved by a doctor as suitable for his or her injury.51 According to employer surveys, return-to-work programs are among the most effective cost containment strategies and are increasingly utilized by public and private entities.52 The economic opportunity in return-to-work programs is immense: many employers that have successfully established such programs have reduced the costs of lost days and indemnity/time loss payments by 25 to 50
Example 3.1 Oregon’s Workplace Injury Prevention and Early Return-to-Work Programs
In 1990, Oregon initiated joint labor-management safety committees, stiff fines for OSHA safety violations and a comprehensive public program of voluntary consultation by safety and prevention experts at individual workplaces. Despite significant benefit increases in the state, Oregon has realized workers’ comp rate reductions each year since 1991.44
Oregon encourages early return through the Employer-at-Injury Program that defrays an employer’s early return-to-work costs and reduces claim costs. The program reimburses employers for 50 percent of the early return-to-work gross wages for a maximum of three consecutive months; provides maximum of $2,500 to modify the worksite to suit the early returnee’s job duties; financially assists the employer with early return-to-work purchases such as tools, equipment and clothing required for the light-duty job; and reimburses the employer for tuition, books and fees for courses needed to update existing skills for a light-duty job.
This voluntary program, financed through the worker’s compensation tax, does not increase costs for insurers or employers.45 Insurers assist employers with identifying transitional (light-duty or modified) work, obtaining a temporary release for work from the injured worker’s medical provider and in placing the injured worker in a suitable job.
The program saves employers money on workers’ comp premiums.46 Estimates indicate that while the program used about $7.3 million in wage subsidies, it saved $10.8 million on time loss for claims closed in 2000.47

16
percent.53 Mid-sized employers (between 1,000 and 1,500 employees) have realized annual savings up to $300,000-$500,000 after implementing return-to-work programs.54 For every $1 invested in implementing a successful program an organization saves $9.55 Return-to-work programs benefit employees as well as employers. When return to work is delayed, employees risk more than their earnings. Special skills may deteriorate; the vacancy might be filled with someone else, and the long absence from work can become an obstacle in seeking future employment. In fact, workers who remain off work for six months or longer have an unemployment rate of 14 percent or more one year later.56 Timely return to work also has health benefits. Evidence suggests that engaging in limited physical activity after low-back injuries can help the employee function and reduce the possibility of long-term injury.57 Medical Cost Containment Strategies For $1 spent on workers’ compensation, about 40 cents is spent on medical care, and the rest is spent on reimbursement for lost wages.58 For a typical claim involving more than seven days of lost work, medical expenses total approximately $4,753.59 Physicians account for 33 percent of the average workers’ compensation medical payment, hospitals for 34 percent, physical and occupational therapists for 11 percent, chiropractors for 4 percent, and other medical providers, including unclassified providers, for 18 percent.60 In addition to comprising 40 percent of all workers’ compensation costs, medical costs are increasing at a very rapid rate. The policy and program options outlined below focus on helping state officials deal with these medical cost drivers. Options include:
• state provider choice laws; • health care provider networks; • fee schedules; • treatment guidelines and utilization review; • case management; and • use of generic drugs.
State lawmakers should note, however, that past successes in curbing the medical costs growth rate in group health plans have been relatively short-lived. Medical cost containment in the future will be more difficult to realize because “much of the low lying cost containment fruit was harvested in the cost containment activities of the 1990s.”61 But there are still cost savings to be captured. The central concept in health care cost containment efforts of the 1990s is the managed care arrangement. Managed care is an umbrella term that describes a wide range of systems and techniques that are used to control the utilization and costs of health care services. The core principle of managed care in workers’ compensation is the existence of special network of health care providers that contract insurers to treat the injured workers covered by the policy. In order to control health care costs, these managed care organizations perform utilization reviews, institute medical fee schedules and offer case-to-case management of claims. Managed care organizations involved in workers’ compensation have also responded to market demands by offering additional services not mandated by state regulations, such as medical bill auditing, counseling and educating businesses about workers’ comp system, and promoting early return-to-work initiatives.62 Since the proliferation of these cost-saving measures in 1990s, numerous studies have assessed their benefit for the workers’ compensation systems in the states. These studies point to a great potential of managed care techniques to curb the growth of health care costs. For example, a Washington state workers’ comp managed care pilot evaluation found that the use of managed care techniques for workers’

17
comp claims lowered costs per injury by an average of 21.5 percent, mainly due to reduction in outpatient services such as X-rays and physical therapy. 63On the downside, studies have also found lower patient satisfaction with the quality of treatment through managed care arrangements.
Provider Choice Laws States regulate injured workers’ ability to choose or change medical providers to different degrees. Twenty-four states mandate some form of restriction on employee’s choice of medical provider for a workers’ compensation claim. New York, for example, mandates selection from a list prepared by state agency. Georgia, Tennessee and Virginia mandate selection from lists maintained by employers. Ten states give the employer sole responsibility for selecting a physician to handle workers’ compensation claims. In seven states, employers make the initial selection, but after specified periods stated in the law, employees have free choice. In Arkansas, Colorado and Idaho, the initial physician selection by employer may be changed by the state agency.64 Changing a state’s law from “employee choice” to “employer choice” results in roughly 7 to 10 percent reduction in medical costs.65 The cost reduction is related to employers’ tendency to participate in health provider networks.66 Employer control over physician choice raises network involvement by 15 to 20 percent for treatment given four to nine months after an injury and by 25 to 30 percent after 10 months of treatment.67 In other words, employers are more likely to choose networks, and the cost savings come from health care
network participation, which is discussed below.
Figure 3.2 Merits and Drawbacks of Medical Cost Cutting Measures
Employer Choice of Physician Laws Pros
• Promotes the use of special provider networks • Discourages over-utilization of a medical service
Cons • Restricts employees’ flexibility and choice of physician • Can adversely affect the quality of workers’ compensation
benefits received Health Care Provider Networks
Pros • Provides medical expertise in occupational medicine • Better coordinates and integrates care for injured workers • Offers discounted prices and standardized services that
significantly reduce medical care costs Cons
• Possibility of lower patient satisfaction with delivered care because of fewer medical services offered within a network
Medical Fee Schedules Pros
• Controls medical costs by increasing the efficiency of delivering the required medical care
• Makes resolution of disputed over excessive charges easier
• Increases the consistency of procedure definitions and admissible charges
Cons • May cause medical treatment utilization to increase to
compensate for financial losses to providers
Treatment Guidelines and Utilization Reviews Pros
• Ensures that injured workers receive the right treatment at the right time
• Deters over- and under-utilization of physician services and other professional medical services and products
Cons • Limits the utility of the latest medical innovations and
discoveries • Stifles the development of more effective treatments for
injuries sustained in a constantly changing workplace environment
Promotion of Generic Drugs Pros
• Addresses the most rapidly rising group of medical costs Cons
• May not offer a generic alternative for some medications

18
Table 3.2 Medical Cost Containment Measures in the States (As of May 2001)
State Provider Fee Schedule
Mandated Bill Review
Treatment Guidelines
Mandated Utilization Review
Case Management1
Promotion of Generic Drugs2
Alabama Yes No No No No No Alaska Yes No Yes* No No No Arizona Yes No No No No No Arkansas Yes Yes Yes No Yes Yes California Yes No Yes Yes* No No Colorado Yes Yes Yes Yes Yes Yes Connecticut Yes No Yes No No No Delaware No No No No No No Florida Yes Yes Yes Yes Yes Yes Georgia Yes No No No Yes No Hawaii Yes No Yes* No No Yes Idaho Yes No No No No No Illinois No No No No No No Indiana No No No No No No Iowa No No No No No No Kansas Yes No No No No No Kentucky Yes Yes Yes Yes Yes Yes Louisiana Yes Yes No Yes No No Maine Yes No Yes Yes No Yes Maryland Yes No No No No No Massachusetts Yes No Yes Yes No No Michigan Yes Yes No Yes No Yes Minnesota Yes No Yes No Yes Yes Mississippi Yes Yes No Yes No Yes Missouri No No No No No No Montana Yes No No No Yes Yes Nebraska Yes No No No Yes No Nevada Yes Yes Yes No No Yes New Hampshire No No No No No No New Jersey No No No No Yes No New Mexico Yes No No Yes No No New York Yes No No No No No North Carolina Yes Yes Yes* No No No North Dakota Yes Yes No Yes Yes Yes Ohio Yes Yes No Yes Yes Yes Oklahoma Yes No Yes No Yes Yes Oregon Yes Yes No No Yes No Pennsylvania Yes No No No Yes No Rhode Island Yes No Yes Yes* No No South Carolina Yes Yes No No No No South Dakota Yes No Yes* No Yes No Tennessee No No No Yes Yes No Texas Yes Yes Yes Yes No Yes

19
Table 3.2 Medical Cost Containment Measures in the States (cont.)
Utah Yes No Yes Yes No No Vermont Yes No No No No Yes Virginia No No No No No No Washington Yes Yes Yes Yes No Yes West Virginia Yes Yes Yes Yes Yes Yes Wisconsin Yes No No No No No Wyoming Yes Yes Yes Yes No Yes TOTALS 41 17 21 19 17 19 1 Except Colorado and Tennessee, states do not mandate the use of medical case management outside the provider networks. Instead, managed care organizations must offer case management to be certified to handle workers’ comp cases. In Colorado, employers that opt out of a managed care arrangement must choose medical case management. In Tennessee, claims that meet certain treatment or financial criteria necessitate case management. 2 Promotion of generic drugs means that the state’s workers’ comp regulations require that a generic drug is dispensed when available unless the doctors specifies to “dispense as written.” Alaska: Treatment guidelines limit the physical therapy and chiropractic treatment utilization. California: Utilization review is required for health care organizations. If insurers or self insured employers choose to implement utilization reviews, they must follow the state standards. Colorado: In several designated counties managed care through designated organizations is mandatory. Case management is allowed in lieu of managed care organizations. If service or procedure is not specified under treatment guidelines or fee schedule, prior authorization is required. Hawaii: Guidelines set the maximum utilization level. New Hampshire: Managed care is mandated for residual markets North Carolina: Treatment guidelines limit the utilization of rehabilitation, chiropractic and physical therapy visits. North Dakota: Managed care is required only for employers with agency-approved risk management plan. Mandatory managed care includes case management, bill review, and utilization review. The exclusive state fund might contract a third party to provide these services. Rhode Island: Utilization review is required only for surgical procedures. South Dakota: Employees may obtain treatment with non-network providers only if these providers agree to abide by the terms of the agreement. Treatment guidelines stipulate duration limits and return-to-work programs. Source: Ramona P. Tanabe and Susan M. Murray, Managed Care and Medical Cost Containment in Workers’ Compensation: A National Inventory, 2001-2002. Workers Compensation Research Institute, Cambridge, Massachusetts, 2001.
Health Care Provider Networks The emergence of workers’ comp health care networks in the past decade has altered the way the workers’ comp claimants receive health care. These networks consist of health care providers that organize to contract with workers’ compensation insurance carriers to provide health care for injured workers, often at discounted prices. The use of networks for workers’ comp claims has a number of benefits. Networks often include occupational medicine specialists with competencies in recognizing and treating work-related illnesses, injuries and disabilities.68 The specialized knowledge of injury prevention, workplace hazards and the workers’ compensation system allows the specialized network physicians to better coordinate and integrate care for injured workers.69 As mentioned above, mandating employer’s choice of medical provider is one way to promote the use of preferred provider networks. Another way is to require insurance carriers to disburse payments for treating workers’ comp patients only to providers with certain occupational medicine credentials or who have participated in state-mandated workers’ compensation training.
20
Documenting a track record of medical providers is another indirect method of promoting networks in workers’ compensation. This will enable an insurer to check medical care provider’s credentials before disbursing a payment to make sure that the physician or the facility treating an injured person meets the minimum required qualifications.70 A number of comprehensive studies covering diverse states and time periods find that specialized networks reduce medical costs.71 The costs for claims treated in workers’ comp networks are significantly lower than non-network claims costs.72 The lower costs are primarily due to network providers using fewer services than non-network providers when treating similar claims. In addition, networks generally charge lower prices. 73 More specifically, research conducted by the Workers Compensation Research Institute indicates that restricting care to designated provider networks saves 15 to 40 percent of medical costs in workers’ compensation claims.74 Studies that examine the impact of networks on duration of disability and recovery indicate that network patients are as healthy as patients outside the network, and there is no difference in the duration of disability between the two groups. On the other hand, several studies have found a lower patient satisfaction under managed care arrangements.75 Finding the right balance between affordability and quality of care is a crucial task. If the push towards using special networks for workers’ comp claims results in inferior quality of care or the perception of inferior quality of care, policy-makers may face considerable pressure from critics to limit the expansion of such programs. Such backlash has already spawned “Patients’ Rights” legislation geared to restrict managed care practices in the group health field in some states.76
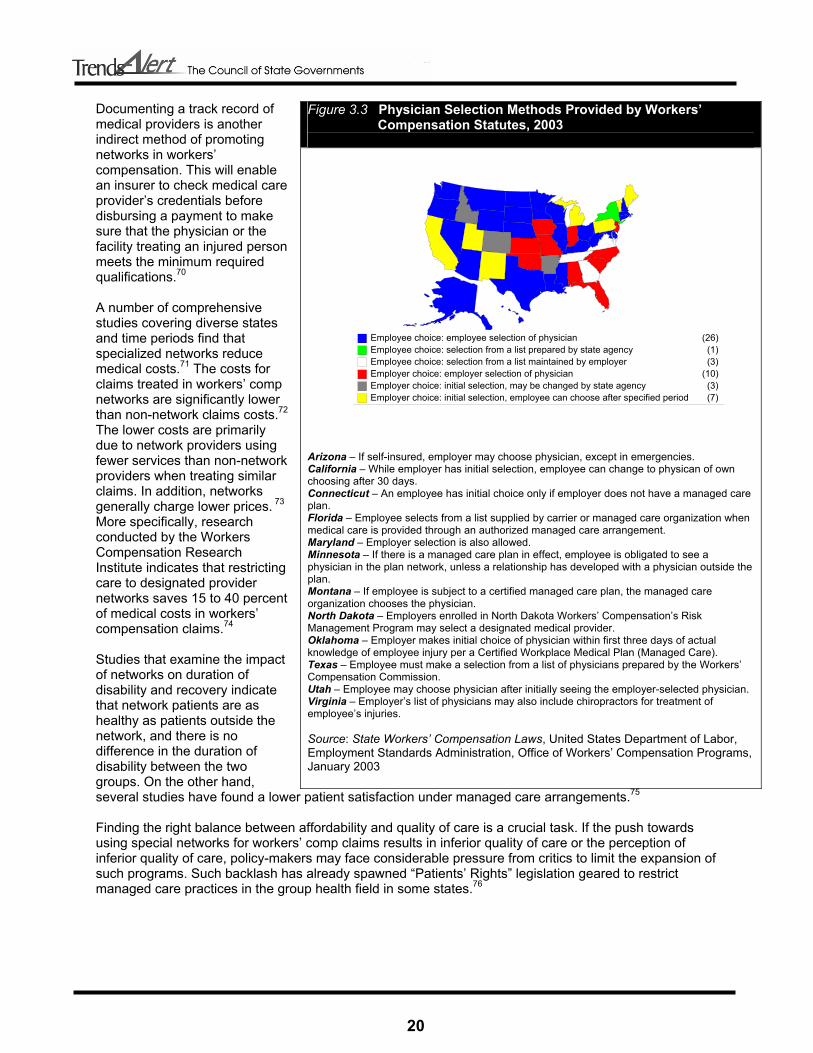
Figure 3.3 Physician Selection Methods Provided by Workers’ Compensation Statutes, 2003
Arizona – If self-insured, employer may choose physician, except in emergencies. California – While employer has initial selection, employee can change to physican of own choosing after 30 days. Connecticut – An employee has initial choice only if employer does not have a managed care plan. Florida – Employee selects from a list supplied by carrier or managed care organization when medical care is provided through an authorized managed care arrangement. Maryland – Employer selection is also allowed. Minnesota – If there is a managed care plan in effect, employee is obligated to see a physician in the plan network, unless a relationship has developed with a physician outside the plan. Montana – If employee is subject to a certified managed care plan, the managed care organization chooses the physician. North Dakota – Employers enrolled in North Dakota Workers’ Compensation’s Risk Management Program may select a designated medical provider. Oklahoma – Employer makes initial choice of physician within first three days of actual knowledge of employee injury per a Certified Workplace Medical Plan (Managed Care). Texas – Employee must make a selection from a list of physicians prepared by the Workers’ Compensation Commission. Utah – Employee may choose physician after initially seeing the employer-selected physician. Virginia – Employer’s list of physicians may also include chiropractors for treatment of employee’s injuries. Source: State Workers’ Compensation Laws, United States Department of Labor, Employment Standards Administration, Office of Workers’ Compensation Programs, January 2003
Employee choice: employee selection of physician (26)Employee choice: selection from a list prepared by state agency (1)Employee choice: selection from a list maintained by employer (3)Employer choice: employer selection of physician (10)Employer choice: initial selection, may be changed by state agency (3)Employer choice: initial selection, employee can choose after specified period (7)

21
Medical Provider Fee Schedules and Bill Review Forty-one states have implemented fee schedules to set the maximum reimbursement levels for workers’ compensation claims.77 Medical fee schedules are generally determined by state workers’ compensation agencies and represent a list of predetermined payments for medical services for injured workers. Fee schedules are instrumental in restricting providers’ fees and in increasing the consistency of procedure definitions and admissible charges. Also, fee schedules make the resolution of disputes over excessive charges easier. The services covered and the methodologies for developing reimbursement levels vary widely from state to state. Medicare’s resource-based relative value scale (RBRVS) has emerged as one of the leading methods for designing fee schedules.78 In the RBRVS system, the costs of resources needed to provide services determine the payments. Three components make up the cost of providing each service: physician work, practice expense and professional liability insurance. A physician’s work accounts for, on average, 55 percent of the total relative value for each service. Physician work is determined by using such factors as the time required to perform the service; the technical skill and physical effort; the mental effort and judgment; and stress due to the potential risk to the patient. The practice expense component of the RBRVS describes the usual supplies, equipment, overhead, staff and general expenses required to perform the procedure, and accounts for an average of 42 percent of the total relative value for each service. The professional liability insurance component reflects the potential malpractice implications of the procedure and accounts for 3 percent of the total relative value.79 Bill review is the most common procedure of enforcing medical fee schedules. As a rule, bill review programs evaluate patients’ bills to make sure that charges coincide with a fee schedule, no duplicate bills are submitted and the indicated services were in fact performed. Most states rely on private insurance providers for conducting their own bill reviews and require state agencies to review bills only when a dispute develops. Seventeen states mandate regular bill review by a state workers’ compensation agency, by the insurance company paying the bill or by both. In five states, exclusive state workers’ comp funds conduct bill reviews.80 Medical fee schedules can generate a number of concerns regarding access to care, quality of care and efficiency. If health care providers are forced to turn away workers’ comp patients because the medical fee schedule doesn’t cover the cost of the care provided, an injured worker’s access to quality care is eroded. In Hawaii, for example, private health insurance pays average fees that are comparable to 135 percent of the Medicare-RBRVS, while payments to injured workers are capped at 110 percent.81 Health care providers in the state claim the disparity in payments for similar treatments is driving health care providers away from accepting workers’ compensation patients and away from the state as well.82 The quality of care for injured workers is likely to suffer if fewer health care providers are available to treat injured workers. Policy-makers should be aware that when cost containment measures such as fee schedules lower the price of medical care, providers may have an incentive to increase the number of visits and the amount of services provided to injured workers unless the number of visits is restricted. For example, although California caps the chiropractor visit fee, it places no limit on the number of visits. As a result, the average number of visits to a chiropractor on a workers’ comp claim in the state is 34, compared to 14 nationwide.83 For this reason, fee schedules will be most effective in conjunction with other measures that also limit utilization, such as utilization reviews and treatment guidelines. States should also be careful not to compromise efficiency by instituting fee schedules. Massachusetts, for example, has long had a surgical fee schedule well below the prevailing group health plan rates. As a result, few surgeons accept the formal fees and negotiations frequently precede surgeries.84 Such inefficient regulatory feature prolongs injured workers’ disability, raises surgical fees and increases payments to replace lost wages.85
22
The key to addressing these concerns is a regular revision of the workers’ compensation medical fee schedule that reflects current conditions and criteria as they apply to the injured workers’ care and treatment in the state. Medicare applies a dollar conversion factor to the relative value for a given service to convert it into a payment amount. A multiplier can be applied to the Medicare conversion factor to establish a payment level that is adequate to provide access to high quality care for injured workers. Setting the rate too low may create access problems while setting the rate too high may encourage unnecessary utilization and result in excessive program expenditures.86 To set effective rates, states can establish advisory boards that include representatives from health care providers, the insurance industry, the business community, state labor agencies and unions. The board’s duties may include monitoring updates and adjustments to the Medicare schedule and deciding whether to accept or modify similar adjustments to medical fee schedules for workers’ compensation.87
Treatment Guidelines and Utilization Review The development and use of treatment guidelines is a new but rapidly growing area in workers’ comp cost containment.88 The number of states using the treatment guidelines grew from 12 in 1996 to 20 in 2002.89 Considerable variation in treatment of similar occupational injuries, poor quality of delivered health care, evidence of inappropriate utilization of certain medical procedures and rapidly rising health care costs fueled strong interest in treatment guidelines in the 1990s.90 Guidelines provide standards for the treatment reasonably required to relieve the effects of workers’ injuries and are presumed correct unless medical opinion establishes the need for a departure from those guidelines. Such measures can ensure that injured workers receive the right treatment at the right time, control medical costs and increase the efficiency of delivering the required medical care. States can also adopt a standardized set of treatment utilization guidelines based on clinical evidence. Such guidelines will deter over- and under-utilization of physician services and other professional medical services and products.91 State workers’ comp agencies, or medical entities within the agencies, are usually responsible for developing treatment guidelines. The drafts of such guidelines may be based either on input from a special medical advisory panel or published literature and scientific studies. Because panels often include political appointees and lobbyists, a concern exists that special-interest groups might influence guidelines to promote particular agenda at the expense of efficiency and cost-effectiveness. On the other hand, guidelines based solely on scientific studies may leave out important input from individual physicians with first-hand knowledge of occupational injuries and their treatment.92 Traditionally, the drafters of workers’ compensation treatment guidelines have given more weight to the consensus of expert panels over scientific studies.93 To ensure patients’ rights, a denial of significant treatment should not be based solely on treatment guidelines. Instead, consideration of individual patient circumstances by a physician, as well as certain appeal procedures, should be a part of the workers’ compensation system.94 States that implement treatment guides may update them with adequate frequency to reflect such changes as technological innovations and medical treatment advancements. Most states with treatment guidelines have no statutory requirements for reviewing treatment guidelines and instead respond to complaints to identify outdated areas and implement changes on an “as needed” basis. Five states – Colorado, Florida, Kentucky, Massachusetts and Texas – require that guidelines be reviewed regularly. Three states – Minnesota, Nevada and North Carolina – mandate reviews but have no specific schedules.95 Also, states may want to devise means for educating medical providers about the guidelines and their updates to ensure compliance. Only South Dakota mandates informing providers about the changes in the guidelines, while most states distribute information to providers upon request.96 Utilization review is one way to make sure that guidelines are being followed. Utilization review is used by insurers to review, approve, modify or deny physicians’ requests for treating patients based on clinically accepted medical guidelines and often outside the managed care programs. Utilization review may include a case-by-case analysis of the necessity of admission and appropriate lengths of hospital stays

23
for injured workers. In some states, utilization review is produced by a peer review group, while in others by a public agency, such as a workers’ compensation commission. The number of states that mandate utilization reviews increased from nine in 1990 to 19 by 2002.97 Twelve states mandate utilization review programs for private insurers only, seven states require state agency or exclusive state fund to perform the review, and two states mandate both private insurers and state entities to carry out utilization review. Fifteen states require preauthorization for certain procedures or preadmission requirements for non-emergency hospitalization, or both. 98 As with the treatment guidelines, the states should balance the need for using utilization review against the need for easy and expedient patient access to the required health care for occupational injuries.99 Case Management Case management for workers’ compensation claims is a proactive approach that assigns a manager (usually a nurse) to an injured worker to craft individualized treatment and care plans. Although case management is usually a component of a managed care organization, insurers also employ it to improve claims-handling. The goal of case management is to ensure a comprehensive treatment plan tailored for particular health care needs of every injured worker. This plan is coordinated between the worker, the employer, the insurance carrier and the health care provider to facilitate the expedient recovery and early return to productive employment. Typically, a case manager is assigned to a patient to oversee every step of his or her treatment and recovery, including referrals to qualified specialists, expedited office visits and avoidance of treatment delays. A case manager also acts as a liaison between the patient and all the other parties involved in the claim.100 Only two states mandate case management for workers’ compensation claims; in Colorado, case management is required for employers that do not participate in managed care organizations and in Tennessee claims that meet certain treatment and/or financial criteria necessitate case management. In 18 additional states, managed care organizations are required to provide case management in order to obtain state certification for covering workers’ compensation claims.101
Promotion of Generic Drugs Drug costs have been rising faster than physician or hospital costs for workers’ comp programs.102 Most of the proven techniques of controlling costs in traditional health care programs, however, are not permitted in workers’ comp programs. Since workers’ compensation laws require that the injured employees pay nothing for their treatment, employers cannot use the financial incentives such as co-payments or deductibles to control medication utilization or costs.103 Instead, state officials can cut costs by promoting the use of less expensive generic drugs over costly brand-name alternatives for workers’ compensation programs. As of 2003, 19 states have enacted laws that require pharmacies to dispense a generic drug for workers’ comp cases but only if one exists for a given prescription and physician does not prescribe a specific non-generic drug.104 Also, the insurance industry can limit how long individuals can take certain drugs with a high potential for abuse, such as painkillers, without physician’s approval. In a related effort, Washington state is in the process of adopting drug schedules for workers’ compensation patients similar to preferred drug lists for Medicaid that promote medications deemed as effective as costlier alternatives.105 General Cost Containment Strategies Besides policy reforms targeted at stabilizing workers’ compensation costs through preventing injuries, decreasing medical costs and expeditiously returning workers to productive employment, states can consider various experience-based measures that boost system efficiency. These measures involve:
• deregulation and competitive premium rates; • alternative insurance options such as self-insurance and pooled insurance; • advisory councils; • technological innovations;

24
• streamlined workers’ compensation systems for state employees; • fraud prevention; and • curbing litigation in the state workers’ compensation systems.
Figure 3.4 Merits and Drawbacks of General Cost Cutting Measures
Deregulation and Competitive Premium Rates
Pros • Avoids extreme distortions in the market • Increases number of carriers in the market, which improves employers’ choice and may decrease
premiums • Responds to changes in costs more quickly than administered pricing • Allows market-based incentives to prevent injuries
Cons
• Can lead to excessive price-cutting and contribute to the volatility of the system
Individual and Group (Pooled) Self-Insurance Pros
• Allows employers to retain insurance investment earnings, control claims costs and improve employee relations by speeding payouts
• Provides better safety and loss control, more stable rate fluctuations and pride of ownership • No tax liability on premiums
Cons • Members share in costs when losses exceed underwriting expectations • Unpredictability of claims costs • Poor underwriting and pricing can lead to dissolution
Advisory Councils Pros
• Provides institutionalized forum where trade-offs can be forged and mutually acceptable solutions can be developed by workers’ comp system stakeholders
• Consolidates stakeholder interests through agenda-setting and policy formulation • Oversees the implementation and evaluation of changes to the system
Cons • Not easily transferable across states because of a larger political, economic and institutional
frameworks in which they operate
Fraud Prevention Pros
• Eliminates a significant source of inefficiency and high costs Cons
• May create an atmosphere of fear and intimidation that discourages legitimate claims
Litigation Controls Pros
• Minimizes overall financial expenditures for a workers’ compensation claim Cons
• May prevent injured workers from receiving a maximum mandated benefits, especially if system is difficult to negotiate

25
Deregulation and Competitive Premium Rates The regulatory environment in the workers’ compensation market can take three basic forms:
• Administered pricing represents a highly regulated environment; • Partial deregulation allows for a degree of flexibility in rate setting process; and • Competitive rating is a comprehensive form of deregulation that allows open competition in
insurance prices.106 While 37 states have adopted competitive rating since 1981, some states still adhere to administered pricing or have partially deregulated their price-setting process.107 Administered pricing is a uniform rating system in which all carriers in a state use the same classification rates filed by a rating organization.108 In the past, state policy-makers favored a highly regulated workers’ comp market for the fear that the open competition would force insurers to write policies below the actual cost rates. However, concerns for higher efficiency and lower costs, coupled with a general political atmosphere that favored less government interference in the economy led to a trend towards deregulating insurance markets starting in early 1980s.109 Most widely adopted forms of partial deregulation are the “deviations” and “schedule rating.” In states that allow deviations, individual carriers can adopt rates that differ from those established by rating organizations. While the degree of the deviations varies among insurers, deviations offered by a particular insurer must be uniform for all policyholders in the state and have to be approved by the state insurance commissioner.110 Approximately one-fourth of states permit schedule rating – a discount or rate credit system for employers with superior workplace safety programs.111 Under schedule rating plans, insurers can decrease the rate an individual employer would otherwise pay, based on a subjective evaluation of factors such as the employer’s safety programs. Such plans are created by the rating organizations, are subject to the insurance commissioner’s approval and are uniform for all insurers operating in a particular state.112 A truly competitive rate system allows each insurance carrier to quote rates based on its own experience of claims, losses and other insurance factors. To this end, some states no longer require insurers to adhere to bureau rates. Also, insurers in some jurisdictions do not have to obtain approval from a state regulatory agency prior to using rates.113 Deregulation allows private insurance carriers to compete for business by varying the premiums offered to employers at the beginning of a policy period. Therefore, under competitive rating, employers have an opportunity to shop around for the best rate, causing the insurance prices to go down. In fact, a recent study estimates 11 percent reduction in employer costs when a state moves from pure administered pricing to comprehensive deregulation.114 The cost reduction is even more significant when a state moves from partial deregulation, such as deviations and schedule rating, to complete deregulation. Moreover, the number of carriers in the market increases with deregulation.115 More carriers should increase insurance options for employers and may ultimately decrease the insurance costs116 if carriers do not undercut one another to the extent that their premiums do not cover their costs. A public policy of full deregulation has many additional advantages. First, since regulation is associated with high administrative costs, open competition prevents spending resources on organizational processes that are necessary for determining an optimal rate by a regulatory agency. There is strong statistical evidence that comprehensive deregulation of the workers’ compensation insurance markets results in significantly more efficient delivery system.117 Second, since administered pricing can prevent insurers from setting rates based on actual experience, insurance prices in a highly regulated environment may not reflect employer experience. This reduces incentives for employers to invest in loss control and prevention.118 Although even the administered pricing systems allow for a degree of experience rating, price levels in such systems may be retained
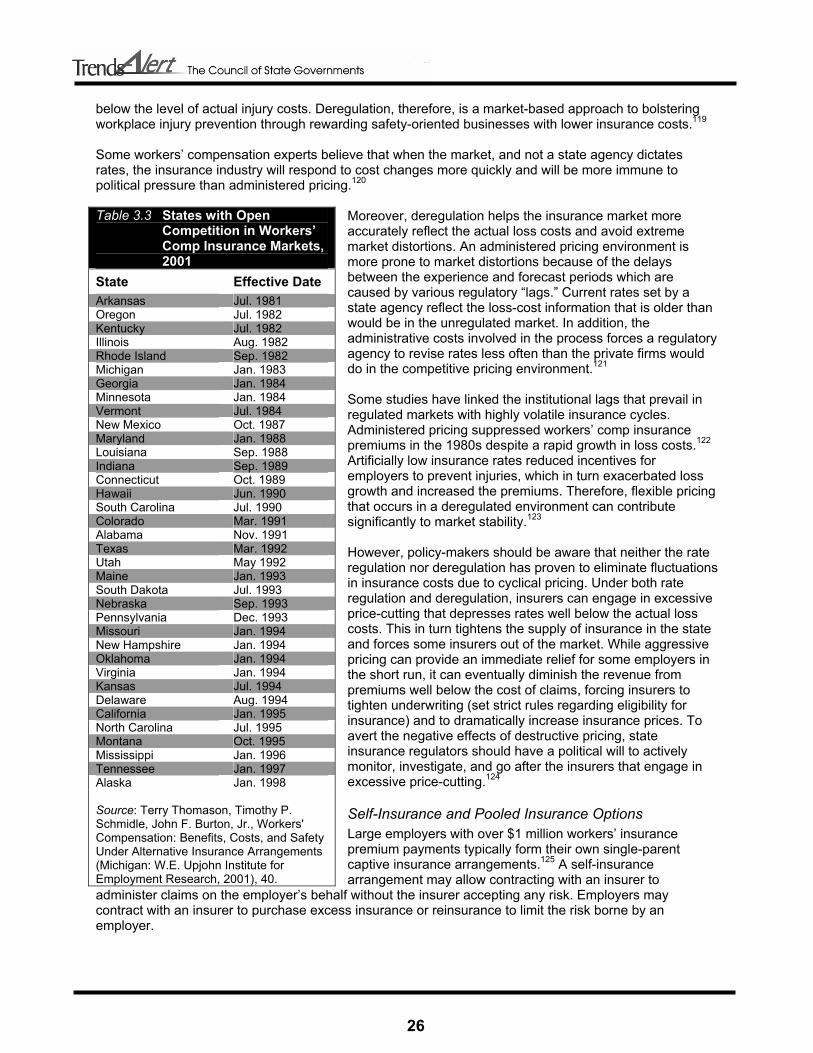
26
below the level of actual injury costs. Deregulation, therefore, is a market-based approach to bolstering workplace injury prevention through rewarding safety-oriented businesses with lower insurance costs.119 Some workers’ compensation experts believe that when the market, and not a state agency dictates rates, the insurance industry will respond to cost changes more quickly and will be more immune to political pressure than administered pricing.120
Moreover, deregulation helps the insurance market more accurately reflect the actual loss costs and avoid extreme market distortions. An administered pricing environment is more prone to market distortions because of the delays between the experience and forecast periods which are caused by various regulatory “lags.” Current rates set by a state agency reflect the loss-cost information that is older than would be in the unregulated market. In addition, the administrative costs involved in the process forces a regulatory agency to revise rates less often than the private firms would do in the competitive pricing environment.121 Some studies have linked the institutional lags that prevail in regulated markets with highly volatile insurance cycles. Administered pricing suppressed workers’ comp insurance premiums in the 1980s despite a rapid growth in loss costs.122 Artificially low insurance rates reduced incentives for employers to prevent injuries, which in turn exacerbated loss growth and increased the premiums. Therefore, flexible pricing that occurs in a deregulated environment can contribute significantly to market stability.123 However, policy-makers should be aware that neither the rate regulation nor deregulation has proven to eliminate fluctuations in insurance costs due to cyclical pricing. Under both rate regulation and deregulation, insurers can engage in excessive price-cutting that depresses rates well below the actual loss costs. This in turn tightens the supply of insurance in the state and forces some insurers out of the market. While aggressive pricing can provide an immediate relief for some employers in the short run, it can eventually diminish the revenue from premiums well below the cost of claims, forcing insurers to tighten underwriting (set strict rules regarding eligibility for insurance) and to dramatically increase insurance prices. To avert the negative effects of destructive pricing, state insurance regulators should have a political will to actively monitor, investigate, and go after the insurers that engage in excessive price-cutting.124
Self-Insurance and Pooled Insurance Options Large employers with over $1 million workers’ insurance premium payments typically form their own single-parent captive insurance arrangements.125 A self-insurance arrangement may allow contracting with an insurer to
administer claims on the employer’s behalf without the insurer accepting any risk. Employers may contract with an insurer to purchase excess insurance or reinsurance to limit the risk borne by an employer.
Table 3.3 States with Open Competition in Workers’ Comp Insurance Markets, 2001 State Effective Date Arkansas Jul. 1981 Oregon Jul. 1982 Kentucky Jul. 1982 Illinois Aug. 1982 Rhode Island Sep. 1982 Michigan Jan. 1983 Georgia Jan. 1984 Minnesota Jan. 1984 Vermont Jul. 1984 New Mexico Oct. 1987 Maryland Jan. 1988 Louisiana Sep. 1988 Indiana Sep. 1989 Connecticut Oct. 1989 Hawaii Jun. 1990 South Carolina Jul. 1990 Colorado Mar. 1991 Alabama Nov. 1991 Texas Mar. 1992 Utah May 1992 Maine Jan. 1993 South Dakota Jul. 1993 Nebraska Sep. 1993 Pennsylvania Dec. 1993 Missouri Jan. 1994 New Hampshire Jan. 1994 Oklahoma Jan. 1994 Virginia Jan. 1994 Kansas Jul. 1994 Delaware Aug. 1994 California Jan. 1995 North Carolina Jul. 1995 Montana Oct. 1995 Mississippi Jan. 1996 Tennessee Jan. 1997 Alaska Jan. 1998 Source: Terry Thomason, Timothy P. Schmidle, John F. Burton, Jr., Workers' Compensation: Benefits, Costs, and Safety Under Alternative Insurance Arrangements (Michigan: W.E. Upjohn Institute for Employment Research, 2001), 40.

27
Self-insurance offers employers a number of advantages. First, a self-insured company can profit from the reserves investment income that it retains. Second, premiums may decrease due to savings from lower overhead expenses. In addition, industry data reveal that self-insurance programs have lower loss experiences than traditional workers’ comp schemes.126 If a smaller company in a particular industry cannot obtain competitive rates from the commercial insurance market and the company is willing to share in its own and others’ risk, group funds can offer a viable alternative in the states that permit group self-insurance.127 Since most pools unite the members of the same type of industry, the insurance policies focus on risk management more narrowly than the ones offered through broad-based commercial providers. The absence of tax liability on premiums is another benefit of pooled self-insurance. Such group self-insurance systems permit small employers in similar industries to band together and benefit from a large pooling of the risk. In this arrangement, members of a pool have a vested interest in keeping costs low. In some industries, self-funded trusts have resulted in 20 to 40 percent savings.128 Besides lower premium costs, a pooled option promises better safety and loss control, more stable rate fluctuations and pride of ownership.129 Self-insurance pools have strict eligibility requirements because underwriting losses are spread among pool members. Individual and group self-insurance plans for businesses have their downsides. If investment, underwriting and other losses exceed underwriting expectations, members share in the costs. Poor loss reserving, inferior underwriting and poor premium pricing have led several such group funds to dissolve. Alternative insurance coverage options can also open new opportunities for system abuse. The self-insurance option can be beneficial for cutting costs and maintaining system stability only if the state puts in place regulations that insure its solvency and prevents abusive practices. It is important that the prospective self-insurers clearly understand all the applicable rules and regulations, administrative issues and reserves requirements.130
Advisory Councils Advisory councils on workers’ compensation have emerged as effective balancers of often-conflicting business and labor interests. Thirty-eight states have implemented labor-management advisory councils to minimize the conflict caused by competitive interests in workers’ compensation system and to channel them into the policy-making process.131 Advisory councils effectively play the role of legislative “gatekeepers” – proposed changes that do not adequately reflect a consensus of labor and business interests stop at the council before reaching the legislature. Councils also examine the state administrative agency’s suggestions of regulatory changes for consistency with the labor and business interests. Considered a leader among workers’ compensation systems, Wisconsin has an exemplary advisory council arrangement that is often cited as a major contributing factor to the system’s stability.132 The structure of the advisory council in Wisconsin gives priority to the interests of the two major stakeholders in the workers’ compensation system – labor and business. Only labor and business representatives enjoy the voting membership of the council, with an exception of the chairperson who represents the administrative agency. In order not to exclude the other, non-vital stakeholder input in policy formulation, the council allows three non-voting seats for representatives of the insurance industry. In addition, the council has expanded its membership to informally include three liaisons to the medical community and several ex officio legislators. Since only key stakeholders have voting power, members of the insurance and medical communities seek the support of labor and business for advancing their interests. By forming such coalitions, the council can insure that the final legislation reflects the “median” interest rather than the extremes. This, in turn, minimizes the possibility of future conflicts.133 Another crucial role of advisory councils, demonstrated by Wisconsin’s experience, is policy implementation and evaluation. Although Wisconsin’s council itself does not promulgate rules, it does, by tradition, advise the Workers’ Compensation Division on policy matters. Not unlike the legislature, the regulatory agency does not adopt any changes without the council’s unanimous approval. In this manner,

28
the regulatory agency becomes a true public servant, gathering input for the advisory council, providing experience-based guidance and enforcing rules.134 An effective advisory council that represents business, labor, the state bar association and other relevant entities is credited for a stable workers’ compensation system in New Jersey.135 The Advisory Council is instrumental in making timely modifications to the system as the general economic environment changes. By reviewing all workers’ comp-related legislation, proposed regulations, appellate court cases and other relevant issues, the council constantly evaluates the changing workers’ compensation environment in the state and helps the legislators make the necessary modifications. Policy-makers seeking to emulate Wisconsin’s or New Jersey’s advisory councils in their states might run into challenges with respect to achieving similar outcomes.136 The larger political, economic and institutional frameworks within which the councils operate exert considerable influence on their effectiveness and differ across states. Therefore, only after significant modifications may one state’s experience in advisory councils be successfully transferred to another state.137
Technological Innovations Some states have taken advantage of various technological innovations that hold a great promise for enhancing system efficiency and cutting costs. New Jersey has one of the most technologically advanced workers’ compensation infrastructures in the country. Case listings, court records, and filings of pleadings and accident reports are available to parties electronically through an expansive and secure computer network. With a workforce of over four million people, such innovations have helped the state to lower administrative costs and boost its efficiency without compromising the quality of services to injured workers.138 New Mexico is working with a private company to set up the newly developed layered voice analysis (LVA) technology. LVA technology tracks and analyzes the vocal patterns of callers to identify emotional states such as excitement, stress, uncertainty and deception. A special device uses these identifiers to assign risk values to each claim, allowing insurance companies to rapidly identify and pay low risk claims, while focusing the investigative resources on the claims with higher likelihood of
Example 3.2 Virginia’s Approach to Managing Workers’ Compensation for State Employees The innovative Workers’ Compensation Management program developed by the state of Virginia is a good example of a comprehensive, holistic approach to improving the workers’ compensation system in state agencies. The program has reduced the state’s workers’ compensation costs by more than $29 million from 1999 to 2001 and decreased the number of lost-time claims by 32 percent since the program was implemented. Virginia’s Office of Workers’ Compensation received Innovation is Government Award from The Council of State Governments in December 2002. The state’s new approach involves four primary concepts: Experience-based premium assessment – Instead of calculating premiums based on the number and size of claims filed by the entire state workforce, separate premiums are determined for each agency based on the number and size of claims that agency has filed. This gives each agency an incentive to curb claims. As an extra incentive, agencies that reduce premiums keep 25 percent of the savings for future loss-control initiatives. Agency-initiated safety training – These incentives, in turn, motivate state agencies to invest in effective worker safety training programs to keep the claim incidence low. “Work-as-therapy” return-to-work model – This approach allows individual agencies to design transitional programs for injured employees to resume working in a capacity that is specially designed to accommodate their injuries. Public-private partnership – The program represents a successful multilayer partnership between the state and Managed Care Innovations (MCI) – a private workers’ comp cost containment company. The company assists the state with claims administration, the development of safety education programs, on-site medical staff, a discount prescription drug program and the use of a vocational placement specialist.

29
fraud. This technology was initially developed in Israel for counterterrorism purposes and is now used around the world for detecting fraud in various insurance industries, including the workers’ compensation.139
Streamlined Workers’ Compensation System for State Employees For states that provide state insurance funds, streamlining the state-run insurance system can greatly enhance efficiency and save big money. An illustrative example is North Dakota, where until 2001, 143 state agencies dealt separately with the state Workers’ Compensation Bureau for coverage. This setup not only increased the overall premium costs but also made cross-agency return-to-work programs impossible. To remedy the problem of inefficiency, the North Dakota Legislature gave the Risk Management Division the responsibility for administering a single workers’ compensation account covering all the state agencies.140 Under a new arrangement, agencies pay their premiums to the Risk Management Division rather than to the state workers’ compensation fund. In turn, the Risk Management Division sets up its own fund to meet the deductibles and pay the overall state workers’ compensation premium to the state fund. Moreover, the new office developed a cross-agency return-to-work program. This change allowed instituting a $100,000 deductible per claim and a return-to-work program across agency lines, and saved the state $1.5 million in 2002.141
Fraud Prevention To fight fraud in the workers’ compensation system some states have instituted special investigation units that track down allegations of fraud and refer the fraudulent cases to the appropriate officials for prosecution; increased penalties against individuals who make or attempt to make fraudulent claims; allowed the insurer or self-insured employer to credit previous fraudulently obtained benefit against any future benefits due to the workers; and excluded benefits or payments obtained through fraudulent claims from any data used for setting rates or calculating dividends by an insurer or insurance commissioner.142 Some states require companies to inform their employees about fraud control programs and regulations. Many states require that fraud warning statements are included on applications for insurance and renewals.143 Several states have revised their laws to make it a felony for anyone to knowingly file a fraudulent workers’ compensation claim. Although these laws can deter persons from committing a fraud, they also carry a risk of complicating for injured workers to file and receive compensation for legitimate claims.144 Focusing preventive and punitive measures on claimant fraud without emphasizing other types of abuse may create an atmosphere of fear and intimidation for injured workers and discourage them from filing legitimate claims. It can also lead to low public confidence in the workers’ compensation system.145 Hence, it is important that the legislative measures against workers’ comp fraud are comprehensive in addressing the various sources of abuse in the system and are not perceived as saving costs to employers at the expense of access to benefits and quality of care.
Litigation Controls Litigiousness of workers’ comp system can be an important cost-increasing factor in a state. In order to minimize economic and personal consequences of workplace injury while keeping costs to employers low, states may promote “self-executing” systems. In such systems, sufficient incentives exist to resolve disputes over benefits outside the courts. However, disputes are inevitable, and states can ensure that disputes that do end up in the court system are resolved in the most efficient fashion.146 Worker’s Compensation Research Institute has studied state mechanisms of dispute resolution and identified several factors that encourage litigation and can help the legislators neutralize the causes of disputes in their states. These include:
• absence of ratings or other evaluation guidelines; • lack of state agency oversight; • heavy reliance on the ratings of adversary experts hired by the both sides of the dispute;

30
• practice of splitting the difference between adversary ratings to resolve the dispute; and • systems where small differences in expert opinion or medical rating result in large differences in
award outcomes.147 Evidence from Wisconsin, a state where there is relatively little workers’ comp litigation, indicates that four major administrative and adjudicative factors can reduce litigiousness in state systems:
• active supervision by the state agency; • required minimum ratings for surgery claims; • heavy reliance on the treating physician; and • dispute resolution by “final-offer adjudication.”148
Often, court rulings involve splitting the difference between the two parties’ positions. This method of medical assessment counterbalances different opinions and thereby promotes the extremes. As a result, attorneys seek doctors who will present the most extreme positions, making negotiated settlements difficult because of a large difference between opinions. A study of Maryland’s system indicates that wider the disparity in opinion, the more likely the case is to go to court.149 In contrast, “final offer adjudication” requires that one or the other of two medical positions are accepted, and not the average. A study has linked this adjudicative feature to a low level of workers’ comp litigation in Wisconsin.150 These four features that have contributed to low level of workers’ compensation litigation in Wisconsin represent a package that can have similar effects if implemented in other states, with necessary modifications to fit the specific state settings. Moreover, the features are mutually reinforcing and an adoption of only one element is unlikely to produce the positive outcomes found in Wisconsin.151 State officials should keep in mind that reducing litigation is not an end in itself. Attorneys are hired not only for assistance in court litigation, but also for navigating the system that is perceived as too confusing by many injured workers. In such cases, without the attorney’s assistance an injured worker may not receive all of the entitled benefits. State agencies can effectively replace attorneys as the system guides to the injured workers by automatically providing written materials that explain the state law and participant’s rights.152 Conclusion
Workers’ comp costs are rising. Increased costs are leading to higher premiums for employers, and this can affect business and economic development. Employers in some states are having difficulty finding carriers to provide workers’ comp insurance. A wide range of factors influences the workers’ comp systems in the states. Therefore, it is difficult, if not impossible, to point to one policy option that will “cure” a problematic workers’ comp system. Many cost-reducing incentives and reforms were introduced in varying degrees and combinations throughout the 1990s. The experiences of states grappling with workers’ compensation issues indicate that targeting the symptoms of the crisis frequently yields insignificant results. Many of the suggested policy options are mutually reinforcing, requiring a comprehensive approach to reforming state workers’ compensation systems. Selective application of reform measures is not as likely to produce the desired outcomes.153
31
Glossary of Terms Administered Pricing – a uniform rating system in which a state workers’ compensation agency sets the same classification rates for all insurance carriers in the state. Case Management – a proactive approach that assigns a manager to an injured worker to craft individualized treatment and care plans and to restore the patient’s working capacity in a timely manner. Competitive Rating – a comprehensive form of deregulation that allows open competition in insurance prices. A competitive rating system permits each insurance carrier to quote rates based on its own experience of claims, losses and other insurance factors. Competitive State Fund – a type of system where workers’ compensation is written by a state agency in competition with private insurers operating in the state market. The operation of state funds is similar to private industry, but the rates may differ. In many cases state fund is also the insurer of last resort. Deviations – allowing individual carriers to adopt rates that differ from those established by the rating organizations. While the degree of the deviations may vary among the insurers, deviations offered by a particular insurer have to be uniform for all policyholders in the state, and have to be approved by the state insurance commissioner. Excess Insurance – involves supplementing primary insurance on an excess basis or providing coverage above a self-insured retention. Exclusive State Fund – an arrangement where the central state fund is the sole provider of workers’ compensation coverage in that state. Health Care Provider Network – an organization of health care providers which contracts with workers’ compensation insurance carriers to provide healthcare to injured workers, often at discounted prices. Indemnity Benefits – compensation that replaces lost wages due to work-related injuries or illness. Also includes all other benefits that may be paid directly to the injured worker except the medical expenses and claims adjustment expenses. Managed Care – a term that unites various operational, administrative and financial measures that together increase efficiency of health care delivery and lower the associated medical care costs. In workers’ compensation system, the core principle of managed care is the existence of special network of health care providers that contract insurers to treat the injured workers covered by the policy. Medical Provider Fee Schedules – a schedule usually set by a state workers compensation agency that limits maximum reimbursement levels for common medical procedures and care for workers’ compensation claims. Partial Deregulation – allowing for a degree of flexibility in the insurers’ ability to set rates, such as permitting “deviations” and “schedule rating.” Permanent Partial Disability Benefits – benefits for injured workers who are disabled for life but are able to work at reduced efficiency. Permanent Total Disability Benefits – compensation for workers whose permanent disability prevents them from working altogether. Provider Choice Law – a state mandate that specifies limitations on the injured workers’ ability to chose a physician to provide medical care for the injury.
32
Residual Market – An arrangement that guarantees the availability of workers’ compensation insurance coverage to employers that are unable to obtain coverage in the voluntary market. There are two major residual market mechanisms: (1) state funds that bear the risk for residual market profits and losses, and (2) assigned-risk plans, where the profits and losses are distributed among voluntary market insurers through a pooling arrangement. Schedule Rating – ability of the insurance carrier to decrease (or increase) the rate an individual employer would otherwise pay, based on a subjective evaluation of factors such as the employer’s safety programs. Such plans are created by the rating organizations, are subject to the insurance commissioner’s approval and are uniform for all insurers operating in a particular state. Self-Insurance – an alternative workers’ compensation insurance scheme where instead of insuring workers’ comp liabilities with an insurance carrier, employers pay the employee claims directly. This can be done on an individual employer or group of employers bases, if the state allows group-self insurance. Self-insurance may include contracting with an insurer for claims administration on the employer’s behalf. It may also include the purchase of excess insurance or reinsurance to limit the risk accepted by the employer. Temporary Partial Disability Benefits – benefits conferred to a worker who returns to work with reduced responsibilities and a lower wage before reaching maximum medical improvement. Temporary Total Disability Benefits – a state-specified percentage of an injured worker’s pre-injury wage paid to a worker who misses work for more than the state-mandated waiting period. Treatment Guidelines – standards for the treatment reasonably required to relieve the effects of workers’ injuries and are presumed correct unless medical opinion establishes the need for a departure from those guidelines. Utilization Review – a process that the insurers use to review, approve, modify or deny physicians’ requests for treating patients based on clinically accepted medical guidelines. Utilization review insures the cost-effective delivery of services and achievement of return-to-work outcomes.

33
Endnotes 1 Joseph B. Treaster, “Cost of Insurance for Work Injuries Soars Across U.S.,” The New York Times, 23 June 2003, sec. A, p. 1. 2 Annemarie Geddes Lipold, “The Soaring Costs of Workers’ Comp,” Workforce, February 2003, p. 46. 3 Insurance Information Institute, On-Line resource on Workers’ compensation, July 2003. <www.iii.org/media/hottopics/insurance/workerscomp> (October 30, 2003) 4 Robert P. Hartwig, “WC: The P-C Industry’s Quiet Crisis?” National Underwriter 107, no. 19 (12 May 2003): 42. 5 Insurance Information Institute. 6 Meg Green, “Filled to the Brim,” Best’s Review (May 2003): 52. 7 Green, 52. 8 Hartwig, 41. 9 Richard B. Victor and Charles A. Fleischman, How Choice of Provider and Recessions Affect Medical Costs in Workers’ Compensation. (Cambridge, Massachusetts: Workers Compensation Research Institute, June 1990). 10 John McNulty, “Workers’ Compensation Fraud: How to Save an Arm and a Leg,” Claims Magazine (September 2003): 53. 11 Insurance Information Institute. 12 Insurance Information Institute. 13 Insurance Information Institute. 14 As cited in Green, 50. 15 Bill Conerly, “Allowing the States to Innovate,” Regulation 26, no. 1 (Spring 2003): 47. 16 Conerly, 47. 17 Conerly, 47. 18 Conerly 48. 19 John Conley, “Pulling Together Workers’ Compensation Pools,” Risk Management 48, n.4 (April 2001): 32. 20 State Workers’ Compensation Laws, U.S. Department of Labor, Employment Standards Administration, Office of Workers’ Compensation Programs, January 2003. 21 Conerly, 47. 22 Green, 47. 23 Cecil Thompson Williams, Virginia P. Reno and John F. Burton, Jr., Workers’ Compensation: Benefits, Coverage, and Costs, 2001. (Washington, DC: National Academy of Social Insurance, July 2003), 7. 24 Benefits include both cash benefits and medical care. Thompson, 7. 25 Thompson, 7. 26 Workers’ Compensation Insurance Rates for the 2003 Policy Year Effective 12/31/2002 <http://www.mdfarmerscoop.com/agri/new_page_5.htm> (21 July 2003). 27 Thompson, 24. 28 Allan Hunt, W. E. Upjohn Institute for Employment Research, interview by Irakli Khodeli, 23 December 2003. 29 Richard J. Butler, “Economic Determinants of Workers’ Compensation Trends,” Journal of Risk and Insurance 61 no. 3 (September 1994): 383-401. 30 Conerly 48. 31 Matt W. Smitha, Kent R. Oestenstad and Kathleen C. Brown, “State Workers’ Compensation: Reform and Workplace Safety Regulations,” Professional Safety 46, n. 12 (Dec. 2001): 48. 32 Smitha, 46. 33 Hugh Conway and Jens Svenson, “Occupational Injury and Illness Rates, 1992-1996: Why They Fell.” Monthly Labor Review 121, no. 11 (1998): 42. 34 Conway, 42. 35 Smitha, 45. 36 Conway, 42. 37 Smitha, 45. 38 Insurance Information Institute, On-Line resource on Workers’ compensation, July 2003. <www.iii.org/media/hottopics/insurance/workerscomp> (October 30, 2003). 39 Conway, 43. 40 Conway, 43. 41 Conway, 47. 42 Conway, 47. 43 Smitha, 45. 44 H. Allan Hunt and Rochelle V. Habeck, New Hope for Workers’ Compensation Programs, W.E. Upjohn Institute for Employment Research, Fall 1994. <http://www.upjohninstitute.org/publications/newsletter/hah_f94.pdf> (14 November 2003). 45 Oregon Workers’ Compensation Division <www.cbs.state.or.us/external/wcd/rdrs/rau/eaip/eaipfs.html> (4 December 2003).

34
46 Maier, <http://www.cbs.state.or.us/external/imd/rasums/3123/web01/3123.htm>(13 December 2003). 47 Maier, <http://www.cbs.state.or.us/external/imd/rasums/3123/web01/3123.htm>(13 December 2003). 48 Monica Galizzi and Leslie I. Boden, What Are the Most Important Factors Shaping Return to Work? Evidence from Wisconsin, (Cambridge, Massachusetts: Workers Compensation Research Institute, October 1996). 49 Joann Sim, “Improving Return-to-Work Strategies in the United States Disability Programs, With Analysis of Program Practices in Germany and Sweden,” Social Security Bulletin 62, no. 3 (1999): 41. 50 Tom Shehan, “Employer and Employee Benefit from a Return-to-Work Program,” Houston Business Journal, 15 December 2003. 51 Mike Maier, “The Employer-at-Injury Program,” Oregon’s Department of Consumer and Business Services, June 2002. <http://www.cbs.state.or.us/external/imd/rasums/3123/web01/3123.htm>(13 December 2003). 52 Maier, <http://www.cbs.state.or.us/external/imd/rasums/3123/web01/3123.htm>(13 December 2003). 53 Dennis Chandler, “Constructing Return to Work Programs: Building for Better Returns,” Workers’ Compensation; Containing Costs and Managing Outcomes – A Public Entity Risk Institute Symposium. <http://www.riskinstitute.org/FP_DOCS/ReturntoWork-PERISymposiumPaper.pdf> (7 January 2004). 54 Chandler, 2. 55 Particia F. Helve, Evaluating the Practicality of Return to Work Programs, (Atlanta: Crawford & Company, 1993). 56 Galizzi, 5. 57 Workers’ Compensation Health Initiative, University of Massachusetts Medical School, “Workers’ Compensation Medical Care: Innovations in Research and Policymaking,” <http://www.umassmed.edu/workerscomp/pdfs/fact_sheets/research.pdf> (13 January 2004). 58 James M.P. Solheim, Workers' Compensation Guide: Managing Workers' Compensation Claims and Costs HR-esource, Gale Group. <http://www.hr-esource.com/hresources/sampleChapters/wcgsampleChapter.html> (13 October 2003). 59 Workers’ Compensation Health Initiative, University of Massachusetts Medical School, “Workers’ Compensation Medical Care: Controlling Costs.”<http://www.umassmed.edu/workerscomp/pdfs/fact_sheets/costs.pdf> (January 13, 2004). 60 Stacy M. Eccleston, Xiaoping Zhao and Michael Watson, The Anatomy of Workers’ Compensation Medical Costs and Utilization: Trends and Interstate Comparisons, 1996-2000 (Cambridge, Massachusetts: Workers Compensation Research Institute, July 2003). 61 Richard A. Victor, Evidence of Effectiveness of Policy Levers to Contain Medical Costs in Workers’ Compensation, Professional Paper, (Cambridge, Massachusetts: Workers Compensation Research Institute, November 2003). 62 Oregon Department of Consumer & Business Services, Research and Analysis Section, Managed Care in the Oregon Workers’ Compensation System, April 1999. <http://www.cbs.state.or.us/external/imd/rasums/2865/2865r.pdf> (12 December 2003). 63 Kelly Fox, “Workers’ Compensation and Managed Care,” NCSL Legisbrief, August/September 1998. 64 State Workers’ Compensation Laws, 20-21. 65 Richard A. Victor, Dongchun Wang, Philip Borba, Provider Choice Laws, Network Involvement, and Medical Costs, (Cambridge, Massachusetts: Workers Compensation Research Institute, December 2002). 66 Victor, WCRI, December 2002. 67 Victor, WCRI, December 2002. 68 Lynn Bailey, “Managed Care and Workers’ Compensation,” Business and Economic Review, Moore School of Business at the University of South Carolina 48, n. 4 (July - September 2002). 69 Bailey, 10. 70 Jay Himmelstein, University of Massachusetts Center for Health Policy and Research, interview by Irakli Khodeli, 29 December 2003. 71 Bailey, 11. 72 William G. Johnson, Marjorie L. Baldwin and Steven C. Marcus, The Impact of Workers’ Compensation Networks on Medical Costs and Disability Payments, (Cambridge, Massachusetts: Workers Compensation Research Institute, November 1999). 73 Johnson, WCRI, Nov. 1999. 74 Johnson, WCRI, Nov. 1999. 75 Victor, WCRI, Nov. 2003. 76 “Managed Care in Workers’ Compensation,” Policy Brief, The Ohio Legislative Budget Office, Columbus Ohio, 5 February 1999. <http://www.lbo.state.oh.us/123ga/publications/periodicals/policybriefs/wc.pdf> (23 November 2003). 77 Ramona P. Tanabe and Susan M. Murray, Managed Care and Medical Cost Containment in Workers’ Compensation: A National Inventory, 2001-2002. (Cambridge, Massachusetts: Workers Compensation Research Institute, December 2001). 78 Solheim, <http://www.hr-esource.com/hresources/sampleChapters/wcgsampleChapter.html> (13 October 2003). 79 American Medical Association, RBRVS: Resource-Based Relative Value Scale: an on-line resource <http://www.ama-assn.org/ama/pub/category/2292.html> (Dec. 8, 2003).
35
80 Tanabe, 35. 81 Pamela Martin, The Medical Fee Schedule under the Workers’ Compensation Law, Legislative Reference Bureau, Honolulu, Hawaii, Report No. 8, 1998. 82 Martin, 23. 83 Workers Compensation Research Institute, “Workers’ Comp Crisis” The Wall Street Journal, 28 July 2003. 84 Peter Rousmaniere and Phil Denniston, “Getting Workers’ Comp Costs Under Control,” Risk & Insurance, 3 March 2003. 85 Rousmaniere, 3 March 2003. 86 Barbara O. Wynn, Adopting Medicare Fee Schedules: Consideration for the California Workers' Compensation Program, Rand Corporation, 2003. < http://www.rand.org/publications/MR/MR1776.0/> (December 1, 2003) 87 Martin, 27. 88 Solheim <http://www.hr-esource.com/hresources/sampleChapters/wcgsampleChapter.html> (13 October 2003). 89 Tanabe, 12. 90 Tanabe, 77. 91 California State Auditor, California’s Workers’ Compensation Program, Bureau of State Audits, August 2003. <www.bsa.ca.gov/bsa> (5 November 2003). 92 Tanabe, 78. 93 Tanabe, 78. 94 American College of Occupational and Environmental Medicine, “Eight Best Ideas for Workers’ Compensation Reform,” Committee Report, May 1997. 95 Tanabe, 79. 96 Tanabe, 83. 97 Tanabe, 12.. 98 Tanabe, 71. 99 Worker’s Compensation Insurance Rating Bureau, Annual Reports, 2 (August 2003). 100 Allard E. Dembe and Jay S. Himmelstein, “The Workers’ Compensation Health Initiative: At the Convergence of Work and Health” To Improve Health and Health Care 2001: The Robert Wood Johnson Foundation Anthology <http://www.rwjf.org/publications/publicationsPdfs/anthology2001/index.html> (15 January 2004). 101 Tanabe, 2001. 102 Michael Prince, “Workers compensation drug costs tough to manage,” Business Insurance 36, no. 42 (21 October 2002): 10. 103 Prince, 11. 104 Prince, 11. 105 “Washington state suspends painkiller policy,” Associated Press, 11 December 2003. <http://www.krem.com/news/local/NW_121103HEBpainkillerLJ.909dfc25.html> (January 15, 2004). 106 Terry Thomason, Timothy P. Schmidle, John F. Burton, Jr., Workers' Compensation: Benefits, Costs, and Safety Under Alternative Insurance Arrangements (Kalamazoo, Michigan: W.E. Upjohn Institute for Employment Research, 2001) 40. 107 Thomason, 42. 108 Most states use the ratings of the National Council of Compensation Insurance. Some states have established independent rating organizations, including California, Delaware, Massachusetts, Minnesota, New York, New Jersey, and Pennsylvania. 109 Thomason, 41. 110 Thomason, 40. 111 Insurance Information Institute, On-Line resource on Workers’ Compensation, July 2003 <www.iii.org/media/hottopics/insurance/workerscomp> (October 30, 2003) 112 Thomason, 40. 113 Thomason, 41. 114 Thomason, 287. 115 Thomason, 289. 116 Thomason, 289. This, however, is not the case if insurers engage in price undercutting which ultimately forces some insurers out of business. 117 Thomason, 287. 118 Danzon, 36. 119 Peter Barth, University of Connecticut, interview by Irakli Khodeli, 29 December 2003. 120 Robert Klein, interview. 121 David J. Cummins and Francois J. Outreville, “An International Analysis of Underwriting Cycles in Property-Liability Insurance,” Journal of Risk and Insurance 54 (1987): 246-262. 122 Patricia M. Danzon and Scott E. Harrington, “Workers’ Compensation Rate Regulation: How Price Controls Increase Costs,” Journal of Law and Economics 41, no. 1 (April 2001): 1.
36
123 Robert Klein, interview. 124 Robert Klein, interview. 125 Conley, 35. 126 Daniel Hickey, “The Self-Funded Trust Option,” Risk & Insurance, May, 2003. <http://www.riskandinsurance.com> (20 December 2003). 127 States that have not enacted legislation that permits self-insurance by groups of employers are Alaska, Delaware, Idaho, Indiana, Nebraska, New Jersey, North Dakota, Ohio, Texas, Utah, Vermont, West Virginia, Wisconsin and Wyoming. 128 Hickey. <http://www.riskandinsurance.com> (20 December 2003). 129 Conley, 33. 130 Robert Klein. 131 Sharon E. Fox, “The Role of Advisory Councils in Workers’ Compensation Policymaking: Observations from Wisconsin,” Spectrum, Council of State Governments 79, no. 1 (Winter 2001): 11. 132 Fox, 15. 133 Fox, 13. 134 Fox, 15. 135 Peter J. Calderone, a letter to Melissa Taylor, RE: Workers’ Compensation Issues, October 30, 2003. 136 Fox, 15. 137 Fox, 15. 138 Peter J. Calderone, letter to Melissa Taylor, September 2003. 139 Jayson Schkloven, “V Introduces Call Center Solution for Detecting Fraudulent Workers’ Compensation and Car Insurance Claims,” Chicago Business Wire, 19 November 2003. 140 Rodd Zolkos, “Streamlined Workers’ Compensation Program Yields Savings,” Business Insurance 37 no. 14 (2003): 73. 141 Zolkos, 73. 142 Brenda Trolin, “Can Workers’ Comp Work?” State Legislatures, 18 n. 5 (May 1992): 33. 143 McNulty, 54. 144 McNulty, 53. 145 Ted Rohrlich and Evelyn Larrubia, “Anti-Fraud Drive Proves Costly for Employees,” Los Angeles Times, 7 August 2000, p. A-1. 146 Duncan S. Ballantyne, Dispute Prevention and Resolution in Worker’s Compensation: A National Inventory, 1997-1998. (Cambridge, Massachusetts: Workers Compensation Research Institute, May 1998). 147 Leslie I. Boden, Reducing Litigation, Evidence From Wisconsin, (Cambridge, Massachusetts: Workers Compensation Research Institute, 1988). 148 Boden, 1988. 149 Workers Compensation Research Institute, Use of Medical evidence, Low-back Permanent Partial Disability Claims in Maryland, Research Brief 2, no. 9 (September 1986). 150 Boden, 1988. 151 Boden, 1988. 152 Ballantyne, 1998. 153 Allan Hunt, W. E. Upjohn Institute for Employment Research, interview by Irakli Khodeli, 23 December 2003.