trial primary results from the evolut low risk · primary results from the evolut low risk ......
TRANSCRIPT

Primary Results From the Evolut Low Risk Trial
Michael J. Reardon, MD, FACCHouston Methodist DeBakey Heart & Vascular Institute, Houston, TXFor the Evolut Low Risk Trial Investigators

Disclosure Statement of Financial Interests
Within the past 12 months, I have had a financial interest/arrangement or affiliation with the organization(s) listed below.
Financial Relationship Company
Consultant (fees paid to institution) Medtronic
Medtronic personnel performed all statistical analyses and assisted with the graphical display of the data presented.
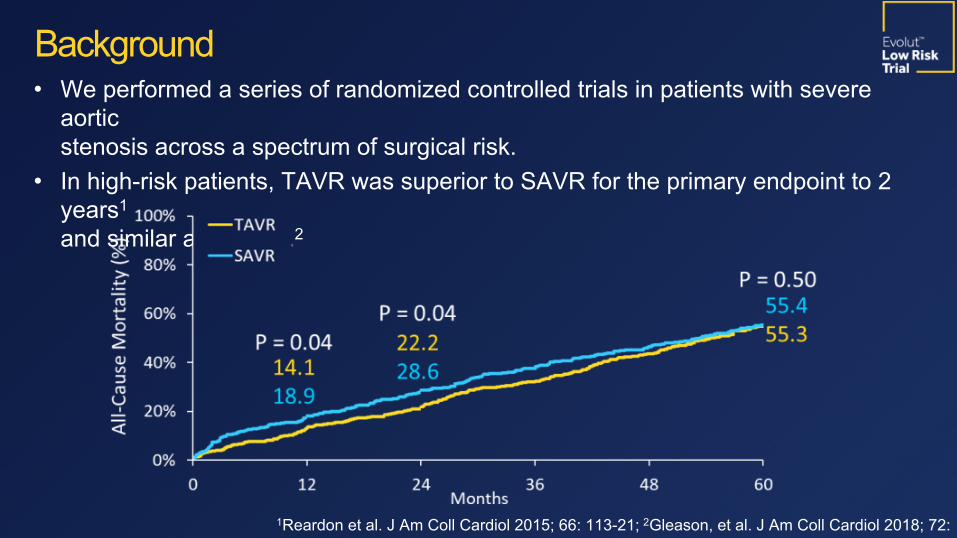
• We performed a series of randomized controlled trials in patients with severe aortic stenosis across a spectrum of surgical risk.
• In high-risk patients, TAVR was superior to SAVR for the primary endpoint to 2 years1 and similar at 5 years.2
Background
1Reardon et al. J Am Coll Cardiol 2015; 66: 113-21; 2Gleason, et al. J Am Coll Cardiol 2018; 72: 2687-96.

Background
Months Post-Procedure24181260
30%25%20%15%10%5%0%
Months Post-Procedure0 6 12 18 24
0%5%
10%15%20%25%30%
Death or Disabling Stroke (%
)
Interim Analysis from the SURTAVI Trial1
2Popma JJ, et al. Presented at TCT 2018.
TAVR
864 755 612 456 272
SAVR
796 674 555 407 241
Final Analysis from the SURTAVI Trial2
TAVR 864 840 786 663SAVR
796 761 698 583Death or Disabling Stroke (%
)
• The SURTAVI intermediate risk trial showed noninferiority at interim analysis.• The final analysis of the SURTAVI Trial confirmed the early Bayesian results, showing TAVR noninferior to SAVR.
1Reardon MJ, et al. NEJM 2017; 376:1321-31.

To assess the safety and efficacy of TAVR with the Evolut self-expanding supra-annular valve compared with
surgical AVR in patients with a low predicted risk of 30-day surgical mortality.
Objective

Study AdministrationPrincipal Investigators: Jeffrey Popma, Michael Reardon
Executive Committee: Jeffrey Popma, Michael Reardon, G. Michael Deeb, Steven Yakubov
Steering Committee: David Adams, Stan Chetcuti, G. Michael Deeb, John Forrest, Thomas Gleason, John Heiser, William Mehri, Mubashir Mumtaz, Daniel O’Hair, Nicolo Piazza, Joshua Rovin, Michael Reardon, Paul Sorajja, Didier Tchétché, Paul Teirstein, Antony Walton, Steven Yakubov, George Zorn III
Screening Committee: G. Michael Deeb (Chair), Thomas Gleason, Jeffrey Popma, Michael Reardon, Steven Yakubov
Echo Core Laboratory: Jae Oh, Mayo Clinic, Rochester, MN
Data & Safety Monitoring Board: Baim Institute for Clinical Research; David Faxon (Chair), William Holman, John Lopez, Scott Kasner, John Orav
Clinical Events Committee: Baim Institute for Clinical Research; Claudia Hochberg (Chair), Cliff Berger, Torin Fitton, Sergio Waxman, Scott Bortman, Carey Kimmelstiel, David Grossman, Manish Chauhan, Jeffrey Veluz, Robert Rodriguez, Sanjay Samy, Gregory Smaroff, Jonathan Waks, Daniel Kramer
Statistical Design and Analyses: Andrew Mugglin, Paradigm Biostatistics, LLC
Sponsor: Medtronic

Johns Hopkins, MedStar Union, & Univ. of Maryland MC
The Mount Sinai MC
Bon Secours Heart & Vascular Institute
St. Francis Hospital
Mass General
Abbott NW
Medical Univ. of South Carolina
Beth Israel Deaconess
North Shore Univ. Hospital
Univ. Vermont MC
Mercy Medical Ctr
Morton Plant
Baylor Heart & Vascular
Methodist Debakey & Baylor College of Medicine
Loyola
St. Lukes/Aurora
Univ. of Colorado Hospital
Piedmont Heart Institute
Wake Forest Baptist MC
Scripps Hospital
Case MC
Univ. of Pittsburgh
Riverside Methodist & OSUSt. Vincent
Vanderbilt
Univ. of Kansas
Jewish Hospital
El Camino
Winchester MC
Univ. of Michigan
Duke Univ.
Integris Baptist MC
Swedish MC
Univ. of Miami
Yale New Haven Hospital
St. John Hospital
Mercy Hospital
Sanford MC
CV Institute of the South
Univ. of Utah
Oregon Health & Science Univ.
Good Samaritan
Tallahassee Research Institute
Abrazo Arizona Heart Hospital
Lee Memorial Health System Delray Medical Center
Baystate MC
Methodist Hospital
Los Robles HospitalKeck Hospital
Spectrum Health
Mercy General Hospital St. Joseph’S Hospital
Participating Sites in the United States
Strong Memorial
U Pittsburg Pinnacle HealthGeisinger MCLehigh Valley Hospital

Waikato Hospital
The Alfred Hospital & MonashHeart
St. Vincent’s Hospital
Fiona Stanley Hospital
Royal North Shore
Sakakibara Heart Institute
Sendai Kousei Hospital
Kokura Memorial Hospital Osaka
General Hospital & NCCC
Sapporo Higashi Taoushukai Hospital
Shonan Kamakura General Hospital
Jacques Cartier
Clinique Pasteur
CHRU de Lille
Erasmus
Catherina Hospital
St. Antonius Hospital
McGill University &Montreal Heart Institute
Toronto General Hospital, Sunnybrook Health & London Health Sciences
IUCPQ
Australia, Canada, Europe, Japan and New Zealand
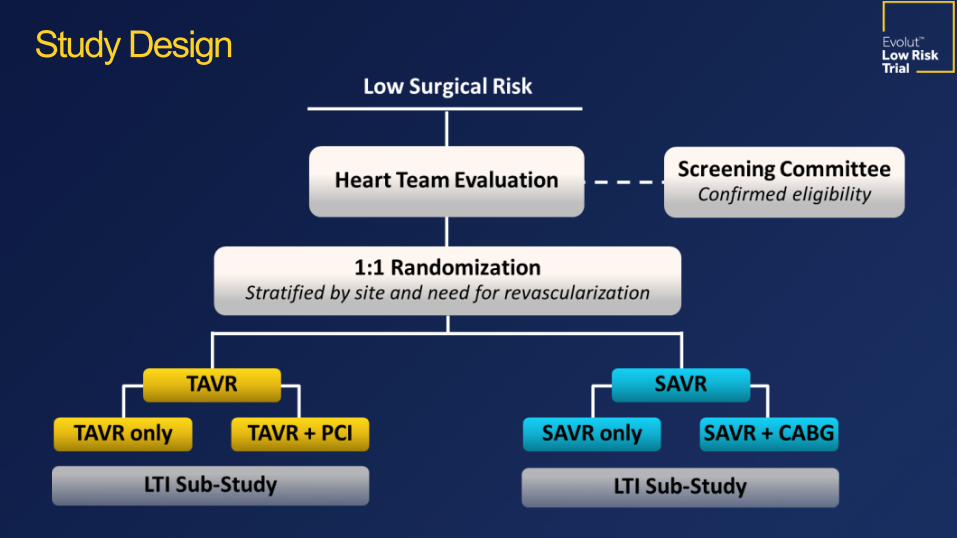
Study Design

Evolut Low Risk Trial–ACC.19
Primary Safety and Effectiveness EndpointAll-cause mortality or disabling stroke at 2 years
Study Endpoints
Noninferiority• Mean gradient at 1 year• EOA at 1 year • Change in NYHA class from baseline to 1 year
• Change in KCCQ score from baseline to 1 year
Superiority• Mean gradient at 1 year• EOA at 1 year • Change in KCCQ score from baseline to 30 days
Hierarchical Powered Secondary Endpoints Other Secondary Endpoints• 30-day safety composite of
– All-cause mortality– Disabling stroke– Life-threatening bleeding– Major vascular complications– Stage 2 or 3 acute kidney injury
• New pacemaker implantation at 30 days
• Heart failure rehospitalizations at 1 year
• Aortic-valve reintervention at 1 year• Moderate/severe AR at 1 year• All stroke at 1 year• Life-threatening bleeding at 1 year

Symptomatic severe AS1: • Aortic valve area ≤1.0 cm² (or aortic valve area index <0.6 cm2/m2), OR mean gradient ≥40 mmHg OR Vmax ≥4 m/sec at rest
Asymptomatic very severe AS1:• Aortic valve area ≤1.0 cm² (or aortic valve area index <0.6 cm2/m2), AND Vmax ≥5 m/sec or mean gradient ≥ 60 mmHg at rest
• Aortic valve area of ≤1.0 cm2 (or aortic valve area index of ≤0.6 cm2/m2), AND a mean gradient ≥40 mmHg or Vmax ≥4.0 m/sec by transthoracic echocardiography at rest, AND an exercise tolerance test that demonstrates limited exercise capacity, abnormal BP response, or arrhythmia
• Aortic valve area of ≤1.0 cm2 (or aortic valve area index of ≤0.6 cm2/m2), AND mean gradient ≥40 mmHg, OR Vmax ≥4.0 m/sec by transthoracic echocardiography at rest, AND LVEF<50%.
A predicted risk of 30-day mortality <3% per multidisciplinary local heart team assessment. 1Nishimura RA, et al. Circulation. 2014;129:2440-92.
Key Inclusion Criteria

• Contraindication for placement of a bioprosthetic valve • Multivessel coronary artery disease with SYNTAX score >22• Bicuspid aortic valve verified by imaging• Hypersensitivity or contraindication to all anticoagulation/ antiplatelet regimens
• Any PCI or peripheral intervention within 30 days prior to randomization• Symptomatic carotid or vertebral artery disease or successful treatment of carotid stenosis within 10 weeks of Heart Team assessment
• Recent (within 2 months) cerebrovascular accident or transient ischemic attack
• Acute MI within 30 days• Severe liver, lung or renal disease • Unsuitable anatomy including native aortic annulus <18 mm or >30 mm• Severe mitral or tricuspid regurgitation
Key Exclusion Criteria

-0.1 -0.05 0 0.05 0.1
*Selected to maintain α < 0.05
Noninferiority margin(6%)
Posterior Distribution of the Difference(TAVR rate – SAVR rate)
Statistical MethodsNoninferiority Testing of the Primary Endpoint
• This was a randomized, multinational, noninferiority trial.
• The Bayesian adaptive design prespecified an “early-win” interim analysis when 850 patients reached 1-year follow-up.
• The estimated sample size was 1200 patients.
• The 2-year primary analysis cohort comprised all patients with an attempted implant procedure (as-treated).
• The prespecified criteria for success was posterior probability >0.972.
Area > 0.972*

*Additional patients were randomized to permit completion of the LTI substudy and to enroll a Japanese cohort.
Patient Flow

First Patient Randomized Mar. 28, 2016
*Last Patient Randomized
Nov. 27, 2018
Primary Endpoint Assessment Dec. 27, 2018
CoreValve 31 mm
*For this analysis
Evolut PRO: 23, 26, 29 mm
Evolut R: 23, 26, 29 Added Evolut R 34 mm
Vascular access§ 99% transfemoral§ 0.6% subclavian§ 0.4% direct aortic
2016 2017 2018
CoreValve 31 = 3.6% Evolut R = 74.1% Evolut PRO =
22.3%
Study Timeline and Valves Studied

RESULTS

Mean ± SD or % TAVR (N=725) SAVR (N=678)Age, years 74.1 ± 5.8 73.6 ± 5.9Female sex 36.0 33.8Body surface area, m2 2.0 ± 0.2 2.0 ± 0.2STS PROM, % 1.9 ± 0.7 1.9 ± 0.7NYHA Class III or IV 25.1 28.5Hypertension 84.8 82.6Chronic lung disease (COPD) 15.0 18.0Cerebrovascular disease 10.2 11.8Peripheral arterial disease 7.5 8.3
There are no significant differences between groups.
Baseline Characteristics

Mean ± SD or % TAVR (N=725) SAVR (N=678)SYNTAX Score 1.9 ± 3.7 2.1 ± 3.9Permanent pacemaker, CRT or ICD 3.2 3.8Prior CABG 2.5 2.1Previous PCI 14.2 12.8Previous myocardial infarction 6.6 4.9Atrial fibrillation/flutter 15.4 14.5Aortic valve gradient, mm Hg 47.0 ± 12.1 46.6 ± 12.2Aortic Valve area, cm2 0.8 ± 0.2 0.8 ± 0.2Left ventricular ejection fraction, % 61.7 ± 7.9 61.9 ± 7.7
There are no significant differences between groups.
Baseline Cardiac Risk Factors
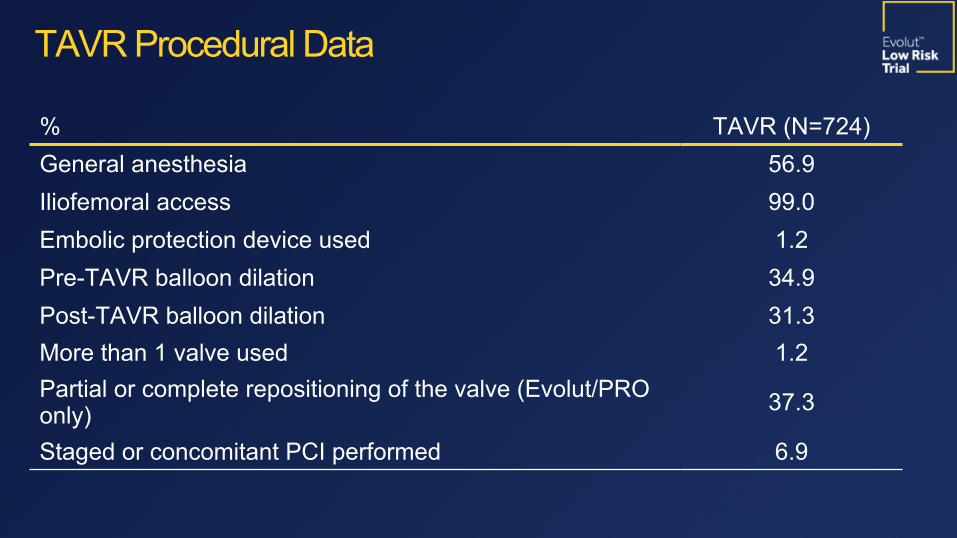
% TAVR (N=724)General anesthesia 56.9Iliofemoral access 99.0Embolic protection device used 1.2Pre-TAVR balloon dilation 34.9Post-TAVR balloon dilation 31.3More than 1 valve used 1.2Partial or complete repositioning of the valve (Evolut/PRO only) 37.3
Staged or concomitant PCI performed 6.9
TAVR Procedural Data

19
-0.1 -0.05 0 0.05 0.1 0.15
PP>0.999
TAVR 5.3% SAVR 6.7% Posterior probability of noninferiority > 0.999
TAVR –SAVR difference = -1.4% (95% BCI; -4.9, 2.1)
Primary Endpoint MetTAVR is noninferior to
SAVR
Primary EndpointAll-Cause Mortality or Disabling Stroke at 2 Years

Hierarchical Secondary Endpoints Hierarchical Secondary Endpoints
TAVR SAVRDifferenceTAVR–SAVR
Posterior Probability
Noninferiority (margin) (90% BCI) Mean gradient at 12 months (5 mmHg) 8.6 ± 3.7 11.2 ± 4.9 -2.6 (-3.1, -
2.1) > 0.999
Mean EOA at 12 months (0.1 cm2) 2.3 ± 0.7 2.0 ± 0.6 0.3 (0.2, 0.4) > 0.999Mean NYHA class change (12 months –Baseline) (0.375) 0.9 ± 0.7 1.0 ± 0.7 -0.1 (-0.2, 0.0) > 0.999
Mean KCCQ change (12 months –Baseline) (5) 22.2 ± 20.3 20.9 ± 21.0 1.3 (-1.2, 3.8) > 0.999
Superiority (95% BCI)
Mean gradient at 12 months, mmHg 8.6 ± 3.7 11.2 ± 4.9 -2.6 (-3.2, -2.0) > 0.999
Mean EOA at 12 months, cm2 2.3 ± 0.7 2.0 ± 0.6 0.3 (0.2, 0.4) > 0.999Mean KCCQ change (30 Days–Baseline) 20.0 ± 21.1 9.1 ± 22.3 10.9 (8.6,
13.2) > 0.999
All Noninferiority and Superiority Endpoints Met

Bayesian rates as %TAVR(N=725)
SAVR(N=678)
(95% BCI for Difference)
30-Day composite safety endpoint* 5.3 10.7 (-8.3, -2.6) All-cause mortality 0.5 1.3 (-1.9, 0.2) Disabling stroke* 0.5 1.7 (-2.4, -0.2)
Life-threatening or disabling bleeding* 2.4 7.5 (-7.5, -2.9) Acute kidney injury, stage 2-3* 0.9 2.8 (-3.4, -0.5) Major vascular complication 3.8 3.2 (-1.4, 2.5)
Atrial fibrillation* 7.7 35.4 (-31.8, -23.6)
Permanent pacemaker implant* 17.4 6.1 (8.0, 14.7)All-cause mortality or disabling stroke* 0.8 2.6 (-3.2, -0.5)All stroke 3.4 3.4 (-1.9, 1.9)Aortic valve reintervention 0.4 0.4 (-0.8, 0.7)
Clinical Outcomes at 30 Days
* Significantly favors TAVR; * Significantly favors SAVR BCI = Bayesian credible interval

Bayesian rates as %TAVR(N=725)
SAVR(N=678)
(95% BCI for Difference)
All-cause mortality or disabling stroke 2.9 4.6 (-4.0, 0.4)
All-cause mortality 2.4 3.0 (-2.6, 1.3)Cardiovascular mortality 1.7 2.6 (-2.7, 0.7)
All stroke 4.1 4.3 (-2.4, 1.9)
Disabling stroke* 0.8 2.4 (-3.1, -0.3)
Transient ischemia attack 1.7 1.8 (-1.6, 1.3)
Myocardial infarction 1.7 1.6 (-1.3, 1.5)
Endocarditis 0.2 0.4 (-0.9, 0.5)
Valve thrombosis 0.2 0.3 (-0.9, 0.5)Aortic valve reintervention 0.7 0.6 (-1.0, 0.9)Heart failure hospitalization* 3.2 6.5 (-5.9, -1.0)
Clinical Outcomes at 1 Year
* Significantly favors TAVR BCI = Bayesian credible interval

23
1211109876543210
10%
8%
6%
4%
2%
0%
TAVR
Death or Disabling Stroke (%
)
Months
30 Days 2.50.7
1 Year4.6 2.7
No. at riskTAVR
725 718 648 435
SAVR
678 656 576 366
K-M All-Cause Mortality or Disabling Stroke at 1 YearK-M All-Cause Mortality or Disabling Stroke at 1 Year
Log-rank P = 0.065
1211109876543210
10%
8%
6%
4%
2%
0%
TAVR
24
No. at risk
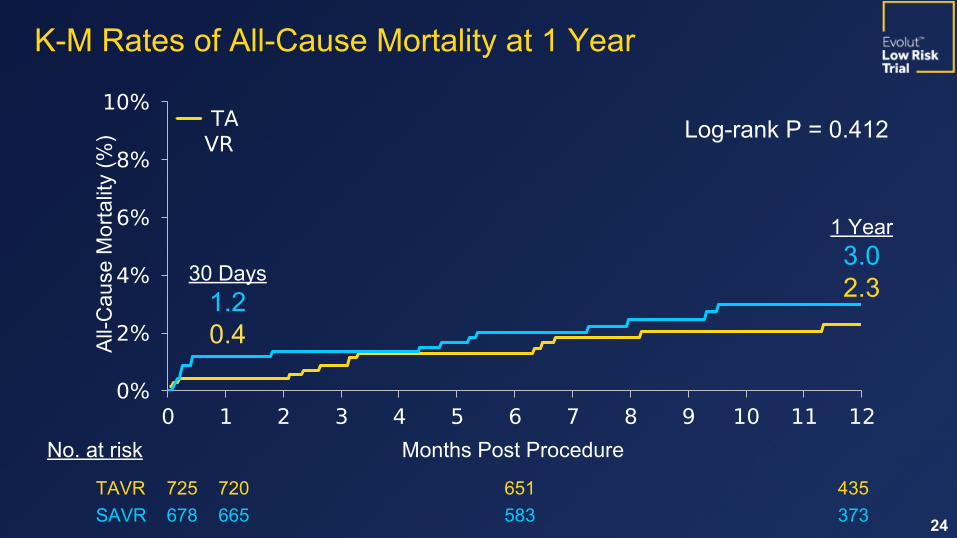
K-M Rates of All-Cause Mortality at 1 YearK-M Rates of All-Cause Mortality at 1 Year
All-Cause Mortality (%)
Months Post Procedure
TAVR 725 720 651 435SAVR 678 665 583 373
30 Days 1.20.4
1 Year3.02.3
Log-rank P = 0.412

1211109876543210
6%
4%
2%
0%
K-M Disabling Stroke at 1 YearK-M Disabling Stroke at 1 Year
Log-rank P = 0.024
No. at riskTAVR
725 720 648 435
SAVR
678 656 576 366
Months
Disabling Stroke (%
)
1 Year2.30.7

1211109876543210
10%
8%
6%
4%
2%
0%
TAVR...
Months
K-M Heart Failure Hospitalization at 1 Year
No. at riskTAVR
725 712 636 420
SAVR
678 649 561 358
Heart Failure Hospitalization
(%)
6.4
3.1
Log-rank P = 0.006
1 Year

TAVR SAVR
12%
10%
8%
6%
4%
2%
0%2.3% [VALUE]0.7%
2.3%3.1%
6.4%
Clinical Implications Death, Disabling Stroke and Heart Failure Hospitalizations to 1 Year
Estimated KM rates, %
Death
Disabling Stroke
HF Hospitalization
Composite Rates TAVR
SAVR Difference = –4.5%
5.6% 10.2%
P = 0.002
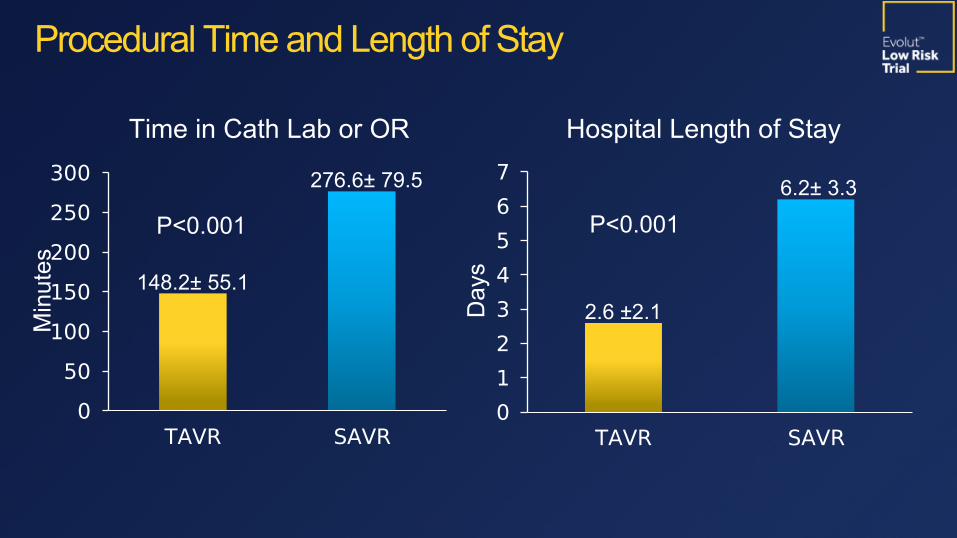
TAVR SAVR0
50100150200250300
148.2± 55.1
276.6± 79.5
Procedural Time and Length of Stay
P<0.001
TAVR SAVR01234567
2.6 ±2.1
6.2± 3.3
P<0.001
Minutes
Days
Time in Cath Lab or OR Hospital Length of Stay

Baseline 1 Mo 6 Mo 12 Mo 24 Mo0.0
0.5
1.0
1.5
2.0
2.5
3.0
0.0
10.0
20.0
30.0
40.0
50.0
60.0
0.8
2.2 2.2 2.3 2.2
0.9
2.0 2.0 2.0 2.0
44.8
8.4 8.7 8.6 9.0
44.2
10.5 11.2 11.2 12.3
Aortic Valve Area, cm2
AV Mean G
radient, mm Hg
Valve Hemodynamics
Implanted population. Core lab assessments.
TAVR Statistically Superior At All Time Points

Prosthesis-Patient Mismatch
TAVRN=542
SAVRN=463
TAVRN=341
SAVRN=293
1 Month 12 Months
05
1015202530
9.915.5
5.015.7
1.14.4
1.8
8.2
Moderate PPM Severe PPMImplant population. Core lab
assessments.
N = 609 N = 541
P<0.001 P<0.001
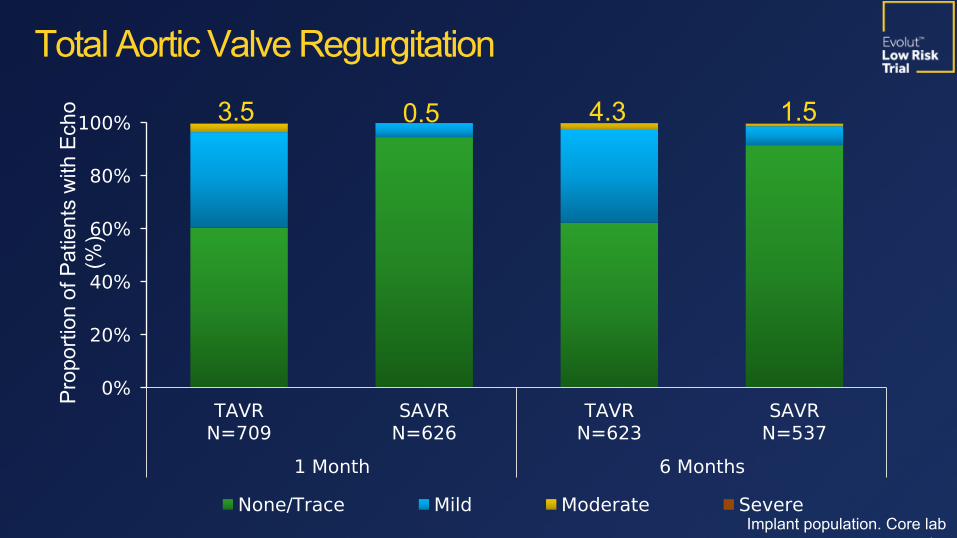
TAVRN=709
SAVRN=626
TAVRN=623
SAVRN=537
1 Month 6 Months 1 Year
0%
20%
40%
60%
80%
100%
None/Trace Mild Moderate Severe
3.5 0.5 4.3 1.5
Proportion of Patients with Echo
(%)
Total Aortic Valve Regurgitation
Implant population. Core lab assessments.

TAVRN=725
SAVRN=678
TAVRN=706
SAVRN=625
TAVRN=428
SAVRN=342
Baseline 1 Month 1 Year
100
80
60
40
20
0
NYHA I NYHA II NYHA III NYHA IV
NYHA Functional ClassProportion of Patients (%)

Change from BaselineTAVR 20.0 ± 21.1 21.9 ± 21.2 22.2 ± 20.3SAVR 9.1 ± 22.3 20.5 ± 20.5 20.9 ± 20.995% BCI for difference
(8.6, 13.2) (-1.0, 3.8) (-1.6, 4.3)
Baseline 30 Days 6 Months 12 Months6065707580859095
100TAVR
KCCQ Overall Summary
Score
Patients Recover Quality of Life Sooner After TAVRKCCQ Summary Score

Subgroup TAVR SAVR Hazard Ratio (95% BCI) P for
Interaction n/N (% KM rate at 1 Year)
Age, years 0.50
< 75 10/351 (3.3) 14/350 (4.3) 0.70 (0.31-1.57)
≥ 75 7/374 (2.2) 13/328 (4.9) 0.45 (0.18-1.14)
Sex 0.22
Male 10/464 (2.5) 21/449 (5.4) 0.44 (0.21-0.93)
Female 7/261 (3.0) 6/229 (2.9) 1.01 (0.34-3.02)
BMI, kg/m2 0.98
≤ 30 8/366 (2.5) 13/345 (4.4) 0.57 (0.24-1.38)
> 30 9/359 (2.9) 14/333 (4.7) 0.56 (0.24-1.31)
LVEF, % 0.28≤ 50 3/56 (7.4) 2/56 (3.6) 1.44 (0.24-
8.63)> 50 14/669 (2.3) 25/621 (4.6) 0.50 (0.26-
0.97)
0.01 0.1 1.0 10.0Favors TAVR
Favors SAVR
Subgroup Analysis for Death or Disabling Stroke at 1 Year

Subgroup TAVR SAVR Hazard Ratio (95% BCI) P for
Interaction n/N (% KM rate at 1 Year)
Peripheral Artery Disease 0.92
No 15/664 (2.7) 25/621 (4.6) 0.54 (0.29-1.03)
Yes 1/54 (1.9) 2/56 (4.9) 0.46 (0.04-5.15)
Diabetes Mellitus 0.81
No 12/497 (2.8) 18/471 (4.7) 0.59 (0.28-1.23)
Yes 5/228 (2.3) 9/207 (4.4) 0.50 (0.17-1.50)
Need for Revascularization 0.31
No 17/640 (3.1) 24/599 (4.7) 0.64 (0.34-1.18)
Yes 0/85 (0.0) 3/79 (3.9) 0.13 (0.00-1.36)
STS PROM, % 0.99< 3 15/678 (2.5) 25/650 (4.4) 0.56 (0.29-
1.06)≥ 3 2/47 (5.3) 2/28 (7.6) 0.55 (0.08-
3.90)
0.01 0.1 1.0 10.0
Subgroup Analysis for Death or Disabling Stroke at 1 Year
Favors TAVR
Favors SAVR

• TAVR with self-expanding supra-annular valves was noninferior to surgery for the primary endpoint of death or disabling stroke at 2 years in patients with severe aortic stenosis at low surgical risk.
• At 30 days, TAVR showed a better safety and recovery profile than surgery, with less death or disabling stroke, less disabling stroke, shorter length of stay and better QOL while SAVR had fewer pacemakers implanted and less residual AR.
• At 1 year, both groups had excellent survival. TAVR showed fewer disabling strokes and heart failure rehospitalizations with superior hemodynamics manifest by lower gradients, larger EOAs and less PPM.
SummarySummary

TAVR may be a preferred strategy to surgery in patients with severe aortic stenosis at low
risk of surgical mortality.
ConclusionConclusion


Thank you to the Evolut Low Risk patients, site personnel, investigators and sponsor for making this and our series of randomized trials possible