triangle petroleum corporate presentation march 2012 · our “consolidated financial statements”...
TRANSCRIPT

CORPORATE PRESENTATION
March 2012

FORWARD LOOKING STATEMENT
This presentation includes a number of forward-looking statements that reflect the current views of our management with respect to future events and financial performance. You can identify these statements by forward-looking words such as “may,” “will,” “expect,” “anticipate,” “believe,” “estimate” and “continue,” or similar words. Those statements include statements regarding our and members of our management team’s intent, belief or current expectations as well as the assumptions on which such statements are based. Prospective investors are cautioned that any such forward-looking statements are not guarantees of future performance and involve risk and uncertainties, and that actual results may differ materially from those contemplated by such forward-looking statements.
Readers are urged to carefully review and consider the various disclosures made by us in these materials and our other reports filed with the U.S. Securities and Exchange Commission. These presentation materials should be read in conjunction with the sections entitled “Management’s Discussion and Analysis of Financial Condition and Results of Operations” in our Annual Report on Form 10-K, and with our “Consolidated Financial Statements” and notes thereto in our Annual Report on Form 10-K for the year ended January 31, 2011.Important factors currently known to our management could cause actual results to differ materially from those in forward-looking statements. We undertake no obligation to update or revise forward-looking statements to reflect changed assumptions, the occurrence of unanticipated events or changes in the future operating results over time. We believe that these assumptions are based upon reasonable data derived from and known about our business and operations. No assurances are made that actual results of operations or the results of our future activities will not differ materially from these assumptions. Factors that could cause differences include, but are not limited to, history of losses, uncertainty of drilling results, inability to acquire additional leasehold interests or other oil and natural gas properties, inability to manage growth in our business, inability to control properties we do not operate, inability to protect against certain liabilities associated with our properties, lack of diversification, substantial capital requirements and limited access to additional capital, competition in the oil and natural gas industry, global financial conditions, oil and natural gas realized prices, seasonal weather conditions, marketing and distribution of oil and natural gas, the influence of our significant stockholders, government regulation of the oil and natural gas industry, potential regulation affecting hydraulic fracturing, environmental regulations, including climate change regulations, uninsured or underinsured risks, aboriginal claims relating to our Canadian properties, defects in title to our oil and natural gas interests, material weakness in our internal accounting controls, and foreign currency exchange risks.
Prior to 2010, the SEC generally permitted oil and gas companies, in their filings, to disclose only proved reserves that a company has demonstrated by actual production or conclusive formation tests to be economically and legally producible under existing economic and operating conditions. Beginning with year-end reserves for 2009, the SEC permits the optional disclosure of probable and possible reserves. We use the terms “estimated ultimately recoverable,” or EUR, “resource potential,” “recoverable reserves” or other descriptions of volumes of hydrocarbons to describe volumes of resources potentially recoverable through additional drilling or recovery techniques that the SEC’s guidelines prohibit us from including in filings with the SEC. Estimates of resource potential, recoverable reserves or estimated ultimately recoverable amounts do not reflect volumes that are demonstrated as being commercially or technically recoverable. Even if commercially or technically recoverable, a significant recovery factor would be applied to these volumes to determine estimates of volumes of proved reserves. Accordingly, these estimates are by their nature more speculative than estimates of proved reserves and accordingly are subject to substantially greater risk of being actually realized by us. The methodology for resource potential, recoverable reserves or estimated ultimately recoverable amounts may also be different than the methodology and guidelines used by the Society of Petroleum Engineers and is different from the SEC’s guidelines for estimating probable and possible reserves.
Furthermore, the forward-looking statements contained in this presentation are made as of the date hereof, and we undertake no obligation, except as required by applicable securities legislation, to update publicly or to revise any of the included forward looking statements, whether as a result of new information, future events or otherwise. The forward-looking statements contained herein are expressly qualified by this cautionary statement.

AG
EN
DA
Triangle Highlights
Geological Overview
Operated Program
RockPile Energy Services, LLC
Financial Overview
Key Investment Considerations

TRIANGLE HIGHLIGHTS

TR
IAN
GL
EH
IGH
LIG
HT
STRIANGLE OVERVIEW
5
Oil-focused Bakken player with ~83,500 concentrated net acres, 52% operated
Strong balance sheet with ~$94mm in cash and no debt
1-rig program is fully-funded through 2012, with plans to grow production to up to 3,200 Boe/d by year-end, depending on rig count
Seasoned Management and Technical Team with Williston Basin and resource play execution experience
Focused on efficiencies of pad drilling (up to 8 wells per unit) and centralized facilities in industry de-risked Core Area
Created RockPile Energy Services, LLC in October 2011 to provide pressure pumping services

TR
IAN
GL
EH
IGH
LIG
HT
STRIANGLE TEAM
TITLE PERSONNEL PRIOR EXPERIENCE
CHIEF EXECUTIVE OFFICER
Dr. Peter Hill
� Dr. Peter Hill has been Director and Chief Executive Officer of Triangle since December 2009. Dr. Hill has over 39 years of experience in the international oil & gas industry, having begun his career in 1972 with British Petroleum. He spent 22 years in senior positions at British Petroleum, including that of Chief Geologist, Chief of Staff for BP Exploration, President of BP Venezuela and Regional Director for Central and South America. Dr. Hill has worked as President and Chief Executive Officer - Harvest Natural Resources Inc. (2000-2005), Director / Chairman - Austral Pacific Energy Ltd. (2006-2008), as an independent advisor to Palo Alto Investors, LLC, a hedge fund founded in 1989 (2008-2009) and as Non-Executive Chairman - Toreador Resources Corporation (2009 to July 2011). Dr. Hill has a BSc with Honors in Geology as well as a PhD.
PRESIDENT AND CHIEF FINANCIAL
OFFICERJonathan Samuels
� Jonathan Samuels has been Director, President and Chief Financial Officer of Triangle since December 2009. Mr. Samuels becamePresident of Triangle in July of 2011. Prior to joining Triangle, Mr. Samuels was an investment professional at Palo Alto Investors, LLC. At the California-based hedge fund, Mr. Samuels was responsible for research and investment sourcing in the energy sector. Mr. Samuels received his BA from the University of California and an MBA at the Wharton School of The University of Pennsylvania. He is a CFA Charterholder.
SUBSURFACE MANAGER
Kim Perez
� Most recently with: EOG Resources, Inc.
� Experience: 30 years, conducted research and developed drillable prospects in the Williston Basin as well as in the Green River Basin, Uinta Basin, Central Montana, Paradox Basin, Las Animas Arch and Southwestern Nebraska; mapped and developed the Three Forks play in the Williston Basin and was responsible for well site geology
� Education: MS in Geology from the University of Wyoming
OPERATIONS MANAGER
John Whittington
� Most recently with: EOG Resources, Inc.
� Experience: 23 years, drilling, completions and production operations; developing the Barnett Shale during its earlier horizontal development stages; exploiting EOG’s horizontal Bakken and Three Forks positions in the Williston Basin
� Education: PE degree from the New Mexico Institute of Mining and Technology
DRILLING ENGINEER Dominic Spencer
� Most recently with: Bill Barrett Corporation
� Experience: Drilling Engineer, Drilling Superintendent, Operations Engineer, Project Coordinator and most recently an Operations Manager and Team Coordinator
� Education: PE degree from the Colorado School of Mines
PRODUCTION AND FACILITIES ENGINEER
J.D. McNally
� Most recently with: EOG Resources, Inc.
� Experience: production engineer for ExxonMobil, working on a range of international oil and gas production systems, including detailed design, construction and operations; horizontal oil well artificial lift optimization and gathering systems and facilities, including new asset development and established production maintenance
� Education: BS in Engineering from MIT
SENIOR RESERVOIR ENGINEER
Craig Smith
� Most recently with: Rosetta Resources Inc.
� Experience: 34 years, expertise in production and reservoir engineering, economic evaluations, Monte Carlo simulation and statistics, financial systems, software and database development and several programming languages; Niobrara and San Juan basins
� Education: BS in Geological Engineering from Colorado School of Mines; MS in Computer Science from the University of Denver
VICE PRESIDENT OF ACCOUNTING,
PRINCIPAL ACCOUNTANT
Joseph Feiten
� Most recently with: Hess Corporation
� Experience: 37 years, has served as Chief Financial Officer, Principal Financial Officer and Principal Accounting Officer of two publicly trading E&P companies: American Oil & Gas Inc. and Tipperary Corporation; co-authored the 4th (1996) and 5th (2000) editions of Petroleum Accounting Principles, Procedures, & Issues
� Education: BSBA in Accounting and MBA from the University of Denver
VICE PRESIDENT –LAND
Don Schroeder
� Most recently with: American Oil & Gas, Inc..
� Experience: 33 years, petroleum landman with Amoco Production Company; management and executive positions with various E&P companies in Denver, Calgary and Russia
� Education: BBA in Petroleum Land Management from The University of Texas and MBA from the University of Denver
LAND MANAGER Rick Feger
� Most recently with: EOG Resources, Inc.
� Experience: field landman / broker in the Piceance Basin; expertise in Williston Basin oil and gas matters, particularly with respect to contract negotiations, lease acquisition, title examination as well as both state and commission rules and regulations
� Education: BA from the University of California at Santa Barbara and JD from the University of Denver
6
SheridanDaniels
Divide
Burke
WilliamsRoosevelt
Mountrail
Richland
McKenzie Dunn
Billings
Stark
Dawson
WibauxPrairie
ValleyGolden
Montana North DakotaFEET
0 124,599
Zone: KRP-BAKKEN - CUM_OIL [KRP] IS PRESENT
PETRA 1/2/2012 9:20:33 AM
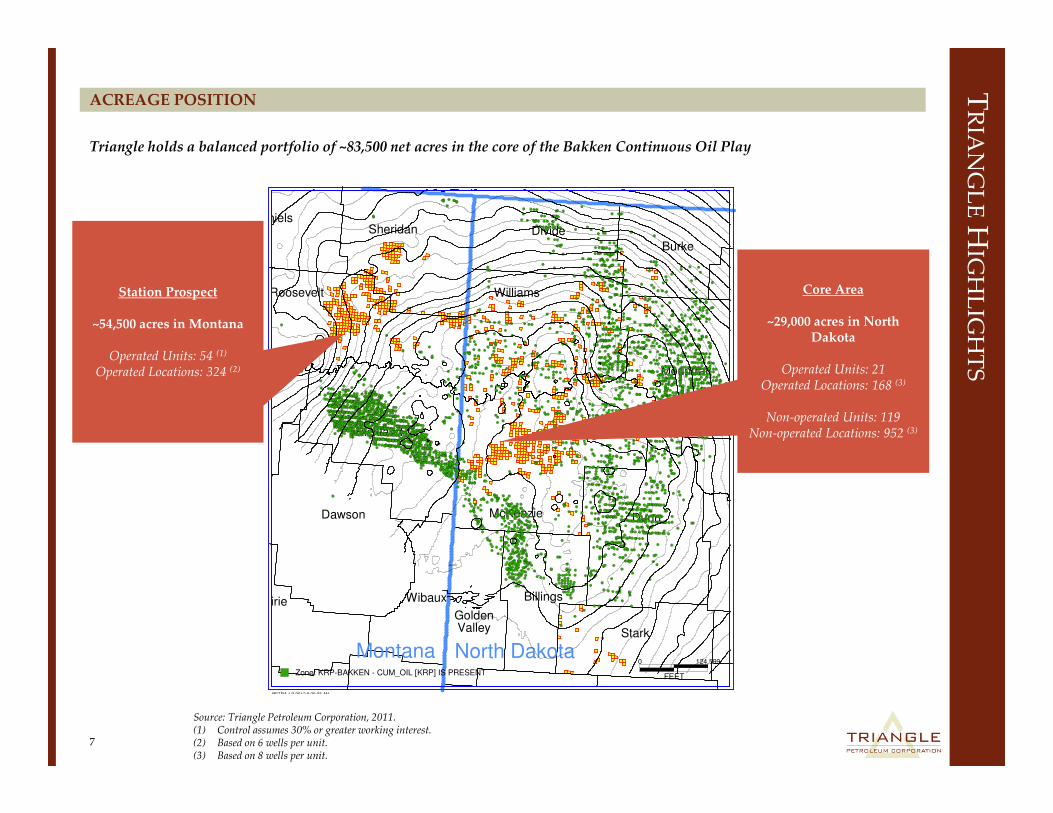
Triangle holds a balanced portfolio of ~83,500 net acres in the core of the Bakken Continuous Oil Play
TR
IAN
GL
EH
IGH
LIG
HT
SACREAGE POSITION
7
Source: Triangle Petroleum Corporation, 2011.(1) Control assumes 30% or greater working interest.(2) Based on 6 wells per unit.(3) Based on 8 wells per unit.
Station Prospect
~54,500 acres in Montana
Operated Units: 54 (1)
Operated Locations: 324 (2)
Core Area
~29,000 acres in North Dakota
Operated Units: 21 Operated Locations: 168 (3)
Non-operated Units: 119Non-operated Locations: 952 (3)

GEOLOGICAL OVERVIEW

GE
OL
OG
ICA
LO
VE
RV
IEW
BAKKEN PETROLEUM SYSTEM
9 Source: Continental Resources Inc., Corporate Presentation, 2011.

GE
OL
OG
ICA
LO
VE
RV
IEW
STATION PROSPECT – ROOSEVELT AND SHERIDAN COUNTIES
10 Source: Triangle Petroleum Corporation, 2011.
37N 57E37N 58E
37N 56E
37N 55E37N 54E
37N 53E
163N 103W
36N 42E
36N 46E
36N 45E
36N 47E
36N 44E
36N 49E
36N 51E
36N 50E
36N 52E
36N 43E
36N 48E
36N 55E
36N 56E
36N 53E
36N 54E
36N 57E
36N 58E
162N 103W35N 48E
35N 47E
35N 49E
35N 50E
35N 51E
35N 58E
35N 43E
35N 45E
35N 46E
35N 44E
35N 56E35N 57E
35N 52E
35N 53E
35N 54E
35N 55E
161N 103W34N 48E
34N 47E
34N 45E
34N 49E
34N 44E
34N 43E
34N 50E
34N 46E
34N 51E
34N 58E
34N 52E
34N 53E
34N 57E34N 56E
34N 54E
34N 55E
160N 103W33N 48E
33N 47E
33N 49E
33N 43E
33N 50E
33N 44E
33N 45E
33N 51E
33N 52E
33N 46E
33N 53E
33N 54E
33N 57E33N 56E
33N 58E
33N 55E
159N 103W
32N 43E
32N 44E
32N 45E
32N 52E
32N 46E
32N 47E
32N 48E
32N 49E
32N 53E
32N 54E
32N 51E
32N 50E
32N 57E32N 58E
32N 56E
32N 59E
32N 55E
158N 103W
31N 43E
31N 46E
31N 44E
31N 45E
31N 54E
31N 55E
31N 57E31N 58E
31N 53E
31N 50E
31N 51E
31N 52E
31N 49E
31N 59E
31N 48E
31N 56E
31N 47E
157N 103W
30N 46E
30N 43E
30N 44E
30N 45E
30N 53E
30N 54E
30N 51E
30N 52E
30N 55E
30N 50E
30N 59E
30N 49E
30N 58E30N 57E
30N 56E
30N 47E
30N 48E
156N 104W
29N 43E
29N 44E
29N 45E
29N 46E
29N 51E
29N 52E
29N 56E29N 55E
29N 57E
29N 53E
29N 48E
29N 49E
29N 50E
29N 47E
29N 54E
29N 58E29N 59E
155N 104W
28N 44E
28N 45E
28N 46E
28N 47E
28N 54E
28N 52E
28N 53E
28N 55E
28N 51E
28N 56E
28N 57E
28N 50E
28N 48E
28N 49E
28N 58E28N 59E
154N 104W
27N 44E
27N 45E
27N 46E
27N 50E
27N 52E
27N 51E
27N 55E
27N 53E
27N 49E
27N 54E
27N 48E
27N 58E
27N 56E27N 57E
27N 47E
27N 59E
153N 104W153N 103W
26N 44E
26N 45E
26N 46E
26N 48E
26N 47E
26N 49E
26N 50E
26N 51E
26N 54E
26N 55E
26N 52E
26N 58E26N 59E
26N 56E26N 57E
26N 53E
152N 104W
25N 44E
25N 46E
25N 47E
25N 45E
25N 48E
25N 50E
25N 49E
25N 51E
SheridanDaniels
Roosevelt
0
0
0
0. 25
52.0
0. 25
5
2.0
0. 5
0. 5
5.
0
5.0
5.0
0. 5
Bakken Shows (vertical wells)
Bakken Production (laterals)
Samson Permitted Bakken Wells
Whiting Permitted Bakken Wells
EOG Permitted Bakken Well
Industry “Closing In,” with Production from Long Laterals and New Permitted Wells

OPERATED PROGRAM

OP
ER
AT
ED
PR
OG
RA
M
159N 103W
159N 100W159N 99W
159N 102W159N 101W
159N 98W159N 97W
159N 95W159N 96W
32N 58E32N 59E
158N 103W
158N 100W158N 101W
158N 102W
158N 99W158N 98W
158N 97W158N 96W
158N 95W
31N 58E31N 59E
157N 103W157N 102W
157N 101W157N 100W
157N 99W157N 98W
157N 97W
157N 95W157N 96W
30N 59E30N 58E
156N 104W156N 103W
156N 102W156N 101W
156N 100W156N 99W
156N 97W
156N 95W156N 96W
156N 98W
29N 58E29N 59E
155N 104W155N 103W
155N 102W155N 101W
155N 99W155N 100W
155N 98W155N 97W
155N 96W155N 95W
28N 58E28N 59E
154N 104W154N 103W
154N 102W
154N 99W154N 100W
154N 98W
154N 101W
154N 97W
154N 95W154N 96W
27N 58E27N 59E
153N 104W
153N 102W153N 103W
153N 100W153N 99W
153N 98W153N 97W
153N 101W
153N 96W153N 95W
26N 58E26N 59E
152N 103W152N 104W
152N 100W152N 99W
152N 102W152N 101W
152N 98W152N 97W
152N 96W152N 95W
25N 59E25N 58E
151N 101W
151N 103W151N 102W
151N 104W
151N 100W151N 99W
151N 98W151N 97W
151N 96W151N 95W
24N 60E24N 59E
150N 101W
150N 103W150N 102W
150N 104W
150N 100W150N 99W
150N 98W150N 97W
150N 96W150N 95W
23N 60E23N 59E
149N 104W
149N 102W149N 103W
149N 101W149N 100W
149N 99W149N 98W
149N 97W149N 96W
149N 95W
22N 59E22N 60E
148N 104W148N 103W
148N 105W
148N 102W148N 101W
148N 100W148N 99W
148N 96W
148N 98W148N 97W
148N 95W
21N 60E21N 59E
147N 105W147N 104W
147N 103W147N 102W
147N 96W147N 95W
147N 100W
147N 97W
147N 101W
147N 99W147N 98W
20N 60E
146N 105W146N 104W
146N 103W146N 102W
146N 96W146N 95W
146N 97W
146N 99W146N 98W
146N 100W146N 101W
19N 60E
145N 105W145N 104W
145N 103W145N 102W
145N 96W145N 97W
145N 95W
145N 98W
145N 101W145N 100W
145N 99W
18N 60E
144N 105W144N 104W
144N 103W
Williams
McKenzie
160N 99W
160N 96W160N 95W
160N 98W160N 97W
33N 57E33N 58E
PETRA 1/3/2012 10:21:23 AM
SIGNIFICANT INVENTORY OF DE-RISKED OPERATED LOCATIONS
12
As of 2/28/2012, a Total of 43 Applications for Permit to Drill
Source: Triangle Petroleum Corporation, 2012.
56
9
7
1
3
8
2
4
10
11
14
13
12
15
Approved as of 2/28/2012 – 12 Permits
1 Dwyer 150-101-21-16-1H
2 Larson 149-101-9-4-1H through 4H
3 Gullickson Trust 150-101-36-25-1H through 4H
4 Fredrick James 149-101-3-10-1H
5 Larsen 157-101-21-16-1H
6 Larsen 157-101-28-33-1H
Submitted / pending NDIC approval as of 2/28/2012 – 31 Permits
7 State 154-102-25-36-1H through 4H
8 Steen 149-101-13-24-1H through 4H
9 Wilder 154-101-1-12-1H through 4H
10 Triangle 149-101-1-12-1H through 4H
11 Skedsvold Trust 151-101-33-29-1H through 4H
12 Dwyer 149-101-2-11-1H through 4H
13 Smith 155-101-25-36-1H through 4H
14 Kittleson 157-103-32-29-1H
15 Joy State 156-104-1H
Sveet 156-104-2-3-1H16
16

OP
ER
AT
ED
PR
OG
RA
MMULTI-WELL PAD DESIGN MAXIMIZES EFFICIENCIES
13
� Increases oil recovery factor by increasing reservoir-stimulated rock volume
� Condenses drilling, completion and production operations
― Drilling:
• Utilize rig’s skid system to move between wells on a pad, with rig move cost of ~$25,000 (cost savings of ~$225,000)
― Completions:
• Decrease completion time with batch completions; apply zipper frac technique to maximize stimulated rock volume
― Production:
• Condense production equipment to a central location, less equipment needed on a per well basis
� Minimizes site cost and truck movements as well as surface and environmental footprint for high well density areas
� Safety and weather: minimize road time for drilling and completion rigs, stimulation fleets and other ancillary services
� Integrate program with infrastructure to reduce cost – share and centralize production facilities
1
Multi-well Pad Design Allows for More Efficient Drilling and Completion Time and Cost, Especially with Triangle’s Lack of Near-term Lease Expirations
2
3
4
5

ROCKPILE ENERGY SERVICES, LLC

RO
CK
PIL
EE
NE
RG
YS
ER
VIC
ES, L
LC
15
� RockPile Energy Services, LLC (“RockPile”) is a majority-owned subsidiary of Triangle Petroleum Corporation (“Triangle”) focused on providing pressure pumping and ancillary services in the Williston Basin
― RockPile will be headquartered in Denver, Colorado, with field operations in both Dickinson and Williston, North Dakota
� RockPile has received commitments for a $24mm Series A 8% Convertible Preferred Unit offering, with Triangle subscribing for $20mm, giving Triangle an 83 percent interest in the Series A Units
― Proceeds from the Series A offering will be used to purchase equipment for 1 pressure pumping spread, to build a rail-based proppant receiving terminal located in Dickinson, North Dakota and for general corporate purposes
� Complete Management Team in place
� RockPile anticipates the commencement of its pressure pumping operations July 1, 2011
� RockPile and Triangle USA Petroleum Corporation, a wholly owned operating subsidiary of Triangle, will enter into an agreement for the use of 50% of the pumping capacity of RockPile’s first spread, based on prevailing market rates
― RockPile will seek third party customers as it expands operations and will consider additional pressure pumping spreads based on customer demand and sourcing additional capital
• With Triangle and other strategic partners as customers, RockPile has contracted 100 percent of the first spread’s capacity for the first four months after start-up
� RockPile’s first 18,000 horsepower pumping spread will be delivered in April 2012 and is expected to commence daylight operations in July 2012
― In addition to its pressure pumping fleet, RockPile will have fully integrated purpose-built proppant loading and storage facilities, fleet maintenance and repair facilities and employee housing facilities
SUMMARY OVERVIEW

RO
CK
PIL
EE
NE
RG
YS
ER
VIC
ES, L
LC
KEY INVESTMENT CONSIDERATIONS
16
� RockPile will benefit from the currently severe supply / demand imbalance of pressure pumping services in the Williston Basin
� Recent rig count of ~200 in the Basin implies approximately 2,000 wells drilled per year and an over $8-$10bn per year market for pressure pumping and ancillary services
� Operators with 4 rigs or less make up approximately 40% of the market and are grossly underserved by incumbent services companies struggling to maintain pace with demand from larger customers
� Current idle well inventory waiting on fracturing services is estimated at +400 with an estimated market of +$4 billion and growing
� Estimated backlog of 350-400 wells Waiting on Completion (WOC) (1)
PRESSURE PUMPING VALUATION METRICS PRESSURE PUMPING PROFITABILITY RATIOS
(1) Spears & Associates, “Pressure Pumping,” 2011.
2.7x
2.0x1.7x 1.6x
1.0x
0.0x
1.0x
2.0x
3.0x
4.0x
CJES TCW CFW SPN RockPile
Price to Book Value:CJES FTS
C&J Energy Services, Inc. Frac Tech Services, LLC
LTM Operating Margin 34.6% 31.5%
LTM EBITDA Margin 37.6% 39.9%
LTM Net Margin 21.4% 23.4%

FINANCIAL OVERVIEW

0
500
1,000
1,500
2,000
2,500
3,000
3,500
FYQ1'13E FYQ2'13E FYQ3'13E FYQ4'13E
0.0
2.0
4.0
6.0
8.0
10.0
12.0
14.0
Q1'13E Q2'13E Q3'13E Q4'13E
Operated Wells Non-operated Wells
FIN
AN
CIA
LO
VE
RV
IEW
AS OF MARCH 20, 2012 PRODUCTION PROFILE
18
Current Position
CUMULATIVE NET WELLS
Note: Dollars in U.S. millions. Charts assume 1-rig program, 2 rigs running between May and July.
12.1 cumulative net wells by year-end FY2013
Exit Rate~2,600 – ~3,200 Boe/d
(April ’12) (July ’12) (October ’12) (January ‘13)
Current Capitalization
Share Price $7.24
Fully Diluted Shares Outstanding 43.3
Market Capitalization $313.4
Total Debt $0.0
Total Cash (as of period end FY3Q12) $93.9
Total Enterprise Value $219.6
Total Acreage 83,500
TEV / Acres $2,629
Current Commitments:
- No hedges
- RockPile contractural obligations

FIN
AN
CIA
LO
VE
RV
IEW
19
BUDGET DETAIL
FY2013 Capital Budget
BUDGET ALLOCATION
Note: Dollars in U.S. millions.
52%
23%
8%
11%
6%
1-Rig Operated
Drilling Program
Non-Operated Drilling
Program
Land Spend
Infrastructure
Cash G&A
Expected Expenses FY2013 Budget
1-Rig Operated Drilling Program $68
Non-Operated Drilling Program $30
Land Spend $10
Infrastructure $15
Cash G&A $8
Total Budget $131

KEY INVESTMENT CONSIDERATIONS

KE
YIN
VE
ST
ME
NT
CO
NS
IDE
RA
TIO
NS
TRIANGLE OVERVIEW
21
Oil-focused Bakken player with ~83,500 concentrated net acres, 52% operated
Strong balance sheet with ~$94mm in cash and no debt
1-rig program is fully-funded through 2012, with plans to grow production to up to 3,200 Boe/d by year-end, depending on rig count
Seasoned Management and Technical Team with Williston Basin and resource play execution experience
Focused on efficiencies of pad drilling (up to 8 wells per unit) and centralized facilities in industry de-risked Core Area
Created RockPile Energy Services, LLC in October 2011 to provide pressure pumping services

APPENDIX

Producing Well Name Operator Status Triangle WI (%) County Target Township Range
Stewart 5200 12-29H Oasis Producing 31.41% McKenzie BKKN 152N 100W
Federal 4-11H Kodiak Producing 26.25% McKenzie BKKN 147N 105W
Grizzly 1-27H R Kodiak Producing 26.25% McKenzie TFK 148N 105W
Grizzly 13-6H Kodiak Producing 26.25% McKenzie BKKN 147N 104W
Holm 150-99-13-24-1H Newfield Production Co. Producing 23.44% McKenzie BKKN 150N 99W
Kahuna 1-7-6H Slawson Producing 18.95% McKenzie BKKN 149N 99W
Crossbow #1-7-6H Slawson Producing 17.92% McKenzie BKKN 149N 102W
Gabriel #3-36-25H Slawson Producing 17.71% McKenzie BKKN 151N 99W
Barnstormer Fed 1-3-10H Slawson Producing 16.41% McKenzie BKKN 148N 100W
Roedeske Federal 12x-21 XTO Producing 15.00% McKenzie TFK 148N 104W
Staal 150-99-23-14-1H Newfield Production Co. Producing 12.84% McKenzie BKKN 150N 99W
Bonanza 1-21-16-H Slawson Producing 12.47% McKenzie BKKN 152N 102W
Smokey 3-6-7-14-H Kodiak Oil and Gas Producing 11.41% McKenzie BKKN 148N 99W
Koufax 3-10 #1H Zavanna Producing 7.50% McKenzie BKKN 149N 102W
Kostelank 28-1H Hess/Tracker Producing 7.50% Dunn BKKN 145N 97W
Hawkeye 16-21-1H Brigham Exploration Company Producing 6.60% Williams BKKN 154N 101W
Lawlar 151-98-31-30-1H Newfield Production Co. Producing 6.30% McKenzie BKKN 151N 98W
Short Prairie 3-1415H EOG Producing 4.83% Williams BKKN 154N 104W
Durham 1-2H Continental Resources, Inc. Producing 4.53% McKenzie BKKN 151N 99W
Well Name Operator Status Triangle WI (%) County Target Township Range
Condor 1-36-25H Slawson Waiting on Completion 18.95% McKenzie BKKN 149N 99W
Thor 1-31-30H Slawson Waiting on Completion 17.91% McKenzie BKKN 149N 103W
Charles 3-10 1-H Kodiak Oil and Gas Waiting on Completion 11.41% McKenzie BKKN 148N 99W
Charles 3-10 2-H Slawson Waiting on Completion 10.64% McKenzie BKKN 151N 99W
Olson 34-19NWH Brigham Exploration Company Waiting on Completion 7.84% Williams BKKN 154N 101W
Mortenson 6-5H Brigham Exploration Company Waiting on Completion 7.84% Williams BKKN 154N 101W
Chitwood 34-36H Denbury Onshore, LLC Waiting on Completion 7.60% McKenzie BKKN 150N 100W
Chitwood 44-36TFH Whiting Drilling 6.25% McKenzie BKKN 149N 100W
BW-R Peterson 149-99-1102H-1 Whiting Drilling 6.25% McKenzie BKKN 149N 100W
Syverson 16-34H Hess Waiting on Completion 6.24% McKenzie BKKN 149N 99W
Antelope 1-34-27H 1 SM Energy Company Waiting on Completion 5.47% McKenzie BKKN 152N 100W
BW-Edwin Stenseth 149-100-2833H-1 Zenergy, Inc Permitted 5.12% Williams BKKN 153N 102W
Moran 15-1H Hunt Oil Waiting on Completion 4.36% McKenzie BKKN 149N 101W
Good Shepherd Home 150-101-15B-22-1HWhiting Drilling 3.13% McKenzie BKKN 149N 99W
Dwyer 14-33NEH Petro-Hunt, LLC Permitted 3.13% McKenzie BKKN 150N 101W
AP
PE
ND
IXSELECTED NON-OPERATED WELL LIST
23
Newfield Staal, 12.84% WIWeek of 8/28/2011: IP rate of 3,034 Boe/d
Newfield Lawlar, 6.33% WIWeek of 10/2/2011: IP rate of 2,789 Boe/d
Newfield Holm, 23.44% WIWeek of 8/21/2011: IP rate of 2,370 Boe/d