triangulation in the assessment of student learning … h nelson associate vice ... 6 december 2010...
TRANSCRIPT
Karen H NelsonAssociate Vice President for Institutional Effectiveness &Professor of Psychology6 December 2010
Triangulation in the Assessment of Student Learning Outcomes
Smith (2007)
Although I have been working in the area of evaluation and assessment for some time, it didn’t come easily. Indeed, I think I can say I came to it with some resistance. Perhaps it was a reaction to so much of the early work that seemed to privilege tests. Perhaps it was the evidence of the limitations of standardized testing, especially high stakes testing, for the assessment of learning or anything. Perhaps it was my sense that talking about assessment and evaluation to groups of academics and administrators was a little like talking abouta root canal.
Question?
How can we determine whether we are really achieving student learning outcomes and student success and how can we ensure that our institutional practices are aligned both with assessment efforts and using results of those efforts?
Smith (2007) On the need for an organizational approach to measurement.
answers to such questions “can and will emerge if we frame assessment not as a reductionistic effort or one that simply focuses on those things that are easily measured or as something that requires compliance.” (p. 8)
Wright (2007)
Assessment is not measurement. Assessment is a process, that includes looking at our students’ learning, determining what strengths and weaknesses are present in the performances relative to what we hoped to see and then deciding what to do to improve their learning, if that seems necessary. (p. 45)
Two challenges (Katz, 2008)
1. We are supposed to do assessment despite the fact that “there is no modal student in American higher education.”
2. We are also supposed to “seek more adequate means of both culminating and longitudinal assessment of student learning.”
The Importance of Narrative
Writing a story about how well a college helps its students become better educated is an endless helix of “counting and recounting” (Shulman, 2007), yielding a series of narratives that track a college’s educational trajectory. When discussed openly, both within and among institutions, these iterative accounts gleaned from measures of student learning can improve undergraduate education by making it more transparent (Bok, 2006).
Sotherland et al. 2007, p. 20
Two ways to think about triangulation
1) Assessing general education (Thomas, Lightcap & Rosencranz, 2005)
2) A non-reductionistic, human and humanistic, iterative process -- the helix of stories that link curriculum development, staff development and student development (Coats & Stevenson, 2006)
Thomas et al.(2005)
Triangulating methods of analysis is commonly recommended to overcome validity problems. . . . The idea is a simple one; when multiple threats to validity of measures emerge, use multiple sources of data generated by multiple methods of analysis to meet them. If the methods lead to similar conclusions, then the level of uncertainty is reduced.
From this perspective, triangulation helps with the formal requirements of assessment and evaluation
Every method is inherently flawed: NSSE, CIRP, YFCY, CSS, etc.
CLA, CAAP, Facione & Facione’s Critical Thinking Scoring Rubric, etc.
Locally developed rubrics, portfolios, pre-post tests, etc.
Major field tests, content exams, etc.
Despite inadequacy of every assessment strategy:
Begin with your institutional story:MissionStrategic plan -- institutional prioritiesProgram assessment in place
What is central to the Austin College story?
Critical inquiry skills Oral communication skills Written communication skills Information literacy skills Quantitative reasoning skills Openness to diversity Citizenship and civic engagement
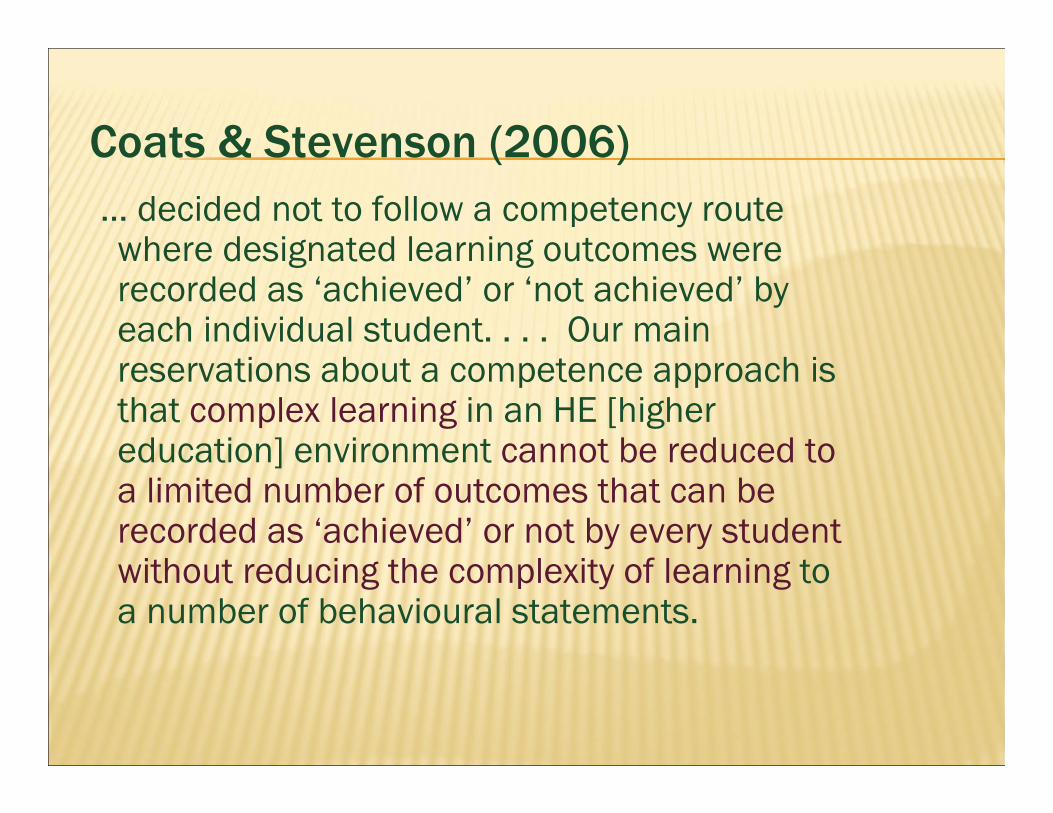
Coats & Stevenson (2006)… decided not to follow a competency route where designated learning outcomes were recorded as ‘achieved’ or ‘not achieved’ by each individual student. . . . Our main reservations about a competence approach is that complex learning in an HE [higher education] environment cannot be reduced to a limited number of outcomes that can be recorded as ‘achieved’ or not by every student without reducing the complexity of learning to a number of behavioural statements.
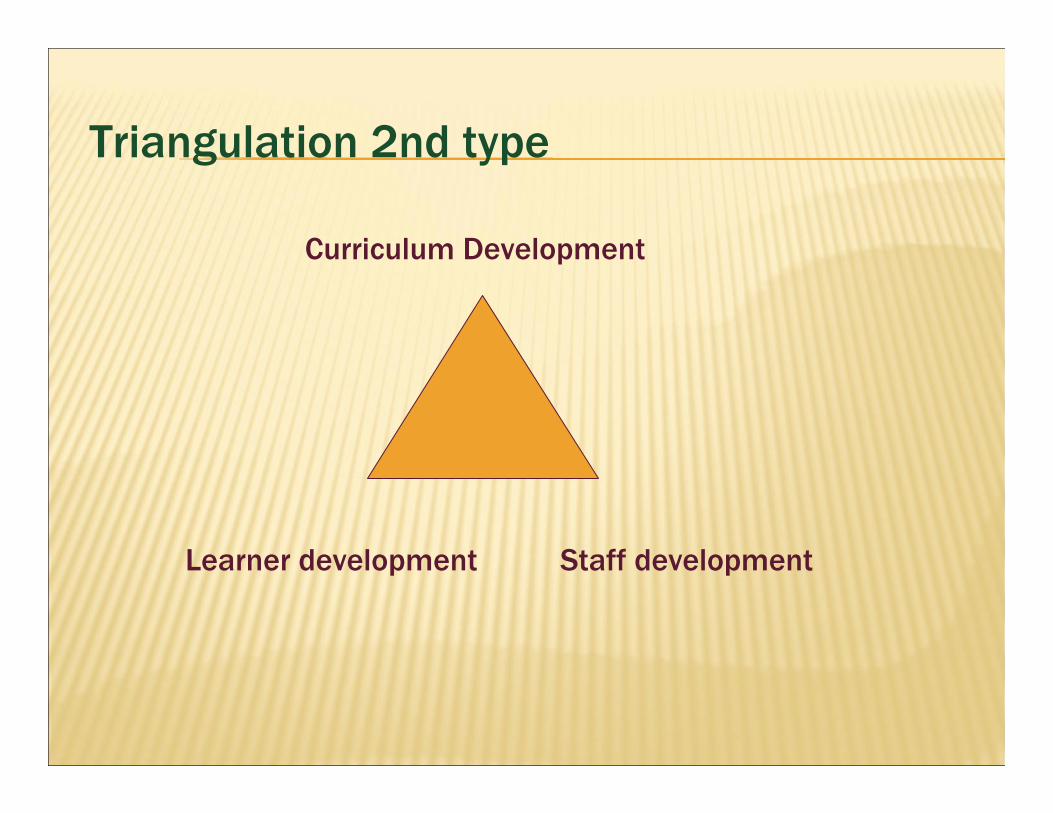
Triangulation 2nd type
Learner development
Curriculum Development
Staff development

Benefits of this approach
This approach moves the conversation to improvement of what we do through on-going assessment linked directly to how faculty think about assessment and its relationship to curricula.
This approach is not new:

Gipps (1994)
Assessment is undergoing a paradigm shift from psychometrics to a broader model of educational assessment, from a testing and examination culture to an assessment culture.
Boud (1995)
Good assessment now is that which most closely reflects desired learning outcomes and in which the process of assessment has a beneficial influence on the learning culture.
Willis (1993)
Rather than assessment being something you do to people, it is an interactive activity between students and teacher that can play an important role in providing feedback, the aim of which is to improve the quality of future learning.
Appeal of this 2nd approacho Coats & Stevenson conclude by describing
what they see as positive in their work:o Colleagues focus on teaching and learning
and, above all, on assessment rather than the content of their courses;
o Staff development is inherent in curricular change;
o Constant attention is paid to the enhancement of learning experiences in their students.
Attractiveness of triangulation to faculty colleagues
1. The 1st approach acknowledges the flaws inherent in any single assessment method;
2. The 2nd persuades colleagues that assessment is not about content or telling them what to teach, but about examining how a program can ensure that its curriculum is achieving the student learning outcomes valued both by the program and the institution. The question becomes how your program helps the institution fulfill its mission.
Oral communication skills
1) Self-ratings
1) NSSE items
2) Locally developed course-based and program assessments
NSSE (National Survey of Student Engagement)
One advantage is comparison of FY and SY students at Austin College with students from: A selected group of peer institutions, All institutions in our Carnegie classification, All institutions who participated in NSSE data
collection in that year.
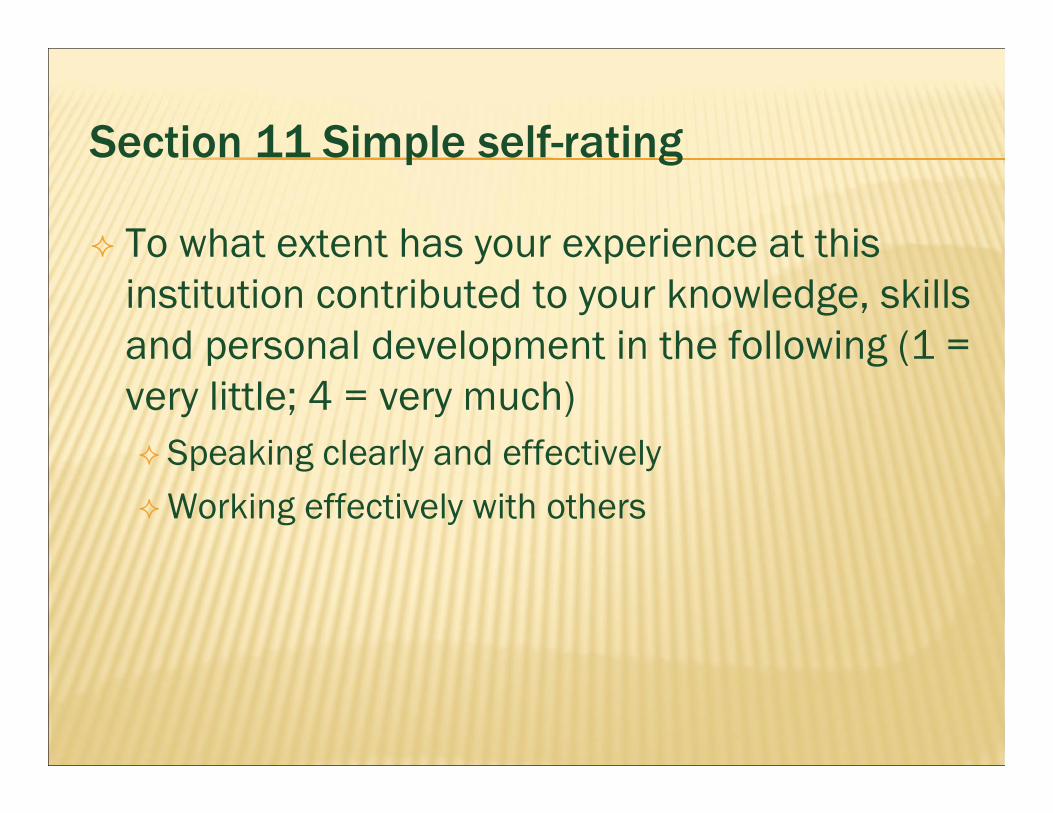
Section 11 Simple self-rating
To what extent has your experience at this institution contributed to your knowledge, skills and personal development in the following (1 = very little; 4 = very much)Speaking clearly and effectivelyWorking effectively with others
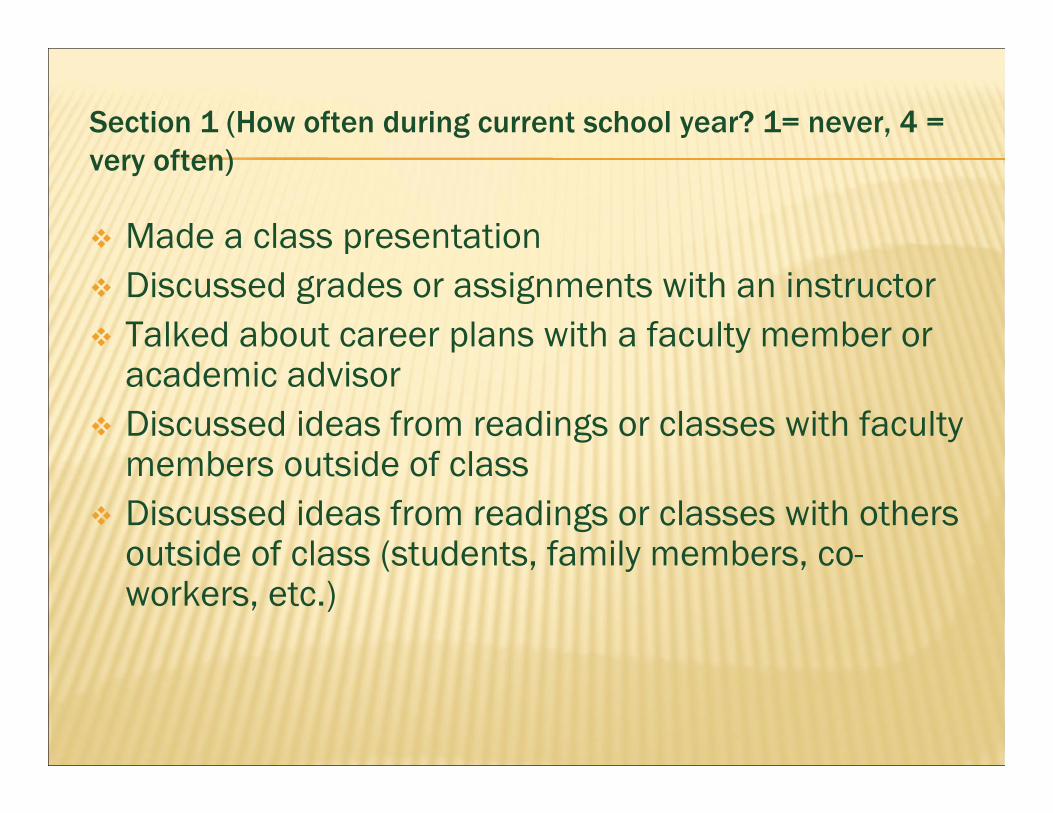
Section 1 (How often during current school year? 1= never, 4 = very often)
Made a class presentation Discussed grades or assignments with an instructor Talked about career plans with a faculty member or
academic advisor Discussed ideas from readings or classes with faculty
members outside of class Discussed ideas from readings or classes with others
outside of class (students, family members, co-workers, etc.)
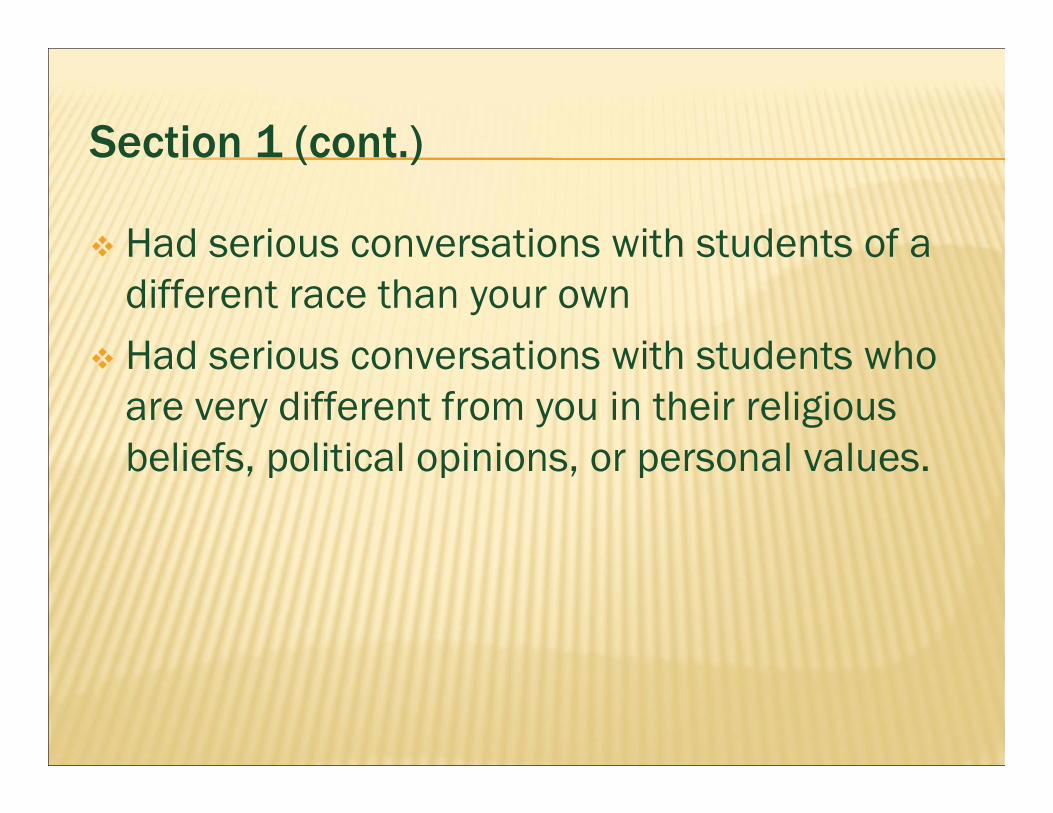
Section 1 (cont.)
Had serious conversations with students of a different race than your own
Had serious conversations with students who are very different from you in their religious beliefs, political opinions, or personal values.
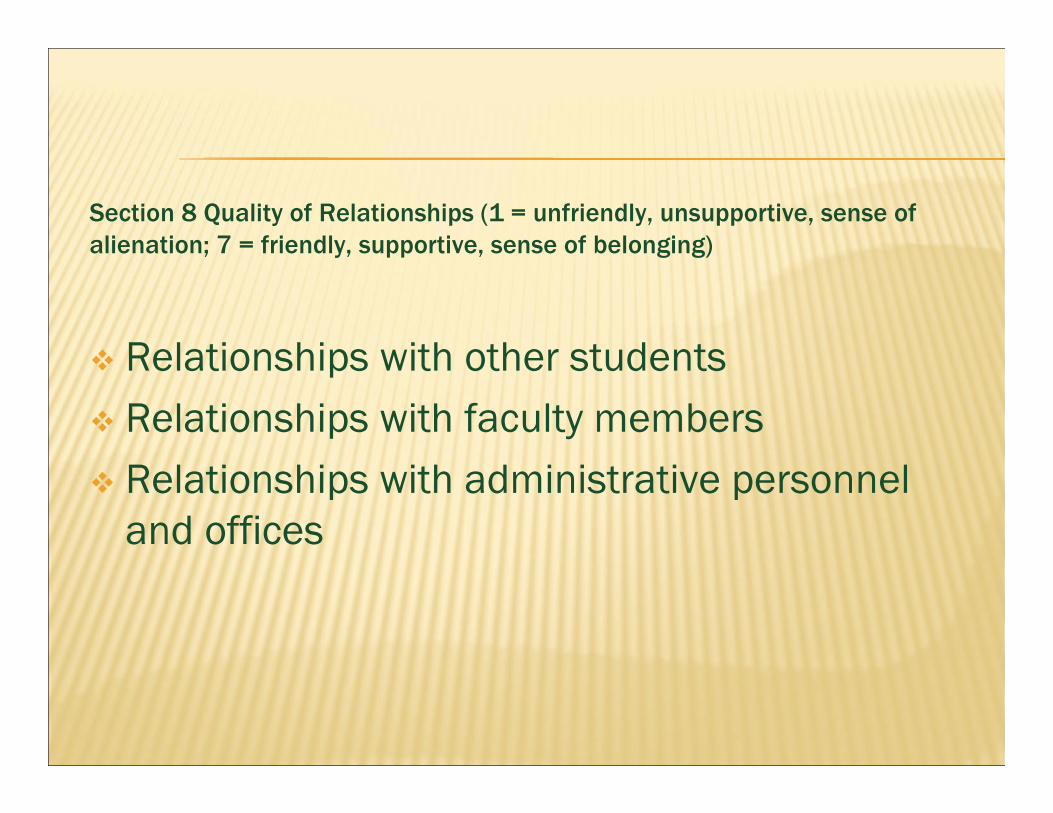
Section 8 Quality of Relationships (1 = unfriendly, unsupportive, sense of alienation; 7 = friendly, supportive, sense of belonging)
Relationships with other students Relationships with faculty members Relationships with administrative personnel
and offices
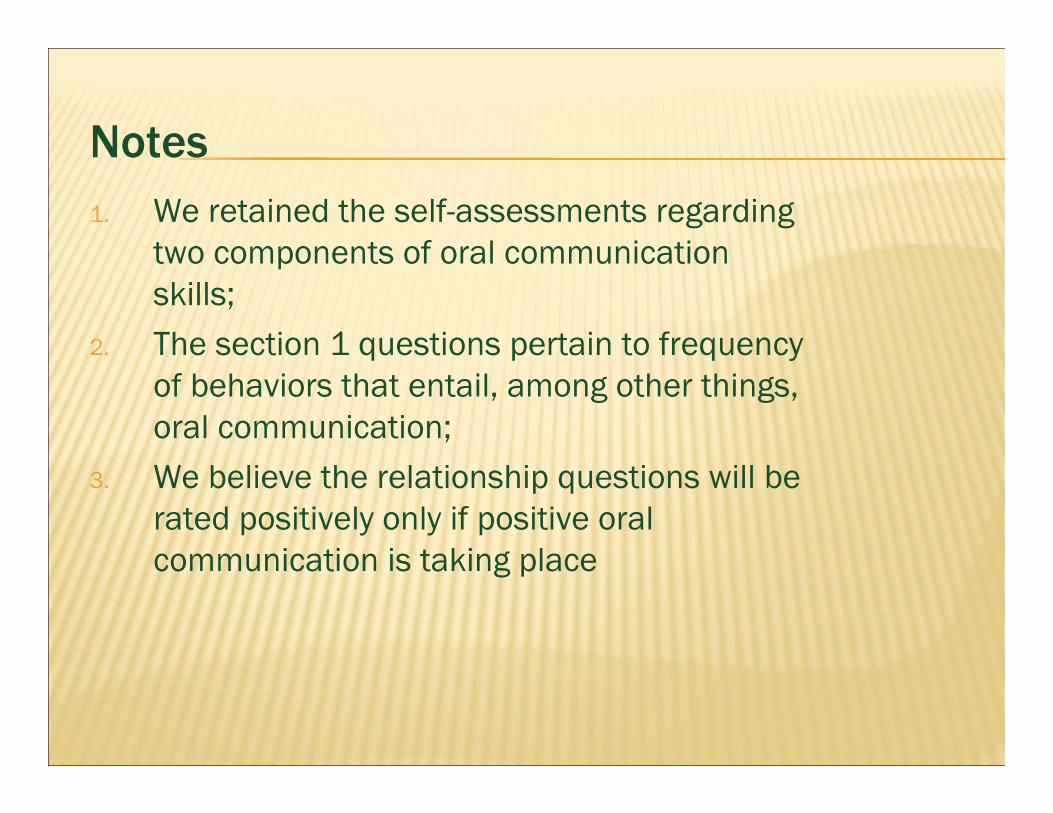
Notes1. We retained the self-assessments regarding
two components of oral communication skills;
2. The section 1 questions pertain to frequency of behaviors that entail, among other things, oral communication;
3. We believe the relationship questions will be rated positively only if positive oral communication is taking place
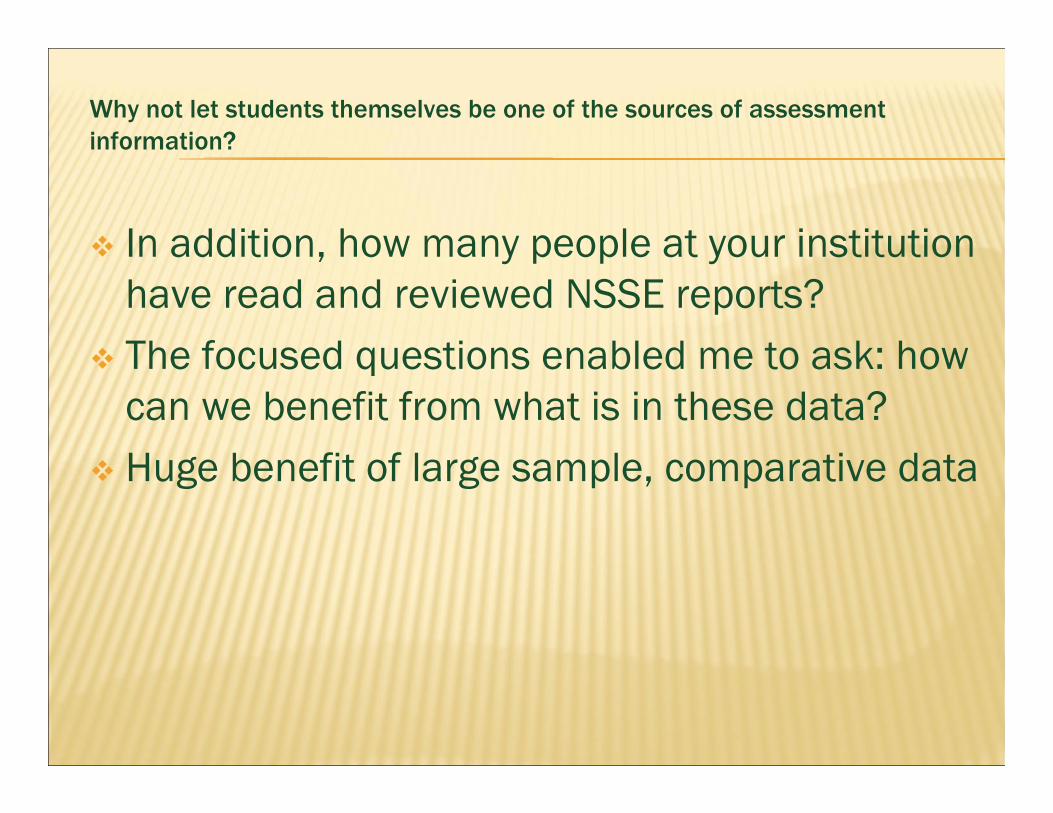
Why not let students themselves be one of the sources of assessment information?
In addition, how many people at your institution have read and reviewed NSSE reports?
The focused questions enabled me to ask: how can we benefit from what is in these data?
Huge benefit of large sample, comparative data
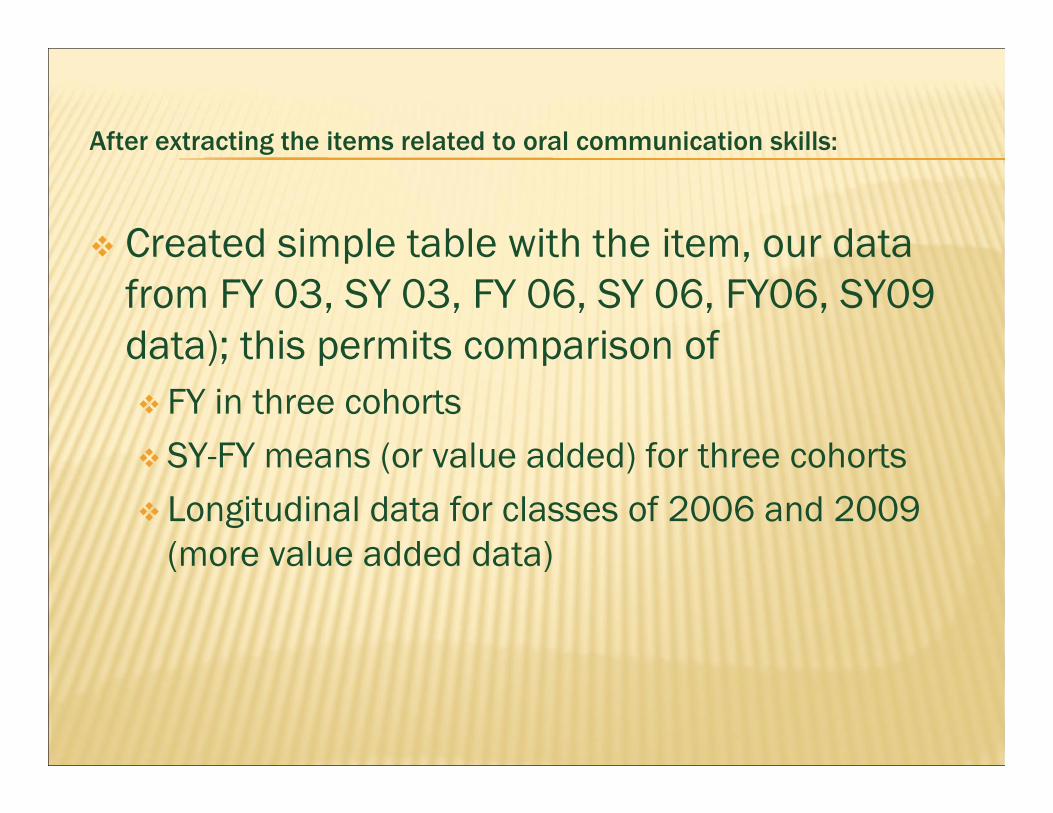
After extracting the items related to oral communication skills:
Created simple table with the item, our data from FY 03, SY 03, FY 06, SY 06, FY06, SY09 data); this permits comparison of FY in three cohortsSY-FY means (or value added) for three cohorts Longitudinal data for classes of 2006 and 2009
(more value added data)
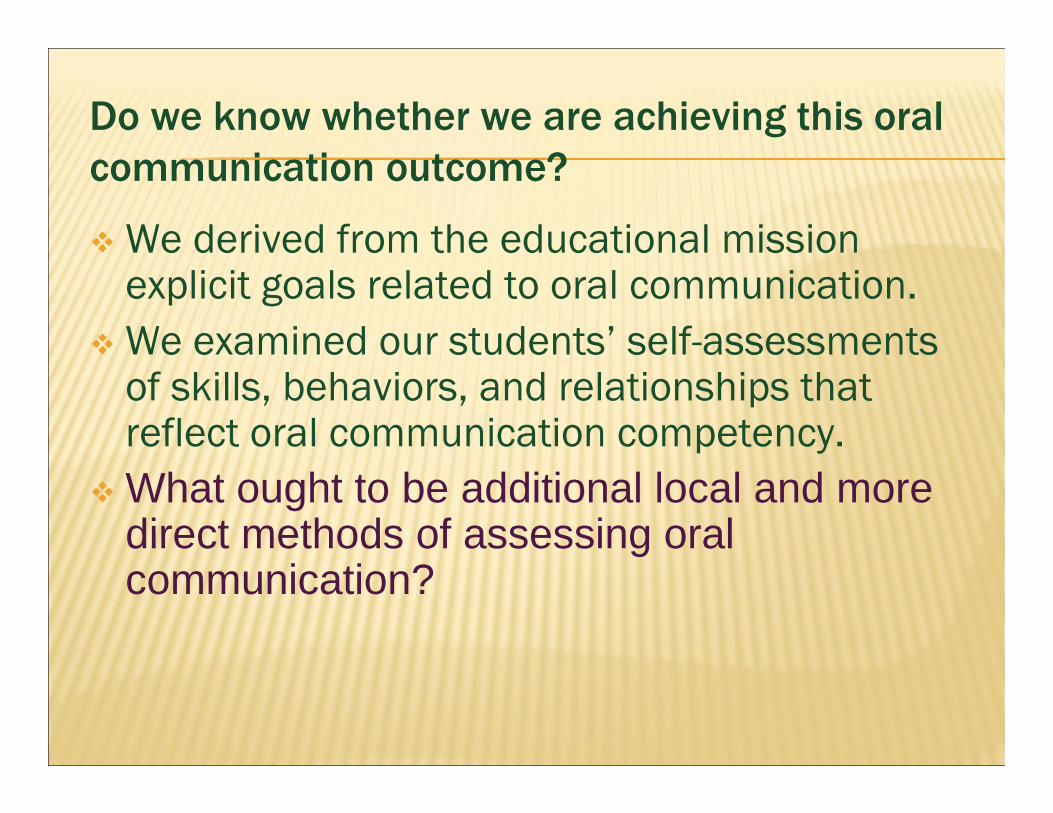
Do we know whether we are achieving this oral communication outcome?
We derived from the educational mission explicit goals related to oral communication.
We examined our students’ self-assessments of skills, behaviors, and relationships that reflect oral communication competency.
What ought to be additional local and more direct methods of assessing oral communication?
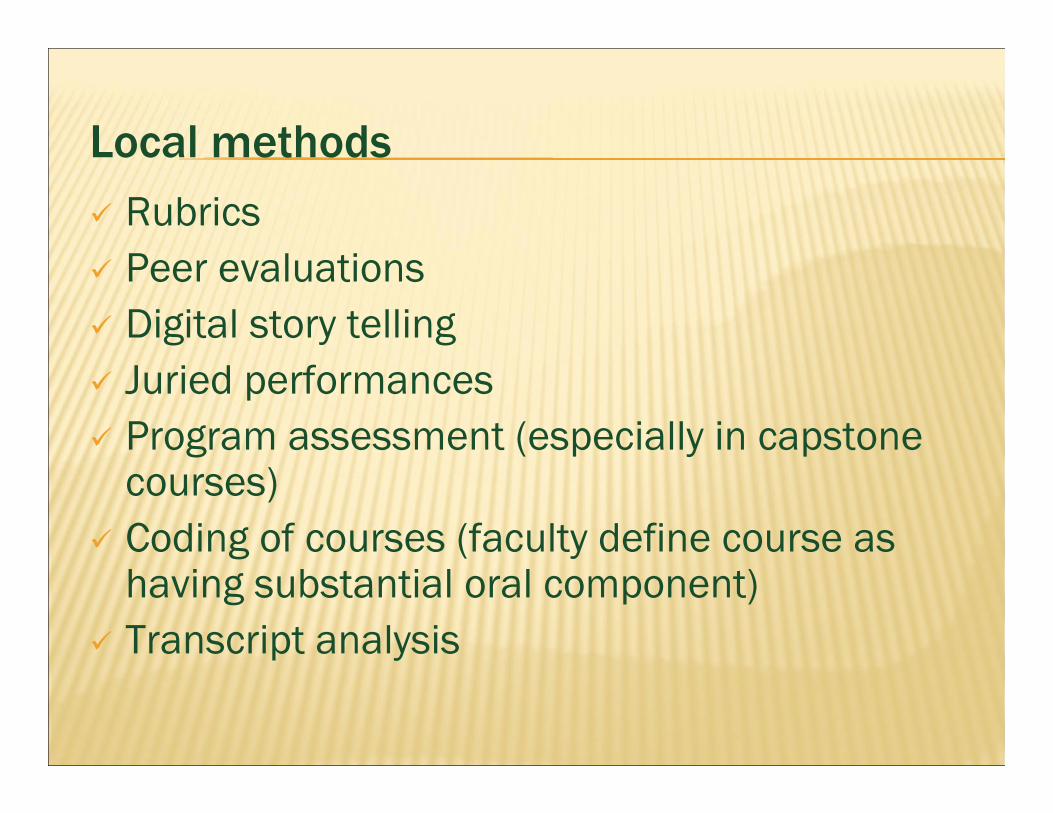
Local methods Rubrics Peer evaluations Digital story telling Juried performances Program assessment (especially in capstone
courses) Coding of courses (faculty define course as
having substantial oral component) Transcript analysis
Quantitative reasoning
While the oral communication data made us look very good, here we will see how assessment helped us target needs for further assessment and, ultimately, changes in program development and institutional policy.
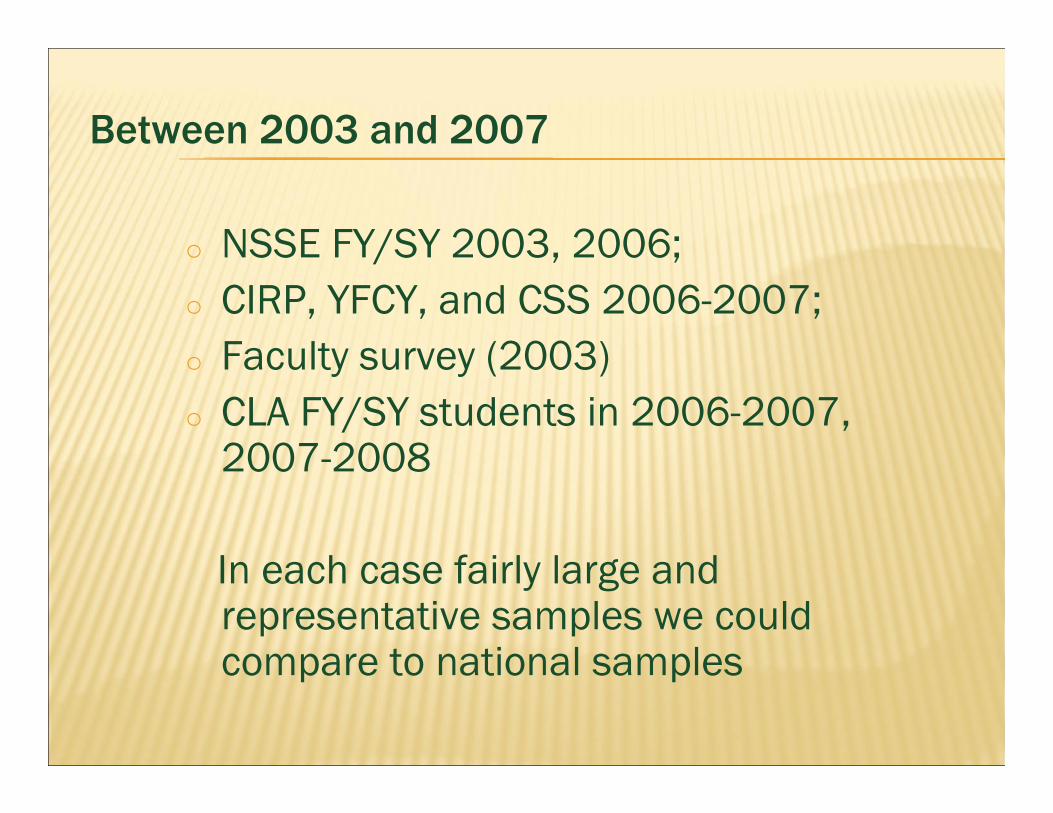
Between 2003 and 2007
o NSSE FY/SY 2003, 2006;o CIRP, YFCY, and CSS 2006-2007;o Faculty survey (2003)o CLA FY/SY students in 2006-2007,
2007-2008
In each case fairly large and representative samples we could compare to national samples
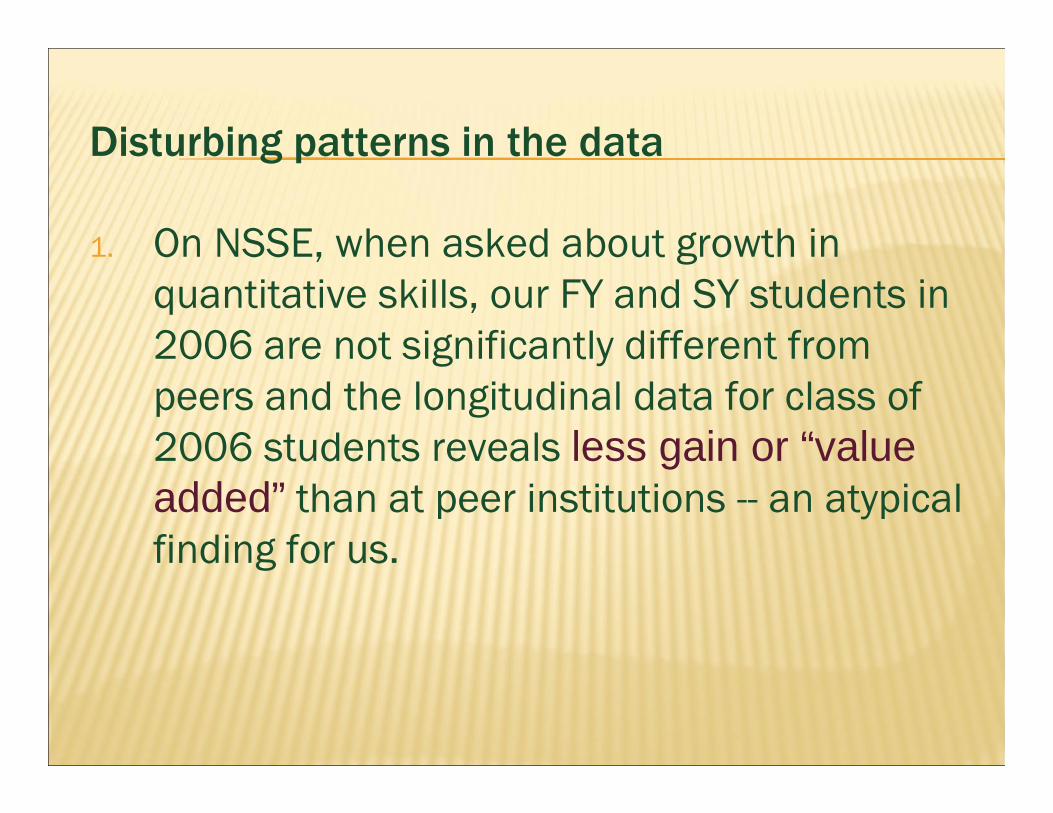
Disturbing patterns in the data
1. On NSSE, when asked about growth in quantitative skills, our FY and SY students in 2006 are not significantly different from peers and the longitudinal data for class of 2006 students reveals less gain or “value added” than at peer institutions -- an atypical finding for us.
More disturbing data
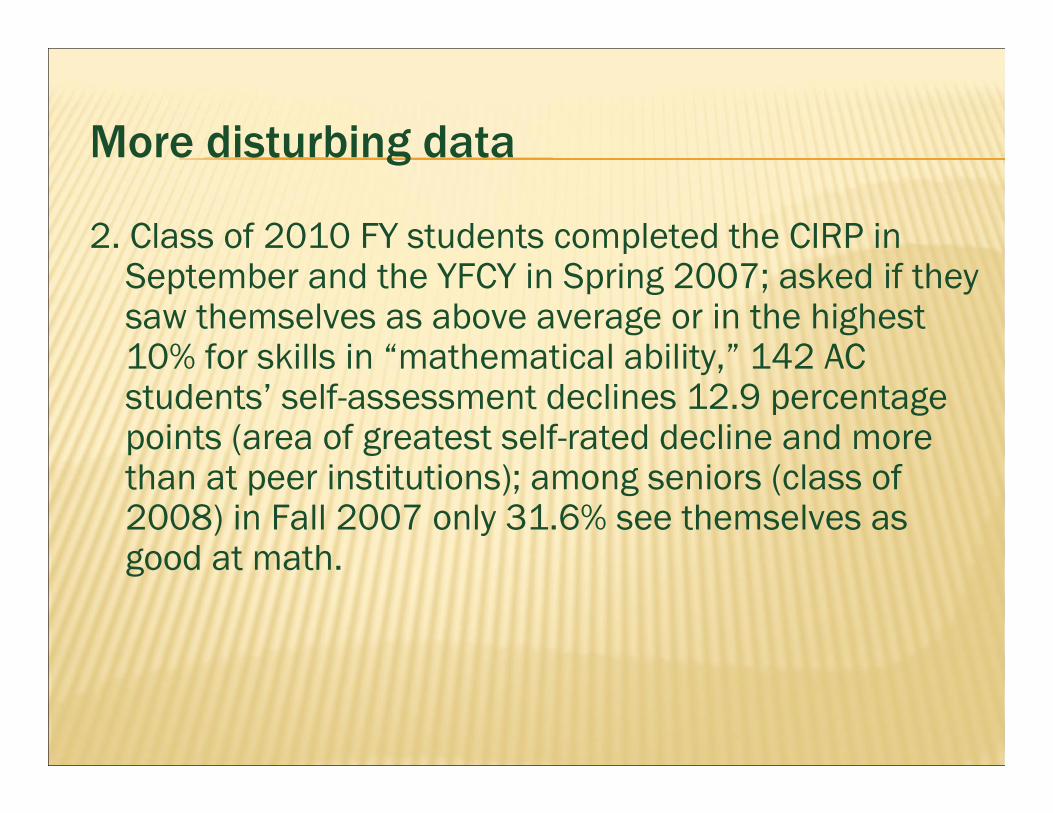
2. Class of 2010 FY students completed the CIRP in September and the YFCY in Spring 2007; asked if they saw themselves as above average or in the highest 10% for skills in “mathematical ability,” 142 AC students’ self-assessment declines 12.9 percentage points (area of greatest self-rated decline and more than at peer institutions); among seniors (class of 2008) in Fall 2007 only 31.6% see themselves as good at math.
Still more disturbing data
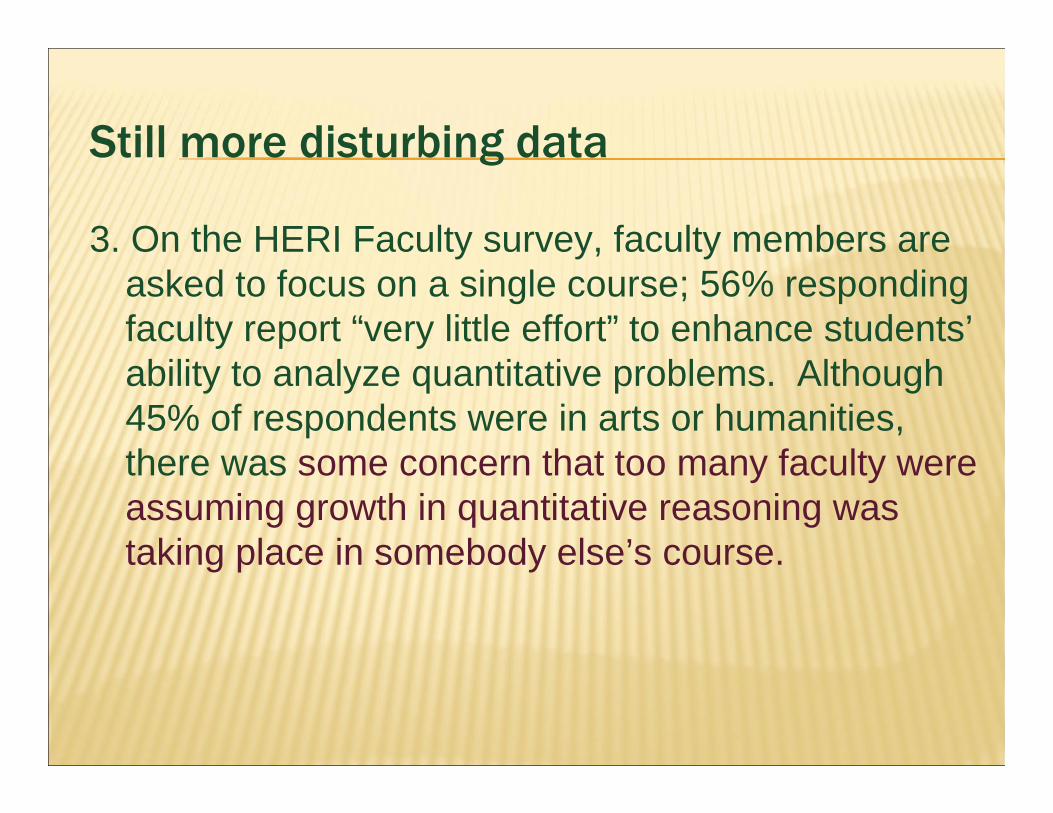
3. On the HERI Faculty survey, faculty members are asked to focus on a single course; 56% responding faculty report “very little effort” to enhance students’ability to analyze quantitative problems. Although 45% of respondents were in arts or humanities, there was some concern that too many faculty were assuming growth in quantitative reasoning was taking place in somebody else’s course.
Yes there are still more disturbing data
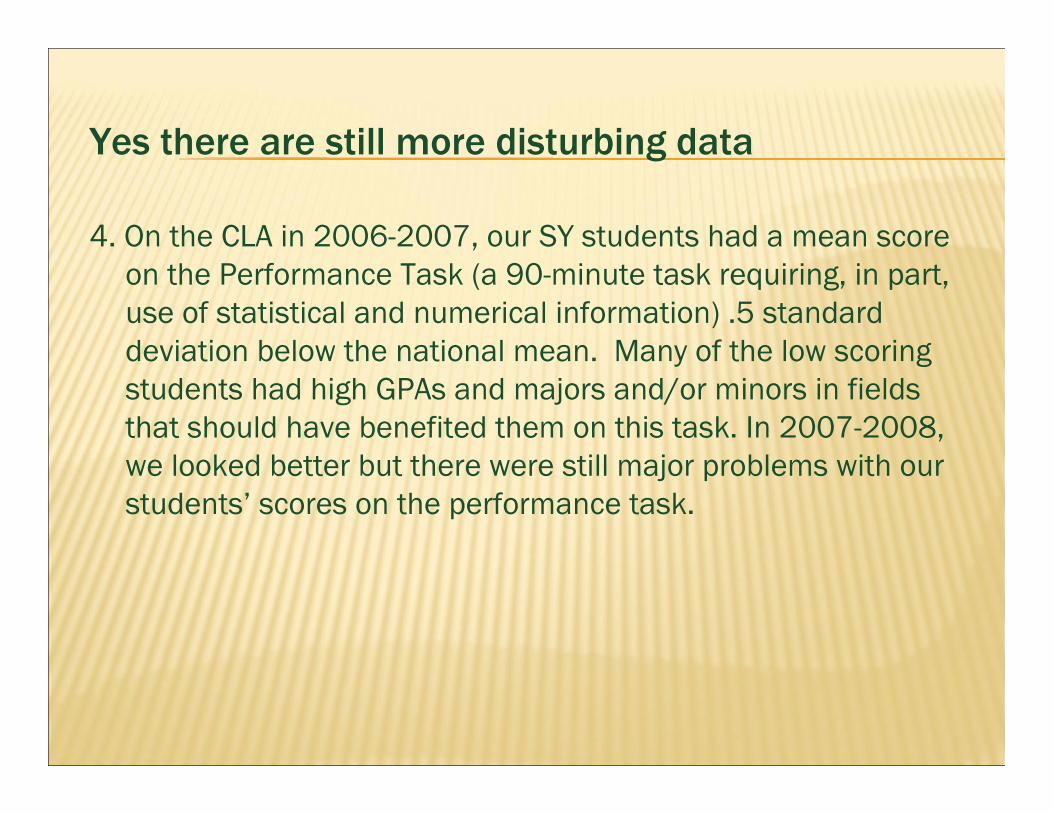
4. On the CLA in 2006-2007, our SY students had a mean score on the Performance Task (a 90-minute task requiring, in part, use of statistical and numerical information) .5 standard deviation below the national mean. Many of the low scoring students had high GPAs and majors and/or minors in fields that should have benefited them on this task. In 2007-2008, we looked better but there were still major problems with our students’ scores on the performance task.
More re: the CLA
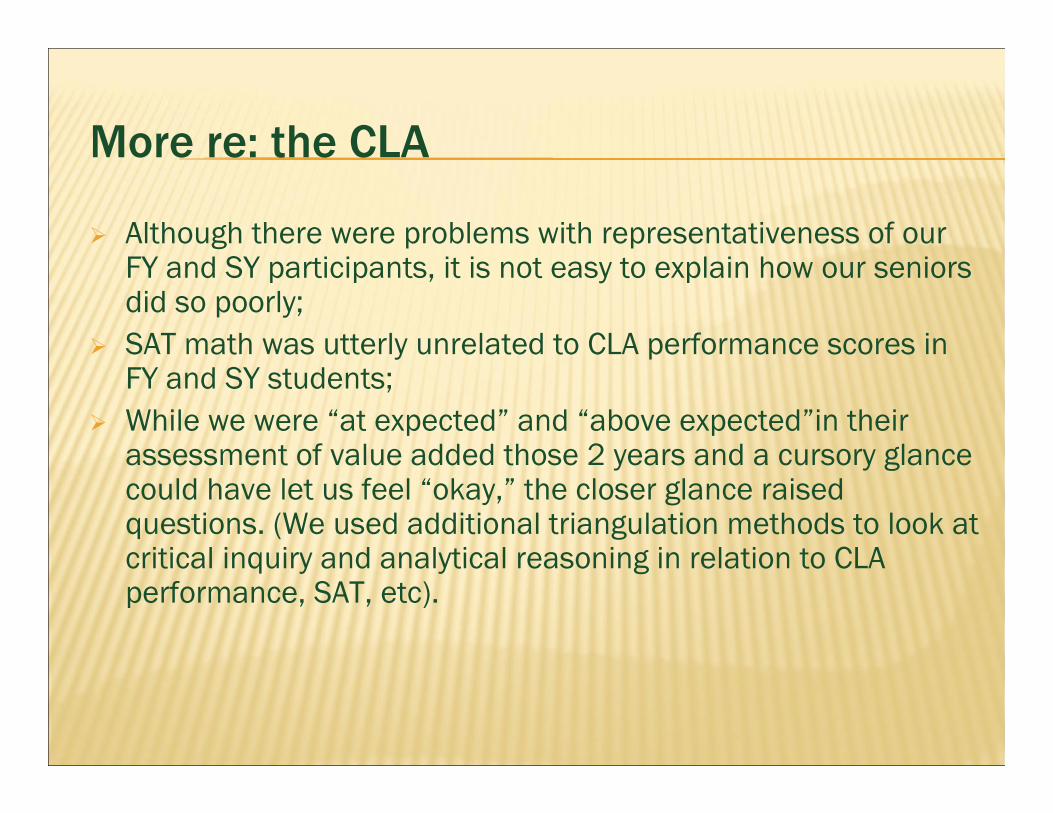
Although there were problems with representativeness of our FY and SY participants, it is not easy to explain how our seniors did so poorly;
SAT math was utterly unrelated to CLA performance scores in FY and SY students;
While we were “at expected” and “above expected”in their assessment of value added those 2 years and a cursory glance could have let us feel “okay,” the closer glance raised questions. (We used additional triangulation methods to look at critical inquiry and analytical reasoning in relation to CLA performance, SAT, etc).
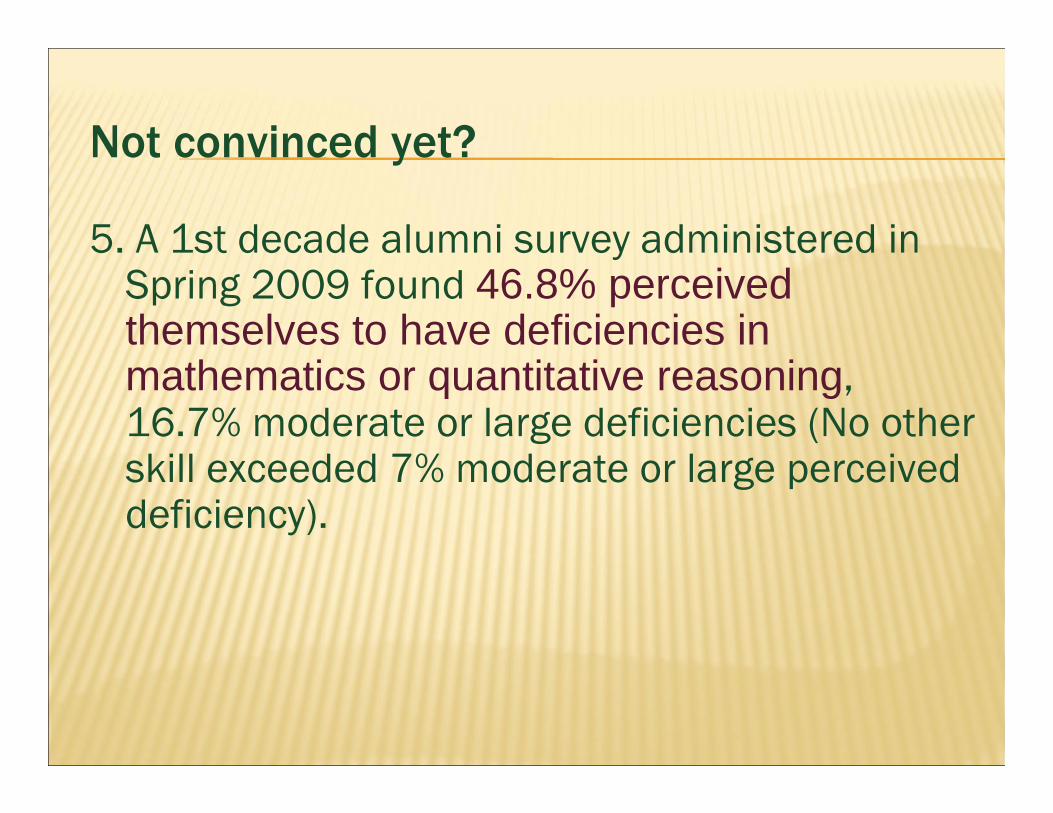
Not convinced yet?
5. A 1st decade alumni survey administered in Spring 2009 found 46.8% perceived themselves to have deficiencies in mathematics or quantitative reasoning, 16.7% moderate or large deficiencies (No other skill exceeded 7% moderate or large perceived deficiency).

What could we do?
6. In October 2006, VPAA Mike Imhoff sent to our Curriculum Committee his assessment of quantitative competency requirement in place since 1995; he reviewed quantitative literacy statements at peer institutions and conducted a transcript of analysis of fifty randomly selected students from the May 2006 class. He recommended new guidelines.
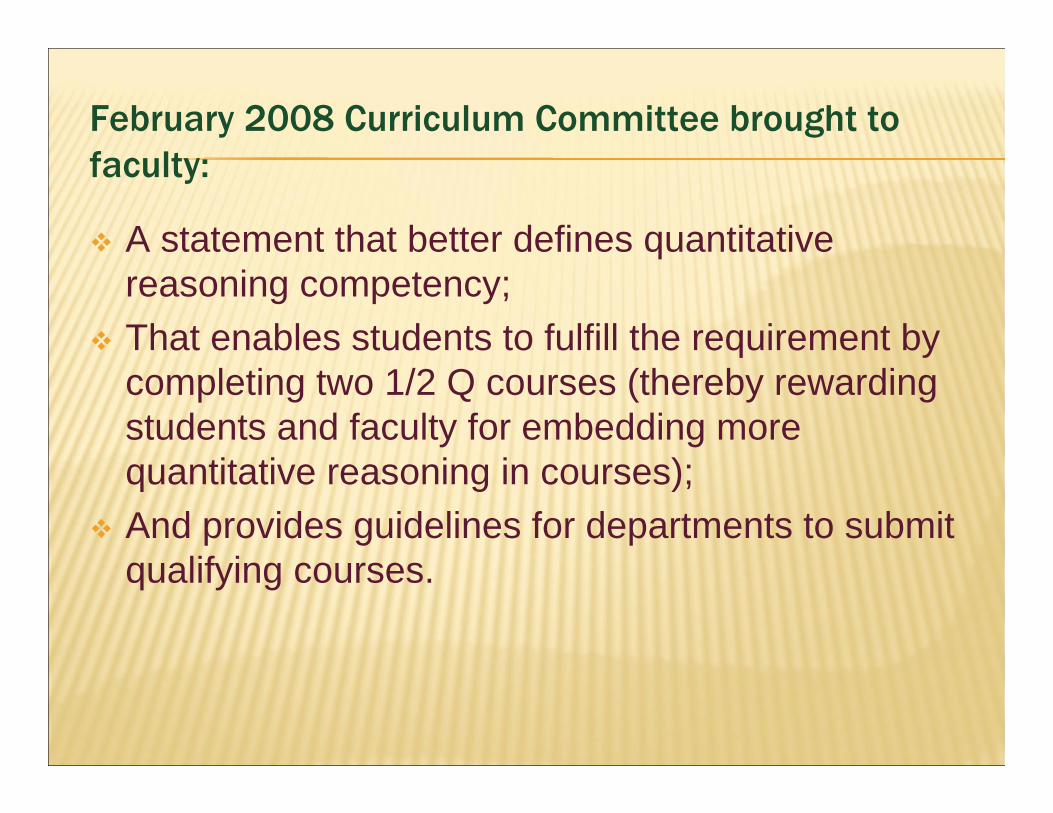
February 2008 Curriculum Committee brought to faculty:
A statement that better defines quantitative reasoning competency;
That enables students to fulfill the requirement by completing two 1/2 Q courses (thereby rewarding students and faculty for embedding more quantitative reasoning in courses);
And provides guidelines for departments to submit qualifying courses.
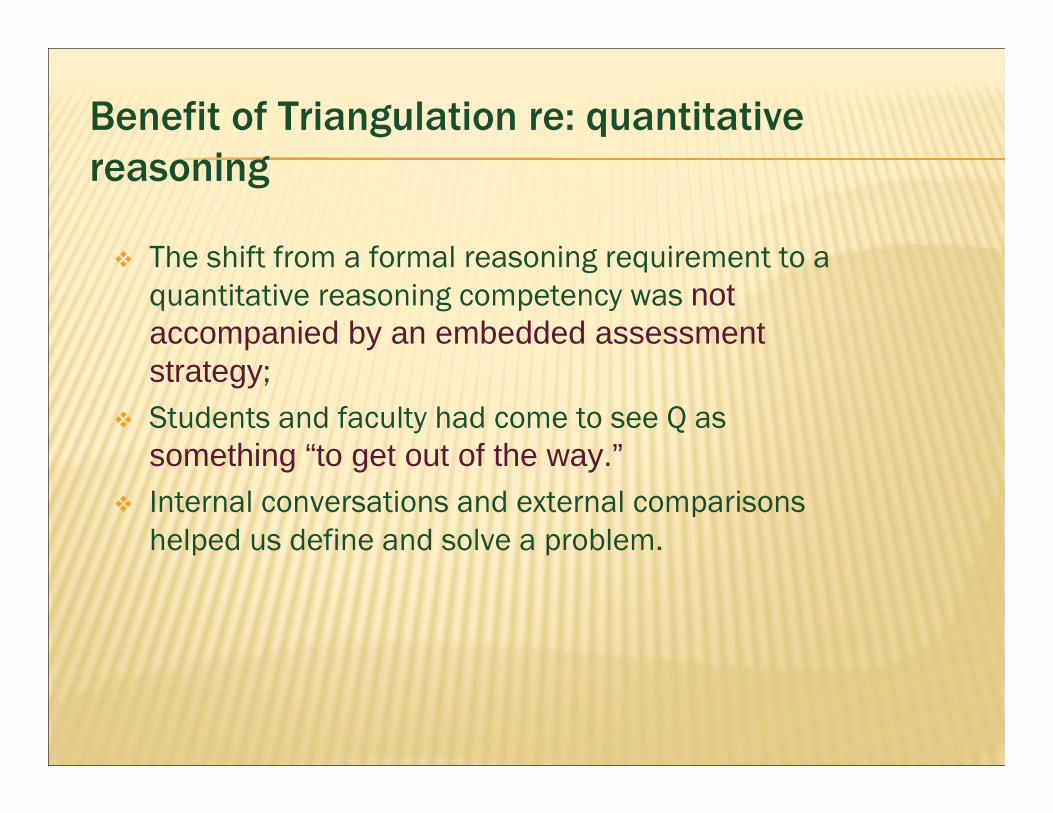
Benefit of Triangulation re: quantitative reasoning
The shift from a formal reasoning requirement to a quantitative reasoning competency was not accompanied by an embedded assessment strategy;
Students and faculty had come to see Q as something “to get out of the way.”
Internal conversations and external comparisons helped us define and solve a problem.
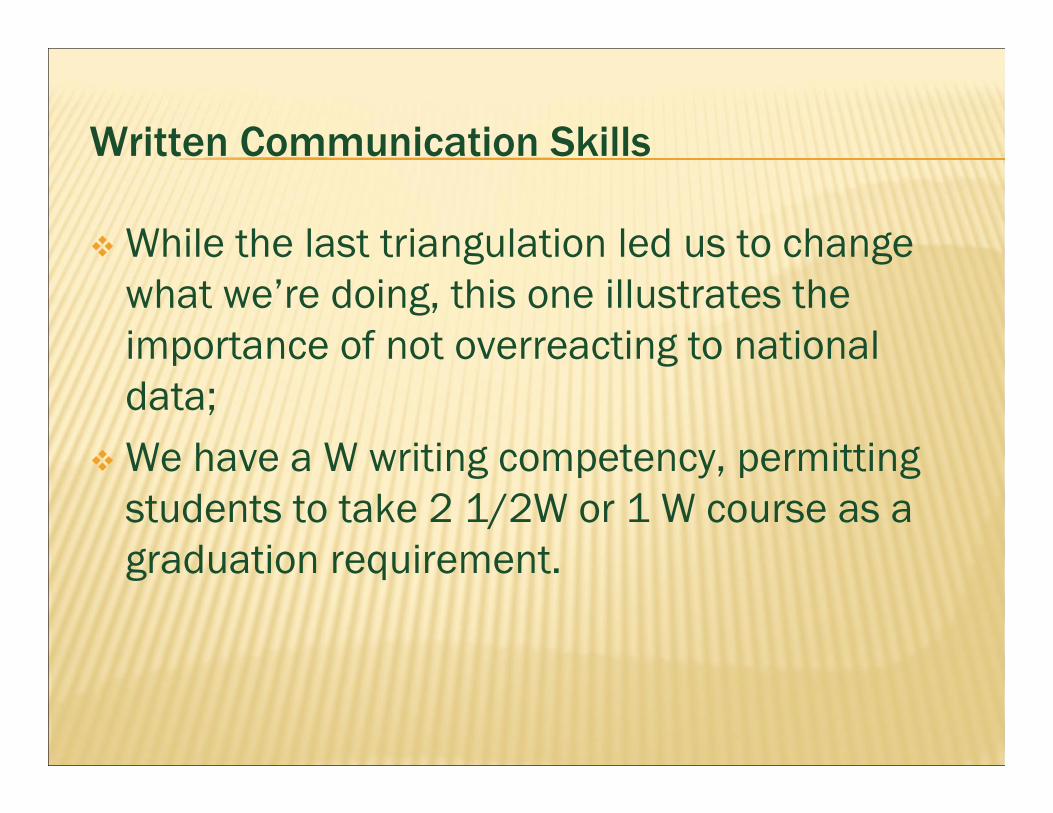
Written Communication Skills
While the last triangulation led us to change what we’re doing, this one illustrates the importance of not overreacting to national data;
We have a W writing competency, permitting students to take 2 1/2W or 1 W course as a graduation requirement.
NSSE data
Self-assessment of writing skills and reported reading for class and pleasure -- seniors think they’re fine (we assumed reading more = writing better);
They also look good in terms of “value added” --between FY and SY, longitudinally, and in relation to peers.
Three specific writing questions on NSSE:
# papers 20 pages or more; # papers 5-19 pages; # papers fewer than 5 pages On intermediate and long papers, our FY and SY
students report fewer than peers, often significantly fewer; on short papers, our students report more than the national sample but no more and often less than our peers.
Level of Academic Challenge (LAC)
1 of the 5 NSSE benchmarks These 3 items are a major component Therefore, on this benchmark, while our SY means in 06 and
09 on LAC are higher than FY and significantly higher than national means, they are not significantly higher than means for peers (while we are on 3 other benchmarks and we do very well on the 4th)
What’s the problem?
These data are inconsistent with our story of who we are -- our mission, our strategic plan, our programs;
76.4% of our seniors on the CSS see writing their skills as above average or in the top 10%;
On the CLA, we were “at expected” in 2006-2007, “above expected” in 2007-2008 and we do very well on the analytical writing part of the CLA.
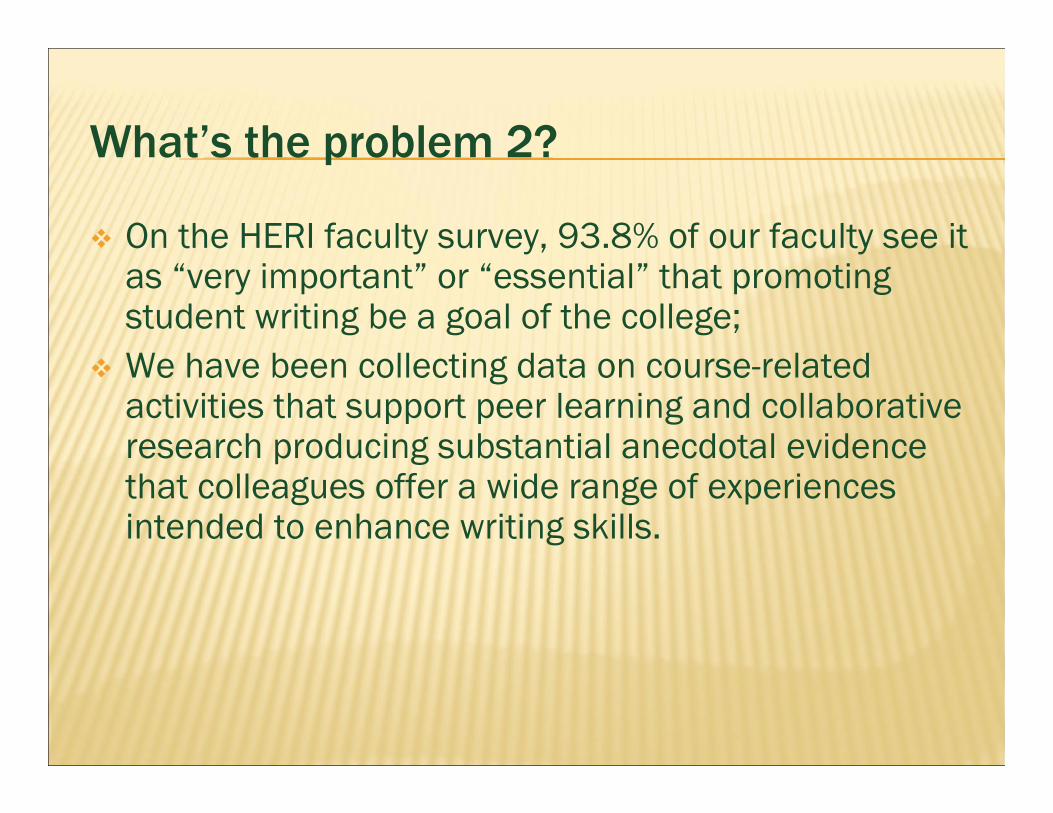
What’s the problem 2?
On the HERI faculty survey, 93.8% of our faculty see it as “very important” or “essential” that promoting student writing be a goal of the college;
We have been collecting data on course-related activities that support peer learning and collaborative research producing substantial anecdotal evidence that colleagues offer a wide range of experiences intended to enhance writing skills.
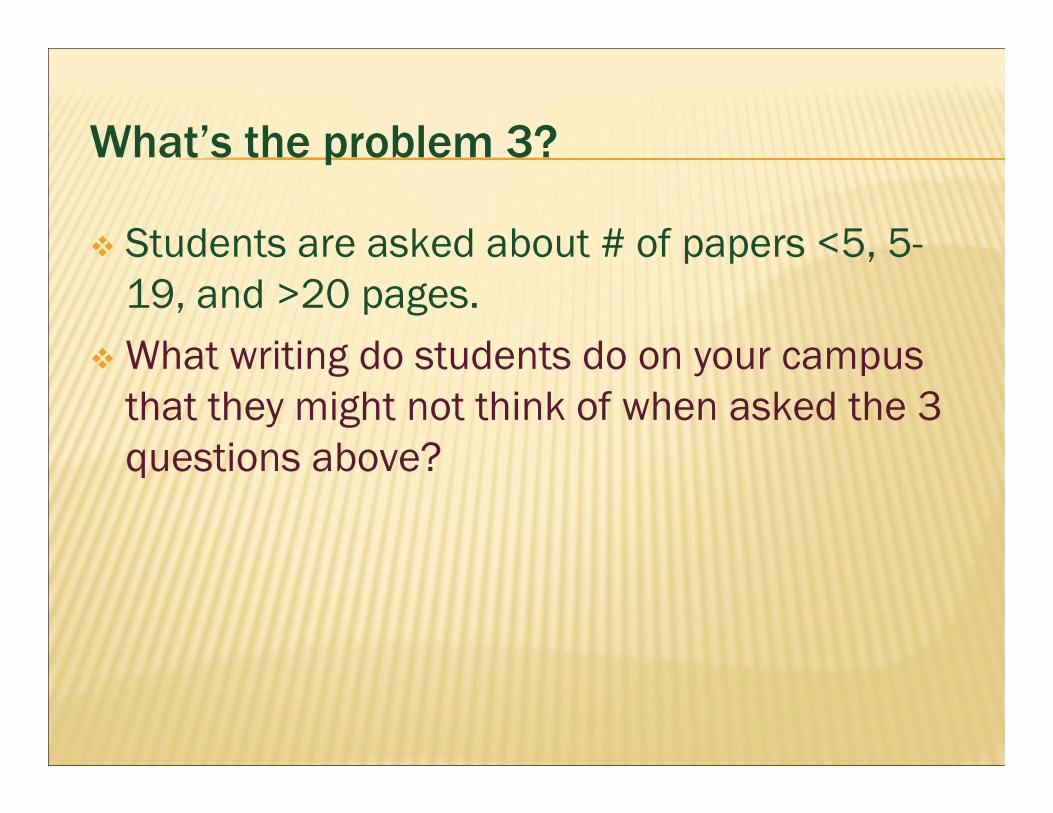
What’s the problem 3?
Students are asked about # of papers <5, 5-19, and >20 pages.
What writing do students do on your campus that they might not think of when asked the 3 questions above?
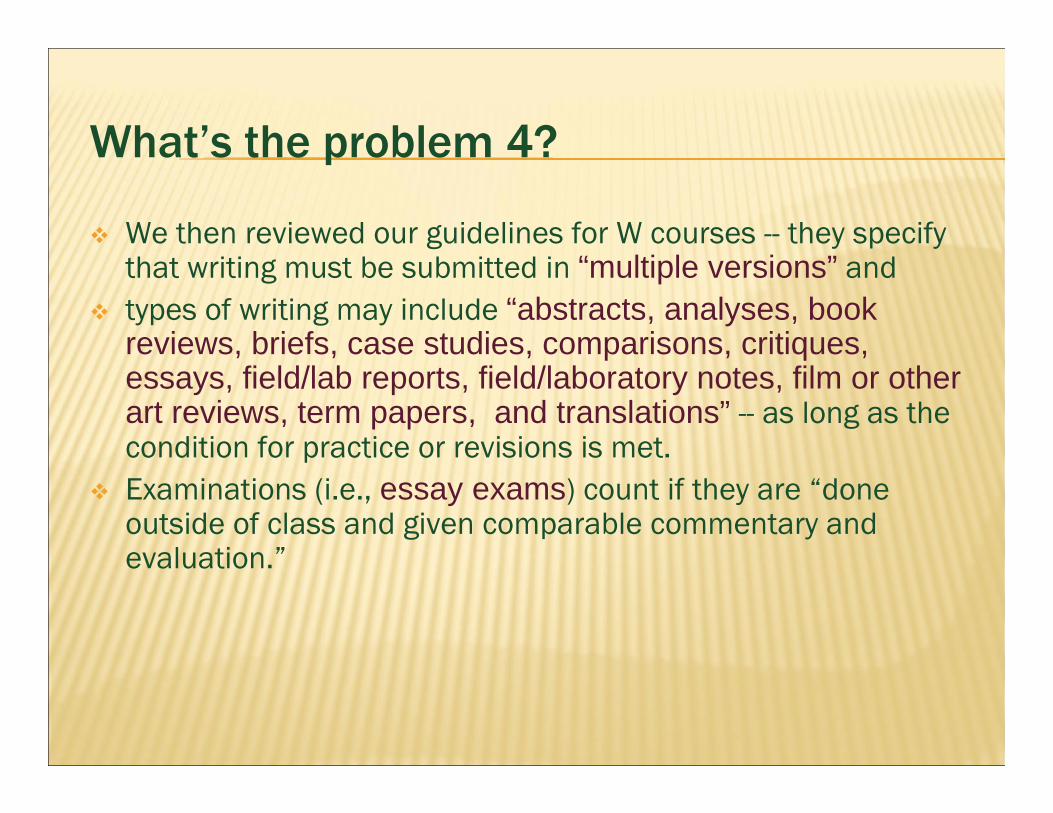
What’s the problem 4?
We then reviewed our guidelines for W courses -- they specify that writing must be submitted in “multiple versions” and
types of writing may include “abstracts, analyses, book reviews, briefs, case studies, comparisons, critiques, essays, field/lab reports, field/laboratory notes, film or otherart reviews, term papers, and translations” -- as long as the condition for practice or revisions is met.
Examinations (i.e., essay exams) count if they are “done outside of class and given comparable commentary and evaluation.”
Decision re: Written Communication
So far we have decided that the problem lies in the NSSE not in our students.
Conclusions -- Strengths of triangulation
Assessment is not seen as reductionistic since institutional mission, strategic planning, and our policies are always used to create the focus of the triangle;
Utilization of national assessment instruments capitalizes on their strengths in providing valuable comparative data, while not ignoring their limitations.

Conclusions (cont.)
Assessment becomes a human and humanistic process rather than a process of jumping through hoops and submitting forms;
Assessment produces multiple narratives -- the endless helix -- whereby we track our trajectory as an institution.
Final point
This process -- of taking focused questions, examining available data from multiple sources -- and then presenting the question and the data to our faculty, administration, and board of trustees, has increased significantly the engagement of my colleagues in assessment;
They ask better questions, seek better strategies in their own planning and evaluation, and bring new energy to our assessment efforts.