trihalomethanes formation after chlorination process kovacs melinda haydee1, dumitru ristoiu1,...
TRANSCRIPT
Trihalomethanes formation Trihalomethanes formation after chlorination processafter chlorination process
Kovacs Melinda Haydee1, Dumitru Ristoiu1, Iovanca Haiduc1, Sidonia Vancea2Kovacs Melinda Haydee1, Dumitru Ristoiu1, Iovanca Haiduc1, Sidonia Vancea21Babes Bolyai University of Cluj-Napoca, Faculty of Environmental Science, Str. P-ta Stefan cel Mare, 1Babes Bolyai University of Cluj-Napoca, Faculty of Environmental Science, Str. P-ta Stefan cel Mare,
no.4, 400084, Cluj-Napoca, email: [email protected], 400084, Cluj-Napoca, email: [email protected] 2Garda de mediu, Comisariatul judetean Cluj, str. G-ral T. Mosoiu, nr. 49, Cluj-Napoca, Romania.2Garda de mediu, Comisariatul judetean Cluj, str. G-ral T. Mosoiu, nr. 49, Cluj-Napoca, Romania.

ChlorinationChlorination• Chlorine and its
compounds are the most commonly used disinfectants for water treatment in Romania.
Advantages Disadvantages
Provides a strong residual in the distribution system
Formation of disinfection by-products (DBPs) especially trihalomethanes (THMs)
Easily applied, controlled, and monitored
Provides poor Cryptosporidium* and Giardia ** control
Relatively inexpensive
Effective at low concentration
Highly effective against most pathogens
* Cryptosporidium parasite is the cause of gastrointestinal diseases (USEPA, 1997)** Giardia Lamblia is the cause of gastrointestinal illness (e.g. diarrhea, vomiting, cramps) (USEPA, 1997)
Tabel 1: Advantages and disadvantages of chlorine
(Rook, 1976; El-Shafy and Grunwald, 2000; Clark, 1998)
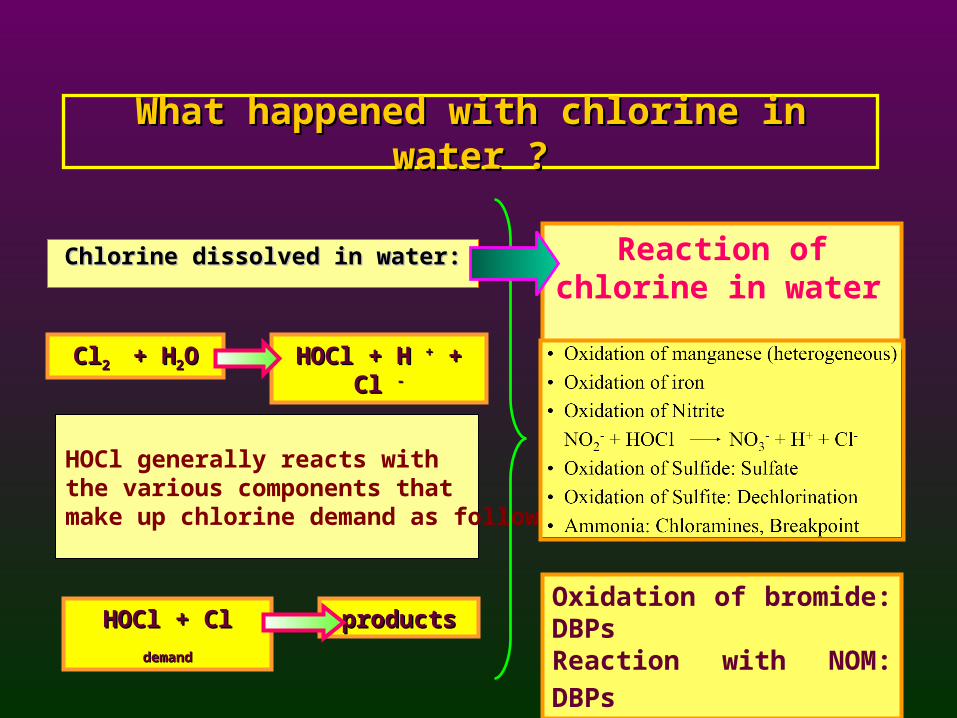
What happened with chlorine in water ?What happened with chlorine in water ?
Chlorine dissolved in water:Chlorine dissolved in water:
ClCl2 2 + H + H22OO HOCl + H HOCl + H ++ + Cl + Cl --
HOCl generally reacts with the various components thatmake up chlorine demand as follows:
HOCl + Cl HOCl + Cl demanddemand productsproducts
Reaction of chlorine in water
Oxidation of bromide: DBPs
Reaction with NOM: DBPs
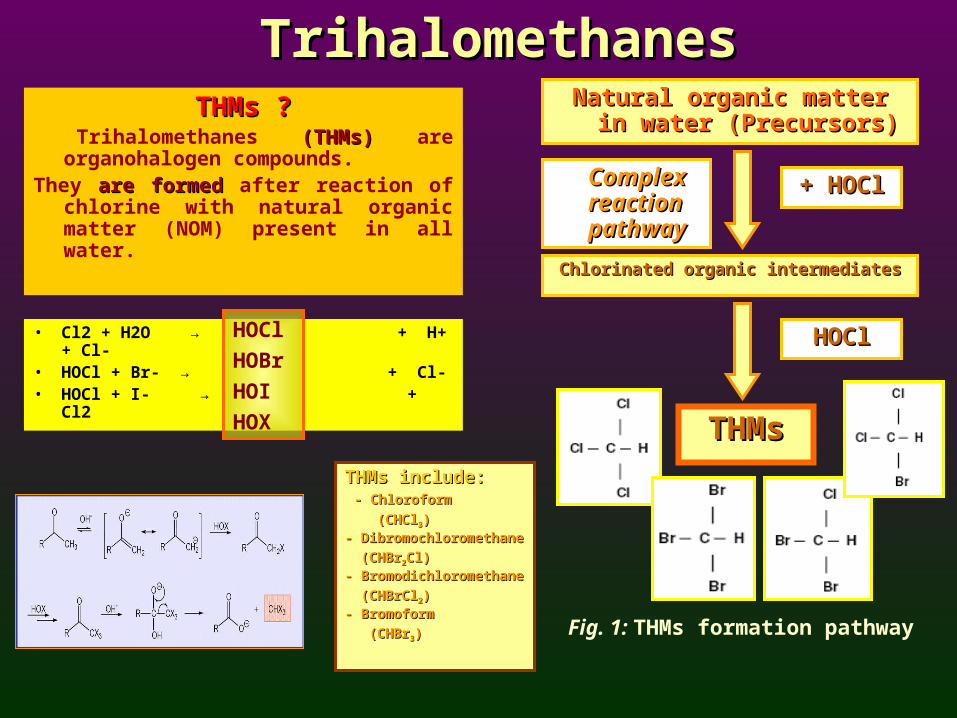
TrihalomethanesTrihalomethanesTHMs ?THMs ?
Trihalomethanes (THMs)(THMs) are organohalogen compounds.
They are formedare formed after reaction of chlorine with natural organic matter (NOM) present in all water.
Natural organic matter in water Natural organic matter in water (Precursors)(Precursors)
Chlorinated organic intermediatesChlorinated organic intermediates
Complex Complex reaction reaction pathwaypathway
+ HOCl+ HOCl
THMsTHMs
HOClHOCl
Fig. 1: THMs formation pathway
• Cl2 + H2O → + H+ + Cl-• HOCl + Br- → + Cl-• HOCl + I- → + Cl2
HOCl
HOBr
HOI
HOX
THMs include:THMs include: - Chloroform - Chloroform
(CHCl(CHCl33))
- Dibromochloromethane- Dibromochloromethane
(CHBr(CHBr22Cl)Cl)
- Bromodichloromethane- Bromodichloromethane
(CHBrCl(CHBrCl22))
- Bromoform- Bromoform
(CHBr(CHBr33))
Possible Health effects of THMs
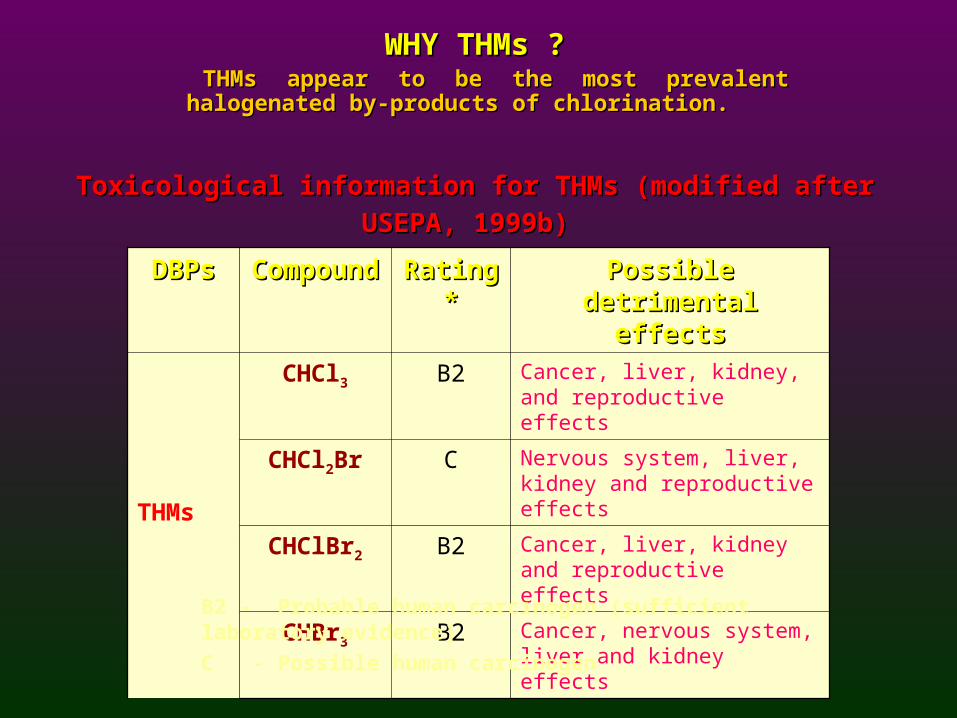
WHY THMs ?WHY THMs ? THMs appear to be the most prevalent halogenated by-THMs appear to be the most prevalent halogenated by-
products of chlorination.products of chlorination.
DBPsDBPs CompoundCompound Rating*Rating* Possible detrimental Possible detrimental effectseffects
THMs
CHCl3 B2 Cancer, liver, kidney, and reproductive effects
CHCl2Br C Nervous system, liver, kidney and reproductive effects
CHClBr2 B2 Cancer, liver, kidney and reproductive effects
CHBr3 B2 Cancer, nervous system, liver and kidney effects
Toxicological information for THMs (modified after USEPA, 1999b)Toxicological information for THMs (modified after USEPA, 1999b)
B2 - Probable human carcinogen (sufficient laboratory evidence)
C - Possible human carcinogen
Compound WHO
(1993)
USEPA
(2001)
Canada
(2001)
Aus-NZ
(2000)
UK
(2000)
Romania
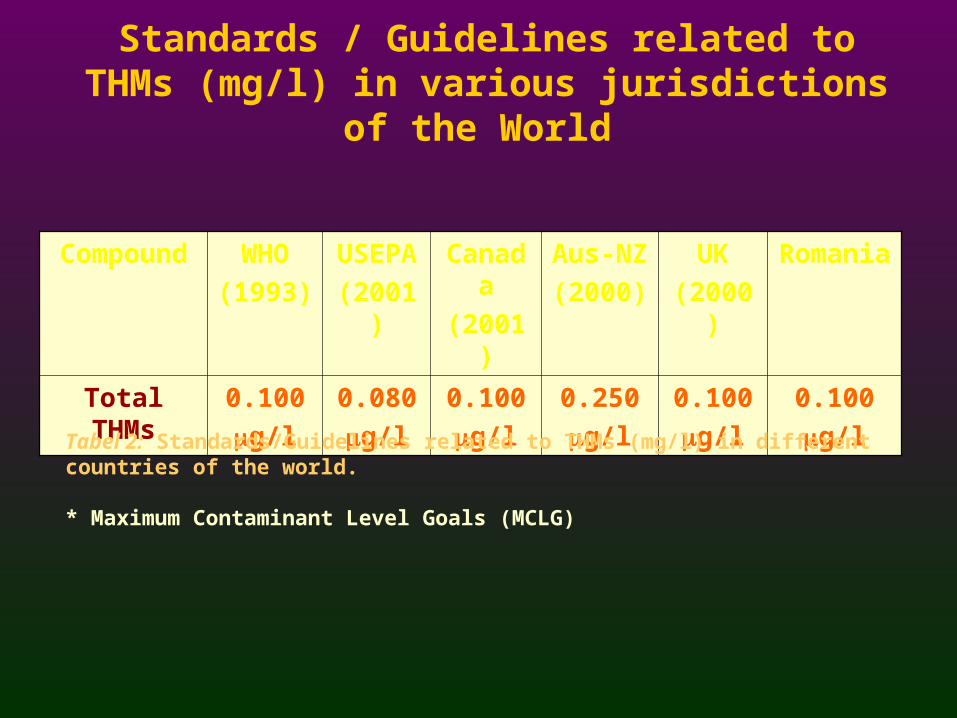
Total THMs 0.100
g/l
0.080
g/l
0.100
g/l
0.250
g/l
0.100
g/l
0.100
g/l
Standards / Guidelines related to THMs (mg/l) in various jurisdictions of the World
Tabel 2: Standards/Guidelines related to THMs (mg/l) in different countries of the world.
* Maximum Contaminant Level Goals (MCLG)

Location of the sampling points
• Location of the sampling points WTP Gilau
• Experiments were carried out with five town from judetul Cluj: Cluj-Napoca, Dej, Beclean, Jibou and Gherla
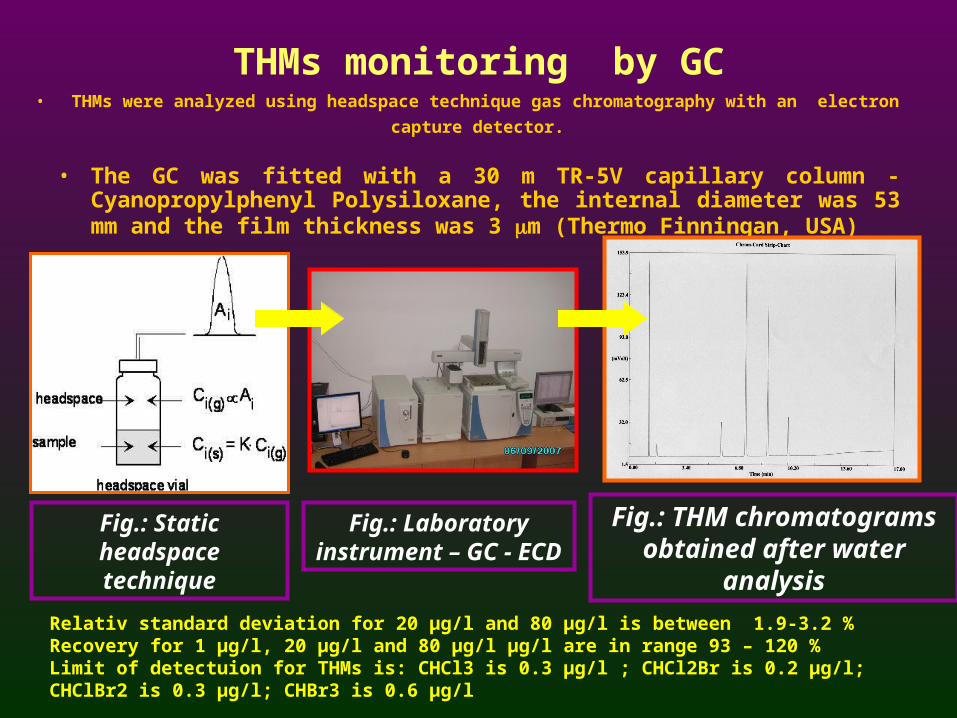
THMs monitoring by GC• THMs were analyzed using headspace technique gas chromatography with an electron capture
detector.
• The GC was fitted with a 30 m TR-5V capillary column - Cyanopropylphenyl Polysiloxane, the internal diameter was 53 mm and the film thickness was 3 m (Thermo Finningan, USA)
Fig.: Static headspace technique
Fig.: Laboratory instrument – GC - ECD
Fig.: THM chromatograms obtained after water analysis
Relativ standard deviation for 20 µg/l and 80 µg/l is between 1.9-3.2 %Recovery for 1 µg/l, 20 µg/l and 80 µg/l µg/l are in range 93 – 120 %Limit of detectuion for THMs is: CHCl3 is 0.3 µg/l ; CHCl2Br is 0.2 µg/l; CHClBr2 is 0.3 µg/l; CHBr3 is 0.6 µg/l
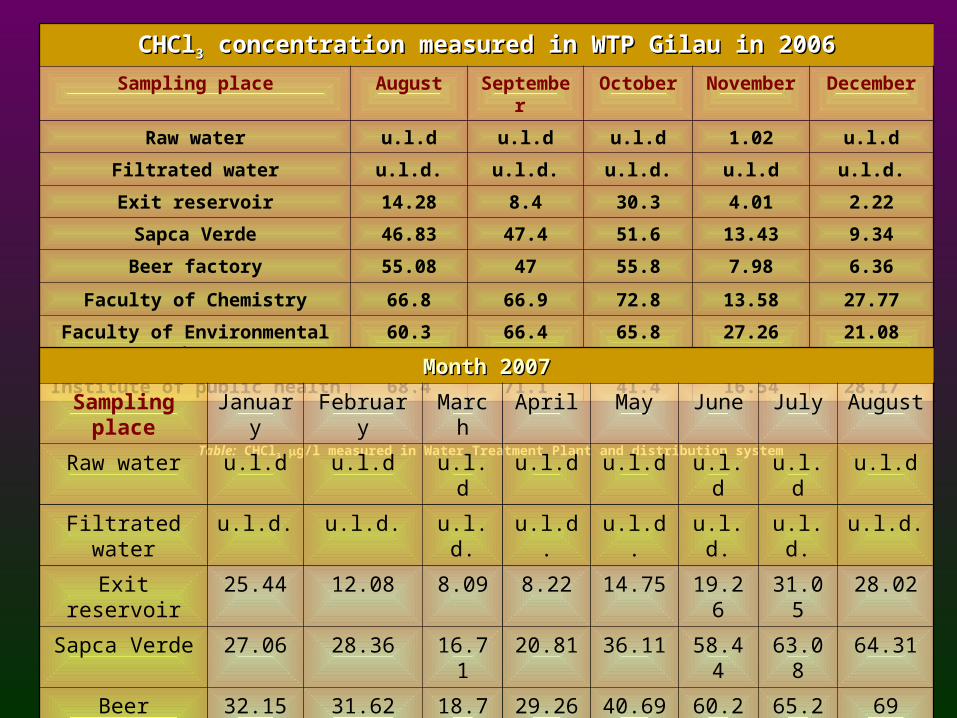
Table: CHCl3 g/l measured in Water Treatment Plant and distribution system
CHClCHCl33 concentration measured in WTP Gilau in 2006 concentration measured in WTP Gilau in 2006
Sampling place August September October November December
Raw water u.l.d u.l.d u.l.d 1.02 u.l.d
Filtrated water u.l.d. u.l.d. u.l.d. u.l.d u.l.d.
Exit reservoir 14.28 8.4 30.3 4.01 2.22
Sapca Verde 46.83 47.4 51.6 13.43 9.34
Beer factory 55.08 47 55.8 7.98 6.36
Faculty of Chemistry 66.8 66.9 72.8 13.58 27.77
Faculty of Environmental Science 60.3 66.4 65.8 27.26 21.08
Institute of public health 68.4 71.1 41.4 16.54 28.17
Month 2007Month 2007
Sampling place January February March April May June July August
Raw water u.l.d u.l.d u.l.d u.l.d u.l.d u.l.d u.l.d u.l.d
Filtrated water u.l.d. u.l.d. u.l.d. u.l.d. u.l.d. u.l.d. u.l.d. u.l.d.
Exit reservoir 25.44 12.08 8.09 8.22 14.75 19.26 31.05 28.02
Sapca Verde 27.06 28.36 16.71 20.81 36.11 58.44 63.08 64.31
Beer factory 32.15 31.62 18.7 29.26 40.69 60.28 65.24 69
Fac.of Chemistry 38.51 48.6 18.99 27.12 43.05 65.31 67.29 78
Fac. of Environ. 35.9 36.73 20.9 32.41 54 64.28 71.33 76.25
Inst. publ health 40.49 48.6 21.6 33.66 50.23 66.35 69.02 81.14
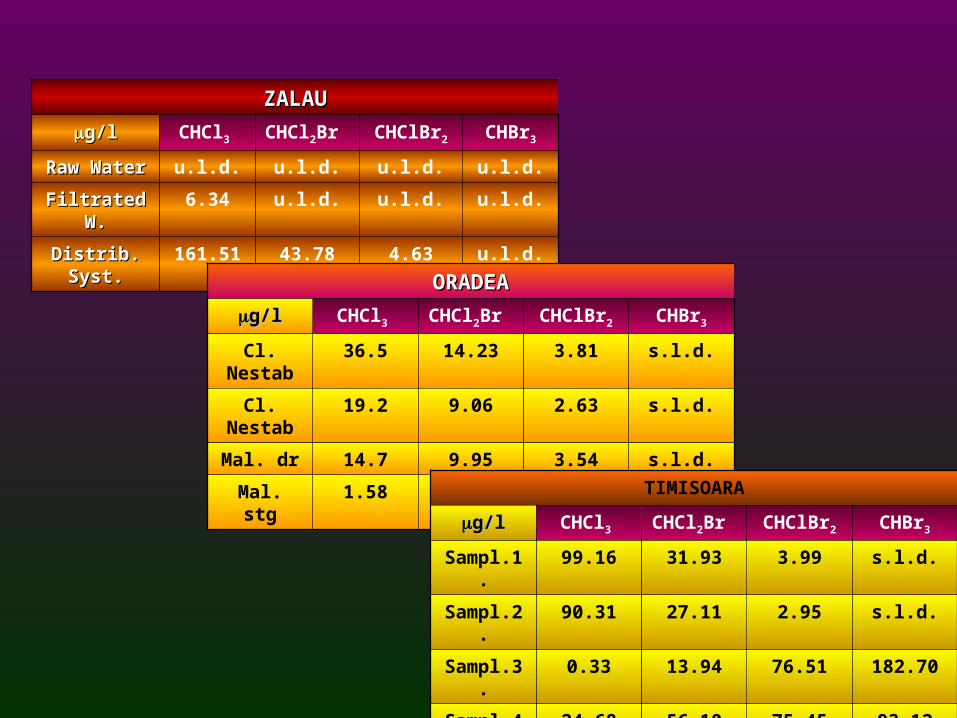
ZALAUZALAU
g/lg/l CHCl3 CHCl2Br CHClBr2 CHBr3
Raw WaterRaw Water u.l.d. u.l.d. u.l.d. u.l.d.
Filtrated W.Filtrated W. 6.34 u.l.d. u.l.d. u.l.d.
Distrib. Syst.Distrib. Syst. 161.51 43.78 4.63 u.l.d.
ORADEAORADEA
g/lg/l CHCl3 CHCl2Br CHClBr2 CHBr3
Cl. Nestab 36.5 14.23 3.81 s.l.d.
Cl. Nestab 19.2 9.06 2.63 s.l.d.
Mal. dr 14.7 9.95 3.54 s.l.d.
Mal. stg 1.58 s.l.d. s.l.d. s.l.d.
TIMISOARA
g/lg/l CHCl3 CHCl2Br CHClBr2 CHBr3
Sampl.1. 99.16 31.93 3.99 s.l.d.
Sampl.2. 90.31 27.11 2.95 s.l.d.
Sampl.3. 0.33 13.94 76.51 182.70
Sampl.4. 24.68 56.10 75.45 93.12
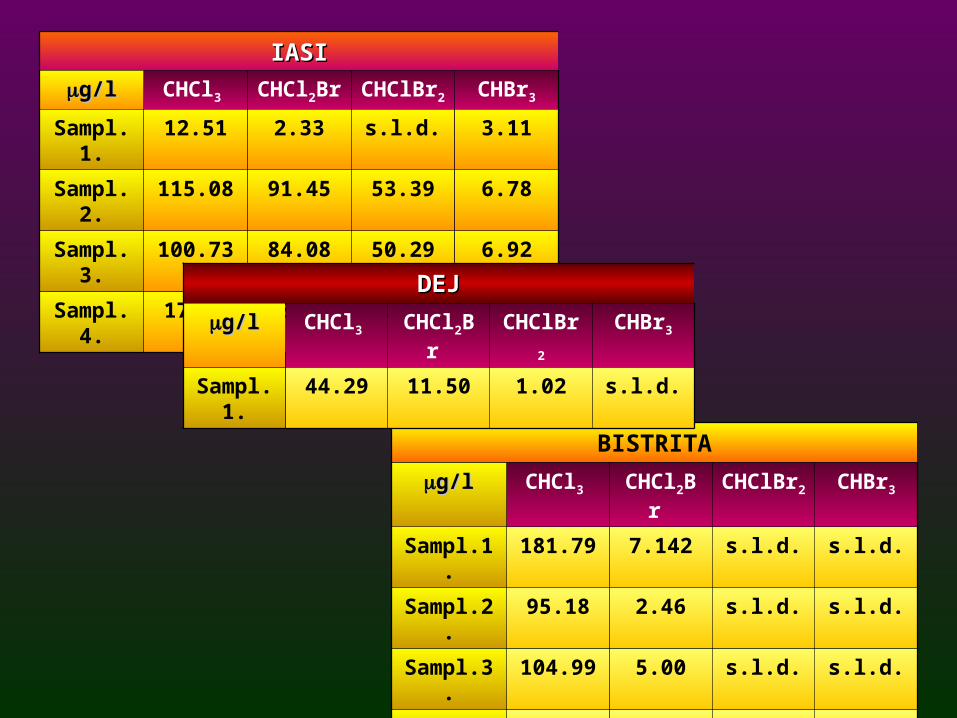
IASIIASI
g/lg/l CHCl3 CHCl2Br CHClBr2 CHBr3
Sampl.1. 12.51 2.33 s.l.d. 3.11
Sampl.2. 115.08 91.45 53.39 6.78
Sampl.3. 100.73 84.08 50.29 6.92
Sampl.4. 17.33 18.50 12.46 2.16
BISTRITA
g/lg/l CHCl3 CHCl2Br CHClBr2 CHBr3
Sampl.1. 181.79 7.142 s.l.d. s.l.d.
Sampl.2. 95.18 2.46 s.l.d. s.l.d.
Sampl.3. 104.99 5.00 s.l.d. s.l.d.
Sampl.4. 9.35 1.75 s.l.d. s.l.d.
Sampl.5. 140.63 5.708 s.l.d. s.l.d.
DEJDEJ
g/lg/l CHCl3 CHCl2Br CHClBr2 CHBr3
Sampl.1. 44.29 11.50 1.02 s.l.d.
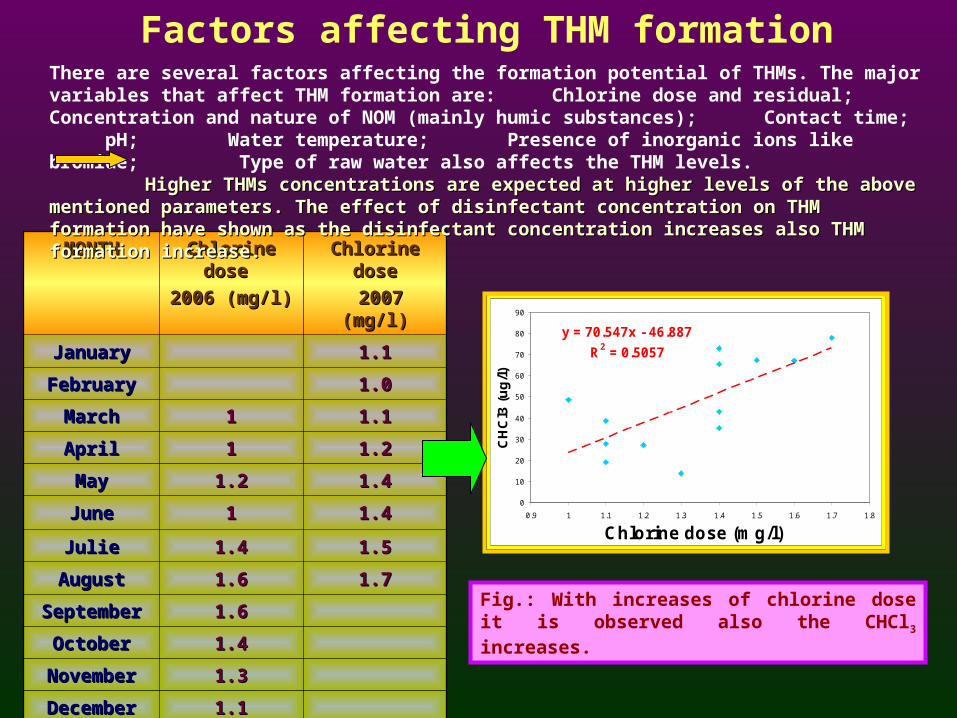
Factors affecting THM formation
MONTHMONTH Chlorine dose Chlorine dose
2006 (mg/l)2006 (mg/l)
Chlorine doseChlorine dose
2007 (mg/l)2007 (mg/l)
JanuaryJanuary 1.11.1
FebruaryFebruary 1.01.0
MarchMarch 11 1.11.1
AprilApril 11 1.21.2
MayMay 1.21.2 1.41.4
JuneJune 11 1.41.4
JulieJulie 1.41.4 1.51.5
AugustAugust 1.61.6 1.71.7
SeptemberSeptember 1.61.6
OctoberOctober 1.41.4
NovemberNovember 1.31.3
DecemberDecember 1.11.1
There are several factors affecting the formation potential of THMs. The major variables that affect THM formation are: Chlorine dose and residual; Concentration and nature of NOM (mainly humic substances); Contact time; pH; Water temperature; Presence of inorganic ions like bromide; Type of raw water also affects the THM levels.
Higher THMs concentrations are expected at higher levels of the above mentioned parameters.Higher THMs concentrations are expected at higher levels of the above mentioned parameters. The effect of disinfectant concentration on THM formation have shown as the disinfectant concentration The effect of disinfectant concentration on THM formation have shown as the disinfectant concentration increases also THM formation increase. increases also THM formation increase.
y = 70.547x - 46.887
R2 = 0.5057
0
10
20
30
40
50
60
70
80
90
0.9 1 1.1 1.2 1.3 1.4 1.5 1.6 1.7 1.8
Chlorine dose (mg/l)
CH
Cl3
(u
g/l
)
Fig.: With increases of chlorine dose it is observed also the CHCl3 increases.
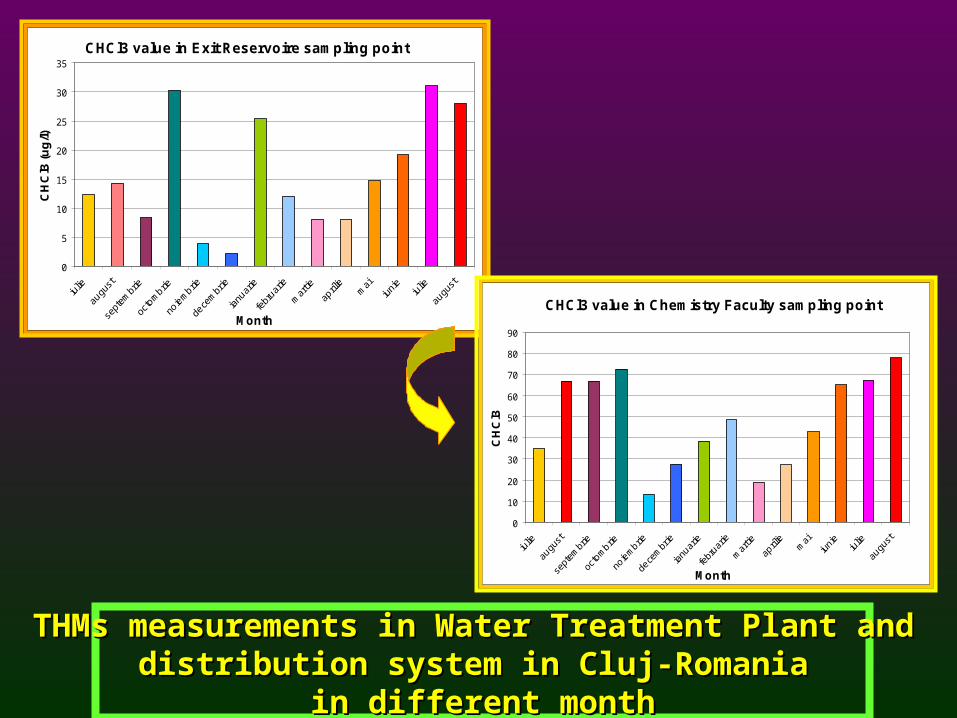
CHCl3 value in Exit Reservoire sampling point
0
5
10
15
20
25
30
35
Month
CH
Cl3
(u
g/l)
CHCl3 value in Chemistry Faculty sampling point
0
10
20
30
40
50
60
70
80
90
Month
CH
Cl3
THMs measurements in Water Treatment Plant and THMs measurements in Water Treatment Plant and distribution system in Cluj-Romania distribution system in Cluj-Romania
in different monthin different month

05
1015
Mar
ch
Apr
il
May
June
July
Aug
ust
Sep
tem
ber
Oct
ober
Nov
embe
r
Dec
embe
r
Janu
ary
Feb
ruar
y
Mar
ch
Apr
il
May
June
July
Aug
ust
2007 2006
Fig.: With increases of filtrated water temperature it is observed also the CHCl3 increases.
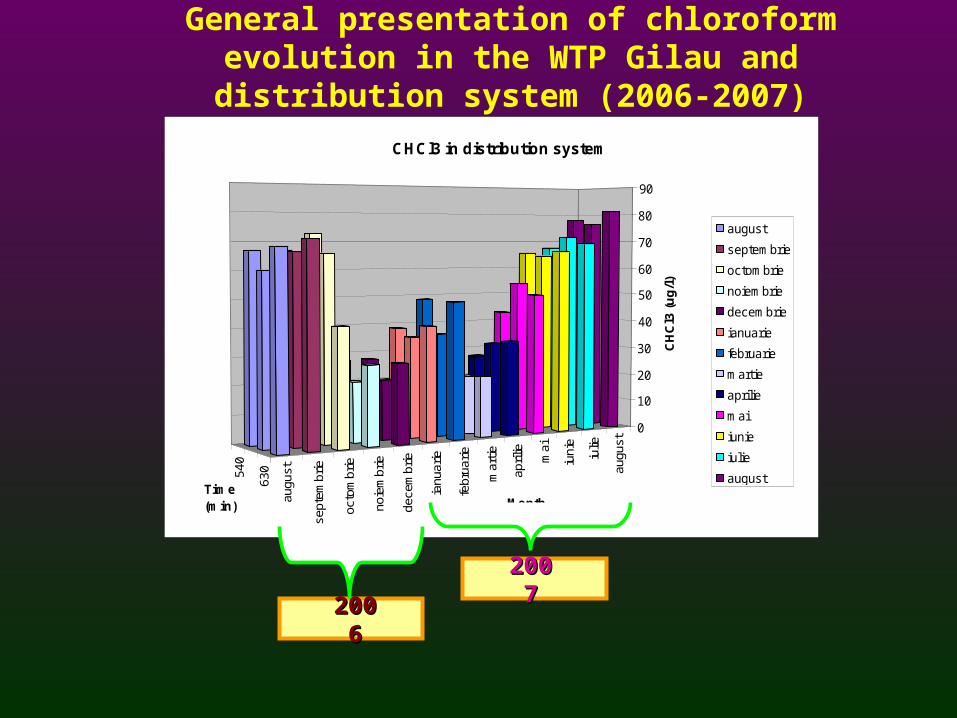
General presentation of chloroform evolution in the WTP Gilau and distribution system (2006-2007)
20062006
20072007
540
630
augu
st
sept
embr
ie
octo
mbr
ie
noie
mbr
ie
dece
mbr
ie
ianu
arie
febr
uarie
mar
tie
april
ie
mai
iuni
e
iulie
augu
st
0
10
20
30
40
50
60
70
80
90
CH
Cl3
(u
g/l
)
Time (min) Month
CHCl3 in distribution system
august
septembrie
octombrie
noiembrie
decembrie
ianuarie
februarie
martie
aprilie
mai
iunie
iulie
august

Chlorine and THM kineticsChlorine and THM kinetics• The experiments were conducted under two conditions: Base line conditionsBase line conditions
(pH 7, 21 C°, 2.5 mg/l Cl2) to gain information about the change of the organic matter in the raw water and Seasonally variable conditionsSeasonally variable conditions to simulate the actual process at the treatment plant.
• Experiments under seasonally variable conditions were carried out with pH and temperature and chlorine dose as measured in the pretreated water on the sampling day.
Chlorine kinetics july 2007 - seasonally variable condition
0.000
0.200
0.400
0.600
0.800
1.000
1.200
1.400
1.600
1.800
0 50 100 150 200 250 300 350 400 450
Time (minutes)
mg
/l
Total chlorine
Free chlorine
Monochloramin
THM kinetics july 2007 - seasonally variable condition
0.00
10.00
20.00
30.00
40.00
50.00
60.00
70.00
0 50 100 150 200 250 300 350 400 450
Time (minutes)
CH
Cl3
(u
g/l)
CHCl3
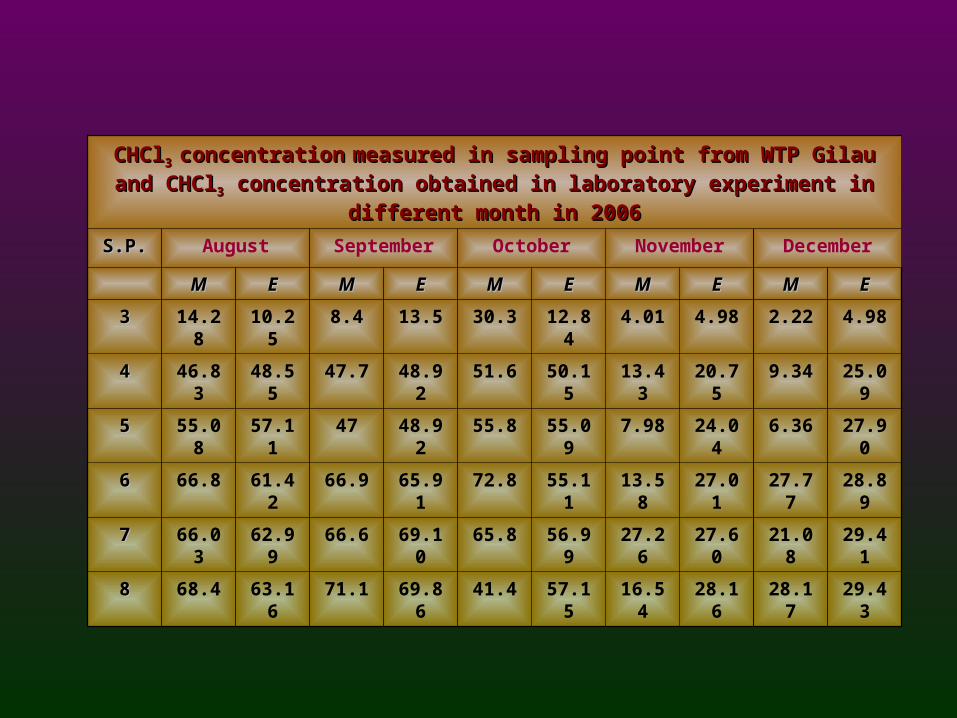
CHClCHCl3 3 concentrationconcentration measured in sampling point from WTP Gilau and CHClmeasured in sampling point from WTP Gilau and CHCl33
concentration obtained in laboratory experiment in different month in 2006concentration obtained in laboratory experiment in different month in 2006
S.P.S.P. August September October November December
MM EE MM EE MM EE MM EE MM EE
33 14.28 10.25 8.4 13.5 30.3 12.84 4.01 4.98 2.22 4.98
44 46.83 48.55 47.7 48.92 51.6 50.15 13.43 20.75 9.34 25.09
55 55.08 57.11 47 48.92 55.8 55.09 7.98 24.04 6.36 27.90
66 66.8 61.42 66.9 65.91 72.8 55.11 13.58 27.01 27.77 28.89
77 66.03 62.99 66.6 69.10 65.8 56.99 27.26 27.60 21.08 29.41
88 68.4 63.16 71.1 69.86 41.4 57.15 16.54 28.16 28.17 29.43
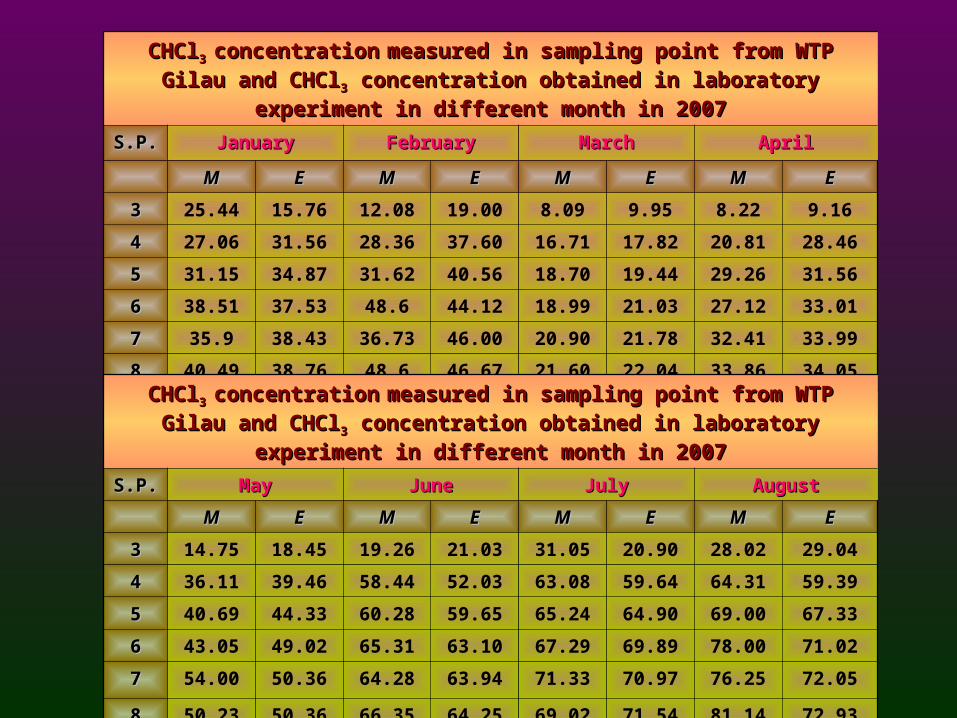
CHClCHCl3 3 concentrationconcentration measured in sampling point from WTP Gilau and CHClmeasured in sampling point from WTP Gilau and CHCl33
concentration obtained in laboratory experiment in different month in 2007concentration obtained in laboratory experiment in different month in 2007
S.P.S.P. JanuaryJanuary FebruaryFebruary MarchMarch AprilApril
MM EE MM EE MM EE MM EE
33 25.44 15.76 12.08 19.00 8.09 9.95 8.22 9.16
44 27.06 31.56 28.36 37.60 16.71 17.82 20.81 28.46
55 31.15 34.87 31.62 40.56 18.70 19.44 29.26 31.56
66 38.51 37.53 48.6 44.12 18.99 21.03 27.12 33.01
77 35.9 38.43 36.73 46.00 20.90 21.78 32.41 33.99
88 40.49 38.76 48.6 46.67 21.60 22.04 33.86 34.05
CHClCHCl3 3 concentrationconcentration measured in sampling point from WTP Gilau and CHClmeasured in sampling point from WTP Gilau and CHCl33
concentration obtained in laboratory experiment in different month in 2007concentration obtained in laboratory experiment in different month in 2007
S.P.S.P. MayMay JuneJune JulyJuly AugustAugust
MM EE MM EE MM EE MM EE
33 14.75 18.45 19.26 21.03 31.05 20.90 28.02 29.04
44 36.11 39.46 58.44 52.03 63.08 59.64 64.31 59.39
55 40.69 44.33 60.28 59.65 65.24 64.90 69.00 67.33
66 43.05 49.02 65.31 63.10 67.29 69.89 78.00 71.02
77 54.00 50.36 64.28 63.94 71.33 70.97 76.25 72.05
88 50.23 50.36 66.35 64.25 69.02 71.54 81.14 72.93
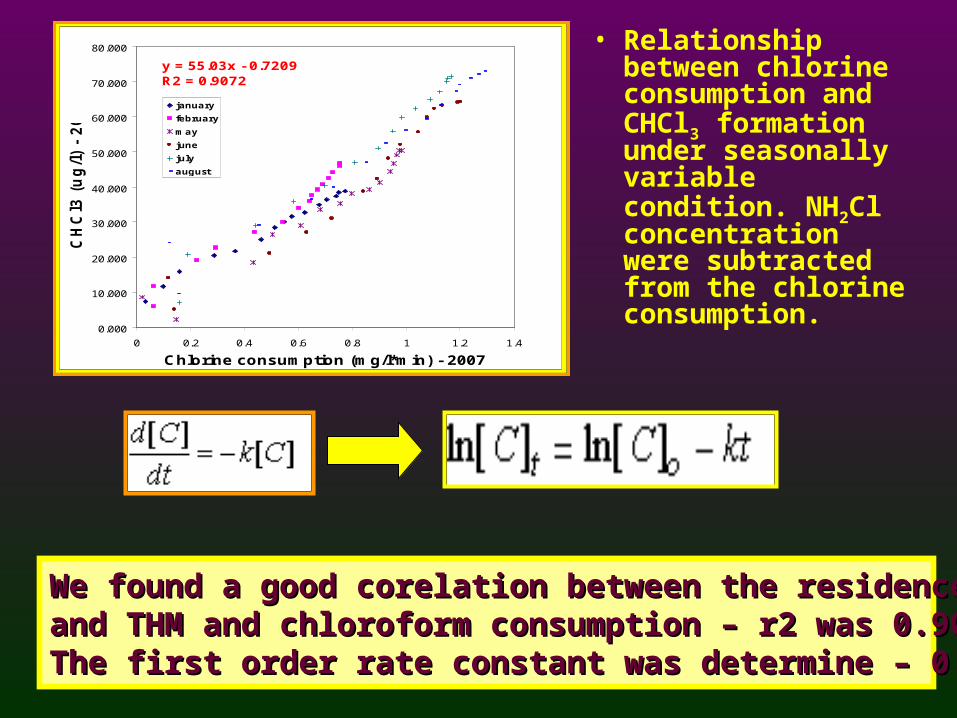
• Relationship between chlorine consumption and CHCl3 formation under seasonally variable condition. NH2Cl concentration were subtracted from the chlorine consumption.
0.000
10.000
20.000
30.000
40.000
50.000
60.000
70.000
80.000
0 0.2 0.4 0.6 0.8 1 1.2 1.4
Chlorine consumption (mg/l*min) - 2007
CH
Cl3
(u
g/l
) -
20
07 january
february
may
june
july
august
y = 55.03x - 0.7209R2 = 0.9072
We found a good corelation between the residence time We found a good corelation between the residence time and THM and chloroform consumption – r2 was 0.9072and THM and chloroform consumption – r2 was 0.9072The first order rate constant was determine – 0.024 - 0.066 M-1s-1The first order rate constant was determine – 0.024 - 0.066 M-1s-1
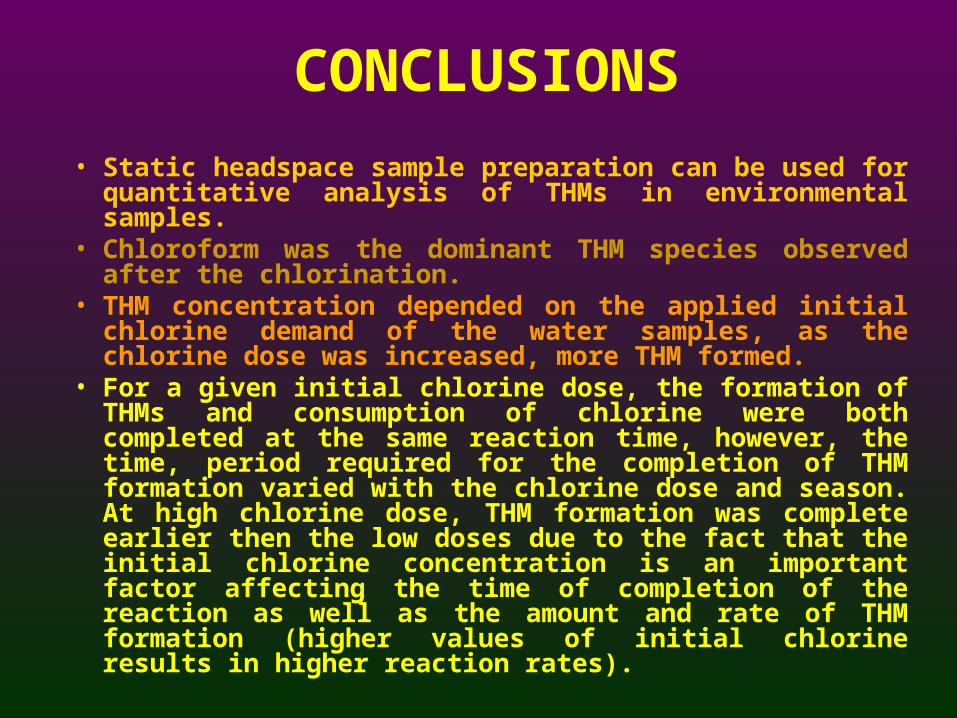
CONCLUSIONS
• Static headspace sample preparation can be used for quantitative analysis of THMs in environmental samples.
• Chloroform was the dominant THM species observed after the chlorination.
• THM concentration depended on the applied initial chlorine demand of the water samples, as the chlorine dose was increased, more THM formed.
• For a given initial chlorine dose, the formation of THMs and consumption of chlorine were both completed at the same reaction time, however, the time, period required for the completion of THM formation varied with the chlorine dose and season. At high chlorine dose, THM formation was complete earlier then the low doses due to the fact that the initial chlorine concentration is an important factor affecting the time of completion of the reaction as well as the amount and rate of THM formation (higher values of initial chlorine results in higher reaction rates).
• The THM formation rates in the distribution system of Cluj-Napoca have a high seasonal variability.
• The main parameters causing variances in the THM formation rate were the concentration and composition of the organic substances in the raw water.
• Residual chlorine concentration during the completion of THM formation, the overall yield values (total THM formed/total chlorine consumed during the entire reaction periods) as well as the average yield values (g TTHM formed/mg Chlorine consumed between two reaction times) differ through sampled months that may be attributed to the variations in the nature of organic matter.
• In all months, the formation yields were highest during the first hours of reaction time.

Thank You !!!!!!!!!!