triplet states - triplet fates : phosphorescence and ...triplet states – triplet fates...
TRANSCRIPT

Triplet states - triplet fates : phosphorescence and energytransfer in functional moleculesCitation for published version (APA):Wasserberg, D. (2006). Triplet states - triplet fates : phosphorescence and energy transfer in functionalmolecules. Eindhoven: Technische Universiteit Eindhoven. https://doi.org/10.6100/IR614648
DOI:10.6100/IR614648
Document status and date:Published: 01/01/2006
Document Version:Publisher’s PDF, also known as Version of Record (includes final page, issue and volume numbers)
Please check the document version of this publication:
• A submitted manuscript is the version of the article upon submission and before peer-review. There can beimportant differences between the submitted version and the official published version of record. Peopleinterested in the research are advised to contact the author for the final version of the publication, or visit theDOI to the publisher's website.• The final author version and the galley proof are versions of the publication after peer review.• The final published version features the final layout of the paper including the volume, issue and pagenumbers.Link to publication
General rightsCopyright and moral rights for the publications made accessible in the public portal are retained by the authors and/or other copyright ownersand it is a condition of accessing publications that users recognise and abide by the legal requirements associated with these rights.
• Users may download and print one copy of any publication from the public portal for the purpose of private study or research. • You may not further distribute the material or use it for any profit-making activity or commercial gain • You may freely distribute the URL identifying the publication in the public portal.
If the publication is distributed under the terms of Article 25fa of the Dutch Copyright Act, indicated by the “Taverne” license above, pleasefollow below link for the End User Agreement:www.tue.nl/taverne
Take down policyIf you believe that this document breaches copyright please contact us at:[email protected] details and we will investigate your claim.
Download date: 17. May. 2020

Triplet States – Triplet FatesPhosphorescence and Energy Transfer in
Functional Molecules


Triplet States – Triplet FatesPhosphorescence and Energy Transfer in
Functional Molecules
Proefschrift
ter verkrijging van de graad van doctor aan deTechnische Universiteit Eindhoven, op gezag vande Rector Magnificus, prof.dr.ir. C.J. van Duijn,voor een commissie aangewezen door het Collegevoor Promoties in het openbaar te verdedigenop maandag 13 november 2006 om 16.00 uur
door
Dorothee Wasserberg
geboren te Bendorf am Rhein, Duitsland

Dit proefschrift is goedgekeurd door de promotor:
prof.dr.ir. R.A.J. Janssen
Copromotor:dr. S.C.J. Meskers
The research projects described in this thesis have been financially supported bythe Council for Chemical sciences of the Netherlands Organization for Scientific Re-search (NWO-CW).
Print Shop: Universiteitsdrukkerij, Technische Universiteit EindhovenCover Design: Jorrit van Rijt, www.oranjevormgevers.nl
A catalogue record is available from theLibrary Eindhoven University of Technology
ISBN-10: 90-386-2978-8
ISBN-13: 978-90-386-2978-0


Table of Contents
1 Preface . . . . . . . . . . . . . . . . . . . . . . . . . . . . . . . . . 11.1 Introduction. . . . . . . . . . . . . . . . . . . . . . . . . . . . . . . 11.2 States and Photophysics of Molecular Materials. . . . . . . . . . . . 21.3 Triplet States and Spin-Orbit Coupling . . . . . . . . . . . . . . . . . 51.4 Methods for the Characterization of Triplet States . . . . . . . . . . . 8
1.4.1 Phosphorescence . . . . . . . . . . . . . . . . . . . . . . . . . . . 81.4.2 Photoinduced Absorption . . . . . . . . . . . . . . . . . . . . . . . 91.4.3 Quenching . . . . . . . . . . . . . . . . . . . . . . . . . . . . . . . 91.4.4 Triplet-Triplet Annihilation and Delayed Fluorescence . . . . . . . . . 10
1.5 Triplet States in 5-Conjugated Oligomers and Polymers . . . . . . . 111.5.1 Extrapolation to the T1 Energy of 5-Conjugated Polymers . . . . . . 111.5.2 Determination of the T1 Energy of 5-Conjugated Polymers . . . . . . 121.5.3 Exchange Energy of 5-Conjugated Materials . . . . . . . . . . . . . 121.5.4 Delayed Fluorescence in 5-Conjugated Polymers. . . . . . . . . . . 131.5.5 Exciton Formation in OLEDs . . . . . . . . . . . . . . . . . . . . . . 13
1.6 Triplet Emitters in OLEDs . . . . . . . . . . . . . . . . . . . . . . . 141.7 Aim and Scope . . . . . . . . . . . . . . . . . . . . . . . . . . . . . 16
2 Triplet States of Oligothiophenes. . . . . . . . . . . . . . . . . . . . 192.1 Introduction. . . . . . . . . . . . . . . . . . . . . . . . . . . . . . . 202.2 Results and Discussions . . . . . . . . . . . . . . . . . . . . . . . . 21
2.2.1 Photophysical Properties of 3T . . . . . . . . . . . . . . . . . . . . 212.2.2 Photophysical Properties of BP-nEDOTs . . . . . . . . . . . . . . . 222.2.3 Length and Functionalization Dependence of S1 and T1 . . . . . . . 242.2.4 Selective Excitation of 3T . . . . . . . . . . . . . . . . . . . . . . . 26
VII

VIII TABLE OF CONTENTS
2.2.5 Quantum-Chemical Calculations . . . . . . . . . . . . . . . . . . . . 262.2.6 Theoretical versus Experimental T1 State Energies . . . . . . . . . . 282.2.7 Theoretical versus Experimental S1 State Energies . . . . . . . . . . 282.2.8 Geometry Changes upon T1← S0 Transition . . . . . . . . . . . . . 292.2.9 Predicted Saturation of E(S0−T1) . . . . . . . . . . . . . . . . . . . 31
2.3 Conclusion . . . . . . . . . . . . . . . . . . . . . . . . . . . . . . . 31
3 Excited States and Vibrations of EDOT Oligomers . . . . . . . . . . 353.1 Introduction. . . . . . . . . . . . . . . . . . . . . . . . . . . . . . . 363.2 Results and Discussions . . . . . . . . . . . . . . . . . . . . . . . . 37
3.2.1 Absorption and Fluorescence at Room Temperature . . . . . . . . . 373.2.2 Absorption and Fluorescence at Low Temperature . . . . . . . . . . 393.2.3 Phosphorescence at Low Temperature . . . . . . . . . . . . . . . . 423.2.4 Triplet-Triplet Absorption at Low Temperature . . . . . . . . . . . . . 443.2.5 Vibrational Spectroscopy. . . . . . . . . . . . . . . . . . . . . . . . 453.2.6 Theoretical Calculations . . . . . . . . . . . . . . . . . . . . . . . . 483.2.7 Energy and Geometry Relaxation in the Excited State . . . . . . . . 503.2.8 Geometry of the Singlet Excited State . . . . . . . . . . . . . . . . . 53
3.3 Summary and Conclusion . . . . . . . . . . . . . . . . . . . . . . . 54
4 Delayed Fluorescence of ir-P3HT with Sub-Gap Excitation . . . . . . 594.1 Introduction. . . . . . . . . . . . . . . . . . . . . . . . . . . . . . . 60
4.1.1 Background . . . . . . . . . . . . . . . . . . . . . . . . . . . . . . 614.2 Results and Discussions . . . . . . . . . . . . . . . . . . . . . . . . 64
4.2.1 Absorption and Prompt Fluorescence of ir-P3HT . . . . . . . . . . . 644.2.2 Delayed Fluorescence of ir-P3HT . . . . . . . . . . . . . . . . . . . 644.2.3 Fluence Dependence of Delayed Fluorescence . . . . . . . . . . . . 65
4.3 Conclusion . . . . . . . . . . . . . . . . . . . . . . . . . . . . . . . 71
5 Length Dependence of Excited States in Oligofluorenes . . . . . . . 755.1 Introduction. . . . . . . . . . . . . . . . . . . . . . . . . . . . . . . 765.2 Results and Discussions . . . . . . . . . . . . . . . . . . . . . . . . 76
5.2.1 The Ground and First Excited Singlet State . . . . . . . . . . . . . . 765.2.2 Delayed Emission from the Lowest Excited Triplet State . . . . . . . 77
TABLE OF CONTENTS IX
5.2.3 Higher Excited Triplet States . . . . . . . . . . . . . . . . . . . . . . 785.2.4 Length Dependence of Singlet and Triplet Energies . . . . . . . . . . 81
5.3 Summary and Conclusion . . . . . . . . . . . . . . . . . . . . . . . 82
6 Triplet Exciton Diffusion of Phosphors in Polymer Matrices . . . . . . 856.1 Introduction. . . . . . . . . . . . . . . . . . . . . . . . . . . . . . . 866.2 Results and Discussions . . . . . . . . . . . . . . . . . . . . . . . . 88
6.2.1 Quenching of Triplet Emitters in Solution . . . . . . . . . . . . . . . 896.2.2 Quenching of Triplet Emitters in Polymer Matrices. . . . . . . . . . . 92
6.3 Conclusion . . . . . . . . . . . . . . . . . . . . . . . . . . . . . . . 97
7 Phosphorescent Resonant Energy Transfer . . . . . . . . . . . . . . 1017.1 Introduction. . . . . . . . . . . . . . . . . . . . . . . . . . . . . . . 1027.2 Results and Discussions . . . . . . . . . . . . . . . . . . . . . . . . 103
7.2.1 Energy Transfer between two Phosphors in Solution . . . . . . . . . 1037.2.2 Energy Transfer between two Phosphors in Thin Films . . . . . . . . 1087.2.3 Energy Transfer between Phosphor and Dye in Solution . . . . . . . 1127.2.4 Absent Energy Transfer between Phosphor and Dye in Films . . . . . 1137.2.5 Förster Energy Transfer in Thin Films . . . . . . . . . . . . . . . . . 114
7.3 Summary and Conclusion . . . . . . . . . . . . . . . . . . . . . . . 116
Summary . . . . . . . . . . . . . . . . . . . . . . . . . . . . . . . . ISamenvatting. . . . . . . . . . . . . . . . . . . . . . . . . . . . . . VEpilogue . . . . . . . . . . . . . . . . . . . . . . . . . . . . . . . . IXCurriculum Vitae . . . . . . . . . . . . . . . . . . . . . . . . . . . . XIIIList of Publications . . . . . . . . . . . . . . . . . . . . . . . . . . . XVReferences . . . . . . . . . . . . . . . . . . . . . . . . . . . . . . . XVI


Preface
1.1 Introduction
One of the most mesmerizing properties of π -conjugated materials is their ability to par-ticipate in a multitude of opto-electronic processes.1 This feature has made them objectof intense research activities in the scientific community in the course of the last 30 yearsand has now brought them up-close-and-personal to the consumer in commercial products.Various electro-optical devices2,3 have been manufactured that make use of π -conjugatedmaterials, such as molecular organic light-emitting diodes4,5 (OLEDs) and their polymericcounterparts6 (PLEDs), for use in full-color displays, as well as polymer solar cells,7 to con-vert sunlight into electricity, and organic field-effect transistors,8,9 to be used as organicswitches.
The origin of the appealing semi-conducting properties of π -conjugated polymers (Figure1.1) that enable their application in devices is related to the extended nature of the electronicwavefunctions that is created by the alternating single and double bonds of their molecularstructure. This provides the basis for charge transport and gives rise to a range of linear andnonlinear optical properties.
There are many analogies between π -conjugated materials and traditional semi-conduc-tors, such as silicon, but also salient differences. One of the special properties of π -conjuga-ted materials is the fact that upon photoexcitation or electrical excitation a triplet excitedstate, i.e. a state with a net magnetic moment, can be formed that is significantly lower
n
S n
n n
n
PA PPP PPV PT PF
Figure 1.1 Structures of archetype π-conjugated polymers: polyacetylene (PA), poly-p-phenylene (PPP), poly(p-phenylene vinylene) (PPV), polythiophene (PT), and polyflu-orene (PF).
1

2 1.2 States and Photophysics of Molecular Materials
in energy, up to 1 eV or more, than the corresponding singlet excited state, which has nomagnetic moment. This does not occur in silicon. These low-energy triplet states play acrucial role in many organic and polymeric semi-conductor devices, such as light-emittingdiodes and solar cells. This thesis aims to deepen the insight into triplet excited statesand describes investigations on well-defined π -conjugated oligomers, polymers, as well asorganometallic complexes blended into polymer matrices. Research into the properties andbehavior of triplet states will provide knowledge on the functioning of opto-electronic devicesand possible ways to improve their performance.
This chapter provides an introduction to the thesis and starts with a brief overview ofthe photophysics of π -conjugated molecules and a description of their excited states. Astriplet states are of specific interest, they will be discussed on a more fundamental leveland methods for the characterization of triplet states will be introduced. The second partof this chapter provides a short outline of the existing literature on triplet state properties inπ -conjugated oligomers and polymers and their role in OLEDs.
1.2 States and Photophysics of Molecular Materials10–12
Molecules can exist in various electronic states having different energies. Transitions be-tween these states may occur. Such processes are often initiated by absorption or emissionof a photon. The investigation of the ensemble of radiative and non-radiative transitions thatsuch molecules can undergo under a variety of conditions is subject of the field of photo-physics. Figure 1.2 identifies various states and transitions amongst these states for mole-cules that have an even number of electrons and possess a singlet ground state. The organicπ -conjugated systems discussed in this thesis all have such singlet ground states.
In a singlet state all electron spins are paired and there is no net magnetic moment.The spin degeneracy, or multiplicity, which provides the name of this state, is 1. The singletground state, i.e. the one with the lowest energy, is denoted as S0 (Figure 1.2). The subscriptindicates the relative energetic position compared to other states of the same spin multiplicity.Thus, the next higher state above the ground state within the singlet manifold is S1, then S2
and so forth. Often a singlet state is denoted with the superscript 1, e.g. in 1(ψaψb), anotation used to specify the electronic configuration (i.e. the two orbitals ψa and ψb) that aresingly occupied with anti-parallel spins.
In addition to a singlet state, a molecule with an even number of electrons can also be ina triplet state (or, in fact, any state with odd multiplicity). In a triplet state two electrons are nolonger anti-parallel and this results in a spin multiplicity of 3, as will be shown in detail in thenext section. As a consequence, a triplet state has a net magnetic moment. The lowest stateof the triplet manifold is denoted as T1, higher excited triplet states are denoted T2, T3,. . . Tn.Likewise, the superscript 3, as in 3(ψaψb), is used to specify the electronic configuration of atriplet state involving two orbitals ψa and ψb.
A given triplet state, e.g. T1, will always be lower in energy than its singlet counterpart,

1 Preface 3
S1. This is due to the exchange integral, K , which can be thought of as a quantum-chemicalcorrection to the coulombic electron repulsion integral J . The exchange integral assuresthat two electrons experience a stronger net repulsion when they have anti-parallel spins(S1) than when they have parallel spins (T1). The exchange integral is a direct mathematicalconsequence of a fundamental quantum-mechanical postulate known as the Pauli principle,which states that the total wavefunction including spin must be anti-symmetric with respectto the interchange of any pair of electrons. The energy difference between S1 and T1 equals2K .
A molecule can be excited by absorption of a photon (hν). Following this event a plethoraof photophysical processes can transform the molecule from one state to another before iteventually returns to its ground state, as long as it has not engaged in any chemical reaction.The most basic of photophysical processes of molecules are:
1. S0 + hν −→ S1 singlet-singlet absorption, where a photon is absorbed by amolecule in the ground state elevating it to a higher energylevel, in this case the S1 state.
2. S0 + 2 hν −→ S1 two-photon singlet-singlet absorption where two photons areabsorbed by a molecule in the ground state nearly simultane-ously elevating it to the S1. This process involves a virtual en-ergy level to make the transition possible/allowed.
3. S0 + hν −→ T1 singlet-triplet absorption, where a photon is absorbed that doesnot contain enough energy to excite the molecule to the S1
state, but contains enough energy to excite it to the triplet state.
4. T1 + hν −→ Tn triplet-triplet absorption, a type of excited state absorption(ESA), where a photon is absorbed by a molecule in the T1
excited state elevating it to an even higher triplet state Tn.
5. S1 −→ S0 + hν fluorescence, where a molecule in the excited singlet state de-cays radiatively, i.e. under emission of a photon.
6. T1 −→ S0 + hν phosphorescence, where a molecule in the excited triplet stateemits a photon and returns to the singlet ground state.
7. S1 −→ S0 + 1
Tn −→ T1 + 1
internal conversion (IC), where a molecule in an excited state,crosses over to another electronic state of the same spin mul-tiplicity. The subsequent non-radiative decay through the step-wise loss of vibrational energy packages (vibrational quanta)ensures that thermal energy (1) is released.
8. S1 −→ T1 + 1
T1 −→ S0 + 1inter-system crossing (ISC), where a molecule in an excitedstate, crosses over to another electronic state with a differentspin multiplicity. The subsequent non-radiative decay throughthe stepwise loss of vibrational quanta ensures that thermalenergy (1) is released.
How, why and under which circumstances do these processes take place? Answeringthis question requires considering Fermi’s golden rule. Fermi’s golden rule states that the
4 1.2 States and Photophysics of Molecular Materials
fluorescence
non-radiative decay
E
S0
S1
T1
direct triplet
excitation
Tn←T1
S1→S0 singlet
absorption T1←S0
S1←S0
ISC
T1→S0 phosphorescence
IC
IC
non-radiative decay non-radiative
decay
ISC
Tn Tn→T1
T1→S0
S1→S0
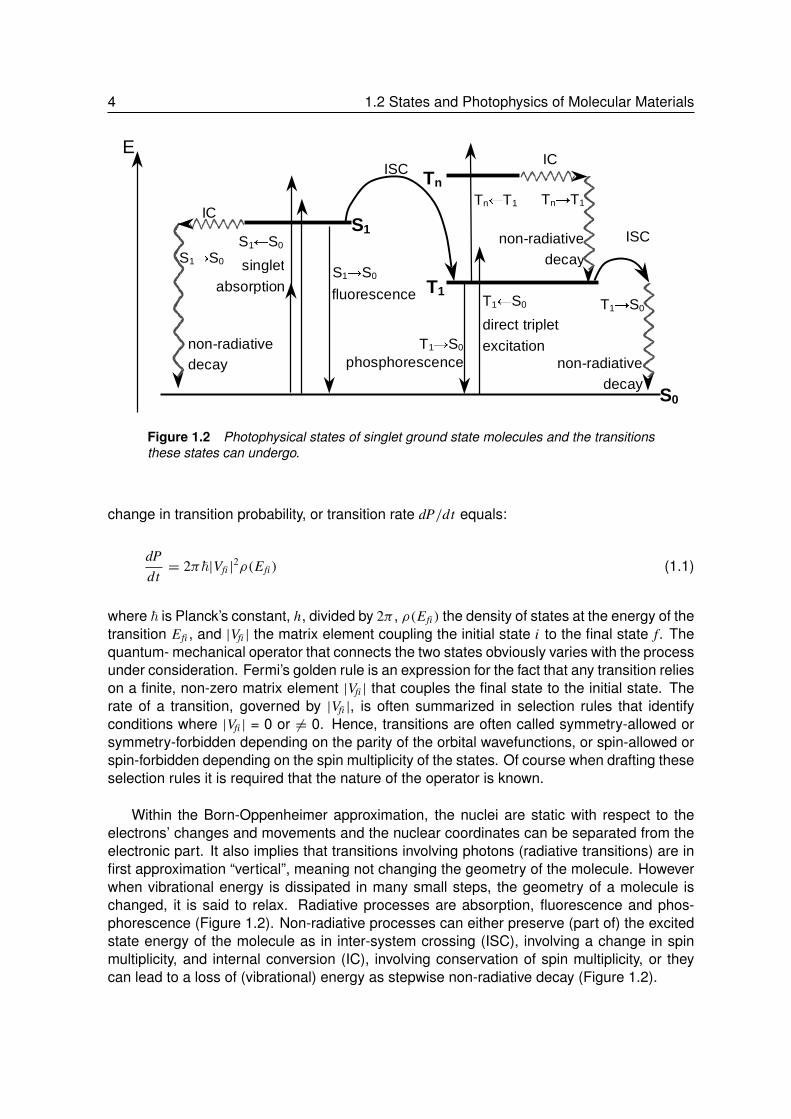
Figure 1.2 Photophysical states of singlet ground state molecules and the transitionsthese states can undergo.
change in transition probability, or transition rate dP/dt equals:
dPdt= 2π~|Vfi |
2ρ(Efi ) (1.1)
where ~ is Planck’s constant, h, divided by 2π , ρ(Efi ) the density of states at the energy of thetransition Efi , and |Vfi | the matrix element coupling the initial state i to the final state f. Thequantum- mechanical operator that connects the two states obviously varies with the processunder consideration. Fermi’s golden rule is an expression for the fact that any transition relieson a finite, non-zero matrix element |Vfi | that couples the final state to the initial state. Therate of a transition, governed by |Vfi |, is often summarized in selection rules that identifyconditions where |Vfi | = 0 or 6= 0. Hence, transitions are often called symmetry-allowed orsymmetry-forbidden depending on the parity of the orbital wavefunctions, or spin-allowed orspin-forbidden depending on the spin multiplicity of the states. Of course when drafting theseselection rules it is required that the nature of the operator is known.
Within the Born-Oppenheimer approximation, the nuclei are static with respect to theelectrons’ changes and movements and the nuclear coordinates can be separated from theelectronic part. It also implies that transitions involving photons (radiative transitions) are infirst approximation “vertical”, meaning not changing the geometry of the molecule. Howeverwhen vibrational energy is dissipated in many small steps, the geometry of a molecule ischanged, it is said to relax. Radiative processes are absorption, fluorescence and phos-phorescence (Figure 1.2). Non-radiative processes can either preserve (part of) the excitedstate energy of the molecule as in inter-system crossing (ISC), involving a change in spinmultiplicity, and internal conversion (IC), involving conservation of spin multiplicity, or theycan lead to a loss of (vibrational) energy as stepwise non-radiative decay (Figure 1.2).

1 Preface 5
For radiative transitions such as absorption or emission, the matrix element |Vfi | is propor-tional to the transition dipole moment µfi = 〈 f |µ|i〉, where µ is the dipole moment operator.At the frequency of the light to induce the electronic transition i → f, the dipole moment oper-ator only affects the electronic part of the wavefunction and, hence, |Vfi | can be representedas the product of the electronic transition dipole moment 〈φf |µ|φi 〉, the overlap integral ofthe vibrational wavefunctions 〈υf |υi 〉, related to the Frank-Condon factor, and the overlap ofthe spin functions 〈σf |σi 〉. For a transition to take place all three parts must have a non-zerovalue. The actual magnitude of these terms then governs the probability of the transition andhence its rate constant, k, and thereby the intensity.
Since the spin functions of states of different multiplicity have zero overlap, dipole tran-sitions between states in the same manifold (spin-allowed transitions) are more probable(more intense and faster) than transitions between different spin manifolds (spin-forbiddentransitions). The subject is more deeply discussed in the next section.
The Frank-Condon factor will influence the transition probability to specific vibrational lev-els. Simultaneous electronic and vibrational excitation can even result in a non-zero intensityfor transitions that are formally symmetry-forbidden.
1.3 Triplet States and Spin-Orbit Coupling10
Triplet states form the subject of this thesis and therefore, it is useful to consider some of thecharacteristics of singlet and triplet states in more detail and see how transitions betweenthese two spin states can occur. The discussion starts by considering that the electron spincan be described with an angular momentum operator. Any angular momentum operator jand its components jx , jy or jz commute according to:
[ jx , jy] = i~ jz
[ jy, jz] = i~ jx
[ jz, jx ] = i~ jy
[ j2, jz] = 0
(1.2)
The eigenstates and eigenvalues of j are determined by two quantum numbers j andm j , so that:
j2| j,m j 〉 = j ( j + 1)~2
| j,m j 〉
jz| j,m j 〉 = m j~| j,m j 〉(1.3)
There are different types of angular momenta present in atoms and molecules. They canbe of the type that need cyclic boundary conditions to be described in the Born interpretation,

6 1.3 Triplet States and Spin-Orbit Coupling
which means that the angular momentum will be described by integral quantum numbers.An example for an angular momentum with integral quantum numbers is the orbital angularmomentum (a standing wave will have to end up on the same ’place’ after one full turnotherwise destructive interference would destroy it). In this case, the quantum numbers willbe denoted l and ml .
Another type of angular momentum can be described by half-integral quantum num-bers, for example the intrinsic angular momentum of a fermion (e.g. an electron). Here thequantum numbers are denoted s and ms . This angular momentum was first suggested byUhlenbeck and Goudsmit13 as an intrinsic property of electrons as that would greatly simplifythe description of the atomic spectra and its existence was later verified by Dirac.
Electrons possess this intrinsic spin quantum number s = 1/2, and can exist in two statesdenoted by ms = +1/2, the α- or up-spin and ms = -1/2, the β- or down-spin. For the case oftwo electrons with s = 1/2, as in a singly excited state (S1 or T1), the composite system has(2s1+1)(2s2+1) states. Using the Clebsch-Gordon triangle condition, it follows that the totalspin, S, can be 1 and 0 and that the total MS can become 0 and ±1 for S = 1 and MS = 0 forS = 0.
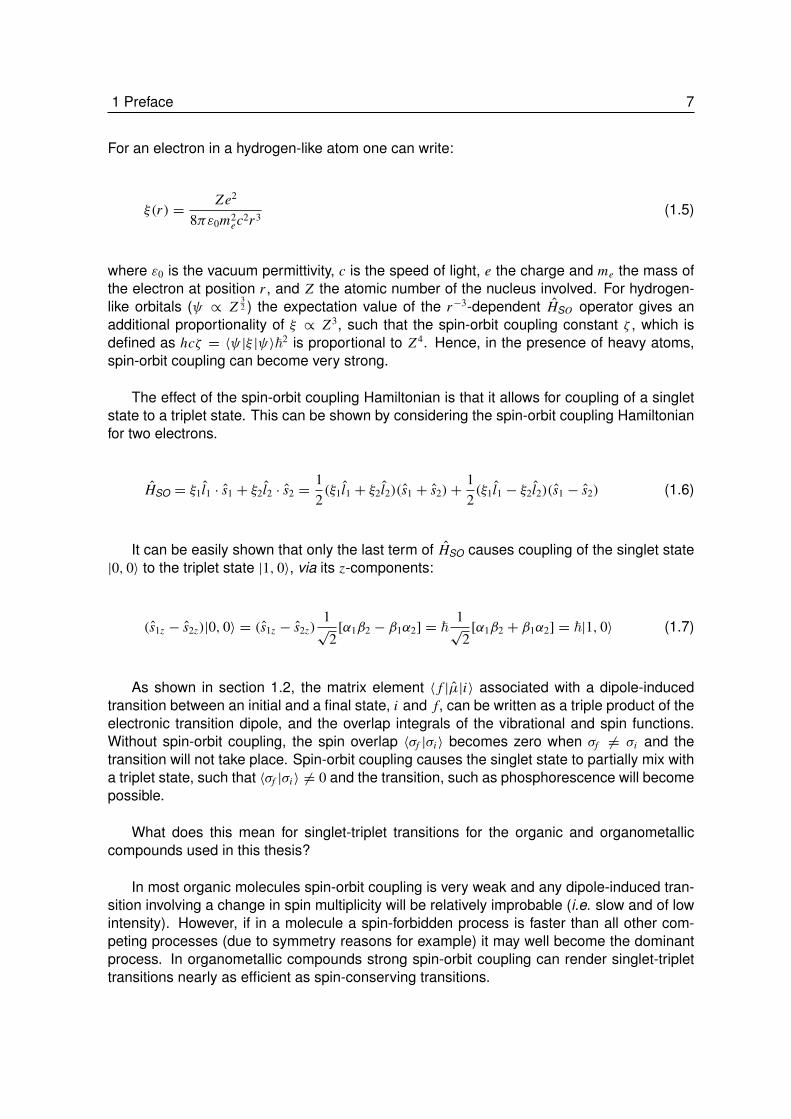
A more pictorial description is the image of “coupled” vectors for the spins, though notentirely correct, it is a rather tangible depiction as long as one keeps in mind that spins arenot a classical phenomenon (Figure 1.3).
The resulting states |S,MS〉 can be described in terms of α- and β-spin:
|0, 0〉 =1√
2α1β2 −
1√
2β1α2
|1,−1〉 = β1β2
|1, 0〉 =1√
2α1β2 +
1√
2β1α2
|1,+1〉 = α1α2
(1.4)
The first of the 4 states is a singlet state with a net spin, S = 0, while the last three statesare triplet states, characterized by a total spin of the system, S = 1. The coupling of twovector-like electron spins is depicted in Figure 1.3.
There are two types of coupling between spin and orbital angular momentum that willbe important here, namely, Russell-Saunders (LS) and jj-coupling. LS-coupling is an ap-propriate description of systems with weak spin-orbit coupling like almost all organic (π -conjugated) molecules. The jj-coupling picture is appropriate to describe e.g. organometalliccompounds. The interaction of the spin angular momentum s and the orbital angular momen-tum l operators can be described with the spin-orbit coupling Hamiltonian, HSO = ξ(r)l · s.
1 Preface 7
For an electron in a hydrogen-like atom one can write:
ξ(r) =Ze2
8πε0m2ec2r3
(1.5)
where ε0 is the vacuum permittivity, c is the speed of light, e the charge and me the mass ofthe electron at position r , and Z the atomic number of the nucleus involved. For hydrogen-like orbitals (ψ ∝ Z
32 ) the expectation value of the r−3-dependent HSO operator gives an
additional proportionality of ξ ∝ Z3, such that the spin-orbit coupling constant ζ , which isdefined as hcζ = 〈ψ |ξ |ψ〉~2 is proportional to Z4. Hence, in the presence of heavy atoms,spin-orbit coupling can become very strong.
The effect of the spin-orbit coupling Hamiltonian is that it allows for coupling of a singletstate to a triplet state. This can be shown by considering the spin-orbit coupling Hamiltonianfor two electrons.
HSO = ξ1l1 · s1 + ξ2l2 · s2 =12(ξ1l1 + ξ2l2)(s1 + s2)+
12(ξ1l1 − ξ2l2)(s1 − s2) (1.6)
It can be easily shown that only the last term of HSO causes coupling of the singlet state|0, 0〉 to the triplet state |1, 0〉, via its z-components:
(s1z − s2z)|0, 0〉 = (s1z − s2z)1√
2[α1β2 − β1α2] = ~
1√
2[α1β2 + β1α2] = ~|1, 0〉 (1.7)
As shown in section 1.2, the matrix element 〈 f |µ|i〉 associated with a dipole-inducedtransition between an initial and a final state, i and f, can be written as a triple product of theelectronic transition dipole, and the overlap integrals of the vibrational and spin functions.Without spin-orbit coupling, the spin overlap 〈σf |σi 〉 becomes zero when σf 6= σi and thetransition will not take place. Spin-orbit coupling causes the singlet state to partially mix witha triplet state, such that 〈σf |σi 〉 6= 0 and the transition, such as phosphorescence will becomepossible.
What does this mean for singlet-triplet transitions for the organic and organometalliccompounds used in this thesis?
In most organic molecules spin-orbit coupling is very weak and any dipole-induced tran-sition involving a change in spin multiplicity will be relatively improbable (i.e. slow and of lowintensity). However, if in a molecule a spin-forbidden process is faster than all other com-peting processes (due to symmetry reasons for example) it may well become the dominantprocess. In organometallic compounds strong spin-orbit coupling can render singlet-triplettransitions nearly as efficient as spin-conserving transitions.
8 1.4 Methods for the Characterization of Triplet States
+1/2
- 1/2
s 1
s 2
S = 1, M S = 0
s 1
s 2
s 2
s 1
s 2
s 1
S = 0, M = 0
- 1/2
- 1/2 - 1/2
+1/2
+1/2
+1/2
S = 1, M S = 1 S = 1, M S = - 1
+1/2
- 1/2
= 0
S = 0
- 1/2
- 1/2 - 1/2
+1/2
+1/2
+1/2
= 1 = - 1
Figure 1.3 Interaction between two electron spins, s1 and s2. Cones do not describea precession but indicate totally undefined positions anywhere on the cones, the posi-tions are defined only relatively between two coupled spins. Dashed lines indicate thecomponent along the (arbitrary) z-axis around which the spins are positioned as well asthe vector sum to obtain the total S, and its component along z, MS .
1.4 Methods for the Characterization of Triplet States
Because triplet states in π -conjugated polymers are excited states and they generally can-not be formed by direct excitation from the ground state (T1← S0 has a low probability),special techniques are needed to create, study and characterize triplet states photophysi-cally. Examples of suitable techniques such as phosphorescence, photoinduced absorption,quenching and delayed fluorescence techniques will be discussed in the following sections.
1.4.1 Phosphorescence
Phosphorescence (T1 −→ S0 + hν, Figure 1.2) is the emission of a photon by a moleculewhen it decays from the T1 to the S0 state. The photon energy of phosphorescence pro-vides a direct measure for the S0-T1 energy gap. Since phosphorescence is a spin-forbiddenprocess, its rate is generally low. Since also thermal decay from T1 to S0 is hampered by the

1 Preface 9
different spin multiplicities of the two states, the T1 state often has a long lifetime comparedto S1, extending into the microsecond and millisecond domain. Often the lifetime of the tripletstate is enhanced at low temperatures, where thermal decay is inhibited further. When phos-phorescence is observed, and can be monitored in time after pulsed excitation, it is possibleto determine the lifetime of the T1 state. It turns out, however, that in many π -conjugatedpolymers phosphorescence is rather inefficient, resulting in very low intensities. This oftenhampers its detection, which is further complicated by the comparatively overwhelming in-tensity of the fluorescence (S1 −→ S0 + hν, Figure 1.2). In order to keep the fluorescenceintensity from drowning out the phosphorescence signal, time-gated methods are used. Inthis technique, the time interval of detection is initiated at a certain delay after a short excitingpulse so that the short-lived fluorescence (usually nanoseconds) can decay completely andphosphorescence becomes detectable. This method was used by Bässler and coworkers todetermine for the first time the triplet state energy of a π -conjugated polymer, a ladder typepolyphenylene.14
1.4.2 Photoinduced Absorption
As argued above, a molecule that is in the excited triplet T1 state often has an extendedlifetime because it is only weakly coupled to the S0 ground state. The long lifetime allowsthe T1 state to be observed via absorption of a photon. The excited state absorption (ESA)of a molecule in the T1 state transforms this molecule to a higher-energy triplet state ( Tn←
T1, Figure 1.2). Since the Tn← T1 absorption is a spin-allowed transition, the Tn← T1 bandcan be strong when it corresponds to a symmetry-allowed transition. Monitoring the Tn←
T1 absorption can provide valuable insight on the formation of triplet states and their lifetime.In absence of phosphorescence, it has become a valuable technique to study triplet excitedstates of π -conjugated oligomers and polymers as was shown by Janssen et al.15,16
ESA (within the triplet manifold) can be probed by photoinduced absorption (PIA). Thistechnique uses two light-sources, called pump and probe. After exciting the molecule withthe pump beam to prepare the molecule in the T1 state (usually via ISC from S1), probelight (often white light) is used to record the absorption spectrum of excited species as thedifference between the absorption spectra of the excited and non-excited samples. PIAprovides a powerful means to study kinetics and other characteristics of the T1 state eventhough the energy level of T1 remains elusive using this technique on its own.
1.4.3 Quenching
When interested in the energy of a triplet state, quenching studies can provide additional in-formation. “Quenching” means the transfer of excited state energy from an excited moleculeto a quencher molecule. The molecule M under study can be either in the singlet (S1 or 1M∗)or triplet (T1 or 3M∗) triplet excited state, while the quencher Q is usually in the singlet groundstate (1Q). Here, the case of triplet energy transfer will be discussed, which can be describedby the reaction:
10 1.4 Methods for the Characterization of Triplet States
3M∗ + 1Q −→ 1M + 3Q∗
the asterisk describes the molecule that is excited. After quenching has taken place, thequencher molecule is in the triplet excited state while the molecule M has decayed to itsground state. Triplet energy transfer generally follows the Dexter mechanism in which thetotal spin of the species before and after the reaction is conserved. The Dexter mechanisminvolves the actual exchange of electrons. Energy transfer will only take place if the energylevel of 3M∗ is higher than of 3Q∗.
To determine the unknown triplet energy E(T1) of a molecule M, quenching experimentsusing a series of quenchers Q with known triplet energy levels are performed. If the triplet-triplet (Tn ← T1) absorption band of 3M∗ can be probed in a PIA experiment, successfulquenching causes this band to disappear upon addition of the quencher. Quenching of 3M∗
by a quencher of known energy level establishes E(T1) of M to lie above that of Q. In thecase of unsuccessful quenching, the triplet energy of M is lower than that of Q.
By performing experiments with different quenchers, an approximate energy for the en-ergy level of an unknown triplet state can be determined. Monkman and coworkers, for ex-ample, created high triplet densities via pulse-radiolysis and triplet sensitization and could,thus, approximately determine the hitherto unknown energy levels of various π -conjugatedpolymers.17
Molecular oxygen, O2, possesses a 36−g triplet ground state and has a low-energy(0.98 eV) 11g singlet excited state. As a consequence molecular oxygen acts as an effi-cient quencher for many triplet state molecules:
3M∗ + O2(36−g ) −→ 1M + O2(11g).
To avoid this reaction, measurements involving triplet states are generally performedunder a protective atmosphere or in high vacuum.
1.4.4 Triplet-Triplet Annihilation and Delayed Fluorescence
Another method to determine the energy of non-emissive triplets is the measurement ofexcitation spectra of delayed fluorescence (DF). When sufficiently high numbers of tripletexcited states are formed, they can meet and undergo triplet-triplet annihilation (TTA):
T1 + T1 −→ S0 + S1
TTA is a spin-allowed process and may leave one of the molecules in the singlet excitedstate S1 and the other in the singlet ground state S0. The S1 state can subsequently decayby fluorescence. When using pulsed excitation, the fluorescence produced via TTA is con-siderably delayed in time compared to the normal or prompt fluorescence (PF) because itoriginates from long-lived triplet states that recombine on a time scale that is much longer
1 Preface 11
than the nanosecond-scale lifetime of the fluorescence of the directly excited S1 state.
By exciting molecules at energies below that of the S1← S0 transition, it is sometimespossible to probe the direct, but weak T1← S0 absorption via monitoring the delayed fluo-rescence produced by TTA. When the wavelength is varied, the excitation spectrum of thedelayed fluorescence, arising via TTA, corresponds to the absorption band of the direct tripletabsorption (T1← S0, Figure 1.2). At a certain energy, the low limit of the triplet absorptionfeature is reached and triplet excitation and with it, DF will cease. This energy correspondsto the energy of the triplet state. Landwehr et al. used this technique to accurately determinethe triplet state energies of a series of oligothiophenes.18
1.5 Triplet States in 5-Conjugated Oligomers and Polymers
Triplet states in organic and polymeric semi-conductors have received considerable attentionin the literature. In this section a selection of the literature on subjects relevant to the contentsof the thesis is reviewed.
1.5.1 Triplet State Energies of Oligomers and Extrapolation to the Triplet State Energyof the Polymer
The determination of the triplet energy, being one of the most basic features of the tripletstates in π -conjugated materials, has been an issue of profound interest. Especially, for thecommonly non-phosphorescent π -conjugated polymers, determining the triplet energy hasbeen a challenging subject for many years. Since the corresponding oligomers of these π -conjugated polymers are more well-defined, several groups have focussed on determiningthe singlet and triplet state energies of series of π -conjugated oligomers. From the conjuga-tion length dependence of these energies, the energy of the polymer can be determined byextrapolation.
To determine the difference in energy between T1 and S0 in π -conjugated oligomersseveral techniques have been used: quenching studies using quenchers of known tripletstate energy,19 photoacoustic calorimetry,20 photodetachment photoelectron spectroscopy(PD-PES)21 and excitation spectra of direct T1← S0 excitation while probing the signal ofdelayed fluorescence.18 The conjugation length dependence of the energies of the lowesttriplet transition yielded extrapolated values for the energy of the polymer triplet state. Seixasde Melo et al. studied oligothiophenes nT with n = 1–7 using photoacoustic calorimetry anddetermined the energy of the triplet state and its length dependence. From the data obtainedfor the oligomers, the limit of the energy difference between S0 and T1 for n =∞ was foundto be 1.24 eV.20 Landwehr et al. recorded excitation spectra of directly triplet excited delayedfluorescence (DF) of nT with n = 2–5 and extrapolated to the polymeric limit of 1.11 eV.18
The conjugation length dependence of the transition energies in π -conjugated oligomerssuch as oligothiophenes, oligofluorenes, oligo(phenylene vinylene)s and oligophenylenes is

12 1.5 Triplet States in 5-Conjugated Oligomers and Polymers
– in first approximation – often linear with the reciprocal number of repeat units (n). Thisreciprocal (1/n) dependence has been observed for the energy of the lowest triplet stateT1,18,22,23 but also for higher triplet transitions Tn ← T1
16,24–26 and for the S1← S0 transi-tion.27–40 The slope of the S1 energy versus 1/n is usually more pronounced than for the T1
energy. This has been ascribed to the exchange energy that stabilizes the triplet state andlocalizes it on a smaller part of the chain than the corresponding singlet state. If a state ismore localized, the energy will be less affected by changes in length of the oligomer.
1.5.2 Determination of the Energy of the Triplet State of 5-Conjugated Polymers
Although Holdcroft et al.41 claimed to have recorded the phosphorescence spectrum of apolythiophene, which would have placed its T1 state energy at 1.50 eV, it turned out thatthis experiment could not be reproduced by others. It was only in 1999 that the first gener-ally accepted case of phosphorescence in a π -conjugated polymer was reported by Bässlerand coworkers for a ladder type polyphenylene derivative (MeLPPP) and one of its oligo-mers.14,39,42 Since then, using the method of gated detection, this group has determined thetriplet state energies of a polyfluorene, a polyphenylene derivative and two quinoxaline poly-mers.43–45 From the threshold energy of singlet fission (S0 + S1 −→ T1 + T1), Österbacka etal. could determine the triplet state energy of poly(phenylene vinylene) at 1.55 eV.46 Simul-taneously, the group of Monkman have used the quenching technique in combination withpulse radiolysis to determine the approximate energies of the triplet states of a large varietyof polymers ranging from different derivatives of polythiophene, polyphenylene, polypyridine,polyfluorene to a ladder type polyphenylene (LPPP).17,47–49 This group also used gated de-tection to study triplet state energy and characteristics of a polythiophene derivative.50
By introducing heavy elements to increase spin-orbit coupling it is possible to increasethe mixing of singlet and triplet states and enhance the probability for absorption to, or emis-sion from, the triplet state. Often solvents containing heavy elements (e.g. iodinated sol-vents) are used.16 Lupton and coworkers, however, exploited residual heavy metal atomsused as catalyst during synthesis to record the intrinsic electrophosphorescence from aphenyl substituted LPPP derivative.51 A more controlled approach to make use of the heavyatom effect has been taken by the group of Köhler who investigated the triplet state energiesof a large variety of platinum-containing monomers and polymers and compared them withthose of the corresponding platinum-free compounds.52–55
1.5.3 Exchange Energy of 5-Conjugated Materials
Most studies on triplet states in π -conjugated materials are not limited to the mere deter-mination of the triplet state energy but report additional information, for example on the S1-T1 energy gap, 1EST. For most π -conjugated polymers 1EST is ∼0.7 eV, while oligomersshow far larger exchange energies. This increase can be rationalized by considering thatin oligomers delocalized states become forcedly more localized within the boundaries of themolecule when the molecule is smaller. This increases the energy of the confined exciton.

1 Preface 13
The forced localization is more keenly felt by the singlet state since it tends to be more delo-calized. Usually the triplet state is thought to be confined on roughly one or two monomericunits, however, the singlet state is estimated to be self-localized within ∼4–10 units.
Moreover, extensive theoretical studies have been carried out on a variety of differentseries of π -conjugated materials. The lowest singlet and triplet states of series of ethylene-dioxy bridged thiophenes have been investigated by Dkhissi et al.56 and Alemán et al.57 andof phenylene vinylenes and thiophenes by Beljonne et al.58,59 The general picture is one ofa very confined triplet state (one or two units) and a rather more delocalized singlet state.The aromatic configuration of most non-degenerate ground state π -conjugated oligomers istransformed into a more quinoid structure upon excitation to the T1 state.
1.5.4 Delayed Fluorescence in 5-Conjugated Polymers
Delayed fluorescence (DF) in π -conjugated polymers has been studied in great depth bythe groups of Monkman and Bässler, who have each postulated a different mechanism toaccount for the DF in a variety of π -conjugated polymers. The mechanism that Bässler andcoworkers hold responsible for DF in a given set of materials involves geminate electron-holepair recombination,39,42,60–62 while for Monkman et al. TTA is the source of DF49,63–68 but fora different set of materials.
At first glance, the two groups seemed to come to contradictory conclusions and the mat-ter was only clarified when Bässler and coworkers carried out another study:45 two deriva-tives of the same polymer were studied, in one polymer the monomers were directly attachedvia one C-C bond, while in the other polymer the same monomers were connected via anether functionality. The C-C connected polymer was shown to undergo charge recombi-nation to cause DF while the ether-linked polymer showed a mixture of both mechanisms,recombination and TTA. With these results, the past discrepancies could be rationalized: forcharge pair formation, an extended π -conjugated system and inter-chain interactions arenecessary, while short conjugation lengths and isolated chains lead to TTA to cause DF, andthese parameters are of course strongly dependent on the nature of polymer and sampleand all the aforementioned results can now be accounted for.
1.5.5 Exciton Formation in OLEDs
One of the most controversial fundamental topics in the field of π -conjugated materials isthe fraction of singlet excitons, χS, formed when holes and electrons recombine. Simple spinstatistics predict that χS = 0.25 and the remaining 0.75 recombine to the triplet state. Thissubject is relevant to electroluminescent OLEDs and PLEDs where charge carrier injectionand subsequent formation of singlet excitons is crucial for efficient device performance. Forquite some time χS was thought to be governed by spin statistics, which would limit the in-ternal quantum efficiency of electrofluorescent OLEDs and PLEDS to 0.25. However, Caoet al. reported a ratio of 0.5 for the efficiencies of electroluminescence versus photolumi-
14 1.6 Triplet Emitters in OLEDs
nescence.69 This implies that under electrical excitation χS = 0.50, which puts serious doubtto whether spin statistics apply to these devices. This initiated various experimental studiesthat indicate deviations from spin statistics in these materials.70–76 Values for χS as highas 83±7% have been found.75 Moreover, the singlet fraction seems to increase with thelength of the π -conjugated system. In addition, a number of theoretical studies were pub-lished on this issue.77–81 In this context, ISC has been studied by Beljonne et al.82,83 andKarabunarliev et al.84 and their theoretical findings suggest that electron phonon interactionsand the relative energies of interacting states play a crucial role in the efficiency of the sin-glet formation. While these studies all indicate that significant deviations from spin statisticsare possible, there is also experimental evidence that challenges this view. In stark con-trast to these results, Forrest and coworkers found that the singlet generation fraction doesnot deviate significantly from spin statistics for both a small organic molecule (Alq3) and aπ -conjugated polymer (MEH-PPV).85
The issue has been reviewed by Brédas and coworkers from a theoretical point of view.86
They argue that exciton formation is a two-step process, initiated by the formation of a looselybound electron-hole pair, or charge transfer (CT) state with singlet or triplet multiplicity, that isthe precursor to the exciton. This CT state is created following simple spin statistics. Whenthe rates for 1CT→ S1 and 3CT→ T1 are different and ISC (1CT→ 3CT) can occur in theCT state, it is possible that χS > 0.25.
Recently, however, Lupton and coworkers reported experiments that the expected inter-system crossing in coulombically bound electron-hole pairs, the precursors to excitons, doesnot take place.87 Hence, the issue remains under debate.
1.6 Triplet Emitters in OLEDs
An elegant way to circumvent the limits set by the electron spins on the efficiency of singletformation in (fluorescent) light-emitting devices is to use a phosphorescent emitter ensuringthat all excitons are quickly transformed into the triplet state on this emitter. If this can beachieved, the internal quantum efficiency of OLEDs can become unity. This approach wasintroduced by Kido et al.88 and Baldo et al.89 by incorporating organometallic complexesin OLEDs. The highly efficient spin-orbit coupling of heavy metal centers in organometalliccomplexes is exploited to provide a path for ISC of singlet excitons into the triplet manifold.Any singlet exciton that is transferred to or is formed on such a metal complex will inter-system cross with very high efficiencies (up to unity), while triplet excitons (formed on ortransferred to a organometallic complex) will emit from the lowest excited state of the com-plex. Hence, all excitons, regardless of their initial spin state, lead to emission. Followingthis approach, highly efficient devices have been manufactured90 and Adachi et al. havereported up to 100% internal quantum efficiency.91,92
Since the report in 1998 on an OLED containing a platinum complex dispersed in theemissive layer,89 a multitude of such dopants in a wide range of hosts used to constructphosphorescent OLEDs have been reported. Different metal centers93 have been used

1 Preface 15
in these phosphorescent OLEDs, such as platinum,89,94–96 ruthenium, as reported by DeCola and coworkers,97 osmium,98,99 and even rare-earth metals, such as terbium,88 andeuropium.100,101
However, the most common metal used for metal-organic dopants in OLEDs nowa-days is iridium.90,102–118 Iridium(III) is a versatile d-metal ion that can accommodate (upto) 6 coordinating ligands. Anionic ligands such as carboxylato ligands form stable bondsto iridium, as do many σ -donor ligands (e.g. amines). Common in stable iridium com-plexes are bidentate ligands, which carry neutral or anionic donor groups, as are cyclo-metallating ligands that form a carbon-iridium bond and carry a second coordinating site,mostly amines. Examples of common iridium complexes used in recent years are the greenemitting phosphor, fac-tris[2-(phenyl) pyridinato] iridium, Ir(ppy)3,102 the red emitter, bis[2-(2’-benzothienyl) pyridinato] (acetylacetonato) iridium, Ir(btp)2(acac),103 and the blue com-plex bis[(4,6-di-fluorophenyl)pyridinato] picolinato iridium, FIrpic.107 In all cases, iridium andligand centered states mix to some extent so that efficient spin-orbit coupling leads to highefficiency ISC and/or emission. The state from which the emission occurs can be either ametal-to-ligand charge transfer (3MLCT) state or a ligand centered 3(π − π∗) state.103
In this way, OLEDs emitting in all the colors of the visible spectrum could be achieved aswell as emission in the infrared (IR) wavelength regime as reported by Gu et al.100 and eventwo different colors depending on the applied bias as shown by De Cola and coworkers.97
With future applications in mind, such as organic lighting (i.e. white light sources) orback-lighting for full-color displays, an intense white light-emitting OLED is needed. Suchwhite organic LEDs (WOLEDs) have been developed making use of the same or similarorganometallic complexes as their single color counterparts. Different types of WOLEDstructures119 have been reported relying on the mixing of colors to achieve white light emis-sion: either by employment of stacked layers each carrying one emitter of a specificcolor,120–122 mixing emitters of differing colors within one layer123–125 or making use of si-multaneous emission from different states or parts of a compound.126,127
Despite the tremendous progress made in the field, there are still many challenging prob-lems intrinsic to metal-doped OLEDs that need to be kept in mind and call for careful planningand control of device structures. The effect of self-quenching128–130 has been addressed bye.g. Adachi and coworkers130 and it has become clear that excitons need to be confined onthe organometallic dopant131–134 which can be achieved by choosing hosts for the dopantsthat have higher S0-T1 energy gaps. Thus, the diffusional behavior of triplet excitons plays acrucial role as discussed by Forrest135 and Ito.136
16 1.7 Aim and Scope
1.7 Aim and Scope
What is the fate of a triplet state?
The characteristics of triplet excited states of π -conjugated molecules and polymers suchas their energy, geometry and lifetime as well as the way they are formed, migrate and even-tually decay form the central theme of this thesis. The aim is to improve our knowledge ontriplet states of conjugated materials as this may help to understand and eventually improvethe operation of opto-electronic devices made from these materials.
The most fundamental property of a triplet state, its energy, is investigated in Chapter 2for a series of oligothiophenes as a function of length and chemical derivatisation using time-gated and steady state spectroscopic techniques as well as theoretical calculations. Forthis group of molecules, experimental and theoretical methods establish the spatial extentof a triplet exciton to be 3-4 monomer units. From the calculations further information onthe nuclear geometry of the oligomers in their triplet states is obtained and changes of thegeometry in the T1 state relative to that in the S0 state are evaluated.
Chapter 3 deals with two series of ethylenedioxy bridged oligothiophenes, which are in-vestigated with steady state, transient and time-gated optical techniques as well as infraredand Raman spectroscopy. At low temperatures, the electronic spectra of these compoundsreveal highly resolved vibrational progressions of two different modes. Theoretical calcu-lations are carried out to obtain optimized geometries of the singlet and triplet states andthe vibrational normal modes (for the S0) of these molecules. A Franck-Condon analysisof the vibronic band shape in the electronic spectra is used to estimate the changes in theequilibrium nuclear geometry upon going from the ground to the lowest excited singlet state.
Chapter 4 provides a new look on delayed fluorescence and two-photon absorptionprocesses taking place upon sub-S0-S1 gap excitation in a polythiophene. Time-gated andfluence dependent luminescence measurements are presented.
The triplet state energies of a series of oligofluorenes is studied in Chapter 5. Fromthe data collected, the spatial extent of a triplet exciton is estimated and it is found to bedelocalized over at least 4 monomer units.
Chapters 6 and 7 deal with the triplet state (dynamics) of organometallic molecules whichare incorporated as dopants in various solid polymeric hosts, an issue which is relevant tophosphorescent OLEDs.
In Chapter 6 diffusion of triplet excitons of iridium emitters blended into polymer matricesas a function of temperature, triplet state energy of the polymeric host and of the concen-tration of a non-emissive organic quencher, is investigated, employing time-correlated singlephoton counting and steady state photoluminescence techniques. The conclusion is drawnthat the migration of triplet excitons via the host in the studied samples using three poly-meric matrices and two iridium phosphors of different triplet state energies at two different

1 Preface 17
temperatures is negligible.
Chapter 7 addresses the mechanism for triplet energy transfer in a polymeric host dopedwith two phosphorescent dyes with different triplet state energies. It is found that tripletenergy is efficiently transferred from a green emitting phosphorescent dye to a red phosphor,when both are dispersed in an inert solid matrix. It is shown that the triplet energy transfercan be accounted for by Förster energy transfer, rather than Dexter transfer, which requiresdirect overlap of the wavefunctions. The strong spin-orbit coupling in both dyes createstransition dipole moments that are strong enough to provide, together with an increasedlifetime, a relatively large Förster radius of several nanometers.


2Phosphorescence and Triplet State Energies
of Oligothiophenes∗
Abstract
The phosphorescence spectra of a series of small oligothiophenes (nT, n = 1–3) incorporat-ing a variety of substituents, end cappers, and functional groups have been recorded for thefirst time using gated detection in combination with nanosecond excitation in frozen solutionat 80 K. The vibrationally resolved emission spectra provide accurate estimates of the T1
and S1 levels, and the singlet-triplet energy gap. Theoretical calculations performed at theDFT (B3LYP/6-31G*) level reproduce all experimental trends accurately and provide a quan-titative description of the difference in energy between lowest singlet and triplet level. Thegeometry relaxation in the excited state shows that the ‘natural’ size of the triplet exciton isabout 3–4 thiophene units.
∗ D. Wasserberg, P. Marsal, S. C. J. Meskers, R. A. J. Janssen, D. Beljonne, J. Phys. Chem. B 2005, 109(10),4410-4415.
19

20 2.1 Introduction
2.1 Introduction
The lowest excited triplet state of oligothiophenes has been subject of continuous interestever since [2,2’;5’,2”]terthiophene (3T), a constituent of marigolds, was identified for its ne-maticidal activity in the presence of light.137 More recently, oligothiophenes (nT, with n thenumber of thiophene rings) have received considerable attention as organic semi-conductorswith potential applications in field-effect transistors, lasing, nonlinear optics, light-emittingdiodes, and solar cells.138 The triplet (T1) state is formed in oligothiophenes with consider-able quantum yield via inter-system crossing from the photoexcited singlet S1 state to thetriplet manifold involving low-lying Tn triplet-excited states.82 Its long lifetime enhances en-ergy migration, trapping, and the possibility to interact with electron acceptors to form chargecarriers.15,139 The triplet states of oligothiophenes of various lengths (nT, n = 2–17) havebeen identified and studied by recording their transient Tn← T1 absorption spectra.25,139–143
Despite this continued interest, one of the most basic features of the oligothiophenetriplet state, the triplet energy E(T1), has long remained elusive. Early attempts by Reyft-mann and Scaiano to observe phosphorescence of the triplet state of 3T at 77 K proved un-successful.144–146 Later, the triplet energy E(T1) of 3T was estimated to be 1.72±0.05 eV byrecording the T1←S0 absorption, utilizing heavy-atom induced absorption spectroscopy.147
The first truly quantitative information on the triplet state energy of a series of oligothiopheneswas reported by Landwehr, Port, and Wolf who recorded high-resolution triplet photoex-citation spectra by monitoring the delayed fluorescence of crystalline, unsubstituted oligo-thiophenes (nT, n = 2–5).18 More recently, Seixas de Melo et al. and Rentsch et al. alsoreported triplet energies of oligothiophenes, using different approaches.20,21 Seixas de Meloet al. employed time-resolved photoacoustic calorimetry (PAC), in combination with spectro-scopic data on absorption and fluorescence, and measured quantum yields for fluorescenceand triplet formation to determine E(T1) for nT (n = 2–5, and 7).20 Rentsch et al. used amore direct method, photodetachment photoelectron spectroscopy (PD-PES) of oligothio-phene anions, to measure E(T1) for nT (n = 2–4) in the gas phase.21 Moreover they wereable to measure, for the first time, the phosphorescence of 2T by gated detection in solutionat cryogenic temperatures, but this method failed for 3T.21
Gated detection has been used successfully in recent years for observing phosphores-cence of various conjugated polymers.14,42–45,50,55,63,65,148,149 In this study, gated detectionin combination with laser excitation and sensitive detection, has been utilized to record thefirst phosphorescence spectra of series of oligothiophenes with up to 3 thiophene units anda range of substituents and functional groups (Figure 2.1) at 80 K in frozen solution. Theenergy level of the triplet state E(T1) and the energy gap between S1 and T1, 1EST, aredirectly obtained from the emission spectra.
Additionally, triplet excitations in oligothiophenes and derivatives have been character-ized by means of first principle DFT and quantum-mechanical calculations, as well as quan-tum-mechanical calculations at the semi-empirical level.26 Here, the results of density func-tional theory calculations, including geometry optimization of S0 and T1, are discussed, whichprovides a firm quantitative description of the lowest triplet excited state. The DFT resultsreproduce the experimental triplet energies with a small (∼0.1 eV) and most importantly sys-
2 Triplet States of Oligothiophenes 21
tematic underestimation; in addition, they allow for an investigation of the extension of thetriplet exciton in greater detail.
2.2 Results and Discussions
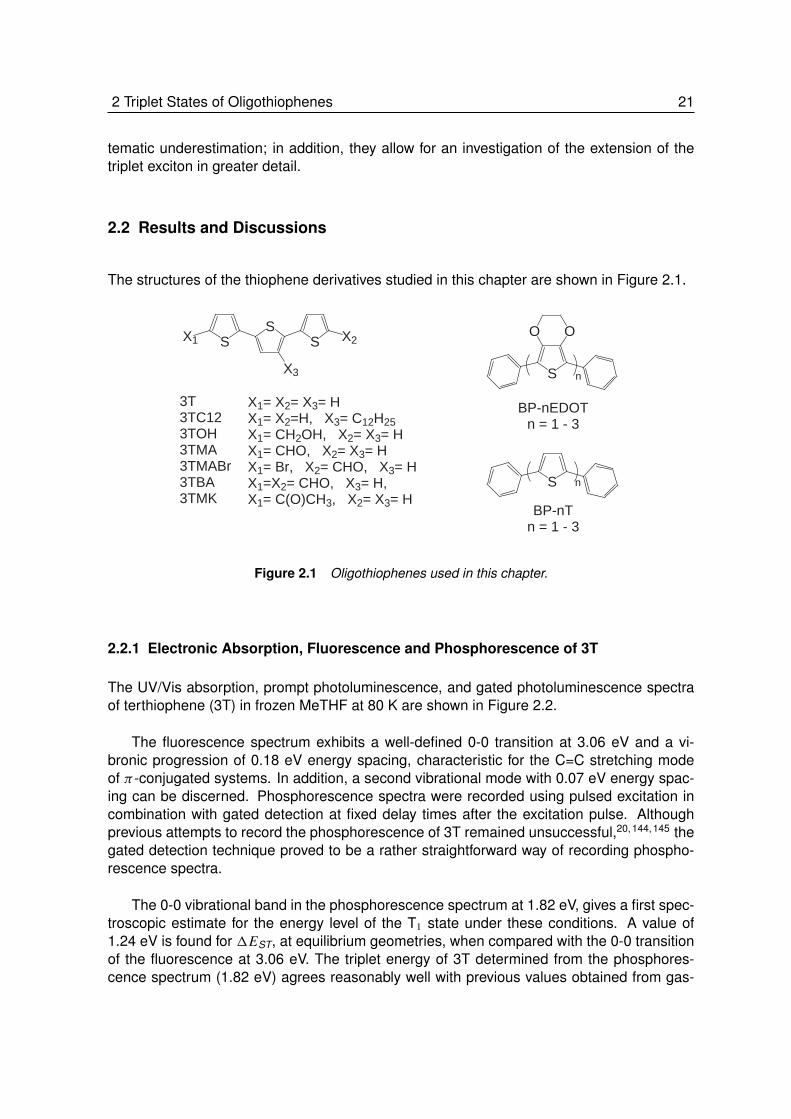
The structures of the thiophene derivatives studied in this chapter are shown in Figure 2.1.
S
S
OOS
SSX1 X2
X3 n
n
BP-nTn = 1 - 3
BP-nEDOTn = 1 - 3
3T 3TC123TOH3TMA3TMABr3TBA3TMK
X1= X2= X3= HX1= X2=H, X3= C12H25X1= CH2OH, X2= X3= HX1= CHO, X2= X3= HX1= Br, X2= CHO, X3= HX1=X2= CHO, X3= H,X1= C(O)CH3, X2= X3= H
Figure 2.1 Oligothiophenes used in this chapter.
2.2.1 Electronic Absorption, Fluorescence and Phosphorescence of 3T
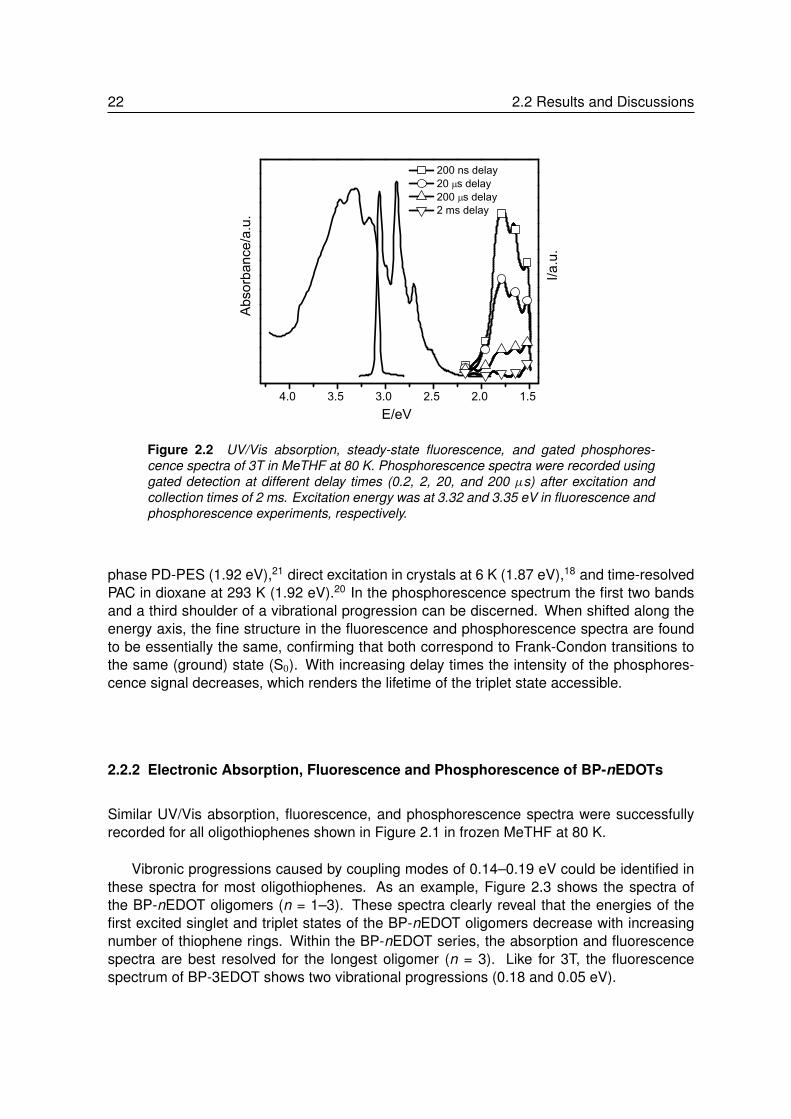
The UV/Vis absorption, prompt photoluminescence, and gated photoluminescence spectraof terthiophene (3T) in frozen MeTHF at 80 K are shown in Figure 2.2.
The fluorescence spectrum exhibits a well-defined 0-0 transition at 3.06 eV and a vi-bronic progression of 0.18 eV energy spacing, characteristic for the C=C stretching modeof π -conjugated systems. In addition, a second vibrational mode with 0.07 eV energy spac-ing can be discerned. Phosphorescence spectra were recorded using pulsed excitation incombination with gated detection at fixed delay times after the excitation pulse. Althoughprevious attempts to record the phosphorescence of 3T remained unsuccessful,20,144,145 thegated detection technique proved to be a rather straightforward way of recording phospho-rescence spectra.
The 0-0 vibrational band in the phosphorescence spectrum at 1.82 eV, gives a first spec-troscopic estimate for the energy level of the T1 state under these conditions. A value of1.24 eV is found for 1EST, at equilibrium geometries, when compared with the 0-0 transitionof the fluorescence at 3.06 eV. The triplet energy of 3T determined from the phosphores-cence spectrum (1.82 eV) agrees reasonably well with previous values obtained from gas-
22 2.2 Results and Discussions
4.0 3.5 3.0 2.5 2.0 1.5
Abs
orba
nce/
a.u.
E/eV
200 ns delay 20 s delay 200 s delay 2 ms delay
I/a.u.
Figure 2.2 UV/Vis absorption, steady-state fluorescence, and gated phosphores-cence spectra of 3T in MeTHF at 80 K. Phosphorescence spectra were recorded usinggated detection at different delay times (0.2, 2, 20, and 200 µs) after excitation andcollection times of 2 ms. Excitation energy was at 3.32 and 3.35 eV in fluorescence andphosphorescence experiments, respectively.
phase PD-PES (1.92 eV),21 direct excitation in crystals at 6 K (1.87 eV),18 and time-resolvedPAC in dioxane at 293 K (1.92 eV).20 In the phosphorescence spectrum the first two bandsand a third shoulder of a vibrational progression can be discerned. When shifted along theenergy axis, the fine structure in the fluorescence and phosphorescence spectra are foundto be essentially the same, confirming that both correspond to Frank-Condon transitions tothe same (ground) state (S0). With increasing delay times the intensity of the phosphores-cence signal decreases, which renders the lifetime of the triplet state accessible.
2.2.2 Electronic Absorption, Fluorescence and Phosphorescence of BP-nEDOTs
Similar UV/Vis absorption, fluorescence, and phosphorescence spectra were successfullyrecorded for all oligothiophenes shown in Figure 2.1 in frozen MeTHF at 80 K.
Vibronic progressions caused by coupling modes of 0.14–0.19 eV could be identified inthese spectra for most oligothiophenes. As an example, Figure 2.3 shows the spectra ofthe BP-nEDOT oligomers (n = 1–3). These spectra clearly reveal that the energies of thefirst excited singlet and triplet states of the BP-nEDOT oligomers decrease with increasingnumber of thiophene rings. Within the BP-nEDOT series, the absorption and fluorescencespectra are best resolved for the longest oligomer (n = 3). Like for 3T, the fluorescencespectrum of BP-3EDOT shows two vibrational progressions (0.18 and 0.05 eV).

2 Triplet States of Oligothiophenes 23
4.0 3.5 3.0 2.5 2.0 1.5
a
Abs
orba
nce/a.u.
E/eV
I/a.u.
4.0 3.5 3.0 2.5 2.0 1.5
E/eV
b
I/a.u.
Abs
orba
nce/
a.u.
4.0 3.5 3.0 2.5 2.0 1.5
c
Abs
orba
nce/
a.u.
E/eV
I/a.u.
Figure 2.3 UV/Vis absorption, steady-state fluorescence, and gated phosphores-cence spectra of BP-nEDOT in MeTHF at 80 K. Phosphorescence spectra wererecorded 200 ns after excitation using gated detection. (a) BP-1EDOT: fluorescenceexcitation 3.62 eV, phosphorescence excitation 3.40 eV, gate 10 ms. (b) BP-2EDOT:fluorescence excitation 3.06 eV, phosphorescence excitation 2.88 eV, gate 100 µs. (c)BP-3EDOT: fluorescence excitation 2.76 eV, phosphorescence excitation 2.95 eV, gate1 ms.
24 2.2 Results and Discussions
2.2.3 Length and Chemical Functionalization Dependence of Singlet and Triplet Ex-cited States
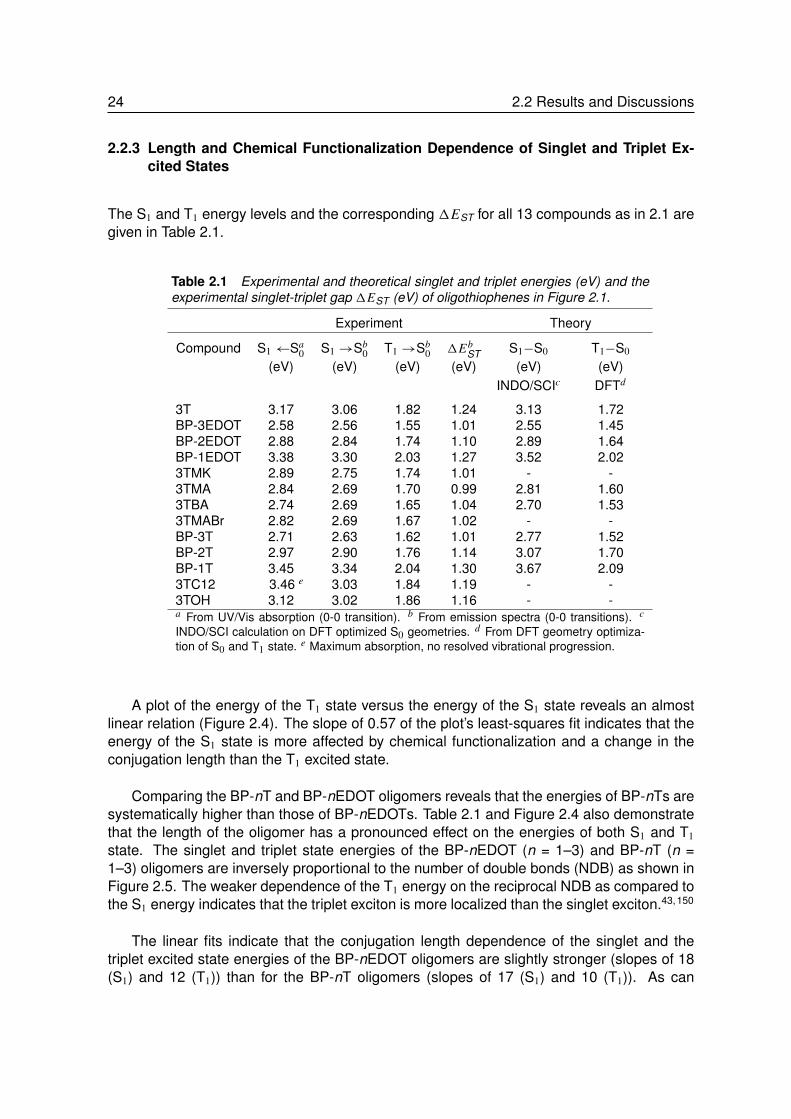
The S1 and T1 energy levels and the corresponding 1EST for all 13 compounds as in 2.1 aregiven in Table 2.1.
Table 2.1 Experimental and theoretical singlet and triplet energies (eV) and theexperimental singlet-triplet gap 1EST (eV) of oligothiophenes in Figure 2.1.
Experiment Theory
Compound S1 ←Sa0 S1 →Sb
0 T1 →Sb0 1Eb
ST S1−S0 T1−S0
(eV) (eV) (eV) (eV) (eV) (eV)INDO/SCIc DFTd
3T 3.17 3.06 1.82 1.24 3.13 1.72BP-3EDOT 2.58 2.56 1.55 1.01 2.55 1.45BP-2EDOT 2.88 2.84 1.74 1.10 2.89 1.64BP-1EDOT 3.38 3.30 2.03 1.27 3.52 2.023TMK 2.89 2.75 1.74 1.01 - -3TMA 2.84 2.69 1.70 0.99 2.81 1.603TBA 2.74 2.69 1.65 1.04 2.70 1.533TMABr 2.82 2.69 1.67 1.02 - -BP-3T 2.71 2.63 1.62 1.01 2.77 1.52BP-2T 2.97 2.90 1.76 1.14 3.07 1.70BP-1T 3.45 3.34 2.04 1.30 3.67 2.093TC12 3.46 e 3.03 1.84 1.19 - -3TOH 3.12 3.02 1.86 1.16 - -a From UV/Vis absorption (0-0 transition). b From emission spectra (0-0 transitions). c
INDO/SCI calculation on DFT optimized S0 geometries. d From DFT geometry optimiza-tion of S0 and T1 state. e Maximum absorption, no resolved vibrational progression.
A plot of the energy of the T1 state versus the energy of the S1 state reveals an almostlinear relation (Figure 2.4). The slope of 0.57 of the plot’s least-squares fit indicates that theenergy of the S1 state is more affected by chemical functionalization and a change in theconjugation length than the T1 excited state.
Comparing the BP-nT and BP-nEDOT oligomers reveals that the energies of BP-nTs aresystematically higher than those of BP-nEDOTs. Table 2.1 and Figure 2.4 also demonstratethat the length of the oligomer has a pronounced effect on the energies of both S1 and T1
state. The singlet and triplet state energies of the BP-nEDOT (n = 1–3) and BP-nT (n =1–3) oligomers are inversely proportional to the number of double bonds (NDB) as shown inFigure 2.5. The weaker dependence of the T1 energy on the reciprocal NDB as compared tothe S1 energy indicates that the triplet exciton is more localized than the singlet exciton.43,150
The linear fits indicate that the conjugation length dependence of the singlet and thetriplet excited state energies of the BP-nEDOT oligomers are slightly stronger (slopes of 18(S1) and 12 (T1)) than for the BP-nT oligomers (slopes of 17 (S1) and 10 (T1)). As can

2 Triplet States of Oligothiophenes 25
2.6 2.8 3.0 3.2 3.4
1.6
1.8
2.0
SLOPE = 0.57
3TC123T
BP-1EDOTBP-1T
BP-2EDOT
3TMK
3TOH
BP-2T
3TMA3TMABr
3TBABP-3T
BP-3EDOT
E(T1)
/ eV
E(S1) / eV
Figure 2.4 Triplet energy as function of the singlet energy for oligothiophenes. Thesolid line represents a least-squares fit to the data.
0.08 0.10 0.121.5
2.0
2.5
3.0
3.5BP-nTBP-nEDOT
1/NDB
E/eV
0.08 0.10 0.12
S1 S1
T1 T1
1/NDB
Figure 2.5 Relation between the inverse number of double bonds (1/NDB) and thesinglet and the triplet excited state energies of BP-nEDOT and BP-nT oligomers.

26 2.2 Results and Discussions
be seen in Table 2.1 and Figure 2.5, 1EST of BP-nT and BP-nEDOT oligomers decreasesfrom ∼1.3 eV to ∼1.0 eV, going from n = 1 to 3. This decrease of exchange energy withconjugation length is in accordance with the 0.7±0.1 eV1EST found experimentally for manyconjugated polymers.150
Not only the conjugation length but also chemical functionalization of terthiophene affectsthe singlet and triplet energies. Substitutents such as -CHO and -C(O)CH3 (in 3TMA, 3TMK,3TBA, and 3TMABr) extend the conjugation length of 3T and – as a consequence – lowerthe excited state energies of both T1 and S1 more strongly than the alkyl substituents in3TC12, and 3TOH. This increased conjugation also lowers the exchange energy to ∼1.0 eVcompared to 1.3 eV in 3T.
2.2.4 Selective Excitation of 3T
Incorporated into the glass of frozen MeTHF at 80 K all oligothiophenes will have slightlydifferent energetic environments due to small variations in conformation and the orientationof solvent molecules, which can be probed. Thus, to further elucidate the correlation betweensinglet and triplet state energies, site-selective excitation experiments were performed.
In these experiments the phosphorescence spectra of 3T were recorded for excitationenergies between 3.18 eV (at the top of the 0-0 transition in absorption) and 3.06 eV (atthe half maximum of the 0-0 band) (Figure 2.6). The latter is close to the region where onlythe energetically most relaxed 3T molecules can be excited. Figure 2.6 reveals that, as aresult of the lowering of the excitation energy, the onset of the phosphorescence spectrum(at half maximum) shifts by 0.023 eV from 1.871 eV to 1.848 eV, while the maximum intensityundergoes a similar shift from 1.664 to 1.640 eV. This demonstrates that features of selectiveexcitation are beginning to show and it indicates that photoexcitation is preserved at specificsites.
2.2.5 Quantum-Chemical Calculations
To elucidate the nature of the triplet state in more detail, quantum-chemical calculationswere performed, initially focusing on accurately determining the triplet energies. DensityFunctional Theory (DFT) was used to investigate the geometric and electronic structuresin the S0 singlet ground state and T1 triplet excited state of these molecules. Here, a po-tential including both Becke and Hartree-Fock exchange and Lee Yang and Parr correlation(B3LYP) has been adopted, which has been shown to provide a reliable description of boththe electronic singlet ground state and the lowest triplet excited states in other conjugatedcompounds.151 The use of a 6-31G* split-valence basis set leads to accurate excitationenergies at reasonable computational costs.152
Singlet vertical transition energies were computed with the semi-empirical IntermediateNeglect of Differential Overlap (INDO) method coupled to a Single Configuration Interac-tion (SCI), INDO/SCI, using DFT-optimized geometries (the Mataga-Nishimoto potential153

2 Triplet States of Oligothiophenes 27
2.0 1.8 1.6 1.4
1.640 eV1.664 eV
ex 3.18 eVex 3.14 eVex 3.10 eVex 3.06 eV
I/a.u
.
E/eV
Figure 2.6 Site-selective excitation of the phosphorescence of 3T. Excitation wave-lengths are indicated in the spectra. The vertical lines indicate the emission maximumfor the spectrum taken after excitation at 3.18 and 3.06 eV as indicated.
was adopted to depict electron-electron interactions). The size of the active space was setaccording to the number of π electrons in the molecule. The ZINDO and Gaussian98154
packages were used for the semi-empirical INDO/SCI and DFT calculations, respectively.
Calculations were performed for a selection of oligothiophenes depicted in Figure 2.1,i.e. 3T, 3TMA, 3TBA, and the series BP-nEDOT (n = 1–6) and BP-nT (n = 1–6) (Table 2.1and 2.2).
Table 2.2 Theoretical triplet state energies (eV) of oligo-thiophenes in Figure 2.1.
T1-S0 DFTa (eV)
n BP-nT BP-nEDOT
6 1.31 1.225 1.35 1.274 1.41 1.343 1.52 1.452 1.70 1.641 2.09 2.02a DFT calculations at optimized geometries for S0 and T1.
28 2.2 Results and Discussions
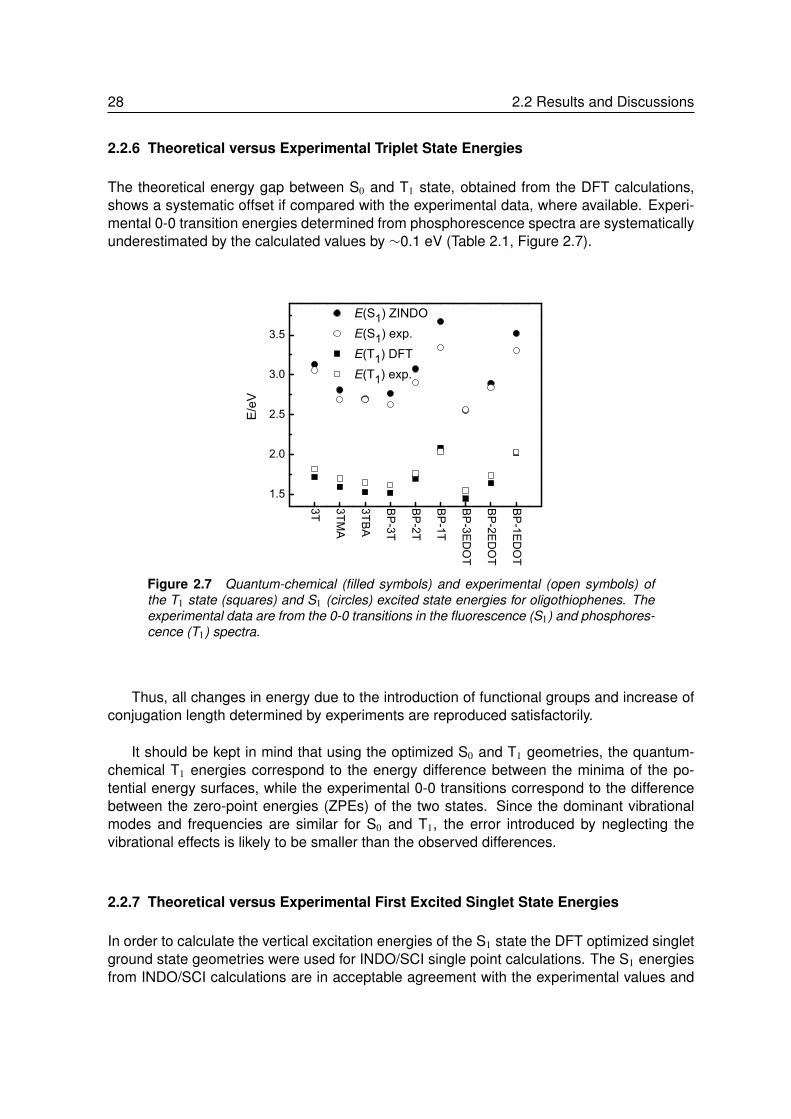
2.2.6 Theoretical versus Experimental Triplet State Energies
The theoretical energy gap between S0 and T1 state, obtained from the DFT calculations,shows a systematic offset if compared with the experimental data, where available. Experi-mental 0-0 transition energies determined from phosphorescence spectra are systematicallyunderestimated by the calculated values by ∼0.1 eV (Table 2.1, Figure 2.7).
3T 3TMA
3TBA
BP-3T
BP-2T
BP-1T
BP-3E
DOT
BP-2E
DOT
BP-1E
DOT
1.5
2.0
2.5
3.0
3.5
E/eV
E(S1) ZINDO E(S1) exp. E(T1) DFT E(T1) exp.
Figure 2.7 Quantum-chemical (filled symbols) and experimental (open symbols) ofthe T1 state (squares) and S1 (circles) excited state energies for oligothiophenes. Theexperimental data are from the 0-0 transitions in the fluorescence (S1) and phosphores-cence (T1) spectra.
Thus, all changes in energy due to the introduction of functional groups and increase ofconjugation length determined by experiments are reproduced satisfactorily.
It should be kept in mind that using the optimized S0 and T1 geometries, the quantum-chemical T1 energies correspond to the energy difference between the minima of the po-tential energy surfaces, while the experimental 0-0 transitions correspond to the differencebetween the zero-point energies (ZPEs) of the two states. Since the dominant vibrationalmodes and frequencies are similar for S0 and T1, the error introduced by neglecting thevibrational effects is likely to be smaller than the observed differences.
2.2.7 Theoretical versus Experimental First Excited Singlet State Energies
In order to calculate the vertical excitation energies of the S1 state the DFT optimized singletground state geometries were used for INDO/SCI single point calculations. The S1 energiesfrom INDO/SCI calculations are in acceptable agreement with the experimental values and
2 Triplet States of Oligothiophenes 29
reproduce the trends correctly (Table 2.1, Figure 2.7). However, the deviations in S1 energybetween theory and experiment are less systematic and generally larger than for the DFT T1
energies.
The larger differences are most likely due to the lower theoretical level of the INDO/SCImethod and the fact that the S1 geometry was not optimized and only a vertical transition iscomputed. Since the calculations refer to the gas phase, the strong oscillator strength of theS1→ S0 transition may induce a medium-induced spectral shift, which could contribute tothe observed larger differences between experiment and theory for the S1 energy level. Forthe T1 level such a spectral shift is not to be expected since the T1→ S0 transition is of weakoscillator strength.
2.2.8 Bond length Alteration and Geometry Changes upon Transition from Singlet toTriplet Ground State
The DFT calculations reveal that in the S0 ground state carbon-carbon bond lengths alternatealong the backbone of the oligothiophenes in Figure 2.1. The thiophene rings have aromaticcharacter, with somewhat longer bonds between the rings. Going from the singlet to thetriplet ground state, the lengths of the carbon-carbon bonds are subject to change in analternating fashion. In the T1 excited state the interring bonds shorten, while the (intraring)double bonds of the S0 ground state become longer in the T1.
The extent of the changes in bond length are an indication for the spatial extent of theexciton, i.e. bonds that are subject to significant changes are involved in accommodatingthe new electronic configuration. The DFT calculations demonstrate that these changesoccur symmetrically around the central thiophene ring(s) and that the effects decrease to-ward the ends of the molecules. As a consequence, the changes in bond lengths are morepronounced for the thiophene moieties than for phenyl or carbonyl end groups.
Only for BP-1EDOT and BP-1T, the terminal phenyl rings are affected to a considerableextent. The single carbonyl group of 3TMA induces asymmetry in the bond length alterna-tion, with stronger changes at the side of the carbonyl moiety. Figure 2.8 shows the changesin bond lengths in the T1 state of the BP-nEDOT oligomers compared to the S0 ground state.The changes are similar in magnitude for all oligomers. Considering a cutoff of |0.02 Å|, thegeometric deformation taking place in the triplet state extends over 3–4 repeat units.
A more detailed analysis of the dihedral angles around the carbon-carbon bonds revealsthat all aromatic rings are generally planar. Some torsion occurs around the bonds connect-ing two rings, or a ring and an end group. In the singlet states the oligothiophene segmentsare essentially planar for all compounds, except for 3T and BP-3T where all the thiophenerings are twisted by ∼16 degrees. However, the S0 ground state potential is very flat, withan energy destabilization of ∼0.35 [2.86] kJ/mol when going from the global minimum to thefully planar structure in 3T [BP-3T].
In this respect, the carbonyl end groups must be responsible for the complete planariza-

30 2.2 Results and Discussions
-15 -10 -5 0 5 10 150.06
0.04
0.02
0.00
-0.02
-0.04
-0.06
-10 -8 -6 -4 -2 0 2 4 6 8 100.080.060.040.020.00-0.02-0.04-0.06-0.08
b
Bon
d le
ngth
/ Å
Number of Bond
BP-6EDOT
a
BP-1EDOT BP-2EDOT BP-3EDOT
Bon
d le
ngth
/ Å
Number of Bond
Figure 2.8 Changes in bond lengths upon transition from the singlet ground state tothe first excited triplet state as calculated with DFT (B3LYP/6-31G*) for BP-nEDOT (a)n = 13 and (b) n = 6. The horizontal arrow indicates the extension of the triplet exciton,considering a cutoff of ∼|0.02 Å|. The bonds are consecutively numbered along thechain, setting the central bond to 0.
tion in 3TMA and 3TBA. In contrast to the carbonyl end groups, the phenyl end groupsare usually twisted in the singlet state by 20 degrees for BP-nEDOT and 27 degrees forBP-nT. The triplet states of the oligothiophenes are essentially planar. Only for the BP-nTand BP-nEDOT series some twisting (6–7 degrees) occurs in the triplet state around thethiophene-phenyl bonds of most BP-nT and BP-nEDOT (n = 1–6) oligomers.
Some more information on the ‘natural’ size of an exciton in oligothiophenes has beenderived from an analysis of the distribution of the spin density of BP-6T and BP-6EDOT.22
The total spin density per ring was found to be maximized around the central part of the twomolecules, with ∼85% and ∼80% of the total spin density contained within the inner four

2 Triplet States of Oligothiophenes 31
rings of BP-6T and BP-6EDOT, respectively.22
2.2.9 Predicted Saturation of the Energy Gap between Singlet and Triplet GroundState
Figure 2.9 shows the theoretical triplet state energies of BP-nTs (n = 1–6) and BP-nEDOTs (n= 1–6) versus the inverse number of double bonds (1/NDB). As expected, the dependenceof energy of the triplet state on 1/NDB levels off for high NDB and seems to approach anasymptotic value for a chain length corresponding to ∼4 thiophene units, i.e. it seems tosaturate.
0.06 0.08 0.10 0.121.2
1.4
1.6
1.8
2.0 BP-nEDOT BP-nEDOT
E(T
1) /e
V
1/NDB
Figure 2.9 Relation between the inverse number of double bonds (1/NDB) and thecalculated triplet excited state energies of BP-nT oligomers (n = 1–6) and BP-nEDOT(n = 1–6). The lines are guides to the eye.
2.3 Conclusion
Phosphorescence spectra have been recorded for the first time of a series of short, func-tionalized oligothiophenes (nT, n = 1–3) in frozen solution at 80 K using nanosecond pulseexcitation in combination with gated detection to eliminate interfering fluorescence emission.The phosphorescence spectra exhibit a vibronically resolved progression with a dominant vi-brational mode that corresponds to the C=C stretching vibration. The 0-0 transition energiesprovide a direct spectroscopic probe for the energy of the triplet state. Apart from a small, butsystematic underestimation of∼0.1 eV, the experimental energies and their variation with thechanges in chemical structure of the oligomer are accurately reproduced by DFT (B3LYP/6-
32 Experimental Part
31G*) calculations when using optimized geometries for S0 and T1. Combined experimentaland theoretical results demonstrate that there is a significant dispersion of both triplet andsinglet excited-state energies with chain length and a decreasing S1−T1 gap with increasingn. In the triplet state, there is a significant, alternating change in the bond length comparedto the singlet ground state. The triplet exciton localizes at the center of the oligomers andthe ‘natural’ size is ∼3–4 thiophene rings.
Experimental Part
The synthesis of the BP-nT and BP-nEDOT oligothiophenes has been reported previously.30
The other oligomers were obtained from Aldrich (3TBA) or synthesized according to pub-lished methods.155–158 3TOH, 3TC12, 3TMABr, BP-3T, BP-2EDOT and BP-3EDOT werecarefully purified by preparative HPLC prior to all photophysical measurements. The purityof the other oligomers was checked to avoid fluorescence or phosphorescent signals of mi-nor quantities of contaminants. GC-MS was used for compounds with a molecular massbelow 500 g/mol, while for higher mass compounds HPLC with diode array detection wasemployed. All final products exhibited only a single peak in the respective chromatograms.
2-Methyltetrahydrofuran (MeTHF) was pre-dried over KOH for 3 days, distilled from CaH2,and stored under inert atmosphere. All sample solutions were prepared in a glove box atconcentrations ∼10−5 M (O.D. around 1 at λmax) for absorption and phosphorescence mea-surements and at ∼10−6 M (OD < 0.3 at λmax) for fluorescence measurements. All sampleswere kept under protective atmosphere at all times. Low temperature spectra were recordedusing an Oxford Optistat CF continuous flow cryostat or an Oxford Optistat DN bath cryostat.For all experiments, the temperature was kept at 80 K during measurements.
UV/Vis/NIR absorption spectra were recorded using a Perkin Elmer Lambda 900 spec-trophotometer. Fluorescence spectra were recorded on an Edinburgh Instruments FS920double-monochromator spectrometer equipped with a Peltier-cooled red-sensitive photomul-tiplier.
A pulsed Nd:YAG laser (Surelite II-10, Continuum, FWHM 4 ns, repetition rate 10 Hz)was used for excitation combined with an optical oscillator (Panther OPO, Continuum) tocontinuously tune the excitation energy. Excitation energies were chosen close to the ab-sorption spectrum. Emission spectra were recorded with an intensified CCD camera (PI-MAX:1024HQ, Princeton Instruments) after dispersion of the photoluminescence by a spec-trograph (SP306, Acton Research). The emitted light was collected and focused into a col-lecting optical fiber using 3 lenses at an angle of about 30 degrees with respect to the incidentlight beam. Signal acquisition by the camera was electronically gated. Phosphorescencespectra were recoded at delay times of >100 ns to avoid any residual fluorescence and gatewidths of 0.1–20 ms. All phosphorescence spectra were smoothed (FFT) to reduce noiselevels. The CCD camera has a reduced sensitivity above 1.5 eV resulting in exponential lossof spectral intensity.


3Excited States and Vibrations of
Ethylenedioxythiophene Oligomers
Abstract
The photophyiscal properties of two series of ethylenedioxythiophene (EDOT) oligomers withup to five repeat units are studied using absorption, fluorescence, phosphorescence, andtriplet-triplet absorption as well as infrared (IR) and Raman spectroscopy. The experimentsare complemented with theoretical calculations on the DFT level to obtain optimized geome-tries and energies for the T1 and S0 states, and vibrational normal modes (for S0). A highlyresolved vibrational fine structure is found for all EDOT oligomers in the electronic spectra forall studied transitions (S1← S0, S1→S0, T1→S0, and Tn← T1) at low temperature that re-veals coupling to two different vibrational modes (∼180 and ∼50 meV). The coupling modesare assigned to fully symmetric normal modes, where the high-energy mode is associatedwith the well-known C=C bond stretch vibration and the low-energy mode involves a defor-mation of the bond angles within the thiophene rings and a change of C-S bond lengths. Theenergies of the 0-0 bands of all studied electronic transitions show a reciprocal dependenceon the inverse number of repeat units and are reproduced by quantum-chemical DFT calcu-lations for the T1→S0 transition. Experimentally obtained Huang-Rhys parameters S1 andS2 and theoretical normal modes are used to analyse the geometry changes between T1 andS0 and to semi-experimentally predict the geometry in the S1 state for H-2EDOT.
35
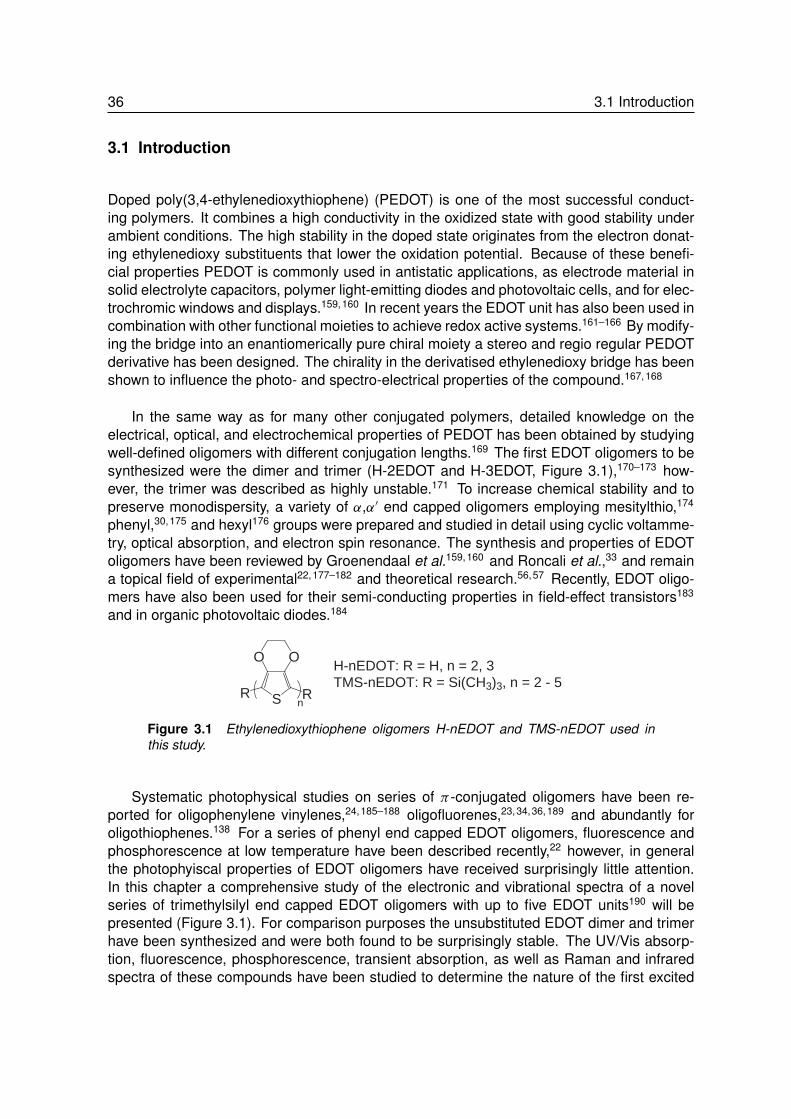
36 3.1 Introduction
3.1 Introduction
Doped poly(3,4-ethylenedioxythiophene) (PEDOT) is one of the most successful conduct-ing polymers. It combines a high conductivity in the oxidized state with good stability underambient conditions. The high stability in the doped state originates from the electron donat-ing ethylenedioxy substituents that lower the oxidation potential. Because of these benefi-cial properties PEDOT is commonly used in antistatic applications, as electrode material insolid electrolyte capacitors, polymer light-emitting diodes and photovoltaic cells, and for elec-trochromic windows and displays.159,160 In recent years the EDOT unit has also been used incombination with other functional moieties to achieve redox active systems.161–166 By modify-ing the bridge into an enantiomerically pure chiral moiety a stereo and regio regular PEDOTderivative has been designed. The chirality in the derivatised ethylenedioxy bridge has beenshown to influence the photo- and spectro-electrical properties of the compound.167,168
In the same way as for many other conjugated polymers, detailed knowledge on theelectrical, optical, and electrochemical properties of PEDOT has been obtained by studyingwell-defined oligomers with different conjugation lengths.169 The first EDOT oligomers to besynthesized were the dimer and trimer (H-2EDOT and H-3EDOT, Figure 3.1),170–173 how-ever, the trimer was described as highly unstable.171 To increase chemical stability and topreserve monodispersity, a variety of α,α′ end capped oligomers employing mesitylthio,174
phenyl,30,175 and hexyl176 groups were prepared and studied in detail using cyclic voltamme-try, optical absorption, and electron spin resonance. The synthesis and properties of EDOToligomers have been reviewed by Groenendaal et al.159,160 and Roncali et al.,33 and remaina topical field of experimental22,177–182 and theoretical research.56,57 Recently, EDOT oligo-mers have also been used for their semi-conducting properties in field-effect transistors183
and in organic photovoltaic diodes.184
RSR
OO
n
H-nEDOT: R = H, n = 2, 3TMS-nEDOT: R = Si(CH3)3, n = 2 - 5
Figure 3.1 Ethylenedioxythiophene oligomers H-nEDOT and TMS-nEDOT used inthis study.
Systematic photophysical studies on series of π -conjugated oligomers have been re-ported for oligophenylene vinylenes,24,185–188 oligofluorenes,23,34,36,189 and abundantly foroligothiophenes.138 For a series of phenyl end capped EDOT oligomers, fluorescence andphosphorescence at low temperature have been described recently,22 however, in generalthe photophyiscal properties of EDOT oligomers have received surprisingly little attention.In this chapter a comprehensive study of the electronic and vibrational spectra of a novelseries of trimethylsilyl end capped EDOT oligomers with up to five EDOT units190 will bepresented (Figure 3.1). For comparison purposes the unsubstituted EDOT dimer and trimerhave been synthesized and were both found to be surprisingly stable. The UV/Vis absorp-tion, fluorescence, phosphorescence, transient absorption, as well as Raman and infraredspectra of these compounds have been studied to determine the nature of the first excited

3 Excited States and Vibrations of EDOT Oligomers 37
singlet and triplet states and to compare these experiments with density functional theory(DFT) calculations. It will be shown that in a rigid matrix at low temperature, the EDOT oligo-mers display highly resolved electronic spectra featuring two different vibronic progressions.Based on these spectra and DFT calculations a semi-experimental estimate of the geometryin the singlet excited state can be made.
3.2 Results and Discussions
3.2.1 Absorption and Fluorescence at Room Temperature
The normalized absorption and fluorescence spectra of the EDOT oligomers measured indichloromethane at room temperature show a broad spectrum with a partially resolved vibra-tional progression (Figure 3.2). The appearance of vibrational fine structure in the absorptionspectrum at room temperature in solution is a fairly unique property of EDOT oligomers andis generally not observed for unsubstituted or alkyl substituted oligothiophenes.138 This re-sult has been interpreted in terms of a rather well-defined and uniform molecular structurein solution at room temperature. A crystallographic study of H-2EDOT has revealed that thedistance between oxygen and sulfur atoms of adjacent units is only 2.92 Å, and hence sig-nificantly shorter than the sum of the van der Waals radii of sulfur and oxygen (3.25 Å) givingevidence of the occurrence of strong intramolecular interactions.191 It can be presumed thatthe attractive O· · ·S interactions of alternating monomers stabilize an anti-conformation ofthe rings and a fully planar structure of the oligomer. As expected, the 0-0 transitions of theabsorption and fluorescence spectra shift to lower energy with increasing oligomer length.
The fluorescence lifetime (Figure 3.3) measured for the longer (n > 2)∗ EDOT oligomersin dichloromethane increases with increasing chain length from τ = 97 ps for H-3EDOT to586 ps for TMS-5EDOT (Table 3.1). The fluorescence quantum yield (φ) of the oligomersalso increases with chain length and as a consequence the radiative lifetimes τ/φ differ onlyslightly for the EDOT oligomers (Table 3.1).
Table 3.1 Fluorescence quantum yield φ, lifetime τ (ns), radiative lifetimes fromexperiment τ/φ (ns) and from the Strickler-Berg equation (τrad (ns)), and the tripletstate lifetime τ (T1) (µs) of EDOT oligomers.
Compound φ τ a τ/φ τ brad τ (T1)c
(ns) (ns) (ns) (µs)
H-3EDOT 0.06 0.097 1.6 2.84 230TMS-2EDOT 0.01 - - - 2500TMS-3EDOT 0.08 0.144 1.8 2.55 450TMS-4EDOT 0.17 0.259 1.5 2.37 148TMS-5EDOT 0.24 0.586 2.4 2.38 83d
a Measured in dichloromethane. b Determined using the Strickler-Berg equation. c Fromtime-dependent phosphorescence spectra at 80 K. d From triplet PIA spectra at 80 K.
∗ The excitation wavelength (400 nm) of the picosecond laser used in these experiment could not be used toexcite H-2EDOT and TMS-2EDOT

38 3.2 Results and Discussions
300 400 500 600
/nm
abso
rban
ce/a.u.
H-2EDOT
H-3EDOT
TMS-2EDOT
I/a.u.
TMS-3EDOT TMS-4EDOT
TMS-5EDOT
4.0 3.5 3.0 2.5E/eV
Figure 3.2 Normalized UV/Vis (O.D. ∼1) and fluorescence (O.D. ∼0.1) spectra of theEDOT oligomers in dichloromethane recorded at room temperature. For clarity thespectra are offset vertically.
The radiative lifetimes associated with the singlet state of the EDOT oligomers can alsobe estimated from the experimental absorption and fluorescence spectra using the Strickler-Berg equation for a non-degenerate excited state:192
1τrad= 2.880× 10⁹n2
〈ν−3f 〉−1av
∫ε d ln ν (3.1)
with
〈ν−3f 〉−1av =
∫I (ν) dν∫
ν−3 I (ν) dν(3.2)
in which n is the refractive index of the solvent, ε the molar absorption coefficient, and Ithe intensity of the fluorescence spectrum. The radiative lifetimes (τrad) estimated with theStrickler-Berg equation are collected in Table 3.1. These results agree only in the order ofmagnitude with the experimental τ/φ values, which is partly ascribed to the limited accuracyin determining φ. Despite the fact that the trends do not agree, the calculated values confirm
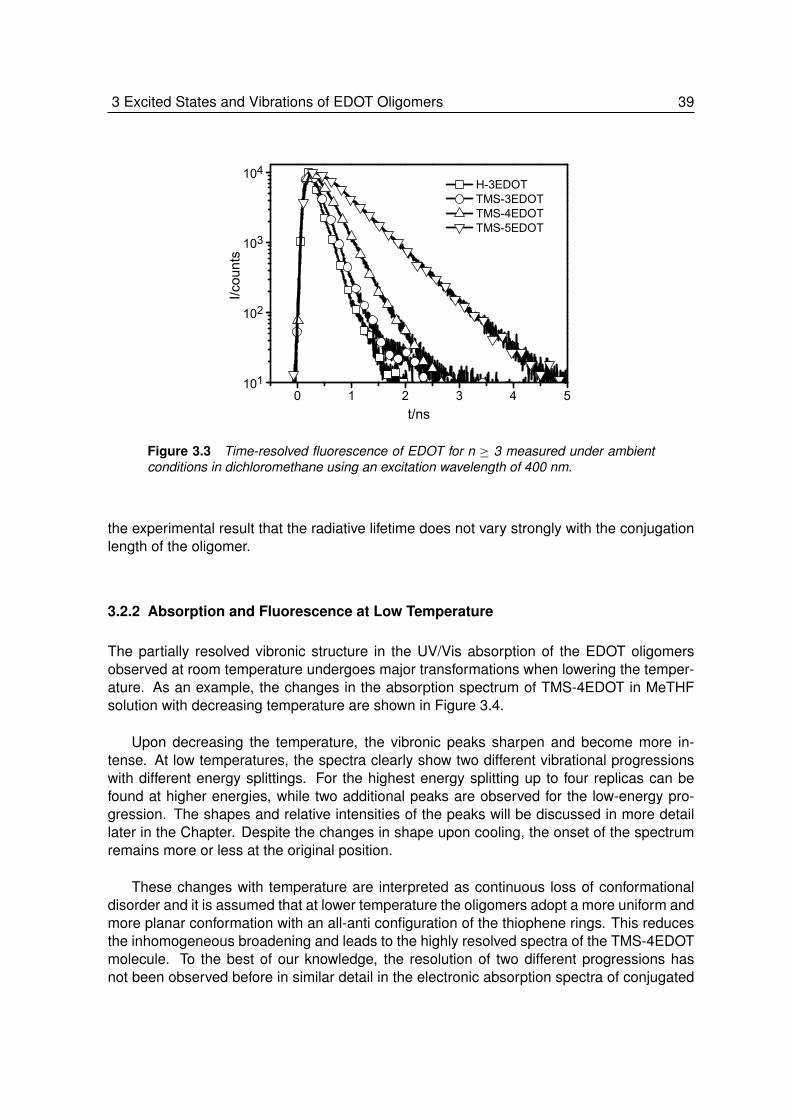
3 Excited States and Vibrations of EDOT Oligomers 39
101
102
103
104 H-3EDOT TMS-3EDOT TMS-4EDOT TMS-5EDOT
I/co
unts
t/ns0 1 2 3 4 5
Figure 3.3 Time-resolved fluorescence of EDOT for n ≥ 3 measured under ambientconditions in dichloromethane using an excitation wavelength of 400 nm.
the experimental result that the radiative lifetime does not vary strongly with the conjugationlength of the oligomer.
3.2.2 Absorption and Fluorescence at Low Temperature
The partially resolved vibronic structure in the UV/Vis absorption of the EDOT oligomersobserved at room temperature undergoes major transformations when lowering the temper-ature. As an example, the changes in the absorption spectrum of TMS-4EDOT in MeTHFsolution with decreasing temperature are shown in Figure 3.4.
Upon decreasing the temperature, the vibronic peaks sharpen and become more in-tense. At low temperatures, the spectra clearly show two different vibrational progressionswith different energy splittings. For the highest energy splitting up to four replicas can befound at higher energies, while two additional peaks are observed for the low-energy pro-gression. The shapes and relative intensities of the peaks will be discussed in more detaillater in the Chapter. Despite the changes in shape upon cooling, the onset of the spectrumremains more or less at the original position.
These changes with temperature are interpreted as continuous loss of conformationaldisorder and it is assumed that at lower temperature the oligomers adopt a more uniform andmore planar conformation with an all-anti configuration of the thiophene rings. This reducesthe inhomogeneous broadening and leads to the highly resolved spectra of the TMS-4EDOTmolecule. To the best of our knowledge, the resolution of two different progressions hasnot been observed before in similar detail in the electronic absorption spectra of conjugated
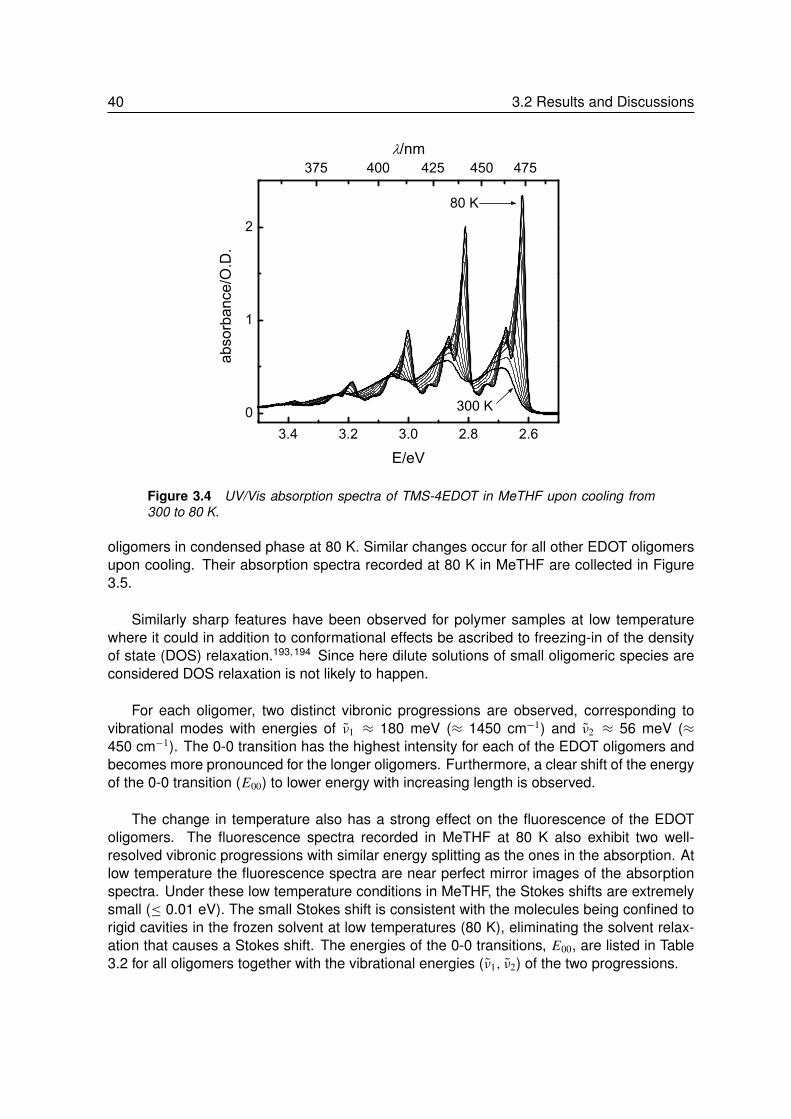
40 3.2 Results and Discussions
3.4 3.2 3.0 2.8 2.60
1
2
300 K
80 Kabsorbance/O
.D.
E/eV
375 400 425 450 475 /nm
Figure 3.4 UV/Vis absorption spectra of TMS-4EDOT in MeTHF upon cooling from300 to 80 K.
oligomers in condensed phase at 80 K. Similar changes occur for all other EDOT oligomersupon cooling. Their absorption spectra recorded at 80 K in MeTHF are collected in Figure3.5.
Similarly sharp features have been observed for polymer samples at low temperaturewhere it could in addition to conformational effects be ascribed to freezing-in of the densityof state (DOS) relaxation.193,194 Since here dilute solutions of small oligomeric species areconsidered DOS relaxation is not likely to happen.
For each oligomer, two distinct vibronic progressions are observed, corresponding tovibrational modes with energies of ν1 ≈ 180 meV (≈ 1450 cm−1) and ν2 ≈ 56 meV (≈450 cm−1). The 0-0 transition has the highest intensity for each of the EDOT oligomers andbecomes more pronounced for the longer oligomers. Furthermore, a clear shift of the energyof the 0-0 transition (E00) to lower energy with increasing length is observed.
The change in temperature also has a strong effect on the fluorescence of the EDOToligomers. The fluorescence spectra recorded in MeTHF at 80 K also exhibit two well-resolved vibronic progressions with similar energy splitting as the ones in the absorption. Atlow temperature the fluorescence spectra are near perfect mirror images of the absorptionspectra. Under these low temperature conditions in MeTHF, the Stokes shifts are extremelysmall (≤ 0.01 eV). The small Stokes shift is consistent with the molecules being confined torigid cavities in the frozen solvent at low temperatures (80 K), eliminating the solvent relax-ation that causes a Stokes shift. The energies of the 0-0 transitions, E00, are listed in Table3.2 for all oligomers together with the vibrational energies (ν1, ν2) of the two progressions.

3 Excited States and Vibrations of EDOT Oligomers 41
4.0 3.5 3.0 2.5 2.0
I/a.u.
abso
rban
ce/a.u.
E/eV
H-2EDOT
H-3EDOT
TMS-2EDOT
TMS-3EDOT TMS-4EDOT
TMS-5EDOT
300 350 400 450 500 550600
/nm
Figure 3.5 Normalized UV/Vis (O.D. ∼1) and fluorescence (O.D. ∼0.1) spectra ofEDOT oligomers in frozen MeTHF recorded at 80 K. For clarity the spectra are offsetvertically.
Table 3.2 Experimental 0-0 transition energies (E00, eV) of absorption, fluorescence, phosphorescence,and triplet-triplet absorption, the vibrational spacing (ν1, ν2, meV), line widths 0 (meV), and Huang-Rhysparameters (S1, S2) of the EDOT oligomers and the theoretical triplet state energies (EDFT, eV) from DFTcalculations.
Compound Absorption S1← S0 Fluorescence S1→S0
E00 ν1 ν2 0 S1 S2 E00 ν1 ν2 0 S1 S2(eV) (meV) (meV) (meV) (eV) (meV) (meV) (meV)
H-2EDOT 3.66 195 57 15 0.92 0.72 3.65 185 59 25 1.05 0.75H-3EDOT 3.05 194 56 14 0.89 0.52 3.04 180 51 20 0.98 0.45TMS-2EDOT 3.47 195 57 16 0.90 0.59 3.46 183 57 28 1.08 0.60TMS-3EDOT 2.93 194 55 13 0.86 0.45 2.93 183 55 25 0.78 0.40TMS-4EDOT 2.62 190 54 14 0.86 0.39 2.61 180 53 18 0.83 0.39TMS-5EDOT 2.42 188 54 17 0.80 0.30 2.41 182 49 15 0.68 0.32
Compound Phosphorescence T1→S0 Excited State Absorption Tn← T1
E00 EDFT ν1 ν2 0 S1 S2 E00 ν1 ν2 0 S1 S2(eV) (eV) (meV) (meV) (meV) (eV) (meV) (meV) (meV)
H-2EDOT 2.18 2.09 178 64 38 1.12 1.03 - - - - - -H-3EDOT 1.79 1.67 181 60 25 0.74 0.65 2.50 179 - - 0.36 -TMS-2EDOT 2.13 2.01 175 59 28 1.79 0.88 2.80 158 - - 0.36 -TMS-3EDOT 1.76 1.63 180 55 25 0.68 0.55 2.39 185 - - 0.35 -TMS-4EDOT 1.57 1.44 - 63 - - - 2.04 174 - - 0.38 -TMS-5EDOT 1.45 1.33 - - - - 1.84 196 74 16 0.20 0.10
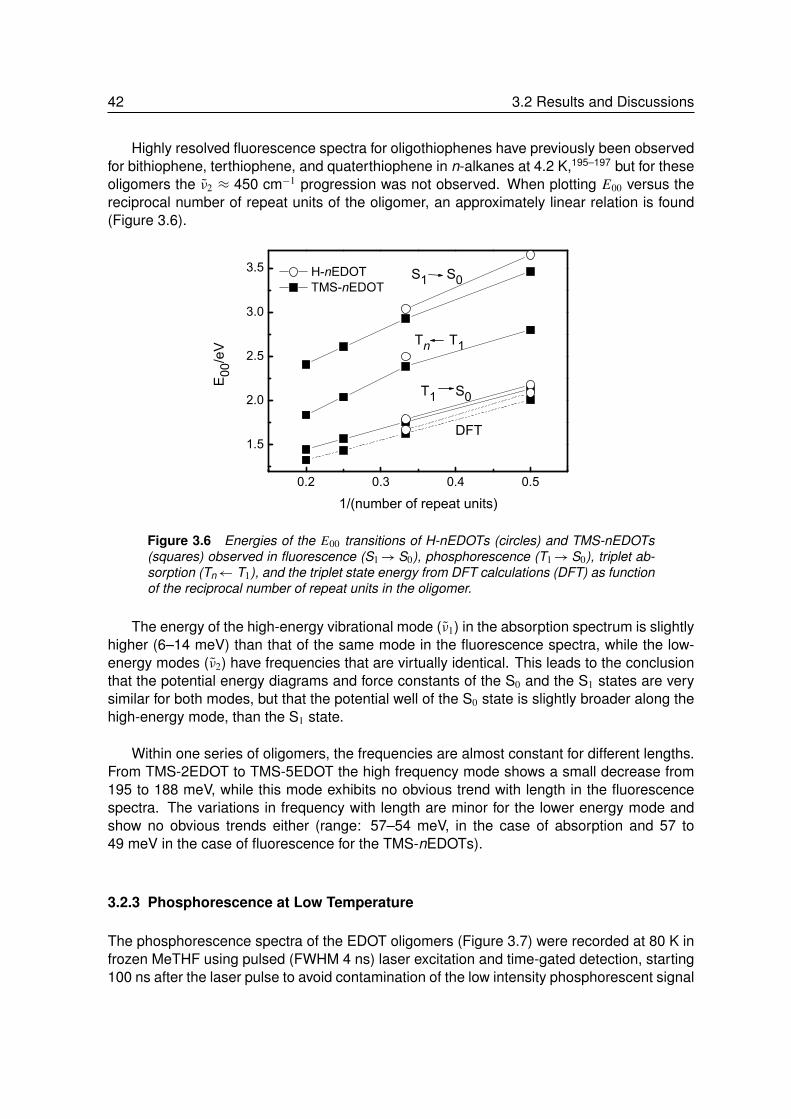
42 3.2 Results and Discussions
Highly resolved fluorescence spectra for oligothiophenes have previously been observedfor bithiophene, terthiophene, and quaterthiophene in n-alkanes at 4.2 K,195–197 but for theseoligomers the ν2 ≈ 450 cm−1 progression was not observed. When plotting E00 versus thereciprocal number of repeat units of the oligomer, an approximately linear relation is found(Figure 3.6).
0.2 0.3 0.4 0.5
1.5
2.0
2.5
3.0
3.5
DFT
Tn T1
T1 S0
S1 S0
E
00/e
V
1/(number of repeat units)
H-nEDOT TMS-nEDOT
Figure 3.6 Energies of the E00 transitions of H-nEDOTs (circles) and TMS-nEDOTs(squares) observed in fluorescence (S1→S0), phosphorescence (T1→S0), triplet ab-sorption (Tn← T1), and the triplet state energy from DFT calculations (DFT) as functionof the reciprocal number of repeat units in the oligomer.
The energy of the high-energy vibrational mode (ν1) in the absorption spectrum is slightlyhigher (6–14 meV) than that of the same mode in the fluorescence spectra, while the low-energy modes (ν2) have frequencies that are virtually identical. This leads to the conclusionthat the potential energy diagrams and force constants of the S0 and the S1 states are verysimilar for both modes, but that the potential well of the S0 state is slightly broader along thehigh-energy mode, than the S1 state.
Within one series of oligomers, the frequencies are almost constant for different lengths.From TMS-2EDOT to TMS-5EDOT the high frequency mode shows a small decrease from195 to 188 meV, while this mode exhibits no obvious trend with length in the fluorescencespectra. The variations in frequency with length are minor for the lower energy mode andshow no obvious trends either (range: 57–54 meV, in the case of absorption and 57 to49 meV in the case of fluorescence for the TMS-nEDOTs).
3.2.3 Phosphorescence at Low Temperature
The phosphorescence spectra of the EDOT oligomers (Figure 3.7) were recorded at 80 K infrozen MeTHF using pulsed (FWHM 4 ns) laser excitation and time-gated detection, starting100 ns after the laser pulse to avoid contamination of the low intensity phosphorescent signal
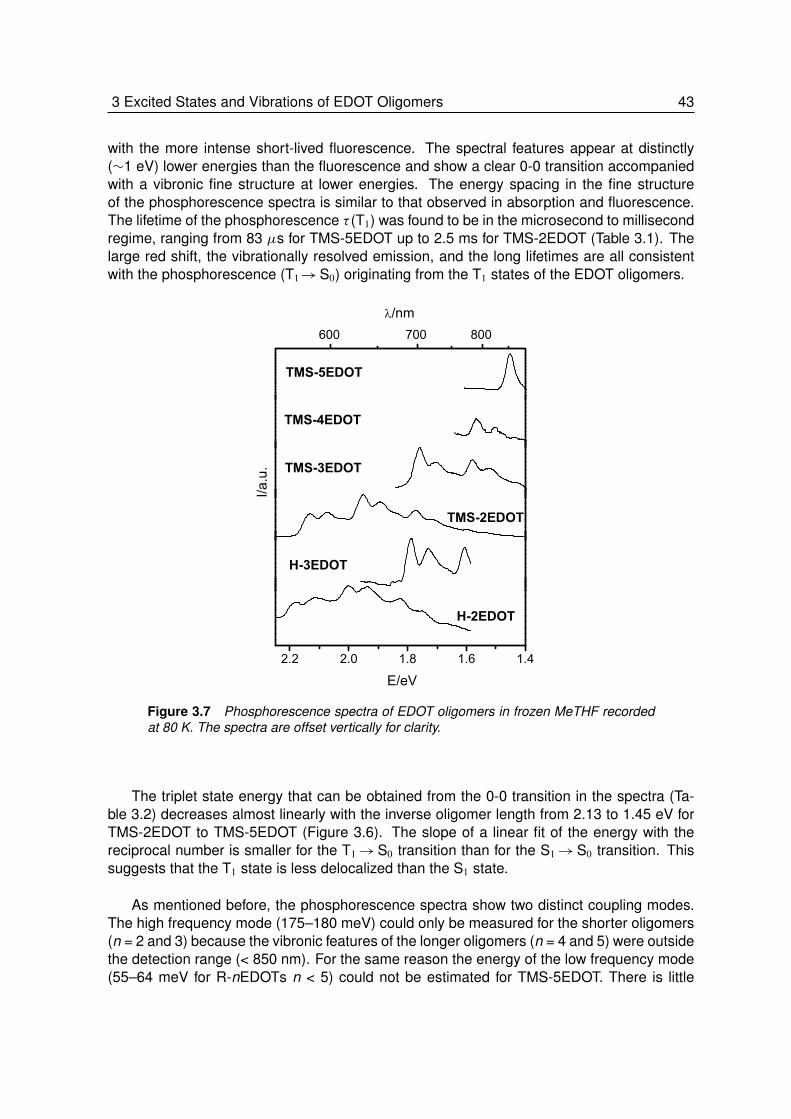
3 Excited States and Vibrations of EDOT Oligomers 43
with the more intense short-lived fluorescence. The spectral features appear at distinctly(∼1 eV) lower energies than the fluorescence and show a clear 0-0 transition accompaniedwith a vibronic fine structure at lower energies. The energy spacing in the fine structureof the phosphorescence spectra is similar to that observed in absorption and fluorescence.The lifetime of the phosphorescence τ (T1) was found to be in the microsecond to millisecondregime, ranging from 83 µs for TMS-5EDOT up to 2.5 ms for TMS-2EDOT (Table 3.1). Thelarge red shift, the vibrationally resolved emission, and the long lifetimes are all consistentwith the phosphorescence (T1→S0) originating from the T1 states of the EDOT oligomers.
2.2 2.0 1.8 1.6 1.4
E/eV
I/a.u.
H-3EDOT
TMS-3EDOT
TMS-4EDOT
TMS-5EDOT
H-2EDOT
TMS-2EDOT
600 700 800
/nm
Figure 3.7 Phosphorescence spectra of EDOT oligomers in frozen MeTHF recordedat 80 K. The spectra are offset vertically for clarity.
The triplet state energy that can be obtained from the 0-0 transition in the spectra (Ta-ble 3.2) decreases almost linearly with the inverse oligomer length from 2.13 to 1.45 eV forTMS-2EDOT to TMS-5EDOT (Figure 3.6). The slope of a linear fit of the energy with thereciprocal number is smaller for the T1→S0 transition than for the S1→S0 transition. Thissuggests that the T1 state is less delocalized than the S1 state.
As mentioned before, the phosphorescence spectra show two distinct coupling modes.The high frequency mode (175–180 meV) could only be measured for the shorter oligomers(n = 2 and 3) because the vibronic features of the longer oligomers (n = 4 and 5) were outsidethe detection range (< 850 nm). For the same reason the energy of the low frequency mode(55–64 meV for R-nEDOTs n < 5) could not be estimated for TMS-5EDOT. There is little

44 3.2 Results and Discussions
variation among these values for the different molecules and there is no clear dependenceon the length of the oligomer.
3.2.4 Triplet-Triplet Absorption at Low Temperature
Transient photoinduced absorption (PIA) spectra of the EDOT oligomers in frozen MeTHFwere recorded using pulsed (FWHM 4 ns) laser excitation and gated detection of continuouswhite probe light at 80 K (Figure 3.8).
3.2 3.0 2.8 2.6 2.4 2.2 2.0 1.8 1.6
E/eV
I/a.u.
H-3EDOT
TMS-3EDOT
TMS-4EDOT
TMS-5EDOT
TMS-2EDOT
400 500 600 700 800/nm
Figure 3.8 Normalized transient photoinduced absorption spectra (-1T/T ) of theEDOT oligomers in frozen MeTHF (O.D. ∼1) recorded at 80 K. For TMS-5EDOT spectrarecorded by transient (solid line) and near steady state (dashed line) setups are shown.For details concerning the two setups see Experimental Part. The spectra are offsetvertically for clarity.
The PIA spectra show a strong band that can be associated with the Tn ← T1 transi-tion of the triplet state. The 0-0 transition can be clearly discerned at the red edge in thePIA spectra and its position decreases with increasing oligomer length from TMS-2EDOT at2.80 eV to TMS-5EDOT at 1.84 eV. The energy of the Tn← T1 transition shows a reciprocaldependence on the number of repeat units as displayed in Figure 3.6. Some vibrational finestructure is apparent in the triplet absorption spectra, although less resolved than observedin the linear absorption and emission spectra. Consequently, only the high-energy vibra-tional splitting (∼170 meV, Table 3.2) can be seen. The second, low-energy, mode is only

3 Excited States and Vibrations of EDOT Oligomers 45
discernable for TMS-5EDOT and is about 70 meV. The energies of these two modes aresimilar to those found for ground state and singlet excited state, suggesting that in all casessimilar vibrational modes couple to each of the electronic transitions.
3.2.5 Vibrational Spectroscopy
In the previous sections it was shown that at 80 K in frozen MeTHF each of the EDOToligomers show S1← S0, S1 →S0, T1 →S0 and Tn ← T1 transitions exhibiting vibrationalfine structure indicating coupling of these electronic transition to two vibrational modes. Theenergies associated with these modes are similar in each of the spectra. In this section, thevibrational fine structure will be analyzed in more detail and compared to vibrational spectrarecorded with FT-IR and FT-Raman techniques.
The discussion will be focused on the fine structure in the fluorescence spectra be-cause these are highly resolved and the vibrational modes in fluorescence correspond tothe potential energy diagram of the ground state and can thus be compared to IR and Ra-man spectroscopy. The energies of the two modes are 182.5±2.5 meV (1472±20 cm−1)and 54±5 meV (435±40 cm−1) (Table 3.2). The ∼1450 cm−1 mode has been observedin many different types of π -conjugated systems and is generally assigned to a symmetricC=C stretching mode. The low-energy mode has an energy that places it in the regime ofdeformational/torsional modes.
To study the vibrations in more detail, the FT-Raman and FT-IR spectra of the EDOToligomers were recorded. For FT-IR, the oligomers were dispersed in KBr pellets, whileFT-Raman spectra were obtained with 1064 nm excitation on powdered samples. The vi-brational spectra were recorded at room temperature and are shown in Figure 3.9 and 3.10for the high and low-energy regimes, respectively. Qualitatively, most of the features in thevibrational spectra are consistent with those previously observed for α, α′ end capped oligo-thiophenes.198–204
In the high wavenumber region (Figure 3.9), the FT-IR spectra show three vibrations atapproximately 1360, 1430, 1462 cm−1. Their positions are almost invariant with the length ofthe oligomer but for H-2EDOT and H-3EDOT the last two modes appear at slightly (6-9 cm−1)higher wavenumbers. The FT-Raman spectra are more complex and exhibit bands whosepositions and shapes shift more strongly with oligomer length and nature of the end group.For the two transitions at ∼1437 and ∼1455 cm−1, the positions are (in first approximation)fairly constant among the different EDOT oligomers. Two other transitions, at higher energies(1478–1512 cm−1 and 1549–1598 cm−1) clearly show more dispersion.
The FT-IR spectra show a large number of transitions in the low wavenumber region(Figure 3.10). In the region of interest (400–500 cm−1), the FT-IR spectra show a strongband at 451 cm−1 for the TMS-functionalized oligomers but not for the hydrogen terminatedderivatives that show a transition at 410 cm−1. Two additional bands associated with theTMS groups are at 630 and 755 cm−1. In contrast, the Raman spectra do show a distinctband at ∼440 cm−1 that is close to low-energy progression observed in the fluorescence

46 3.2 Results and Discussions
1600 1500 1400 1300 1200
I/a.u.
H-2EDOT
H-3EDOT
TMS-2EDOT
TMS-3EDOT
DFT Raman
/cm-1
TMS-4EDOT
TMS-5EDOT
1600 1500 1400 1300 1200
TMS-5EDOT
TMS-4EDOT
TMS-3EDOT
TMS-2EDOT
H-3EDOT
H-2EDOT
FT-Raman
/cm-1
I/a.u
.
1600 1500 1400 1300 1200
DFT IR
TMS-2EDOT
TMS-5EDOT
H-2EDOT
H-3EDOT
TMS-3EDOT
/cm-1
TMS-4EDOT
I/a.u
.
1600 1500 1400 1300 1200
TMS-5EDOT
TMS-4EDOT
TMS-3EDOT
TMS-2EDOT
H-3EDOT
H-2EDOT
/cm-1
I/a.u
.
FT-IR
Figure 3.9 Experimental and theoretical (DFT) IR and Raman spectra of solid sam-ples of EDOT oligomers at room temperature in the 1200–1700 cm−1 range. Thewavenumbers in the DFT spectra have been corrected by multiplying by 0.96.205

3 Excited States and Vibrations of EDOT Oligomers 47
800 700 600 500 400 300 200
DFT Raman
I/a.u
.
H-2EDOT
H-3EDOT
TMS-2EDOT
TMS-3EDOT
/cm-1
TMS-4EDOT
TMS-5EDOT
800 700 600 500 400 300 200 /cm-1
I/a.u
.
FT-Raman
H-2EDOT
H-3EDOT
TMS-2EDOT
TMS-3EDOT
TMS-4EDOT
TMS-5EDOT
800 700 600 500 400 300 200
DFT IR
TMS-6EDOT
TMS-5EDOT
TMS-4EDOT
TMS-3EDOT
H-2EDOT
H-3EDOT
/cm-1
I/a.u
.
800 700 600 500 400 300 200
FT-IR
/cm-1
I/a.u
.
TMS-2EDOT
TMS-5EDOT
TMS-4EDOT
TMS-3EDOT
H-3EDOT
H-2EDOT
Figure 3.10 Experimental and theoretical (DFT) IR and Raman spectra of solid sam-ples of EDOT oligomers at room temperature in the 200–800 cm−1 range. Thewavenumbers of the DFT spectra have been corrected by multiplying by 0.96.205

48 3.2 Results and Discussions
spectra of both types of EDOT oligomers.
3.2.6 Theoretical Calculations
Quantum-chemical calculations can provide additional information on the EDOT oligomers.Density functional theory (DFT) has been used to describe the geometric and electronicstructures in the S0 singlet ground state and T1 triplet excited state. A potential includingboth Becke and Hartree-Fock exchange and Lee Yang and Parr correlation (B3LYP) and asplit-valence 6-31G* basis set have been used to optimize the S0 and T1 geometries of allEDOT oligomers.206
The T1-S0 energies obtained from the DFT calculations (Table 3.2) are in excellent agree-ment with the experimental values from the phosphorescence spectra (subject to a system-atic deviation of ∼0.12 eV) and reproduce the experimental chain length dependence accu-rately (Figure 3.6).
When using optimized S0 and T1 geometries, the energy of the T1 state correspondsto the energy difference between the minima of the potential energy surfaces, while theexperimental 0-0 transition corresponds to the difference between the zero-point energies(ZPEs) of the two states. Since the dominant vibrational modes and frequencies are similarfor the singlet and triplet manifold, the error introduced by neglecting the vibrational effectsis likely to be smaller than the observed differences.
C=C C-C C=C C-C C=C C-C C=C
-0.05
0.00
0.05
bond
bond
-0.05
0.00
0.05
C-S S-C C-C C-S S-C
Bon
d leng
th/Å
Figure 3.11 Change in bond length (1Bond length) between the S0 and T1 statesalong the sulfur atoms (top) and along the π -conjugated part (bottom) of the backboneof the H-2EDOT oligomer obtained from DFT geometry optimization.
The optimized geometries are very similar for all EDOTs in both electronic states. All

3 Excited States and Vibrations of EDOT Oligomers 49
thiophene rings, including the two oxygen atoms, are essentially coplanar within < 1 degreeaccuracy. The ethylene bridges have dihedral angles (O-C-C-O) of ∼60 degrees. The onlysignificant differences between S0 and T1 geometry occur for the bond lengths within andbetween the thiophene rings. All C-S bond lengths increase by a few picometers in the T1
state compared to the S0 ground state (shown in Figure 3.11 for H-2EDOT).
For the C-C and C=C bonds of the thiophene rings, the changes in bond length reflect atransition of the ring from an aromatic to quinoid configuration in the T1 state by a lengtheningof the C=C and a contraction of the C-C bonds (Figure 3.11). These changes are morepronounced for the smaller oligomers than for the longer ones. In the longer oligomers, thetriplet state exciton is more easily accommodated and delocalized over more rings makinggeometry changes per ring smaller.
The harmonic frequency analysis of the singlet ground state of the EDOT oligomers intheir DFT optimized geometries allowed determining the IR and Raman vibrational frequen-cies and intensities. The theoretical spectra are shown next to the experimental spectra forthe high and low wavenumber regimes in Figure 3.9 and 3.10, respectively, and reveal a goodcorrespondence of the most salient features. The calculated wavenumbers were correctedby a factor of 0.96.205
The calculations can be used to assign the vibrational fine structure observed in thefluorescence spectra to specific modes. To appear in the electronic spectra, the couplingmode must be fully symmetric within the molecule’s point group assuming that the symmetryin ground and excited state is the same. In an all-anti conformation, the EDOTs belongto the C2v (for n odd) or the C2h (for n even) point groups and vibrations must be of A1 orAg symmetry. As can be seen in the theoretical Raman spectra at least two bands withconsiderable intensity are present in the high-energy region (1400–1500 cm−1).
Table 3.3 Experimental energy spacing ν1 and ν2 (cm−1) from the fluorescence spectra andfrom DFT Raman spectra together with the irreducible representation of the normal mode 0(Qk)
in the point group of the molecules.
Compound Point Group Fluorescence DFT Calculations
ν1 ν2 ν1 0(Q1) ν2 0(Q2)(cm−1) (cm−1) (cm−1) (cm−1)
H-2EDOT C2h 1490 480 1507 Ag 435 Ag
H-3EDOT C2v 1450 410 1506 A1 431 A1
TMS-2EDOT C2h 1480 460 1476 Ag 427 Ag
TMS-3EDOT C2v 1480 440 1484 A1 427 A1
TMS-4EDOT C2h 1450 430 1488 Ag 426 Ag
TMS-5EDOT C2v 1470 400 1490 A1 426 A1
One of the bands that has the required A1 or Ag symmetry is invariably found at

50 3.2 Results and Discussions
1422±1 cm−1 for all EDOT oligomers. A second band (1476–1506 cm−1) shows somedispersion with oligomer length. The vibrational frequencies of this last band are listed (ν1,Table 3.3) for each of the oligomers and show generally good correspondence to the vibroniccoupling in the fluorescence spectra. The DFT calculations identified this mode as being fullysymmetric (A1 or Ag) and involving mainly bond stretching modes in the thiophene rings. Theoverall mode represents a displacement of atoms along a coordinate that can be identifiedwith the transformation of an aromatic structure into a quinoid structure, which is expectedto couple strongly to the electronic transitions.
For the low-energy vibration regime (400–500 cm−1) a distinct band at 430±5 cm−1 in thetheoretical Raman spectra is associated with a fully symmetric (A1 or Ag) mode. Its energyis similar to the low-energy vibronic spacing 440±40 cm−1 observed in the fluorescencespectra. Based on this correspondence the second progression in the fluorescence spectrais assigned to be associated with this particular mode. The displacement vectors obtainedfrom the DFT calculations show that for all EDOT oligomers this normal mode involves adeformation of the bond angles within the thiophene rings and a change of C-S bond lengths.The changing bond angles directly influence the hybridization of the conjugated chain andit is conjectured that this causes the strong coupling to the electronic transition. There isanother indication that points to this mode as being important to electronic excitations. Thedeformation caused by this mode resembles the deformation found when comparing singletand triplet ground state geometries in e.g. the H-2EDOT (Figure 3.11).
3.2.7 Energy and Geometry Relaxation in the Excited State
The intensity In of a transition between the vibrational ground state in the initial electronicstate and the nth vibrational level in the final electronic state is governed by the square of theFranck-Condon overlap:
In = 〈υ0|υn〉2 (3.3)
with υ the vibrational wave function. In the harmonic approximation, the intensity can alsobe expressed in terms of the Huang-Rhys factor S as a Poisson distribution PS(n) over thevibronic levels:
In = PS(n) =e−S Sn
n!(3.4)
Within this formalism, the band shape of the low-temperature electronic spectra can beanalyzed in more detail using Equation 3.5, which simulates the spectrum as a sum over theLorentzian-shaped vibrational peaks of both experimentally observed progressions.
I (E) = c∑
m
∑n
0
(E − E00 ∓ mν1 ∓ mν2)2 + 02(
Im
Im=0)(
In
In=0) (3.5)

3 Excited States and Vibrations of EDOT Oligomers 51
In Equation 3.5 the sums run over all peaks m and n of both progressions, 0 is the linebroadening parameter, ν1 and ν2 are the energies of the two vibrational modes, and - or +signs refer to absorption and emission spectra, respectively. Im and In are determined by theHuang-Rhys parameters (S1 and S2) of the two modes according to:
Imn = Im × In =e−S1 Sm
1
m!e−S2 Sn
2
n!(3.6)
Equation 3.5 has been used to determine the Huang-Rhys parameters S1 and S2 by ad-justing I (E) to the experimental spectra. Even for single values of 0, ν1 and ν2, the simulatedspectra follow the experimental spectra fairly well (see e.g. Figure 3.12) although significantdeviation still exists at the onset and in some of the peak intensities. The increasing widthof the higher vibronic peaks in the low-energy progression suggest that deviations, whichoriginate from additional modes, that are not accounted for in Equation 3.5, contribute to thewidth of experimental spectra. The values for S1 and S2 resulting from the fits have beencollected in Table 3.2 for each of the S1← S0, S1→S0, T1→S0 and Tn← T1 spectra.
0.0
0.5
1.0
1.5
3.6 3.4 3.2 3 2.8
Experimental absorption spectrum
abs
orba
nce/
O.D.
TMS-3EDOT
/nm
E/eV
350 375 400 425
Simulated absorption spectrum
Figure 3.12 UV/Vis spectrum of TMS-3EDOT at 80 K and under inert atmosphere infrozen MeTHF and a simulation of the data using Equation 3.5.
Using the experimental Huang-Rhys parameters, information about the relaxation energyand the geometric changes associated with an electronic transition can be obtained. Therelaxation energy, defined as the loss of vibrational energy in the final state after a verticaltransition from the initial state, is directly related to the Huang-Rhys parameter via:
Erel = Sν (3.7)
52 3.2 Results and Discussions
In addition, the Huang-Rhys parameter is related to the dimensionless displacement 1Qof the minima of the potential energy curve along the normal coordinate Q upon electronicexcitation according to:207
S =(1Q)2
2(3.8)
Since 1Q is dimensionless, it gives a displacement relative to the zero-point motion thatcan be compared in different systems. Table 3.2 shows that the Huang-Rhys parametersassociated with both modes decrease with increasing chain length for each of the differentelectronic transitions. For the longer oligomers the intensities of the transitions involvinghigher vibrational levels are suppressed compared to the 0-0 transition.
This demonstrates that the vibrational relaxation energy associated with both modesdecreases for longer oligomers. The trend that the maximum of the vibrational envelopeshifts towards the 0-0 transition indicates that the electronic transitions cause less geometricdistortion in the larger molecules than in shorter ones. This trend occurs for each of the S1←
S0, S1→S0, T1→S0 and Tn← T1 transitions, albeit to a different degree and is interpretedin terms of a more extended delocalization of the excitation for the longer oligomers.
For the absorption (S1← S0) spectra, S1 decreases from 0.92 for H-2EDOT to 0.80 forTMS-5EDOT, while S2 is lowered from 0.72 to 0.30. This reveals that the low-energy vi-brational mode becomes less frequently excited for longer oligomers. The experimentalHuang-Rhys parameters for the fluorescence (S1 →S0) spectra (1.05 ≥ S1 ≥ 0.68 and0.75 ≥ S2 ≥ 0.32) are very similar to those in the absorption, consistent with the fact thatthe same electronic states are involved. For the phosphorescence (T1→S0) spectra bothHuang-Rhys parameters for the H-2EDOT oligomer (S1 = 1.12; S2 = 1.03) are much largerthan for the H-3EDOT oligomer (S1 = 0.74; S2 = 0.65), with similarly large differences betweenTMS-2EDOT and TMS-3EDOT. This indicates an appreciable excitation of both vibrationalmodes for the shorter oligomers and a larger displacement1Q between the T1 and S0 states.
These findings are corroborated by DFT calculations that reveal stronger geometry relax-ation in the T1 state for the shorter oligomers. Unfortunately, the detection limit (≤ 850 nm)precludes determining the corresponding Huang-Rhys factors from the phosphorescencespectra for the two longest oligomers. It should be noted, however, that vibronic coupling inthe triplet manifold along with spin-orbit coupling can introduce vibrationally induced intensi-ties in the phosphorescence spectra, complicating this analysis.208–211 Finally, in the Tn←
T1 spectra, the Huang-Rhys parameter for the high energy mode (0.38 ≥ S1 ≥ 0.20) is muchless than for any of the other electronic transitions. The same result has been observedpreviously, e.g. in the Tn← T1 spectra of p-phenylene vinylene oligomers,185 and seems tobe a general property of π -conjugated oligomers. It signifies that the geometry relaxation fortransitions between T1 and the dipole-coupled Tn state are minimal.
The above analysis shows that both coupling modes exhibit rather similar trends withconjugation length and that the low-energy mode yields consistently smaller Huang-Rhysparameters than the high-energy mode. Hence, in the S1 and T1 states, larger distortions
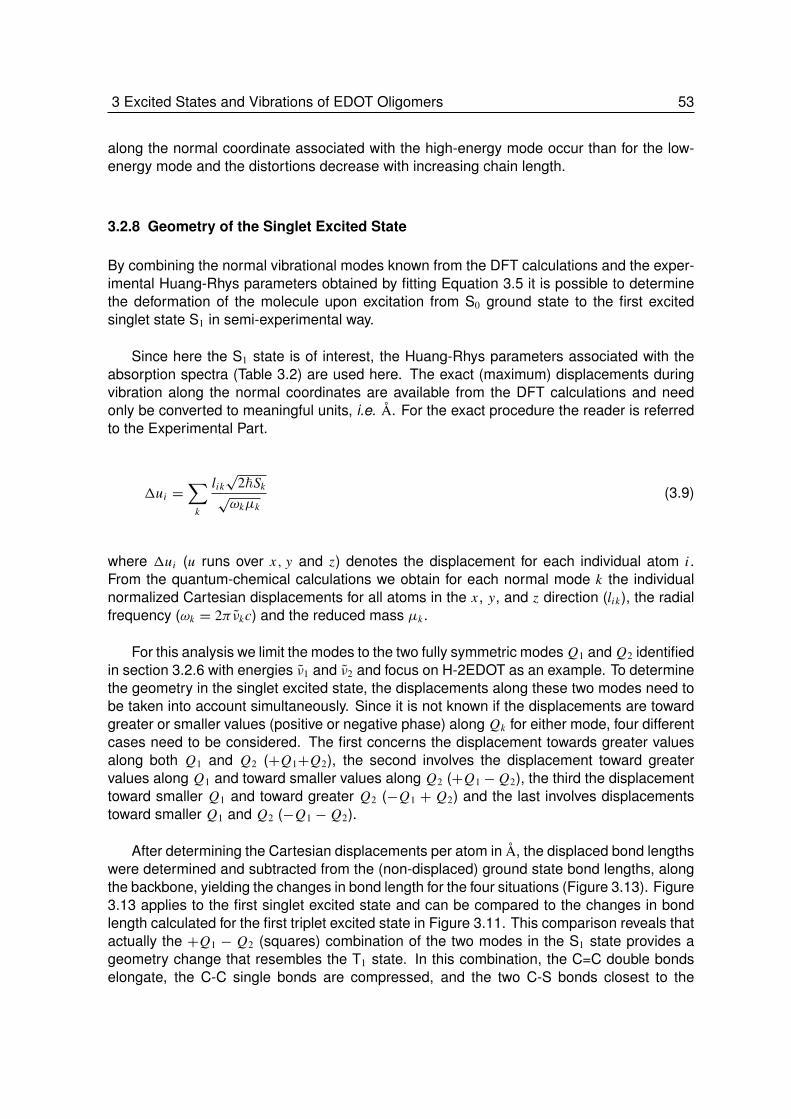
3 Excited States and Vibrations of EDOT Oligomers 53
along the normal coordinate associated with the high-energy mode occur than for the low-energy mode and the distortions decrease with increasing chain length.
3.2.8 Geometry of the Singlet Excited State
By combining the normal vibrational modes known from the DFT calculations and the exper-imental Huang-Rhys parameters obtained by fitting Equation 3.5 it is possible to determinethe deformation of the molecule upon excitation from S0 ground state to the first excitedsinglet state S1 in semi-experimental way.
Since here the S1 state is of interest, the Huang-Rhys parameters associated with theabsorption spectra (Table 3.2) are used here. The exact (maximum) displacements duringvibration along the normal coordinates are available from the DFT calculations and needonly be converted to meaningful units, i.e. Å. For the exact procedure the reader is referredto the Experimental Part.
1ui =∑
k
lik√
2~Sk√ωkµk
(3.9)
where 1ui (u runs over x, y and z) denotes the displacement for each individual atom i .From the quantum-chemical calculations we obtain for each normal mode k the individualnormalized Cartesian displacements for all atoms in the x , y, and z direction (lik), the radialfrequency (ωk = 2πνkc) and the reduced mass µk .
For this analysis we limit the modes to the two fully symmetric modes Q1 and Q2 identifiedin section 3.2.6 with energies ν1 and ν2 and focus on H-2EDOT as an example. To determinethe geometry in the singlet excited state, the displacements along these two modes need tobe taken into account simultaneously. Since it is not known if the displacements are towardgreater or smaller values (positive or negative phase) along Qk for either mode, four differentcases need to be considered. The first concerns the displacement towards greater valuesalong both Q1 and Q2 (+Q1+Q2), the second involves the displacement toward greatervalues along Q1 and toward smaller values along Q2 (+Q1− Q2), the third the displacementtoward smaller Q1 and toward greater Q2 (−Q1 + Q2) and the last involves displacementstoward smaller Q1 and Q2 (−Q1 − Q2).
After determining the Cartesian displacements per atom in Å, the displaced bond lengthswere determined and subtracted from the (non-displaced) ground state bond lengths, alongthe backbone, yielding the changes in bond length for the four situations (Figure 3.13). Figure3.13 applies to the first singlet excited state and can be compared to the changes in bondlength calculated for the first triplet excited state in Figure 3.11. This comparison reveals thatactually the +Q1 − Q2 (squares) combination of the two modes in the S1 state provides ageometry change that resembles the T1 state. In this combination, the C=C double bondselongate, the C-C single bonds are compressed, and the two C-S bonds closest to the
54 3.3 Summary and Conclusion
C=C C-C C=C C-C C=C C-C C=C
-0.04
-0.02
0.00
0.02
0.04
-0.04
-0.02
0.00
0.02
0.04
C-S S-C C-C C-S S-Cbond
bond
phase +/- phase -/+ phase +/+ phase -/-
Bon
d leng
th/Å
Figure 3.13 Changes in bond length (Å) for geometry deformation following the differ-ently phased combinations of the two normal modes Q1 and Q2 for H-2EDOT along thealternating single and double bonds of the backbone (bottom) and along the backbonevia the sulfur atoms (top).
center of the molecule elongate (Figure 3.13). The other three combinations show lesscorrespondence with Figure 3.11.
The maximum change in bond length in the S1 state for this combination amounts to-4 pm for the central C-C bond which is of the same order of magnitude, but less than thevalue of -8 pm for the same bond of H-2EDOT in the T1 state derived from the DFT calcu-lations. The larger geometry deformation of H-2EDOT in the T1 state than in the S1 stateinferred from this analysis is reflected in the fact that the Huang-Rhys parameters of bothmodes are larger in the phosphorescence spectra (S1 = 1.12; S2 = 1.03) indicating a strongerdeformation than for the fluorescence (S1 = 1.05; S2 = 0.75), although the former may beaffected by unknown contributions from vibronic coupling in the triplet manifold along withspin-orbit coupling influencing the intensity of the peaks in the vibrational progression.208–211
3.3 Summary and Conclusion
The photophyiscal properties of a series of EDOT oligomers with up to five repeat unitshave been studied using absorption, fluorescence, phosphorescence, and triplet-state ab-sorption as well as IR and Raman spectroscopy. At low temperature in MeTHF, the EDOToligomers undergo conformational relaxation to a more uniform and planar structure. As a

3 Excited States and Vibrations of EDOT Oligomers 55
consequence, the optical spectra of the EDOT oligomers show highly resolved fine structureindicating coupling to two different vibrational modes. The vibrational energies associatedwith the two vibrational progressions are very similar for each of the S1← S0, S1 →S0,T1→S0 and Tn← T1 electronic transitions studied and amount to ν1 = 180±20 meV andν2 = 50±20 meV, respectively.
By comparing the vibronic coupling observed in the electronic spectra with experimentaland theoretical DFT-based vibrational spectra, the coupling vibrations could be assigned tofully symmetric (A1 and Ag) normal modes. The high-energy mode is associated with thewell-known carbon-carbon bond stretch vibration that represents displacements analogousto the aromatic-to-quinoid deformation of rings and inter ring bonds. The low-energy modeinvolves a deformation of the bond angles within the thiophene rings and a change of C-Sbond lengths.
The 0-0 bands of the S1← S0, S1→S0, T1→S0 and Tn← T1 transitions shift to lowerenergy with increasing length of the oligomer in a linear fashion with the inverse numberof repeat units. The energy of the triplet state obtained from the phosphorescence spectracould be reproduced (subject to a systematic deviation of 0.12 eV) by quantum-chemicalDFT calculations starting from singlet geometry-optimized structures. In the T1 state, theoptimized geometry of the EDOT oligomers shows changes in bond length compared to theoptimized geometry of the S1 state that point to an increase in quinoid character.
By analyzing the shape of the vibronic progressions in the spectra, the Huang-Rhys para-meters S1 and S2 associated with the electronic transitions were obtained. It is found that S2
is smaller than S1 and that both S1 and S2 exhibit a downward trend with conjugation length.Hence in the S1 and T1 states, larger distortions along the normal coordinate associatedwith the high-energy mode occur than for the low-energy mode and the amount of distortiondecreases with increasing chain length. For H-2EDOT, the Huang-Rhys parameters deter-mined from the experiment were combined with the normal modes from the DFT calculationsto semi-experimentally predict the geometry in the S1 state. The results indicate a maximumchange in bond length in the S1 state of -4 pm for the central C-C bond, which is half of thevalue of -8 pm for the same bond in the T1 state as inferred from the DFT calculations.
Experimental Part
The synthesis and full characterization of the EDOTs used in this study has been describedelsewhere.190
2-Methyltetrahydrofuran (MeTHF) was pre-dried over KOH for 3 days, filtered, distilledfrom CaH2, and stored under inert atmosphere. Sample solutions in MeTHF were preparedin a nitrogen-filled glove box at concentrations between 10−5 and 10−7 M. These sampleswere kept under inert atmosphere. Low temperature spectra were recorded using an OxfordOptistat CF continuous flow cryostat or an Oxford Optistat DN bath cryostat. Samples forroom temperature measurements in dichloromethane were prepared under ambient condi-
56 Experimental Part
tions. For photoluminescence spectra the optical density was less than 0.1.
UV/Vis and fluorescence spectra were recorded using a Perkin Elmer Lambda 900 andan Edinburgh Instruments FS920 spectrophotometer, respectively. Fluorescence quantumyields were determined by comparing the fluorescence intensity with those of suitable stan-dards: 9,10-diphenylanthracene in cyclohexane for TMS-3EDOT and H-3EDOT, 2-amino-pyridine in 0.1 N H2SO4 for TMS-2EDOT, and fluorescein in 0.1 M NaOH for the TMS-4EDOT and TMS-5EDOT. Time-correlated single photon counting (TCSPC) experimentswere performed on an Edinburgh Instruments LifeSpec-PS spectrometer by photoexcita-tion at 400 nm with a picosecond-pulse laser (PicoQuant PDL 800B) operated at 2.5 MHzand using a Peltier-cooled Hamamatsu microchannel plate photomultiplier (R3809U-50) fordetection.
Phosphorescence was recorded using gated detection. A pulsed Nd:YAG laser (SureliteII-10, Continuum, FWHM 4 ns, 10 Hz) was used for excitation combined with an opticalparametric oscillator (Panther OPO, Continuum) to tune the excitation energy. Spectra wererecorded with an intensified CCD camera (PI-MAX:1024HQ, Princeton Instruments) afterdispersion of the phosphorescent light by a spectrograph at delay times of >100 ns and gatewidths of 0.1-2 ms, to minimize residual fluorescence. All phosphorescence spectra weresmoothed (adjacent averaging). Phosphorescent lifetimes were determined by analyzingthe change in intensity upon changing the delay time.
Two different spectrometers were used to record PIA spectra. The first operated in thenanosecond regime and used the same setup as employed for phosphorescence measure-ments incorporating an additional tungsten-halogen lamp as a white-light probe. The probelight transmission was recorded with (T ) and without pump laser (T0) using gated detection.The difference between the two spectra afforded the PIA spectrum (−1T
T = −(T−T0)
T0)
The second spectrometer records near steady-state PIA by excitation of the sample witha mechanically modulated (77 Hz) cw argon ion laser (tuned to a λex of 351 and 362 nm) andmeasuring the change in transmission (1T ) of a tungsten-halogen white light probe beamthrough the sample between 1.0 and 3.5 eV. Si and InGaAs detectors, and a phase sensitivelock-in amplifier referenced to the modulation frequency were used to record1T after disper-sion of the probe light in a monochromator. The excitation power was typically 30 mW witha beam diameter of 2 mm. The PIA signal (−1T
T ) was corrected for the photoluminescence,which was recorded in a separate experiment.
FT-Raman spectra were recorded on solid samples under ambient conditions using aRFS/100 FT-Raman spectrometer containing a cw-Nd:YAG laser for excitation at 1064 nmand a liquid N2-cooled InGaAs detector. The resolution was set to 2 cm−1 and the range wasset to 4000 cm−1 to 50 cm−1. Excitation power was kept between 30 and 50 mW. All spectrawere averaged between 100 and 1000 times.
FT-IR spectra were taken on KBr pellets using a Perkin Elmer Spectrum One FTIR spec-trometer. All spectra were averaged about 50 times.

3 Excited States and Vibrations of EDOT Oligomers 57
Normal mode analysis and simulation of the IR and Raman spectra was performed us-ing Gaussian03.206 The geometry of the EDOT oligomers in the ground state was optimizedusing DFT at the B3LYP/6-31G* level. Using the optimized geometry, the normal modeanalysis was performed which yields the wavenumber (νk), reduced mass (µk), and normal-ized Cartesian displacement vectors (lik) for each atom for the set of k = 1, 2, · · · , 3N − 6normal modes in non-linear molecules with N atoms.212
Following Wilson et al.,213 we can describe the displacements ui (with u running throughx, y and z) for each atom i with mass mi in the molecule in terms of the set of dimensionlessdisplacements Qk associated with normal modes labeled k as:
ui =∑
k
lMWC,ik√
mi
√~ωk
Qk (3.10)
where ωk = 2πνkc and lMWC,ik is an orthonormal set of vectors describing mass-weightedCartesian displacements for each atom i and normal mode k. The displacement vectors cal-culated by Gaussian (lik) are closely related to the mass-weighted Cartesian displacements(lMWC,ik) via lik = NklMWC,ik(mi )
−1/2. The Gaussian calculated displacements are not mass-weighted and are normalized such that
∑3Ni (lik)
2= 1. The square of normalization constant
Nk equals the reduced mass (µk) for the mode under consideration212 and hence:
ui =∑
k
lik
√~
µkωkQk (3.11)
From analysis of the fluorescence spectra one can determine the change in the geometryin the excited state relative to the ground state, assuming that both geometries share thesame symmetry elements. The magnitude of the Huang-Rhys factor Sk for mode k is relatedto the relative displacement 1Qk of the minimum on the harmonic potential energy wellassociated with the normal mode k in the excited state relative to the minimum in the groundstate according to:
1Qk =√
2Sk (3.12)
Using the last two relations the Cartesian displacements upon excitation of the minimaof the harmonic potential wells in the ground and excited state (1ui ) for each atom i werecalculated according to:
1ui =∑
k
lik√
2~Sk√µkωk
(3.13)


4Delayed Fluorescence from Polythiophene
with Sub-S0-S1 Gap Excitation
Abstract
Delayed fluorescence (DF) of regio-irregular poly(3-hexylthiophene) (ir-P3HT) in the solidstate upon excitation with photon energies below the S0-S1 gap (1.9 eV) is reported. Thefluence (J ) dependence of the intensity of DF is proportional to J α with α ≥ 2 for excitationphoton energies Eex < 1.5 eV. For these sub-gap excitation energies, the observation ofprompt fluorescence with fluence dependence J α, α ≥ 2 implies the generation of excitedstates via a multi-photon process. The ratio of the intensity of DF and PF is found to besimilar for excitation at 2.34 and 1.03 eV. These findings suggest that the DF for excitationat 1.03 eV involves long-lived excited species that are formed out of a singlet excited statepopulated via a two-photon absorption process. The nature of the long-lived excited statesinvolved in DF is not yet clear and may be either triplet states or geminate charge pairs.
59
60 4.1 Introduction
4.1 Introduction
Delayed fluorescence (DF) is the emission of a photon from the lowest excited singlet state(S1) of a molecule, at a moment in time after pulsed excitation, that exceeds the normal S1
excited state lifetime, by an order of magnitude or more. It has been observed for a number ofmolecular materials, including π -conjugated polymers. Its occurrence implies the presenceof long-lived excited states with a lifetime exceeding that of the S1 state that at some momentduring its lifetime is transformed into the S1 state. Study of delayed fluorescence can provideuseful information on photophysical processes in molecular solids.
Delayed fluorescence has been reported for a variety of π -conjugated polymers andsophisticated experiments have been designed to elucidate the mechanism responsible forthis long-lived luminescence. Two different mechanisms are commonly called upon to explainDF in π -conjugated polymers.
The first mechanism involves the lowest excited triplet state of the material as the long-lived excitation. Triplet-triplet annihilation (TTA) occurring via diffusive encounter of twotriplet excitations can lead to generation of an excitation with singlet spin signature whichin turn can give rise to delayed fluorescence. This mechanism has been used to explainDF in poly(phenylene vinylene) (PPV),67,68 poly(phenylene ethynylene) (PPE) derivatives,214
polyfluorene (PF) derivatives63–66 and in a ladder type polyphenylene (LPPP) (solution).44,49
In a second mechanism for DF, the long-lived excitation is assumed to be a (gemi-nate) electron-hole pair. Recombination of the electron and the hole can give rise to re-formation of an excited singlet state. This mechanism is used to explain DF in poly(3-methyl-4-octylthiophene)50 and in ladder type polyphenylene.39,42,60–62 Experimental evidence infavor of the charge pair mechanism comes from the observation of a strong influence of anapplied electric field on the delayed emission.
In a study on polyquinoxaline derivatives,45 Bässler and coworkers found that the chargerecombination mechanism is dominant when the quinoxaline units are directly linked viacovalent C-C bonds. In quinoxaline polymers where the units are linked via an ether func-tionality, which reduces the conjugation between the units, both the TTA and the charge pairmechanism where found to be operative.
Here, delayed fluorescence is studied in regio-irregular poly(3-hexylthiophene) (ir-P3HT),which is a π -conjugated polymer that can be applied in opto electronic devices.7,9,215 Thequestion that will be addressed is whether DF can be induced via excitation with photonshaving an energy below the S0-S1 gap of the polymer. In this case electronic excitationof the polymer might occur via direct T1← S0 excitation and subsequent TTA may lead toDF. This mechanism was found to be operative in crystals of oligothiophenes.18 On theother hand, excitation of the polymer by sub-gap photons may also occur via two-photonabsorption (TPA). TPA will cause the formation of singlet excitons by simultaneously ab-sorbing two exciting photons via a virtual intermediary state.216,217 By the virtue that twophotons are absorbed simultaneously, the selection rules for TPA are different than for lin-

4 Delayed Fluorescence of ir-P3HT with Sub-Gap Excitation 61
ear (one-photon) absorption. TPA has been reported for π -conjugated polymers.218–220 Forpoly(3-alkylthiophene) (P3AT) the maximum of the lowest TPA absorption band is situated0.6 eV above the singlet-singlet absorption edge.218,219,221 In the case of excitation via TPA,delayed fluorescence may arise via the charge pair mechanism or possibly also via TTA.
4.1.1 Background
Relevant photophysical processes that may occur in polythiophene films are illustrated in(Figure 4.1). As mentioned, the energy of the lowest excited singlet state (S1) is situatedapproximately 1.9 eV above the ground state. First the focus will be on processes induced byphotons with an excitation energy above the S0-S1 gap. Illumination with these photons willnormally result in formation of an excited singlet state and inter-system crossing (ISC) fromthe singlet to the triplet manifold can eventually yield the lowest triplet state (T1). Formally thisprocess is spin-forbidden but (oligo-)thiophenes are known for comparatively high ISC rates.From the T1 state a dipole-allowed transition to a higher excited triplet level (Tn) is possiblefor polythiophenes. This feature can be used to detect formation of triplet states. Thus, bythe use of quenching experiments, the energy of the lowest triplet state in P3AT derivativeshas been determined in solution by Janssen et al.19 to lie between 1.57 and 1.72 eV and tobe 1.65 eV by Monkman et al.222 In the solid state a red-shift of the triplet state band is to beexpected compared with the solution case. Using the value for the red-shift (0.4 eV) of thesinglet state upon going from solution to film for ir-P3HT as an estimate suggests a T1 stateenergy of approximately ∼1.25 eV for ir-P3HT. This is in good agreement with the findings ofKöhler et al., who have reported a constant value of about ∼0.7 eV for the exchange energy,i.e. the difference in energy between T1 and S1 excited state, in π -conjugated polymers.150
Using the exchange energy to estimate the T1 state energy (with S1 = 1.9 eV) results inan approximate T1 energy for ir-P3HT of ∼1.2 eV, which is in good agreement with the firstestimate.
For a more quantitative discussion, the rate of decay of the triplet population may beexpressed as follows:
−d[T1]
dt= k(1)T [T1]+ k(2)TT [T1]2 (4.1)
where k(1)T is the decay constant for monomolecular decay, [T1] is the concentration of tripletexcitons and k(2)TT is the bimolecular decay constant describing TTA. This differential equationis a well-known problem; it is of the form of the Verhulst equation:
dydt= ay − by2 (4.2)
where y corresponds to [T1] and a and b to −k(1)T and k(2)TT , respectively. Applying the solution
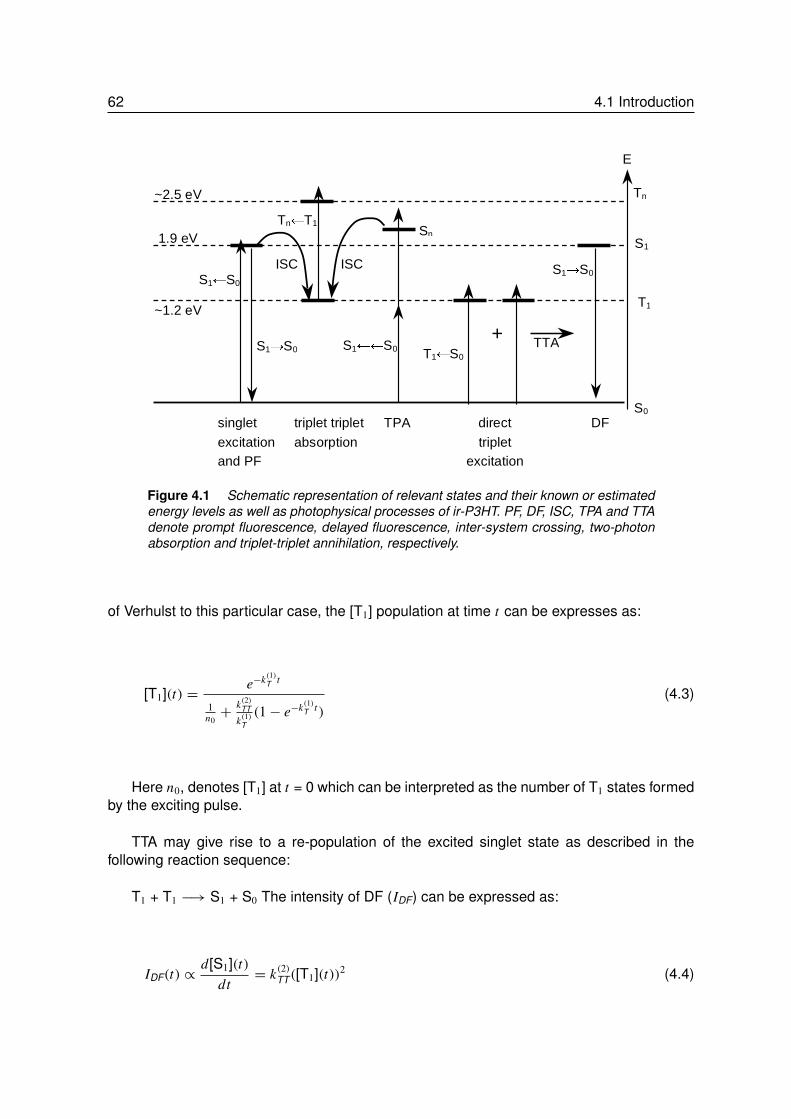
62 4.1 Introduction
S0
Tn
S1
T1
direct
triplet excitation
E
Tn←T1
S1→S0
singlet
excitation and PF
triplet triplet
absorption
S1←←S0
TPA DF
TTAT1←S0
S1→S0
1.9 eV
~1.2 eV
Sn
S1←S0
~2.5 eV
ISC
+
ISC
Figure 4.1 Schematic representation of relevant states and their known or estimatedenergy levels as well as photophysical processes of ir-P3HT. PF, DF, ISC, TPA and TTAdenote prompt fluorescence, delayed fluorescence, inter-system crossing, two-photonabsorption and triplet-triplet annihilation, respectively.
of Verhulst to this particular case, the [T1] population at time t can be expresses as:
[T1](t) =e−k(1)T t
1n0+
k(2)TT
k(1)T(1− e−k(1)T t)
(4.3)
Here n0, denotes [T1] at t = 0 which can be interpreted as the number of T1 states formedby the exciting pulse.
TTA may give rise to a re-population of the excited singlet state as described in thefollowing reaction sequence:
T1 + T1 −→ S1 + S0 The intensity of DF (IDF) can be expressed as:
IDF(t) ∝d[S1](t)
dt= k(2)TT([T1](t))2 (4.4)
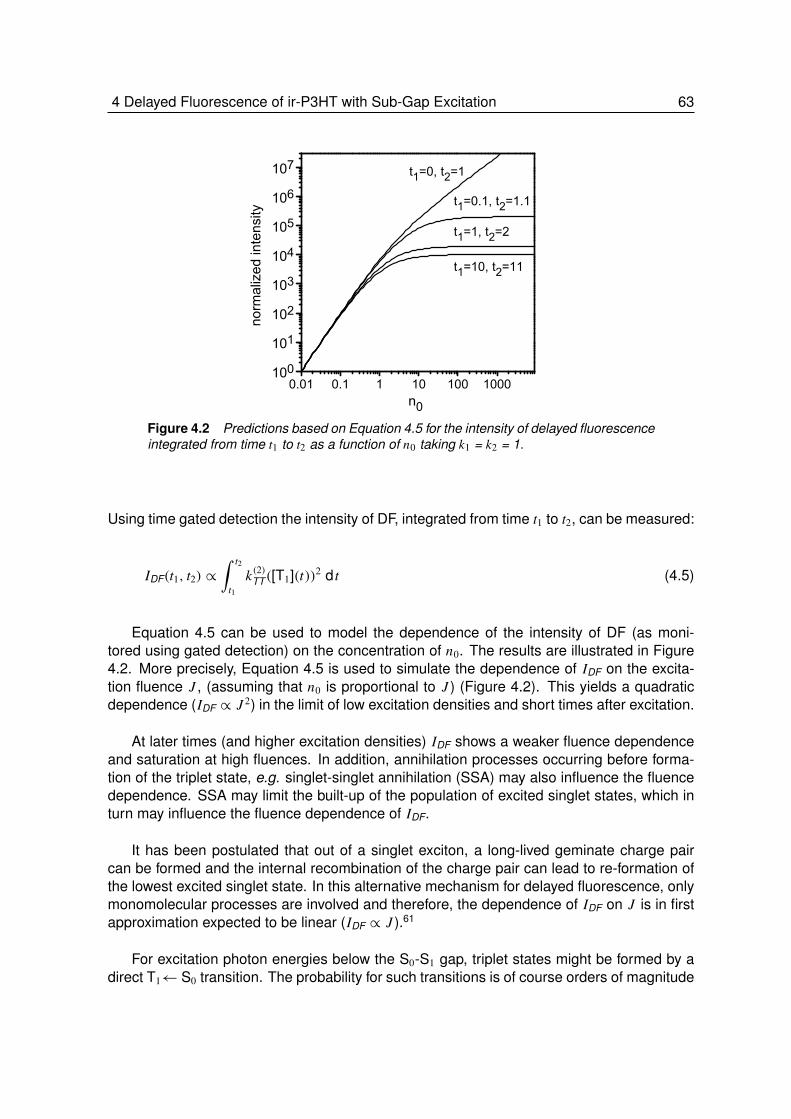
4 Delayed Fluorescence of ir-P3HT with Sub-Gap Excitation 63
0.01 0.1 1 10 100 1000100
101
102
103
104
105
106
107
t1=10, t2=11
t1=1, t2=2
t1=0.1, t2=1.1
t1=0, t2=1
norm
aliz
ed in
tens
ity
n0
Figure 4.2 Predictions based on Equation 4.5 for the intensity of delayed fluorescenceintegrated from time t1 to t2 as a function of n0 taking k1 = k2 = 1.
Using time gated detection the intensity of DF, integrated from time t1 to t2, can be measured:
IDF(t1, t2) ∝∫ t2
t1k(2)TT([T1](t))2 d t (4.5)
Equation 4.5 can be used to model the dependence of the intensity of DF (as moni-tored using gated detection) on the concentration of n0. The results are illustrated in Figure4.2. More precisely, Equation 4.5 is used to simulate the dependence of IDF on the excita-tion fluence J , (assuming that n0 is proportional to J ) (Figure 4.2). This yields a quadraticdependence (IDF ∝ J 2) in the limit of low excitation densities and short times after excitation.
At later times (and higher excitation densities) IDF shows a weaker fluence dependenceand saturation at high fluences. In addition, annihilation processes occurring before forma-tion of the triplet state, e.g. singlet-singlet annihilation (SSA) may also influence the fluencedependence. SSA may limit the built-up of the population of excited singlet states, which inturn may influence the fluence dependence of IDF.
It has been postulated that out of a singlet exciton, a long-lived geminate charge paircan be formed and the internal recombination of the charge pair can lead to re-formation ofthe lowest excited singlet state. In this alternative mechanism for delayed fluorescence, onlymonomolecular processes are involved and therefore, the dependence of IDF on J is in firstapproximation expected to be linear (IDF ∝ J ).61
For excitation photon energies below the S0-S1 gap, triplet states might be formed by adirect T1← S0 transition. The probability for such transitions is of course orders of magnitude

64 4.2 Results and Discussions
lower than for the S1← S0 transition because of the spin selection rules. After direct T1← S0
excitation, TTA may lead to DF and in this case Equation 4.4 also applies; when consideringthe dependence of IDF on the fluence. Thus, for this TTA-involving process as well, anIDF ∝ J 2 dependence is expected. Since the primary excitations are in this case not S1, butT1 excitations, no SSA processes can occur.
In the case of sub-gap excitation, two-photon absorption may lead to the formation ofan excited singlet state. For two-photon absorption to occur, the two light quanta must bepresent almost at the same time at the site of excitation. Therefore, two-photon absorptionhas an intrinsic J 2 dependence and thus, n0 ∝ J 2. After the creation of the excited singletstate, DF may arise via the geminate pair mechanism leading to the prediction IDF ∝ J 2.Alternatively, delayed fluorescence may also arise from TTA of T1 excitations formed out ofthe primary two-photon excited S1 states via ISC. In this case one expects IDF ∝ J 4. Also,a hybrid mechanism in which one triplet is formed via direct T1← S0 and another via two-photon absorption may be envisaged, for which IDF ∝ J 3 is expected.
4.2 Results and Discussions
4.2.1 Absorption and Prompt Fluorescence of ir-P3HT
The electronic absorption spectrum of a drop cast film of ir-P3HT is shown in Figure 4.3.At nearly 2 eV photon energy it features the S1← S0 absorption band. For comparison theabsorption spectrum of ir-P3HT in frozen 2-methyltetrahydrofuran (MeTHF) solution is alsoshown. The latter spectrum shows some vibronic fine structure, and a progression based ona vibrational mode with 0.18 eV energy may be discerned. In solution, the molar extinctioncoefficient per monomeric unit at 80 K is εmax(2.34 eV) = 1.3×10⁴ Lmol−1cm−1. In Figure4.3 the instantaneous or so-called prompt fluorescence of the film of ir-P3HT recorded underdirect excitation (2.3 eV) is shown as well. The fluorescence shows some vibronic finestructure and a ∼0.17 eV vibrational mode may be discerned, giving rise to three maximapositioned at 1.86 eV (0-0 transition), 1.69 eV (0-1 transition) and 1.53 eV (0-2 transition).From the intersection of the absorption curve and fluorescence trace the electronic excitationenergy of the S1 excited state is estimated as 1.9 eV.
4.2.2 Delayed Fluorescence of ir-P3HT
Using time-gated detection, prompt fluorescence (no delay after arrival of the peak of theexcitation pulse) and delayed fluorescence (∼10 ns and >100 ns delay) spectra have beenrecorded at 80 K (Figure 4.4). The spectra pertain to drop cast films of ir-P3HT using differentexcitation energies, collection times (gates) and delay times.
Using 2.34 eV photons for excitation PF and DF can be recorded readily. The DF and PFspectra are very similar implying that the delayed luminescence indeed originates from theS1 excited state. The small differences that are observed between the PF and DF spectra

4 Delayed Fluorescence of ir-P3HT with Sub-Gap Excitation 65
500 600 700 800 900
absorption of solution, 80 K
abs
orba
nce/
a.u.
emission of film, 80 K
2.6 2.4 2.2 2.0 1.8 1.6 1.4
E/eV
I/a.
u.
/nm
absorption of film, RT
Figure 4.3 Absorption spectra of a film of ir-P3HT at room temperature (triangles)and a frozen solution of ir-P3HT in MeTHF at 80 K (circles, concentration of monomericunits 84 µM). Prompt fluorescence from the film upon excitation with 2.3 eV photons,T = 80 K (squares).
may be explained in terms of disorder induced broadening of the density of S1 excited statesin the polymer.
Upon lowering the photon energy of the exciting photons below the S0-S1 gap (1.9 eV) PFand DF can still be observed although the signal becomes weak and has to be accumulatedover a large number of excitation pulses.
4.2.3 Fluence Dependence of Delayed Fluorescence
The dependence on the fluence of the excitation beam of the delayed luminescence ob-served provides more information on the nature of the mechanisms causing the delayedluminescence. In general it is found that the intensity (I ) of DF and PF follows a power lawdependence on the fluence, J , (I ∝ J α) where the magnitude of the exponent α dependson various parameters such as the energy of the exciting photon. Figure 4.5 illustrates thefluence dependence of some of the luminescence signals observed. As expected, underdirect S1← S0 excitation (2.34 eV) the PF shows a linear fluence dependence at low excita-tion densities. At higher densities, the fluence dependence is less strong indicating that thesinglet excitations can be quenched by photoinduced excitations and/or charge carriers.
The DF under direct S1← S0 excitation shows a similar fluence dependence with α close

66 4.2 Results and Discussions
2.0 1.8 1.6 1.4
650 700 750 800 850
I/a.u.
PF DF
/nm
E/eV
Eex 1.55 eV
Eex 2.34 eV
Eex 1.30 eV
Eex 1.03 eV
Figure 4.4 PF (no delay, dashed line) and DF (>100 ns delay, solid line) spectra fordifferent excitation photon energies Eex for films of ir-P3HT at 80 K. Spectra for differentEex are offset for clarity. Spectral resolution 10 nm, except for DF at Eex = 1.03 eV:20 nm resolution.
to 1 (Figure 4.5). This can be explained by the geminate pair mechanism where the delayedfluorescence originates from a photoinduced charge pair that stems from a one-photon exci-tation. Additionally, the DF may also originate from TTA, but in this explanation one is forcedto introduce an annihilation mechanism, in which the long-lived triplet or its precursor, thesinglet excitation, is quenched by another photoinduced species.
Using sub-gap excitation (1.3 eV) it is found that the fluence dependence of the PF ismuch stronger (α ≈ 2.6) than in the case of direct S1← S0 excitation (Figure 4.5). Thisprovides a strong indication that the prompt fluorescence originates from multi-photon exci-tation. Incidentally this also shows that the PF observed with sub-gap excitation, does notoriginate from one-photon excitation induced by stray light with photon energy >1.9 eV. ForTPA one expects α = 2, which comes close to the experimental value, α ≈ 2.6.
The DF with sub-gap excitation (Figure 4.5) shows a fluence dependence which is verysimilar to that of the PF with sub-gap excitation This indicates that the DF originates directlyfrom a single-singlet excitation induced by two-photon absorption e.g. via the geminate pairmechanism.
The exponent α for the fluence dependence of the PF and DF has been measured for anumber of excitation photon energies. Results are summarized in Table 4.1 and are graphi-cally represented in Figure 4.6.
Figure 4.6 and Table 4.1 reveal a correlation between excitation energy and the exponent
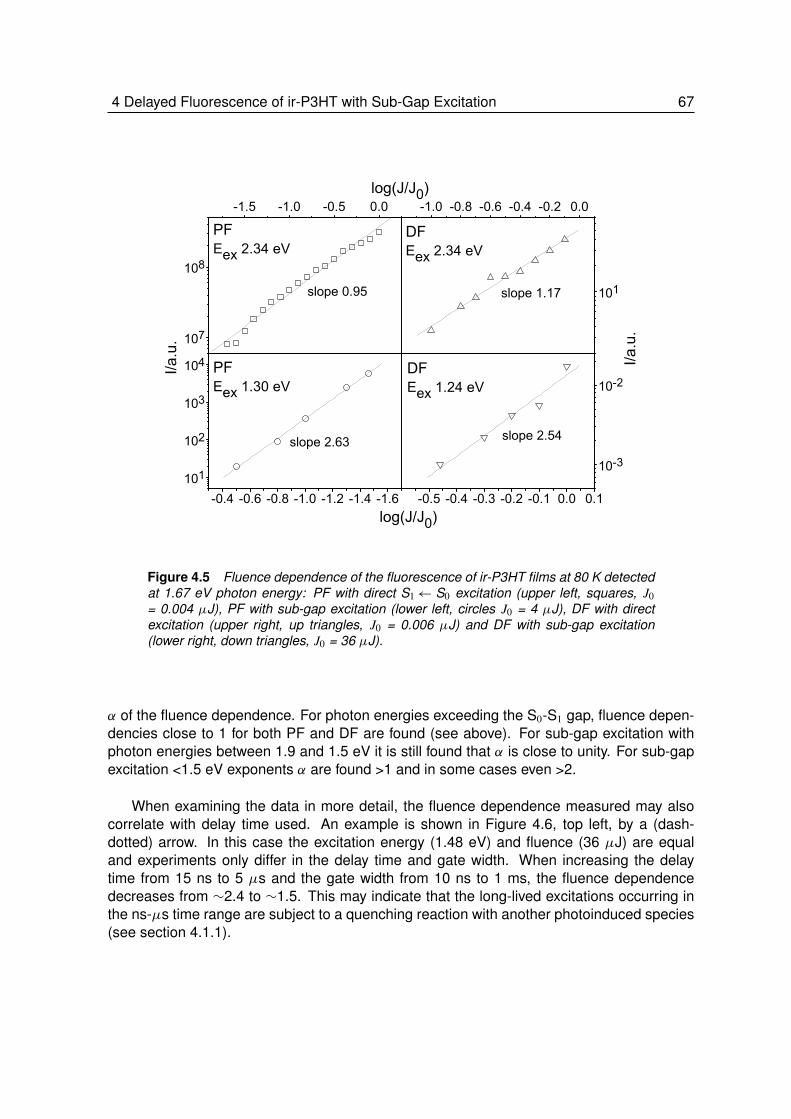
4 Delayed Fluorescence of ir-P3HT with Sub-Gap Excitation 67
101
101
102
103
104
10-3
10-2
-0.4 -0.6 -0.8 -1.0 -1.2 -1.4 -1.6 -0.5 -0.4 -0.3 -0.2 -0.1 0.0 0.1
-1.5 -1.0 -0.5 0.0 -1.0 -0.8 -0.6 -0.4 -0.2 0.0
107
108
PFEex 2.34 eV
DFEex 2.34 eV
slope 1.17
slope 0.95
I/a.u.
I/a.u.
PFEex 1.30 eV
slope 2.54
DFEex 1.24 eV
log(J/J0)
log(J/J0)
slope 2.63
Figure 4.5 Fluence dependence of the fluorescence of ir-P3HT films at 80 K detectedat 1.67 eV photon energy: PF with direct S1← S0 excitation (upper left, squares, J0= 0.004 µJ), PF with sub-gap excitation (lower left, circles J0 = 4 µJ), DF with directexcitation (upper right, up triangles, J0 = 0.006 µJ) and DF with sub-gap excitation(lower right, down triangles, J0 = 36 µJ).
α of the fluence dependence. For photon energies exceeding the S0-S1 gap, fluence depen-dencies close to 1 for both PF and DF are found (see above). For sub-gap excitation withphoton energies between 1.9 and 1.5 eV it is still found that α is close to unity. For sub-gapexcitation <1.5 eV exponents α are found >1 and in some cases even >2.
When examining the data in more detail, the fluence dependence measured may alsocorrelate with delay time used. An example is shown in Figure 4.6, top left, by a (dash-dotted) arrow. In this case the excitation energy (1.48 eV) and fluence (36 µJ) are equaland experiments only differ in the delay time and gate width. When increasing the delaytime from 15 ns to 5 µs and the gate width from 10 ns to 1 ms, the fluence dependencedecreases from ∼2.4 to ∼1.5. This may indicate that the long-lived excitations occurring inthe ns-µs time range are subject to a quenching reaction with another photoinduced species(see section 4.1.1).

68 4.2 Results and Discussions
1
2
3
1
2
3
1
2
3
2.0 1.5 1.0 2.0 1.5 1.0
2.0 1.5 1.0 2.0 1.5 1.0
0.6 µJ
36 µJ85 µJ
16 µJ 24 µJ0.6 µJ
36 µJ
70 nJ
6 nJ
16µJ
5µJ
7µJ
11µJ4µJ
36µJ
1
2
3 PF DF, (9-15 ns) DF, (>100 ns)
PF
expo
nent
expo
nent
DF, delay 9-15 ns
DF, delay >100 ns
Eex/eV
Eex/eV
Figure 4.6 Exponent α describing the fluence (J ) dependence of the fluorescence in-tensity (I ∝ Jα) determined for various excitation photon energies Eex for ir-P3HT films.The labels indicate the energy of the unattenuated excitation beam. PF, measured with-out delay (top right), DF, 9-15 ns delay (bottom left) and DF after long delays (>100 ns,bottom right). Top left: compilation of the other panels, labels are omitted for clarity. Thearrow indicates experiments that differ only in delay time.
Table 4.1 Exponents α describing the fluence dependence of the intensity,I , of fluorescence from ir-P3HT films (I ∝ Jα), recorded for different photonexcitation energies Eex (eV), delay times, gate widths and pulse energies ofthe unattenuated excitation beam J0 at T = 80 K with fluorescence detectionat 1.67 eV.
photon energy delay gate width J0 exponent α(eV) (µs) (µs) (µJ)
2.34 0.068 0.005 0.6 0.82.34 0.085 0.01 0.6 0.82.34 0.2 1000 0.006 1.22.34 0.2 1000 0.07 0.71.81 0.079 0.005 16 1.01.55 0.079 0.005 24 1.11.48 0.2 1000 5 1.11.48 0.2 1000 16 1.91.41 0.2 1000 7 2.11.35 0.2 1000 11 2.71.30 0.068 0.005 36 2.61.30 0.085 0.01 36 2.41.30 5 1000 36 1.51.24 0.2 1000 4 2.51.03 0.066 0.005 85 2.8

4 Delayed Fluorescence of ir-P3HT with Sub-Gap Excitation 69
0 1 2 3 4 5-10
-8
-6
-4
-2
0 Eex 1.03 eV
10log(I/IPF)
delaytime/µs
Eex 2.34 eV
Figure 4.7 Intensity of fluorescence at 1.67 eV from an ir-P3HT film normalized to thePF versus the delay time for fluorescence detection. Excitation photon energies Eex =2.34 (circles) and 1.03 (crosses) eV. Gate widths used for detection of PF: 10 ns, forDF: 1 ms. T = 80 K.
For two excitation photon energies, one above (2.34 eV) and one below (1.03 eV) theS0-S1 gap, the luminescence intensity has been measured at different delay times and nor-malized to the intensity of the PF (no delay) (Figure 4.7).
For both excitation photon energies, this normalized intensity follows the same time de-pendence and the DF (>0.1 µs) is about 7 orders of magnitude less than the PF. This simi-larity between the two time dependencies indicates that both direct excitation at 2.34 eV andsub-gap excitation at 1.03 eV result primarily in singlet excitons. The relative importance ofthe DF would have been expected to be much larger if T1← S0 excitation would occur at1.03 eV, because the PF would be much less. Hence, excitation at 1.03 eV gives primarilyrise to singlet excited states, presumably via a two-photon process. Consistently, the 1.03 eVphoton energy used is below the expected S0-T1 gap (1.2 eV).
This experiment (Figure 4.7) does not tell directly whether the delayed fluorescence orig-inates from geminate charge pairs formed out of the singlet excitation or via TTA of tripletsformed via inter-system crossing. In the latter case one expects a different fluence depen-dence for PF and DF (α = 2 and 4 respectively) while the charge pair mechanism predictsthe fluence dependence of PF and DF to be the same (α = 2). The experimental observationof a very similar fluence dependence for DF and PF, close to α = 2 (Figure 4.5) provides anindication that the charge pair mechanism is operative.
The long-lived excitations that give rise to the DF may also be studied by photoinducedabsorption spectroscopy (PIA). Because of its much lower sensitivity in comparison with lumi-

70 4.2 Results and Discussions
0.5 1.0 1.5 2.0 2.5-2.0x10⁻⁴
-1.0x10⁻⁴
0.0
1.0x10⁻⁴
2.0x10⁻⁴
3.0x10⁻⁴
T/T 0
excitation
2x10³
E/eV
/nm
Figure 4.8 ss-PIA spectrum of ir-P3HT film at 80 K under inert atmosphere (exci-tation photon energy 2.4 eV, power of excitation beam 30 mW, modulation frequencyν = 275 Hz).
nescence measurements, PIA measurements are restricted to excitation at photon energiesabove the S0-S1 gap. In Figure 4.8 the near steady-state PIA (ss-PIA) spectrum of a filmof ir-P3HT is shown. The spectrum shows a featureless transient absorption (1.20 eV) anda structured bleaching band with a first peak at 2.00 eV. The bleaching band exhibits fine-structure with an energy spacing of ∼160 meV, reminiscent of the well-known carbon-carbondouble bond stretching mode. The bleaching band largely resembles the low temperature(80 K) UV/Vis spectrum. The spectrum shows very little photoinduced absorption in thespectral region around 0.5 eV.
From studies involving chemical oxidation and reduction of polythiophene it is well knownthat charge carriers on this polymer give rise to induced absorption bands near 0.5 eV.158
Therefore, the absence of any significant photoinduced absorption at 0.5 eV indicates that(free) charge carriers are not the main long-lived excitation. The PIA absorption band ob-served at 1.2 eV is commonly attributed to triplet excitations and the 1.2 eV absorption bandhas been assigned as a Tn← T1 transition before.223 The dependence of the PIA signalat 1.2 eV on the modulation frequency reveals that the triplets have a relatively long life-time (0.03 ms). In conclusion, from PIA measurements, no direct support for the presenceof long-lived charge pairs could be obtained. This does, however, not exclude the chargepair recombination mechanism because the relative efficiencies of triplets and charge pairsin delayed generation of the singlet state have to be taken into account in estimating theirimportance in the DF process.

4 Delayed Fluorescence of ir-P3HT with Sub-Gap Excitation 71
4.3 Conclusion
Delayed fluorescence of regio-irregular poly(3-hexylthiophene) has been observed using ex-citation photon energies below the S0-S1 gap. Measurements of the prompt fluorescenceupon excitation with sub-gap photons reveals that the lowest excited singlet state (S1) isgenerated via multi-photon processes. The comparison of the relative intensities of DF andPF using photon energies below and above the S0-S1 gap indicates that the delayed fluo-rescence upon sub-gap excitation originates mainly from long-lived excitations formed out ofsinglet excited states populated via two-photon absorption. In general two-photon processesallow one to access excited states that can normally not be populated selectively by linearabsorption processes because of their different selection rules. An intriguing question iswhether the states populated via two-photon absorption show photophysical behavior suchas charge generation efficiency that differs from the S1 excited state that can be accessedvia linear absorption. The present study shows that delayed fluorescence measurementscan be a tool to investigate the photophysical behavior of states accessed via multi-photonprocesses.
Experimental Part
The synthesis of ir-P3HT (Mw = 175 kDa) has been performed according to published meth-ods.224,225 2-Methyltetrahydrofuran (MeTHF) was pre-dried over KOH for 3 days, filtered,distilled from CaH2, and stored under inert nitrogen atmosphere.
Sample solutions were prepared in nitrogen-filled glove box using dry MeTHF. Film sam-ples were drop cast from saturated polymer solutions in MeTHF under ambient conditions.
During the spectroscopic experiments, samples were held at 80 K under nitrogen at-mosphere using an Oxford Optistat CF continuous flow cryostat or an Oxford Optistat DNbath cryostat. All solutions were kept under inert atmosphere during measurements.
UV/Vis spectra were recorded using a Perkin-Elmer Lambda 900 spectrophotometer.
Fluorescence spectra were recorded using time-gated detection. A pulsed Nd:YAG laser(Surelite II-10, Continuum, FWHM 4 ns, 10 Hz) was used for excitation combined with anoptical parametric oscillator (Panther OPO, Continuum) to tune the excitation energy. Theexcitation beam was focused onto the sample to a spot size ∼0.01 cm2. Fluorescence spec-tra were recorded with an intensified CCD camera (PI-MAX:1024HQ, Princeton Instruments)after dispersion of the incident light by a spectrograph. The effective spectral resolution inthe spectra shown is 10 nm unless stated otherwise. DF was usually recorded using delaysof >100 ns in order to minimize residual PF. In the case of sub-gap excitation, BG24 andcut-off filters (λ > 700 nm) were placed in the excitation beam to suppress any residual 355and 532 nm emission of the Nd:YAG laser. The fluence dependence of the fluorescencesignal was determined by attenuating the excitation beam with neutral density filters.

72 Experimental Part
The near steady-state PIA spectra were recorded by exciting the sample with a mechan-ically modulated (77 Hz) cw argon ion laser (2.4 eV) and measuring the change in transmis-sion (1T ) of a tungsten-halogen white light probe beam through the sample between 0.25and 3.5 eV. Si, InGaAs and (liquid nitrogen cooled) InSb detectors and a phase sensitivelock-in amplifier referenced to the modulation frequency were used to record 1T after dis-persion of the probe light in a monochromator. The excitation power was typically 30 mW witha beam diameter of 2 mm. The PIA signal (−1T
T ) was corrected for the photoluminescence,which was recorded in a separate experiment. From the dependence of the PIA signal onthe modulation frequency ν, an estimate of the lifetime (τ ) of the long-lived excitations canbe obtained assuming an exponential decay, using the relation 1T (ν) = cτ(1+ (2πντ)2)−1/2
where c is a constant.


5Length dependence in the Singlet and Triplet
Excited States of Oligofluorenes∗
Abstract
Using time-resolved photoluminescence and excited-state absorption spectroscopy the chainlength dependence of the energies of the singlet (S1) and triplet (T1 and Tn) excited statesof a homologous series of π -conjugated 9,9-dihexylfluorene-2,7-diyl oligomers (nF, n = 1, 3,5, 7, ∼50) in frozen solution has been investigated. The energies of the optical transitions inabsorption, fluorescence, phosphorescence, and triplet-triplet absorption initially decreaselinearly with the reciprocal number of repeat units, but saturate at n > 5. The saturation anddispersion of the optical transition energies indicate that the T1 state is only slightly moreconfined than the S1 state.
∗ D. Wasserberg, S. P. Dudek, S. C. J. Meskers, R. A. J. Janssen, Chem. Phys. Lett. 2005, 411(1-3), 273-277.
75
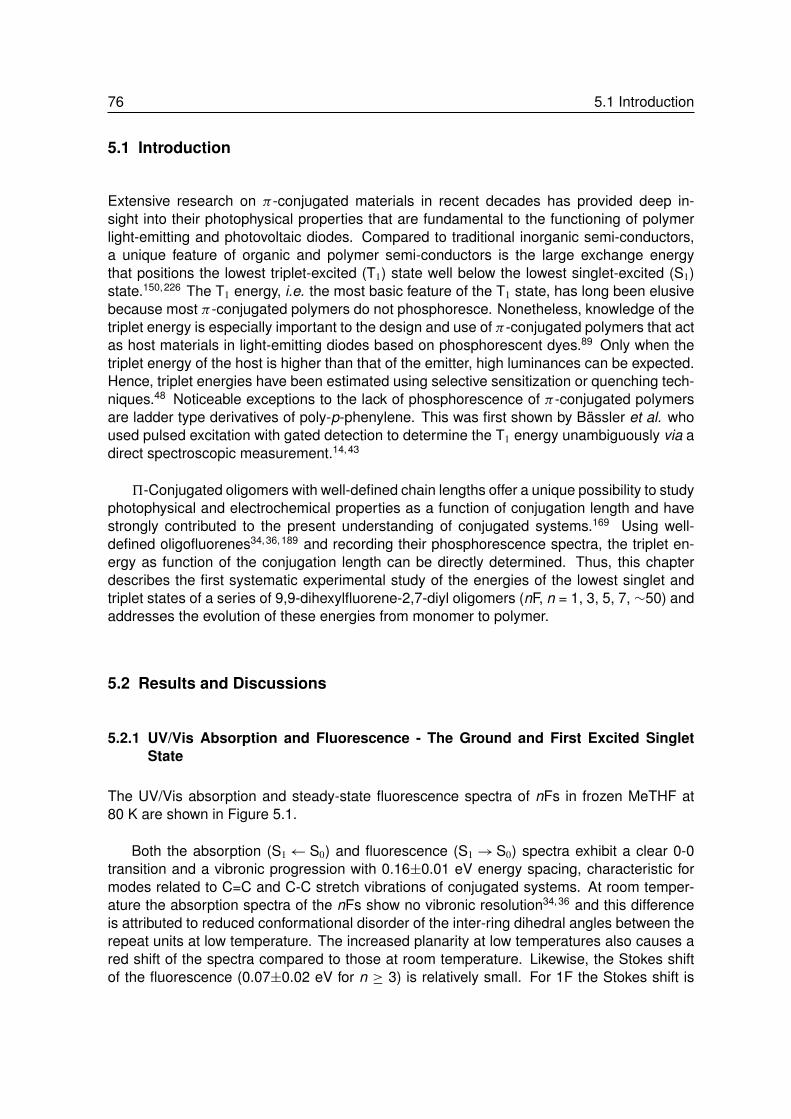
76 5.1 Introduction
5.1 Introduction
Extensive research on π -conjugated materials in recent decades has provided deep in-sight into their photophysical properties that are fundamental to the functioning of polymerlight-emitting and photovoltaic diodes. Compared to traditional inorganic semi-conductors,a unique feature of organic and polymer semi-conductors is the large exchange energythat positions the lowest triplet-excited (T1) state well below the lowest singlet-excited (S1)state.150,226 The T1 energy, i.e. the most basic feature of the T1 state, has long been elusivebecause most π -conjugated polymers do not phosphoresce. Nonetheless, knowledge of thetriplet energy is especially important to the design and use of π -conjugated polymers that actas host materials in light-emitting diodes based on phosphorescent dyes.89 Only when thetriplet energy of the host is higher than that of the emitter, high luminances can be expected.Hence, triplet energies have been estimated using selective sensitization or quenching tech-niques.48 Noticeable exceptions to the lack of phosphorescence of π -conjugated polymersare ladder type derivatives of poly-p-phenylene. This was first shown by Bässler et al. whoused pulsed excitation with gated detection to determine the T1 energy unambiguously via adirect spectroscopic measurement.14,43
5-Conjugated oligomers with well-defined chain lengths offer a unique possibility to studyphotophysical and electrochemical properties as a function of conjugation length and havestrongly contributed to the present understanding of conjugated systems.169 Using well-defined oligofluorenes34,36,189 and recording their phosphorescence spectra, the triplet en-ergy as function of the conjugation length can be directly determined. Thus, this chapterdescribes the first systematic experimental study of the energies of the lowest singlet andtriplet states of a series of 9,9-dihexylfluorene-2,7-diyl oligomers (nF, n = 1, 3, 5, 7, ∼50) andaddresses the evolution of these energies from monomer to polymer.
5.2 Results and Discussions
5.2.1 UV/Vis Absorption and Fluorescence - The Ground and First Excited SingletState
The UV/Vis absorption and steady-state fluorescence spectra of nFs in frozen MeTHF at80 K are shown in Figure 5.1.
Both the absorption (S1← S0) and fluorescence (S1 →S0) spectra exhibit a clear 0-0transition and a vibronic progression with 0.16±0.01 eV energy spacing, characteristic formodes related to C=C and C-C stretch vibrations of conjugated systems. At room temper-ature the absorption spectra of the nFs show no vibronic resolution34,36 and this differenceis attributed to reduced conformational disorder of the inter-ring dihedral angles between therepeat units at low temperature. The increased planarity at low temperatures also causes ared shift of the spectra compared to those at room temperature. Likewise, the Stokes shiftof the fluorescence (0.07±0.02 eV for n ≥ 3) is relatively small. For 1F the Stokes shift is
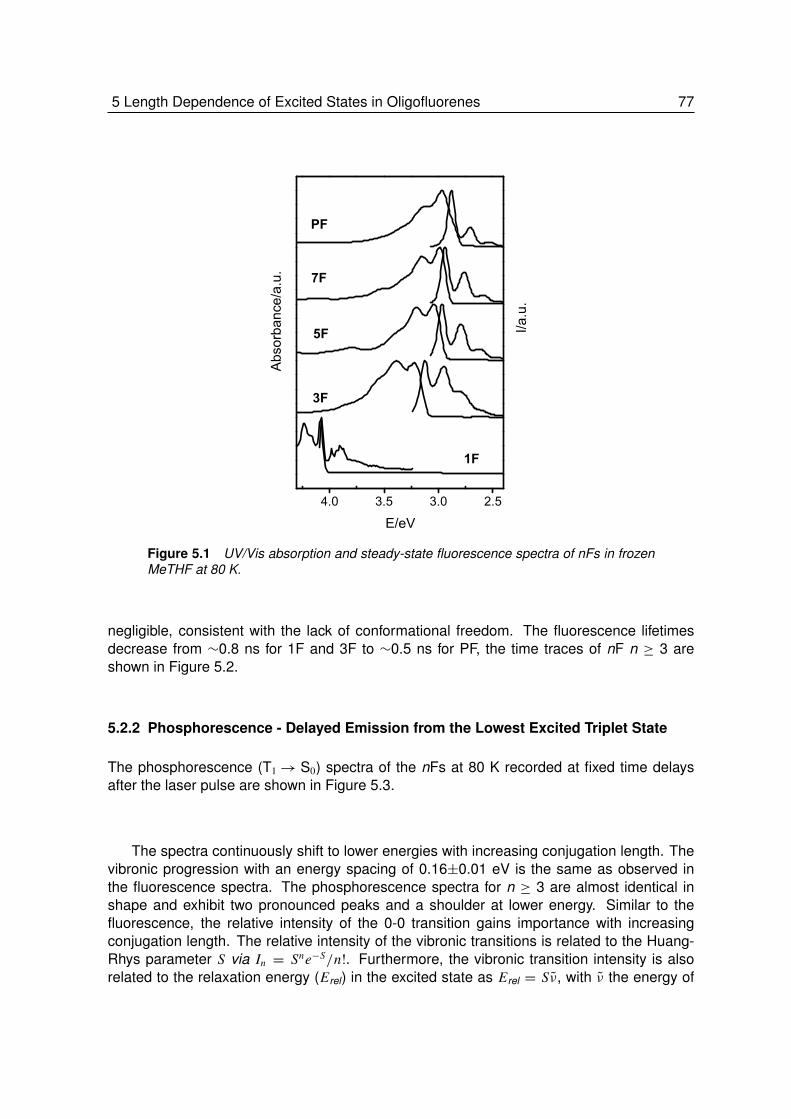
5 Length Dependence of Excited States in Oligofluorenes 77
4.0 3.5 3.0 2.5I/a
.u.
PF
7F
1F
5F
3F
Abs
orba
nce/a.u.
E/eV
Figure 5.1 UV/Vis absorption and steady-state fluorescence spectra of nFs in frozenMeTHF at 80 K.
negligible, consistent with the lack of conformational freedom. The fluorescence lifetimesdecrease from ∼0.8 ns for 1F and 3F to ∼0.5 ns for PF, the time traces of nF n ≥ 3 areshown in Figure 5.2.
5.2.2 Phosphorescence - Delayed Emission from the Lowest Excited Triplet State
The phosphorescence (T1→ S0) spectra of the nFs at 80 K recorded at fixed time delaysafter the laser pulse are shown in Figure 5.3.
The spectra continuously shift to lower energies with increasing conjugation length. Thevibronic progression with an energy spacing of 0.16±0.01 eV is the same as observed inthe fluorescence spectra. The phosphorescence spectra for n ≥ 3 are almost identical inshape and exhibit two pronounced peaks and a shoulder at lower energy. Similar to thefluorescence, the relative intensity of the 0-0 transition gains importance with increasingconjugation length. The relative intensity of the vibronic transitions is related to the Huang-Rhys parameter S via In = Sne−S/n!. Furthermore, the vibronic transition intensity is alsorelated to the relaxation energy (Erel) in the excited state as Erel = Sν, with ν the energy of
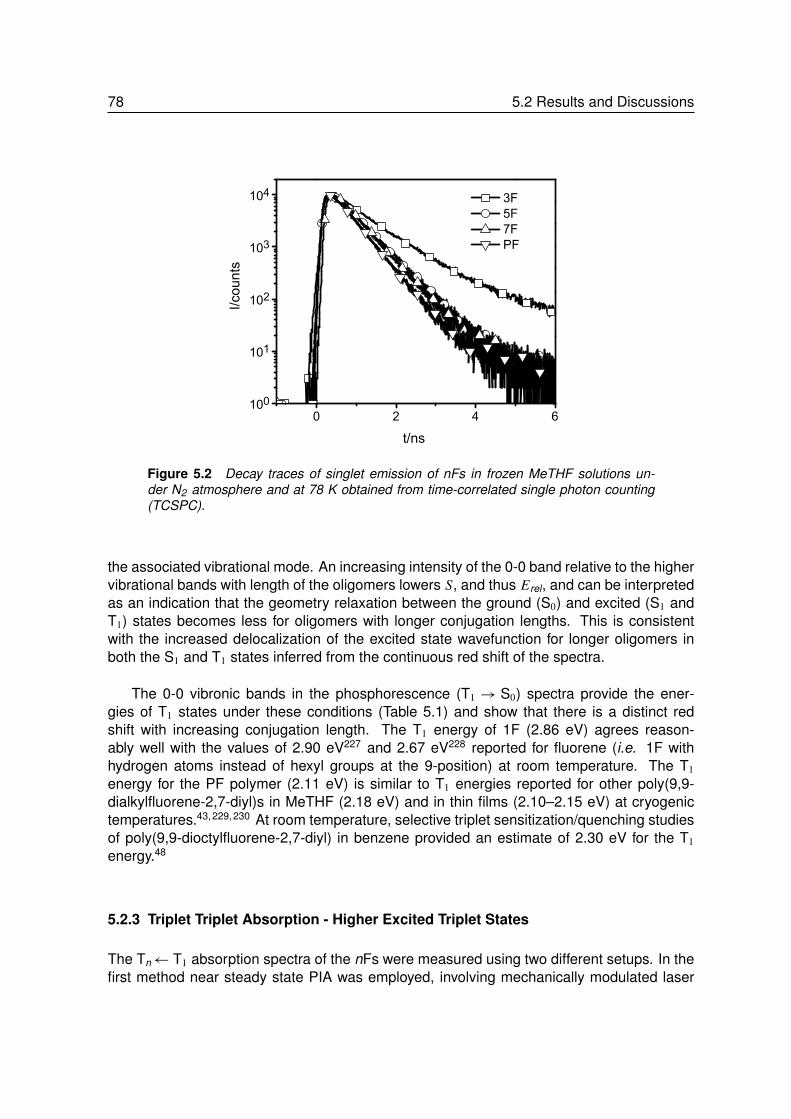
78 5.2 Results and Discussions
100
101
102
103
104
0 2 4 6
3F 5F 7F PF
I/cou
nts
t/ns
Figure 5.2 Decay traces of singlet emission of nFs in frozen MeTHF solutions un-der N2 atmosphere and at 78 K obtained from time-correlated single photon counting(TCSPC).
the associated vibrational mode. An increasing intensity of the 0-0 band relative to the highervibrational bands with length of the oligomers lowers S, and thus Erel, and can be interpretedas an indication that the geometry relaxation between the ground (S0) and excited (S1 andT1) states becomes less for oligomers with longer conjugation lengths. This is consistentwith the increased delocalization of the excited state wavefunction for longer oligomers inboth the S1 and T1 states inferred from the continuous red shift of the spectra.
The 0-0 vibronic bands in the phosphorescence (T1 → S0) spectra provide the ener-gies of T1 states under these conditions (Table 5.1) and show that there is a distinct redshift with increasing conjugation length. The T1 energy of 1F (2.86 eV) agrees reason-ably well with the values of 2.90 eV227 and 2.67 eV228 reported for fluorene (i.e. 1F withhydrogen atoms instead of hexyl groups at the 9-position) at room temperature. The T1
energy for the PF polymer (2.11 eV) is similar to T1 energies reported for other poly(9,9-dialkylfluorene-2,7-diyl)s in MeTHF (2.18 eV) and in thin films (2.10–2.15 eV) at cryogenictemperatures.43,229,230 At room temperature, selective triplet sensitization/quenching studiesof poly(9,9-dioctylfluorene-2,7-diyl) in benzene provided an estimate of 2.30 eV for the T1
energy.48
5.2.3 Triplet Triplet Absorption - Higher Excited Triplet States
The Tn← T1 absorption spectra of the nFs were measured using two different setups. In thefirst method near steady state PIA was employed, involving mechanically modulated laser
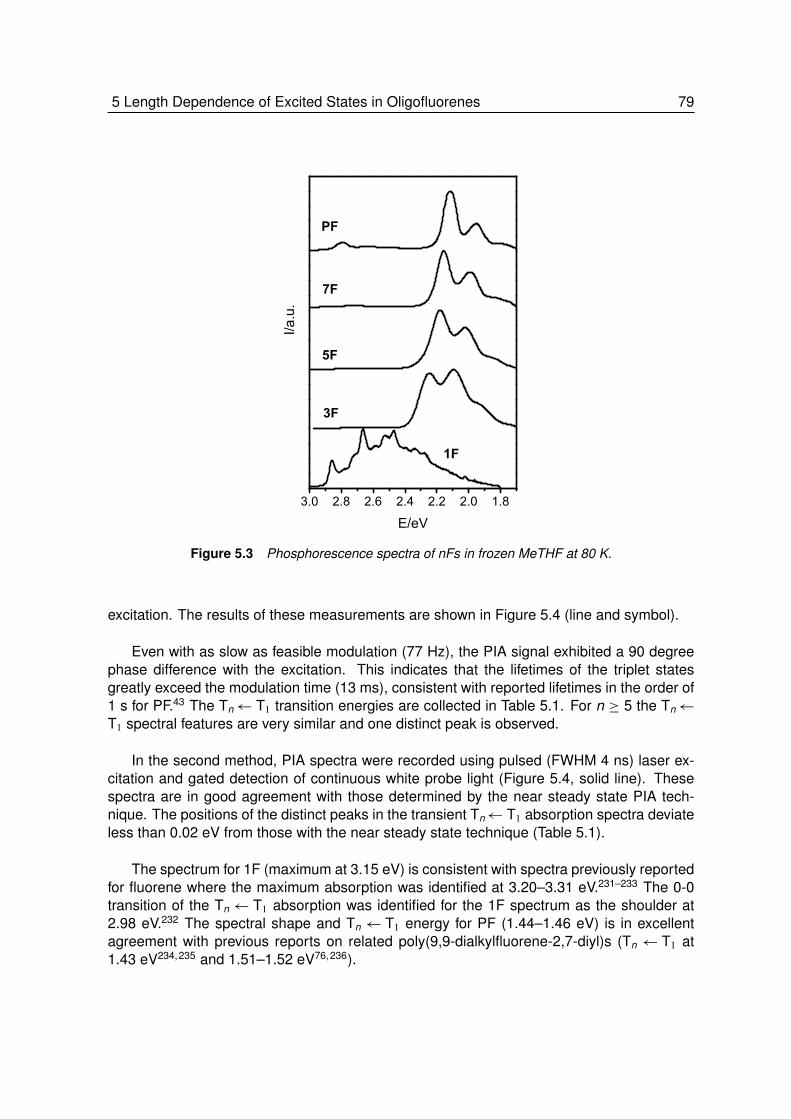
5 Length Dependence of Excited States in Oligofluorenes 79
3.0 2.8 2.6 2.4 2.2 2.0 1.8
I/a.u.
E/eV
PF
7F
1F
5F
3F
Figure 5.3 Phosphorescence spectra of nFs in frozen MeTHF at 80 K.
excitation. The results of these measurements are shown in Figure 5.4 (line and symbol).
Even with as slow as feasible modulation (77 Hz), the PIA signal exhibited a 90 degreephase difference with the excitation. This indicates that the lifetimes of the triplet statesgreatly exceed the modulation time (13 ms), consistent with reported lifetimes in the order of1 s for PF.43 The Tn← T1 transition energies are collected in Table 5.1. For n ≥ 5 the Tn←
T1 spectral features are very similar and one distinct peak is observed.
In the second method, PIA spectra were recorded using pulsed (FWHM 4 ns) laser ex-citation and gated detection of continuous white probe light (Figure 5.4, solid line). Thesespectra are in good agreement with those determined by the near steady state PIA tech-nique. The positions of the distinct peaks in the transient Tn← T1 absorption spectra deviateless than 0.02 eV from those with the near steady state technique (Table 5.1).
The spectrum for 1F (maximum at 3.15 eV) is consistent with spectra previously reportedfor fluorene where the maximum absorption was identified at 3.20–3.31 eV.231–233 The 0-0transition of the Tn← T1 absorption was identified for the 1F spectrum as the shoulder at2.98 eV.232 The spectral shape and Tn← T1 energy for PF (1.44–1.46 eV) is in excellentagreement with previous reports on related poly(9,9-dialkylfluorene-2,7-diyl)s (Tn ← T1 at1.43 eV234,235 and 1.51–1.52 eV76,236).
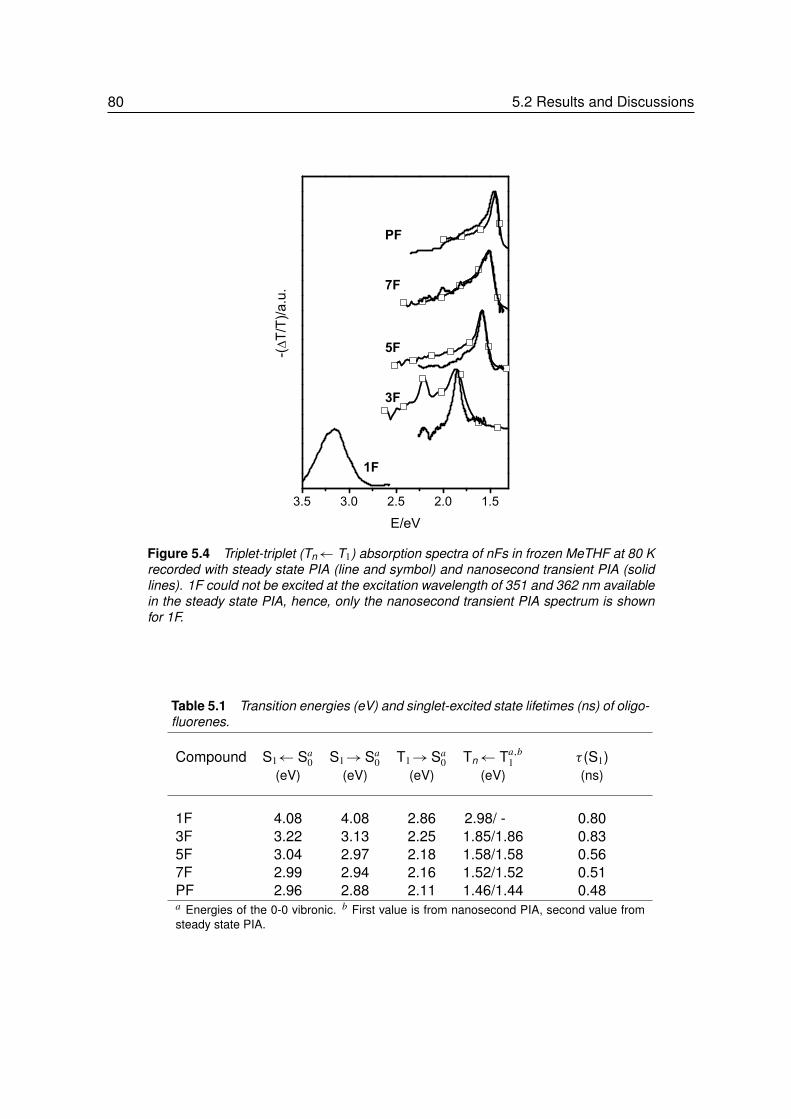
80 5.2 Results and Discussions
3.5 3.0 2.5 2.0 1.5
-(T/
T)/a.u.
PF
7F
1F
5F
3F
E/eV
Figure 5.4 Triplet-triplet (Tn← T1) absorption spectra of nFs in frozen MeTHF at 80 Krecorded with steady state PIA (line and symbol) and nanosecond transient PIA (solidlines). 1F could not be excited at the excitation wavelength of 351 and 362 nm availablein the steady state PIA, hence, only the nanosecond transient PIA spectrum is shownfor 1F.
Table 5.1 Transition energies (eV) and singlet-excited state lifetimes (ns) of oligo-fluorenes.
Compound S1← Sa0 S1→Sa
0 T1→Sa0 Tn← Ta,b
1 τ (S1)(eV) (eV) (eV) (eV) (ns)
1F 4.08 4.08 2.86 2.98/ - 0.803F 3.22 3.13 2.25 1.85/1.86 0.835F 3.04 2.97 2.18 1.58/1.58 0.567F 2.99 2.94 2.16 1.52/1.52 0.51PF 2.96 2.88 2.11 1.46/1.44 0.48a Energies of the 0-0 vibronic. b First value is from nanosecond PIA, second value fromsteady state PIA.
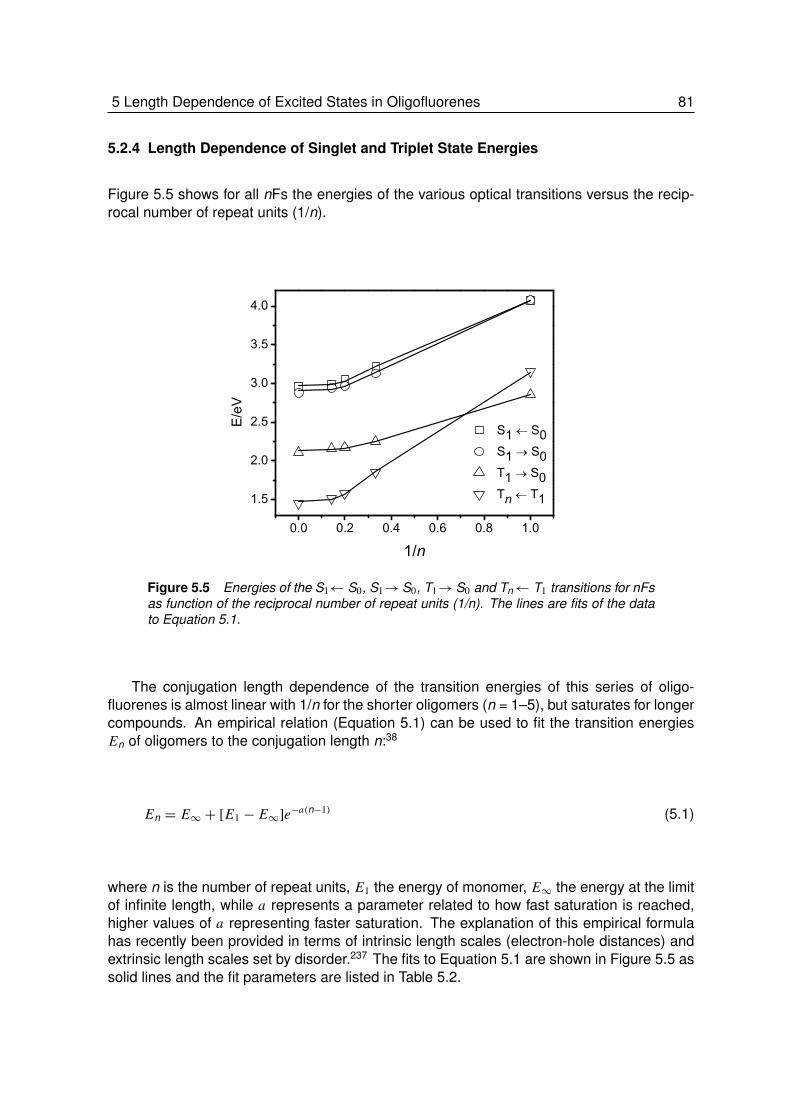
5 Length Dependence of Excited States in Oligofluorenes 81
5.2.4 Length Dependence of Singlet and Triplet State Energies
Figure 5.5 shows for all nFs the energies of the various optical transitions versus the recip-rocal number of repeat units (1/n).
0.0 0.2 0.4 0.6 0.8 1.0
1.5
2.0
2.5
3.0
3.5
4.0
E/e
V
1/n
S1 S0 S1 S0 T1 S0 Tn T1
Figure 5.5 Energies of the S1← S0, S1→S0, T1→S0 and Tn← T1 transitions for nFsas function of the reciprocal number of repeat units (1/n). The lines are fits of the datato Equation 5.1.
The conjugation length dependence of the transition energies of this series of oligo-fluorenes is almost linear with 1/n for the shorter oligomers (n = 1–5), but saturates for longercompounds. An empirical relation (Equation 5.1) can be used to fit the transition energiesEn of oligomers to the conjugation length n:38
En = E∞ + [E1 − E∞]e−a(n−1) (5.1)
where n is the number of repeat units, E1 the energy of monomer, E∞ the energy at the limitof infinite length, while a represents a parameter related to how fast saturation is reached,higher values of a representing faster saturation. The explanation of this empirical formulahas recently been provided in terms of intrinsic length scales (electron-hole distances) andextrinsic length scales set by disorder.237 The fits to Equation 5.1 are shown in Figure 5.5 assolid lines and the fit parameters are listed in Table 5.2.
82 5.3 Summary and Conclusion
Table 5.2 Parameters a and E∞ (eV) describing theconjugation length dependence of transition energies ac-cording to Equation 5.1.
Transition a E∞(eV)
S1← S0 0.74 2.97S1→S0 0.82 2.91T1→S0 0.91 2.14Tn← T1 0.67a 1.47a
a Obtained from the average numberslisted in Table 5.1.
By means of these fits, the convergence of the excited state energies with increasing ncan now be described more quantitatively. The saturation parameter a is slightly higher forphosphorescence than for fluorescence, indicating that the T1 state is more confined thanthe S1 state. This is also reflected in the fact that the difference E1 − E∞, i.e. the totaldispersion of the excited-state energy, is less for T1 (0.72 eV) than for S1 (1.17 eV). Theenergy dispersion and the a of the Tn←T1 absorption indicate that the Tn state is moredelocalized than T1 and S1. The exchange energy 1EST (i.e. the energy difference betweenS1 and T1) shows only a moderate dispersion with chain length: for F1 1EST = 1.22 eV andfor PF 1EST = 0.77 eV.
5.3 Summary and Conclusion
The results presented here provide the first detailed experimental insight in the conjugationlength dependence of the lowest singlet and triplet states of a series of oligofluorenes frommonomer to polymer. The energies of all optical transitions studied (S1← S0, S1→ S0, T1→
S0, and Tn←T1) decrease linearly with the reciprocal number of repeat units until they startto saturate at approximately n > 5, corresponding to more than ten aromatic units. For the T1
state, the dispersion of the energy with chain length is less than for S1 and Tn and it saturatesat slightly shorter conjugation lengths.
Experimental Part
The syntheses of oligo(9,9-dihexyloligofluorene-2,7-diyl)s (nF, n = 1, 3, 5, 7) and poly(9,9-dihexyloligofluorene-2,7-diyl) PF with (n ≈ 50) were performed analogous to published meth-ods.36 The compounds were carefully purified by column chromatography. 2-Methyltetra-hydrofuran (MeTHF) was pre-dried over KOH for 3 days, filtered, distilled from CaH2, and

5 Length Dependence of Excited States in Oligofluorenes 83
stored under inert atmosphere. Sample solutions were prepared in a nitrogen glove box atconcentrations between 10−7 and 10−5 M for the different experiments. For fluorescencestudies the optical density was less than 0.1. All samples were kept under inert atmosphere.During all spectroscopic experiments, samples were held at ≤ 80 K using an Oxford OptistatCF continuous flow cryostat or an Oxford Optistat DN bath cryostat.
UV/Vis and fluorescence spectra were recorded using a Perkin Elmer Lambda 900 andan Edinburgh Instruments FS920 spectrophotometer, respectively. Time-correlated singlephoton counting (TCSPC) photoluminescence was performed on an Edinburgh InstrumentsLifeSpec-PS spectrometer by photoexcitation at 400 nm with a picosecond laser (PicoQuantPDL 800B) operated at 2.5 MHz and using a Peltier-cooled Hamamatsu microchannel platephotomultiplier (R3809U-50) for detection. For 1F (which could not be excited at 400 nmin the TCSPC spectrometer), FWHM 4 ns excitation at 310 nm and detection with differentdelay times (1–17 ns) was used to determine the lifetime.
Phosphorescence was recorded using gated detection. A pulsed Nd:YAG laser (SureliteII-10, Continuum, FWHM 4 ns, 10 Hz) was used for excitation combined with an opticalparametric oscillator (Panther OPO, Continuum) to tune the excitation energy. Spectra wererecorded with an intensified CCD camera (PI-MAX:1024HQ, Princeton Instruments) afterdispersion of the phosphorescent light by a spectrograph at delay times of >100 ns and gatewidths of 0.1–20 ms, to minimize residual fluorescence. All phosphorescence spectra weresmoothed (adjacent averaging) to reduce noise levels.
Two different methods were used for photoinduced absorption (PIA) spectroscopy. Thefirst operated in the nanosecond regime and used the same setup as employed for phospho-rescence measurements incorporating an additional tungsten-halogen lamp as a white-lightprobe. The probe light transmission was recorded with (T ) and without pump laser (T0) us-ing gated detection. The difference between the two spectra divided by T0 afforded the PIAspectrum (−1T
T =T−T0
T0)
For the second method, near steady-state PIA spectra were recorded by excitation of thesample with a mechanically modulated (77 Hz) cw argon ion laser (351 and 362 nm) andmeasuring the change in transmission (1T ) of a tungsten-halogen white light probe beamthrough the sample between 1.0 and 3.5 eV. Si and InGaAs detectors, and a phase sensitivelock-in amplifier referenced to the modulation frequency were used to record1T after disper-sion of the probe light in a monochromator. The excitation power was typically 50 mW witha beam diameter of 2 mm. The PIA signal (−1T
T ) was corrected for the photoluminescence,which was recorded in a separate experiment.

6Triplet Exciton Diffusion of Phosphorescent
Dopants in Polymer Matrices
Abstract
Thin film samples of two green-emitting phosphors fac-tris[2-(4’-tert-butyl phenyl) pyridinato]iridium (Ir(tBu-ppy)3) and bis(2-phenylpyridinato)-3-(3-(tBoc-amino) propoxy) picolinato irid-ium, (Ir(ppy)2(R-pic)) blended in three different polymeric host matrices, polystyrene (PS),poly(9-vinylcarbazole) (PVK) and an all-meta connected co-polymer of 9,9’-didecyl-[3,3’]-bicarbazole and 2,5-diphenyl-[1,3,4]-oxadiazole (coC) are investigated. Time-correlated flu-orescence spectroscopy is used to study triplet exciton diffusion by comparing the decay ki-netics of samples with and without a non-emissive triplet quencher ([2,2’;5’,2”]terthiophene,3T) at different temperatures. The resulting diffusion coefficient DT is determined to be smallat 300 K (1×10⁻⁹ cm2s−1) for both emitters blended into coC, which is the polymer with thelowest diffusion barrier where triplet excitons are expected to be most mobile. It turns out thatthe average free path length as estimated from DT is less than a nanometer and thereforeshorter than the average distance between two dyes. Thus, triplet exciton diffusion via thehost matrix is not significant for any of the samples studied here and can easily be preventedby a prudent choice of host materials.
85
86 6.1 Introduction
6.1 Introduction
When the first observation of electroluminescence (EL) of an organic material was reportedin 19634 it did not excite much interest at that time due to the requirement of high drivevoltages. However, since the late 1980’s, when an organic light-emitting diode (OLED) witha low drive voltage was reported,5 the field of OLEDs has become ever more active, untiltoday when OLEDs are being commercialized in first products. Through the use of polymericmaterials,6 solution processing techniques, such as spin coating and inkjet printing, can beused, which allow for manufacturing these devices at low cost and in large areas.
One property of organic and polymer electroluminescence that still presents problemsis related to the fact that charges injected into an organic or polymer semi-conductor fromthe electrodes or charge transport layers, can recombine into singlet as well as into tripletexcitons.238 Statistically, formation of triplet excitons is favored over singlet excitons by afactor of three, although exceptions to this statistical distribution have been reported (seePreface). Since radiative emission from the triplet state in common organic semi-conductorsis negligible, the formation of triplets represents a significant energy loss channel.
To overcome this restriction, triplet emitters, usually transition metal complexes, havebeen employed.88,89,239 These triplet emitters can harvest both singlet and triplet excitons,and provided they have a high quantum yield for phosphorescence it is possible to approachthe theoretical limit of 100% internal quantum efficiency.91,92
The commercialization of phosphorescent OLEDs and PLEDs in e.g. full color flexibledisplays or lighting applications calls for rationally designed and optimized structures, whichrequires intimate knowledge of the processes involved in such a device. One issue thatneeds to be addressed is the migration of triplet excitons through a device doped with phos-phorescent emitters. Triplet exciton diffusion can affect the efficiency and color properties ofOLEDs.
Exciton diffusion has been studied in organic materials for singlet240 and triplet exci-tons.238 Early work addressed triplet diffusion in organic molecular crystals, disorderedsolids, and polymers comprising simple aromatic molecules such as naphthalene, anthra-cene, and carbazole.241–247 These molecules have a strongly spin-forbidden transition be-tween the singlet ground state (S0) and the first triplet state (T1). Hence, the diffusion of tripletexcitons can only occur via direct electron exchange (Dexter mechanism), which does notrely on the transition dipole moment but requires orbital overlap and scales with the squareof the exchange interaction energy between the two molecules.248,249 More recently, tripletenergy diffusion via the Dexter mechanism has been studied in tris(8-hydroxyquinoline) alu-minum (Alq3, triplet diffusion coefficient DT = 8×10⁻⁸ cm2s−1)250 and in 4,4’-N,N’-dicarbazolebiphenyl (CBP, DT = 1.4×10⁻⁸ cm2s−1)135 in relation to the performance of light-emittingdiodes, and in tetra-p-octylphenylporphyrin (H2TOPP) for use in organic solar cells.251 Tripletexciton diffusion in organic materials may result in the appearance of delayed fluorescencewhen two triplet excitons annihilate and form a singlet excited state (T1 + T1 −→ S1 + S0).This process has received considerable interest in π -conjugated polymers.44,63

6 Triplet Exciton Diffusion of Phosphors in Polymer Matrices 87
For phosphorescent organometallic compounds, the triplet state is radiatively coupled tothe ground state and therefore has a non-negligible transition dipole moment for the T1← S0
transition. For strongly phosphorescent molecules, triplet energy can also be transferred viacoupling of transition dipoles (Förster mechanism).252 Recent examples of Förster tripletenergy transfer for phosphorescent molecules were established for palladium tetrakis(4-carboxyphenyl) porphyrin layers (diffusion coefficient DT = 8×10⁻⁷ cm2s−1)253,254 and fortris(2,2’-bipyridine)ruthenium(II) units grafted on a polymer chain (DT = 2×10⁻⁵ cm2s−1).136
In contrast, however, the distance dependence of triplet exciton diffusion in iridium-coreddendrimers has been found to be consistent with the exchange mechanism.255
Application of triplet diffusion processes allows making OLEDs with excellent perfor-mance, e.g. multilayer white light OLEDs (WOLEDs) have been realized in which the emis-sion colors of three distinct emission layers/centers are balanced by tuning internal diffusionprocesses to emit white light.121,123,125 On the other hand, triplet exciton diffusion can alsobe unfavorable as it may lead to triplet-triplet annihilation255,256 or to concentration quenchingof the phosphorescence as found for iridium complexes in a CBP host.130
Several studies address the process of triplet exciton confinement in guest:host sys-tems. Triplet confinement in relation to the energy difference between the triplet levels ofvarious iridium guests and that of polymeric (poly(9-vinylcarbazole) (PVK) vs. poly(9,9-dioctylfluorene) (PF))131,132 and small molecule hosts (CBP vs. 4,4’-N,N’-dicarbazolyl-2,2’-dimethyl biphenyl (CDBP)) have been investigated.134 It was shown that triplet excitons canbe confined to the guest if the triplet state of the dopant has a lower energy than that of thehost. Such confinement generally results in an increase in efficiency of the electrophospho-rescent devices. For co-polymers, in which the phosphorescent guest molecule is covalentlylinked to the host polymer, it was found that introducing a non-conjugative, long methylenespacer reduces the triplet energy back transfer from guest to host when their triplet energiesare similar. The synthesis of polymer hosts that combine good charge injection and transportwith high-energy triplet levels has been demonstrated recently.257,258
In this chapter, the diffusion of triplet excitons of phosphorescent guest molecules througha polymeric host material is studied. To this end phosphorescent iridium dyes are blendedinto thin films of polymeric hosts. Figure 6.1 gives an impression of energy levels and pos-sible transitions in blends of a triplet emitter (and a quencher) in a polymeric host. In such asample, triplet excitons on the phosphorescent guest are not necessarily confined and diffu-sion may occur. In fact, it was recently shown that luminescent concentration quenching in aphosphorescent iridium complex embedded in a host film is controlled by dipole-dipole deac-tivating interactions.130 The same Förster mechanism can be responsible for direct transferof triplet energy between guest molecules.
However, apart from this direct transfer it is also possible that triplet diffusion occurs viaan indirect mechanism, involving the triplet energy level of the matrix. In this case thermalexcitation of the triplet state of the guest can populate the triplet state of the host, followedby triplet diffusion via electron exchange and, eventually, localization of the triplet state onanother phosphorescent guest.
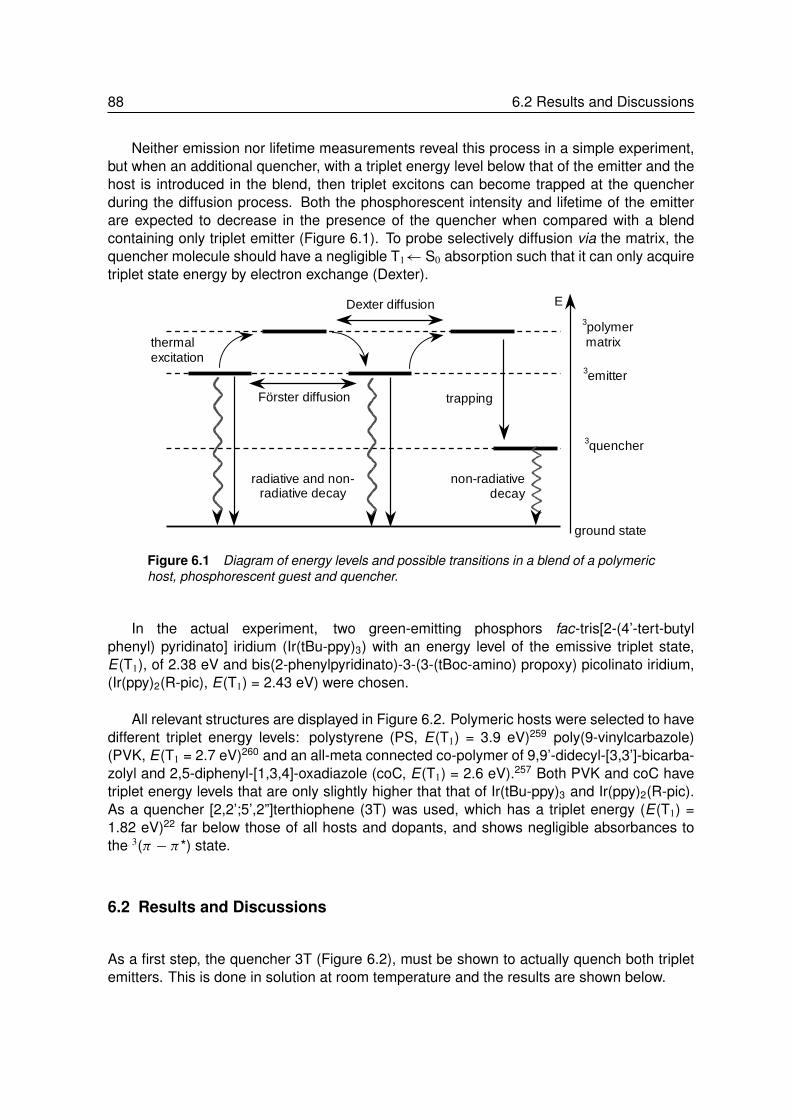
88 6.2 Results and Discussions
Neither emission nor lifetime measurements reveal this process in a simple experiment,but when an additional quencher, with a triplet energy level below that of the emitter and thehost is introduced in the blend, then triplet excitons can become trapped at the quencherduring the diffusion process. Both the phosphorescent intensity and lifetime of the emitterare expected to decrease in the presence of the quencher when compared with a blendcontaining only triplet emitter (Figure 6.1). To probe selectively diffusion via the matrix, thequencher molecule should have a negligible T1← S0 absorption such that it can only acquiretriplet state energy by electron exchange (Dexter).
ground state
3polymer matrix
3emitter
3quencher
radiative and non-radiative decay
non-radiative decay
Dexter diffusion
trapping
E
Förster diffusion
thermal excitation
Figure 6.1 Diagram of energy levels and possible transitions in a blend of a polymerichost, phosphorescent guest and quencher.
In the actual experiment, two green-emitting phosphors fac-tris[2-(4’-tert-butylphenyl) pyridinato] iridium (Ir(tBu-ppy)3) with an energy level of the emissive triplet state,E(T1), of 2.38 eV and bis(2-phenylpyridinato)-3-(3-(tBoc-amino) propoxy) picolinato iridium,(Ir(ppy)2(R-pic), E(T1) = 2.43 eV) were chosen.
All relevant structures are displayed in Figure 6.2. Polymeric hosts were selected to havedifferent triplet energy levels: polystyrene (PS, E(T1) = 3.9 eV)259 poly(9-vinylcarbazole)(PVK, E(T1 = 2.7 eV)260 and an all-meta connected co-polymer of 9,9’-didecyl-[3,3’]-bicarba-zolyl and 2,5-diphenyl-[1,3,4]-oxadiazole (coC, E(T1) = 2.6 eV).257 Both PVK and coC havetriplet energy levels that are only slightly higher that that of Ir(tBu-ppy)3 and Ir(ppy)2(R-pic).As a quencher [2,2’;5’,2”]terthiophene (3T) was used, which has a triplet energy (E(T1) =1.82 eV)22 far below those of all hosts and dopants, and shows negligible absorbances tothe 3(π − π*) state.
6.2 Results and Discussions
As a first step, the quencher 3T (Figure 6.2), must be shown to actually quench both tripletemitters. This is done in solution at room temperature and the results are shown below.
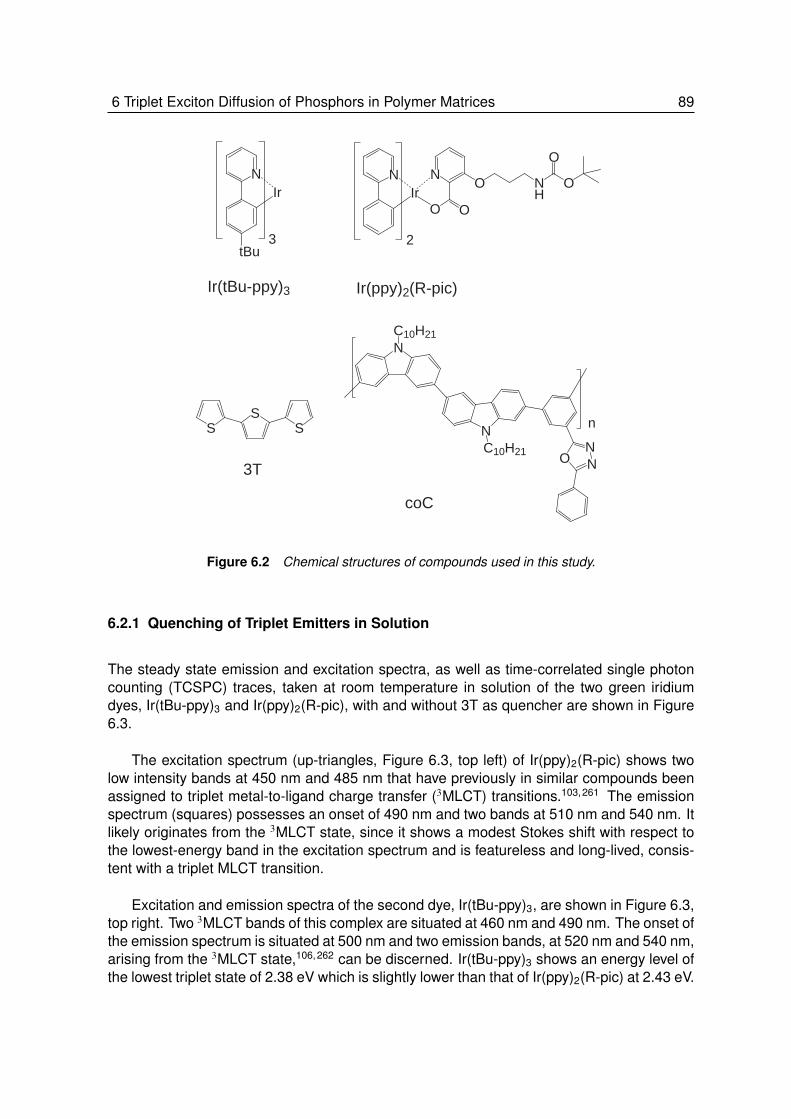
6 Triplet Exciton Diffusion of Phosphors in Polymer Matrices 89
SS
S
3T
coC
Ir(tBu-ppy)3 Ir(ppy)2(R-pic)
n
NIr
3tBu
NIr
2
N
OO
O NH
O
O
N
N
O NN
C10H21
C10H21
Figure 6.2 Chemical structures of compounds used in this study.
6.2.1 Quenching of Triplet Emitters in Solution
The steady state emission and excitation spectra, as well as time-correlated single photoncounting (TCSPC) traces, taken at room temperature in solution of the two green iridiumdyes, Ir(tBu-ppy)3 and Ir(ppy)2(R-pic), with and without 3T as quencher are shown in Figure6.3.
The excitation spectrum (up-triangles, Figure 6.3, top left) of Ir(ppy)2(R-pic) shows twolow intensity bands at 450 nm and 485 nm that have previously in similar compounds beenassigned to triplet metal-to-ligand charge transfer (3MLCT) transitions.103,261 The emissionspectrum (squares) possesses an onset of 490 nm and two bands at 510 nm and 540 nm. Itlikely originates from the 3MLCT state, since it shows a modest Stokes shift with respect tothe lowest-energy band in the excitation spectrum and is featureless and long-lived, consis-tent with a triplet MLCT transition.
Excitation and emission spectra of the second dye, Ir(tBu-ppy)3, are shown in Figure 6.3,top right. Two 3MLCT bands of this complex are situated at 460 nm and 490 nm. The onset ofthe emission spectrum is situated at 500 nm and two emission bands, at 520 nm and 540 nm,arising from the 3MLCT state,106,262 can be discerned. Ir(tBu-ppy)3 shows an energy level ofthe lowest triplet state of 2.38 eV which is slightly lower than that of Ir(ppy)2(R-pic) at 2.43 eV.
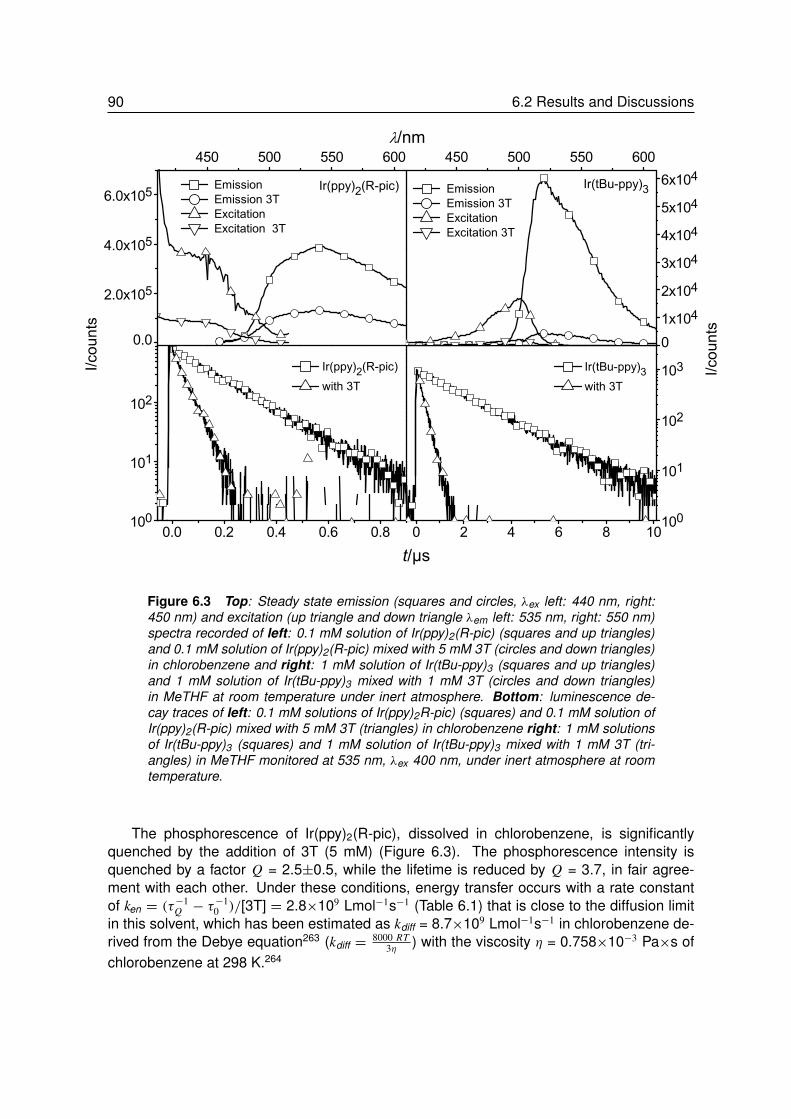
90 6.2 Results and Discussions
01x1042x1043x1044x1045x1046x104
100
101
102
100
101
102
103
0.0 0.2 0.4 0.6 0.8 0 2 4 6 8 10
450 500 550 600 450 500 550 600
0.0
2.0x10⁵
4.0x10⁵
6.0x10⁵ Emission Emission 3T Excitation Excitation 3T
I/cou
nts
Emission Emission 3T Excitation Excitation 3T
I/cou
nts
Ir(ppy)2(R-pic) with 3T
Ir(tBu-ppy)3 with 3T
/nm
t/µs
Ir(tBu-ppy)3Ir(ppy)2(R-pic)
Figure 6.3 Top: Steady state emission (squares and circles, λex left: 440 nm, right:450 nm) and excitation (up triangle and down triangle λem left: 535 nm, right: 550 nm)spectra recorded of left: 0.1 mM solution of Ir(ppy)2(R-pic) (squares and up triangles)and 0.1 mM solution of Ir(ppy)2(R-pic) mixed with 5 mM 3T (circles and down triangles)in chlorobenzene and right: 1 mM solution of Ir(tBu-ppy)3 (squares and up triangles)and 1 mM solution of Ir(tBu-ppy)3 mixed with 1 mM 3T (circles and down triangles)in MeTHF at room temperature under inert atmosphere. Bottom: luminescence de-cay traces of left: 0.1 mM solutions of Ir(ppy)2R-pic) (squares) and 0.1 mM solution ofIr(ppy)2(R-pic) mixed with 5 mM 3T (triangles) in chlorobenzene right: 1 mM solutionsof Ir(tBu-ppy)3 (squares) and 1 mM solution of Ir(tBu-ppy)3 mixed with 1 mM 3T (tri-angles) in MeTHF monitored at 535 nm, λex 400 nm, under inert atmosphere at roomtemperature.
The phosphorescence of Ir(ppy)2(R-pic), dissolved in chlorobenzene, is significantlyquenched by the addition of 3T (5 mM) (Figure 6.3). The phosphorescence intensity isquenched by a factor Q = 2.5±0.5, while the lifetime is reduced by Q = 3.7, in fair agree-ment with each other. Under these conditions, energy transfer occurs with a rate constantof ken = (τ
−1Q − τ
−10 )/[3T] = 2.8×10⁹ Lmol−1s−1 (Table 6.1) that is close to the diffusion limit
in this solvent, which has been estimated as kdiff = 8.7×10⁹ Lmol−1s−1 in chlorobenzene de-rived from the Debye equation263 (kdiff =
8000 RT3η ) with the viscosity η = 0.758×10⁻³ Pa×s of
chlorobenzene at 298 K.264
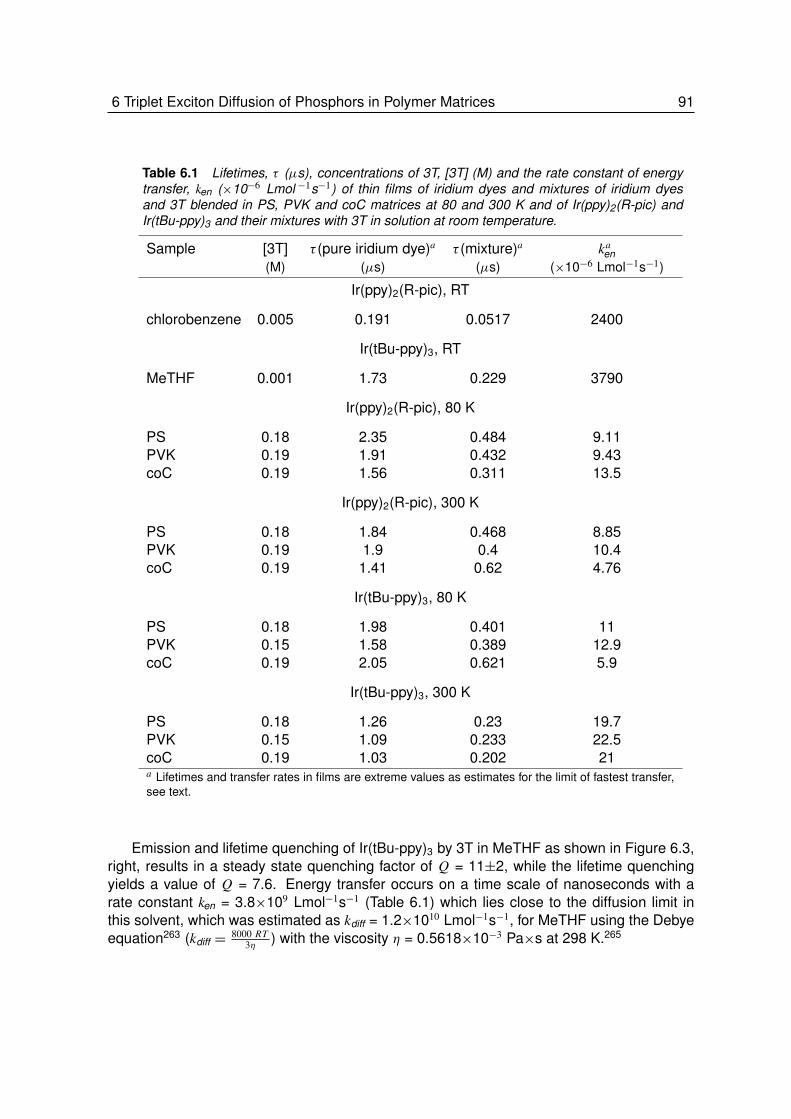
6 Triplet Exciton Diffusion of Phosphors in Polymer Matrices 91
Table 6.1 Lifetimes, τ (µs), concentrations of 3T, [3T] (M) and the rate constant of energytransfer, ken (×10−6 Lmol −1s−1) of thin films of iridium dyes and mixtures of iridium dyesand 3T blended in PS, PVK and coC matrices at 80 and 300 K and of Ir(ppy)2(R-pic) andIr(tBu-ppy)3 and their mixtures with 3T in solution at room temperature.
Sample [3T] τ (pure iridium dye)a τ (mixture)a kaen
(M) (µs) (µs) (×10−6 Lmol−1s−1)
Ir(ppy)2(R-pic), RT
chlorobenzene 0.005 0.191 0.0517 2400
Ir(tBu-ppy)3, RT
MeTHF 0.001 1.73 0.229 3790
Ir(ppy)2(R-pic), 80 K
PS 0.18 2.35 0.484 9.11PVK 0.19 1.91 0.432 9.43coC 0.19 1.56 0.311 13.5
Ir(ppy)2(R-pic), 300 K
PS 0.18 1.84 0.468 8.85PVK 0.19 1.9 0.4 10.4coC 0.19 1.41 0.62 4.76
Ir(tBu-ppy)3, 80 K
PS 0.18 1.98 0.401 11PVK 0.15 1.58 0.389 12.9coC 0.19 2.05 0.621 5.9
Ir(tBu-ppy)3, 300 K
PS 0.18 1.26 0.23 19.7PVK 0.15 1.09 0.233 22.5coC 0.19 1.03 0.202 21a Lifetimes and transfer rates in films are extreme values as estimates for the limit of fastest transfer,see text.
Emission and lifetime quenching of Ir(tBu-ppy)3 by 3T in MeTHF as shown in Figure 6.3,right, results in a steady state quenching factor of Q = 11±2, while the lifetime quenchingyields a value of Q = 7.6. Energy transfer occurs on a time scale of nanoseconds with arate constant ken = 3.8×10⁹ Lmol−1s−1 (Table 6.1) which lies close to the diffusion limit inthis solvent, which was estimated as kdiff = 1.2×10¹⁰ Lmol−1s−1, for MeTHF using the Debyeequation263 (kdiff =
8000 RT3η ) with the viscosity η = 0.5618×10⁻³ Pa×s at 298 K.265

92 6.2 Results and Discussions
It can be concluded that 3T, with its T1 energy level at 1.82 eV,22 is a quencher for the3MLCT states of the two iridium dyes investigated here.
6.2.2 Quenching of Triplet Emitters in Various Polymer Matrices
As a next step the decay kinetics of thin films were studied. Films of coC, PVK or PS eachcontaining either 8 wt.-% of one of the iridium dyes or 7 wt.-% of one of the iridium dyesplus 4 wt.-% 3T were spin coated from chlorobenzene under N2. The decay traces at 80 and300 K of these samples are shown in Figure 6.4 for Ir(ppy)2(R-pic) containing films and inFigure 6.5 for Ir(tBu-ppy)3 containing films.
If triplet excitons are transferred, or diffuse, via the polymer host from one dopant to thenext an initial activation barrier needs to be overcome, since the polymer has a higher tripletenergy than the dopant (Figure 6.1). The activation energy is usually provided by thermalenergy, thus the triplet diffusion processes, and the resulting quenching, are expected to bemore pronounced at higher temperatures.
Due to that same activation energy needed to promote the triplet exciton from dopantto host energy level, the difference in triplet energy level between host and dopant will playa crucial role in diffusional triplet energy transfer. The larger the difference in energy level,the smaller the chance of thermal activation of a dopant’s exciton onto the polymer level willbe. Thus, the diffusional quenching is expected to be decreasing for the studied samplesin the order coC (E(T1) = 2.6 eV), PVK (E(T1) = 2.7 eV), PS (E(T1) = 3.9 eV). Additionally,samples that contain Ir(ppy)2(R-pic), with its 50 meV higher triplet level, should show strongerquenching by triplet exciton diffusion via the host than those containing Ir(tBu-ppy)3.
Therefore, quenching via exciton diffusion is expected to be strongest for blends ofIr(ppy)2(R-pic) in coC at high temperatures with the closest match in triplet energies andmost thermal activation energy available, while it is expected to be weaker for Ir(tBu-ppy)3
containing samples as well as PVK and certainly for PS since in those cases the energylevels differ strongly, especially at low temperatures, i.e. little available thermal energy.
However, from the actual measurements none of the expected effects is evident. InFigure 6.4 and 6.5 each panel shows traces of two corresponding samples differing only in3T content. It appears that all the traces undergo negligible change upon addition of 3T,which indicates negligible quenching and thus negligible diffusion.
The only apparent systematic effect on the lifetime is exerted by the changes in tem-perature. Upon increasing the temperature from 80 to 300 K, samples differing only in 3Tcontent, show the same decrease in lifetime, regardless of their 3T content. Since the effectoccurs for 3T-containing (circles) as well as 3T-free (squares) samples to the same extent itis clearly not an effect of exciton diffusion and quenching.
Upon closer examination of the solid state decay traces it seems that in 3T-containingsamples of Ir(ppy)2(R-pic) in PVK (80 and 300 K) and Ir(ppy)2(R-pic) in PS (80 K) as well
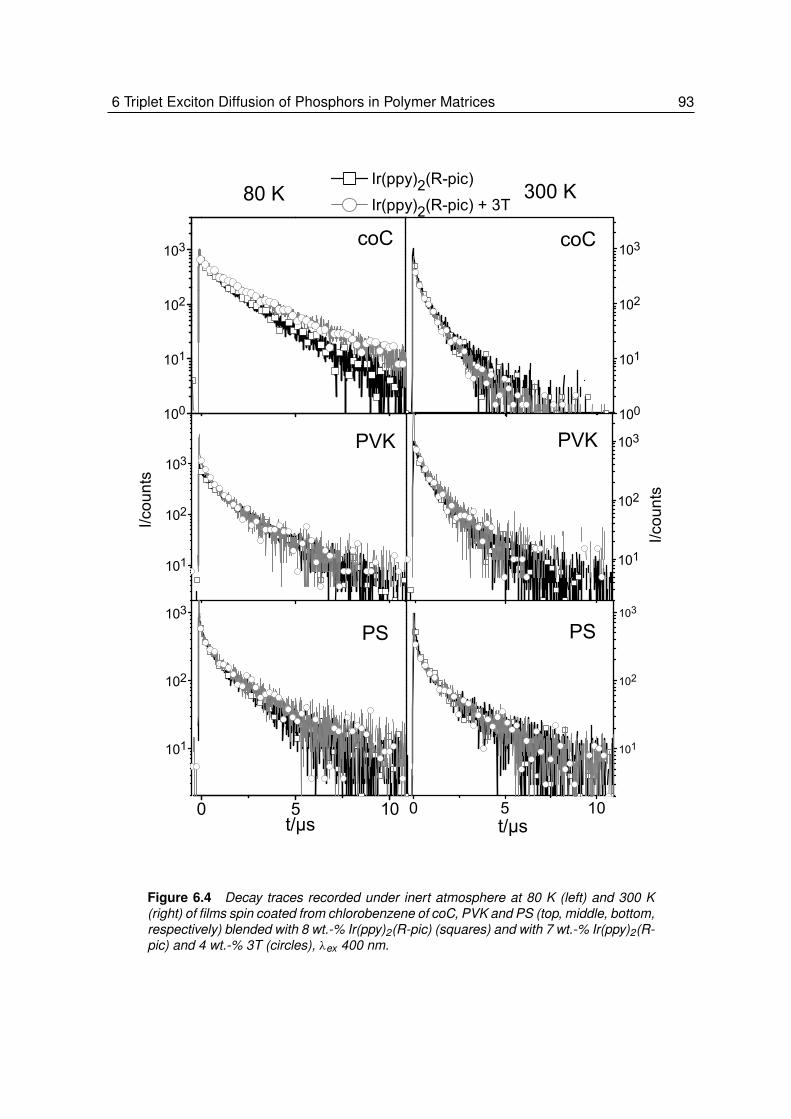
6 Triplet Exciton Diffusion of Phosphors in Polymer Matrices 93
100
101
102
103
101
102
103
101
102
103
101
102
103
101
102
103
0 5 100 5 10
100
101
102
103
80 K 300 K
PS PS
PVK
coC
PVK
coC
Ir(ppy)2(R-pic) Ir(ppy)2(R-pic) + 3T
I/co
unts
I/co
unts
t/µs
t/µs
Figure 6.4 Decay traces recorded under inert atmosphere at 80 K (left) and 300 K(right) of films spin coated from chlorobenzene of coC, PVK and PS (top, middle, bottom,respectively) blended with 8 wt.-% Ir(ppy)2(R-pic) (squares) and with 7 wt.-% Ir(ppy)2(R-pic) and 4 wt.-% 3T (circles), λex 400 nm.
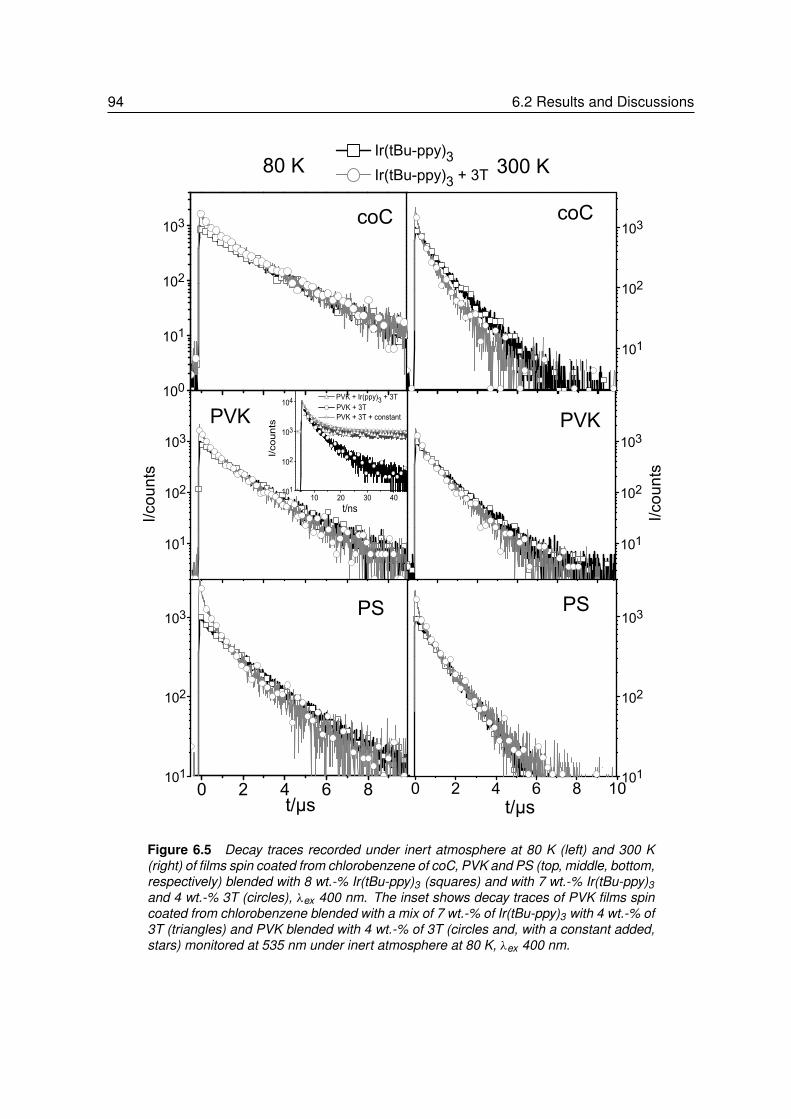
94 6.2 Results and Discussions
101
102
103
101
102
103
101
102
103
101
102
103
101
102
103
0 2 4 6 8 100 2 4 6 8
100
101
102
103
Ir(tBu-ppy)3 Ir(tBu-ppy)3 + 3T80 K 300 K
PS
PVK
PS
PVK
coCcoC
10 20 30 40101
102
103
104 PVK + Ir(ppy)3 + 3T
I/co
unts
t/ns
PVK + 3T PVK + 3T + constant
I/co
unts
I/co
unts
t/µs
t/µs
Figure 6.5 Decay traces recorded under inert atmosphere at 80 K (left) and 300 K(right) of films spin coated from chlorobenzene of coC, PVK and PS (top, middle, bottom,respectively) blended with 8 wt.-% Ir(tBu-ppy)3 (squares) and with 7 wt.-% Ir(tBu-ppy)3and 4 wt.-% 3T (circles), λex 400 nm. The inset shows decay traces of PVK films spincoated from chlorobenzene blended with a mix of 7 wt.-% of Ir(tBu-ppy)3 with 4 wt.-% of3T (triangles) and PVK blended with 4 wt.-% of 3T (circles and, with a constant added,stars) monitored at 535 nm under inert atmosphere at 80 K, λex 400 nm.
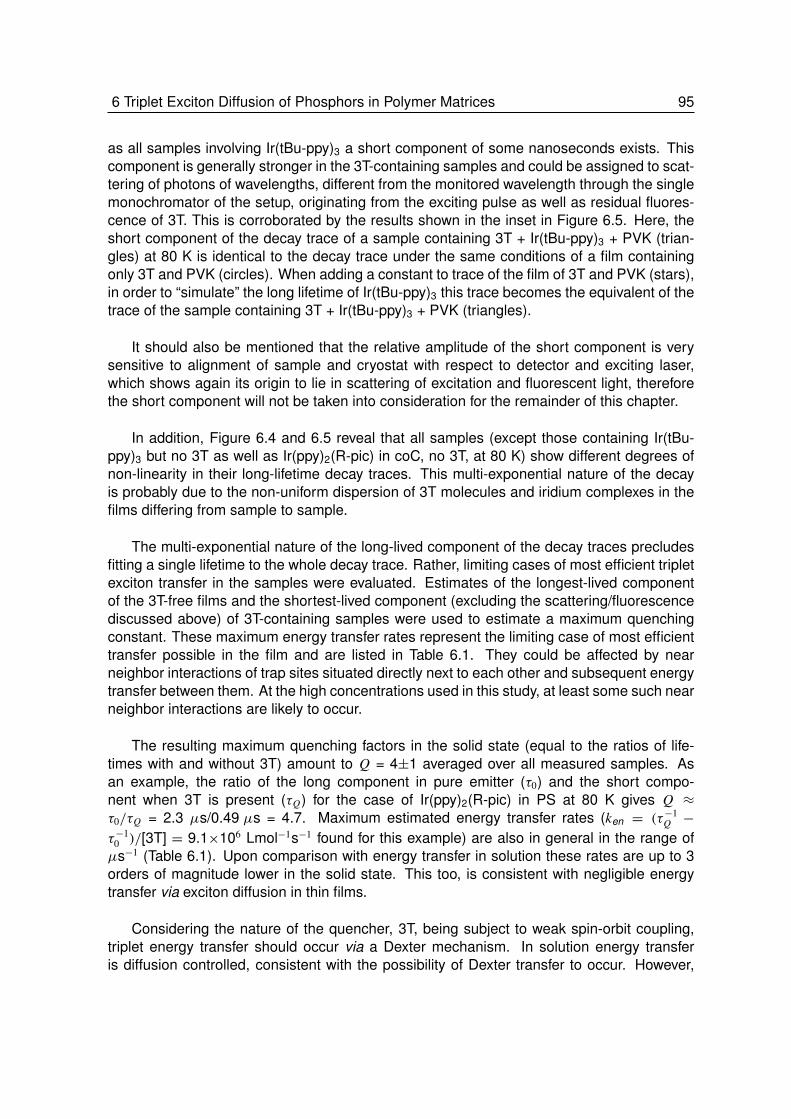
6 Triplet Exciton Diffusion of Phosphors in Polymer Matrices 95
as all samples involving Ir(tBu-ppy)3 a short component of some nanoseconds exists. Thiscomponent is generally stronger in the 3T-containing samples and could be assigned to scat-tering of photons of wavelengths, different from the monitored wavelength through the singlemonochromator of the setup, originating from the exciting pulse as well as residual fluores-cence of 3T. This is corroborated by the results shown in the inset in Figure 6.5. Here, theshort component of the decay trace of a sample containing 3T + Ir(tBu-ppy)3 + PVK (trian-gles) at 80 K is identical to the decay trace under the same conditions of a film containingonly 3T and PVK (circles). When adding a constant to trace of the film of 3T and PVK (stars),in order to “simulate” the long lifetime of Ir(tBu-ppy)3 this trace becomes the equivalent of thetrace of the sample containing 3T + Ir(tBu-ppy)3 + PVK (triangles).
It should also be mentioned that the relative amplitude of the short component is verysensitive to alignment of sample and cryostat with respect to detector and exciting laser,which shows again its origin to lie in scattering of excitation and fluorescent light, thereforethe short component will not be taken into consideration for the remainder of this chapter.
In addition, Figure 6.4 and 6.5 reveal that all samples (except those containing Ir(tBu-ppy)3 but no 3T as well as Ir(ppy)2(R-pic) in coC, no 3T, at 80 K) show different degrees ofnon-linearity in their long-lifetime decay traces. This multi-exponential nature of the decayis probably due to the non-uniform dispersion of 3T molecules and iridium complexes in thefilms differing from sample to sample.
The multi-exponential nature of the long-lived component of the decay traces precludesfitting a single lifetime to the whole decay trace. Rather, limiting cases of most efficient tripletexciton transfer in the samples were evaluated. Estimates of the longest-lived componentof the 3T-free films and the shortest-lived component (excluding the scattering/fluorescencediscussed above) of 3T-containing samples were used to estimate a maximum quenchingconstant. These maximum energy transfer rates represent the limiting case of most efficienttransfer possible in the film and are listed in Table 6.1. They could be affected by nearneighbor interactions of trap sites situated directly next to each other and subsequent energytransfer between them. At the high concentrations used in this study, at least some such nearneighbor interactions are likely to occur.
The resulting maximum quenching factors in the solid state (equal to the ratios of life-times with and without 3T) amount to Q = 4±1 averaged over all measured samples. Asan example, the ratio of the long component in pure emitter (τ0) and the short compo-nent when 3T is present (τQ) for the case of Ir(ppy)2(R-pic) in PS at 80 K gives Q ≈τ0/τQ = 2.3 µs/0.49 µs = 4.7. Maximum estimated energy transfer rates (ken = (τ−1
Q −
τ−10 )/[3T] = 9.1×10⁶ Lmol−1s−1 found for this example) are also in general in the range ofµs−1 (Table 6.1). Upon comparison with energy transfer in solution these rates are up to 3orders of magnitude lower in the solid state. This too, is consistent with negligible energytransfer via exciton diffusion in thin films.
Considering the nature of the quencher, 3T, being subject to weak spin-orbit coupling,triplet energy transfer should occur via a Dexter mechanism. In solution energy transferis diffusion controlled, consistent with the possibility of Dexter transfer to occur. However,

96 6.2 Results and Discussions
in the solid state molecular movement to bring reactants close enough and to make (thevery short-range) Dexter energy transfer possible is impeded, corroborating the absence ofquenching.
Supporting this interpretation, it should be mentioned that in the next chapter a quench-ing experiment in the solid state of Ir(tBu-ppy)3 with a phosphor of low triplet energy level(∼2 eV) and large phosphorescence quantum yield is described. The rate constants forenergy transfer resulting from these experiments are larger by 2 orders of magnitude thanthe ones found here. When using a phosphorescent quencher, which is subject to strongspin-orbit coupling, energy transfer can occur via the Förster mechanism since the spin-orbitcoupling renders the T1← S0 transition partially allowed. The low-energy phosphor showsfar more efficient quenching at even lower concentrations, than 3T, which cannot take part ina Förster transfer because its T1← S0 transition is strongly spin-forbidden. These findings,too, provide evidence that the absence of quenching by 3T in the experiments here can beinterpreted to indicate that thermal excitation from the phosphorescent dopants to polymerhost is an unimportant process, even when the required energy is modest (∼0.2 eV for thecoC matrix).
To quantify the results the diffusion constant of the triplet exciton, DT, was estimated forboth dyes in coC, the polymer where the largest diffusional effects can be expected, usingthe equation:266
DT =kdiff
4 πR∗NA(6.1)
where kdiff corresponds to the energy transfer rate estimated from lifetime data, R∗ is thedistance at which the transfer occurs (estimated to be the sum of the radii of the participantsin energy transfer) and NA is Avogadro’s constant.266 DT was estimated to be in the order of1×10−9 cm2s−1 in both cases.
The average free path length, x , was estimated from DT using:266,267
x =√
2DTτ0 (6.2)
where τ0 is the lifetime of the iridium dye in a 3T-free film. The upper limit for the aver-age free path length was estimated to be of the order of x = 0.5 nm for both dyes. Thisis less than the nearest neighbor distance between quencher molecules, Rc, when es-timating this nearest neighbor distance from the average spherical volume available to aquencher molecule at number density ρN is Rc = [3/(4πNAρ
−1N )]
13 and equals Rc = 1.3 nm at
ρN = 8.24×10⁻²¹ molecules/cm3.
Thus, even when assessing the limiting case of maximum quenching, triplet excitonsturn out not to diffuse via the host in the solid matrices used in this study. Hence, thermalexcitation from the phosphorescent dopants to polymer host is a minor process, even whenthe energy required is modest (∼0.2 eV for the coC matrix).

6 Triplet Exciton Diffusion of Phosphors in Polymer Matrices 97
6.3 Conclusion
In conclusion, there is no apparent triplet exciton diffusion and quenching via the host in thethin film samples studied here. No (systematic) dependence on temperature and host tripletlevel could be determined. Average free path lengths for the diffusion of triplet excitons forboth iridium dyes was estimated (using the diffusion coefficient, DT = 1×10⁻⁹ cm2s−1) to be≤0.5 nm in coC which is less than half the estimated average dye-to-dye distance.
Thus, when choosing triplet emitters with triplet energies below that of the polymer matrixthe process of diffusion via the matrix generally becomes inefficient. Therefore, preventingenergy loss through triplet exciton diffusion via the host turns out to be an easily avoidable,chemically tunable problem.
Experimental Part
Ir(tBu-ppy)3,268 coC257 and 3T155 have been synthesized using standard procedures andwere generously supplied by Jolanda Bastiaansen, Nicole Kiggen and Bea Langeveld (TNOScience and Industry). Ir(ppy)2(R-pic) has been a generous gift from Michel Fransen andHenk Janssen (SyMO-Chem BV), and its synthesis will be published elsewhere. Anhydrous,sealed chlorobenzene was purchased from Aldrich, kept under inert atmosphere at all timesand used as received. Polystyrene (Mw = 250 kDa) and PVK (Mw = 40 kDa) were purchasedfrom Aldrich and Polysciences, respectively, and used as received. 2-Methyltetrahydrofuran(MeTHF) was pre-dried over KOH for 3 days, filtered, distilled from CaH2, and stored underinert atmosphere.
Sample solutions were prepared in a nitrogen-filled glove box using dry MeTHF or drychlorobenzene. Thin film samples were spin coated at 1100 rpm using an Electronic MicroSystems Photo Resist Spinner (Model 4000) inside the glovebox. The polymer solutionsused for spin coating were prepared in the same glovebox by stirring over night and heatingto 70 ◦C for 1 hour. After that, the solutions were immediately spin coated. All sampleswere kept under inert atmosphere. The incorporation of 3T in the polymers was proven byquantitative UV experiments comparing absorbances of film with solutions from which thefilms were spin coated. Furthermore, the corresponding emission spectra demonstrated noapparent aggregation effects.
Film thicknesses were determined using a Tencor P-10 Surface Profilometer.
During the spectroscopic experiments, thin film samples were held at 80 or 300 K undernitrogen atmosphere using an Oxford Optistat CF continuous flow cryostat or an OxfordOptistat DN bath cryostat.
UV/Vis and fluorescence spectra were recorded using a Perkin Elmer Lambda 900 andan Edinburgh Instruments FS920 spectrophotometer, respectively. Time-correlated single

98 Experimental Part
photon counting (TCSPC) photoluminescence was performed on an Edinburgh InstrumentsLifeSpec-PS spectrometer by photoexcitation at 400 nm with a picosecond-pulse laser (Pi-coQuant PDL 800B) operated at 2.5 MHz, 400 kHz or 40 kHz and using a Peltier-cooledHamamatsu microchannel plate photomultiplier (R3809U-50) for detection.


7Phosphorescent Resonant Energy Transfer
Abstract
The mechanism for triplet energy transfer from the green-emitting fac-tris[2-(4’-tert-butylphenyl) pyridinato] iridium (Ir(tBu-ppy)3) complex to the red-emitting bis[2-(2’- benzothienyl)pyridinato](acetylacetonato) iridium (Ir(btp)2(acac)) phosphor has been investigated usingsteady-state and time-resolved photoluminescence spectroscopy. To differentiate betweenthe two common mechanisms for energy transfer, i.e. the direct exchange of electrons (Dex-ter transfer) or the coupling of transition dipoles (Förster transfer), [2,2’;5’,2”]terthiophene(3T) was also used as triplet energy acceptor. Unlike Ir(btp)2(acac), 3T can only be active ina Dexter transfer because it has a negligible ground state absorption to the 3(π − π*) state.The experiments demonstrate that in semi-dilute solution, the 3MLCT state of Ir(tBu-ppy)3
can transfer its triplet energy to the lower-lying 3(π − π*) states of both Ir(btp)2(acac) and3T. For both acceptors, this transfer occurs via a diffusion controlled reaction with a com-mon rate constant (ken = 3.8×10⁹ Lmol−1s−1). In solid polymer matrix, the two acceptors,however, show entirely different behavior. The 3MLCT phosphorescence of Ir(tBu-ppy)3 isstrongly quenched by Ir(btp)2(acac) but not by 3T. This reveals that under conditions wheremolecular diffusion is inhibited, triplet energy transfer only occurs via the Förster mecha-nism, provided that the transition dipole moments involved on energy donor and acceptorare not negligible. Using the Förster radius for triplet energy transfer from Ir(tBu-ppy)3 toIr(btp)2(acac) of R0 = 3.02 nm, the experimentally observed quenching is found to agreequantitatively with a Förster model that assumes a random distribution of acceptors in a rigidmatrix.
101
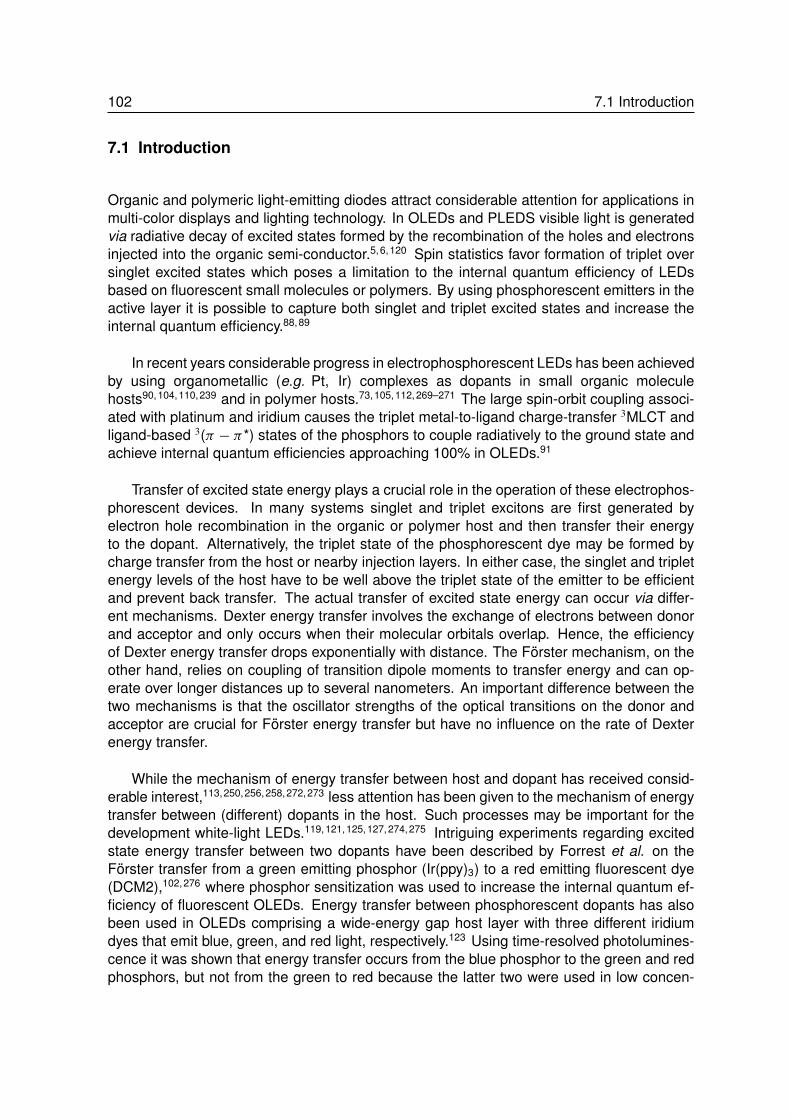
102 7.1 Introduction
7.1 Introduction
Organic and polymeric light-emitting diodes attract considerable attention for applications inmulti-color displays and lighting technology. In OLEDs and PLEDS visible light is generatedvia radiative decay of excited states formed by the recombination of the holes and electronsinjected into the organic semi-conductor.5,6,120 Spin statistics favor formation of triplet oversinglet excited states which poses a limitation to the internal quantum efficiency of LEDsbased on fluorescent small molecules or polymers. By using phosphorescent emitters in theactive layer it is possible to capture both singlet and triplet excited states and increase theinternal quantum efficiency.88,89
In recent years considerable progress in electrophosphorescent LEDs has been achievedby using organometallic (e.g. Pt, Ir) complexes as dopants in small organic moleculehosts90,104,110,239 and in polymer hosts.73,105,112,269–271 The large spin-orbit coupling associ-ated with platinum and iridium causes the triplet metal-to-ligand charge-transfer 3MLCT andligand-based 3(π − π*) states of the phosphors to couple radiatively to the ground state andachieve internal quantum efficiencies approaching 100% in OLEDs.91
Transfer of excited state energy plays a crucial role in the operation of these electrophos-phorescent devices. In many systems singlet and triplet excitons are first generated byelectron hole recombination in the organic or polymer host and then transfer their energyto the dopant. Alternatively, the triplet state of the phosphorescent dye may be formed bycharge transfer from the host or nearby injection layers. In either case, the singlet and tripletenergy levels of the host have to be well above the triplet state of the emitter to be efficientand prevent back transfer. The actual transfer of excited state energy can occur via differ-ent mechanisms. Dexter energy transfer involves the exchange of electrons between donorand acceptor and only occurs when their molecular orbitals overlap. Hence, the efficiencyof Dexter energy transfer drops exponentially with distance. The Förster mechanism, on theother hand, relies on coupling of transition dipole moments to transfer energy and can op-erate over longer distances up to several nanometers. An important difference between thetwo mechanisms is that the oscillator strengths of the optical transitions on the donor andacceptor are crucial for Förster energy transfer but have no influence on the rate of Dexterenergy transfer.
While the mechanism of energy transfer between host and dopant has received consid-erable interest,113,250,256,258,272,273 less attention has been given to the mechanism of energytransfer between (different) dopants in the host. Such processes may be important for thedevelopment white-light LEDs.119,121,125,127,274,275 Intriguing experiments regarding excitedstate energy transfer between two dopants have been described by Forrest et al. on theFörster transfer from a green emitting phosphor (Ir(ppy)3) to a red emitting fluorescent dye(DCM2),102,276 where phosphor sensitization was used to increase the internal quantum ef-ficiency of fluorescent OLEDs. Energy transfer between phosphorescent dopants has alsobeen used in OLEDs comprising a wide-energy gap host layer with three different iridiumdyes that emit blue, green, and red light, respectively.123 Using time-resolved photolumines-cence it was shown that energy transfer occurs from the blue phosphor to the green and redphosphors, but not from the green to red because the latter two were used in low concen-

7 Phosphorescent Resonant Energy Transfer 103
trations.123 More recently, Förster triplet energy transfer was considered as the mechanismthat is responsible for the concentration quenching of phosphorescent emission.130
In this chapter, the mechanism of triplet energy transfer in semi-dilute solution and in arigid polymer host matrix from the green-emitting Ir(tBu-ppy)3 to the red-emitting Ir(btp)2(acac)phosphor (Figure 7.1) is investigated using steady-state and time-resolved photolumines-cence. This is compared to triplet energy transfer from Ir(tBu-ppy)3 to the non-emissive 3T(Figure 7.1). The results demonstrate that in semi-dilute solution triplet energy transfer oc-curs to both Ir(btp)2(acac) and 3T via a diffusion controlled reaction, but that in a rigid matrix,where molecular diffusion is absent, only Ir(btp)2(acac) quenches the Ir(tBu-ppy)3 phospho-rescence. This result is interpreted in terms of phosphorescent resonance energy transfervia the Förster mechanism.
SS
S
3T
Ir(tBu-ppy)3 Ir(btp)2(acac)
NIr
3tBu
NIr
2
S
O
O
Figure 7.1 Structures of the green-emitting Ir(tBu-ppy)3 phosphor, the red-emitting Ir(btp)2(acac) phosphor, and the low-triplet-energy 3T molecule.
7.2 Results and Discussions
7.2.1 Energy Transfer between two Phosphorescent Dyes in Solution
The absorption spectrum of Ir(tBu-ppy)3 in chlorobenzene solution recorded at room tem-perature shows a strong band at 380 nm (ε ≈ 12000 Lmol−1cm−1) that is attributed to aspin-allowed metal-to-ligand charge transfer (1MLCT) transition (Figure 7.2).277 The twoweaker bands at 460 and 490 nm are assigned to spin-forbidden 3MLCT transitions. Thestrong spin-orbit coupling of iridium causes these transitions to mix with higher lying spin-allowed transitions and acquire appreciable intensity. The photoluminescence of Ir(tBu-ppy)3
originates from lowest energy 3MLCT transition and shows a maximum at 515 nm (2.4 eV)(Figure 7.2).106,262 The photoluminescence spectrum shows little or no vibronic structure. Indeoxygenated chlorobenzene solution the photoluminescence quantum yield for Ir(tBu-ppy)3
is φ = 0.56±0.04 when referenced to N,N’-bis(1-ethylpropyl) perylenediimide (φ = 1). For theclosely related Ir(ppy)3 complex, φ = 0.40±0.1, has been reported in deoxygenated toluenesolution278 and φ = 0.97±0.02 in a solid state host matrix at 1.5 mol% concentration.92
The room temperature absorption spectrum of Ir(btp)2(acac) in chlorobenzene exhibits

104 7.2 Results and Discussions
0
1x10⁵
2x10⁵
3x10⁵
4x10⁵
5x10⁵
6x10⁵
Emission
I/cou
nts
350 400 450 500 550 600 650 7000.0
2.0x10³
4.0x10³
6.0x10³
8.0x10³
1.0x10⁴
1.2x10⁴
1.4x10⁴ Absorption
E/eV
/nm
/Lm
ol-1cm
-1
3.5 3 2.5 2
Figure 7.2 Absorption (squares) and photoluminescence (circles) spectra ofIr(tBu-ppy)3 in chlorobenzene solution (10 µM) at room temperature. The photolu-minescence was recorded under inert atmosphere using an excitation wavelengthof 400 nm.
a band at 491 nm (2.52 eV; ε ≈ 8000 Lmol−1cm−1) (Figure 7.3) that has been assigned tothe 3MLCT state.103 The photoluminescence of Ir(btp)2(acac) has a maximum at 620 nm(2.00 eV) with vibronic bands at 670 and 740 nm. The large Stokes shift of ∼129 nm(0.52 eV) is due to the fact that the emission of Ir(btp)2(acac) does not occur from the3MLCT state, but originates predominantly from the btp ligand based 3(π − π*) state.103
The photoluminescence quantum yield of Ir(btp)2(acac) in MeTHF solution is φ = 0.21103
and φ = 0.51±0.01 in a solid state host matrix at 1.4 mol% concentration.92
The different nature of the lowest energy triplet excited states of Ir(tBu-ppy)3 [3MLCT]and Ir(btp)2(acac) [3(π − π*)] is supported by the difference in vibrational structure of thetwo photoluminescence spectra: Luminescence from a 3MLCT state generally gives rise toa broad, featureless band while that of 3(π − π*) states can be highly structured, featuringthe vibrational modes of the ground state ligand that couple to the transition.103,109
The 3MLCT photoluminescence of Ir(tBu-ppy)3 and the 3MLCT absorption spectrum ofIr(btp)2(acac) overlap in the region between 500 and 550 nm. Hence, energy transfer fromthe triplet state of Ir(tBu-ppy)3 to Ir(btp)2(acac) is energetically possible. To investigate theoccurrence of resonant energy transfer between the two phosphorescent emitters, the photo-luminescence spectrum of a mixed solution of the two dyes was recorded. Figure 7.4 revealsthat the emission of Ir(tBu-ppy)3 at 535 nm is significantly quenched (quenching factor, Q =6.5) after addition of Ir(btp)2(acac). At the same time, the photoluminescence at 620 nmof Ir(btp)2(acac) increases significantly. The spectra demonstrate that triplet energy transfer

7 Phosphorescent Resonant Energy Transfer 105
0
1x10⁴
2x10⁴
3x10⁴
4x10⁴
5x10⁴
Emission
I/cou
nts
400 450 500 550 600 650 700 7500.0
2.0x10³
4.0x10³
6.0x10³
8.0x10³
1.0x10⁴ Absorption
E/eV
/nm
/Lm
ol-1cm
-1
3 2.5 2
Figure 7.3 Absorption (squares) and photoluminescence (circles) spectra ofIr(btp)2(acac) in chlorobenzene solution (185 µM) at room temperature. The pho-toluminescence was recorded under inert atmosphere using an excitation wave-length of 400 nm.
occurs from the 3MLCT state of Ir(tBu-ppy)3 to the 3(π − π*) state of Ir(btp)2(acac). Basedon the steady state photoluminescence spectra it is difficult to quantify the results becausethe spectra have been recorded in front-face geometry, which introduces some uncertaintyin collecting the luminescent light. For comparison, Figure 7.4 also shows the photolumi-nescence spectra of Ir(btp)2(acac) for two limiting cases: (1st) assuming that the emissiononly occurs from photons directly absorbed by Ir(btp)2(acac) (circles), and (2nd) assumingthe red emission occurs from all photons absorbed by Ir(btp)2(acac) and Ir(tBu-ppy)3 (stars).The experimental spectrum of the mix (triangles) closely follows the latter curve within thewavelength range of Ir(btp)2(acac) emission. This suggests that the energy transfer is nearlycomplete. The 15% residual emission of Ir(tBu-ppy)3 at 535 nm, however, shows that it isnot quantitative under these conditions.
To quantify the triplet energy transfer and determine the rate constants for the process,time-resolved single photon counting experiments were performed (Figure 7.5 and 7.6).
The lifetime of Ir(tBu-ppy)3 is reduced from 1.30 µs to 345 ns upon addition of the550 µM of Ir(btp)2(acac) (Figure 7.5, Table 7.1) when excited at 400 nm. The pseudo-first-order rate constant for quenching via energy transfer under these conditions can be calcu-lated from the lifetimes in presence (τQ) and absence (τ0) of the Ir(btp)2(acac) quencher viakq = τ
−1Q − τ
−10 = 2.1× 10⁶ s−1. Assuming that the quenching is proportional to the concen-
tration of the Ir(btp)2(acac) quencher (550 µM), the second-order rate constant for energytransfer is ken = kq/[Q] = 3.8×10⁹ Lmol−1s−1.
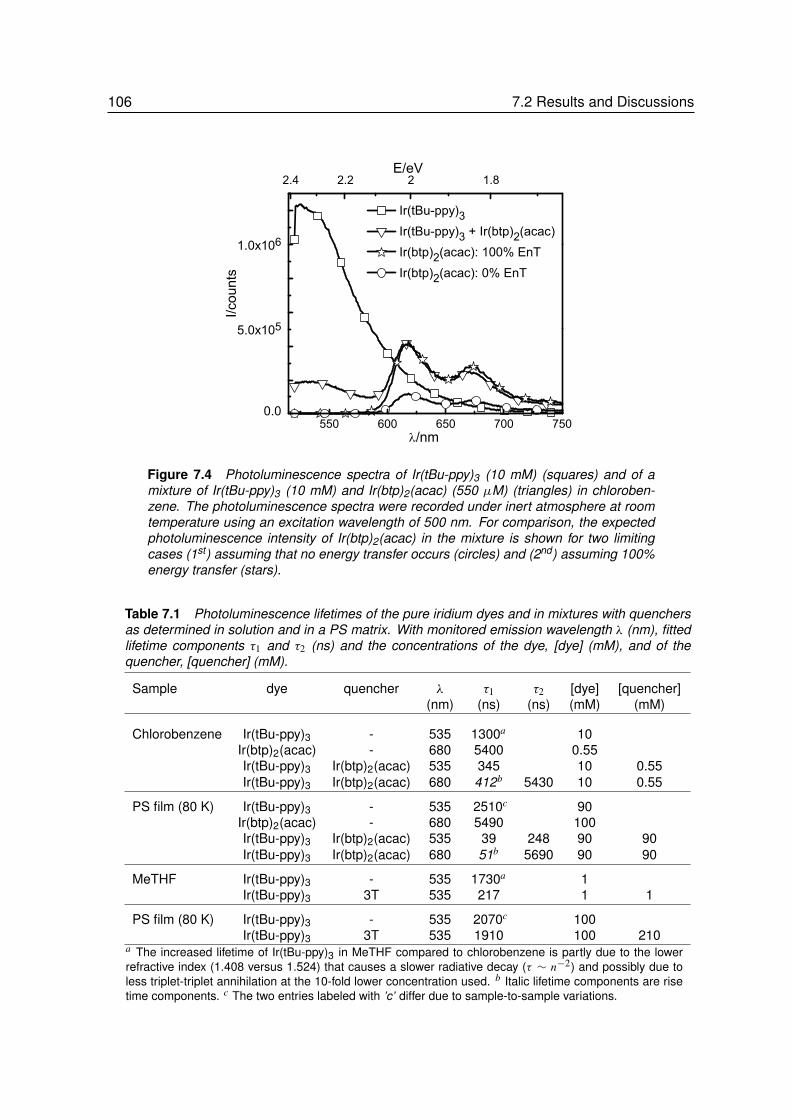
106 7.2 Results and Discussions
0.0
5.0x10⁵
1.0x10⁶
Ir(tBu-ppy)3 Ir(tBu-ppy)3 + Ir(btp)2(acac) Ir(btp)2(acac): 100% EnT Ir(btp)2(acac): 0% EnT
550 600 650 700 750
E/eV
/nm
I/cou
nts
2.4 2.2 2 1.8
Figure 7.4 Photoluminescence spectra of Ir(tBu-ppy)3 (10 mM) (squares) and of amixture of Ir(tBu-ppy)3 (10 mM) and Ir(btp)2(acac) (550 µM) (triangles) in chloroben-zene. The photoluminescence spectra were recorded under inert atmosphere at roomtemperature using an excitation wavelength of 500 nm. For comparison, the expectedphotoluminescence intensity of Ir(btp)2(acac) in the mixture is shown for two limitingcases (1st) assuming that no energy transfer occurs (circles) and (2nd) assuming 100%energy transfer (stars).
Table 7.1 Photoluminescence lifetimes of the pure iridium dyes and in mixtures with quenchersas determined in solution and in a PS matrix. With monitored emission wavelength λ (nm), fittedlifetime components τ1 and τ2 (ns) and the concentrations of the dye, [dye] (mM), and of thequencher, [quencher] (mM).
Sample dye quencher λ τ1 τ2 [dye] [quencher](nm) (ns) (ns) (mM) (mM)
Chlorobenzene Ir(tBu-ppy)3 - 535 1300a 10Ir(btp)2(acac) - 680 5400 0.55Ir(tBu-ppy)3 Ir(btp)2(acac) 535 345 10 0.55Ir(tBu-ppy)3 Ir(btp)2(acac) 680 412b 5430 10 0.55
PS film (80 K) Ir(tBu-ppy)3 - 535 2510c 90Ir(btp)2(acac) - 680 5490 100Ir(tBu-ppy)3 Ir(btp)2(acac) 535 39 248 90 90Ir(tBu-ppy)3 Ir(btp)2(acac) 680 51b 5690 90 90
MeTHF Ir(tBu-ppy)3 - 535 1730a 1Ir(tBu-ppy)3 3T 535 217 1 1
PS film (80 K) Ir(tBu-ppy)3 - 535 2070c 100Ir(tBu-ppy)3 3T 535 1910 100 210
a The increased lifetime of Ir(tBu-ppy)3 in MeTHF compared to chlorobenzene is partly due to the lowerrefractive index (1.408 versus 1.524) that causes a slower radiative decay (τ ∼ n−2) and possibly due toless triplet-triplet annihilation at the 10-fold lower concentration used. b Italic lifetime components are risetime components. c The two entries labeled with ’c’ differ due to sample-to-sample variations.

7 Phosphorescent Resonant Energy Transfer 107
100
101
102
103
104 Ir(tBu-ppy)3 Ir(tBu-ppy)3 + Ir(btp)2(acac)
I/co
unts
0 5 10
t/ s
Figure 7.5 Time-resolved photoluminescence recorded at 535 nm of Ir(tBu-ppy)3in chlorobenzene (10 mM) (squares) and of Ir(tBu-ppy)3 (10 mM) mixed withIr(btp)2(acac) (550 µM) (squares). The photoluminescence was recorded underinert atmosphere at room temperature with pulsed excitation at 400 nm.
The sub-microsecond rate for energy transfer inferred from the photoluminescencequenching of the Ir(tBu-ppy)3 can also be observed as a slow increase of the emissionof Ir(btp)2(acac). Figure 7.6 shows the time-resolved photoluminescence at 680 nm ofIr(btp)2(acac) in solution, before and after mixing with Ir(tBu-ppy)3. While the decay kineticsof the two Ir(btp)2(acac) emission traces are very similar with a lifetime of 5.4 µs, the rise ofthe two signals is distinctly different.
For the pure Ir(btp)2(acac) dye the maximum emission coincides with the end of theexcitation pulse, but in the mixed solution there is an additional slow rise component witha time constant of 410 ns (Figure 7.6). This rise time is similar to the time constant ofk−1
q = 476 ns for quenching via energy transfer determined from the lifetime reduction ofIr(tBu-ppy)3 upon mixing (Table 7.1).
The correspondence between the time constants for the rise of the emission ofIr(btp)2(acac) and the quenching of Ir(tBu-ppy)3 in the mixed solution, strongly suggests thatthe two processes are related, consistent with a triplet energy transfer reaction.
It is of interest to note that the second-order rate constant for the quenching(ken = 3.8× 10⁹ Lmol−1s−1) is of the same order of magnitude as the rate constant for dif-fusional collision kdiff = 8.7×10⁹ Lmol−1s−1 in chlorobenzene derived from the Debye equa-tion263 (kdiff =
8000RT3η ) and the viscosity η = 0.758×10⁻³ Pa×s of chlorobenzene at 298 K.264
Hence, the energy transfer reaction in solution is, to a large extent, diffusion controlled. BothDexter and Förster energy transfer strongly depend on the distance between donor and ac-ceptor, and without further experimental data it is not possible to distinguish between these
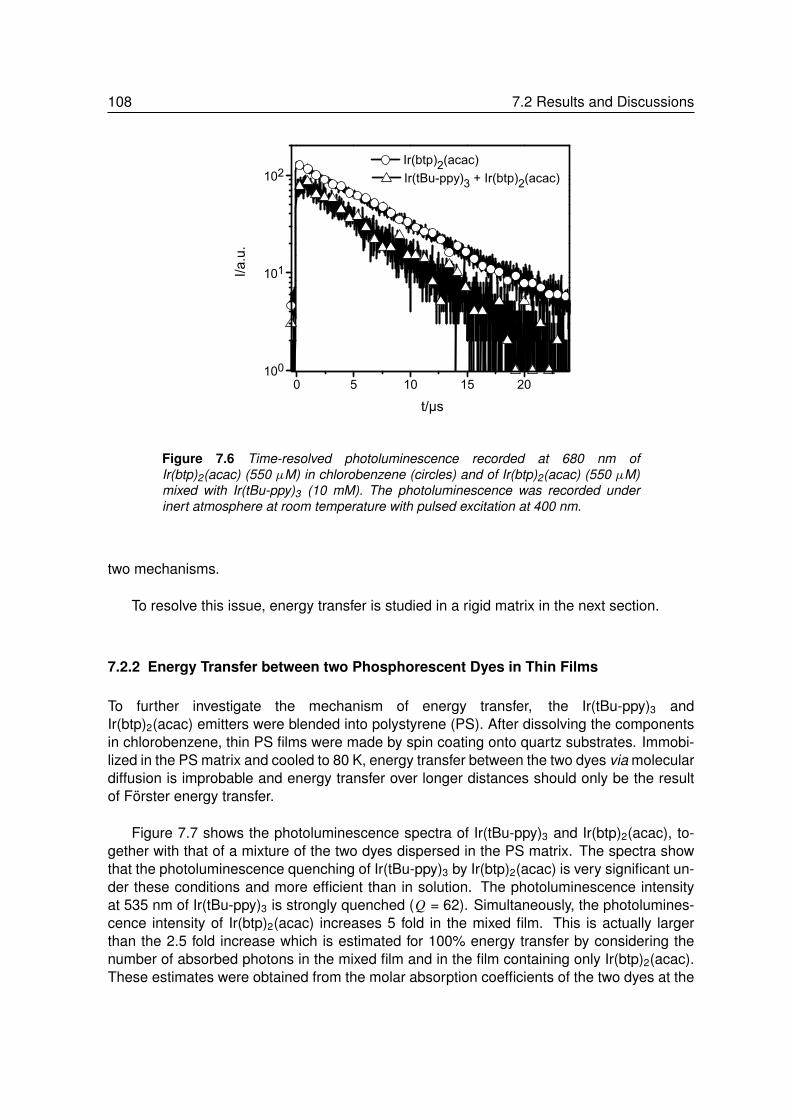
108 7.2 Results and Discussions
100
101
102
I/a.
u.
Ir(tBu-ppy)3 + Ir(btp)2(acac) Ir(btp)2(acac)
0 5 10 15 20
t/µs
Figure 7.6 Time-resolved photoluminescence recorded at 680 nm ofIr(btp)2(acac) (550 µM) in chlorobenzene (circles) and of Ir(btp)2(acac) (550 µM)mixed with Ir(tBu-ppy)3 (10 mM). The photoluminescence was recorded underinert atmosphere at room temperature with pulsed excitation at 400 nm.
two mechanisms.
To resolve this issue, energy transfer is studied in a rigid matrix in the next section.
7.2.2 Energy Transfer between two Phosphorescent Dyes in Thin Films
To further investigate the mechanism of energy transfer, the Ir(tBu-ppy)3 andIr(btp)2(acac) emitters were blended into polystyrene (PS). After dissolving the componentsin chlorobenzene, thin PS films were made by spin coating onto quartz substrates. Immobi-lized in the PS matrix and cooled to 80 K, energy transfer between the two dyes via moleculardiffusion is improbable and energy transfer over longer distances should only be the resultof Förster energy transfer.
Figure 7.7 shows the photoluminescence spectra of Ir(tBu-ppy)3 and Ir(btp)2(acac), to-gether with that of a mixture of the two dyes dispersed in the PS matrix. The spectra showthat the photoluminescence quenching of Ir(tBu-ppy)3 by Ir(btp)2(acac) is very significant un-der these conditions and more efficient than in solution. The photoluminescence intensityat 535 nm of Ir(tBu-ppy)3 is strongly quenched (Q = 62). Simultaneously, the photolumines-cence intensity of Ir(btp)2(acac) increases 5 fold in the mixed film. This is actually largerthan the 2.5 fold increase which is estimated for 100% energy transfer by considering thenumber of absorbed photons in the mixed film and in the film containing only Ir(btp)2(acac).These estimates were obtained from the molar absorption coefficients of the two dyes at the

7 Phosphorescent Resonant Energy Transfer 109
excitation wavelength (400 nm), their molar concentrations in the PS film, and the film thick-ness as measured with a profilometer. The deviation is ascribed to unavoidable differencesin measurement conditions related to the alignment of sample and cryostat.
Ir(tBu-ppy)3 Ir(btp)2(acac) Ir(tBu-ppy)3 + Ir(btp)2(acac)
450 500 550 600 650 700 7500
1x10⁵
2x10⁵
3x10⁵
4x10⁵
5x10⁵
6x10⁵
7x10⁵
E/eV
/nm
I/cou
nts
2.6 2.4 2.2 2 1.8
Figure 7.7 Photoluminescence spectra of PS films blended with 7 wt.-% (90 mM)Ir(tBu-ppy)3 (squares), 7 wt.-% (100 mM) Ir(btp)2(acac) (circles), and a compositeof 7 wt.-% (90 mM) Ir(tBu-ppy)3 and 6 wt.-% (90 mM) Ir(btp)2(acac) (triangles). Thespectra were recorded at 80 K using an excitation wavelength of 400 nm recordedunder inert atmosphere.
Figure 7.8 shows the photoluminescence excitation spectra monitored at 535 nm for thePS film with Ir(tBu-ppy)3 and at 680 nm for films with Ir(btp)2(acac) and the mixed emitters.The sum of the excitation spectra of the two pure emitters follows the excitation spectrum ofthe 680 nm emission of the mixed sample closely. There is ambiguity in adding the two spec-tra because they were recorded at different emission wavelengths. Nevertheless, the distinctfeature at 460 nm and the steep increase of the curve below 430 nm in the experimentalspectrum are clear indications that triplet energy transfer from Ir(tBu-ppy)3 to Ir(btp)2(acac)occurs in the PS films.
The triplet energy transfer inferred from the photoluminescence and excitation spectra issupported by the time-resolved luminescence data recorded at 535 nm. The lifetime of theIr(tBu-ppy)3 emission is significantly reduced after mixing it with Ir(btp)2(acac), while that ofthe Ir(btp)2(acac) itself does not change significantly upon mixing (Figure 7.9 and Table 7.1).
In the mixture of the two emitters, three lifetime components (4.9, 39, and 248 ns) de-scribe the decay of the emission at 535 nm, corresponding to Ir(tBu-ppy)3 (Table 7.1). Itshould be noted that none of these components corresponds to the photoluminescence life-time of the pure Ir(tBu-ppy)3 dye (2.51 µs), suggesting that the excited state of Ir(tBu-ppy)3 is

110 7.2 Results and Discussions
535 nm, Ir(tBu-ppy)3 680 nm, Ir(btp)2(acac) 680 nm, Ir(tBu-ppy)3 + Ir(btp)2(acac) sum of Ir(tBu-ppy)3 + Ir(btp)2(acac)
400 450 500 550 600 6500
E/eV
/nm
I/a.u
.
3 2.8 2.6 2.4 2.2 2
Figure 7.8 Photoluminescence excitation spectra of PS films blended with 7 wt.-%(90 mM) Ir(tBu-ppy)3 (squares), 7 wt.-% (100 mM) Ir(btp)2(acac) (circles), and a com-posite of 7 wt.-% (90 mM) Ir(tBu-ppy)3 and 6 wt.-% (90 mM) Ir(btp)2(acac) (triangles).The spectra were recorded at 80 K with excitation at 400 nm recorded under inertatmosphere. The dotted line (crosses) shows the sum of the spectra of the pure com-pounds.
effectively quenched in the mix. The shortest lifetime component (4.9 ns) arises from scatter-ing of the excitation beam through the single monochromator of the setup and is neglected(see Chapter 6). The two other time constants, represent a fast (39 ns, relative amplitude1.0) and a slower (248 ns, relative amplitude 0.34) energy transfer process.
The occurrence of multiple lifetimes for the energy transfer, instead of one, is probablydue to the dispersion of distances within the solid phase. From the shorter time constant(τQ = 39 ns; kdecay = 2.56×10⁷ s−1) and the lifetime τ0 = 2.51 ms of pure Ir(tBu-ppy)3 inPS a quenching factor of Q = τ0
τQ− 1 = 63 is predicted, in good agreement with the value
Q = 62 obtained from the photoluminescence intensity (Figure 7.7). This demonstratesthe quantitative agreement of the steady-state and time-resolved photoluminescence data.The rate constant for quenching via energy transfer under these conditions is kq = τ−1
Q −
τ−10 = 2.52×10⁷ s−1.
Similar to the mixed solutions, the rise of the emission of Ir(btp)2(acac) in the PS film withthe mixed dyes is much slower than for the pure Ir(btp)2(acac) dye in the film (Figure 7.9). At80 K in the mixed dye PS film, the rise time amounts to 51 ns (Table 7.1), in fair agreementwith the inverse energy transfer rate k−1
q = 40 ns determined from the photoluminescencelifetime quenching of the Ir(tBu-ppy)3 dye. The quantitative correspondence of the charac-teristic time constants of the two processes, strongly suggest a mutual origin, consistent with

7 Phosphorescent Resonant Energy Transfer 111
100
101
102
103
104
I/a.
u.
Ir(tBu-ppy)3 at 535 nm
Ir(tBu-ppy)3 + Ir(btp)2(acac) at 535 nm Ir(tBu-ppy)3 + Ir(btp)2(acac) at 680 nm
0.0 0.1 0.2 0.3 0.4 0.5 0.6 0.7 0.8 0.9
t/ s
200 4007x102
8x10²
9x10²
1x10³
t/ns
I/co
unts
Figure 7.9 Time-resolved photoluminescence of PS films containing7 wt.- % (90 mM) Ir(tBu-ppy)3 recorded at 535 nm (squares) and of filmscontaining a mix of 7 wt.-% (90 mM) Ir(tBu-ppy)3 and 6 wt.-% (90 mM)Ir(btp)2(acac) recorded at 535 nm (down triangles) and 680 nm (up triangles).The photoluminescence was recorded under inert atmosphere at 80 K withpulsed excitation at 400 nm. The solid lines are fits to the data. The insetshows an expansion of the data in a linear plot.
triplet energy transfer from Ir(tBu-ppy)3 to Ir(btp)2(acac).
In thin films at 80 K, diffusion of molecules can be excluded and an energy transfermechanism that involves diffusion via the triplet state the PS matrix is highly unlikely. Thefact that the energy transfer is very efficient in the mixed films seems to indicate that a Förstermechanism is operative, but -at this stage- the Dexter mechanism cannot be fully excludedbecause the relatively high concentration (90-100 mM; 6-7 wt.-%) of the dyes give rise to anaverage distance between the dyes that does not preclude some orbital overlap.
The radius Rc of the average spherical volume available to a phosphorescent dye mole-cule at molar concentration C is Rc = [3/(4πNAC)]
13 and equals Rc = 1.6 nm at C = 100 mM.
This can be compared to the radius of the molecule as determined from the molecular vol-ume provided by the crystallographic structure. For the related Ir(ppy)3 and Ir(ppy)2(acac)complexes this radius is 0.51-0.53 nm and of the same order of magnitude as Rc.261,279
In the next section it will be shown, however, that the Dexter mechanism can be excludedas being the major mechanism energy transfer occurs by.
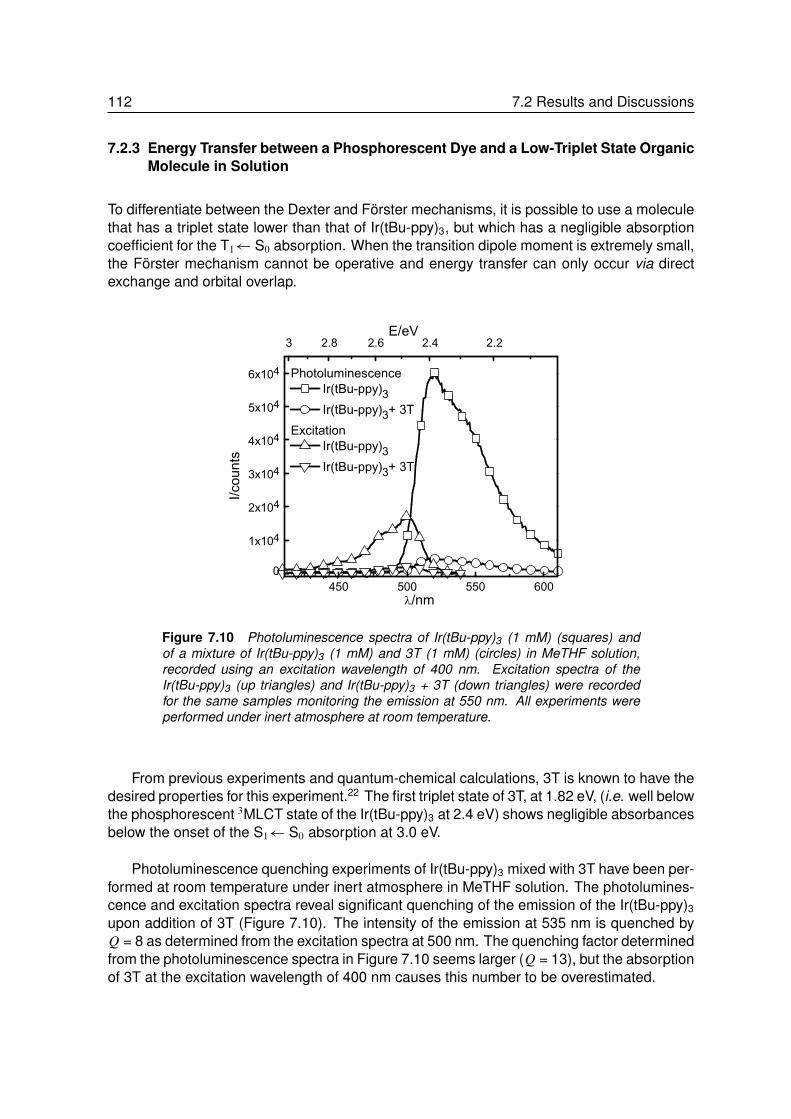
112 7.2 Results and Discussions
7.2.3 Energy Transfer between a Phosphorescent Dye and a Low-Triplet State OrganicMolecule in Solution
To differentiate between the Dexter and Förster mechanisms, it is possible to use a moleculethat has a triplet state lower than that of Ir(tBu-ppy)3, but which has a negligible absorptioncoefficient for the T1← S0 absorption. When the transition dipole moment is extremely small,the Förster mechanism cannot be operative and energy transfer can only occur via directexchange and orbital overlap.
Photoluminescence Ir(tBu-ppy)3 Ir(tBu-ppy)3+ 3T
Excitation Ir(tBu-ppy)3 Ir(tBu-ppy)3+ 3T
450 500 550 6000
1x10⁴
2x10⁴
3x10⁴
4x10⁴
5x10⁴
6x10⁴
E/eV
/nm
I/cou
nts
3 2.8 2.6 2.4 2.2
Figure 7.10 Photoluminescence spectra of Ir(tBu-ppy)3 (1 mM) (squares) andof a mixture of Ir(tBu-ppy)3 (1 mM) and 3T (1 mM) (circles) in MeTHF solution,recorded using an excitation wavelength of 400 nm. Excitation spectra of theIr(tBu-ppy)3 (up triangles) and Ir(tBu-ppy)3 + 3T (down triangles) were recordedfor the same samples monitoring the emission at 550 nm. All experiments wereperformed under inert atmosphere at room temperature.
From previous experiments and quantum-chemical calculations, 3T is known to have thedesired properties for this experiment.22 The first triplet state of 3T, at 1.82 eV, (i.e. well belowthe phosphorescent 3MLCT state of the Ir(tBu-ppy)3 at 2.4 eV) shows negligible absorbancesbelow the onset of the S1← S0 absorption at 3.0 eV.
Photoluminescence quenching experiments of Ir(tBu-ppy)3 mixed with 3T have been per-formed at room temperature under inert atmosphere in MeTHF solution. The photolumines-cence and excitation spectra reveal significant quenching of the emission of the Ir(tBu-ppy)3
upon addition of 3T (Figure 7.10). The intensity of the emission at 535 nm is quenched byQ = 8 as determined from the excitation spectra at 500 nm. The quenching factor determinedfrom the photoluminescence spectra in Figure 7.10 seems larger (Q = 13), but the absorptionof 3T at the excitation wavelength of 400 nm causes this number to be overestimated.

7 Phosphorescent Resonant Energy Transfer 113
The time-resolved photoluminescence of Ir(tBu-ppy)3 with and without 3T (Figure 7.11)confirm that the addition of 3T quenches the excited state of Ir(tBu-ppy)3. The lifetime of theIr(tBu-ppy)3 luminescence decreases from 1.73 µs to 229 ns upon addition of 3T (Table 7.1).The pseudo-first-order rate constant for quenching via energy transfer under these conditionsdetermined from the lifetime, kq = τ
−1Q −τ
−10 = 3.8×10⁶ s−1, is in excellent agreement with the
rate, kq =(Q−1)τ0= 4.0×10⁶ s−1, determined from the 8 fold photoluminescence quenching
with excitation at 500 nm.
Using the lifetime quenching and the concentration of the quencher, the second-orderrate constant for energy transfer is then ken = 3.8×10⁹ Lmol−1s−1. The diffusion constant forMeTHF (η = 0.5618×10⁻³ Pa×s)265 at 298 K was calculated as kdiff = 1.2×10¹⁰ Lmol−1s−1.263
The steady state and time-resolved photoluminescence experiments show that in solu-tion triplet energy transfer from Ir(tBu-ppy)3 to the low-energy (1.82 eV) triplet sate of 3Toccurs via diffusion controlled mechanism. The negligible absorption coefficient of 3T in thewavelength range where Ir(tBu-ppy)3 emits, precludes that Förster energy transfer is involvedand, hence, the quenching is attributed to Dexter exchange.
100
101
102
103
Ir(tBu-ppy)3 Ir(tBu-ppy)3 + 3T
I/co
unts
t/µs0 2 4 6 8 10 12
Figure 7.11 Time-resolved photoluminescence recorded at 535 nm of Ir(tBu-ppy)3 in MeTHF (squares) and of Ir(tBu-ppy)3 (1 mM) mixed with 3T (1 mM) (tri-angles). The photoluminescence was recorded under inert atmosphere at roomtemperature with pulsed excitation at 400 nm.
7.2.4 Absence of Energy Transfer between a Phosphorescent Dye and a Low-EnergyTriplet State Organic Molecule in Thin Films
The time-resolved photoluminescence of the phosphorescent Ir(tBu-ppy)3 dye in thin PSfilms with and without 3T as a quencher have been recorded at 80 and 300 K (Figure 7.12).
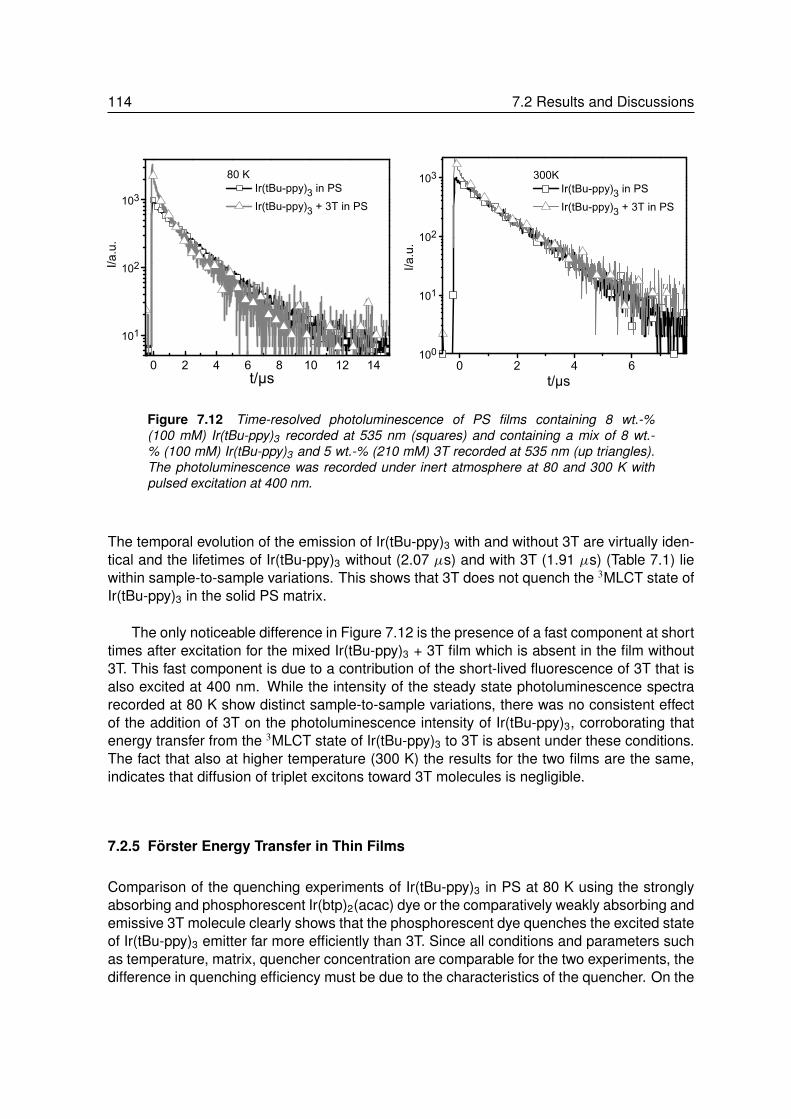
114 7.2 Results and Discussions
0 2 4 6 8 10 12 14
101
102
103
80 K Ir(tBu-ppy)3 in PS Ir(tBu-ppy)3 + 3T in PS
I/a.
u.
t/µs0 2 4 6
100
101
102
103 300K Ir(tBu-ppy)3 in PS Ir(tBu-ppy)3 + 3T in PS
I/a.
u.
t/µs
Figure 7.12 Time-resolved photoluminescence of PS films containing 8 wt.-%(100 mM) Ir(tBu-ppy)3 recorded at 535 nm (squares) and containing a mix of 8 wt.-% (100 mM) Ir(tBu-ppy)3 and 5 wt.-% (210 mM) 3T recorded at 535 nm (up triangles).The photoluminescence was recorded under inert atmosphere at 80 and 300 K withpulsed excitation at 400 nm.
The temporal evolution of the emission of Ir(tBu-ppy)3 with and without 3T are virtually iden-tical and the lifetimes of Ir(tBu-ppy)3 without (2.07 µs) and with 3T (1.91 µs) (Table 7.1) liewithin sample-to-sample variations. This shows that 3T does not quench the 3MLCT state ofIr(tBu-ppy)3 in the solid PS matrix.
The only noticeable difference in Figure 7.12 is the presence of a fast component at shorttimes after excitation for the mixed Ir(tBu-ppy)3 + 3T film which is absent in the film without3T. This fast component is due to a contribution of the short-lived fluorescence of 3T that isalso excited at 400 nm. While the intensity of the steady state photoluminescence spectrarecorded at 80 K show distinct sample-to-sample variations, there was no consistent effectof the addition of 3T on the photoluminescence intensity of Ir(tBu-ppy)3, corroborating thatenergy transfer from the 3MLCT state of Ir(tBu-ppy)3 to 3T is absent under these conditions.The fact that also at higher temperature (300 K) the results for the two films are the same,indicates that diffusion of triplet excitons toward 3T molecules is negligible.
7.2.5 Förster Energy Transfer in Thin Films
Comparison of the quenching experiments of Ir(tBu-ppy)3 in PS at 80 K using the stronglyabsorbing and phosphorescent Ir(btp)2(acac) dye or the comparatively weakly absorbing andemissive 3T molecule clearly shows that the phosphorescent dye quenches the excited stateof Ir(tBu-ppy)3 emitter far more efficiently than 3T. Since all conditions and parameters suchas temperature, matrix, quencher concentration are comparable for the two experiments, thedifference in quenching efficiency must be due to the characteristics of the quencher. On the

7 Phosphorescent Resonant Energy Transfer 115
basis of these properties of the quencher it is now possible to differentiate between Försterand Dexter mechanisms.
In terms of a Förster mechanism, 3T is a poor quencher due to the extremely low os-cillator strength of the T1← S0 transition. In contrast, the Ir(btp)2(acac) is a much betterquencher because it has significant absorption in the wavelength range where Ir(tBu-ppy)3
emits. The Dexter mechanism relies on orbital overlap, and the oscillator strengths are notimportant. The larger quenching of Ir(tBu-ppy)3 emission by Ir(btp)2(acac) as compared to3T is therefore attributed to a Förster phosphorescence energy transfer.
To quantify the results it is possible to determine the Förster radius R0:
R60 =
9000 κ2 ln(10)φ125 π5n4 NA
·
∫ID(λ)εA(λ)λ
4 dλ∫ID(λ) dλ
(7.1)
where λ is the wavelength, κ2 is an orientation factor that equals 23 for an isotropic sample,
φ = 0.56±0.04 is the luminescence quantum yield of the donor, ID(λ) is the emission of thedonor and εA(λ) is the molar absorption coefficient of the acceptor, n is the refractive indexof the solvent in which absorption and luminescence were recorded, and NA is Avogadro’sconstant. The Förster radius for energy transfer between the green Ir(tBu-ppy)3 dye and thered Ir(btp)2(acac) dye amounts to 3.02 nm. This can be used to estimate the photolumines-cence quenching of Ir(tBu-ppy)3 in a solid PS matrix with Ir(btp)2(acac) as an acceptor. ForFörster energy transfer from a donor to an acceptor that is randomly distributed in three di-mensions, with slow translational diffusion compared to the rate of transfer, the luminescencequenching amounts to:217
1Q= 1−
√πγ eγ
2[1− er f (γ )] (7.2)
where γ is given by:
γ =
√π
2CA
43πR3
0 (7.3)
with CA the concentration of acceptors (number per nm3). In Figure 7.13 the quenching con-stant Q is plotted as function of R0. The experimental results Q = 63 (from lifetime quenchingexperiments) and Q = 62 (from steady state quenching experiments) are reproduced at theFörster radius R0 ≈ 3.02 nm, where Q = 64 calculated using Equation 7.2. This quantitativeagreement provides further evidence that in the mixed films Förster energy transfer occurs.
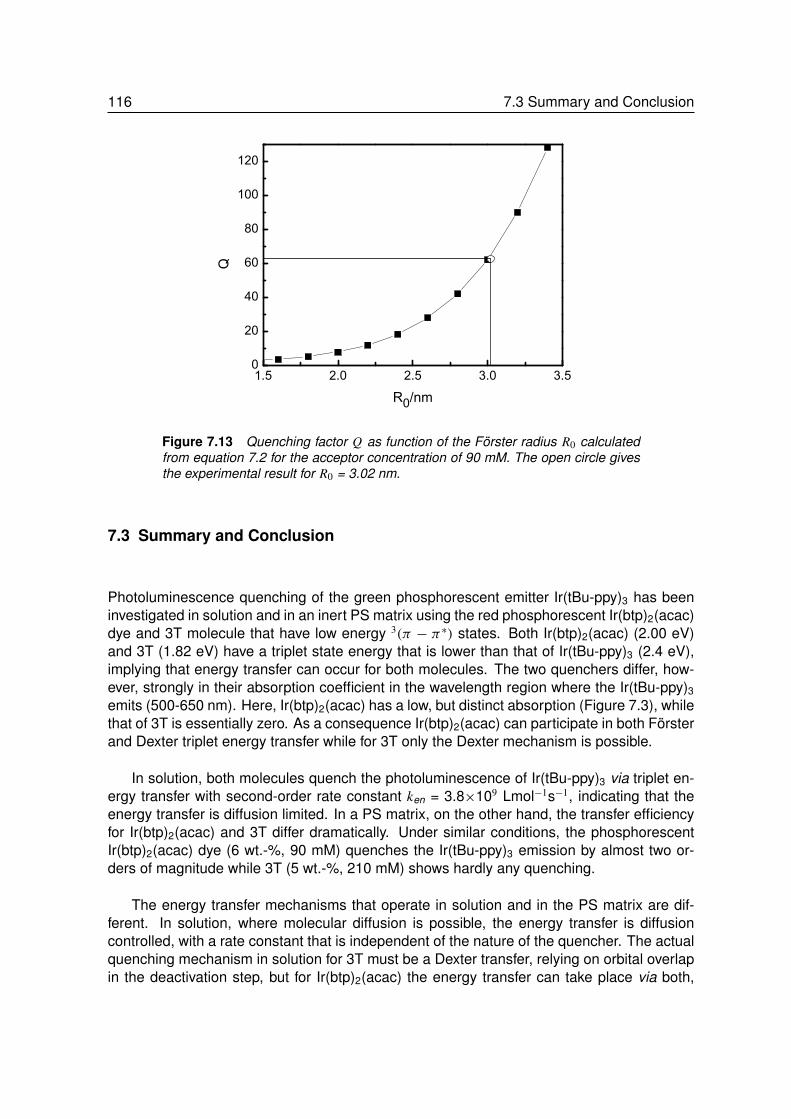
116 7.3 Summary and Conclusion
1.5 2.0 2.5 3.0 3.50
20
40
60
80
100
120
Q
R0/nm
Figure 7.13 Quenching factor Q as function of the Förster radius R0 calculatedfrom equation 7.2 for the acceptor concentration of 90 mM. The open circle givesthe experimental result for R0 = 3.02 nm.
7.3 Summary and Conclusion
Photoluminescence quenching of the green phosphorescent emitter Ir(tBu-ppy)3 has beeninvestigated in solution and in an inert PS matrix using the red phosphorescent Ir(btp)2(acac)dye and 3T molecule that have low energy 3(π − π∗) states. Both Ir(btp)2(acac) (2.00 eV)and 3T (1.82 eV) have a triplet state energy that is lower than that of Ir(tBu-ppy)3 (2.4 eV),implying that energy transfer can occur for both molecules. The two quenchers differ, how-ever, strongly in their absorption coefficient in the wavelength region where the Ir(tBu-ppy)3
emits (500-650 nm). Here, Ir(btp)2(acac) has a low, but distinct absorption (Figure 7.3), whilethat of 3T is essentially zero. As a consequence Ir(btp)2(acac) can participate in both Försterand Dexter triplet energy transfer while for 3T only the Dexter mechanism is possible.
In solution, both molecules quench the photoluminescence of Ir(tBu-ppy)3 via triplet en-ergy transfer with second-order rate constant ken = 3.8×10⁹ Lmol−1s−1, indicating that theenergy transfer is diffusion limited. In a PS matrix, on the other hand, the transfer efficiencyfor Ir(btp)2(acac) and 3T differ dramatically. Under similar conditions, the phosphorescentIr(btp)2(acac) dye (6 wt.-%, 90 mM) quenches the Ir(tBu-ppy)3 emission by almost two or-ders of magnitude while 3T (5 wt.-%, 210 mM) shows hardly any quenching.
The energy transfer mechanisms that operate in solution and in the PS matrix are dif-ferent. In solution, where molecular diffusion is possible, the energy transfer is diffusioncontrolled, with a rate constant that is independent of the nature of the quencher. The actualquenching mechanism in solution for 3T must be a Dexter transfer, relying on orbital overlapin the deactivation step, but for Ir(btp)2(acac) the energy transfer can take place via both,

7 Phosphorescent Resonant Energy Transfer 117
Förster and Dexter mechanisms.
Molecular diffusion can be neglected in thin PS films at 80 K and hence triplet energytransfer can only occur via the Förster mechanism. This point of view is strongly supportedby the experimental result that effective quenching only occurs for Ir(btp)2(acac) and not for3T in PS films, as expected for Förster transfer considering the much higher transition di-pole moment of Ir(btp)2(acac) compared to that of 3T. Moreover, a model for luminescencequenching via Förster energy transfer from donor to acceptor molecules that are randomlydistributed in three dimensions in a rigid matrix (Equation 4.2) provides quantitative agree-ment with the experimental phosphorescence quenching in the films when using the Försterradius (R0 = 3.02 nm) of the two iridium complexes determined from the photophysical data.Hence, the Förster mechanism is the prevailing mechanism for phosphorescent resonantenergy transfer under these conditions.
The result that in a rigid polymer matrix triplet energy transfer between different phos-phorescent dopants occurs via the Förster mechanism may be used to rationally tune theemission spectra of mixed layers123 towards more optimal white light emission.
Experimental Part
The synthesis of the green-emitting Ir(tBu-ppy)3 dye106 and 3T155 have been performed ac-cording to published methods. The red-emitting Ir(btp)2(acac) dye (American Dye Source,Inc.) and polystyrene (Mw = 250 kDa) were used as received. Anhydrous, sealed chloroben-zene (Aldrich) was used as received and kept under inert atmosphere at all times. 2-Methyl-tetrahydrofuran (MeTHF) was pre-dried over KOH for 3 days, filtered, distilled from CaH2,and stored under inert nitrogen atmosphere.
Sample solutions were prepared in a nitrogen glove box using dry and deoxygenatedMeTHF or chlorobenzene. Thin film samples were spin coated at 1100 rpm using a Elec-tronic Micro Systems’ Photo Resist Spinner (Model 4000) inside a glove box. The polymersolutions used for spin coating were prepared in the glove box by stirring overnight andheating to 70 ◦C for 1 hour, after which the films were spin coated. Film thicknesses weredetermined using a Tencor P-10 Surface Profilometer.
UV/Vis and photoluminescence spectra were recorded using a Perkin-Elmer Lambda900 and an Edinburgh Instruments FS920 spectrophotometer, respectively. Time-correla-ted single photon counting (TCSPC) photoluminescence was performed on an EdinburghInstruments LifeSpec-PS spectrometer by photoexcitation at 400 nm with a picosecond-pulse laser (PicoQuant PDL 800B) operated at 2.5 MHz, 400 kHz or 40 kHz and usinga Peltier-cooled Hamamatsu microchannel plate photomultiplier (R3809U-50) for detection.During the spectroscopic experiments, thin film samples were held at 80 K or 300 K un-der nitrogen atmosphere using an Oxford Optistat CF continuous flow cryostat or an OxfordOptistat DN bath cryostat. All solutions were kept under inert atmosphere. Only absorp-tion measurements on thin films and on the 10 µM solution of green Ir(tBu-ppy)3 emitter in

118 Experimental Part
chlorobenzene were performed under ambient conditions. The quantum yield of Ir(tBu-ppy)3
was determined using N,N’-bis(1-ethylpropyl)perylenediimide (φ = 1) as a standard. Exci-tation wavelength was 480 nm and both samples had similar O.D. (< 0.1). The integratedemission spectra were corrected by dividing by the number of absorbed photons.


Triplet States – Triplet FatesPhosphorescence and Energy Transfer in
Functional Molecules
Summary
Triplet states play a crucial role in organic and polymeric semi-conductor devices, such assolar cells and light-emitting diodes. Research into the properties and behavior of tripletstates in functional molecules used in such devices will provide insights into the functioningof and possible ways to improve such devices.
This thesis describes the investigations on triplet excited states and their properties inwell-defined π -conjugated oligomers and polymers as well as in triplet emitting organometal-lic complexes blended into polymer matrices. The experiments were performed using a vari-ety of spectroscopic techniques at time scales ranging from steady state to nanoseconds.
Using steady state, time-resolved, and time-gated (transient) absorption and photolu-minescence spectroscopy, different series of π -conjugated oligomers (oligofluorenes, oligo-thiophenes) of varying lengths were investigated. The energy levels of the first excited singletand triplet states were shown to depend linearly on the inverse number of repeat units, simi-lar to the classic quantum-mechanical ’particle in a box’. The energy of the singlet state wasfound to be linearly correlated to that of the triplet state. In addition to the effect of length,the influence of chemical functionalization was investigated for a series of oligothiophenes.The experimental studies were corroborated by quantum-mechanical and density functionaltheory calculations that provided an accurate description of the triplet energy and geometryrelaxation in the excited state. Vibrational modes coupling to both singlet-singlet and triplet-singlet transitions were studied using spectroscopic and theoretical techniques resulting intheir assignment. From these studies, a semi-experimental “geometry prediction” for the firstexcited singlet state could be obtained. An important new insight from this work is that thetriplet state in conjugated molecules is not as localized as was generally assumed, but in factprobes the entire length of the investigated oligomers.
I

II
Delayed fluorescence of a polythiophene derivative upon direct and sub-S0-S1 gap ex-citation was recorded using time-gated spectroscopic techniques. Measurements of theprompt fluorescence upon excitation with sub-gap photons revealed that the lowest excitedsinglet state (S1) is generated via multi-photon processes and the comparison of the relativeintensities of delayed fluorescence and prompt fluorescence using photon energies belowand above the S0-S1 gap indicated that the delayed fluorescence upon sub-gap excitationoriginates mainly from long-lived excitations formed out of singlet excited states populatedvia two-photon absorption. The nature of the long-lived excited states involved in delayedfluorescence is not yet clear and may be either triplet states or geminate charge pairs.
The mechanisms of triplet exciton transfer from one triplet emitting organometallic com-plex to another or to a low-triplet energy organic molecule were determined using steadystate and time-resolved photoluminescence techniques. The mechanism of triplet excitontransfer differs depending on the state of the sample. In solution, triplet energy transfer oc-curs via a diffusion controlled mechanism that may involve Förster and/or Dexter transfer.In the solid state, where diffusion is absent, energy transfer from one triplet emitter to an-other triplet emitter occurs via a Förster mechanism that relies on dipole-dipole interactionsand can operate over distances up to several nanometers without direct ’physical’ contact.Further experiments have demonstrated that the diffusion of triplet energy through a solidfilm occurs via direct energy transfer between the organometallic guest molecules and is notinfluenced by the triplet energy levels of the matrix as long as these are above that of theemitter.
With the studies described in this thesis new fundamental insights into the triplet states oforganic molecules and organometallic complexes have been obtained. This knowledge con-tributes to the future design and development of more efficient organic (white) light-emittingdiodes for lighting applications.


Samenvatting
Triplettoestanden spelen een cruciale rol in organische en polymere halfgeleidertoepassin-gen zoals zonnecellen en lichtgevende diodes. In dit proefschrift worden de resultatenbeschreven van onderzoek naar de aangeslagen triplettoestanden van goedgedefinieerde π -geconjugeerde oligomeren en polymeren, en van organometaalcomplexen die, ingemengdin een polymeermatrix, vanuit de triplettoestand licht uitzenden. De experimenten aan dezesystemen zijn uitgevoerd met behulp van geavanceerde spectroscopische technieken meteen tijdsresolutie tot in het nanoseconde regime en worden gecomplementeerd met kwan-tumchemische berekeningen.
De aangeslagen toestanden van verschillende series π -geconjugeerde oligomeren (oligo-fluorenen, oligothiofenen) met variabele lengte zijn onderzocht met absorptie- en fluores-centiespectroscopie. Hierbij is gebruik gemaakt van continue belichting alsook van tijd-sopgeloste technieken in emissie en absorptie, soms met tijdsvertraagde en tijdsgeïnte-greerde detectie. De energieniveaus van de eerste aangeslagen singlet- en triplettoes-tanden blijken lineair afhankelijk te zijn van het reciproque aantal repeterende eenheden inhet oligomeer, analoog met de klassieke kwantummechanica van het ’deeltje in een doosje’.Ook correleert de energie van de singlettoestand lineair met die van de triplettoestand.Naast het effect van oligomeerlengte, is ook de invloed van de functionele groepen onder-zocht voor een serie oligothiofenen. De experimentele resultaten worden ondersteund doorkwantummechanische en dichtheidsfunctionaaltheorie berekeningen. Deze berekeningenhebben geleid tot een nauwkeurige beschrijving van de energie en de evenwichtsgeome-trie van de aangeslagen triplettoestand. Voor singlet-singlet en singlet-triplet overgangenzijn de normaalvibraties die koppelen met de elektronische structuur bestudeerd met spec-troscopische technieken gecombineerd met theoretische berekeningen. Uit deze studies iseen semi-experimentele voorspelling van de geometrie van de eerste aangeslagen singlet-toestand verkregen. Het blijkt dat deze minder gedeformeerd is dan de corresponderendetriplettoestand. Een belangrijk inzicht verkregen uit het onderzoek is dat de triplettoestandin deze geconjugeerde moleculen niet zo gelokaliseerd is als algemeen wordt aangenomen,maar zich in feite uitstrekt over de hele lengte van het systeem.
Naast de prompte fluorescentie is ook de vertraagde fluorescentie van een polythiofeen-derivaat gemeten met excitatie-energieën die zowel boven als onder de optische S0-S1
bandafstand liggen. Voor deze metingen is gebruik gemaakt van een tijdsvertraagde geïnte-greerde detectie die het mogelijk maakt zwakke signalen lang na een excitatiepuls te meten.De prompte fluorescentie vanuit de laagste aangeslagen singlettoestand (S1), gemeten na
V

VI
excitatie met sub-bandafstand fotonen, toont aan dat de S1 toestand ook bereikt kan wor-den via multi-foton processen. De vertraagde fluorescentie na sub-bandafstand excitatieblijkt veroorzaakt te worden door langlevende aangeslagen toestanden die gevormd zijn uitaangeslagen singlettoestanden die gegenereerd zijn via twee-foton-absorptie en niet doorT1← S0 excitatie. De aard van de langlevende toestanden is nog niet duidelijk, het kan eenneutrale triplettoestand zijn of een geminaal ladingspaar.
Het mechanisme van tripletenergieoverdracht tussen tripletemitterende organometaal-complexen of van een dergelijk complex naar een oligothiofeen met een lage tripletenergieis bestudeerd met (tijdsopgeloste) fotoluminescentiespectroscopie. Het mechanisme vantripletenergieoverdracht blijkt afhankelijk van de mobiliteit van de moleculen. In oplossing,waar diffusie plaatsvindt, gaat tripletenergieoverdracht via een diffusie-gecontroleerde reac-tie. In het geval van een oligothiofeen als tripletenergieacceptor is daarbij het Dexter mecha-nisme actief. In de vaste fase, waar diffusie van moleculen geen rol speelt, vindt energieover-dracht tussen tripletemitterende moleculen plaats via een Förster mechanisme waarbij deinteractie tussen dipoolovergangsmomenten verantwoordelijk is voor de energieoverdrachtover een afstand van enkele nanometers, zonder direct fysiek contact. Verdere experi-menten hebben aangetoond dat de diffusie van tripletenergie door een polymeerfilm metdaarin gedispergeerde metaalcomplexen alleen verloopt via directe energieoverdracht tussende gastmoleculen en niet beïnvloed wordt door de tripletenergieniveaus van het polymeer,zolang deze boven die van de tripletemittter liggen.
Met het onderzoek zoals beschreven in dit proefschrift zijn nieuwe fundamentele inzichtenverkregen in de triplettoestanden en de dynamica van organische π -geconjugeerde mole-culen en organometaalcomplexen. Deze kennis draagt bij aan een beter begrip van de werk-ingsmechanismen van organische moleculen en organometaalcomplexen in opto-elektroni-sche toepassingen en kan in de toekomst mogelijk leiden tot een verbetering van de efficiën-tie daarvan.


Epilogue
It is now time to acknowledge those who helped shape this dissertation into what it is....First and foremost I would like to thank my advisors: professor (no you cannot fire me now...)René (your light touch always left a shred of hope for me during writing something down) anddoctor Stefan (I was favored with a glimpse or two into some of the more awesome thoughtsof yours - mostly, I was not up to it), I have had the privilege to work with and learn from youand have become a better scientist (and a little better person?) for it.
Furthermore, I feel honored that prof. dr. Luisa De Cola of the Universität Münster andprof. dr. Anna Köhler of the Universität Potsdam as well as prof. dr. Bert Meijer of the Tech-nische Universiteit Eindhoven have agreed to join the opposition’s camp during my defenseand to form part of the reading committee! Thank you for your participation, advise, com-ments and insights. Furthermore, dr. Albert Schenning and prof. dr. Reinder Coehoorn willcomplement the opposition during the defense and I am looking forward to cryptic questionsand puzzling proposals from you – as usual.
I was very fortunate to be able to spend some time at the Materia Nova Institute of theUniversity of Mons-Hainaut in Belgium where working with dr. Philippe Marsal and dr. DavidBeljonne introduced me to the more pleasant aspects of theoretical chemistry and the South-ern French and Belgian style of life; thank you for your kindness, hospitality and especiallyyour patience (Philippe, I am still trying to remember some of your more colorful (and a lit-tle more lengthy) remarks toward and about the computer...!). I would also like to thank todr. Victor Geskin and prof. dr. Roberto Lazzaroni for their time and hospitality during my stay.
Of course, as a spectroscopist, one is totally and completely dependent on the syn-thetic chemist to provide one with the necessary compounds, as did dr. Henk Janssen andMichel Fransen (SyMo-Chem B.V.) who provided generous amounts of Ir(ppy)2(R-pic) anddr. Bea Langeveld, Jolanda Bastiaansen and Nicole Kiggen (TNO Science and Industry)who donated many a mg Ir(tBu-ppy)3, coC and regio-irregular P3HT, kindly assisted me inthe preparation of films and perpetually answered my many questions. My gratitude alsogoes to dr. Bert Groenendaal (Agfa) who kindly provided the nEDOT oligomers described inChapter 2 and Ralf Bovee and dr. Xianwen Lou who assisted me with their purification onthe preparative HPLC.
Prof. dr. Peter Bäuerle and dr. Elena Mena-Osteritz on their visit to Eindhoven spareda rather large amount of the (especially re-cooked!!) R-nEDOT oligomers as described in
IX
X
Chapter 3, that provided cause for so many inspiring night-sessions behind the machines –and they are still the most beautiful spectra that I have seen! – I enjoyed those measurementsimmensely, as I did my short visit to you and to the frosty city and University of Ulm!
Natalie, it has always been a pleasure – be it weekend UV measurements, philosophicand geometric discussions, the various grand movies and cigarillos we enjoyed – thanks foryour unstinting kindness and eternal optimism!
Dr. Bruce Anderson, loads of thanks to you, for with your Raman spectrometer I eventu-ally produced spectra that excelled in their LACK of noise...
Only due to the hands-on attitude of dr. Martijn Wienk could I maintain clog-free liquidnitrogen equipment and be sure that at least on glovebox was always available - thanksto you and Stefan all our the equipment was snatched, time and again, from the brink ofdestruction!
Dr. Tonek Jansen; thanks for the first time you brought me up-close-and-personal to thismost mysterious creature, the operator. Evgenii Pidko and Rik van Laarhoven, thanks foryour help and unwavering support with the theoretical calculations for Chapter 3 – withoutyou guys that chapter’s quality would have greatly suffered. Erik Postma, thanks to you forunveiling for me some of the more terrifying regions of mathematics as well as those (futileand non-so-futile) lunch-sessions.
During my participation in the meetings of the TriPLED project (Philips Research BV) Iprofited a lot from the knowledge and expertise of all members, my thanks go to you all.
My gratitude goes to Marko Boon whose invaluable help and answers to my million emailsmade it possible for me to largely avoid the MS-plague and to produce the final layout in LATEX,Dr. Oren Scherman helped with tips and tricks and LATEX bibliography styles and withoutprof. dr. Rint Sijbesma my Matlab programming would have come to nothing.
Furthermore, my thanks to Maarten Pouderoijen (the king of CaH2 destruction); to HansDamen, and the mechanical-glass men of the GTD (who can fix positively anything betweenthem); to Joke Rediker and the other ladies of the secretary for all those little things that letSMO run smoothly; to Henk for always making sure nothing was left standing around – ever,and for very nearly managing to get me off my notorious coffee addiction; to the ladies of thereception and to the people from BAT who more than once saved me and my subsequentand parallel computers from oblivion and fatal system errors, respectively.
The way SMO works is the miniature version of the Dutch way of life and has taughtme the Dutchmen’s motto: "always make the most if it!" – I spent unforgettable 4 years invarious offices together with various pleasant room mates: dr. Paul van Hal and dr. CorinneMartineau, dr. Chris Radano, dr. Stephen THE Dudek, Jaap Smits and dr. Edda Neuteboom,to name but a few. My chief desk neighbor Martin Wolffs who, despite his refusal to waterthe plants, is a goodfella; Dirk, sad that you joined the group so much later than I did – Ishould have liked some more discussions and problem solving together — thanks to you I

XI
could always tell the right day for experiments, due to total, utter and complete synchrony ofour work.
I was fortunate to have had an excellent colleague in dr. Ton Offermans – we spendmany an evening behind the various machines, computers, books and courses trying tomake sense of things – I learned a lot from and with you and had fun doing so!
I should like to venture a note of gratitude to "my" nanosecond laser setup - you surehave been accompanying my research with an unmistakably personal touch...
When I first came to the Netherlands dr. Abdelkrim El-Ghayoury and dr. Fiorella Brustolintook me under their (protective) wings and introduced me to the finer points of complicationof life in the Netherlands as ‘allochtoon’ — day and night. All the ‘allochtonen’ used to providea pleasant diversion from the bleak life in the catacombs of the laser lab – at least at a timewhen there was still time for a social life...
Dr. Hinke, without those uncountable and somewhat lengthy (coffee)breaks from work-frustrations, I would not have made it through the last half year unscathed!
I most certainly could not have done without the mental, emotional, female and profes-sional support of THE GIRLS: doctors Fiorella, Alicia, Hinke, Marga, Natalia, Daniela andEdda I shall miss those Ladies’-Days-Out very much.
There is of course also a life of the Dodo apart from the TU/e, whose inhabitants shallnot go unmentioned – TJ and Dagmar you have been friends unquestioning and withoutreserve since long before my coming to the Netherlands – my gratitude goes to you asmuch as to those more recent friends, Laura and Erik, Christel and Nico, who made me feelwelcome and at home in the Netherlands....and of course thanks to my ‘Taekwondo Kids’,Hoi Ying, Marieke&Merijn, Hanneke&Martijn and of course Richard – at times I positivelydepended on our training sessions being such an excellent valve for the various frustrationsand aggressions one bottles up at work...
Last but certainly not least: most of what I could achieve or was able to attempt in my lifeI owe to my beloved parents, who have in all things been my greatest fans (and fortunatelymy greatest critics too) – thank you so very much. Pascal, I shall not even make an attemptat saying anything meaningful – I’ll make a list...


Curriculum Vitae
Dorothee Wasserberg was born on July, 5th 1976 in Bendorf am Rhein, Germany. Sheattended primary school at the Grundschule Dormitz, Germany between 1983 and 1987,and received her secondary education during the years 1987-1996 at the Christian-Ernst-Gymnasium, Germany and Kylemore-Abbey-School, Ireland (1991-1992). In 1996 she ob-tained the ‘Abitur’, at the Christian-Ernst-Gymnasium.
In the same year she took up the subject of chemistry at the Friedrich-Alexander-Universität Erlangen-Nürnberg, where she received the ‘Vordiplom’, in 1998 and joined the‘Hauptdiplom’ course of chemistry. She spend a semester (1999) at the Loughborough-University, UK, participating in an undergraduate research project on LASER spectroscopyin the group of prof. dr. F. Wilkinson under the supervision of dr. D. Worrall. After com-pleting her final project (‘Diplomarbeit’) on functional [60]fullerene adducts at the Friedrich-Alexander-Universität Erlangen-Nürnberg with prof. dr. A. Hirsch and at the TechnischeUniversiteit Eindhoven, Netherlands, with prof. dr. U. Schubert she obtained the univer-sity degree,‘Diplom-Chemikerin’ at the Friedrich-Alexander-Universität Erlangen-Nürnbergin 2002.
Between 2002 and 2006 as a Ph.D. candidate at the Technische Universiteit Eindhoven,Netherlands, she continued her reseaerch activities in the field of LASER spectroscopy withprof. dr. R.A.J. Janssen and dr. S.C.J. Meskers on phosphorescence and (triplet) energytransfer in functional molecules, partially under collaboration with prof. dr. R. Lazzaroni,dr. D. Beljonne and dr. P. Marsal (Materia Nova Institute, Université Mons-Hainaut, Belgium)and prof. dr. P. Bäuerle and dr. E. Mena-Osteritz (Universität Ulm).
XIII


List of Publications
D. Wasserberg, P. Marsal, S. C. J. Meskers, R. A. J. Janssen, D. Beljonne: Phospho-rescence and Triplet State Energies of Oligothiophenes. J. Phys. Chem. B 2005,109(10), 4410-4415.
D. Wasserberg, S. P. Dudek, S. C. J. Meskers, R. A. J. Janssen: Comparison of theChain Length Dependence of the Singlet and Triplet Excited States of Oligofluorenes.Chem. Phys. Lett. 2005, 411(1-3), 273-277.
I. O. Shklyarevskiy, P. Jonkheijm, N. Stutzmann, D. Wasserberg, H. J. Wondergem,P. C. M. Christianen, A. P. H. J. Schenning, D. M. de Leeuw, Z. Tomovic, J. Wu, K.Müllen, J. C. Maan: High Anisotropy of the Field-Effect Transistor Mobility in Magnet-ically Aligned Discotic Liquid-Crystalline Semiconductors. J. Am. Chem. Soc. 2005,127 (46), 16233.
XV

References
[1] Chiang, C. K.; Fincher, J. C. R.; Park, Y. W.; Heeger, A. J.; Shirakawa, H.; Louis, E. J.;Gau, S. C.; MacDiarmid, A. G. Phys. Rev. Lett., 1977, 39(17), 1098–1101.
[2] Forrest, S. R. Nature, 2004, 428(6986), 911–918.
[3] Friend, R. H.; Gymer, R. W.; Holmes, A. B.; Burroughes, J. H.; Marks, R. N.; Taliani,C.; Bradley, D. D. C.; Dos Santos, D. A.; Brédas, J.-L.; Logdlund, M.; Salaneck, W. R.Nature, 1999, 397(6715), 121–128.
[4] Pope, M.; Kallmann, H. P.; Magnante, P. J. Chem. Phys., 1963, 38, 2042–2043.
[5] Tang, C. W.; VanSlyke, S. A. Appl. Phys. Lett., 1987, 51(12), 913–915.
[6] Burroughes, J. H.; Bradley, D. D. C.; Brown, A. R.; Marks, R. N.; Mackay, K.; Friend,R. H.; Burns, P. L.; Holmes, A. B. Nature, 1990, 347(6293), 539–541.
[7] Sariciftci, N. S.; Smilowitz, L.; Heeger, A. J.; Wudl, F. Science, 1992, 258(5087),1474–1476.
[8] Barbe, D. F.; Westgate, C. R. J. Phys. Chem. Solids, 1970, 31(12), 2679–2687.
[9] Tsumura, A.; Koezuka, H.; Ando, T. Appl. Phys. Lett., 1986, 49(18), 1210–1212.
[10] Atkins, P. W.; Friedman, R. S. Molecular Quantum Mechanics. Oxford UniversityPress, Oxford, 2001.
[11] Gilbert, A.; Baggot, J. Essentials of Molecular Photochemistry. Blackwell Science,Oxford, 1991.
[12] Turro, N. J. Modern Molecular Photochemistry. University Science Books, Sausalito,1978.
[13] Uhlenbeck, G. E.; Goudsmit, S. Naturwissenschaften, 1925, 13, 953–954.
[14] Romanovskii, Y. V.; Gerhard, A.; Schweitzer, B.; Scherf, U.; Personov, R. I.; Bässler,H. Phys. Rev. Lett., 2000, 84(5), 1027–1030.
[15] Janssen, R. A. J.; Moses, D.; Sariciftci, N. S. J. Chem. Phys., 1994, 101(11), 9519–9527.
XVII

XVIII REFERENCES
[16] Janssen, R. A. J. in Primary Photoexcitations in Conjugated Polymers, Sariciftci, N. S.,Ed., pp 524–558. World Scientific, Singapore, 1997.
[17] Monkman, A. P.; Burrows, H. D.; Miguel, M. D. G.; Hamblett, I.; Navaratnam, S. Chem.Phys. Lett., 1999, 307(5,6), 303–309.
[18] Landwehr, P.; Port, H.; Wolf, H. C. Chem. Phys. Lett., 1996, 260(1,2), 125–129.
[19] Janssen, R. A. J.; Sariciftci, N. S.; Heeger, A. J. J. Chem. Phys., 1994, 100(12),8641–8645.
[20] de Melo, J. S.; Silva, L. M.; Arnaut, L. G.; Becker, R. S. J. Chem. Phys., 1999, 111(12),5427–5433.
[21] Rentsch, S.; Yang, J. P.; Paa, W.; Birckner, E.; Schiedt, J.; Weinkauf, R. Phys. Chem.Chem. Phys., 1999, 1(8), 1707–1714.
[22] Wasserberg, D.; Marsal, P.; Meskers, S. C. J.; Janssen, R. A. J.; Beljonne, D. J. Phys.Chem. B, 2005, 109(10), 4410–4415.
[23] Wasserberg, D.; Dudek, S. P.; Meskers, S. C. J.; Janssen, R. A. J. Chem. Phys. Lett.,2005, 411(1-3), 273–277.
[24] Peeters, E.; Ramos, A. M.; Meskers, S. C. J.; Janssen, R. A. J. J. Chem. Phys., 2000,112(21), 9445–9454.
[25] Janssen, R. A. J.; Smilowitz, L.; Sariciftci, N. S.; Moses, D. J. Chem. Phys., 1994,101(3), 1787–1798.
[26] Beljonne, D.; Cornil, J.; Friend, R. H.; Janssen, R. A. J.; Brédas, J.-L. J. Am. Chem.Soc., 1996, 118(27), 6453–6461.
[27] Bäuerle, P. Adv. Mater., 1992, 4(2), 102–107.
[28] Colditz, R.; Grebner, D.; Helbig, M.; Rentsch, S. Chem. Phys., 1995, 201(2,3), 309–320.
[29] Becker, R. S.; de Melo, J. S.; Macanita, A. L.; Elisei, F. J. Phys. Chem., 1996, 100(48),18683–18695.
[30] Apperloo, J. J.; Groenendaal, L. B.; Verheyen, H.; Jayakannan, M.; Janssen, R. A. J.;Dkhissi, A.; Beljonne, D.; Lazzaroni, R.; Brédas, J.-L. Chem. Eur. J., 2002, 8(10),2384–2396.
[31] Gierschner, J.; Mack, H. G.; Egelhaaf, H. J.; Schweizer, S.; Doser, B.; Oelkrug, D.Synth. Met., 2003, 138(1-2), 311–315.
[32] Osikowicz, W.; Denier van der Gon, A. W.; Crispin, X.; de Jong, M. P.; Friedlein, R.;Groenendaal, L.; Fahlman, M.; Beljonne, D.; Lazzaroni, R.; Salaneck, W. R. J. Chem.Phys., 2003, 119(19), 10415–10420.
[33] Roncali, J.; Blanchard, P.; Frère, P. J. Mater. Chem., 2005, 15(16), 1589–1610.
REFERENCES XIX
[34] Klärner, G.; Miller, R. D. Macromolecules, 1998, 31(6), 2007–2009.
[35] Geng, Y.; Trajkovska, A.; Katsis, D.; Ou Jane, J.; Culligan Sean, W.; Chen Shaw, H. J.Am. Chem. Soc., 2002, 124(28), 8337–8347.
[36] Jo, J.; Chi, C.; Hoeger, S.; Wegner, G.; Yoon, D. Y. Chem. Eur. J., 2004, 10(11),2681–2688.
[37] Chi, C.; Im, C.; Enkelmann, V.; Ziegler, A.; Lieser, G.; Wegner, G. Chem. Eur. J., 2005,11(23), 6833–6845.
[38] Meier, H.; Stalmach, U.; Kolshorn, H. Acta Polymer., 1997, 48(9), 379–384.
[39] Romanovskii, Y. V.; Gerhard, A.; Schweitzer, B.; Personov, R. I.; Bässler, H. Chem.Phys., 1999, 249(1), 29–39.
[40] Narwark, O.; Meskers, S. C. J.; Peetz, R.; Thorn-Csanyi, E.; Bässler, H. Chem. Phys.,2003, 294(1), 1–15.
[41] Xu, B.; Holdcroft, S. J. Am. Chem. Soc., 1993, 115(18), 8447–8448.
[42] Romanovskii, Y. V.; Bässler, H. Chem. Phys. Lett., 2000, 326(1,2), 51–57.
[43] Hertel, D.; Setayesh, S.; Nothofer, H.-G.; Scherf, U.; Müllen, K.; Bässler, H. Adv.Mater., 2001, 13(1), 65–70.
[44] Hertel, D.; Bässler, H.; Güntner, R.; Scherf, U. J. Chem. Phys., 2001, 115(21), 10007–10013.
[45] Hayer, A.; Bässler, H.; Falk, B.; Schrader, S. J. Phys. Chem. A, 2002, 106(46), 11045–11053.
[46] Österbacka, R.; Wohlgenannt, M.; Chinn, D.; Vardeny, Z. V. Phys. Rev. B, 1999,60(16), R11253–R11256.
[47] Monkman, A. P.; Burrows, H. D.; Hamblett, I.; Navarathnam, S.; Svensson, M.; Ander-sson, M. R. J. Chem. Phys., 2001, 115(19), 9046–9049.
[48] Monkman, A. P.; Burrows, H. D.; Hartwell, L. J.; Horsburgh, L. E.; Hamblett, I.; Navarat-nam, S. Phys. Rev. Lett., 2001, 86(7), 1358–1361.
[49] Monkman, A. P.; Burrows, H. D.; Hamblett, I.; Navaratnam, S.; Scherf, U.; Schmitt, C.Chem. Phys. Lett., 2000, 327(1,2), 111–116.
[50] Rothe, C.; Hintschich, S.; Monkman, A. P.; Svensson, M.; Anderson, M. R. J. Chem.Phys., 2002, 116(23), 10503–10507.
[51] Lupton, J. M.; Pogantsch, A.; Piok, T.; List, E. J. W.; Patil, S.; Scherf, U. Phys. Rev.Lett., 2002, 89(16), 167401.
[52] Beljonne, D.; Wittmann, H. F.; Köhler, A.; Graham, S.; Younus, M.; Lewis, J.; Raithby,P. R.; Khan, M. S.; Friend, R. H.; Brédas, J.-L. J. Chem. Phys., 1996, 105(9), 3868–3877.

XX REFERENCES
[53] Wilson, J. S.; Köhler, A.; Friend, R. H.; Al-Suti, M. K.; Al-Mandhary, M. R. A.; Khan,M. S.; Raithby, P. R. J. Chem. Phys., 2000, 113(17), 7627–7634.
[54] Wilson, J. S.; Chawdhury, N.; Al-Mandhary, M. R.; Younus, M.; Khan, M. S.; Raithby,P. R.; Köhler, A.; Friend, R. H. J. Am. Chem. Soc., 2001, 123(38), 9412–9417.
[55] Köhler, A.; Wilson, J. S.; Friend, R. H.; Al-Suti, M. K.; Khan, M. S.; Gerhard, A.;Bässler, H. J. Chem. Phys., 2002, 116(21), 9457–9463.
[56] Dkhissi, A.; Beljonne, D.; Lazzaroni, R.; Louwet, F.; Groenendaal, L.; Brédas, J.-L. Int.J. Quant. Chem., 2003, 91(3), 517–523.
[57] Aléman, C.; Armelin, E.; Iribarren, J. I.; Liesa, F.; Laso, M.; Casanovas, J. Synth. Met.,2005, 149(2-3), 151–156.
[58] Beljonne, D.; Zhuai, Z.; Friend, R. H.; Brédas, J.-L. J. Chem. Phys., 1995, 102(5),2042–2049.
[59] Beljonne, D.; Cornil, J.; Brédas, J.-L.; Friend, R. H. Synth. Met., 1996, 76(1-3), 61–65.
[60] Schweitzer, B.; Arkhipov, V. I.; Scherf, U.; Bässler, H. Chem. Phys. Lett., 1999,313(1,2), 57–62.
[61] Hertel, D.; Romanovskii, Y. V.; Schweitzer, B.; Scherf, U.; Bässler, H. Synth. Met.,2001, 116(1-3), 139–143.
[62] Hertel, D.; Romanovskii, Y. V.; Schweitzer, B.; Scherf, U.; Bässler, H. Macromol.Symp., 2001, 175, 141–150.
[63] Rothe, C.; Monkman, A. P. Phys. Rev. B, 2003, 68(7), 075208/075201–075208/075211.
[64] Rothe, C.; Güntner, R.; Scherf, U.; Monkman, A. P. J. Chem. Phys., 2001, 115(20),9557–9562.
[65] Rothe, C.; Monkman, A. Phys. Rev. B, 2002, 65(7), 073201/073201–073201/073204.
[66] Sinha, S.; Rothe, C.; Güntner, R.; Scherf, U.; Monkman, A. P. Phys. Rev. Lett., 2003,90(12), 127402.
[67] Monkman, A. P.; Burrows, H. D.; Hamblett, I.; Navaratnam, S. Chem. Phys. Lett., 2001,340(5,6), 467–472.
[68] Burrows, H. D.; Seixas de Melo, J.; Serpa, C.; Arnaut, L. G.; Miguel, M. d. G.;Monkman, A. P.; Hamblett, I.; Navaratnam, S. Chem. Phys., 2002, 285(1), 3–11.
[69] Cao, Y.; Parker, I. D.; Yu, G.; Zhang, C.; Heeger, A. J. Nature, 1999, 397(6718),414–417.
[70] Ho, P. K. H.; Kim, J.-S.; Burroughes, J. H.; Becker, H.; Sam, F. Y. L.; Brown, T. M.;Cacialli, F.; Friend, R. H. Nature, 2000, 404(6777), 481–484.
[71] Wohlgenannt, M.; Tandon, K.; Mazumdar, S.; Ramasesha, S.; Vardeny, Z. V. Nature,2001, 409(6819), 494–497.
REFERENCES XXI
[72] Wohlgenannt, M.; Jiang, X. M.; Vardeny, Z. V.; Janssen, R. A. J. Phys. Rev. Lett.,2002, 88(19), 197401/197401–197401/197404.
[73] Wilson, J. S.; Dhoot, A. S.; Seeley, A. J.; Khan, M. S.; Köhler, A.; Friend, R. H. Nature,2001, 413(6858), 828–831.
[74] Meulenkamp, E. A.; van Aar, R.; Bastiaansen, J. J. A. M.; van den Biggelaar, A. J.;Börner, H.; Brunner, K.; Büchel, M.; van Dijken, A.; Kiggen, N. M. M.; Kilitziraki, M.;de Kok, M. M.; Langeveld, B. M.; Ligter, M. P. H.; Vulto, S. I. E.; van de Weijer, P.;de Winter, S. H. P. M. High efficiency polymer leds: triplets and novel devices. in Proc.SPIE, volume 5464, pp 90–103, Bellingham, 2004.
[75] Dhoot, A. S.; Ginger, D. S.; Beljonne, D.; Shuai, Z.; Greenham, N. C. Chem. Phys.Lett., 2002, 360(3,4), 195–201.
[76] Dhoot, A. S.; Greenham, N. C. Adv. Mater., 2002, 14(24), 1834–1837.
[77] Karabunarliev, S.; Bittner, E. R. Phys. Rev. Lett., 2003, 90(5), 057402/057401–057402/057404.
[78] Beljonne, D.; Shuai, Z.; Cornil, J.; Calbert, J. P.; Brédas, J.-L. J. Photochem. Photo-biol., A, 2001, 144(1), 57–62.
[79] Shuai, Z.; Beljonne, D.; Silbey, R. J.; Brédas, J.-L. Phys. Rev. Lett., 2000, 84(1),131–134.
[80] Kobrak, M. N.; Bittner, E. R. Phys. Rev. B, 2000, 62(17), 11473–11486.
[81] Hong, T.-M.; Meng, H.-F. Phys. Rev. B, 2001, 63(7), 075206/075201–075206/075205.
[82] Beljonne, D.; Shuai, Z.; Pourtois, G.; Brédas, J.-L. J. Phys. Chem. A, 2001, 105(15),3899–3907.
[83] Beljonne, D.; Ye, A.; Shuai, Z.; Brédas, J.-L. Adv. Funct. Mater., 2004, 14(7), 684–692.
[84] Karabunarliev, S.; Bittner, E. R. J. Chem. Phys., 2003, 118(9), 4291–4296.
[85] Segal, M.; Baldo, M. A.; Holmes, R. J.; Forrest, S. R.; Soos, Z. G. Phys. Rev. B, 2003,68(7), 075211/075211–075211/075214.
[86] Brédas, J.-L.; Beljonne, D.; Coropceanu, V.; Cornil, J. Chem. Rev., 2004, 104(11),4971–5003.
[87] Reufer, M.; Walter, M. J.; Lagoudakis, P. G.; Hummel, A. B.; Kolb, J. S.; Roskos, H. G.;Scherf, U.; Lupton, J. M. Nat. Mater., 2005, 4(4), 340–346.
[88] Kido, J.; Nagai, K.; Ohashi, Y. Chem. Lett., 1990, (4), 657–660.
[89] Baldo, M. A.; O’Brien, D. F.; You, Y.; Shoustikov, A.; Sibley, S.; Thompson, M. E.;Forrest, S. R. Nature, 1998, 395(6698), 151–154.
[90] Baldo, M. A.; Lamansky, S.; Burrows, P. E.; Thompson, M. E.; Forrest, S. R. Appl.Phys. Lett., 1999, 75(1), 4–6.
XXII REFERENCES
[91] Adachi, C.; Baldo, M. A.; Thompson, M. E.; Forrest, S. R. J. Appl. Phys., 2001, 90(10),5048–5051.
[92] Kawamura, Y.; Goushi, K.; Brooks, J.; Brown, J. J.; Sasabe, H.; Adachi, C. Appl. Phys.Lett., 2005, 86(7), 071104/071101–071104/071103.
[93] Manners, I. Science, 2001, 294(5547), 1664–1666.
[94] Cleave, V.; Yahioglu, G.; Le Barny, P.; Friend, R. H.; Tessler, N. Adv. Mater., 1999,11(4), 285–288.
[95] Baldo, M. A.; O’Brien, D. F.; Thompson, M. E.; Forrest, S. R. Phys. Rev. B, 1999,60(20), 14422–14428.
[96] Cocchi, M.; Virgili, D.; Sabatini, C.; Fattori, V.; Di Marco, P.; Maestri, M.; Kalinowski, J.Synth. Met., 2004, 147(1-3), 253–256.
[97] Welter, S.; Brunner, K.; Hofstraat, J. W.; De Cola, L. Nature, 2003, 421(6918), 54–57.
[98] Niu, Y.-H.; Tung, Y.-L.; Chi, Y.; Shu, C.-F.; Kim, J. H.; Chen, B.; Luo, J.; Carty, A. J.;Jen, A. K. Y. Chem. Mater., 2005, 17(13), 3532–3536.
[99] Liu, T.-H.; Hsu, S.-F.; Ho, M.-H.; Liao, C.-H.; Wu, Y.-S.; Chen, C. H.; Tung, Y.-L.; Wu,P.-C.; Chi, Y. Appl. Phys. Lett., 2006, 88(6), 063508/063501–063508/063503.
[100] Gu, L.; Xiong, Z.; Chen, G.; Xiao, Z.; Gong, D.; Hou, X.; Wang, X. Adv. Mater., 2001,13(18), 1402–1405.
[101] Coppo, P.; Duati, M.; Kozhevnikov, V. N.; Hofstraat, J. W.; De Cola, L. Angew. Chem.Int. Ed., 2005, 44(12), 1806–1810.
[102] Baldo, M. A.; Thompson, M. E.; Forrest, S. R. Nature, 2000, 403(6771), 750–753.
[103] Lamansky, S.; Djurovich, P.; Murphy, D.; Abdel-Razzaq, F.; Lee, H.-E.; Adachi, C.;Burrows, P. E.; Forrest, S. R.; Thompson, M. E. J. Am. Chem. Soc., 2001, 123(18),4304–4312.
[104] Adachi, C.; Baldo, M. A.; Forrest, S. R.; Lamansky, S.; Thompson, M. E.; Kwong, R. C.Appl. Phys. Lett., 2001, 78(11), 1622–1624.
[105] Gong, X.; Robinson, M. R.; Ostrowski, J. C.; Moses, D.; Bazan, G. C.; Heeger, A. J.Adv. Mater., 2002, 14(8), 581–585.
[106] Zhu, W.; Liu, C.; Su, L.; Yang, W.; Yuan, M.; Cao, Y. J. Mater. Chem., 2003, 13(1),50–55.
[107] Kawamura, Y.; Yanagida, S.; Forrest, S. R. J. Appl. Phys., 2002, 92(1), 87–93.
[108] Tsuzuki, T.; Shirasawa, N.; Suzuki, T.; Tokito, S. Adv. Mater., 2003, 15(17), 1455–1458.
[109] Tsuboyama, A.; Iwawaki, H.; Furugori, M.; Mukaide, T.; Kamatani, J.; Igawa, S.;Moriyama, T.; Miura, S.; Takiguchi, T.; Okada, S.; Hoshino, M.; Ueno, K. J. Am.Chem. Soc., 2003, 125(42), 12971–12979.

REFERENCES XXIII
[110] Holmes, R. J.; D’Andrade, B. W.; Forrest, S. R.; Ren, X.; Li, J.; Thompson, M. E. Appl.Phys. Lett., 2003, 83(18), 3818–3820.
[111] Tang, K.-C.; Liu, K. L.; Chen, I. C. Chem. Phys. Lett., 2004, 386(4-6), 437–441.
[112] Sandee, A. J.; Williams, C. K.; Evans, N. R.; Davies, J. E.; Boothby, C. E.; Köhler, A.;Friend, R. H.; Holmes, A. B. J. Am. Chem. Soc., 2004, 126(22), 7041–7048.
[113] Evans, N. R.; Devi, L. S.; Mak, C. S. K.; Watkins, S. E.; Pascu, S. I.; Köhler, A.; Friend,R. H.; Williams, C. K.; Holmes, A. B. J. Am. Chem. Soc., 2006, 128(20), 6647–6656.
[114] Holmes, R. J.; Forrest, S. R.; Sajoto, T.; Tamayo, A.; Djurovich, P. I.; Thompson, M. E.;Brooks, J.; Tung, Y. J.; D’Andrade, B. W.; Weaver, M. S.; Kwong, R. C.; Brown, J. J.Appl. Phys. Lett., 2005, 87(24), 243507/243501–243507/243503.
[115] Mak, C. S. K.; Hayer, A.; Pascu, S. I.; Watkins, S. E.; Holmes, A. B.; Koehler, A.;Friend, R. H. Chem. Commun., 2005, (37), 4708–4710.
[116] Ragni, R.; Plummer, E. A.; Brunner, K.; Hofstraat, J. W.; Babudri, F.; Farinola, G. M.;Naso, F.; De Cola, L. J. Mater. Chem., 2006, 16(12), 1161–1170.
[117] Plummer, E. A.; Van Dijken, A.; Hofstraat, H. W.; De Cola, L.; Brunner, K. Adv. Funct.Mater., 2005, 15(2), 281–289.
[118] Holder, E.; Langeveld, B. M. W.; Schubert, U. S. Adv. Mater., 2005, 17(9), 1109–1121.
[119] D’Andrade, B. W.; Forrest, S. R. Adv. Mater., 2004, 16(18), 1585–1595.
[120] Kido, J.; Kimura, M.; Nagai, K. Science, 1995, 267(5202), 1332–1334.
[121] D’Andrade, B. W.; Thompson, M. E.; Forrest, S. R. Adv. Mater., 2002, 14(2), 147–151.
[122] Kanno, H.; Sun, Y.; Forrest, S. R. Appl. Phys. Lett., 2005, 86(26), 263502/263501–263502/263503.
[123] D’Andrade, B. W.; Holmes, R. J.; Forrest, S. R. Adv. Mater., 2004, 16(7), 624–628.
[124] Suzuki, M.; Hatakeyama, T.; Tokito, S.; Sato, F. IEEE J. Sel. Top. Quantum Electron.,2004, 10(1), 115–120.
[125] Sun, Y.; Giebink Noel, C.; Kanno, H.; Ma, B.; Thompson Mark, E.; Forrest Stephen, R.Nature, 2006, 440(7086), 908–912.
[126] Gong, X.; Moses, D.; Heeger, A. J.; Xiao, S. J. Phys. Chem. B, 2004, 108(25), 8601–8605.
[127] Adamovich, V.; Brooks, J.; Tamayo, A.; Alexander, A. M.; Djurovich, P. I.; D’Andrade,B. W.; Adachi, C.; Forrest, S. R.; Thompson, M. E. New J. Chem., 2002, 26(9), 1171–1178.
[128] Xie, H. Z.; Liu, M. W.; Wang, O. Y.; Zhang, X. H.; Lee, C. S.; Hung, L. S.; Lee, S. T.;Teng, P. F.; Kwong, H. L.; Zheng, H.; Che, C. M. Adv. Mater., 2001, 13(16), 1245–1248.
[129] Tanaka, I.; Tokito, S. J. Appl. Phys., 2005, 97(11), 113532/113531–113532/113534.

XXIV REFERENCES
[130] Kawamura, Y.; Brooks, J.; Brown, J. J.; Sasabe, H.; Adachi, C. Phys. Rev. Lett., 2006,96(1), 017404/017401–017404/017404.
[131] Chen, F.-C.; He, G.; Yang, Y. Appl. Phys. Lett., 2003, 82(7), 1006–1008.
[132] Chen, F.-C.; Chang, S.-C.; He, G.; Pyo, S.; Yang, Y.; Kurotaki, M.; Kido, J. J. Polym.Sci., Part A : Polym. Phys., 2003, 41(21), 2681–2690.
[133] Kalinowski, J.; Stampor, W.; Cocchi, M.; Virgili, D.; Fattori, V.; Di Marco, P. Chem.Phys., 2004, 297(1-3), 39–48.
[134] Tanaka, I.; Tabata, Y.; Tokito, S. Chem. Phys. Lett., 2004, 400(1-3), 86–89.
[135] Giebink, N. C.; Sun, Y.; Forrest, S. R. Org. Electronics, In Press, Corrected Proof.
[136] Fushimi, T.; Oda, A.; Ohkita, H.; Ito, S. J. Phys. Chem. B, 2004, 108(49), 18897–18902.
[137] Bakker, J.; Gommers, F. J.; Nieuwenhuis, I.; Wynberg, H. J. Biol. Chem., 1979, 254(6),1841–1844.
[138] Fichou, D.; Ed. Handbook of Oligo- and Polythiophenes. VCH, Weinheim, 1999.
[139] Wintgens, V.; Valat, P.; Garnier, F. J. Phys. Chem., 1994, 98(1), 228–232.
[140] Evans, C. H.; Scaiano, J. C. J. Am. Chem. Soc., 1990, 112(7), 2694–2701.
[141] Becker, R. S.; de Melo, S.; Macanita, A. L.; Elisei, F. Pure Appl. Chem., 1995, 67(1),9–16.
[142] Grebner, D.; Helbig, M.; Rentsch, S. J. Phys. Chem., 1995, 99(46), 16991–16998.
[143] Apperloo, J. J.; Janssen, R. A. J.; Malenfant, P. R. L.; Fréchet, J. M. J. J. Am. Chem.Soc., 2001, 123(28), 6916–6924.
[144] Reyftmann, J. P.; Kagan, J.; Santus, R.; Morliere, P. Photochem. Photobio., 1985,41(1), 1–7.
[145] Evans, C.; Weir, D.; Scaiano, J. C.; Mac Eachern, A.; Arnason, J. T.; Morand, P.;Hollebone, B.; Leitch, L. C.; Philogene, B. J. R. Photochem. Photobio., 1986, 44(4),441–451.
[146] Scaiano, J. C.; MacEachern, A.; Arnason, J. T.; Morand, P.; Weir, D. Photochem.Photobio., 1987, 46(2), 193–199.
[147] Scaiano, J. C.; Redmond, R. W.; Mehta, B.; Arnason, J. T. Photochem. Photobio.,1990, 52(4), 655–659.
[148] Laquai, F.; Im, C.; Kadashchuk, A.; Bässler, H. Chem. Phys. Lett., 2003, 375(3,4),286–291.
[149] Reufer, M.; Schindler, F.; Patil, S.; Scherf, U.; Lupton, J. M. Chem. Phys. Lett., 2003,381(1,2), 60–66.
REFERENCES XXV
[150] Köhler, A.; Beljonne, D. Adv. Funct. Mater., 2004, 14(1), 11–18.
[151] Pogantsch, A.; Heimel, G.; Zojer, E. J. Chem. Phys., 2002, 117(12), 5921–5928.
[152] Nguyen, K. A.; Kennel, J.; Pachter, R. J. Chem. Phys., 2002, 117(15), 7128–7136.
[153] Mataga, N.; Nishimoto, K. Z. Phys. Chem., 1957, 13, 140–157.
[154] Frisch, M. J. et al., GAUSSIAN98. Gaussian Inc., Pittsburgh, 1998.
[155] Wynberg, H.; Metselaar, J. Synth. Commun., 1984, 14(1), 1–9.
[156] Nakayama, J.; Nakamura, Y.; Tajiri, T.; Hoshino, M. Heterocycles, 1986, 24(3), 637–640.
[157] Wei, Y.; Wang, B.; Wang, W.; Tian, J. Tetrahedron Lett., 1995, 36(5), 665–668.
[158] Van Haare, J. A. E. H.; Havinga, E. E.; Van Dongen, J. L. J.; Janssen, R. A. J.; Cornil,J.; Brédas, J.-L. Chem. Eur. J., 1998, 4(8), 1509–1522.
[159] Groenendaal, L. B.; Jonas, F.; Freitag, D.; Pielartzik, H.; Reynolds, J. R. Adv. Mater.,2000, 12(7), 481–494.
[160] Groenendaal, L. B.; Zotti, G.; Aubert, P.-H.; Waybright, S. M.; Reynolds, J. R. Adv.Mater., 2003, 15(11), 855–879.
[161] Argun, A. A.; Cirpan, A.; Reynolds, J. R. Adv. Mater., 2003, 15(16), 1338–1341.
[162] Argun, A. A.; Aubert, P.-H.; Thompson, B. C.; Schwendeman, I.; Gaupp, C. L.; Hwang,J.; Pinto, N. J.; Tanner, D. B.; MacDiarmid, A. G.; Reynolds, J. R. Chem. Mater., 2004,16(23), 4401–4412.
[163] Thomas, C. A.; Zong, K.; Abboud, K. A.; Steel, P. J.; Reynolds, J. R. J. Am. Chem.Soc., 2004, 126(50), 16440–16450.
[164] Huchet, L.; Akoudad, S.; Levillain, E.; Roncali, J.; Emge, A.; Bäuerle, P. J. Phys.Chem. B, 1998, 102(40), 7776–7781.
[165] Segura, J. L.; Gomez, R.; Reinold, E.; Bäuerle, P. Org. Lett., 2005, 7(12), 2345–2348.
[166] Segura, J. L.; Gomez, R.; Blanco, R.; Reinold, E.; Bäuerle, P. Chem. Mater., 2006,18(12), 2834–2847.
[167] Caras-Quintero, D.; Bäuerle, P. Chem. Commun., 2002, (22), 2690–2691.
[168] Caras-Quintero, D.; Bäuerle, P. Chem. Commun., 2004, (8), 926–927.
[169] Wegner, G.; Müllen, K.; Eds. Electronic Materials: The Oligomer Approach. VCH,Weinheim, 1996.
[170] Sotzing, G. A.; Reynolds, J. R.; Steel, P. J. Chem. Mater., 1996, 8(4), 882–889.
[171] Sotzing, G. A.; Reynolds, J. R.; Steel, P. J. Adv. Mater., 1997, 9(10), 795–798.
[172] Akoudad, S.; Roncali, J. Synth. Met., 1998, 93(2), 111–114.

XXVI REFERENCES
[173] Zhu, S. S.; Swager, T. M. J. Am. Chem. Soc., 1997, 119(51), 12568–12577.
[174] Hicks, R. G.; Nodwell, M. B. J. Am. Chem. Soc., 2000, 122(28), 6746–6753.
[175] De Jong, M. P.; Denier van der Gon, A. W.; Crispin, X.; Osikowicz, W.; Salaneck, W. R.;Groenendaal, L. J. Chem. Phys., 2003, 118(14), 6495–6502.
[176] Turbiez, M.; Frère, P.; Roncali, J. J. Org. Chem., 2003, 68(13), 5357–5360.
[177] Turbiez, M.; Frère, P.; Roncali, J. Tetrahedron, 2005, 61(12), 3045–3053.
[178] Turbiez, M.; Frère, P.; Allain, M.; Gallego-Planas, N.; Roncali, J. Macromolecules,2005, 38(16), 6806–6812.
[179] Casado, J.; Ortiz, R. P.; Ruiz Delgado, M. C.; Hernandez, V.; Lopez Navarrete, J. T.;Raimundo, J.-M.; Blanchard, P.; Allain, M.; Roncali, J. J. Phys. Chem. B, 2005,109(35), 16616–16627.
[180] Jousselme, B.; Blanchard, P.; Allain, M.; Levillain, E.; Dias, M.; Roncali, J. J. Phys.Chem. A, 2006, 110(10), 3488–3494.
[181] Leriche, P.; Blanchard, P.; Frère, P.; Levillain, E.; Mabon, G.; Roncali, J. Chem. Com-mun., 2006, (3), 275–277.
[182] Perepichka, I. F.; Roquet, S.; Leriche, P.; Raimundo, J.-M.; Frère, P.; Roncali, J. Chem.Eur. J., 2006, 12(11), 2960–2966.
[183] Turbiez, M.; Frère, P.; Allain, M.; Videlot, C.; Ackermann, J.; Roncali, J. Chem. Eur. J.,2005, 11(12), 3742–3752.
[184] Roncali, J.; Frère, P.; Blanchard, P.; de Bettignies, R.; Turbiez, M.; Roquet, S.; Leriche,P.; Nicolas, Y. Thin Solid Films, 2006, 511-512, 567–575.
[185] Schenk, R.; Gregorius, H.; Meerholz, K.; Heinze, J.; Müllen, K. J. Am. Chem. Soc.,1991, 113(7), 2634–2647.
[186] Oelkrug, D.; Tompert, A.; Egelhaaf, H.-J.; Hanack, M.; Steinhuber, E.; Hohloch, M.;Meier, H.; Stalmach, U. Synth. Met., 1996, 83(3), 231–237.
[187] Cornil, J.; Beljonne, D.; Heller, C. M.; Campbell, I. H.; Laurich, B. K.; Smith, D. L.;Bradley, D. D. C.; Müllen, K.; Brédas, J.-L. Chem. Phys. Lett., 1997, 278(1,2,3), 139–145.
[188] Gierschner, J.; Mack, H.-G.; Luer, L.; Oelkrug, D. J. Chem. Phys., 2002, 116(19),8596–8609.
[189] Yasuda, T.; Fujita, K.; Tsutsui, T.; Geng, Y.; Culligan, S. W.; Chen, S. H. Chem. Mater.,2005, 17(2), 264–268.
[190] Reinold, E.; Nicklas, F.; Vogt, A.; Bäuerle, P. in preparation.
[191] Raimundo, J. M.; Blanchard, P.; Frère, P.; Mercier, N.; Ledoux-Rak, I.; Hierle, R.;Roncali, J. Tetrahedron Lett., 2001, 42(8), 1507–1510.

REFERENCES XXVII
[192] Strickler, S. J.; Berg, R. A. J. Chem. Phys., 1962, 37, 814–822.
[193] Hayer, A.; Khan, A. L. T.; Friend, R. H.; Köhler, A. Phys. Rev. B, 2005, 71(24),241302/241301–241302/241304.
[194] Khan, A. L. T.; Sreearunothai, P.; Herz, L. M.; Banach, M. J.; Köhler, A. Phys. Rev. B,2004, 69(8), 085201/085201–085201/085208.
[195] Birnbaum, D.; Kohler, B. E. J. Chem. Phys., 1991, 95(7), 4783–4789.
[196] Birnbaum, D.; Kohler, B. E. J. Chem. Phys., 1989, 90(7), 3506–3510.
[197] Birnbaum, D.; Fichou, D.; Kohler, B. E. J. Chem. Phys., 1992, 96(1), 165–169.
[198] Louarn, G.; Buisson, J. P.; Lefrant, S.; Fichou, D. J. Phys. Chem., 1995, 99(29),11399–11404.
[199] Hernandez, V.; Casado, J.; Ramirez, F. J.; Alemany, L. J.; Hotta, S.; Lopez Navarrete,J. T. J. Phys. Chem., 1996, 100(1), 289–293.
[200] Hernandez, V.; Casado, J.; Ramirez, F. J.; Zotti, G.; Hotta, S.; Lopez Navarrete, J. T.J. Chem. Phys., 1996, 104(23), 9271–9282.
[201] Casado, J.; Hotta, S.; Hernandez, V.; Lopez Navarrete, J. T. J. Phys. Chem. A, 1999,103(7), 816–822.
[202] Moreno Castro, C.; Ruiz Delgado, M. C.; Hernandez, V.; Hotta, S.; Casado, J.;Lopez Navarrete, J. T. J. Chem. Phys., 2002, 116(23), 10419–10427.
[203] Castro, C. M.; Ruiz Delgado, M. C.; Hernandez, V.; Shirota, Y.; Casado, J.;Lopez Navarrete, J. T. J. Phys. Chem. B, 2002, 106(29), 7163–7170.
[204] Casado, J.; Hernandez, V.; Ruiz Delgado, M. C.; Ortiz, R. P.; Lopez Navarrete, J. T.;Facchetti, A.; Marks, T. J. J. Am. Chem. Soc., 2005, 127(38), 13364–13372.
[205] Scott, A. P.; Radom, L. J. Phys. Chem., 1996, 100(41), 16502–16513.
[206] Frisch, M. J. et al., GAUSSIAN03. Gaussian Inc., Pittsburgh, 2003.
[207] Bässler, H.; Schweitzer, B. Acc. Chem. Res., 1999, 32(2), 173–182.
[208] Albrecht, A. C. J. Chem. Phys., 1963, 38, 354–365.
[209] Lim, E. C.; Yu, J. M. H. J. Chem. Phys., 1967, 47(9), 3270–3275.
[210] Lim, E. C.; Yu, J. M. H. J. Chem. Phys., 1968, 49(9), 3878–3884.
[211] Griesser, H. J.; Bramley, R. Chem. Phys., 1982, 67(3), 373–389.
[212] Ochterski, J. W. Vibrational Analysis in Gaussian,http://gaussian.com/g whitepap/vib.htm. 1999.
[213] Wilson, J. E. B.; Decius, J. C.; Cross, P. C. Molecular Vibrations. McGraw-Hill, NewYork, 1955.
XXVIII REFERENCES
[214] Partee, J.; Frankevich, E. L.; Uhlhorn, B.; Shinar, J.; Ding, Y.; Barton, T. J. Phys. Rev.Lett., 1999, 82(18), 3673–3676.
[215] Ohmori, Y.; Uchida, M.; Muro, K.; Yoshino, K. Jpn. J. Appl. Phys., Part 2, 1991,20(11B), L1938–L1940.
[216] Horie, K.; Ushiki, H.; Winnik, F. M. Molecular Photonics: Fundamentals and PracticalAspects. VCH, Weinheim, 2000.
[217] Valeur, B. Molecular Fluorescence - An Introduction: Principles and Applications.VCH, Weinheim, 2000.
[218] Pfeffer, N.; Raimond, P.; Charra, F.; Nunzi, J.-M. Chem. Phys. Lett., 1993, 201(1-4),357–363.
[219] Meyer, R. K.; Liess, M.; Benner, R. E.; Gellermann, W.; Vardeny, Z. V.; Ozaki, M.;Yoshino, K.; Ding, Y.; Barton, T. Two-photon absorption spectra of luminescent con-ducting polymers measured over wide spectral range. in Proc. SPIE, volume 3145, pp219–228, 1997.
[220] Meyer, R. K.; Benner, R. E.; Vardeny, Z. V.; Liess, M.; Ozaki, M.; Yoshino, K.; Ding, Y.;Barton, T. Synth. Met., 1997, 84(1-3), 549–550.
[221] Sakurai, K.; Tachibana, H.; Shiga, N.; Terakura, C.; Matsumoto, M.; Tokura, Y. Phys.Rev. B, 1997, 56(15), 9552–9556.
[222] Monkman, A. P.; Burrows, H. D.; Horsburgh, L. E.; Hartwell, L. J.; Miguel, M. d. G.;Hamblett, I.; Navaratnam, S. Measurement of triplet and charged states in conjugatedpolymers by pulse radiolysis. in Proc. SPIE, volume 3797, pp 109–117, 1999.
[223] van Hal, P. A. Photophysics of Molecules and Materials for Polymer Solar Cells. Dis-sertation, Eindhoven University of Technology, The Netherlands, 2003.
[224] Sugimoto, R.; Takeda, S.; Gu, H. B.; Yoshino, K. Chem. Express, 1986, 1(11), 635–638.
[225] Sirringhaus, H.; Brown, P. J.; Friend, R. H.; Nielsen, M. M.; Bechgaard, K.; Langeveld-Voss, B. M. W.; Spiering, A. J. H.; Janssen, R. A. J.; Meijer, E. W.; Herwig, P.;De Leeuw, D. M. Nature, 1999, 401(6754), 685–688.
[226] Köhler, A.; Wilson, J. S.; Friend, R. H. Adv. Mater., 2002, 14(10), 701–707.
[227] Barltrop, J. A.; Coyle, J. D. Excited States in Organic Chemistry. Wiley, New York,1975.
[228] Canabate Diaz, B.; Schulman, S. G.; Segura Carretero, A.; Fernandez Gutierrez, A.Anal. Chim. Acta, 2003, 489(2), 165–171.
[229] Rothe, C.; Palsson, L. O.; Monkman, A. P. Chem. Phys., 2002, 285(1), 95–101.
[230] Kadashchuk, A.; Vakhnin, A.; Skryshevski, Y.; Arkhipov, V. I.; Emelianova, E. V.;Bässler, H. Chem. Phys., 2003, 291(3), 243–250.
REFERENCES XXIX
[231] Fratev, F.; Hermann, H.; Olbrich, G.; Polansky, O. E.; Zander, M. Z. Naturforsch., A:Phys. Sci., 1976, 31A(1), 84–86.
[232] Hoshi, T.; Oka, M.; Komuro, M.; Yoshino, J.; Ota, K.; Murofushi, K. Z. Phys. Chem.,1978, 112(2), 129–137.
[233] Craig, D. P.; Ross, I. G. J. Chem. Soc., 1954, pp 1589–1606.
[234] Cadby, A. J.; Lane, P. A.; Mellor, H.; Martin, S. J.; Grell, M.; Giebeler, C.; Bradley, D.D. C.; Wohlgenannt, M.; An, C.; Vardeny, Z. V. Phys. Rev. B, 2000, 62(23), 15604–15609.
[235] Cadby, A. J.; Lane, P. A.; Wohlgenannt, M.; An, C.; Vardeny, Z. V.; Bradley, D. D. C.Synth. Met., 2000, 111-112, 515–518.
[236] Romaner, L.; Piok, T.; Gadermaier, C.; Guentner, R.; Scandiucci de Freitas, P.; Scherf,U.; Cerullo, G.; Lanzani, G.; List, E. J. W. Synth. Met., 2003, 139(3), 851–854.
[237] Rissler, J. Chem. Phys. Lett., 2004, 395(1-3), 92–96.
[238] Pope, M.; Swenberg, C. Electronic Processes in Organic Crystals and Polymers.Oxford University Press, Oxford, 1999.
[239] O’Brien, D. F.; Baldo, M. A.; Thompson, M. E.; Forrest, S. R. Appl. Phys. Lett., 1999,74(3), 442–444.
[240] Powell, R. C.; Soos, Z. G. J. Luminescence, 1975, 11(1-2), 1–45.
[241] Avakian, P.; Merrifield, R. E. Phys. Rev. Lett., 1964, 13(18), 541–543.
[242] Avakian, P.; Merrifield, R. E. Mol. Cryst., 1968, 5(1), 37–77.
[243] Bässler, H. J. Chem. Phys., 1968, 49(11), 5198–5199.
[244] Durocher, G.; Williams, D. F. J. Chem. Phys., 1969, 51(4), 1675–1676.
[245] Pautmeier, L.; Ries, B.; Richert, R.; Bässler, H. Chem. Phys. Lett., 1988, 143(5),459–462.
[246] Richert, R.; Bässler, H. J. Chem. Phys., 1986, 84(6), 3567–3572.
[247] Ito, S.; Katayama, H.; Yamamoto, M. Macromolecules, 1988, 21(8), 2456–2462.
[248] Dexter, D. L. J. Chem. Phys., 1953, 21, 836–850.
[249] Davidovich, M. A.; Konx, R. S. Chem. Phys. Lett., 1979, 68(2,3), 391–394.
[250] Baldo, M. A.; Forrest, S. R. Phys. Rev. B, 2000, 62(16), 10958–10966.
[251] Kroeze, J. E.; Koehorst, R. B. M.; Savenije, T. J. Adv. Funct. Mater., 2004, 14(10),992–998.
[252] Förster, T. Ann. Physik, 1948, 2, 55–75.
[253] Kroeze, J. E.; Savenije, T. J.; Warman, J. M. Adv. Mater., 2002, 14(23), 1760–1763.

XXX REFERENCES
[254] Kroeze, J. E.; Savenije, T. J.; Candeias, L. P.; Warman, J. M.; Siebbeles, L. D. A. Sol.Energy Mater. Sol. Cells, 2004, 85(2), 189–203.
[255] Namdas, E. B.; Ruseckas, A.; Samuel, I. D. W.; Lo, S.-C.; Burn, P. L. Appl. Phys. Lett.,2005, 86(9), 091104/091101–091104/091103.
[256] Baldo, M. A.; Adachi, C.; Forrest, S. R. Phys. Rev. B, 2000, 62(16), 10967–10977.
[257] van Dijken, A.; Bastiaansen Jolanda, J. A. M.; Kiggen Nicole, M. M.; Langeveld Bea,M. W.; Rothe, C.; Monkman, A.; Bach, I.; Stössel, P.; Brunner, K. J. Am. Chem. Soc.,2004, 126(24), 7718–7727.
[258] Brunner, K.; Van Dijken, A.; Börner, H.; Bastiaansen, J. J. A. M.; Kiggen, N. M. M.;Langeveld, B. M. W. J. Am. Chem. Soc., 2004, 126(19), 6035–6042.
[259] Botelho do Rego, A. M.; Rei Villar, M.; Lopes da Silva, J. J. Electron Spectrosc. Relat.Phenom., 1997, 85(1,2), 81–91.
[260] Rippen, G.; Kaufmann, G.; Kloepffer, W. Chem. Phys., 1980, 52(1-2), 165–177.
[261] Lamansky, S.; Djurovich, P.; Murphy, D.; Abdel-Razzaq, F.; Kwong, R.; Tsyba, I.; Bortz,M.; Mui, B.; Bau, R.; Thompson, M. E. Inorg. Chem., 2001, 40(7), 1704–1711.
[262] Dedeian, K.; Djurovich, P. I.; Garces, F. O.; Carlson, G.; Watts, R. J. Inorg. Chem.,1991, 30(8), 1685–1687.
[263] Debye, P. T. Electrochem. Soc., 1942, 82, 7.
[264] Singh, R. P.; Sinha, C. P. J. Chem. Eng. Data, 1985, 30(4), 470–474.
[265] Vallés, C.; Pérez, E.; Mainar, A. M.; Santafé, J.; Domínguez, M. J. Chem. Eng. Data,2006, 51(3), 1105–1109.
[266] Atkins, P. W. Physical Chemistry. VCH, Weinheim, 1994.
[267] Moore, W. J. Physical Chemistry. Prentice-Hall, Englewood Cliffs, 1972.
[268] Lou, X.; van Buijtenen, J.; Bastiaansen, J. J. A. M.; de Waal, B. F. M.; Langeveld, B.M. W.; van Dongen, J. L. J. J. Mass Spectrom., 2005, 40(5), 654–660.
[269] Lee, C.-L.; Lee, K. B.; Kim, J.-J. Appl. Phys. Lett., 2000, 77(15), 2280–2282.
[270] Zhu, W.; Mo, Y.; Yuan, M.; Yang, W.; Cao, Y. Appl. Phys. Lett., 2002, 80(12), 2045–2047.
[271] Gong, X.; Ostrowski, J. C.; Bazan, G. C.; Moses, D.; Heeger, A. J.; Liu, M. S.; Jen, A.K. Y. Adv. Mater., 2003, 15(1), 45–49.
[272] Gong, X.; Ostrowski, J. C.; Moses, D.; Bazan, G. C.; Heeger, A. J. Adv. Funct. Mater.,2003, 13(6), 439–444.
[273] Gong, X.; Lim, S.-H.; Ostrowski, J. C.; Moses, D.; Bardeen, C. J.; Bazan, G. C. J. Appl.Phys., 2004, 95(3), 948–953.

REFERENCES XXXI
[274] Gong, X.; Ma, W.; Ostrowski, J. C.; Bazan, G. C.; Moses, D.; Heeger, A. J. Adv. Mater.,2004, 16(7), 615–619.
[275] Gong, X.; Wang, S.; Moses, D.; Bazan, G. C.; Heeger, A. J. Adv. Mater., 2005, 17(17),2053–2058.
[276] D’Andrade, B. W.; Baldo, M. A.; Adachi, C.; Brooks, J.; Thompson, M. E.; Forrest,S. R. Appl. Phys. Lett., 2001, 79(7), 1045–1047.
[277] Colombo, M. G.; Brunold, T. C.; Riedener, T.; Guedel, H. U.; Fortsch, M.; Bürgi, H.-B.Inorg. Chem., 1994, 33(3), 545–550.
[278] King, K. A.; Spellane, P. J.; Watts, R. J. J. Am. Chem. Soc., 1985, 107(5), 1431–1432.
[279] Breu, J.; Stoessel, P.; Schrader, S.; Starukhin, A.; Finkenzeller, W. J.; Yersin, H. Chem.Mater., 2005, 17(7), 1745–1752.