triss working paper series - tcd
TRANSCRIPT

1
TRiSS Working Paper Series
No. # TRiSS-WPS-06-2020
Version #1
Analysis of the acceptance by Dublin’s population of technological innovation by age demographic, using AV and
SAV as examples.
Ciara Sugden1
School: School of Geography Email address: [email protected]
Date: 30/10/2020
Abstract: Autonomous vehicle technology is the next frontier of Dublin’s mobility sector, with plans
formulated governmentally under Smart Dublin initiates for the introduction of this technology in the
next 5 years (Department of Transport, Tourism and Sport, 2018). For this change to be successfully
implemented and accepted by Dublin’s population, it must first be understood what influences
acceptance of technological innovation. Within this study, a person’s travel priorities, impression of
AV technology and level of knowledge of said technology was examined in relation to acceptance. It
was also examined across age demographics to garner a more specific understanding of acceptance
tailored towards different age populations. It was found that a person’s travel priorities and
impressions have no strong relationship with acceptance of a technology for both Young and Mature
adults. Prior knowledge was found to have a relationship with acceptance in the case of both
populations, with less information causing more uncertainty in Young adults, and outright rejection of
technology with Mature adults. Ergo, when making future mobility changes, public knowledge should
1 Acknowledgements:

2
be a main priority to allow for the most strategic and successful adaption of Dublin’s population to
said technology.
Keywords: Smart urbanism, AI, Autonomous Vehicles, Shared Autonomous Vehicles,
Psychology, Acceptance Theory, SMART Dublin, Fourth Industrial Revolution
Primary discipline: e.g. Smart urbanism
In the case of multiple authors, has permission been obtained for submission from all
authors: Yes / No / Not Applicable. Please include all co-authors on your submission email
In the case of PhD students, has permission been obtained from your supervisor(s): Yes /
No / Not Applicable. Please include your PhD supervisor(s) on your submission email

3
Abstract
Autonomous vehicle technology is the next frontier of Dublin’s mobility sector, with
plans formulated governmentally under Smart Dublin initiates for the introduction of
this technology in the next 5 years (Department of Transport, Tourism and Sport,
2018). For this change to be successfully implemented and accepted by Dublin’s
population, it must first be understood what influences acceptance of technological
innovation. Within this study, a person’s travel priorities, impression of AV technology
and level of knowledge of said technology was examined in relation to acceptance. It
was also examined across age demographics to garner a more specific understanding
of acceptance tailored towards different age populations. It was found that a persons
travel priorities and impressions have no strong relationship with acceptance of a
technology for both Young and Mature adults. Prior knowledge was found to have a
relationship with acceptance in the case of both populations, with less information
causing more uncertainty in Young adults, and outright rejection of technology with
Mature adults. Ergo, when making future mobility changes, public knowledge should
be a main priority to allow for the most strategic and successful adaption of Dublin’s
population to said technology.

4
Table of Contents
List of Figures 6
Acronyms 9
1. Introduction 1.1 Self-driving cars or Autonomous vehicles 10
1.2 Shared self-driving cars or Shared autonomous vehicles 11
2. Methodology Introduction 13
2.1 Research Aims and Objectives 13
2.2 Justification 13
2.3 Study approach and Structure 14
2.4 Survey distribution 17
2.5 Limitations 18
2.6 Ethics 18
3. Literary review Introduction 20
3.1 Acceptance of technological innovation 20
3.2 Demographic determinants of acceptance: a focus on age 22
3.3 User priority and experience 24
3.4 User’s knowledge and its relationship with acceptance 29
Conclusion 31
4. Results Introduction 32
4.1.1 Populations priorities for transport 32
4.1.2 Populations impression of various factors of AV/SAV 34
4.1.3 Populations rate of acceptance, incentives & preventions 37
4.2.1 Populations level of knowledge and impression of 41
SAV

5
4.2.2 Populations level of knowledge and acceptance of 45
SAV
Conclusion 48
5. Discussion Introduction 49
5.1 Populations travel priorities and impressions of AV and 51
SAV
5.2 Populations knowledge and subsequent acceptance of 51
AV and SAV
6. Conclusion Introduction 54
6.1 Research objectives and research findings 54
6.2 Future research 55
Conclusion 55
7. References 57
8. Appendix 64

6
List of Figures
Figure 1: Flow chart of survey structure
Figure 2: Population of Ireland divided by age. Source: www.worldmeters.info
Figure 3: Young adult population answer to Q7 ‘Ranking these elements 1-6, what is
the most important to you in considering your mode of transport?’
Figure 4: Mature adult population answer to Q7 ‘Ranking these elements 1-6, what is
the most important to you in considering your mode of transport?’
Figure 5: Young adults answer to Section 4, Question 2: ‘Rating these elements 1-6,
what has your impression been regarding these issues in relation to Self-driving
Cars?’
Figure 6: Mature adults answer to Section 4, Question 2: ‘Ranking these elements 1-
6, what has your impression been regarding these issues in relation to Self-driving
Cars?’
Figure 7: Young adults answer to Section 5, Question 2: ‘Ranking these elements 1-
6, what has your impression been regarding these issues in relation to Shared Self-
driving Cars?’
Figure 8: Mature adults answer to Section 5, Question 2: ‘Ranking these elements 1-
6, what has your impression been regarding these issues in relation to Shared Self-
driving Cars?’

7
Figure 9. Incentives (blue) and Preventatives (red) of both AV and SAV technology
according to the population of Young Adult’s population who answered ‘Yes’ to ‘If
this technology was implemented, would you be willing to transfer to this mode of
transport? (AV/SAV)’
Figure 10. Incentives (blue) and preventatives (red) of both AV and SAV technology
according to the population of Mature Adult’s population who answered ‘Yes’ to ‘If
this technology was implemented, would you be willing to transfer to this mode of
transport? (AV/SAV)’
Figure 11. Incentives (blue) and preventatives (red) of both AV and SAV technology
according to the population of Young Adult’s population who answered ‘No’ to ‘If this
technology was implemented, would you be willing to transfer to this mode of
transport? (AV/SAV)’
Figure 12. Incentives (blue) and preventatives (red) of both AV and SAV technology
according to the population of Mature Adult’s population who answered ‘No’ to ‘If this
technology was implemented, would you be willing to transfer to this mode of
transport? (AV/SAV)’
Figure 13. Young adults answer to Section 5, Question 1: ‘Have you heard of Shared
Self-driving cars?’
Figure 14. Mature adults answer to Section 5, Question 1: ‘Have you heard of
Shared Self-driving cars?’
Figure 15. Young adults who have a prior knowledge of SAV’s answer to Section 5,
Question 2: ‘What has your impression been regarding these issues in relation to
Shared Self-driving Cars?’

8
Figure 16. Mature adults who have prior knowledge of SAV’s answer to Section 5,
Question 2: ‘What has your impression been regarding these issues in relation to
Shared Self-driving Cars?’
Figure 17. Young adults who do not have prior knowledge of SAV’s answer to
Section 5, Question 2: ‘What has your impression been regarding these issues in
relation to Shared Self-driving Cars?’
Figure 18. Mature adults who do not have prior knowledge of SAV’s answer to
Section 5, Question 2: ‘What has your impression been regarding these issues in
relation to Shared Self-driving Cars?’
Figure 19. Young adults who had prior knowledge of SAV technology’s answer to
Section 5, Question 3: ‘Would you be willing to transfer to this mode of transport?’
Figure 20. Young adults who had no prior knowledge of SAV technology’s answer to
Section 5, Question 3: ‘Would you be willing to transfer to this mode of transport?’
Figure 21. Mature adults who had prior knowledge of SAV technology’s answer to
Section 5, Question 3: ‘Would you be willing to transfer to this mode of transport?’
Figure 22. Mature adults who had no prior knowledge of SAV technology’s answer to
Section 5, Question 3: ‘Would you be willing to transfer to this mode of transport?’

9
Acronyms
AV Autonomous Vehicles
SAV Shared Autonomous Vehicles
LiDAR Light Detection and Ranging
RADAR Radio Detection and Ranging
GPS Global Positional System
TAM Technological Acceptance Model
TPB Theory of Planned Behaviour
SEP Socio-ecological Perspective
PBC Perceived Behavioural Control
SN Subjective Norm
PU Perceived Usefulness
PEU Perceived Ease of Use
FMLM First-mile Last-mile problem
FoK Feeling of Knowing

10
1. Introduction
Minister for Transport, Tourism and Sport, Shane Ross T.D., announced Dublin’s plan
to integrate autonomous vehicles and carsharing autonomous vehicles into Dublin’s
current transport system (Department of Transport, Tourism and Sport, 2018). The
idea of autonomous mobility in the public sphere is becoming more of a reality each
year, with multiple projects and legislation change in motion within Ireland. We are
currently living in the what is known as the Fourth Industrial Revolution due to the
speed at which technology is advancing in society (Schwab, 2017), and at the forefront
of this technology is artificial intelligence and autonomous driving technology (Yun,
2016). For the implementation of this technology to be accepted by the wider
population it must first be tailored to their needs. This technology should be pre-
emptively designed to appeal to their consumers to assure successful and broad
integration of this technology. To do this their priorities and behaviour of acceptance
must first be analysed in relation to autonomous vehicles and shared autonomous
vehicles. To analyse this, what first must be established is the definition of 1.1:
Autonomous Vehicles and 1.2: Car Sharing Autonomous Vehicles.
1.1 Self-driving cars or Autonomous Vehicles (AV)
Autonomous cars are not a new phenomenon, this technology has been in actuality
since 1977 when it was first developed (Forrest and Konca, 2007). Autonomous cars
themselves are defined as a vehicle with technology capable of sensing their
surrounding environment with technologies such as LIDAR, GPS, and RADAR to help
travel between two points (Anderson et al, 2014). The intelligence technology can also
allow the vehicles to exchange data which provides them with knowledge to coordinate
driving speed, breaking patterns, distance between vehicles, and provides real-time
information regarding surrounding traffic conditions and many other characteristics of
its environment (Walker, 2017, Ringenson, 2018). The extent of which a vehicle is
autonomous can vary, with different systems of autonomy classification and human
interference (Kyriakidis et al., 2014). When discussing autonomous vehicles a model
is often referred to. This model is one with optimum sensing of its environment, carbon
emissions, decision making algorithms and safety for its passengers (Kyriakidis et al,
2014).

11
Dublin is also one of the pioneering cities implementing autonomous vehicles. In
October of 2018, the Minister for Transport, Tourism and Sport Shane Ross T.D.
officially announced Dublin’s plans to develop guidelines and a national strategy for
Intelligent Transport Systems (ITS) (Department of Transport, Tourism and Sport,
2018). The Department of Tourism has recently agreed to introduce legislation to allow
for the testing of Autonomous Vehicles on Irish roads and will amend the Road Traffic
Bill in the Oireachtas to allow for this testing. Predominantly testing within Ireland had
been done either via simulation or within private property.
Research and development of this technology has been a central focus in the west of
Ireland. Jaguar Land Rover has opened a research facility in Shannon. As well as this,
Lero, the Science Foundation of Ireland, funded research groups in order to develop
new sensor technology for autonomous vehicles and is doing this in collaboration with
French car technology giant Valeo (Mc Caffrey, 2007). This company has also been
collaborating with NUI Galway for many years and has employed over 1000 people in
Tuam. The EZ10, an autonomous bus shuttle in the docklands, has been implemented
over 1km long section of land to ease travel, and is the first example of autonomous
technology being implemented within Ireland (Department of Transport, Tourism and
Sport, 2018).
1.2 Shared autonomous vehicles (SAV)
Shared mobility is the shared use of a mode of transportation (Murphy, 2016). The
combination of both shared mobility with autonomous vehicles has the potential to
greatly improve the viability of shared transportation services and its utilization by the
public (Taiebat, et al, 2018). Many aspects account for the increased interest in
autonomous shared mobility, also known as shared automated vehicles (SAV). Ride
sourcing services, such as Uber, have globalised the idea of carsharing (Rigole, 2014).
Ireland have implemented different carsharing modes such as GoCar and Yuka
Toyota Car Club, showing the willingness to participate within a sharing mobility
economy (Rigole 2014). As well as this, the development of AV, with such companies
as Tesla, popularising the idea of automated vehicles, along with the realization that
operating costs of mobility services, especially those with automation, may

12
substantially decrease compared to other forms of transport, eg: fuel for private
vehicle, increase bus fare etc, have all led to the normalisation and acceptance of
SAV’s as a practical and advantageous mode of transport (Stocker and Shaheen,
2017).
This SAV service gives access to a fleet of driverless vehicles to use without owning
the car(s). One must register for this service and can book a driverless car via an app
when needed. When a passenger is driven using automation to a destination, instead
of the car sitting idle in a parking space until that passenger returns, it continues to
transport other passengers in the meantime (Hars, 2010). With the same technology
as self-driving cars, this provides the same benefits without having ownership of the
car.
Privately owned cars are, economically, an underutilized asset, due to the amount of
time its left unused (International Transport Forum, 2015) and the amount of space it
occupies, often in urban centres with limited space (Hars, 2010). Car sharing
autonomous vehicles have the potential to become a more economically viable option
for people and increase convenience (Hars, 2010). The implementation of these
technologies is thought to be able to potentially provide a socially equitable and better
valued mode of transport for communities. This would then cause a cascade affect in
not only changing how people travel but a change in land-usage patterns in cities and
suburban areas, possibly leading to an improvement in the quality of life for the urban
and suburban populations (Segal and Kockelman, 2016).

13
2. Methodology
Introduction
The aim of the study was to gather data on how the acceptance of technological
innovation changes depending on age demographic. This change will be due to
differencing priorities when choosing transport, differencing impression of said
technology and the different level of knowledge held.
2.1 Research Aims and Objectives
The primary research question of this study is to investigate what determines the
acceptance of technological innovations, specifically AV and SAV technology.
Furthermore, the relationship between an individual’s travel priorities, impression of
mentioned technology, level of knowledge, and their acceptance. Analysing this in
terms of specific demographic contexts, in particular, age, will provide insights into
acceptance behaviour and reasoning not yet fully examined. This studies main
objectives are to investigate, in the context of AV/SAV technology, 1. if different age
groups have different priorities and impressions when accepting technology and 2. if
their level of knowledge of technology affects their acceptance.
2.2 Justification
Differing factors and priorities between individuals in a population makes implementing
change that caters to all in a society an extremely difficult task. With any new
technological innovation, there is a risk that underrepresented members of society will
not be considered or socially excluded during decision making processes. Using
models such as the Technological Acceptance Model (TAM), the Theory of Planned
Behaviour, or the Socio-ecological perspective can give insights into behavioural
intention and therefore acceptance (Hutchins and Hook, 2017). Each of these theories
and approaches do this, by examining the factors most important to a population,
among other factors. However the factors differentiating young people’s travel
behaviour, attitudes, and perceptions from that of older generations are not completely
clear (Herrenkind, 2019). A deeper understanding of the determinants, as well as who

14
prioritises what, and for what reasons, is extremely important for the correct
implementation of a more sustainable mobility system, one that includes AV and SAV
technologies (Alemi, 2018). Younger generations are known to be those who will make
change, that they are the future of mobility (Ha, 2010). For those individuals to happily
accept change, this change must be developed pre-emptively for their acceptance.
This survey aims to achieve this by creating an age profile in relation to acceptance,
the priorities and determinants associated with it, and the role of knowledge in this
acceptance.
2.3 Study Approach and Structure
Surveys were the core data collection process of this research project. This is a useful
method as it allows for the collection of individuals knowledge, beliefs, priorities and
attitudes (Boynton 2004), which is exactly what this research study is intending to seek
out. It also allows for the collection of demographic information, in this case age was
an extremely important aspect to collect. The questions within the survey were a
mixture of both closed and open questions. This is beneficial as it allows
comprehensive analysis using different approaches, utilizing the advantages and
limiting the disadvantages of each type of question (Ostlund, 2011). Within the survey
there are three open questions and seventeen closed questions. Closed questions
asking about their opinion on a certain factor of AV technology such as “What is your
impression of the safety of AV” came with a Likert scale. Closed questions also act
as a guide to aid respondents in answering (Clifford, 2010).
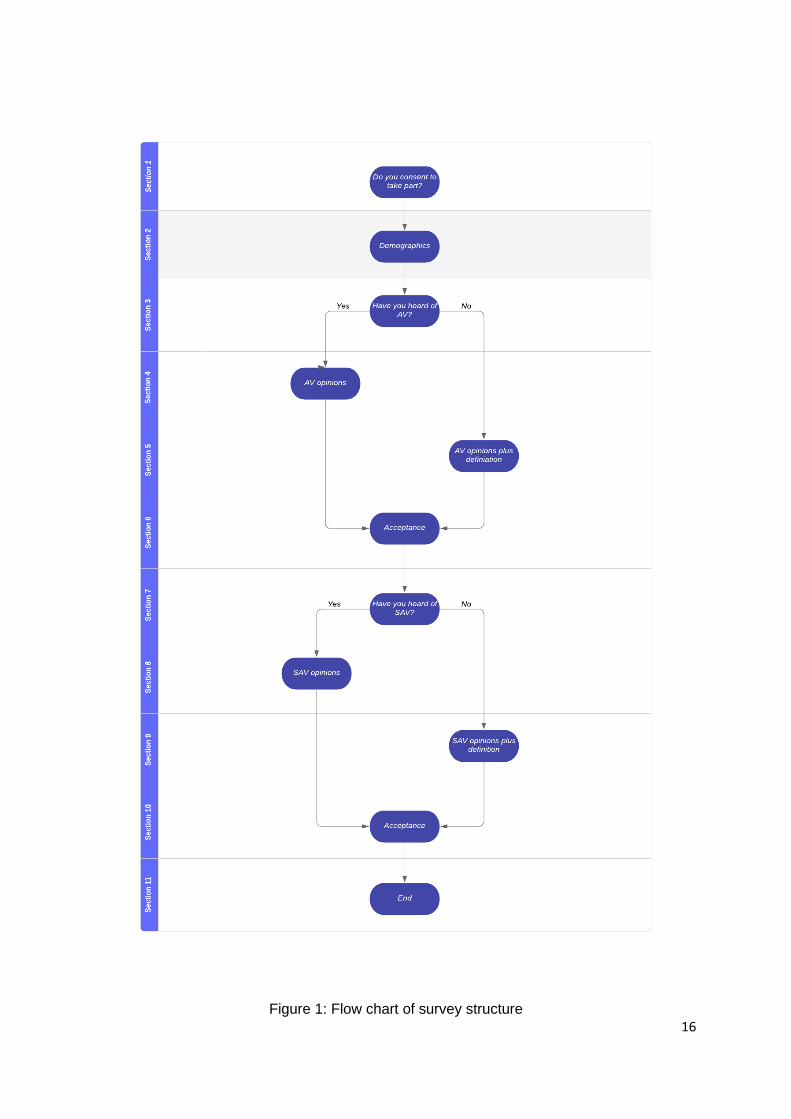
The survey was split into three main sections: 1. Demographics and priorities in
choosing mode of transport, 2. AV opinions, perceptions and acceptance, and 3. SAV
opinions, perceptions and acceptance. This was done so that the participant can think
clearly about each technology and consolidate opinions accurately. There are eleven
sub-section in total, see Figure 1. The AV and SAV sections were headed with a brief
description of the technology for those who answered ‘No’ to “Have you heard of
AV/SAV’s before?”. These definitions avoided the use of jargon and overcomplicated
wording to ease understanding. These descriptions they were written without bias in
the language and strictly factual in nature to avoid influencing respondents’ opinions.
AV and SAV were also rephrased as Self-driving car and Shared self-driving cars for

15
this purpose also. Both AV and SAV sections had the same questions to garner the
same information on both technology to be able to get a comparative measure of the
opinion of both. Using both quantitative and qualitative approaches allows for
triangulation of results, not only getting quickly analysable quantitative data, but also
allowing for a deeper insight into personal viewpoints. Graphs were then produced
using relevant data collected concerning impressions, level of knowledge and their
relationships with acceptance, and these graphs were then used to make data
analyses. These were done using Google sheets, and the data was exported directly
from Google forms to Google sheets. To find specific quantitative relationships t-
testing was done using Microsoft Excel.
Many drafts of the survey questions were completed to ensure the research objective
were reached and a pilot survey was administered to a small population of 10 people.
Six factors are being assessed in this research topic: cost, safety, ease of access,
comfort, efficiency, and environmental impact. Cost, safety, and environmental impact
were found to be acceptable factors from the initial draft and pilot. However, to aid in
understanding ‘Ease of access’ was used instead of ‘Convenience’, ‘Efficiency’ was
used instead of ‘Time’, and ‘Comfort’ was used instead of ‘Leisure’ as it was not
entirely clear what was meant. Social aspect was initially a seventh factor to be
considered but was then disregarded as too vague. The Likert scaling system was
also changed from 1-5 to 1-6, as many participants those 3 when uncertain, which
would garner poor results. The pilot survey allowed for the survey to make small but
necessary changes to aid in the efficiency of data collection and was a very valuable
part of the methodology.
16
Figure 1: Flow chart of survey structure

17
2.4 Survey Distribution
The way in which surveys are distributed can affect how representative the sample
population will be (Ponto, 2015). Therefore, it is suggested that using “diverse
recruitment strategies that can help improve the size of the sample and help ensure
adequate coverage of the intended population.” After considering this, the survey was
distributed online via social media channels such as Facebook, Reddit, Instagram, as
well as through additional websites, noticeboard and relevant webpages. It was also
sent via email to all contacts available. This was beneficial as it allowed for a quick
and cost-effective means of collecting data (Kayam and Hirsch, 2012). The sample
was to be from Dublin only, and so a description of the study and of participant
description was provided to confine the respondents to that singular geographical
area. This allows this study to be representative of Dublin only.
The survey was also distributed to individuals face-to-face at various shopping
centres, waiting rooms, and streets. During this process non-probability sampling was
used (Marshall, 1996). This was to allow for the specific targeting of older generations.
This was done as the online surveys allow for a bias towards people with technological
prowess, knowhow and access to social media, which often excludes older
generations. This is not to say all online respondent were from younger generations,
but to accurately reach a number of respondents that mimic the age profile of Ireland,
selective choosing of older generations in face-to-face survey distribution allowed
these numbers to become relatively accurate in comparison with Ireland population.
By analysing the population of Ireland, the representative percentage of the population
by age was gotten, see Figure 2. The population was then split into two groups ‘Young
adults’ and ‘Mature adults’, following the precedent set by many researchers and
psychologists who class those from 18-24 as having a different development and
cognition patterns that those from 25+ (Simpson 2017, JSNA 2017, Teipel 2016).
Therefore, using these two groups and classing them Young adult and Mature adult
respectively, will allow for the comparison of two different age demographics.

18
Figure 2: Population of Ireland divided by age. Source: www.worldmeters.info
2.5 Limitations
It is important to consider whether your sample population is truly representative of the
population being generalized or studied. If the sample size is not sufficient, it is very
difficult to achieve representation (Montello and Sutton 2006). The population of this
study is n=100, where 50 are classed as ‘Young adults’ and 50 are classed as ‘Mature
adults’. This population is relatively small but still allows for a comparison between
populations. Measures have been taken to ensure that the survey respondents are not
biased, however a large proportion of the sample population came after posting the
survey on the Trinity Noticeboard so there is an unbalanced number of educated
individuals.
2.6 Ethics
An informed consent form was shown at the beginning of the survey. This gave the
participants the description of the survey, the information that will be used and how
the information will be used. It then asks them to give their consent. It also provides
them with the contact information of the surveyor to voice any concerns if needed. The
survey was also strictly open to members of the population that are eighteen years old
and above. The survey was conducted so that all participants are anonymous.
20-30 31-45 45-60 60+

19
(Montello and Sutton, 2006) outlined three main guidelines for an ethical research
project, and they were followed as to assure the rights of the participates were not
violated in any way. These guidelines were:
i. Respect for persons: Understanding that individuals are “autonomous
agents capable of deliberating about the personal goals and acting
according to those deliberations,”
ii. Beneficence: “benefits to individuals should be maximised while potential
harm in minimised,”
iii. Justice: “the benefits and burdens of research should be distributed fairly,”
20
3. Literary Review
Introduction
Technological acceptance by society and individuals encompasses a range of fields
of thought. Within discursive landscapes, a multitude of theories of acceptance have
been produced as well as in depth research into the neurological factors influencing
an individual’s decision making. As well as this, a more personalised analysis of an
individual’s priorities and experience has also led researchers to a more
comprehensive understanding of acceptance. This personalised acceptance research
also sheds light on how different sociodemographic factors also influence acceptance,
such as a person’s age, gender, class etc. Each of these factors interlink and both
consciously and subconsciously controls a person’s willingness to acceptance
technological innovations and will be more thoroughly discussed in the following
literary review.
3.1 Acceptance of technological innovation
The introduction of new technology, such as AV and SAV, into the public domain and
into everyday society will undoubtably trigger changes in traditional mobility practices
and could potentially cause fundamental changes in how people travel within space.
Therefore, acceptance should be brought into the discourse surrounding the
implementation of these technologies. Without the support and willingness of the
public to participate, technological innovations will ultimately fail to be successfully
integrated (Fraedrick and Lenz 2016). Technology cannot be accurately assessed or
seen independent from its “social, economic, and usage-related contexts”, its
embedment within society must too be analysed (Peterman and Schertz 2005, Husing,
2002).
The populations perspective of these technological innovations is imperative to its
implementation. Having a user-oriented view and identifying which factors are
prioritized by the public, will make a considerable contribution to the overall success

21
and acceptance of said technology (Khan 2012, Rupp 2010). Researching the
acceptance of this technology can allow technology, in this case AV and SAV, to be
pre-emptively developed and curated so that acceptance is the likely outcome and
issues preventing the acceptance by society, such as cost or environmental impacts,
avoided. However, which factors and whom and how those factors impact specific
populations, affects AV acceptance has yet to be specifically analysed.
Frameworks have been developed over numerous fields to try quantifying and
accurately assess acceptance. Two of the most well-known being: Theory of Planned
Behaviour (TPB) and the Socio-ecological Perspective (SEP). TPB assesses how
influences can contribute to attitudinal factors of acceptance and how an individual’s
environmental factors, both physical and social, affects behaviour. It discusses how
intention must come before, and dictates, behaviour. An individual’s behavioural
intention depends on both their attitudinal and environmental factors (Fishbein and
Ajzen, 1975). This behavioural intention is measured with three key concepts: 1. An
individual’s attitude towards behaviour, 2. Their perceived behavioural control (PBC),
and 3. Their subjective norm (SN).
PBC encompasses the perception of both the ease and difficulty of enacting a decided
behaviour, in this case the use of AVs and SAVs, and the belief that the behaviour in
question is under the individual’s control (Acheampong and Cugurullo, 2019). The
former being referred to as operational and the latter being referred as self-efficacy.
Self-efficacy also considers an individual’s confidence in being able to carry out the
behaviour in extenuating circumstances (Wallston, 1987). SNs are defined as the
perceived societal pressures that then influences behaviour and the motivation to
succumb to those pressures (Ham, 2015).
SN is also considered within the extended Technological Acceptance Model (TAM)
(Davies, 1989). This outlines the two main variables that determines an individual’s
acceptance: 1. Perceived Usefulness (PU) and Perceived Ease of Use (PEU). PU
encompasses the individuals belief that the technology may or may not be beneficial,
whereas PEU is the individuals belief that the transition and use of the new technology
will not require effort, that the technology will cater to their needs, and is affected by
22
the users level of knowledge of how the technology functions. In the extended TAM,
voluntariness: the extent of which a person has the free will to choose or to not choose
to use a technology, and internalization: how an individual synthesises the perceived
importance of a new technology into their belief system, are discussed (Davies 2000).
Both of these mediates the impact SN has on technological integration decisions.
SEP captures the “relationships between individuals and their external environments,”
(Acheampong and Cugurullo, 2019). Personal factors are considered within this
model; sociodemographic characteristics and level of knowledge, perceptions and
attitudes, which fits within the structure of this study. It then also analyses the
surroundings of individuals and how their surroundings then impact their decision
making and acceptance. These aforementioned sociodemographic characteristics
very starkly shows a difference in acceptance when it comes to that of age.
3.2 Demographic determinants of acceptance, with a focus on age
Age as a demographic has been found to have a significant influence in many
acceptance studies (Herrenkind, 2019). The behavioural intention to accept
technological innovation has been proven by (Venkatesh 2003), to decrease as age
increases, supporting the claim made by (Hogg, 2010), that said the younger
generations will be the ones to shape the mobility patterns of the future. (Herrenkind,
2019) found a stark distinction between different age groups in line with TAM, meaning
that the PU was found to directly influence their intention to use more so in older
generations than younger. In relation to PU and its relationship with PEU it was found
that younger generations found that AV technology had a larger usefulness for them
than older generations.
SEP was also used to analyse individuals’ attitudes towards the environment and how
that affected their acceptance. It found that there was no significant relationship
between younger generation and their attitude towards the environment and making
a behavioural change to AV technology. However, the opposite is true for older
generations. (Herrenkind, 2019, pp. 221) then goes on to state that “to change the
travel behaviour of the younger generation, the campaign implemented should not be

23
based on environmental factors but instead focus on other features found to have a
significant association with the intention to use.”
Recent trends have shown a decrease in the interest of car ownership by younger
generations (Millard-Ball and Schipper, 2011, Newman and Kenworthy, 2011). With
cars dominating mobility systems and urban planning, AV and SAV is a possible
solution and sustainable method to utilize and improve the current automobile centric
system. Moreover, the possession of driver’s licenses has declined in younger
generations, showing a lack of enthusiasm in car ownership or driving (Davis and
Dutzik, 2014, Delbosc, 2017). (Fagnant and Kockelman 2014) surmises that
ownership of a car is becoming less of a priority for younger generations. (Davis and
Dutzik 2014) believed that this could be due to the younger generation’s adolescence
in the digital age, making constant connectivity a priority, and consider driving a
distraction from that connectivity. This has also been found by (Deloitte, 2010), that
young generations find driving “burdensome”, and that driving prevents them from
being able to participate in other activities. (Deloitte, 2010) observed that regulation
insists that texting is distracting drivers on the road, but that in reality driving is the
distraction from texting, outlining the younger generations priority to being connected
and online.
In relation to older generations, (Frost and Sullivan, 2006) have found that the majority
of those who use vehicles resist relinquishing control of their car to AI, or any sort of
machine operating (Frost and Sullivan, 2006). In contrast, (KPMG & CAR 2012) found
that older generations, coined baby boomers, were more willing to give up driving their
own vehicles for a more stress-free commute. (Knight 2012), argued that AV and SAV
in a useful alternative for the ageing population. This is due to the fact that the older
generations may experience poor eyesight or slow reflexes. The comfort and
accessibility of this mode of transport is just one factor that may influence a person’s
choice of transport towards AV or SAV. The next section will go deeper into the main
factors that have been proven to influence technological acceptance and how each
factor relates to AV technology.

24
3.3 User Priority and Experience
In line with TPB and SEP, and existing studies of technology acceptance, users’
attitude towards a certain behaviour, the use of AV/SAV in this case, will be imperative
to the understanding of generations and how they will interact with this technology. To
do this the analysis of different factors, priorities and experience has been conducted,
using factors such as: i. Safety, ii. Cost, iii. Efficiency, iv. Ease of access, v.
Environmental Impact, and vi. Comfort. This is a non-exhaustive list of possible
deciding factors when considering behavioural intention, however these factors have
been found to be those that influence consumer acceptance the most significantly.
Within TPB, factors such as comfort, safety, environmental impact, and ease of access
are factors considered to directly influence a person’s acceptance (Fishbein and
Ajzen, 1975). Efficiency, ease of access, along with cost have also been established
as influences by precedent set in previous studies (Anderson 2014, Kelkel 2015,
Fraedrick and Lenz, 2016, Bagloee 2016). Ergo, these factors have been used
repeatedly to garner the perspective of technology via consumer’s most valued
factors. The following is a breakdown of each of these factors, using AV and SAV as
examples.
i. Safety
The safety of autonomous vehicles and AI technology within the mobility
sector is one of the most discussed topics within the field, and one that most
individuals have concerns about. However, within the literature, the
consensus is that AVs and SAVs increase safety. In fact, AV technology is
expected to reduce, and perhaps stop, traffic accidents from occurring
(Fraedrich and Lenz, 2016). It does this by eliminating human error due to
factors such as “age, disability, stress, tiredness, inexperience,” (Shanker,
2013). According to NHTSA, 93% of traffic accidents was due to human
error (National History Traffic Safety Administration, 2008). Approximately
1.3 million people are killed and approximately 45 million are injured (World
Health Organization, 2013). It is the leading cause of death for young people

25
between 16 and 30, and the eight highest cause of death globally (World
Health Organization, 2009).
AV is thought to be one of the solutions to decrease traffic accidents due to
the technology on board, including LIDAR, RADAR, etc (will be in
introduction), to accurately be aware of their surroundings and potential
risks. It is also beneficial as it can allow a driver to give full control to the
vehicle in times of fatigue or distraction. (Kelkel 2015).
ii. Cost
(Litman, 2017) estimated, based on previous vehicle innovations, that the
initial implementation of individually owned AV will be available to higher
income individuals due to the cost of technology. He also calculated that it
may take approximately ten to thirty years until the individual ownership of
AVs will be a viable option for the middle- and lower-income households.
However, some think that the additional costs of AV ownership may be
offset by the large possibility that individual car insurance costs for AV will
reduce (Anderson, 2014). This is due to the method of calculating insurance
premiums based on penalty points, engine size and so forth, whereas with
AV insurance companies can offer differing premiums depending on the
level of automation a vehicle is equipped with (KPMG & CAR, 2012).
Therefore there is a high chance that insurance premiums will lower due to
the lack of human error occurring in AVs. As well as this, the efficiency of
this technology can also allow for fuel saving costs. This efficiency will be
further discussed in section 3. Iii. of this literary review.
It is believed, however, that SAVs may be the most affordable
implementation of AV technology, and most beneficial to the general public.
This will allow for households to forgo vehicle purchasing, insurance
payments, and any maintenance on the vehicle. It will also allow for a
flexible and relatively cheap mode of transport proven to be cheaper than
public transport (Lim and Taeihagh 2018). In work done by (Khondaker
26
2015), it was shown that 25% of participants sold a car, and another 25%
forwent the purchasing of a car when SAV services were available.
iii. Efficiency
The current paradigm in place in the transport sector is unsustainable in
regard to its capacity capabilities. The current pattern of the construction of
more infrastructure to allow for more vehicles to be on the road does not
solve any mobility issues, such as traffic congestion or travel time (Schiller,
2017). In fact, it creates a positive feedback loop, that further facilitates and
exaggerates those issues and many others (Givoni, 2013). (Fagnant, 2015)
and (Pakusch 2018), among many others, believe AV and their technology
could be the solution to these problems.
AVs reportedly only need a 30% penetration rate to “significantly reduce
oscilliation waves” and reduce bottleneck congestion, reducing travel times
by 40% (Ngoduy, 2012). Moreover, penetration rates less than 30% still
showed a reduction in travel time, allowing for the assumption that even a
small uptake could improve traffic conditions (Kesting, 2008). In a mixed
traffic situation, where both private owned vehicles and AV were on the
road, there was a peak of 5000 vehicles per hour reached (Huang, 2000).
In fact, it was found that for each SAV used, it could replace eleven private
vehicles on the road (Fagnant and Kockelman, 2016).
Platooning between AVs could optimize the flow of traffic, reduce
congestion and avoid stop-and-go traffic (Spieser 2013, Fagnant 2015). An
algorithm was developed by (Ferandes 2015) that allowed for symbiotic
behaviour between platooning AV that may achieve a traffic capacity of
approximately 7500 vehicle per hour, which is more efficient than current
public transport and owned car usage, in both capacity and travel time. This
can also allow for the exchange of data between vehicles that can then
coordinate and communicate different information such as: driving speed,
braking patterns, distance between vehicles and so on (Ringenson 2018).

27
Thus making commutes quicker. This technology also integrates real time
information in regard to traffic conditions into its route planning, this not only
improves response times and efficiency but can also improve safety, as
spoken of before (Fagnant 2013). (Tientrakool, Ho & Maxemchuk 2011)
estimates that is all vehicles implemented adaptive cruise control, there
would be a rise in motorway capacity from 45% to 275% along with
congested traffic speeds increasing from 7% to 14%.
iv. Ease of Access
When commuting, individuals often must travel to their desired mode of
transport, and once off their mode of transport, travel to their desired
location. This is referred to as the first-mile last-mile problem (FMLM) (Lim
and Taeihagh, 2018). The standard agreeable distance expected to be
walked to a transit stop is 400m (Chen, 2011), however this being the
average, does not mean that all of the population is willing, or capable of
walking that distance. SAV technology could eliminate the FMLM problem
by implementing a model that collect passengers from any point, their home
or elsewhere, and driving them directly to their desired location (Munzel
2018), using the most efficient route available as discussed in iii. This
eliminates the FMLM problem and allows for individuals to benefit from an
efficient and customisable form of transport. This service could potentially
become a strong competitor against MNC’s such as Uber or Lyft
(International Transport Forum, 2015).
SAV could also improve social equity. Vulnerable groups such as the
disabled, elderly, or those from a low sociodemographic background, face
limited participation within society, which may lead to social exclusion (Segal
and Kockelman, 2016). This occurs due to various factors not
accommodating these individuals in mobility planning (Lucas and Jones,
2012). (Harper 2016) found that an estimated increase in the demand of
mobility options will occur in the US, primarily for the non-driving, elderly or
travel restricted populations. This was found to potentially increase the VMT

28
(vehicle miles travelled) by 15%. In a fully automated, or mixed traffic
situation, it was found that these “restricted parties would travel as much as
any other cohort of age or ability”.
v. Environment
Environmental concern has been found to have a positive relationship with
an individual’s intention to use autonomous vehicles (Wu, et al., 2019). AV
implementation could reduce dependence on fossil fuels in the mobility
sector, as well as lowering emissions on the roads (Ringenson 2018). This
is due to the improved efficiency of the vehicles leading optimization of traffic
flow leading to shorter and more efficient trips, and less time polluting in
traffic. The technology also lessens the use of braking and acceleration
processes that increase emissions (Milakis, 2017). Some studies predict
that emissions could be reduced by 95% (Greenblatt 2015). This is also due
to the fact that SAVs will reduce car ownership levels (KelKel, 2018).
Interestingly, in a study done by (Herrenkind 2019) is was found that there
was a positive significant relationship between the elderly, the environment
and their choice in mobility, whereas this relationship was not found in
younger generations. Individuals who prefer to live more sustainably are
more significantly likely to use SAV technology and embrace the future of
AV sharing (Livieri, 2017)
Contrastingly, increases in car efficiency provided by AV and SAV
technology may in fact lead to an increase in energy consuming driving
styles and increased mileage (Becker, 2015). As well as this, when AV
technology allows for better use of one’s time while travelling, some may be
willing to take longer journeys than they have before (Brown, 2014). With the
use of SAV being a cheaper option, increase use of this mode of transport
will in turn lead to increased mileage as previously stated, but also a possible
move from public transport to SAV (Trommer, 2016). Studies have shown
that this use of autonomous technology within mobility will led to an increase
in number of journeys from 3 to 27 percent (Milakis, 2017). There could also
29
be an 8-17% increase in movement for the relocation of vehicles, their
arrivals, and their departure (Bischoff 2016, Davidson 2016).
vi. Comfort
Comfort, both physically and psychologically, is a factor that controls
individuals’ mode of transport and positively influences a person’s attitude
and purchase intention (Kelkel, 2019). (Beirao 2007) studied this and found
that with public transport, comfort was both a benefit and drawback as
comfort levels are dependent on time of day and the condition of the public
transport in use. It has been found that although the privacy of an owned
vehicle is beneficial, the stress caused by navigating through traffic
congestion negatively impact the psychological comfort of drivers. The
option of being relieved from stressful situations associated with driving
increases an individual’s likelihood to choose AV technology (Arndt, 2011).
3.4 User Knowledge and its relationship with Acceptance
Acceptance is studied across many fields of expertise and it not limited to
technological innovation. However, each of these studies provide insight into the
relationship, or apparent relationship, between an individual’s knowledge and an
individual’s acceptance. The findings of these experiments are not always consistent
with each other, for example: (Paz-y Mino & Espinosa 2009) found there to be a robust
relationship between knowledge and acceptance, but (Sinatra 2003) found no
evidence to support that claim. Thus it is evident that the relationship between these
two criteria are not straightforward (Ha, 2012). (Ha, 2012), also discusses the
neurological perspective on knowledge and acceptance. They surmised that
acceptance is both to do with having the “knowledge that enables comprehension and
having the feeling of knowing (FoK),” (Burton 2008). The former component,
knowledge, is dependent on conscious thought processes, the latter FoK,
encompasses intrinsic beliefs formed by unconscious thought, intuitive cognitions.
FoK is defined as a ‘metathought’ that drastically affects how we perceive our world
30
around us (Burton 2008). FoK, due to its intrinsic nature, has the ability to be activated
subconsciously and not be reliant on any sort of underlying knowledge. Reasoned
thought or certainty, however, arises from the conscious analysis of a situation and
thus making judgements and decision based on that (Ha 2012). These two factors
interplay as the emotional signal of FoK plays an auxiliary role that makes the
reasoning process faster (Damasio 2003).
These two systems produce a duel information processing method, with FoK providing
quick, instantaneous responses and the opposite more cognitive system, being slower
allowing for conscious thought and abstract reasoning. These two systems have been
combined into a dualist approach that unifies these forms of reasoning (Osman 2004).
The factors influencing cognitive reasoning have been studied and analysed in section
3, however the factors influencing FoK are harder to quantify (Sinatra, Bream & Evens,
2008). This combined processing approach directly affects acceptance (Ha 2012). It
is believed that FoK may have a greater influence on our acceptance of technological
innovation subconsciously and that the neural network associated with this system,
once established, is difficult to overcome with critical, cognitive reasoning (Burton
2008). (Ha 2012, pp.118) gracefully summarises the implications of this, though in
their case they were discussing the acceptance of evolution as a concept;
“the implication for acceptance [of AV/SAV] is that constrained levels of certainty
resulting from intuitive feelings may lead to a lowered level of acceptance, even
when conceptual knowledge of [AV/SAV] is high, and the level of acceptance will
likely be resistant to change,”
(Ha 2012) study ultimately found a weak but significant relationship between
knowledge and acceptance and a strong significant relationship between FoK and
acceptance. This, therefore, shows that knowledge does in fact influence acceptance
but it’s the intuitive and intrinsic instincts that truly decide a person’s acceptance.

31
Conclusion
The literature reviewed was a multidisciplinary undertaking. Through exploring
different theoretical backgrounds concerning acceptance and garnering the core
factors influencing people’s acceptance of technological innovations, a
comprehensive literary review was produced. Sociodemographic elements,
specifically age has been suggested to significantly change a person’s acceptance
rate of technology, and this aspect in conjunction with the impression, and level of
knowledge a subject has, has to potential to shine light on many factors that may
influence acceptance and condense it into one study, allowing for a thorough
understanding of a wealth of knowledge associated with this type of undertaking that
has not been previously produced.

32
4. Results
Introduction
The aim of this chapter is to find out how travel priorities, impression of technology
and level of knowledge affects a person acceptance of AV/SAV, and to analyse this
between two different age demographics, Young and Mature adults. This chapter is
divided into two overarching categories: 4.1. Population priorities and impression in
connection with acceptance and 4.2. Population knowledge in connection with
acceptance. Within these two sections graphs surmising the data relating to each
research objective will be presented, analysing the difference between user’s answers
to the survey between both populations, Young adults and Mature adults, and within
each population in regard to different technology, AV and SAV. Excel and Google
sheets were used to produce graphs and to run significance testing between
populations to find the extent of any existing differences and will be used to investigate
any patterns that emerge.
4.1.1 Population’s priorities for transport
Figure 3: Young adult population answer to Q7 ‘Ranking these elements 1-6, what is the
most important to you in considering your mode of transport?’

33
Figure 4: Mature adult population answer to Q7 ‘Ranking these elements 1-6, what is the
most important to you in considering your mode of transport?’
The travel priorities of both Young Adults (18-24) (Figure 3.) and of Mature Adults
(25+) (Figure 4.) shows relatively similar results. The only notable difference between
them is in the category of Safety and Comfort. Mature adults tend to value safety and
comfort more than that of Young adults. Overall, Mature adults most value safety
whereas Young adults most value cost. However, there is no statistically significant
difference found between any factor when comparing Young adults with Mature adults,
(p=0.58).
34
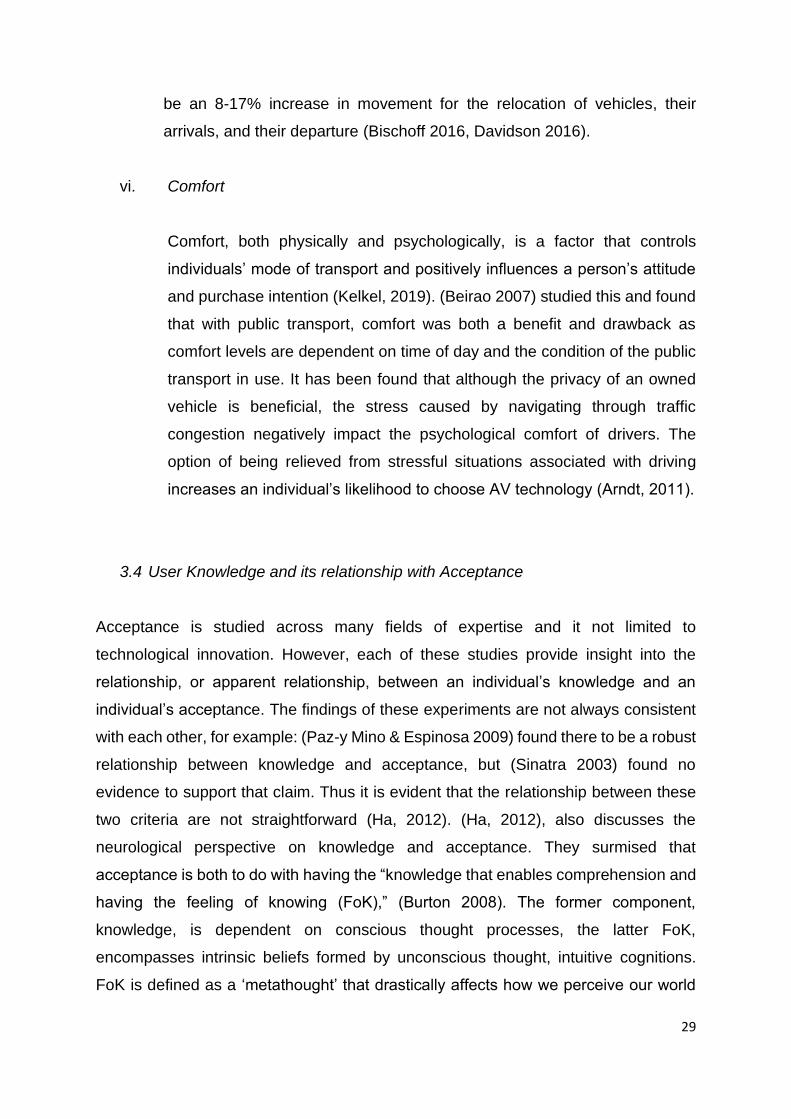
4.1.2 Population’s impression of various factors in regard to AV and SAV
Figure 5: Young adults answer to Section 4, Question 2: ‘Rating these elements 1-6, what
has your impression been regarding these issues in relation to Self-driving Cars?’
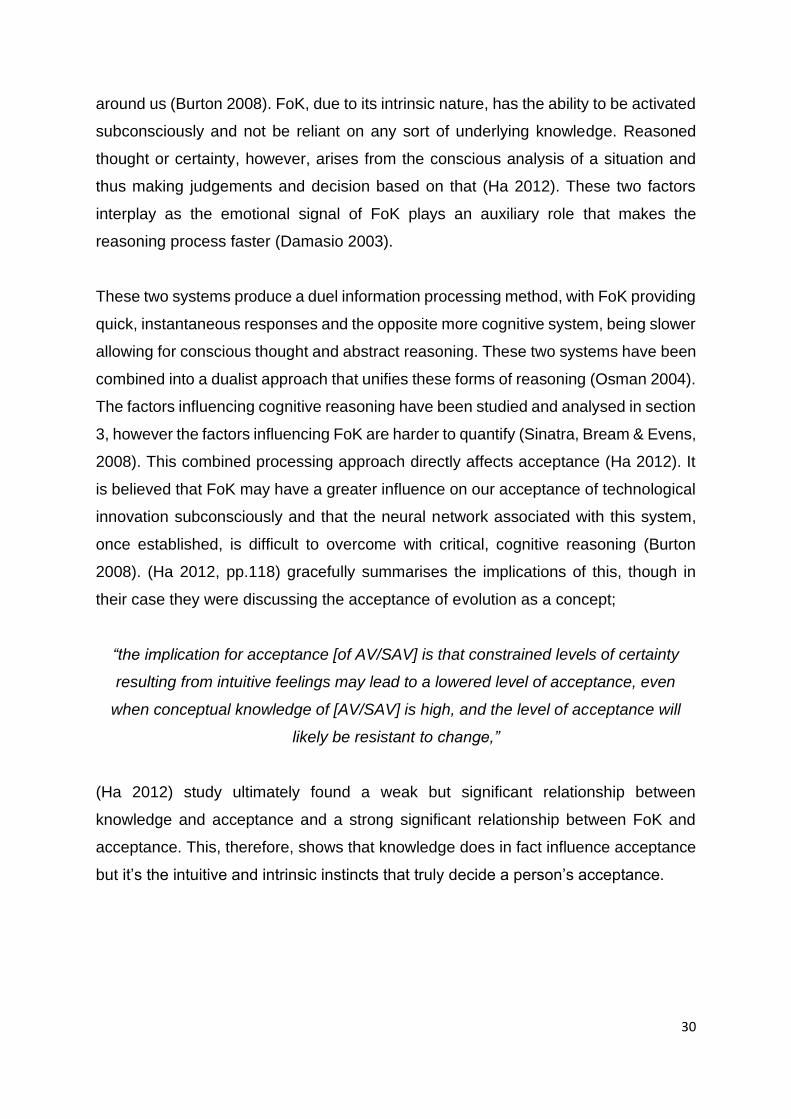
Figure 6: Mature adults answer to Section 4, Question 2: ‘Ranking these elements 1-6, what
has your impression been regarding these issues in relation to Self-driving Cars?’
35
Young Adults and Mature Adults impressions of AV mirrors each other’s well (Figure
5. and Figure 6.), with a maximum variation of ±0.5. Therefore, it has been found that
there is no statistically significant difference between Young Adults impressions of this
technology and Mature Adults. When comparing these impressions with user priorities
it is clear that the priorities of Mature Adults are believed to not be met by the
technology. Safety, ease of access, and cost are the top three priorities for Mature
Adults, and are the three lowest ranking factors respectively, when analysing their
impressions. Similarly, their three least important factors; Efficiency, comfort, and
environmental impact, are the three highest ranking factors in their view of AV. Two of
the three top priorities for Young Adults, cost and ease of access, are the lowest
ranking factors from their impression of the AV. This shows that user’s impression of
AV technology is not in line with their priorities, which may lead to lack of acceptance.
Analysing user’s impressions of SAV, a very similar pattern occurs again. Both Mature
adults (Figure 8.) and Young adults (Figure 7.) impressions of SAV are parallel with a
maximum variation of ±0.4, showing no statistically significant difference between the
two when it comes to transport priorities. Akin to with AV, user’s impressions of SAV
does not coincide with their priorities when choosing transport. Mature adults’ top
priorities are what they rank the least in their impression and for Young adults’ as well,
two of their top three are what they have ranked the lowest in their impression.

36
Figure 7: Young adults answer to Section 5, Question 2: ‘Rating these elements 1-6, what
has your impression been regarding these issues in relation to Shared Self-driving Cars?’
Figure 8: Mature adults answer to Section 5, Question 2: ‘Ranking these elements 1-6, what
has your impression been regarding these issues in relation to Shared Self-driving Cars?’
37
4.1.3 Population’s rate of acceptance of AV and SAV and relative incentives and
preventatives
Of those who answered ‘Yes’ to if they would switch to the relative technology, the
following two questions ‘What would INCENTIVISE you to make this switch’ and ‘What
would PREVENT you from making this switch’ was graphed together in one figure for
both Young adults, (Figure 9.) and Mature adults (Figure 10.) to present the values of
those who would consider switching to autonomous vehicle technology, both AV and
SAV. When it comes to accessibility it is clear that the accessibility of both AV and
SAV technology is considered a negative aspect of this technology by Young Adults
and similarly by Mature adults in relation to SAV. However, Mature Adults consider
accessibility a net positive for AV technology. Mature adults do not consider efficiency
when deciding to switch for AV or SAV, and Young adults do not consider it with SAV.
For AV technology, 50% of those who decided to switch within the Young adult
population considered the level of safety of an autonomous car to prevent them from
using and but also 50% consider the safety level to incentivise them to use it.
Therefore, it can be noted that the opinions of Young adults are not uniform between
the whole population. This can also be seen when viewing Mature adults’ impression
of the safety of both AV and SAV. 50% believe it to be an incentive and 50% believe
it to be preventative. Young adults seem to be less trustworthy of the technology as
only around 15% and 45% of user’s believe the safety of AV and SAV respectively, is
an incentive. Environmentally, both AV and SAV are considered an incentive for
Young and Mature Adults, except in the case of AV with Mature adults. Cost of both
AV and SAV is a net negative for both populations, with the highest percentage of
those considering it be an incentive being Mature adults with SAV technology. Young
adults consider it a preventative factor for both AV and SAV as do Mature adults for
AV. Comfort within AV’s are seen as a net incentive for the technology for both
populations, but a net prevention for SAV by the Young adults. Mature adults do not
consider it to be a deciding factor.
In comparison with these populations travel priorities, one would assume that these
would align with each other as this population has answered ‘Yes’ to if they would
switch. For Young adults, cost, efficiency, and ease of access are what matters. Of
those who answered ‘Yes’, they found that cost was a prevention in AV technology
and 50% incentive and 50% prevention in regard to SAV. Efficiency was not found to

38
be either an incentive or preventive for AV, and was not considered for SAV, and ease
of access is 100% preventative for both AV and SAV. For Mature adults, safety, ease
of access and cost are what they consider important. Safety for both AV and SAV were
evenly split as an incentive and prevention, accessibility was a net positive for AV’s
but not considered for SAVs, and cost was found to be 60% and 50% preventative for
AV and SAV respectively. This shows that even though both the Young and Mature
population’s main priorities for travel were not met, they still would switch to AV or SAV
technology regardless.
Figure 9. Incentives (blue) and Preventatives (red) of both AV & SAV technology according
to the population of Young Adult’s population who answered ‘Yes’ to ‘If this technology was
implemented, would you be willing to transfer to this mode of transport? (AV/SAV)’

39
Figure 10. Incentives (blue) and preventatives (red) of both AV & SAV technology according
to the population of Mature Adult’s population who answered ‘Yes’ to ‘If this technology was
implemented, would you be willing to transfer to this mode of transport? (AV/SAV)’
Figure 11. Incentives (blue) and preventatives (red) of both AV & SAV technology according
to the population of Young Adult’s population who answered ‘No’ to ‘If this technology was
implemented, would you be willing to transfer to this mode of transport? (AV/SAV)’

40
Figure 12. Incentives (blue) and preventatives (red) of both AV & SAV technology according to the population of Mature Adult’s population who answered ‘No’ to ‘If this technology was
implemented, would you be willing to transfer to this mode of transport? (AV/SAV)’
Young adults’ incentives and preventions of AV and SAV are very similar (Figure 11.).
Accessibility is 100% a preventative factor, and efficiency is a 100% incentivising
factor. Safety is a net preventative factor with it being 30% and 40% incentivising for
AV and SAV respectively. Environmentally, half of the population believe it to be
incentivising and the other half believe it to be preventative. Cost is seen to be an
incentive with 65% and 70% of the population stating this for AV and SAV respectively.
The main difference between AV and SAV is comfort, where AV is seen to be fully
incentivising and SAV, half the population believe this to be true. With Mature adults
(Figure 12.), accessibility and environmental aspects are similar to that of Young
adults in relation to AV. Safety is also a net negative for both AV and SAV, similar to
Young Adults, however the main preventative reason for not choosing to switch to
SAV is environmental aspects, with that being 100% preventative. Cost was found to
be a net incentive of SAV for Mature Adults, but accessibility, efficiency, and comfort
were not considered when making the decision to not switch to SAV technology.
Once again, when comparing users travel priorities, Young adults in particular seem
to be contrary. With cost being their top priority, those who said ‘No’ to switching found

41
that AV and SAV had an incentivising cost. Efficiency was found to be 100%
incentivising for both AV and SAV and was their second most important priority, but
also decided to not switch to said technology. Accessibility was found to be their third
top priority and both AV and SAV were found to be preventative in their access
abilities. Mature adults’ top priority was safety, and this was found to be a net
preventative for both AV and SAV, as well as accessibility being found to be 100%
preventative in AV but not considered in SAV. Cost however, being their third most
important factor, was a net incentive. Once again, in the case of Young adults, their
priorities do not determine whether they will use the technology or not.
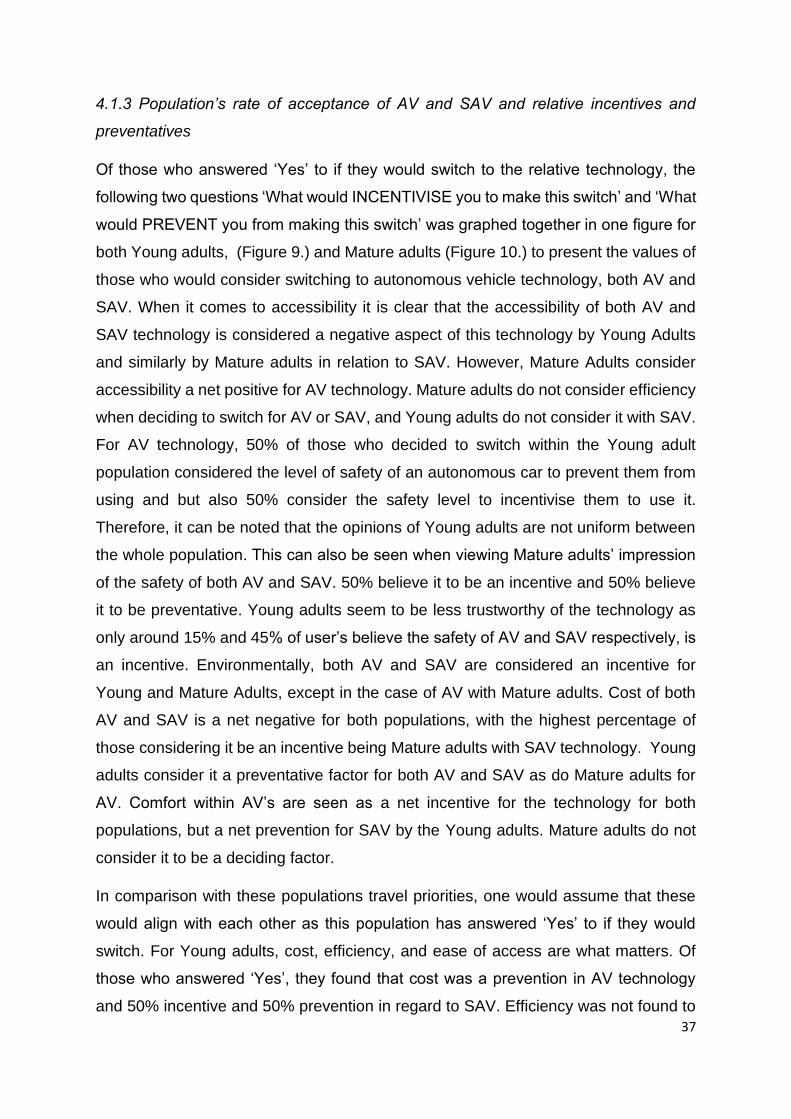
4.2.1 Population’s level of knowledge and their impression of SAV
When observing if the level of knowledge links with the overall impression of a
technology, SAV is considered. This is due to the fact that 100% of respondents had
prior knowledge of AV technology. For SAV, 67.9% of Young adults and 52% of Mature
adults had a prior knowledge of SAV mobility (see Figures 13 and 14, respectively).
Using SAV will allow analysis of how knowledge may affect a person’s impression of
a technology.
Figure 13. Young adults answer to Section 5, Question 1: ‘Have you heard of Shared Self-
driving cars?’
42
Figure 14. Mature adults answer to Section 5, Question 1: ‘Have you heard of Shared Self-
driving cars?’
When comparing Young adults with prior knowledge’s impression of SAV with Mature
adults with prior knowledge’s impression of SAV you can see differences between
them. Mature adults have a smaller range when it comes to rating priorities, 0.42,
whereas Young adults have a range of 1.2. This shows that Young adults impressions
fluctuate more considerably than Mature adults. Mature adults’ impressions all lie
within 0.42 of each other and show relatively high impressions of all priorities, whereas
Young adults have distinct preferences. This trend continues for the population who
do not have prior knowledge, as the Mature adults’ impressions do not fluctuate as
much as Young adults, however both do fluctuate, with Mature adults having a range
of 1.04 and Young adults having a range of 1.36.
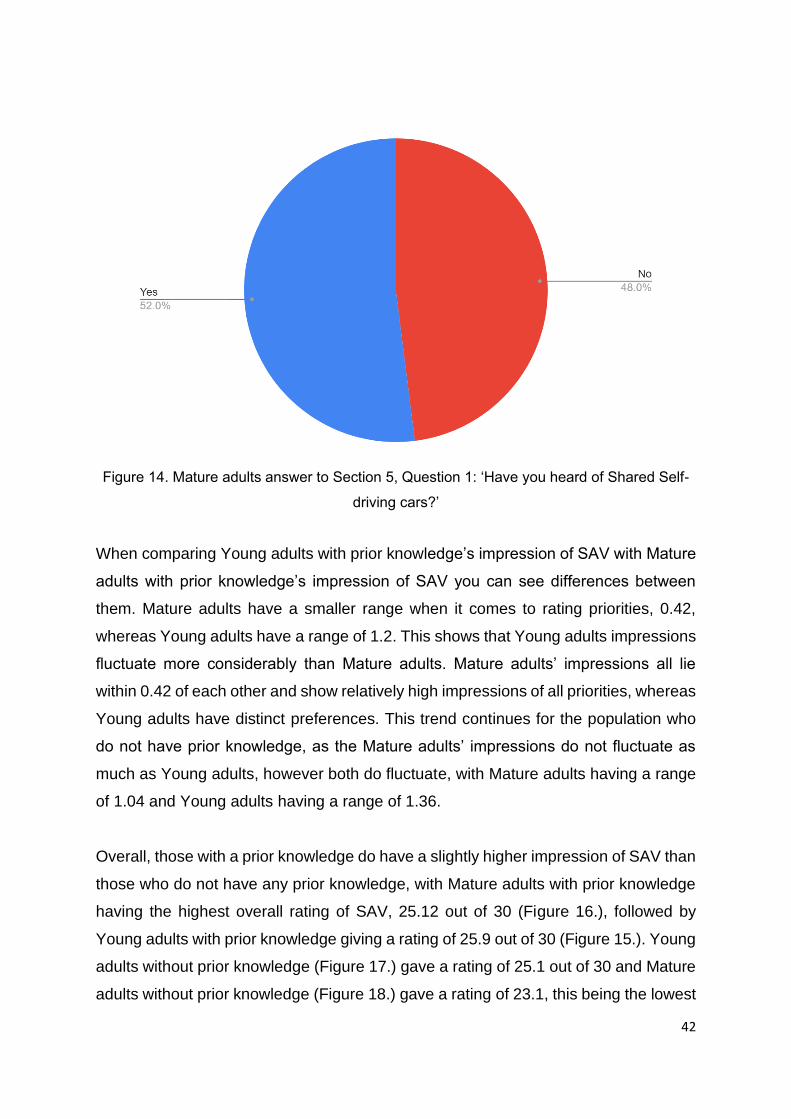
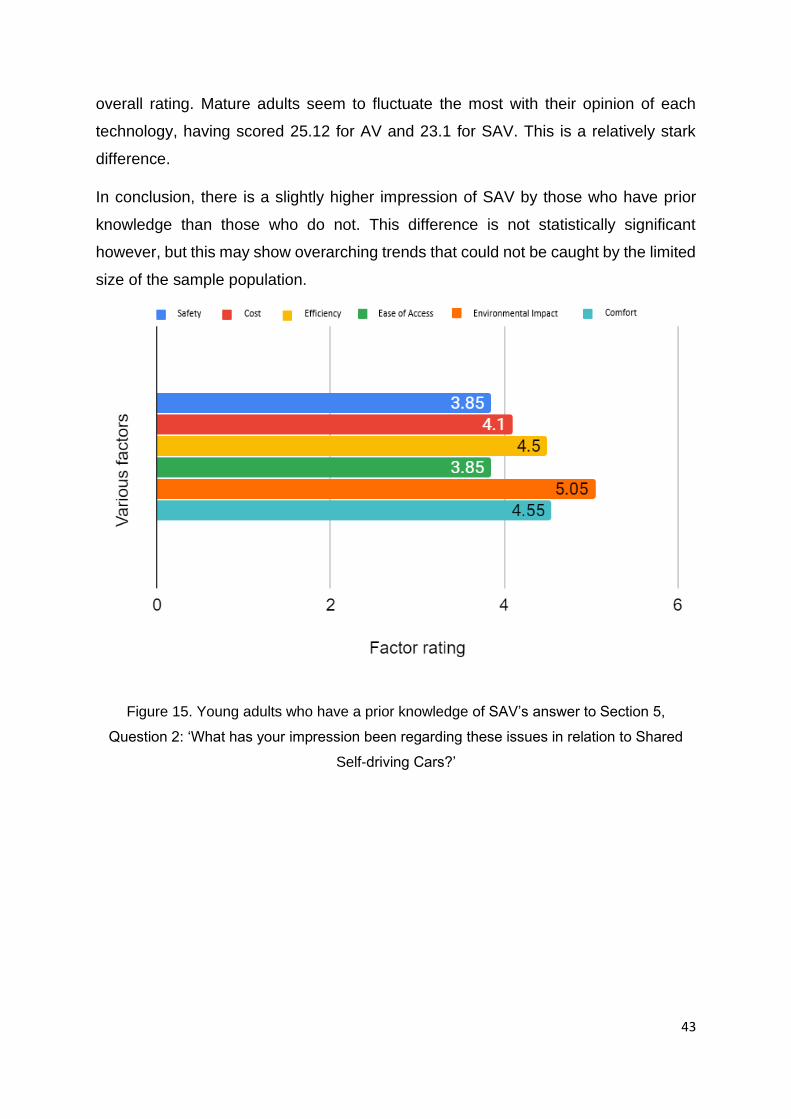
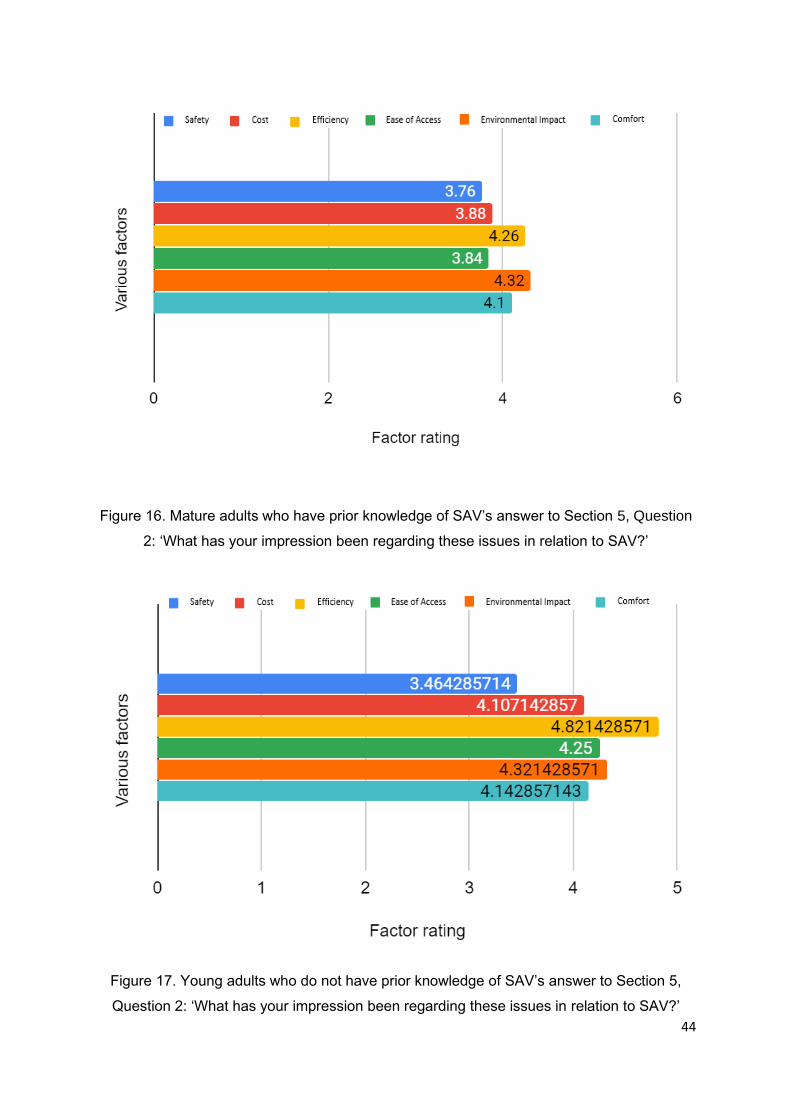
Overall, those with a prior knowledge do have a slightly higher impression of SAV than
those who do not have any prior knowledge, with Mature adults with prior knowledge
having the highest overall rating of SAV, 25.12 out of 30 (Figure 16.), followed by
Young adults with prior knowledge giving a rating of 25.9 out of 30 (Figure 15.). Young
adults without prior knowledge (Figure 17.) gave a rating of 25.1 out of 30 and Mature
adults without prior knowledge (Figure 18.) gave a rating of 23.1, this being the lowest
43
overall rating. Mature adults seem to fluctuate the most with their opinion of each
technology, having scored 25.12 for AV and 23.1 for SAV. This is a relatively stark
difference.
In conclusion, there is a slightly higher impression of SAV by those who have prior
knowledge than those who do not. This difference is not statistically significant
however, but this may show overarching trends that could not be caught by the limited
size of the sample population.
Figure 15. Young adults who have a prior knowledge of SAV’s answer to Section 5,
Question 2: ‘What has your impression been regarding these issues in relation to Shared
Self-driving Cars?’
44
Figure 16. Mature adults who have prior knowledge of SAV’s answer to Section 5, Question
2: ‘What has your impression been regarding these issues in relation to SAV?’
Figure 17. Young adults who do not have prior knowledge of SAV’s answer to Section 5,
Question 2: ‘What has your impression been regarding these issues in relation to SAV?’

45
Figure 18. Mature adults who do not have prior knowledge of SAV’s answer to Section 5,
Question 2: ‘What has your impression been regarding these issues in relation to SAV?’
4.2.2 Population’s level of knowledge and their acceptance of SAV
To analyse if having a prior knowledge of a technology makes a person more likely to
accept a technology, pie charts were made to demonstrate the acceptance rate of
those who had prior knowledge vs those who had not. Figure 19. and Figure 20.
demonstrate this for the Young adult’s population, showing the acceptance rate of
those who had prior knowledge of the technology and those who did not respectively.
From this, it can be seen that those with a prior knowledge has more ‘Yes’ answers to
switching than those who had no prior knowledge. It also shows that there is more
uncertainty to switch by those who had no prior knowledge of the technology.

46
Figure 19. Young adults who had prior knowledge of SAV technology’s answer to Section 5,
Question 3: ‘Would you be willing to transfer to this mode of transport?’
Figure 20. Young adults who had no prior knowledge of SAV technology’s answer to Section
5, Question 3: ‘Would you be willing to transfer to this mode of transport?’

47
Figure 21. Mature adults who had prior knowledge of SAV technology’s answer to Section 5,
Question 3: ‘Would you be willing to transfer to this mode of transport?’
Figure 22. Mature adults who had no prior knowledge of SAV technology’s answer to
Section 5, Question 3: ‘Would you be willing to transfer to this mode of transport?’
With the Mature adult population, the differences are more considerable. For those
with prior knowledge (Figure 21.) the majority of them answered ‘Yes’ or ‘Maybe’, with
the smallest proportion answering no. Contrastingly, those with no prior knowledge
48
(Figure 22.) the majority of them said ‘No’ to the question of switching. Only 16.7% of
that population would consider switching and 37.5% have uncertainty about switching.
This shows the Mature population is more inclined to reject a technology if they have
no prior knowledge and are less prone to uncertainty.
Conclusion
In conclusion, this study shows that the travel priorities and impression of AV
technology of both Young and Mature adult populations do not strongly or directly
affect their acceptance, however level of knowledge has an effect on both populations
in different ways. Young adults without knowledge having more uncertainty and
Mature adults are more likely to reject SAV technology without having prior knowledge.
Further analysis of these results and the implications of these within the pre-existing
literature will be discussed in the next chapter.

49
5. Discussion
Introduction
This study aims to gather information regarding people’s travel priorities, impression
of AV and SAV technology, as well as their level of prior knowledge of said technology
and their level of acceptance of it. With this information a comprehensive overview of
some of the potential reasons behind a person’s acceptance of this technology can be
found.
5.1. Populations travel priorities and impressions of AV and SAV
Identifying different factors that are prioritised by the public has been said to aid the
success of AV/SAV technology by increasing the chances of the acceptance of the
technology (Khan 2012, Rupp 2010). However, within this study it has been found that
this may not be the case. Between the Young adult and Mature adult populations for
both AV and SAV, it was found that Young adult’s value 1. Cost, 2. Efficiency, and 3.
Accessibility, the most and Mature adults consider 1. Safety, 2. Accessibility and 3.
Cost to be most valuable, in decreasing order of importance. When analysing the
details of the population’s impression of the three top priorities, Mature adults most
valued priorities were ranked the three lowest in their impressions. The same goes for
Young adults with two of their top three. Therefore, it was found that AV and SAV
technology is not seen to be able to meet the average travel priorities of either
population. The fact that the populations impression of the technology is the opposite
of their priorities, may be a reason for some not accepting the technology. However,
when going further into analysis and examining the core reasons as to why the
population were or were not willing to switch to autonomous technology, these
priorities were seemingly unconsidered.
By looking at both the incentives and preventatives of SAV by the proportion of both
populations that answered ‘Yes’ to a willingness to switch to SAV if implemented, their
priorities did not dictate their acceptance. For example, Young adults most value cost,
however those who answered ‘yes’ to a willingness to switch considered the cost of
SAV to be a net negative factor in switching, and yet would still be willing to do so.
Similarly, the proportion of the Young adult population that answered ‘No’ to a

50
willingness to switch to SAV, found the cost of the technology to be a net positive, and
yet still decided to not switch. Efficiency was their second most valued priority, and
100% this population found the efficiency of SAV to be incentivising, but still decided
to ultimately not make the switch. These findings go against previous studies such a
(Efthymiou 2013) where it was proven that when these priorities are met it increases
acceptance, (Lane 2015) who found that the stronger the priority the more likely a
person is to accept AV technology if it is met, (KPMG 2013) and (Bazilinsky 2015)
looking at safety as people’s main priority, and results showing that when that strong
priority wasn’t met the technology was rejected, and many more studies within this
field.
This leads to the conclusion that their priorities are not the sole determinant in whether
they will use the technology or not and that there are more complicated underlying
factors at play into the acceptance of technology that goes beyond priorities being met.
Other factors that affect the acceptance are outlined within the Theory of Planned
Behaviour, and within this study two out of the three main concepts were found. 1. An
individual’s attitude towards the behaviour, in this case the use of AV/SAV. This was
found when respondents answered questions regarding their impression of AV/SAV
and was found to be generally positive. When it was further broken down into
incentives and preventatives, the details of these impressions were broken down.
Second, is the Perceived behavioural control, or the ease or difficulty of enacting
behaviour. Within this study it was found when the population answered the question
regarding their impression of ‘Ease of Access’. The impression of this factor fluctuated
between 3.5 – 5.2 out of 6, showing mixed opinions. The third concept, the one not
investigated within this study was their subjective norm, or societal pressures. This
could be the underlying reason dominating their acceptance that was not caught in the
scope of this study, instead of priorities.
Within the extended version of TAM, two other factors PU and PEU are considered.
Within the Socio-ecological Perspective, perceptions and attitudes are also important
in determining acceptance, as well as a person’s surroundings, similar to TAM.
However within this framework, sociodemographic characteristics are also important,
and within this study one of the research aims is to determine whether age plays a
significant role in priorities or impressions of AV/SAV in relation to its acceptance.

51
It has been found that the populations impression of AV and SAV also does not
significantly differ between Young adults and Mature adults. However, Young adults
and Mature adults’ opinions are not uniform within each population. For example: 50%
of Young adults believe safety to be an incentive to switching, meaning they believe
autonomous technology to be safer than the one they’re currently using. The other
50% believe it to be a net negative, not trusting the technology to be able to help them
travel in a safe manner. This can also be said for the Mature population, an even divide
within the population, and this population most values safety when travelling.
Therefore, when trying to cater to a specific population through their impressions and
priorities it is a complicated process.
Ultimately, when analysing the relationship between population’s priorities and
acceptance, the first objective of this study, it can be said that; No, the populations
priorities are not the deciding factor in acceptance. It has been theorised and put
forward that other factors that had not been investigated such as a person’s subjective
norm could be the underlying factor determining acceptance. That a person’s
environment and societal pressures may override a person’s priorities and was not
captured within the scope of this study.
5.2 Population knowledge and its relationship with acceptance
When it comes to AV, all participants had prior knowledge of this technology.
Therefore, investigating level of knowledge and acceptance will be done using SAV,
as a large number of subjects had no prior knowledge. This allows for a comparison
between groups. Generally, more Young adults had prior knowledge of SAV
technology than Mature adults. All subjects who had a prior knowledge of the
technology have a higher opinion of that technology than those without prior
knowledge. Mature adults with prior knowledge had a slightly higher opinion of SAV
than Young adults. This difference is very slight and not statistically significant;
however this could show an overarching trend that was not caught within the small
sample size used within this study.
Those who have prior knowledge are also more willing to switch to SAV than those
without, which echoes findings within (Nees 2016), (Ha, 2010) and others.

52
Interestingly, when investigating those without prior knowledge a clear difference is
seen between Mature and Young adults. Young adults with prior knowledge have 40%
acceptance rate with the smallest proportion rejecting SAV, (10%). For those without
prior knowledge the uncertainty rises from 50% with prior knowledge to 57% without.
However, the no proportion doesn’t rise significantly, (10.7%). This shows that Young
adults are more likely to be uncertain regarding their opinions than to outright reject
an idea. This is certainly not the case with Mature adults.
Overall, the proportion of Mature adults who outright reject the technology is much
higher for those without prior knowledge. For those with prior knowledge there is a
42.3% acceptance, which is higher than that of Young adults. Nonetheless, when
examining their acceptance without prior knowledge, the majority has rejected that
technology (45.6%). Only 16.7% of the population would accept SAV without prior
knowledge. It must also be mentioned that those who selected ‘No’ to the question ‘Do
you have any prior knowledge of SAV?’ was then provided with a brief description of
this technology. Even after gaining some insight into the technology the majority still
chose to reject the technology. This shows that Mature adults are more likely to
outright reject a technology they are not familiar with, this links in with previous studies
whose findings were similar such as (Schoettle and Sivak 2014), (Deloitte 2014) and
(Wang 2011), all of whom found that Younger populations are more likely to accept
AV technology than Mature populations. These studies findings also mirror theories
within TAM.
PEU is an important factor within TAM’s extended version. This analyses where a
technology will cater to the needs of the user. This ease of use and ease of access
directly affect acceptance. Within the Mature population without prior knowledge, they
rate SAV’s ease of access lower than any other proportion of the population. This
follows the findings of TAM that say that the opinion of SAV’s ability to cater to their
needs is directly influenced by their level of knowledge. This also explains why those
with more knowledge are more willing to switch.
These results also coincide with some aspects of SEP. It theorises that
sociodemographic characteristics directly affect acceptance. Within this study, this
was found to be true in relation to acceptance when related to level of knowledge.
Level of knowledge is also considered to be a deciding factor within SEP, which is also

53
proven true within these findings. It also reinforces results found by (Vankatesh 2003,
and Hogg 2010) when they found that behavioural intention to accept technological
innovation declined as age increases. This is true for SAV for those without prior
knowledge and is reinforced by theories associated with level of knowledge in both
SEP and TAM.
Within the field of acceptance theory, the link between knowledge and acceptance is
not straightforward (Ha, 2012). This study reinforces the viewpoint that a subject’s
level of knowledge directly influences their acceptance, with more knowledge leading
to higher rates of acceptance. However, it would be remiss not to mention the multitude
of studies that contradict these findings (Sinatra 2002, Paz-y Mino and Espinosa
2009). (Ha, 2012)’s perspective on acceptance is also something to be considered
when analysing any acceptance study. As summarised previously, acceptance is a
combination of 1. Knowledge, but also 2. Feeling of knowing. This second aspect was
not examined within this study but is believed to be a stronger force behind decision
making than knowledge. This is because this FoK is not based on any underlying
knowledge, its purely intuitive cognition. This could be why in 5.1, that although SAV
could meet their needs, a proportion of the population would still reject to switch to that
technology. It has also been found that constrained levels of certainty linked with FoK
due to instinctual feelings, may lead to lower levels of acceptance even when
conceptual knowledge of the technology is high (Ha, 2012). These factors may be
underlying influences within this study that was not caught through questions asked
and must be acknowledged as such. Nevertheless, the results within this study found
that there is a direct link between level of knowledge and acceptance that is noticeably
stark within older sociodemographic populations.

54
6. Conclusion
Introduction
This chapter will outline the main findings within this study as well as suggestions for
future research that may be beneficial to incorporate into any proceeding acceptance
studies, in relation to AV/SAV, or more generally.
6.1 Main objectives and research findings
The main objective of this research was to investigate the acceptance of AV and SAV
technology by surveying a relatively representative proportion of the population of
Dublin. Having used a small sample size (n=100), this study found overarching trends
within the population. These trends are in relation to 1. Acceptance and its relationship
with a person’s impression of a technology, and 2. Acceptance and it’s relationship
with a persons’ level of knowledge of a technology.
1. The results of the first objective are that there is no significant relationship
between a person’s impression of a technology and a willingness to accept that
technology. This was found due to the fact that when the main priorities of a
proportion of a population were met, that proportion still rejected the technology,
and similarly when the main priorities were not met, a proportion of the
population accepted the technology. Ergo, impressions are not the deciding
factor of acceptance. This was theorised to be due to different aspects not
investigated within this study, such as SN or FoK, and is suggested to be
incorporated into any future study regarding these topics.
2. The second objective results found a relationship between a person’s level of
knowledge and acceptance within the Mature adult population. The results
found that the majority of those within the Mature adult population who had no
prior knowledge of a technology would outright reject it, if implemented. Those
with prior knowledge within the Mature adult population were more accepting
than those without prior knowledge. Young adults were found to have similar
acceptance with or without prior knowledge, but the majority of both populations
were uncertain of whether they would accept or not and were therefore less
55
likely to outright reject a technology. These results were found to coincide with
theories within the extended TAM and SEP, as well as previous findings within
technological acceptance studies (Ha 2010, Hogg 2013, Davies 1989,
Venkatesh 2003).
6.2 Future research
The findings within this study contribute to the growing body of work within acceptance
theory and AV/SAV technology research. When moving forward with research,
questions unanswered within this study would be a useful endeavour. For example,
understanding why when the main priorities of a population are met, some still choose
to reject the technology. It has been hypothesised to be due to a possible influence by
(Ha, 2012)’s FoK theory, however empirical data investigating this would be needed
for confirmation.
As well as this, one aspect used within both SEP and TAM was not investigated within
this study, this being a person’s surroundings, or better known as subjective norm
within TAM. Outside influences such as their environment, social pressures, or other
external influences were not considered within the scope of this study. Investigating
these factors may allow for a better understanding of acceptance and answer
questions posed within this study.
Due to the time frame, resources, and word count available for this study, FoK and SN
were not viable for study within this research but would be extremely valuable to
analyse in any future research. The time frame and resources available also caused
there to be a relatively small sample size. It would be recommended to survey a larger
proportion of the population to more easily root out any overarching trends that may
not have been caught in the scope of this study.
Conclusion
The relationships at play that determine acceptance are not straightforward or simple
to analyse. To fully research this topic one must adapt a multidisciplinary approach to
fully encompass the broad spectrum of reasonings behind acceptance, such as the

56
psychology of acceptance, the cognitive background of knowledge as well as having
a strong knowledge of the technology and literature surrounding autonomous vehicle
technology. For this technology to be accepted by society, these kinds of studies are
imperative to the smooth transitioning to this technology that is happening across the
world in different mobility sectors. Within Ireland, AV and SAV technology is advancing
and will soon become part of our sphere of mobility, how successful this will be is
entirely due to how this technology is communicated and developed to and for
consumers. This study has shown that a prior knowledge of a new technology will
greatly improve the acceptance of said technology, and that this information should be
communicated affectively, particularly towards the Mature adult population, for this
technology to be fully incorporated and accepted by society.

57
References
1. Acheampong, R.A. and Cugurullo, F., (2019). Capturing the behavioural
determinants behind the adoption of autonomous vehicles: Conceptual
frameworks and measurement models to predict public transport, sharing and
ownership trends of self-driving cars. Transportation research part F: traffic
psychology and behaviour, 62, pp.349-375.
2. Alemi, F., Circella, G., Handy, S. and Mokhtarian, P., (2018). What influences
travelers to use Uber? Exploring the factors affecting the adoption of on-
demand ride services in California. Travel Behaviour and Society, 13, pp.88-
104.
3. Anderson, J. M., Nidhi, K., Stanley, K. D., Sorensen, P., Samaras, C., &
Oluwatola, O. A. (2014). Autonomous Vehicle Technology: A Guide for
Policymakers. Santa Monica: RAND Corporation. Banister, D.,
(2005). Unsustainable transport: city transport in the new century. Routledge.
4. Arndt, S. (2011). Evaluation of the acceptance of driver assistance systems:
examination a model for predicting the purchasing behaviour of end customers
(1st ed.) Traffic Psychology. Wiesbaden: VS publishing house for social
sciences.
5. Bagloee, S.A., Tavana, M., Asadi, M. and Oliver, T., (2016). Autonomous
vehicles: challenges, opportunities and future implications for transportation
policies. Journal of modern transportation, 24(4), pp. 284-303
6. Bazilinksky, P., Kyriakidis, M. and de Winter, J., (2015). An International
Crowdsourcing Study into People’s Statements on Fully Automated Driving.
Procedia Manufactoring, 3, pp. 2534-2542.
7. Beirão, G. and Cabral, J.S., (2007). Understanding attitudes towards public
transport and private car: A qualitative study. Transport policy, 14(6), pp.478-
489.
8. Bischoff, J., and Maciejewski, M., (2016) Simulation of city-wide replacement
of private cars with autonomous taxis in Berlin, Procedia Computer Science 83
237–244
9. Boynton, P.M. and Greenhalgh, T., (2004). Selecting, designing, and
developing your questionnaire. Bmj, 328(7451), pp.1312-1315.

58
10. Brown, A., Gonder, J., and Repac, B., (2014) An analysis of possible energy
impacts of automated vehicle, in Road Vehicle Automation, (Springer, 2014),
pp. 137–153.
11. Burton, R. A. (2008). On being certain: Believing you are right even when you’re
not (1st ed.). New York: St. Martin’s Press
12. Chen, S.C., Shing-Han, L. and Chien-Yi, L., (2011). Recent related research in
technology acceptance model: A literature review. Australian Journal of
Business and Management Research, 1(9), p.124.
13. Chen, X.J., (2018). Review of the Transit Accessibility Concept: A Case Study
of Richmond, Virginia. Sustainability, 10(12), p.4857.
14. Clifford, N., French, S. and Valentine, G., (2010). Getting started in
geographical research: how this book can help. Key methods in geography, 2,
pp.3-15.
15. Damasio, A. R. (2003). Looking for spinoza: Joy, sorrow, and the feeling brain
(1st ed.). Orlando, FL: Harcourt.
16. Davidson, P., and Spinoulas, A., (2016). Driving alone versus riding together-
How shared autonomous vehicles can change the way we drive, Road &
Transport Research: A Journal of Australian and New Zealand Research and
Practice 25 51.
17. Davis, B., Dutzik, T. and Baxandall, P., (2014). Transportation and the New
Generation: Why Young People Are Driving Less and What It Means for
Transportation Policy (Frontier Group and US PIRG Education Fund, April,
2012).
18. Davis, F. D., Bagozzi, R. O., & Warshaw, P. R. (1989). User Acceptance of
computer technology: A comparison of two theoretical models. Management
Science 35(8), 982-1003.
19. Delbosc, A., (2017). Delay or forgo? A closer look at youth driver licensing
trends in the United States and Australia. Transportation, 44(5), pp.919-926.
20. Deloitte, (2010): Third Annual Deloitte Automotive Generation Y Survey
“Gaining speed: Gen Y in the Driver’s seat”. Deloitte Development LLC.
21. Deloitte (2014). Whats ahead for fully autonomous driving Consumer opinions
on advanced vehicle technology – Perspectives from Deloitte’s Global

59
Autotmotive Consumer Study. Automotive Research Centre Deloitte Servies
LP.
22. Efthymiou, D., Antoniou, C., Waddell, P. (2013). Factors Affecting the Adoption
Of Vehicle Sharing Systems by Young Drivers. Transport Policy, 29. Pp/ 64-73.
23. Fagnant, D. and Kockelman, K.M., (2013). Preparing a nation for autonomous
vehicles: Opportunities, barriers and policy recommendations.
24. Fagnant, D.J. and Kockelman, K. M, (2015). Preparing a nation for autonomous
vehicles: opportunities, barriers and policy recommendations. Transportation
Research Part A: Policy and Practice, 77, pp.167-181
25. Fagnant, D. J., & Kockelman, K. M. (2014). The travel and environmental
implications of shared autonomous vehicles, using agent-based model
scenarios. Transportation Research Part C: Emerging Technologies, 40, pp.1–
13
26. Fagnant, J. D., & Kockelman, K. M. (2016). Dynamic ride-sharing and fleet
sizing for a system of shared autonomous vehicles in Austin,
Texas. Transportation. Advanced online publication
27. Fernandes, Nunes, Fernandes, P., Nunes, U., S. (2015). Multi-platooning
leaders positioning and cooperative behaviour algorithms of communicant
automated vehicles for high traffic capacity. IEEE Transactions on Intelligent
Transportation Systems, 16(3), pp.1172–1187
28. Fishbein, M., leek Ajzen (1975). Belief, attitude, intention and behaviour: An
introduction to theory and research, pp.181-202.
29. Fraedrick, E. and Lenz, B., (2016). Societal and individual acceptance of
autonomous driving. Autonomous driving, pp.621-640. Springer, Berlin,
Heidelberg.
30. Frost & Sullivan, (2006): Customer Desirability and Willingness to Pay Active
and Passive Safety Systems in Canada. Frost & Sullivan, Canada.
31. Givoni, M. and Banister, D., (2013). Mobility transport and carbon. Towards
Low Carbon Mobility; Givoni, M., Banister, D., Eds, pp.1-15.
32. Ha, M., Haury, D.L. and Nehm, R.H., (2012). Feeling of certainty: Uncovering
a missing link between knowledge and acceptance of evolution. Journal of
Research in Science Teaching, 49(1), pp.95-121.

60
33. Ham, M., Jeger, M. and Frajman Ivković, A., (2015). The role of subjective
norms in forming the intention to purchase green food. Economic research-
Ekonomska istraživanja, 28(1), pp.738-748.
34. Harper C., Hendrickson C. T., Mangones S., Samaras C., (2016). Estimating
potential increases in travel with autonomous vehicles for the non-driving,
elderly and people with travel-restrictive medical conditions. Transportation
Research Part C: Emerging Technologies, 72, pp.1–9.
35. Herrenkind, B., Nastjuk, I., Brendel, A.B., Trang, S. and Kolbe, L.M., (2019).
Young people’s travel behaviour – Using the life-oriented approach to
understand the acceptance of autonomous driving. Transportation research
part D: transport and environment, 74, pp.214-233.
36. Hogg, R., Schmid, H.P.D.B. and Stanoevska-Slabeva, F.P.D.K., (2010)
Extension and evaluation of the technology acceptance model for use in mobile
data services.
37. Husing, B., Bierhals, R., Buhrlen, B., Friededwald, M., Kimpeler, S., Mendrad,
K., Wengel, J., Zimmer, R. and Zoche, P., (2002). Technology acceptance and
demand patterns as a location advantage. Final report to the Federal Ministry
of Education and Research, Fraunhoker Institute for Systems and Innovation
Research (Fraunhoker ISI), Karlsruhe.
38. International Transport Forum, (2015) Urban Mobility System Uupgrade, 1st
edition. Paris: OECD Publishing
39. JSNA (2017), Young Adults JSNA, Heath and Wellbeing needs of Young
adults, JSNAs for Westminster & Kensington and Chelsea.
40. Kayam, 0. And Hirsch, T. (2012). Using Social Media Networks to Conduct
Questionnaire Based Research in Social Studies Case Study: Family
Language Policy. Journal of Sociological Research, 3(2).
41. Kelkel, R., (2015). Predicting consumer’ intention to purchase fully autonomous
driving systems: which factors drive acceptance?
42. Kesting, A., Treiber, M., Schonhof, M., & Helbing, D. (2008). Adaptive cruise
control design for active congestion avoidance. Transportation Research Part
C: Emerging Technologies, 16(6), pp. 668.
43. Khan, A.M., Bacchus, A. and Erwin, S., (2012). Policy challenges of increasing
automation in driving. IATSS research, 35(2), pp.79-89.

61
44. Khondaker, B. and Kattan, L., (2015). Variable speed limit: A microscopic
analysis in a connected vehicle environment. Transportation Research Part C:
Emerging Technologies, 58, pp.146-159.
45. Knight, W. (2012). Driverless Cars: Coming to Your Street Sooner Than You
Think. Trends Magazine, 115, 26-31.
46. KPMG & CAR. (2012). Self-driving cars: The next revolution. KPMG.
47. Lane, C., Zeng, H., Dhingra, C., Carrigan, A. (2015). A Carshaing: A Vehicle
for Sustainable Mobiltiy in Engerging Markets. World Resources Institute,
Washington DC.
48. Lavieri, P.S., Garikapati, V.M., Bhat, C. R., Pendyala, R.M., Astroza, S, and
Dias, F.F. (2017). Modelling individual preferences for ownership and sharing
of autonomous vehicle technologies. Transportation Research Record: Journal
of the Transportation Research Board.
49. Lim, H.S.M. and Taeihagh, A., (2018). Autonomous vehicles for smart and
sustainable cities: An in-depth exploration of privacy and cybersecurity
implications. Energies, 11(5), p.1062.
50. Litman, T. (2017). Autonomous vehicle implementation predictions.
Implications for Transport Planning. Presented at the 2015 Transportation
Research Board Annual Meeting
51. Lucas, K., & Jones, P. (2012). Social impacts and equity issues in transport: An
introduction. Journal of Transport Geography, 21, pp.1–3
52. Marshall, Martin N. (1996). "Sampling for Qualitative Research." Family
Practice 13: 522–526.
53. Mc Caffery, F., Richardson, I. and Moller, P., (2007). Automotive-Adept: A
lightweight assessment method for the Automotive Irish software industry.
54. Milakis, D., Van Arem, B. and Van Wee, B., (2017). Policy and society related
implications of automated driving: A review of literature and directions for future
research. Journal of Intelligent Transportation Systems, 21(4), pp.324-348.
55. Millard‐Ball, A. and Schipper, L., (2011). Are we reaching peak travel? Trends
in passenger transport in eight industrialized countries. Transport
reviews, 31(3), pp.357-378.

62
56. Montello, D.R., Sutton, P.C., Scafi, A., Zook, M.A., Sheppard, E.S. and
Kennedy, B., (2006). An introduction to scientific research methods in
geography. USA.
57. Münzel, Karla et al. (2017). “Carsharing Business Models in Germany:
Characteristics, Success and Future Prospects”. Utrecht University
58. Münzel, T., Schmidt, F.P., Steven, S., Herzog, J., Daiber, A. and Sørensen, M.,
(2018). Environmental noise and the cardiovascular system. Journal of the
American College of Cardiology, 71(6), pp.688-697.
59. National Highway Traffic Safety Administration. (2008). National Motor Vehicle
Crash Causation Survey. National Highway Traffic Safety Administration.
60. Nees, M. (2016). Acceptance of Self-driving Cars: An Examination of Idealised
versus Realistic Portrayals with a Self-driving Car Acceptance Scale.
Proceedings of the Human Factors and Ergonomics Society Annual Meeting,
60(1), pp/ 1449-1453.
61. Newman, P. and Kenworthy, J., (2011). ‘Peak car use’: understanding the
demise of automobile dependence. World Transport Policy & Practice, 17(2),
pp.31-42.
62. Ngoduy, D., (2012). Application of gas-kinetic theory to modelling mixed traffic
of manual and ACC vehicles. Transportmetrica, 8(1), pp.43-60.
63. Osman, M. (2004). An evaluation of dual-process theories of reasoning.
Psychonomic Bulletin & Review, 11(6), 988–1010
64. Östlund, U., Kidd, L., Wengström, Y. and Rowa-Dewar, N., (2011). Combining
qualitative and quantitative research within mixed method research designs: a
methodological review. International journal of nursing studies, 48(3), pp.369-
383.
65. Pakusch C., Stevens G., Boden A., Bossauer P., (2018) Unintended effects of
Autonomous Driving: A Study on Mobility Preferences in the Future,
Sustainability, 10(7) pp. 2404
66. Paz-y-Min˜o, C. G., & Espinosa, A. (2009). Acceptance of evolution increases
with student academic level: A comparison between a secular and a religious
college. Evolution Education & Outreach, 2, 655–675.
67. Petermann, T. and Scherz, C., (2005). TA and (technology) acceptance
(research). Technology Assessment – Theory and Practice, 14 (3), pp. 45-53

63
68. Ponto, J., (2015). Understanding and evaluating survey research. Journal of
the advanced practitioner in oncology, 6(2), p.168.
69. Ringenson, T., Höjer, M., Kramers, A. and Viggedal, A., (2018). Digitalization
and Environmental Aims in Municipalities. Sustainability, 10(4), pp.1278.
70. Rupp, J. D., King, A. G (2010).: Autonomous Driving – A Practical Roadmap.
SAE International.
71. Schiller, P.L. and Kenworthy, J.R., (2017). An introduction to sustainable
transportation: Policy, planning and implementation. Routledge.
72. Schoettle, B., and M. Sivak. (2014). A Survey of Public Opinion about
Autonomous and Self Driving Vehickels in the U.S., U.K., and Australia.
UMTRI-2014-21, University of Michigan, Ann Arbor, Michigan.
73. Shanker, R., Jonas, A., Devitt, S., Huberty, K., Flannery, S., Greene, W.,
Swinburne, B., Locraft, G., Wood, A., Weiss, K. and Moore, J., (2013).
Autonomous Cars.
74. Simpson, R., (2017) Young Adult Development Project, MIT Centre for Work,
Family and Personal Life.
75. Sinatra, G. M., Brem, S. K., & Evans, E. M. (2008). Changing minds?
Implications of conceptual change for teaching and learning about biological
evolution. Evolution: Education & Outreach, 1(2), 189–195.
76. Spieser, K., Treleautonomous vehiclesen, K., Zhang, R., Frazzoli, E., Morton,
D. and Pautonomous vehiclesone, M., (2014.) Toward a systematic approach
to the design and evaluation of automated mobility-on-demand systems: A case
study in Singapore. In Road vehicle automation pp. 229-245.
77. Teipel, K., (2016) Understanding Adolescence. Seeing Through a
Developmental Lens. A synthesis of adolescent development research
conducted at University of Minnesota. Association of Maternal Camp.
78. Tientrakool, P., Ho, Y.C. and Maxemchuk, N.F., (2011), September. Highway
capacity benefits from using vehicle-to-vehicle communication and sensors for
collision avoidance. In 2011 IEEE Vehicular Technology Conference (VTC
Fall) (pp. 1-5). IEEE.
79. Venkatesh, V., M. G. Morris, G. B. Davis and F. D. Davis (2003) User
Acceptance of 20 Information Technology: Toward a Unified View, MIS
Quarterly, 27 (3) 425–478.
64
80. Wallston, K.A., Wallston, B.S., Smith, S. and Dobbins, C.J., (1987). Perceived
control and health. Current Psychology, 6(1), pp.5-25.
81. Wang, M., E.W. Martin, S.A Shaheen. (2011). Carsharing In Shanghai, China:
Analysis of Behvaioural Response to a Local Survey and Potential Competition
Transportation Research Recor: Jounral of the Transportation Research Board.
No. 2319: 86-95.
82. World Health Organization. (2013). Global status report on road safety 2013:
Supporting a decade of action. Geneva:
83. World Health Organization. World Health Organization. (2009). Global status
report on road safety: Time for action. Geneva: World Health Organization.
84. Wu, J., Liao, H., Wang, J.W. and Chen, T., (2019). The role of environmental
concern in the public acceptance of autonomous electric vehicles: A survey
from China. Transportation Research Part F: Traffic Psychology and
Behaviour, 60, pp.37-46.

65
7. Appendix
Survey distributed

66

67
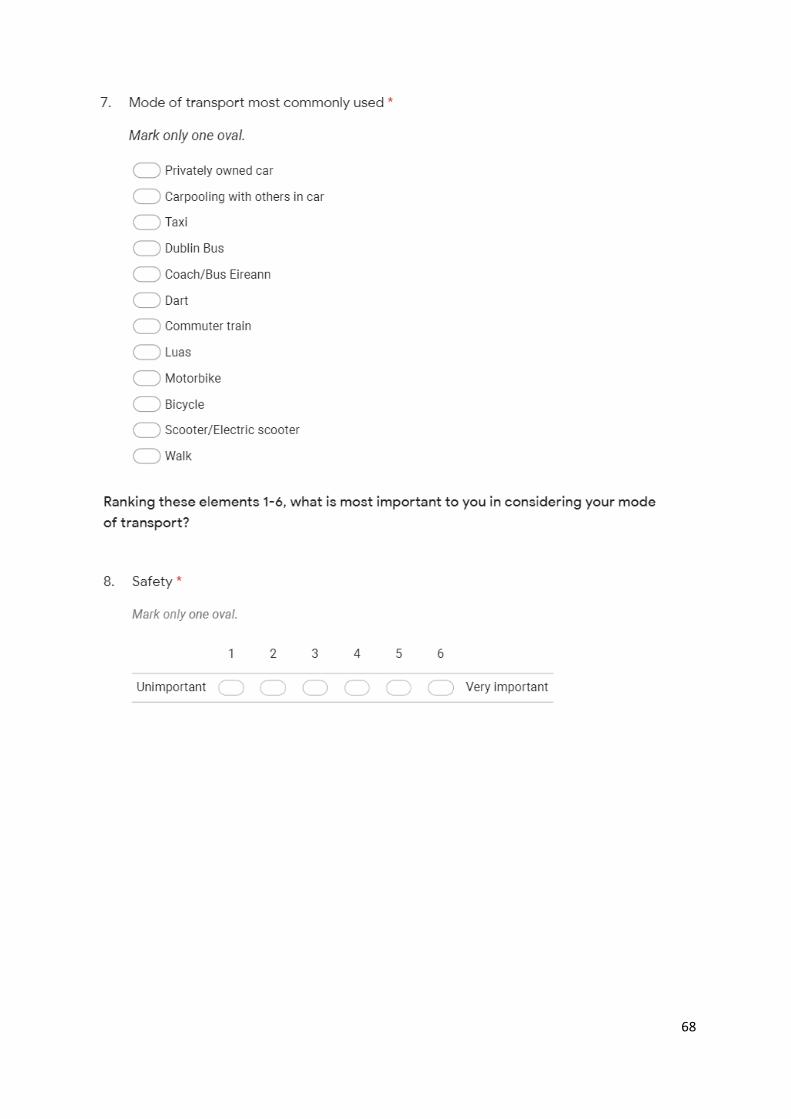
68

69

70
71

72

73

74
75

76

77

78

79
80

81