tristar 3000 - micromeriticsprovides instrument and software interface. chapter 4 operating...
TRANSCRIPT

TriStar 3000
Operator’s ManualV6.08
(For serial number 1001 and higher)
300-42832-01June 2007

Windows is a registered trademark of Microsoft Corporation
© Micromeritics Instrument Corporation 2005-2007. All rights reserved.
The software described in this manual is furnished under a license agreement and may be used or copied only in accordance with the terms of the agreement.
WARRANTYMICROMERITICS INSTRUMENT CORPORATION warrants for one year from the date of shipment each instrumentmanufactured by it to be free from defects in material and workmanship impairing its usefulness under normal use andservice conditions except as noted herein.
Our liability under this warranty is limited to repair, servicing and adjustment, free of charge at our plant, of anyinstrument or defective parts, when returned prepaid to us, and which our examination discloses to have been defective.The purchaser is responsible for all transportation charges involving the shipment of materials for warranty repairs.Failure of any instrument or product due to operator error, improper installation, unauthorized repair or alteration, failureof utilities, or environmental contamination will not constitute a warranty claim. The materials of construction used inMICROMERITICS instruments and other products were chosen after extensive testing and experience for theirreliability and durability. However, these materials cannot be totally guaranteed against wear and/or decomposition bychemical action (corrosion) as a result of normal use.
Repair parts are warranted to be free from defects in material and workmanship for 90 days from the date of shipment.
No instrument or product shall be returned to MICROMERITICS prior to notification of alleged defect and authorizationto return the instrument or product. All repairs or replacements are made subject to factory inspection of returned parts.
MICROMERITICS shall be released from all obligations under its warranty in the event repairs or modifications aremade by persons other than its own authorized service personnel unless such work is authorized in writing byMICROMERITICS.
The obligations of this warranty will be limited under the following conditions:
1. Certain products sold by MICROMERITICS are the products of reputable manufacturers, sold under theirrespective brand names or trade names. We, therefore, make no express or implied warranty as to such products.We shall use our best efforts to obtain from the manufacturer, in accordance with his customary practice, the repairor replacement of such of his products that may prove defective in workmanship or materials. Service chargesmade by such manufacturer are the responsibility of the ultimate purchaser. This states our entire liability in respectto such products, except as an authorized person of MICROMERITICS may otherwise agree to in writing.
2. If an instrument or product is found defective during the warranty period, replacement parts may, at the discretionof MICROMERITICS, be sent to be installed by the purchaser, e.g., printed circuit boards, check valves, seals,etc.
3. Expendable items, e.g., sample tubes, detector source lamps, indicator lamps, fuses, valve plugs (rotor) and stems,seals and O-rings, ferrules, etc., are excluded from this warranty except for manufacturing defects. Such itemswhich perform satisfactorily during the first 45 days after the date of shipment are assumed to be free ofmanufacturing defects.
Purchaser agrees to hold MICROMERITICS harmless from any patent infringement action brought againstMICROMERITICS if, at the request of the purchaser, MICROMERITICS modifies a standard product or manufacturesa special product to the purchaser’s specifications.
MICROMERITICS shall not be liable for consequential or other type damages resulting from the use of any of itsproducts other than the liability stated above. This warranty is in lieu of all other warranties, express or implied,including, but not limited to the implied warranties of merchantability or fitness for use.
One Micromeritics Drive • Norcross, GA 30093-1877 • Fax: (770) 662-3696Domestic Sales — (770) 662-3633 Domestic Repair Service — (770) 662-3666International Sales — (770) 662-3660 Customer Service — (770) 662-3636
Form No. 008-42104-00Rev. 12/95

TABLE OF CONTENTS
1. GENERAL DESCRIPTION
Organization of the Manual . . . . . . . . . . . . . . . . . . . . . . . . . . . . . . 1-1Conventions . . . . . . . . . . . . . . . . . . . . . . . . . . . . . . . . . . . . . 1-2
Equipment Description . . . . . . . . . . . . . . . . . . . . . . . . . . . . . . . . . 1-3SmartPrep Degasser . . . . . . . . . . . . . . . . . . . . . . . . . . . . . . . . 1-3Vacuum Pump . . . . . . . . . . . . . . . . . . . . . . . . . . . . . . . . . . . 1-4Analysis Program . . . . . . . . . . . . . . . . . . . . . . . . . . . . . . . . . . 1-5
Report System . . . . . . . . . . . . . . . . . . . . . . . . . . . . . . . . . 1-5Online Help . . . . . . . . . . . . . . . . . . . . . . . . . . . . . . . . . . 1-5
Specifications . . . . . . . . . . . . . . . . . . . . . . . . . . . . . . . . . . . . . . 1-6
2. INSTALLATION
Unpacking and Inspecting the Equipment . . . . . . . . . . . . . . . . . . . . . . . 2-1Equipment Damage or Loss During Shipment . . . . . . . . . . . . . . . . . . 2-1Equipment Return . . . . . . . . . . . . . . . . . . . . . . . . . . . . . . . . . 2-1
Installing the Analyzer . . . . . . . . . . . . . . . . . . . . . . . . . . . . . . . . . 2-3Connecting the Computer . . . . . . . . . . . . . . . . . . . . . . . . . . . . . 2-3Connecting the Vacuum Pump . . . . . . . . . . . . . . . . . . . . . . . . . . . 2-4Connecting Peripheral Equipment to the Computer . . . . . . . . . . . . . . . 2-6Connecting the Gas Supply . . . . . . . . . . . . . . . . . . . . . . . . . . . . 2-7Installing the SmartPrep Degasser . . . . . . . . . . . . . . . . . . . . . . . . . 2-9
Installing the Software . . . . . . . . . . . . . . . . . . . . . . . . . . . . . . . . . 2-10Initial Installation . . . . . . . . . . . . . . . . . . . . . . . . . . . . . . . . . . 2-10Using the Setup Program for Other Functions . . . . . . . . . . . . . . . . . . 2-13
Installing Subsequent Software Versions . . . . . . . . . . . . . . . . . . . 2-15Adding an Analyzer . . . . . . . . . . . . . . . . . . . . . . . . . . . . . . 2-16Moving an Analyzer from one PC to another PC . . . . . . . . . . . . . . 2-17Removing an Analyzer . . . . . . . . . . . . . . . . . . . . . . . . . . . . . 2-20Changing an Analyzer Setup . . . . . . . . . . . . . . . . . . . . . . . . . 2-21Reinstalling the Calibration Files . . . . . . . . . . . . . . . . . . . . . . . 2-22Uninstalling the Analysis Program . . . . . . . . . . . . . . . . . . . . . . 2-23
Specifying Gas Ports . . . . . . . . . . . . . . . . . . . . . . . . . . . . . . . . . . 2-25
3. USER INTERFACE
Turning the Analyzer On and Off . . . . . . . . . . . . . . . . . . . . . . . . . . . 3-1Turning the Analyzer On . . . . . . . . . . . . . . . . . . . . . . . . . . . . . . 3-1Turning the Analyzer Off . . . . . . . . . . . . . . . . . . . . . . . . . . . . . 3-1
Using the Software . . . . . . . . . . . . . . . . . . . . . . . . . . . . . . . . . . . 3-2Shortcut Menus . . . . . . . . . . . . . . . . . . . . . . . . . . . . . . . . . . . 3-2Shortcut Keys . . . . . . . . . . . . . . . . . . . . . . . . . . . . . . . . . . . . 3-2
Feb 03 i
Dialog Boxes and Subdialog Boxes . . . . . . . . . . . . . . . . . . . . . . . . 3-4Selecting Files . . . . . . . . . . . . . . . . . . . . . . . . . . . . . . . . . . . . 3-6File Name Conventions . . . . . . . . . . . . . . . . . . . . . . . . . . . . . . . 3-8
Menu Structure . . . . . . . . . . . . . . . . . . . . . . . . . . . . . . . . . . . . . 3-9Main Menu Bar . . . . . . . . . . . . . . . . . . . . . . . . . . . . . . . . . . . 3-9Windows Menu . . . . . . . . . . . . . . . . . . . . . . . . . . . . . . . . . . . 3-10Help Menu . . . . . . . . . . . . . . . . . . . . . . . . . . . . . . . . . . . . . 3-11
4. OPERATIONAL PROCEDURES
Specifying Sample Defaults . . . . . . . . . . . . . . . . . . . . . . . . . . . . . . 4-1Basic Format . . . . . . . . . . . . . . . . . . . . . . . . . . . . . . . . . . . . 4-1Advanced Format . . . . . . . . . . . . . . . . . . . . . . . . . . . . . . . . . . 4-3
Defining Parameter Files . . . . . . . . . . . . . . . . . . . . . . . . . . . . . . . . 4-5Sample Tube . . . . . . . . . . . . . . . . . . . . . . . . . . . . . . . . . . . . 4-5Degas Conditions . . . . . . . . . . . . . . . . . . . . . . . . . . . . . . . . . . 4-7Analysis Conditions . . . . . . . . . . . . . . . . . . . . . . . . . . . . . . . . . 4-8Adsorptive Properties . . . . . . . . . . . . . . . . . . . . . . . . . . . . . . . . 4-9Report Options . . . . . . . . . . . . . . . . . . . . . . . . . . . . . . . . . . . 4-10
Creating a Sample File . . . . . . . . . . . . . . . . . . . . . . . . . . . . . . . . . 4-12Basic and Restricted Formats . . . . . . . . . . . . . . . . . . . . . . . . . . . 4-12Advanced Format . . . . . . . . . . . . . . . . . . . . . . . . . . . . . . . . . . 4-14
Cleaning and Labeling Sample Tubes . . . . . . . . . . . . . . . . . . . . . . . . . 4-16Calibrating Sample Tubes . . . . . . . . . . . . . . . . . . . . . . . . . . . . . . . . 4-19Preparing the Sample for Analysis . . . . . . . . . . . . . . . . . . . . . . . . . . . 4-21
Weighing the Sample . . . . . . . . . . . . . . . . . . . . . . . . . . . . . . . . 4-21Degassing the Sample . . . . . . . . . . . . . . . . . . . . . . . . . . . . . . . 4-22Installing the Sample Tube . . . . . . . . . . . . . . . . . . . . . . . . . . . . . 4-23Installing the Analysis Dewar . . . . . . . . . . . . . . . . . . . . . . . . . . . 4-24
Performing an Analysis . . . . . . . . . . . . . . . . . . . . . . . . . . . . . . . . . 4-26Standard Analysis . . . . . . . . . . . . . . . . . . . . . . . . . . . . . . . . . . 4-26QuickStart Analysis . . . . . . . . . . . . . . . . . . . . . . . . . . . . . . . . . 4-27
Printing File Contents . . . . . . . . . . . . . . . . . . . . . . . . . . . . . . . . . . 4-29Generating a List . . . . . . . . . . . . . . . . . . . . . . . . . . . . . . . . . . . . 4-30Exporting Isotherm Data . . . . . . . . . . . . . . . . . . . . . . . . . . . . . . . . 4-32Generating Graph Overlays . . . . . . . . . . . . . . . . . . . . . . . . . . . . . . . 4-33
Multiple Graph Overlays . . . . . . . . . . . . . . . . . . . . . . . . . . . . . . 4-33Multiple Sample Overlays . . . . . . . . . . . . . . . . . . . . . . . . . . . . . 4-35
5. FILE MENU
Description . . . . . . . . . . . . . . . . . . . . . . . . . . . . . . . . . . . . . . . . 5-1Open . . . . . . . . . . . . . . . . . . . . . . . . . . . . . . . . . . . . . . . . . . . 5-3
Sample Information . . . . . . . . . . . . . . . . . . . . . . . . . . . . . . . . . 5-4Basic . . . . . . . . . . . . . . . . . . . . . . . . . . . . . . . . . . . . . . . 5-5Advanced . . . . . . . . . . . . . . . . . . . . . . . . . . . . . . . . . . . . 5-8
Table of Contents TriStar 3000
ii Feb 03
Sample Tube . . . . . . . . . . . . . . . . . . . . . . . . . . . . . . . . . . . . 5-11Degas Conditions . . . . . . . . . . . . . . . . . . . . . . . . . . . . . . . . . . 5-13Analysis Conditions . . . . . . . . . . . . . . . . . . . . . . . . . . . . . . . . 5-15Adsorptive Properties . . . . . . . . . . . . . . . . . . . . . . . . . . . . . . . . 5-27Report Options . . . . . . . . . . . . . . . . . . . . . . . . . . . . . . . . . . . 5-29
Isotherm Report Options . . . . . . . . . . . . . . . . . . . . . . . . . . . . 5-32BET/Langmuir Surface Area Report Options . . . . . . . . . . . . . . . . 5-34t-Plot Report Options . . . . . . . . . . . . . . . . . . . . . . . . . . . . . 5-37Alpha-S Plot . . . . . . . . . . . . . . . . . . . . . . . . . . . . . . . . . . 5-42f-Ratio Plot . . . . . . . . . . . . . . . . . . . . . . . . . . . . . . . . . . . 5-44BJH Adsorption/Desorption Report Options . . . . . . . . . . . . . . . . . 5-46
Tabular Report . . . . . . . . . . . . . . . . . . . . . . . . . . . . . . . 5-49Plot Options . . . . . . . . . . . . . . . . . . . . . . . . . . . . . . . . 5-51
Dubinin Report Options . . . . . . . . . . . . . . . . . . . . . . . . . . . . 5-53Tabular Report Options . . . . . . . . . . . . . . . . . . . . . . . . . . 5-55Transformed Isotherm Plot Options . . . . . . . . . . . . . . . . . . . 5-56Pore Volume Options . . . . . . . . . . . . . . . . . . . . . . . . . . . 5-57
MP-Method Report Options . . . . . . . . . . . . . . . . . . . . . . . . . . 5-58Tabular Report Options . . . . . . . . . . . . . . . . . . . . . . . . . 5-60Plot Options . . . . . . . . . . . . . . . . . . . . . . . . . . . . . . . . 5-61
Summary Report . . . . . . . . . . . . . . . . . . . . . . . . . . . . . . . . 5-63Options Report . . . . . . . . . . . . . . . . . . . . . . . . . . . . . . . . . 5-64Sample Log Report . . . . . . . . . . . . . . . . . . . . . . . . . . . . . . 5-64
Collected/Entered Data . . . . . . . . . . . . . . . . . . . . . . . . . . . . . . . 5-65Save . . . . . . . . . . . . . . . . . . . . . . . . . . . . . . . . . . . . . . . . . . . 5-68Save As . . . . . . . . . . . . . . . . . . . . . . . . . . . . . . . . . . . . . . . . . 5-68Save All . . . . . . . . . . . . . . . . . . . . . . . . . . . . . . . . . . . . . . . . . 5-70Close . . . . . . . . . . . . . . . . . . . . . . . . . . . . . . . . . . . . . . . . . . . 5-70Close All . . . . . . . . . . . . . . . . . . . . . . . . . . . . . . . . . . . . . . . . . 5-70Print . . . . . . . . . . . . . . . . . . . . . . . . . . . . . . . . . . . . . . . . . . . 5-71List . . . . . . . . . . . . . . . . . . . . . . . . . . . . . . . . . . . . . . . . . . . . 5-73Export . . . . . . . . . . . . . . . . . . . . . . . . . . . . . . . . . . . . . . . . . . 5-75Exit . . . . . . . . . . . . . . . . . . . . . . . . . . . . . . . . . . . . . . . . . . . 5-77
6. UNIT MENU
Description . . . . . . . . . . . . . . . . . . . . . . . . . . . . . . . . . . . . . . . 6-1Sample Analysis . . . . . . . . . . . . . . . . . . . . . . . . . . . . . . . . . . . . . 6-3QuickStart . . . . . . . . . . . . . . . . . . . . . . . . . . . . . . . . . . . . . . . . 6-7Enable Manual Control . . . . . . . . . . . . . . . . . . . . . . . . . . . . . . . . . 6-11Show Instrument Schematic . . . . . . . . . . . . . . . . . . . . . . . . . . . . . . 6-13Show Status . . . . . . . . . . . . . . . . . . . . . . . . . . . . . . . . . . . . . . . 6-14Show Instrument Log . . . . . . . . . . . . . . . . . . . . . . . . . . . . . . . . . . 6-15Unit Configuration . . . . . . . . . . . . . . . . . . . . . . . . . . . . . . . . . . . 6-17Calibration . . . . . . . . . . . . . . . . . . . . . . . . . . . . . . . . . . . . . . . . 6-18
Temperature . . . . . . . . . . . . . . . . . . . . . . . . . . . . . . . . . . . . . 6-18Pressure Scale . . . . . . . . . . . . . . . . . . . . . . . . . . . . . . . . . . . . 6-19Zero Pressure . . . . . . . . . . . . . . . . . . . . . . . . . . . . . . . . . . . . 6-19
TriStar 3000 Table of Contents
Feb 03 iii

Reset Pressure Calibration . . . . . . . . . . . . . . . . . . . . . . . . . . . . . 6-20Servo Valve . . . . . . . . . . . . . . . . . . . . . . . . . . . . . . . . . . . . . 6-20Volume . . . . . . . . . . . . . . . . . . . . . . . . . . . . . . . . . . . . . . . . 6-21Save to File . . . . . . . . . . . . . . . . . . . . . . . . . . . . . . . . . . . . . 6-23Load from File . . . . . . . . . . . . . . . . . . . . . . . . . . . . . . . . . . . 6-23
7. REPORTS MENU
Description . . . . . . . . . . . . . . . . . . . . . . . . . . . . . . . . . . . . . . . . 7-1Start Report . . . . . . . . . . . . . . . . . . . . . . . . . . . . . . . . . . . . . . . 7-2Close Reports . . . . . . . . . . . . . . . . . . . . . . . . . . . . . . . . . . . . . . 7-5DFT Plus . . . . . . . . . . . . . . . . . . . . . . . . . . . . . . . . . . . . . . . . . 7-5Printed Reports . . . . . . . . . . . . . . . . . . . . . . . . . . . . . . . . . . . . . 7-6
Header . . . . . . . . . . . . . . . . . . . . . . . . . . . . . . . . . . . . . . . . 7-6Onscreen Reports . . . . . . . . . . . . . . . . . . . . . . . . . . . . . . . . . . 7-6
Tool Bar . . . . . . . . . . . . . . . . . . . . . . . . . . . . . . . . . . . . . 7-7Shortcut Menus . . . . . . . . . . . . . . . . . . . . . . . . . . . . . . . . . 7-10
Tabular Reports . . . . . . . . . . . . . . . . . . . . . . . . . . . . . . 7-10Graphs . . . . . . . . . . . . . . . . . . . . . . . . . . . . . . . . . . . 7-11
Zoom Feature . . . . . . . . . . . . . . . . . . . . . . . . . . . . . . . . . . 7-14Axis Cross Hair . . . . . . . . . . . . . . . . . . . . . . . . . . . . . . . . 7-14
Report Examples . . . . . . . . . . . . . . . . . . . . . . . . . . . . . . . . . . . . 7-15Analysis Log . . . . . . . . . . . . . . . . . . . . . . . . . . . . . . . . . . . . 7-16Isotherm Plot . . . . . . . . . . . . . . . . . . . . . . . . . . . . . . . . . . . . 7-17BET Surface Area Report . . . . . . . . . . . . . . . . . . . . . . . . . . . . . 7-18BET Surface Area Plot . . . . . . . . . . . . . . . . . . . . . . . . . . . . . . . 7-19Langmuir Surface Area Plot . . . . . . . . . . . . . . . . . . . . . . . . . . . . 7-20t-Plot Report . . . . . . . . . . . . . . . . . . . . . . . . . . . . . . . . . . . . . 7-21t-Plot Graph . . . . . . . . . . . . . . . . . . . . . . . . . . . . . . . . . . . . . 7-22Alpha-S Method . . . . . . . . . . . . . . . . . . . . . . . . . . . . . . . . . . . 7-23f-Ratio Method . . . . . . . . . . . . . . . . . . . . . . . . . . . . . . . . . . . 7-24BJH Adsorption: Pore Distribution Report . . . . . . . . . . . . . . . . . . . . 7-25BJH Adsorption: Cumulative Pore Volume Plot . . . . . . . . . . . . . . . . . 7-26BJH Adsorption: dV/dD Pore Volume . . . . . . . . . . . . . . . . . . . . . . . 7-27BJH Adsorption: dV/dlog(D) Pore Volume . . . . . . . . . . . . . . . . . . . . 7-28BJH Adsorption: Cumulative Pore Area Plot . . . . . . . . . . . . . . . . . . . 7-29BJH Adsorption: dA/dD Pore Area Plot . . . . . . . . . . . . . . . . . . . . . . 7-30Summary Report . . . . . . . . . . . . . . . . . . . . . . . . . . . . . . . . . . 7-31Sample Log Report . . . . . . . . . . . . . . . . . . . . . . . . . . . . . . . . . 7-32
8. OPTIONS MENU
Description . . . . . . . . . . . . . . . . . . . . . . . . . . . . . . . . . . . . . . . . 8-1Option Presentation . . . . . . . . . . . . . . . . . . . . . . . . . . . . . . . . . . . 8-3
Advanced . . . . . . . . . . . . . . . . . . . . . . . . . . . . . . . . . . . . . . 8-4Basic . . . . . . . . . . . . . . . . . . . . . . . . . . . . . . . . . . . . . . . . . 8-5Restricted . . . . . . . . . . . . . . . . . . . . . . . . . . . . . . . . . . . . . . 8-6
Table of Contents TriStar 3000
iv Feb 03
Data Presentaton . . . . . . . . . . . . . . . . . . . . . . . . . . . . . . . . . . . . 8-7Sample Defaults . . . . . . . . . . . . . . . . . . . . . . . . . . . . . . . . . . . . . 8-8
Basic . . . . . . . . . . . . . . . . . . . . . . . . . . . . . . . . . . . . . . . . . 8-8Advanced . . . . . . . . . . . . . . . . . . . . . . . . . . . . . . . . . . . . . . 8-11
System Configuration . . . . . . . . . . . . . . . . . . . . . . . . . . . . . . . . . . 8-14Parameter Files Directory . . . . . . . . . . . . . . . . . . . . . . . . . . . . . . . 8-15Service Test Mode . . . . . . . . . . . . . . . . . . . . . . . . . . . . . . . . . . . 8-16
9. TROUBLESHOOTING AND MAINTENANCE
Cleaning the Analyzer . . . . . . . . . . . . . . . . . . . . . . . . . . . . . . . . . 9-1Replacing Port Frit and O-ring . . . . . . . . . . . . . . . . . . . . . . . . . . . . . 9-2Calibrating the System . . . . . . . . . . . . . . . . . . . . . . . . . . . . . . . . . 9-3
Zero pressure . . . . . . . . . . . . . . . . . . . . . . . . . . . . . . . . . . . . 9-3Pressure scale . . . . . . . . . . . . . . . . . . . . . . . . . . . . . . . . . . . . 9-4Servo valve . . . . . . . . . . . . . . . . . . . . . . . . . . . . . . . . . . . . . 9-5Temperature . . . . . . . . . . . . . . . . . . . . . . . . . . . . . . . . . . . . . 9-5Volume . . . . . . . . . . . . . . . . . . . . . . . . . . . . . . . . . . . . . . . 9-7
10. ORDERING INFORMATION
APPENDICES
Appendix A: FormsAppendix B: Error MessagesAppendix C: Calculations
Saturation Pressure (Po) . . . . . . . . . . . . . . . . . . . . . . . . . . . . . . C-1Relative Pressure Calculations . . . . . . . . . . . . . . . . . . . . . . . . . . . C-1Volume Adsorbed Calculations . . . . . . . . . . . . . . . . . . . . . . . . . . C-3
Free Space . . . . . . . . . . . . . . . . . . . . . . . . . . . . . . . . . . . C-3Measured, Calculated, and Entered . . . . . . . . . . . . . . . . . . . . C-3Quasi Gemini . . . . . . . . . . . . . . . . . . . . . . . . . . . . . . . C-6
Equilibration . . . . . . . . . . . . . . . . . . . . . . . . . . . . . . . . . . . . C-7BET Surface Area Calculations2 . . . . . . . . . . . . . . . . . . . . . . . . . . C-8Langmuir Surface Area Calculations . . . . . . . . . . . . . . . . . . . . . . . C-9t-Plot Calculations4 . . . . . . . . . . . . . . . . . . . . . . . . . . . . . . . . . C-11BJH Pore Volume and Area Distribution Calculations . . . . . . . . . . . . . . C-13
Explanation of Terms . . . . . . . . . . . . . . . . . . . . . . . . . . . . . C-13Calculations . . . . . . . . . . . . . . . . . . . . . . . . . . . . . . . . . . . C-14Compendium of Variables . . . . . . . . . . . . . . . . . . . . . . . . . . . C-22
Dubinin-Radushkevich Calculations . . . . . . . . . . . . . . . . . . . . . . . . C-23Dubinin-Astakhov Calculations . . . . . . . . . . . . . . . . . . . . . . . . . . C-25MP-Method Calculations . . . . . . . . . . . . . . . . . . . . . . . . . . . . . . C-29Summary Page . . . . . . . . . . . . . . . . . . . . . . . . . . . . . . . . . . . C-32References . . . . . . . . . . . . . . . . . . . . . . . . . . . . . . . . . . . . . C-33
TriStar 3000 Table of Contents
Feb 03 v

Appendix D: Free-space Correction . . . . . . . . . . . . . . . . . . . . . . . . . D-1Measure . . . . . . . . . . . . . . . . . . . . . . . . . . . . . . . . . . . . . . . D-2Quasi-Gemini . . . . . . . . . . . . . . . . . . . . . . . . . . . . . . . . . . . . D-2Calculate . . . . . . . . . . . . . . . . . . . . . . . . . . . . . . . . . . . . . . . D-3Enter . . . . . . . . . . . . . . . . . . . . . . . . . . . . . . . . . . . . . . . . . D-3
Appendix E: Maintaining High Purity Gases . . . . . . . . . . . . . . . . . . . . E-1Using Metal Gas Lines . . . . . . . . . . . . . . . . . . . . . . . . . . . . . . . E-1Removing Trapped Air . . . . . . . . . . . . . . . . . . . . . . . . . . . . . . . E-1
Purge Method . . . . . . . . . . . . . . . . . . . . . . . . . . . . . . . . . . E-2Evacuation Method . . . . . . . . . . . . . . . . . . . . . . . . . . . . . . . E-4
Purging the System After Non-use . . . . . . . . . . . . . . . . . . . . . . . . E-6
INDEX
Table of Contents TriStar 3000
vi Feb 03
CHAPTER 1
GENERAL DESCRIPTION
• Organization of the Manual
• Equipment Description
• Specifications

GENERAL DESCRIPTION
This manual describes how to install and operate the TriStar 3000.
Organization of the Manual
This operator’s manual is organized so that all operating procedures are located inChapter 4. Chapters 5, 6, 7, and 8 are reference chapters should you need addi-tional information while performing these procedures.
This manual is divided as follows:
Chapter 1 General Description. Provides a general description of theTriStar 3000 and its features and specifications.
Chapter 2 Installation. Describes how to unpack, inspect, install, and ver-ify operation of the TriStar 3000.
Chapter 3 User Interface. Provides instrument and software interface.
Chapter 4 Operating Procedures. Provides step-by-step procedures forthe operations performed with the TriStar 3000.
Chapter 5 File Menu. Provides a description of the choices available onthe File menu.
Chapter 6 Unit [n] Menu. Provides a description of the choices availableon the Unit menu.
Chapter 7 Reports. Provides a description of the choices available onthe Reports menu.
Chapter 8 Options Menu. Provides a description of the choices availableon the Options menu.
Chapter 9 Troubleshooting and Maintenance. Provides user mainte-nance and service information.
Chapter 10 Ordering Information. Provides ordering informationfor TriStar system components.
Appendix A Forms. Contains forms you may use to record informationprior to entering it into the system.
TriStar 3000 Organization of the Manual
Feb 03 1-1

Appendix B Error Messages. Lists the error messages that may be dis-played by the software and includes a cause and action foreach.
Appendix C Calculations. Provides the calculations used by the TriStar pro-gram.
Appendix D Free-space Correction. Provides a discussion of the free-space measurements available with TriStar.
Conventions
This manual uses the symbols shown below to identify notes of importance, cau-tions, and warnings.
Notes contain a tip or important information pertinent to the subject matter.
Cautions contain information to help you prevent actions which could damagethe instrument.
Warnings contain information to help you prevent actions which could cause per-sonal injury.
Organization of the Manual TriStar 3000
1-2 Feb 03

Equipment Description
The TriStar 3000 is an automated gas adsorption analyzer which contains threeports, allowing you to analyze up to three samples simultaneously. Or you can useport 2 for measuring the free space using the Quasi-Gemini method and/or port 3to measure the saturation pressure (Po) on a continuous basis. You can operate upto four TriStar analyzers with one control module (computer). The TriStar 3000system consists of the TriStar analyzer, a SmartPrep degasser (optional) for prepar-ing samples, a vacuum pump, and a control module for entering analysis and re-port options.
Figure 1-1. TriStar Analyzer
SmartPrep Degasser
The SmartPrep is a flowing-gas, degassing unit which removes adsorbed contami-nants from the surface and pores of your sample in preparation for analysis. It con-tains six sample ports, each one independently controlled for greater flexibility. Itcontains two serial ports, one for connecting to the control module and the otheravailable for connecting an additional SmartPrep. In fact, you can connect up to 4SmartPreps, one to the other, allowing the capability of up to 24 preparation portsat one time! The SmartPrep is the recommended degassing unit for the TriStar3000; however, you may furnish your own degassing method if desired. Chapter10 provides ordering information for the SmartPrep.
TriStar 3000 Equipment Description
Feb 03 1-3

Vacuum Pump
A vacuum pump is required for sample analysis with the TriStar analyzer. A re-cessed cavity is provided at the rear of the instrument for its placement.
Vacuum pumps used with the TriStar must meet the following criteria. They must:
• be able to achieve vacuums better than 20 µmHg at the instrument inlet
• contain an anti-suckback valve to prevent vacuum pump oil from backing upinto the analyzer in the event of a vacuum pump failure
• contain an NW16 inlet port for connection to the TriStar
An appropriate vacuum pump is available from Micromeritics. (Refer to Chapter10 for ordering information.)
Equipment Description TriStar 3000
1-4 Feb 03

Analysis Program
The TriStar 3000 analysis program is designed to operate in the Windows® envi-ronment. This makes operation of the TriStar 3000 easier and allows you to runother applications while an automatic operation is in progress. If you are new toWindows, you should learn some basic Windows skills, such as using the mouseand choosing commands. Brief operating instructions are provided in Using theSoftware in Chapter 3. For more specific instructions, refer to the Windows oper-ating manual or to the online tutorial.
Report System
The TriStar software includes a report system which allows you to manipulate andcustomize reports. You can zoom in on portions of the graphs or shift the axes toexamine fine details. Scalable graphs can be copied to the clipboard and pastedinto other applications. Reports can be customized with your choice of fonts and acompany logo added to the report header for an impressive presentation. Refer toChapter 7 for the options available for reports.
Online Help
An extensive online help system is provided for quick-and-easy access to a sub-ject matter. The TriStar help system functions in the same manner as most otherhelp systems. You can choose a subject from the Contents window where topicsare organized in “books,” locate your topic using the Index window where topicsare listed alphabetically by key words, or search for information on a specifictopic using the Find window.
TriStar 3000 Equipment Description
Feb 03 1-5

Specifications
The TriStar 3000 has been designed and tested to meet the specifications providedbelow.
Characteristic Specification
——————— PRESSURE MEASUREMENT ———————
Range: 0 to 999 mmHg
Resolution: Within 0.05 mmHg
Accuracy: Within 0.5% of full scale
Linearity: Within 0.25% of full scale (transducermanufacturer’s specification)
——————— MANIFOLD TEMPERATURE ———————
Accuracy: ± 0.25°C
Resolution: Within 0.1°C
—————— VACUUM SYSTEM ———————
Vacuum Pump: One required; 20 µmHg (maximum) with anti-suckback valve (May be purchased fromMicromeritics or supplied by user.)
—————— ENVIRONMENT ———————
Temperature: 10 to 35°C, operating; 0 to 50°C, nonoperating
Humidity: 20 to 80% relative, noncondensing
——————— ELECTRICAL ———————
Voltage: 85 to 265 VAC
Frequency: 50/60 Hz
Power: 300 VA, maximum (110 VA for TriStar plus 190 VAfor vacuum pump)
——————— PHYSICAL ———————
Height: 76 cm (30 in.)
Width: 64 cm (25 in.)
Depth: 53 cm (21 in.)
Weight: 45 kg (100 lbs)
Specifications TriStar 3000
1-6 Feb 03
CHAPTER 2
INSTALLATION
• Unpacking and Inspecting the Equipment
• Installing the Analyzer
• Installing the Software
• Specifying Gas Ports

INSTALLATION
This chapter describes how to:
• Unpack and inspect the equipment• Install the TriStar system• Verify operation of the system
Initially, your TriStar 3000 will be installed and verified for operation by anauthorized Micromeritics service representative or a representative of aMicromeritics distributor. Installation instructions are provided in this manual incase the TriStar has to be relocated or reinstalled after a factory repair.
Unpacking and Inspecting the Equipment
When you unpack the shipping cartons, carefully compare the packing list withthe equipment actually received and check the equipment for any damage duringshipment. Be sure to sift through all packing materials before declaring equipmentmissing.
If you need to declare equipment as damaged or lost, save the shipping cartons.The claims investigator must examine the cartons in order to complete the in-spection report.
Equipment Damage or Loss During Shipment
If equipment is damaged or lost in transit, you are required to make note of thedamage or loss on the freight bill. The freight carrier, not Micromeritics, is respon-sible for all damage or loss occurring during shipment. If you discover damage orloss of equipment during shipment, report the condition to the carrier immediately.
Equipment Return
Micromeritics strives to ensure that all items arrive safely and in working order.Occasionally, due to circumstances beyond our control, a customer may receiveequipment which is not in working order. When equipment has been damaged(either during shipment or in use) and you wish to return the equipment to Mi-cromeritics for repair or replacement, follow the steps below:
1. Pack the instrument in its original shipping carton if possible. If the originalcarton is unavailable, for a nominal fee, Micromeritics can provide anothercarton for your use.
TriStar 3000 Unpacking and Inspecting the Equipment
Feb 03 2-1

Failure to package your instrument properly may result in shipping damage.
2. Tag or otherwise identify the defective equipment, noting the defect and cir-cumstances, if any, the circumstances under which the defect occurred.
3. Reference the sales order or purchase order for the equipment, and providethe date the equipment was received.
4. Notify the Micromeritics Service Department of the defect and request ship-ping instructions. The Service Department will assign a Returned MaterialsAuthorization (RMA) number. Write the RMA number on the outside of thecarton.
Unpacking and Inspecting the Equipment TriStar 3000
2-2 Feb 03
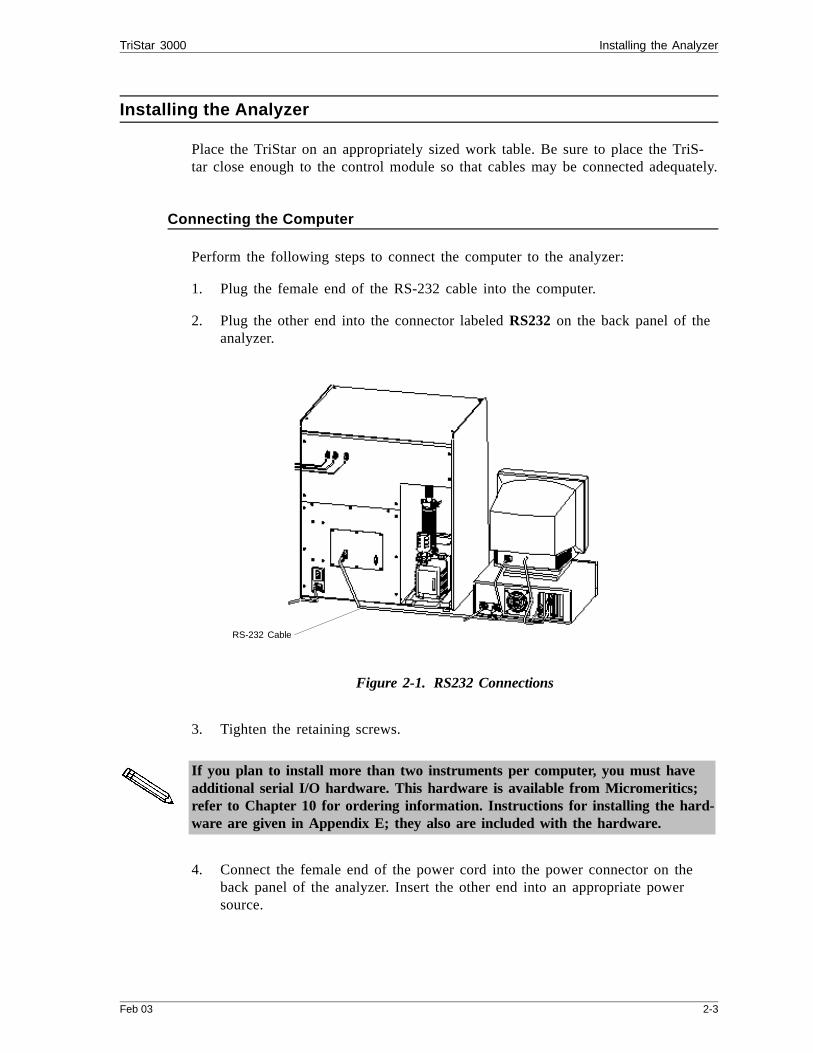
Installing the Analyzer
Place the TriStar on an appropriately sized work table. Be sure to place the TriS-tar close enough to the control module so that cables may be connected adequately.
Connecting the Computer
Perform the following steps to connect the computer to the analyzer:
1. Plug the female end of the RS-232 cable into the computer.
2. Plug the other end into the connector labeled RS232 on the back panel of theanalyzer.
Figure 2-1. RS232 Connections
3. Tighten the retaining screws.
If you plan to install more than two instruments per computer, you must haveadditional serial I/O hardware. This hardware is available from Micromeritics;refer to Chapter 10 for ordering information. Instructions for installing the hard-ware are given in Appendix E; they also are included with the hardware.
4. Connect the female end of the power cord into the power connector on theback panel of the analyzer. Insert the other end into an appropriate powersource.
RS-232 Cable
TriStar 3000 Installing the Analyzer
Feb 03 2-3
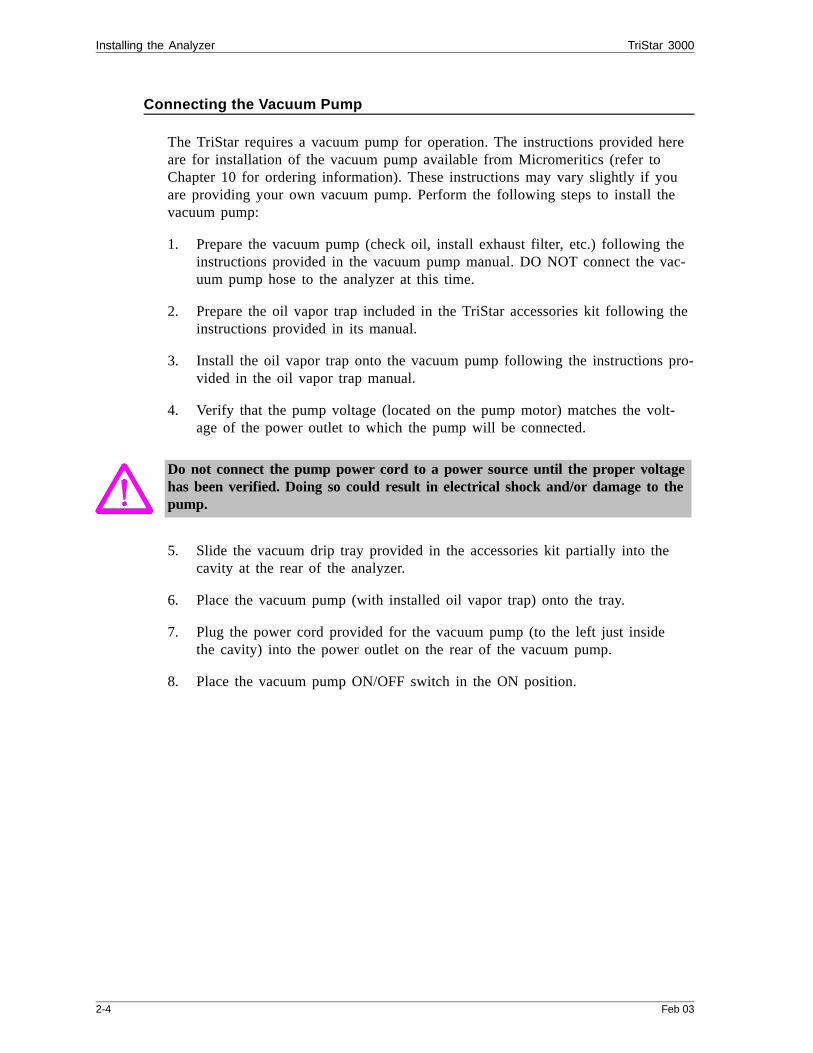
Connecting the Vacuum Pump
The TriStar requires a vacuum pump for operation. The instructions provided hereare for installation of the vacuum pump available from Micromeritics (refer toChapter 10 for ordering information). These instructions may vary slightly if youare providing your own vacuum pump. Perform the following steps to install thevacuum pump:
1. Prepare the vacuum pump (check oil, install exhaust filter, etc.) following theinstructions provided in the vacuum pump manual. DO NOT connect the vac-uum pump hose to the analyzer at this time.
2. Prepare the oil vapor trap included in the TriStar accessories kit following theinstructions provided in its manual.
3. Install the oil vapor trap onto the vacuum pump following the instructions pro-vided in the oil vapor trap manual.
4. Verify that the pump voltage (located on the pump motor) matches the volt-age of the power outlet to which the pump will be connected.
Do not connect the pump power cord to a power source until the proper voltagehas been verified. Doing so could result in electrical shock and/or damage to thepump.
5. Slide the vacuum drip tray provided in the accessories kit partially into thecavity at the rear of the analyzer.
6. Place the vacuum pump (with installed oil vapor trap) onto the tray.
7. Plug the power cord provided for the vacuum pump (to the left just insidethe cavity) into the power outlet on the rear of the vacuum pump.
8. Place the vacuum pump ON/OFF switch in the ON position.
Installing the Analyzer TriStar 3000
2-4 Feb 03
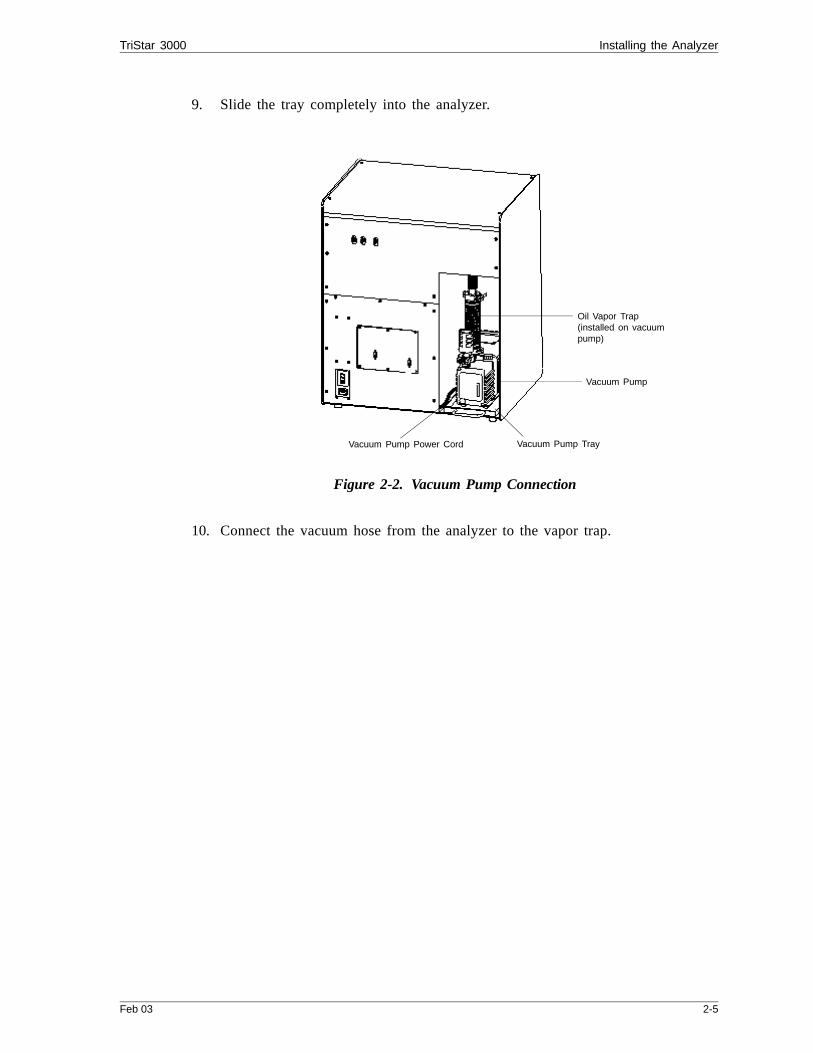
9. Slide the tray completely into the analyzer.
Figure 2-2. Vacuum Pump Connection
10. Connect the vacuum hose from the analyzer to the vapor trap.
Oil Vapor Trap(installed on vacuumpump)
Vacuum Pump
Vacuum Pump Power Cord Vacuum Pump Tray
TriStar 3000 Installing the Analyzer
Feb 03 2-5
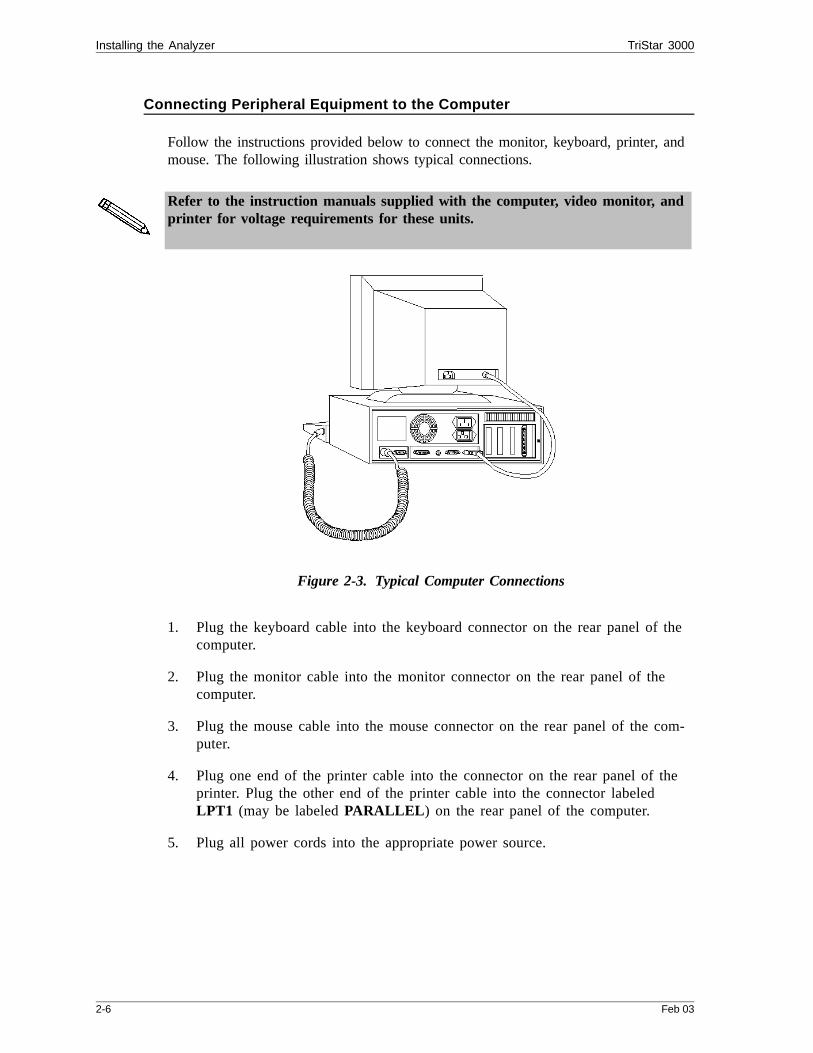
Connecting Peripheral Equipment to the Computer
Follow the instructions provided below to connect the monitor, keyboard, printer, andmouse. The following illustration shows typical connections.
Refer to the instruction manuals supplied with the computer, video monitor, andprinter for voltage requirements for these units.
Figure 2-3. Typical Computer Connections
1. Plug the keyboard cable into the keyboard connector on the rear panel of thecomputer.
2. Plug the monitor cable into the monitor connector on the rear panel of thecomputer.
3. Plug the mouse cable into the mouse connector on the rear panel of the com-puter.
4. Plug one end of the printer cable into the connector on the rear panel of theprinter. Plug the other end of the printer cable into the connector labeledLPT1 (may be labeled PARALLEL) on the rear panel of the computer.
5. Plug all power cords into the appropriate power source.
Installing the Analyzer TriStar 3000
2-6 Feb 03
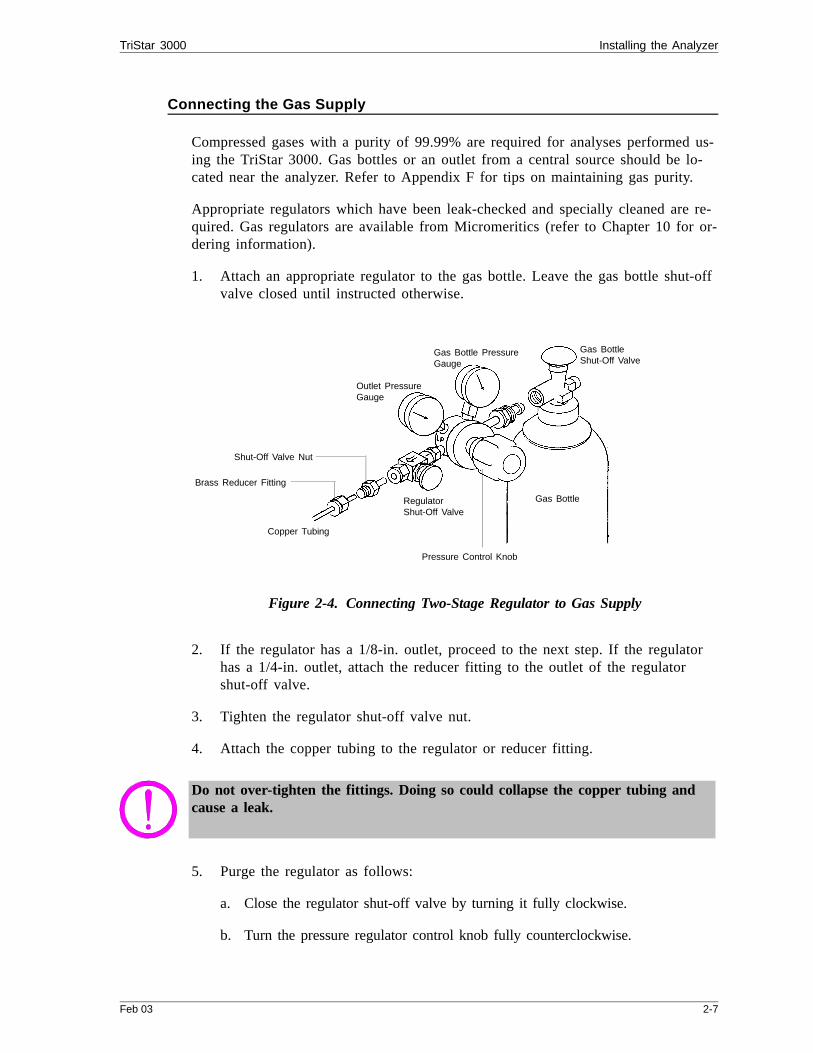
Connecting the Gas Supply
Compressed gases with a purity of 99.99% are required for analyses performed us-ing the TriStar 3000. Gas bottles or an outlet from a central source should be lo-cated near the analyzer. Refer to Appendix F for tips on maintaining gas purity.
Appropriate regulators which have been leak-checked and specially cleaned are re-quired. Gas regulators are available from Micromeritics (refer to Chapter 10 for or-dering information).
1. Attach an appropriate regulator to the gas bottle. Leave the gas bottle shut-offvalve closed until instructed otherwise.
Figure 2-4. Connecting Two-Stage Regulator to Gas Supply
2. If the regulator has a 1/8-in. outlet, proceed to the next step. If the regulatorhas a 1/4-in. outlet, attach the reducer fitting to the outlet of the regulatorshut-off valve.
3. Tighten the regulator shut-off valve nut.
4. Attach the copper tubing to the regulator or reducer fitting.
Do not over-tighten the fittings. Doing so could collapse the copper tubing andcause a leak.
5. Purge the regulator as follows:
a. Close the regulator shut-off valve by turning it fully clockwise.
b. Turn the pressure regulator control knob fully counterclockwise.
Regulator Shut-Off Valve
Pressure Control Knob
Gas Bottle
Gas BottleShut-Off Valve
Shut-Off Valve Nut
Outlet PressureGauge
Copper Tubing
Brass Reducer Fitting
Gas Bottle PressureGauge
TriStar 3000 Installing the Analyzer
Feb 03 2-7
c. Open the gas bottle valve by turning it counterclockwise, then close the gasbottle valve.
d. Observe the outlet pressure gauge. If the pressure decreases, tighten the nutconnecting the regulator to the gas bottle. If the pressure is stable, proceedto Step e.
e. Turn each pressure regulator control knob clockwise until the outlet pressuregauge indicates 15 psig (1.0 bar). Open each regulator shut-off valve by turn-ing it counterclockwise briefly. Then close each valve.
f. Make sure the gas bottle valve is completely closed.
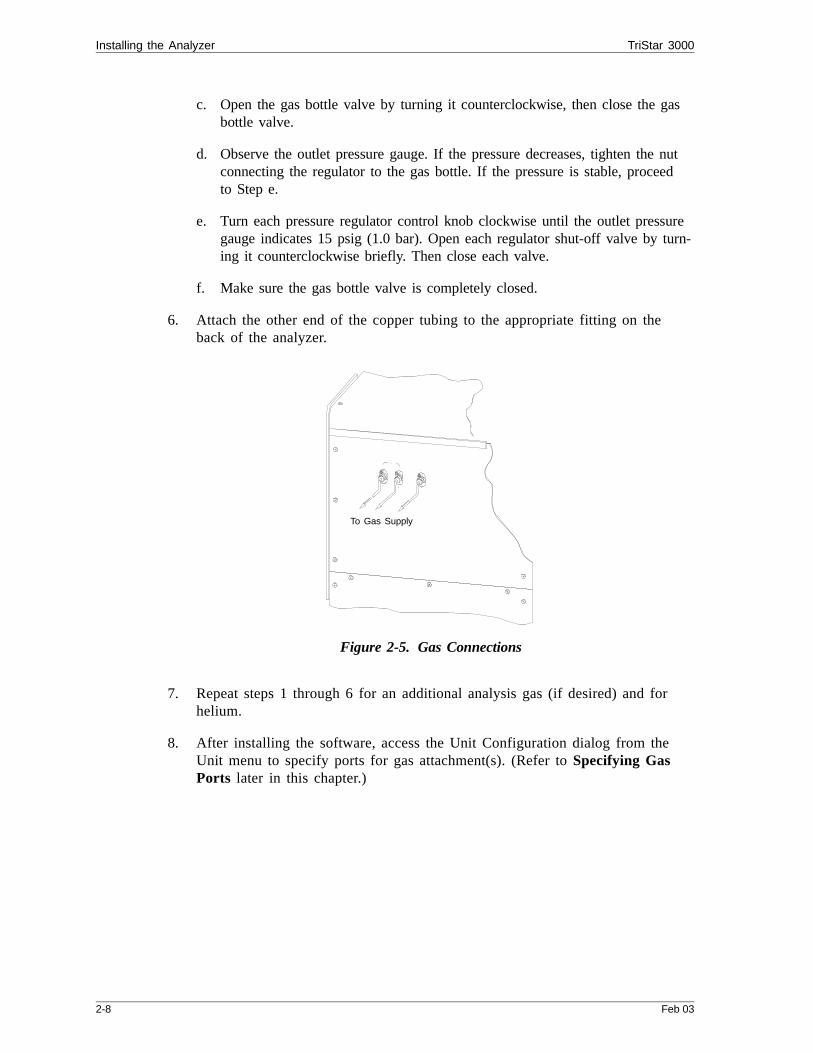
6. Attach the other end of the copper tubing to the appropriate fitting on theback of the analyzer.
Figure 2-5. Gas Connections
7. Repeat steps 1 through 6 for an additional analysis gas (if desired) and forhelium.
8. After installing the software, access the Unit Configuration dialog from theUnit menu to specify ports for gas attachment(s). (Refer to Specifying GasPorts later in this chapter.)
To Gas Supply
Installing the Analyzer TriStar 3000
2-8 Feb 03

Installing the SmartPrep Degasser
Refer to the SmartPrep operator’s manual for installation instructions. When youinstall the SmartPrep, a menu item entitled “SmartPrep” is added to the mainmenu bar of the TriStar, allowing you complete control of the SmartPrep throughthe TriStar program.
TriStar 3000 Installing the Analyzer
Feb 03 2-9
Installing the Software
Your system must meet or exceed the following requirements before you caninstall the TriStar 3000 analysis program:
• Pentium 333MHz computer (or equivalent)• CD-ROM drive• 128 megabytes of main memory• 1-gigabyte hard drive• SVGA monitor (800 x 600 minimum resolution)• Windows 2000 or Windows XP Professional
The TriStar analysis program is also available as a standalone option so that youcan install it on a computer other than the one controlling the analyzer. This al-lows you to:
• create or edit sample and parameter files• generate reports on completed sample files
Review the Micromeritics PROGRAM License Agreement for restrictions on theuse of another copy.
Initial Installation
The TriStar analysis program is supplied on a CD. Perform the following steps toinstall the program:
1. Turn on the analyzer.
2. Insert the program CD into your CD-ROM drive.
3. Select Start from the Status bar, then Run from the Start menu.
4. Enter the name of the drive designator, followed by setup. For example:
e:setup
5. Click ; the New Installation dialog is displayed.OK
Installing the Software TriStar 3000
2-10 Feb 03
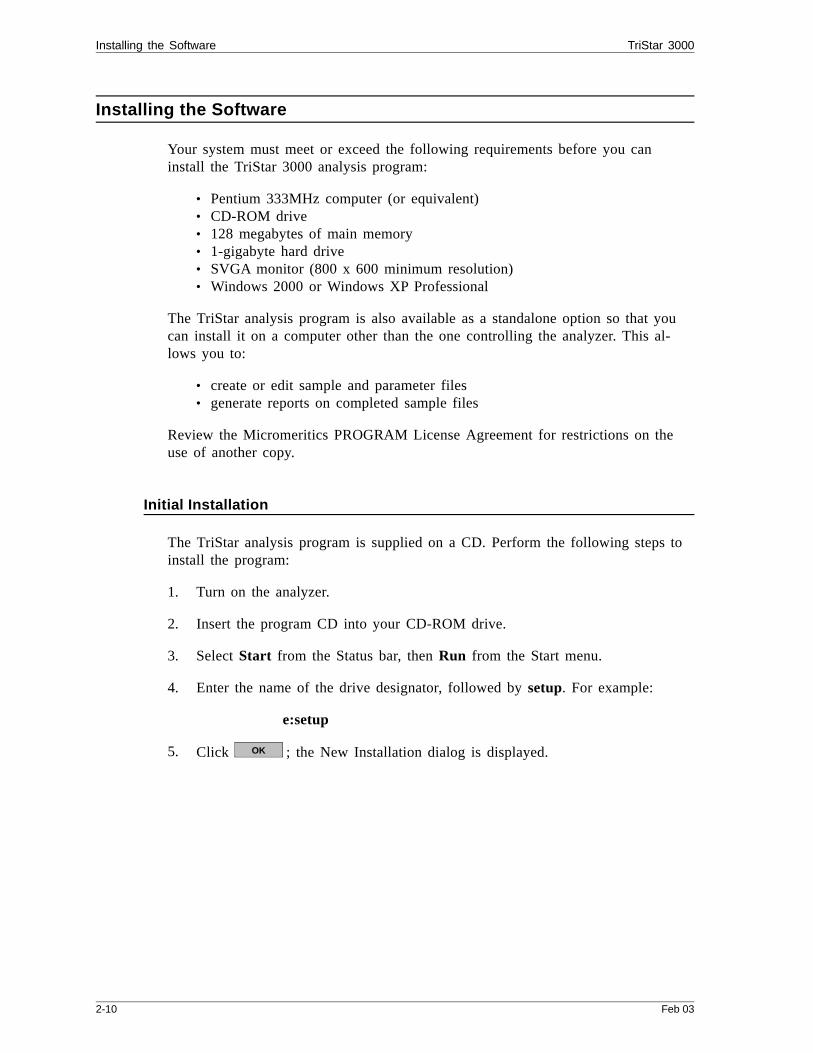
You may cancel the installation at any time by selecting . If you do so,you must start the installation program from the beginning to install the analysisprogram.
The Destination Folder group box displays the amount of current disk space,the amount of disk space required for the analysis program, and the directoryinto which the application will be installed. If you wish to install the applica-tion into a different directory, click to choose the directory.
6. If you want to run the application from the desktop, select the checkbox justbelow the Destination Folder group box to add an icon to the desktop.
7. The TriStar 3000 icon is added to the Micromeritics folder by default. If youprefer a different folder, enter or select one from the drop-down list.
Exit
Browse
Displays the amount of currentdisk space and the amountrequired for installation of theapplication. Also displays thedirectory into which theapplication will be installed.
Select this option to add theTriStar 3000 icon to yourdesktop for quick access tothe application.
TriStar 3000 Installing the Software
Feb 03 2-11

8. Click ; the Analyzer Configuration dialog is displayed.
9. In the Step 1 group box, click the radio button for the number of analyzersto be attached to this computer. If you are attaching multiple analyzers, makesure your computer has sufficient serial ports. Additional hardware may be re-quired (refer to Chapter 10 for ordering information).
Choose 0 (zero) if you are installing this program for data reduction on a com-puter other than the one controlling the analyzer.
10. In the Step 2 group box, enter the serial number(s) for the analyzer(s) youare attaching to this computer.
11. Click ; the Calibration File Installation dialog is displayed. Read theinformation in the dialog(s) and proceed accordingly.
If you selected zero (0) as the number of instruments to install, the Calibrationdialog is not displayed.
12. After the calibration files are installed, the Installation Complete dialog boxcontaining the Readme file is displayed.
13. Use the scroll bar if you wish to read the contents of the file, then click to close the dialog.
14. Remove the Setup CD and store in a safe place. The original Setup CD con-tains the calibration files specific to your instrument. Upgrade CDs do notcontain calibration files. Therefore, it is important that you maintain youroriginal Setup CD in a secure location in the event calibration files need tobe reinstalled.
Next
Next
Finish
2-12 Mar 03
Installing the Software TriStar 3000

Using the Setup Program for Other Functions
After initial installation of the TriStar analysis program, the application setup pro-gram is used to:
• Upgrade software• Add an analyzer• Move an analyzer from one computer to another computer• Remove an analyzer from the computer• Change the analyzer setup• Reinstall calibration files• Uninstall the analysis program
To start the application setup program:
1. Ensure that the analysis program is not operating.
2. Insert the program CD into your CD-ROM drive.
3. Select Start from the Status bar.
4. Select Run from the start menu.
5. Enter the drive designator of the CD-ROM drive, followed by setup. For ex-ample: e:setup.
Alternatively, you can click , navigate to your CD-ROM drive, and se-lect setup.exe.
6. Click ; the setup Welcome screen showing the options available isdisplayed.
Browse
OK
TriStar 3000 Installing the Software
Feb 03 2-13

7. Select the operation you wish to perform. Procedures for performing each op-eration are in subsequent sections.
After the requested operation is completed, the setup Welcome screen is againdisplayed. A confirmation message indicating completion of the operation isshown in the lower section of the dialog.
8. After you have completed all desired operations, click to close thedialog.
Exit
Indicates status oflast operation.
Installing the Software TriStar 3000
2-14 Feb 03
Installing Subsequent Software Versions
When you install a software upgrade, the system installs all of the applicationfiles and any status files that do not already exist on the computer. Existing ana-lyzer status files are not affected and default and data files are not overwritten.There are three types of subsequent installation; the software version controlled bythe setup program is:
• a later version than the version installed on the computer• the same version as the version installed on the computer• an earlier version than the version installed on the computer
The setup program automatically detects which type of installation applies and cus-tomizes the selection in the Setup dialog accordingly.
1. Start the Setup program. Choose the software option; remember, only the ap-plicable option will display; it will be one of the following:
• Upgrade software to version (number) from version (number)• Reinstall software version (number)• Downgrade software to version (number) from version (number)
2. Click ; the application installs the software and redisplays thesetup Welcome dialog.
3. If no other operations are desired using this dialog, click to close thedialog.
Start file installation
Exit
TriStar 3000 Installing the Software
Feb 03 2-15
Adding an Analyzer
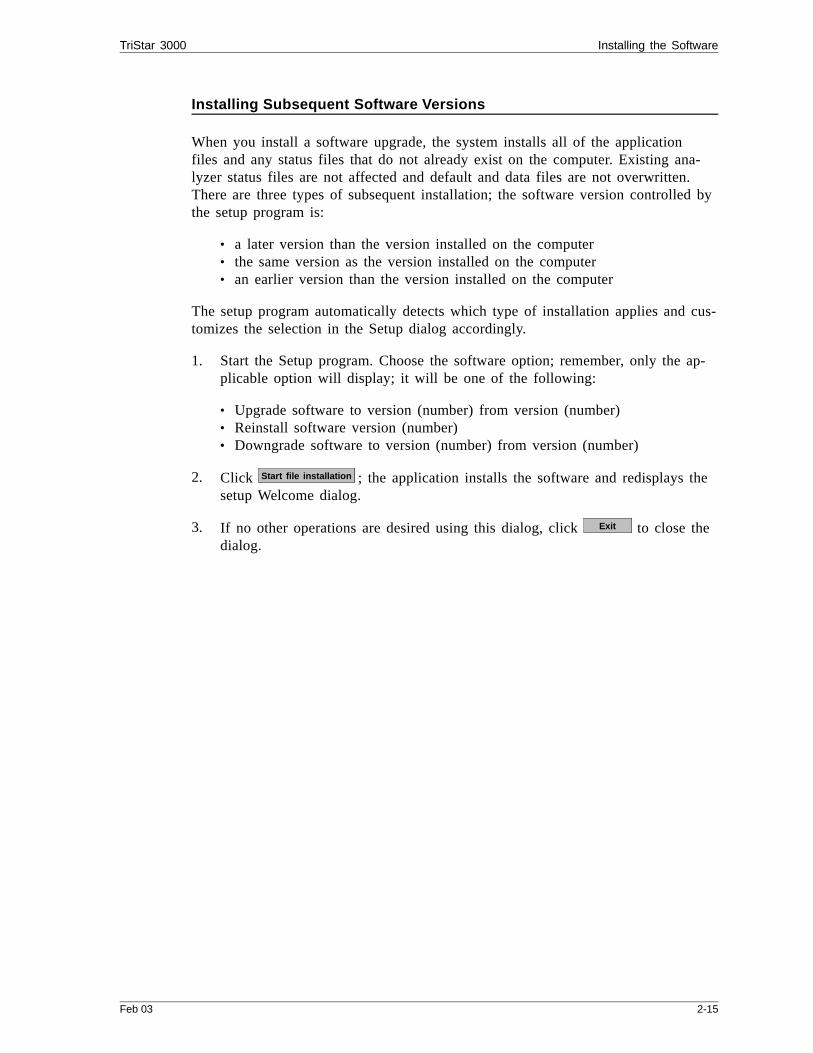
Add an analyzer to the existing application as follows:
1. Start the Setup program. Select Add an analyzer, then click ; theSetup analyzer dialog is displayed:
2. Enter the serial number of the analyzer being added, then the communicationsport to which it is to be connected.
3. Click ; the Calibration Installation dialog is displayed. Read theinformation in the dialog and proceed accordingly.
4. After the calibration files are installed, the setup Welcome dialog is redis-played.
5. If no other operations are desired using this dialog, click to close thedialog.
Next
Next
Exit
Installing the Software TriStar 3000
2-16 Feb 03

Moving an Analyzer from one PC to another PC
You can move an analyzer, along with its status and calibration files, from one com-puter (Source PC) to another computer (Destination PC).
This operation does not move sample or parameter files. To move these files, usea file management program such as Explorer or a backup/restore utility.
1. Install the analysis program on the destination computer. Refer to Initial In-stallation earlier in this chapter. Be sure to select 0 as the number of instru-ments; all related instrument information will be transferred in the Moveoperation.
If the analysis program is already installed on the destination computer, pro-ceed to Step 2.
2. Start the application setup program on the source computer. Refer to Usingthe Setup Program for Other Functions earlier in this chapter.
3. In the Setup dialog, select Move an analyzer from one PC to another PC,then click ; the Move analyzer operation dialog is displayed.
4. Select Source PC, then click ; the following dialog is displayed.
Next
Next
TriStar 3000 Installing the Software
Feb 03 2-17

5. In the Step 1 group box, select the analyzer that is to be moved.
6. In the Step 2 group box, choose a location in which the moved files will bestored. If possible, choose a floppy drive or a shared network drive. If this isnot possible, select a local folder. After the files are placed there, use a foldertransfer utility to copy this folder from the Source PC to the Destination PC.
Calibration files are not included in the moved files. These files must be cop-ied and moved separately to the destination computer. The calibration filesare located in a subdirectory (folder) of the Hardware directory. The subdirec-tory is named 300-(serial number).
7. Click ; the files are moved and the setup Welcome screen is dis-played.
8. Start the application setup program on the destination computer.
9. In the Setup dialog, select Move an analyzer from one PC to another PC;the Move analyzer operation dialog is displayed (shown on previous page).
10. Select Destination PC, then click ; the following dialog is displayed.
Finish
Next
Installing the Software TriStar 3000
2-18 Feb 03

11. In the Step 1 group box, enter the serial number of the analyzer being movedand the communications port to which it will be attached.
12. In the Step 2 group box, click and choose the location of the movedfiles.
13. Click ; the files are moved and the setup Welcome dialog is displayed.
Browse
Finish
TriStar 3000 Installing the Software
Feb 03 2-19

Removing an Analyzer
You can remove an analyzer from the computer as follows. When you remove ananalyzer, the status files are removed as well.
1. Start the Setup program. Refer to Using the Setup Program for Other Func-tions earlier in this chapter.
2. From the Setup dialog, select Remove an analyzer, then click ; theRemove an analyzer dialog is displayed.
3. From the drop-down list, choose the serial number of the analyzer you wantto remove.
4. Click ; the analyzer is removed and the Welcome screen is again dis-played.
5. Click to close the dialog.
Next
Remove
Exit
Installing the Software TriStar 3000
2-20 Feb 03
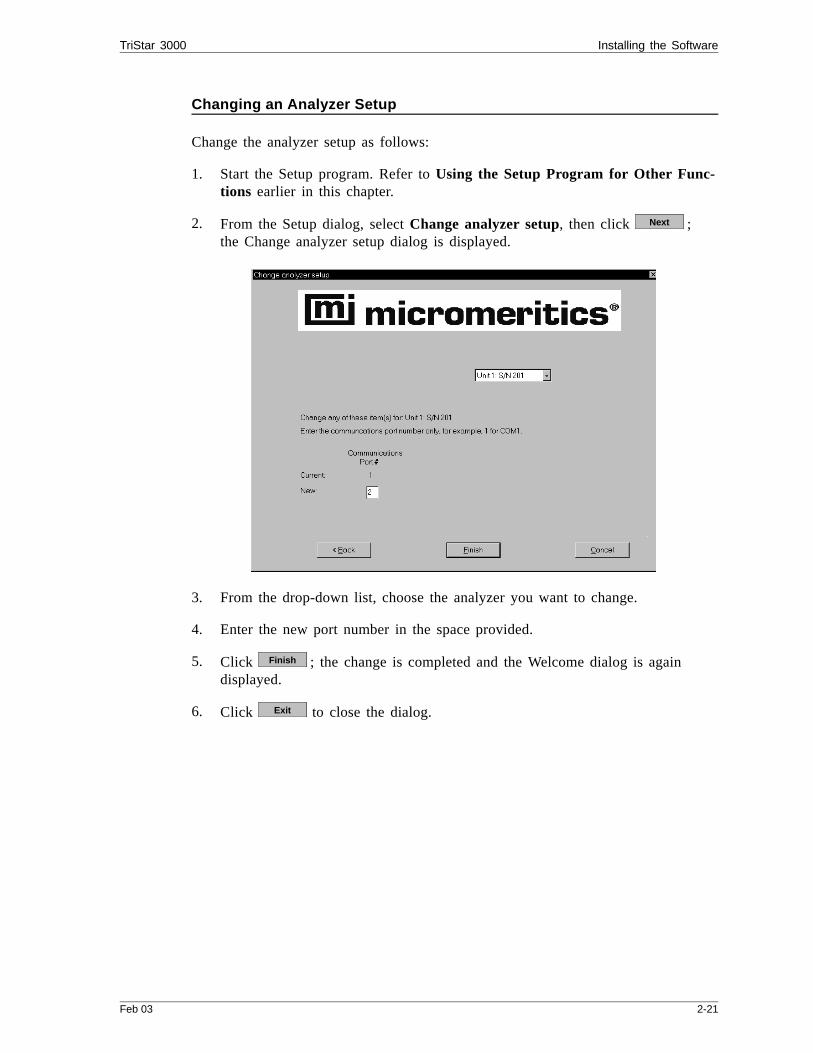
Changing an Analyzer Setup
Change the analyzer setup as follows:
1. Start the Setup program. Refer to Using the Setup Program for Other Func-tions earlier in this chapter.
2. From the Setup dialog, select Change analyzer setup, then click ;the Change analyzer setup dialog is displayed.
3. From the drop-down list, choose the analyzer you want to change.
4. Enter the new port number in the space provided.
5. Click ; the change is completed and the Welcome dialog is againdisplayed.
6. Click to close the dialog.
Next
Finish
Exit
TriStar 3000 Installing the Software
Feb 03 2-21
Reinstalling the Calibration Files
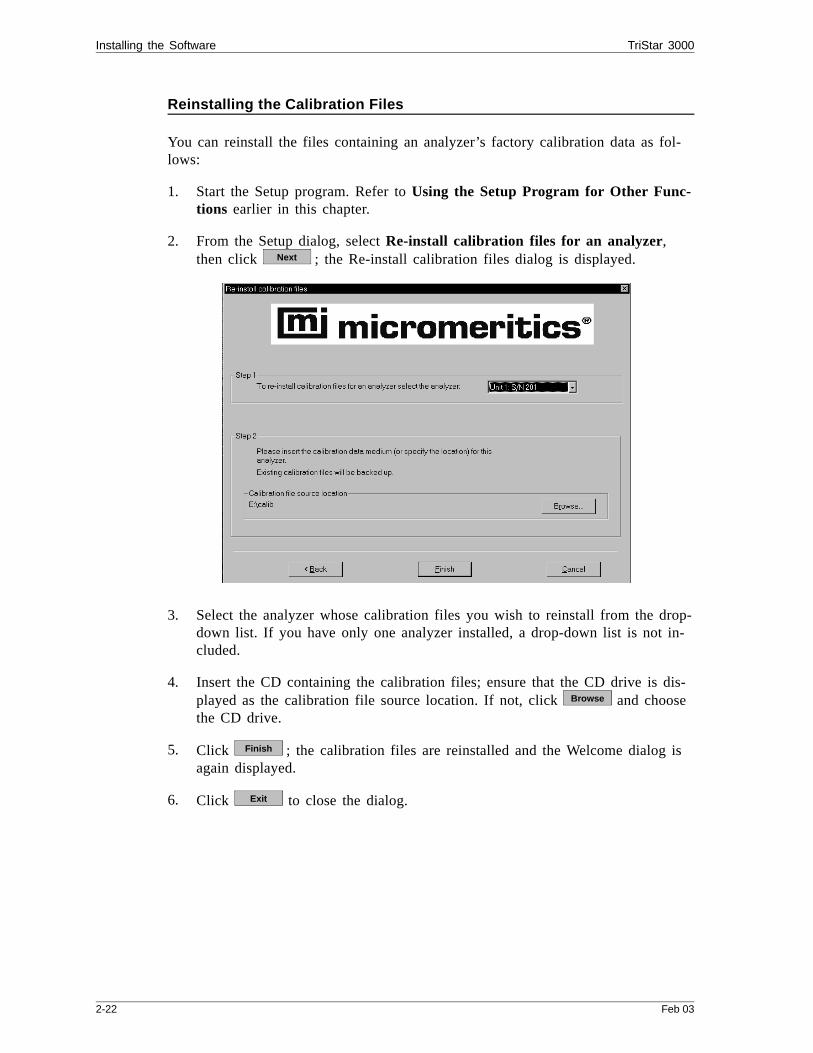
You can reinstall the files containing an analyzer’s factory calibration data as fol-lows:
1. Start the Setup program. Refer to Using the Setup Program for Other Func-tions earlier in this chapter.
2. From the Setup dialog, select Re-install calibration files for an analyzer,then click ; the Re-install calibration files dialog is displayed.
3. Select the analyzer whose calibration files you wish to reinstall from the drop-down list. If you have only one analyzer installed, a drop-down list is not in-cluded.
4. Insert the CD containing the calibration files; ensure that the CD drive is dis-played as the calibration file source location. If not, click and choosethe CD drive.
5. Click ; the calibration files are reinstalled and the Welcome dialog isagain displayed.
6. Click to close the dialog.
Next
Browse
Finish
Exit
Installing the Software TriStar 3000
2-22 Feb 03
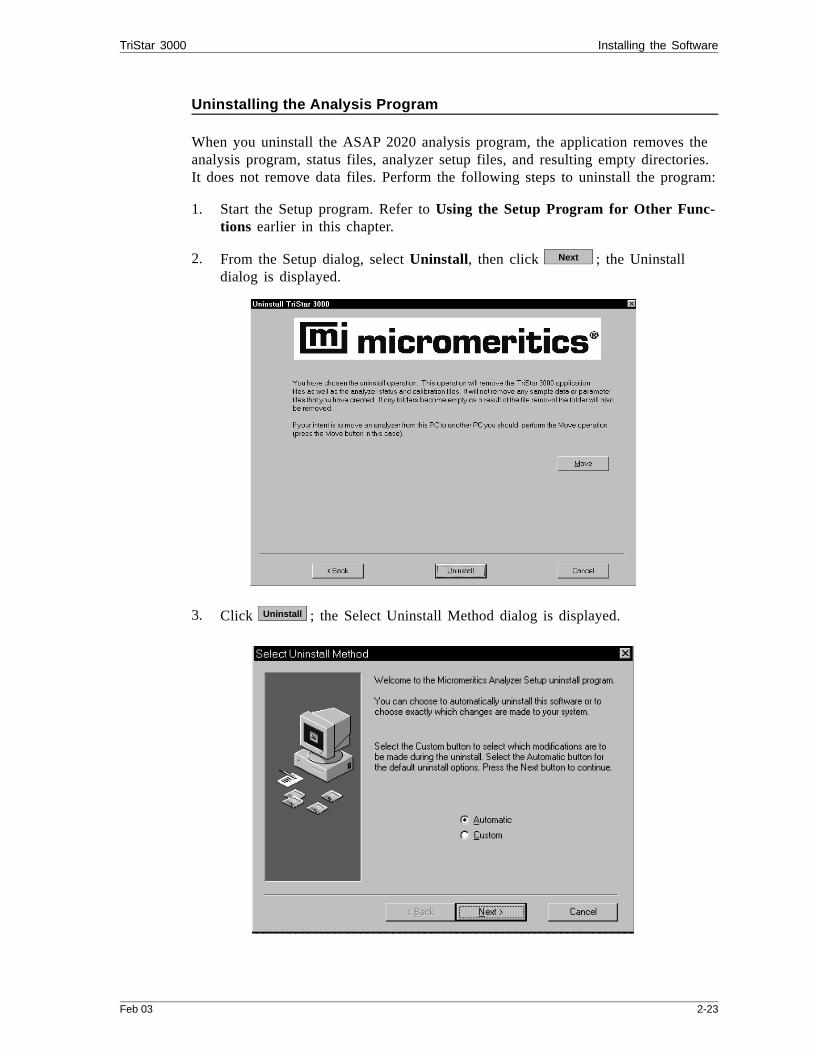
Uninstalling the Analysis Program
When you uninstall the ASAP 2020 analysis program, the application removes theanalysis program, status files, analyzer setup files, and resulting empty directories.It does not remove data files. Perform the following steps to uninstall the program:
1. Start the Setup program. Refer to Using the Setup Program for Other Func-tions earlier in this chapter.
2. From the Setup dialog, select Uninstall, then click ; the Uninstalldialog is displayed.
3. Click ; the Select Uninstall Method dialog is displayed.
Next
Uninstall
TriStar 3000 Installing the Software
Feb 03 2-23

4. Choose one of the following:
• Automatic: click ; the system uninstalls the analysis program auto-matically and the setup Welcome dialog redisplays.
• Custom: click ; a series of dialogs is displayed, allowing you tochoose the files you wish to uninstall. After all files are selected and unin-stalled, the setup Welcome dialog redisplays.
5. Click to close the Welcome dialog.
Next
Next
Exit
Installing the Software TriStar 3000
2-24 Feb 03

Specifying Gas Ports
After you have connected your analysis gas(es) to the analyzer, you must specifywhich gas is connected to each port.
• Valve 7 carries the free-space gas (He) and cannot be changed• Valves 8 and 9 are designated for the analysis gas(es)
Specify gas connections as follows:
1. From the Unit menu, select Unit configuration; the Unit Configuration dia-log box is displayed.
2. In the Gas Selections group box, enter the mnemonic name for the gasinstalled for valve(s) 8 and 9; then click to close the dialog box. OK
TriStar 3000 Specifying Gas Ports
Feb 03 2-25
CHAPTER 3
USER INTERFACE
• Turning the Analyzer On and Off
• Using the Software
• Menu Structure
• Windows Menu
• Help Menu

USER INTERFACE
Turning the Analyzer On and Off
Turning the Analyzer On
1. Place the computer, monitor, and printer ON/OFF switches in the ON position.
2. Place the TriStar analyzer ON/OFF switch in the ON ( | ) position.
3. Place the vacuum pump ON/OFF switch in the ON position. This step is notnecessary if your vacuum pump is connected to the TriStar’s internal vacuumpump cable.
Turning the Analyzer Off
Always exit the analysis program and Windows before turning off the com-puter. Failure to do so could result in loss of data.
1. Select Close from the System menu or Exit from the File menu.
If an analysis is in progress, the following message is displayed:
Instrument is busy. Continue program exit?
Even if you select and the analysis program closes, the analysis con-tinues and data continue to be collected. Reports that are queued under thePrint Manager will print. If, however, a power failure occurs and an uninter-ruptible power supply (UPS) is not attached to the analyzer, the data col-lected after exiting the analysis program are lost.
2. Place the computer, monitor, and printer ON/OFF switches in the OFF posi-tion.
3. Place the TriStar analyzer ON/OFF switch in the OFF position.
4. Place the vacuum pump ON/OFF switch in the OFF position. This step is notnecessary if your vacuum pump is connected to the TriStar’s internal vacuumpump cable.
Yes No
Yes
TriStar 3000 Turning the Analyzer On and Off
Feb 03 3-1
Using the Software
The TriStar 3000 analysis program operates in the Windows environment and re-quires familiarity with standard Windows operations such as using the mouse,menus, and dialog boxes. While this manual provides brief instructions for suchstandard operations, you may have to refer to your Windows documentation or toits online help system to clarify functions which are specific to Windows.
Shortcut Menus
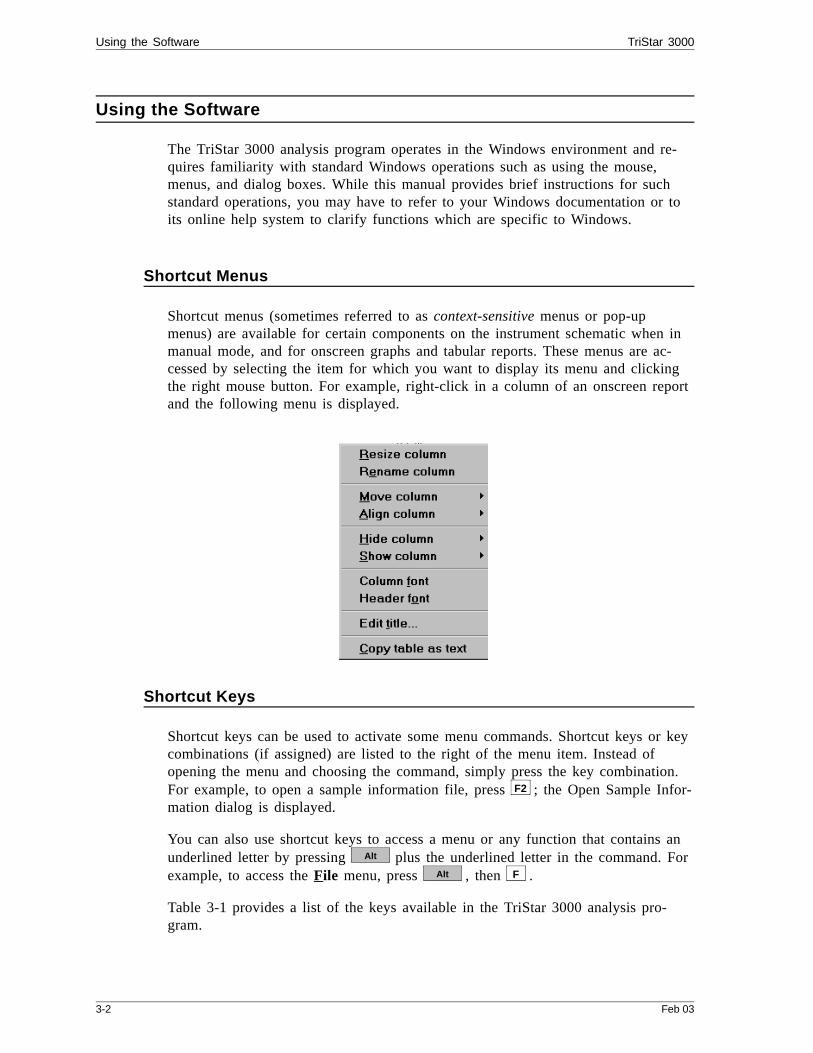
Shortcut menus (sometimes referred to as context-sensitive menus or pop-upmenus) are available for certain components on the instrument schematic when inmanual mode, and for onscreen graphs and tabular reports. These menus are ac-cessed by selecting the item for which you want to display its menu and clickingthe right mouse button. For example, right-click in a column of an onscreen reportand the following menu is displayed.
Shortcut Keys
Shortcut keys can be used to activate some menu commands. Shortcut keys or keycombinations (if assigned) are listed to the right of the menu item. Instead ofopening the menu and choosing the command, simply press the key combination.For example, to open a sample information file, press ; the Open Sample Infor-mation dialog is displayed.
You can also use shortcut keys to access a menu or any function that contains anunderlined letter by pressing plus the underlined letter in the command. Forexample, to access the File menu, press , then .
Table 3-1 provides a list of the keys available in the TriStar 3000 analysis pro-gram.
F2
Alt
Alt F
Using the Software TriStar 3000
3-2 Feb 03
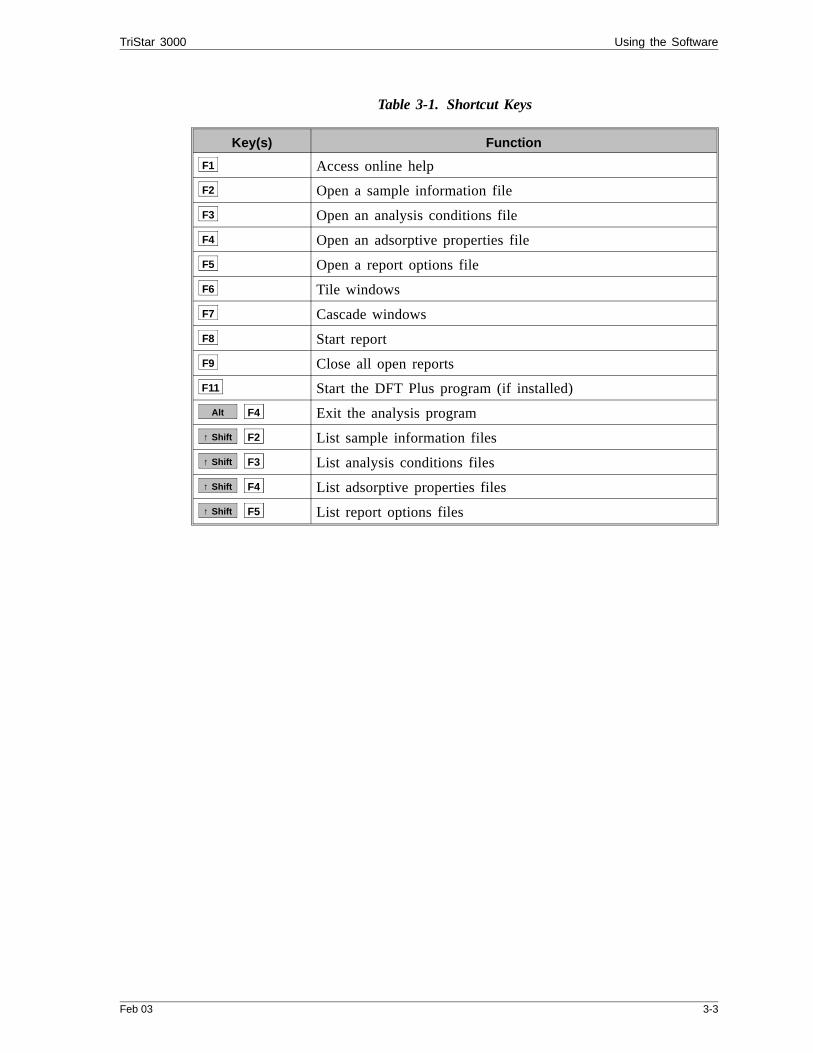
Table 3-1. Shortcut Keys
Key(s) Function
Access online help
Open a sample information file
Open an analysis conditions file
Open an adsorptive properties file
Open a report options file
Tile windows
Cascade windows
Start report
Close all open reports
Start the DFT Plus program (if installed)
Exit the analysis program
List sample information files
List analysis conditions files
List adsorptive properties files
List report options files
F1
F2
F3
F4
F5
F6
F7
F8
F9
F11
Alt F4
↑ Shift F2
↑ Shift F3
↑ Shift F4
↑ Shift F5
TriStar 3000 Using the Software
Feb 03 3-3

Dialog Boxes and Subdialog Boxes
Dialog boxes are displayed when an item followed by an ellipsis (...) is selected.Subdialog boxes are displayed when a push button on a dialog box is selected.Both types of boxes may contain one or more of the following:
Data entry field These fields may be either numeric (numbers only) or al-phanumeric (numbers, letters, or printable characters). Ifyou make an invalid entry in either of these fields, an er-ror message occurs.
Information bar Some dialog boxes contain information pertinent to theselected field in an information bar across the bottom ofthe dialog. For example, a range is shown for fields inwhich numeric entries are required.
List A list contains selections from which you may chooseone or more items. To select an item on the list, positionthe mouse pointer on the desired selection, then double-click. An item is selected if it is preceded with a checkmark.
Indicates itemis selected.
Displays range forselected field.
Using the Software TriStar 3000
3-4 Feb 03

Push Button A push button is used to display subdialog boxes inwhich to enter additional information about the subjectmatter. For example, this push button displays a dialogfor specifying a range of dates (explained later in thischapter).
Push buttons also may be used to invoke an action. Forexample, closes the open dialog box, discardingany information you may have entered.
Radio Button Radio buttons are contained within a group box. Thesebuttons are used to select options; you may choose onlyone item.
Check Box Check boxes also are used to select options. You maymake as many selections as you wish.
Drop-down List A drop-down list is indicated by a down arrow to theright of the field. Drop-down lists contain a list of op-tions from which you may choose one.
Cancel
Down Arrow
TriStar 3000 Using the Software
Feb 03 3-5

Some dialog boxes contain one or both of the following push buttons:
Displays a dialog box which allows you to select a filefor the subject matter.
Allows you to copy file values from an existing file intothe one you are creating. You then can edit the values inthe new file without changing the ones in the originalfile.
Selecting Files
Sample information is stored in files and saved under file names. Certain dialogboxes contain a Files list box, which displays a list of files available for that par-ticular operation. For example, the Open Sample Information dialog box:
From the list of files in the Files list box, move the mouse pointer to the file youwish to open and double-click. If you do not see the desired file, it may be in an-other directory. Go to the Directories list box and choose the correct drive and/ordirectory.
You may limit the list of files displayed in the Files: list box by choosing one ofthe following:
• Use wildcard characters in the path name you enter in the File name field.
Wildcard characters such as * and ? can be used to filter file names. Forexample, you can limit the list of files displayed to those beginning with01 as by entering 01*.smp.
Browse...
Replace...
Choose thedrive/directory.
Click to specify arange of dates.
Choose the fileyou wish to open.
Specify a new Status categoryto limit the files displayed inthe Files: list box.
Using the Software TriStar 3000
3-6 Feb 03

• Enter a range of dates. Select ; the Select Dates dialog is displayed.
Select the Show Date Range radio button. This enables the From and Tofields allowing you to enter a beginning and ending date. Alternatively, youmay double-click in each field to display a calendar to set a date. Therange of dates remains the default until you change the dates or selectShow All Dates.
For convenience, the following function keys are available when the SelectDates dialog box is displayed:
Clears the fieldInserts the current dateDisplays a calendar from which you may select a date
You may change the date format by using the International Date Format func-tion on the Windows Control Panel.
• Select a file status from the Status drop-down list. Table 3-2 describes eachfile status.
Table 3-2. File Status and Description
Status Description
All All sample information files in the specifieddirectory and within the specified range of dates.
Analyzing Sample information files that are currently beingused for analysis or are in the degassing process.
Complete Sample information files that were used in ananalysis that has been completed.
Entered Sample information files that contain manuallyentered data.
No analysis Sample information files that have not been used toperform an analysis.
Prepared Sample information files that have been used in anautomatic degas operation, but not for an analysis.
Preparing Sample information files currently being used in anautomatic degas operation.
Dates...
F2
F3
F4
TriStar 3000 Using the Software
Feb 03 3-7

File Name Conventions
For sample information files, a default file name (the next available sequence num-ber) and a default extension display. For Sample tube, Degas conditions, Analysisconditions, Adsorptive properties, and Report options, only a default extension dis-plays.
The following table shows the file name extensions for the TriStar 3000 analysisprogram.
Table 3-3. Default File Name Extensions
File Type Extension
Sample information SMP
Sample tube STP
Degas conditions DEG
Analysis conditions ANC
Adsorptive properties ADP
Report options RPO
Export to disk (ASCII) EXP
Report to disk RPT
List to disk LST
Thickness curve THK
Alpha-s curve ALS
The following types are available for reports saved from theReport window:
Report REP
Spreadsheet XLS
ASCII TXT
Using the Software TriStar 3000
3-8 Feb 03
Menu Structure
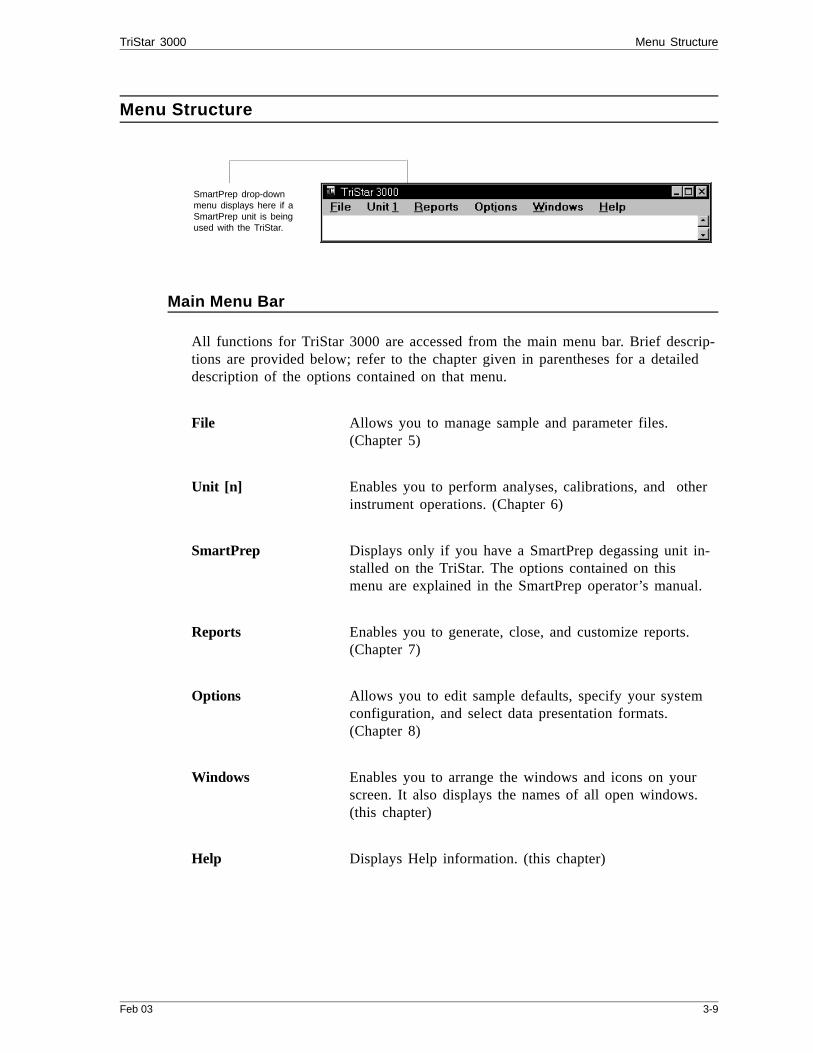
Main Menu Bar
All functions for TriStar 3000 are accessed from the main menu bar. Brief descrip-tions are provided below; refer to the chapter given in parentheses for a detaileddescription of the options contained on that menu.
File Allows you to manage sample and parameter files.(Chapter 5)
Unit [n] Enables you to perform analyses, calibrations, and otherinstrument operations. (Chapter 6)
SmartPrep Displays only if you have a SmartPrep degassing unit in-stalled on the TriStar. The options contained on thismenu are explained in the SmartPrep operator’s manual.
Reports Enables you to generate, close, and customize reports. (Chapter 7)
Options Allows you to edit sample defaults, specify your systemconfiguration, and select data presentation formats.(Chapter 8)
Windows Enables you to arrange the windows and icons on yourscreen. It also displays the names of all open windows.(this chapter)
Help Displays Help information. (this chapter)
SmartPrep drop-downmenu displays here if aSmartPrep unit is beingused with the TriStar.
TriStar 3000 Menu Structure
Feb 03 3-9

Windows Menu
The choices on this menu allow you to arrange your open windows and icons.
Tile Resizes all open windows and arranges them side by sideso that the contents of all open windows are visible.
Cascade Resizes all open windows and arranges them in a stackedfashion. The active window is positioned on top of thestack. Each window’s title remains visible, making iteasy to select other windows.
Arrange Icons Arranges the symbols for all minimized windows in anorderly manner.
The Windows menu also displays all open files; the active window is precededwith a check mark.
Menu Structure TriStar 3000
3-10 Feb 03
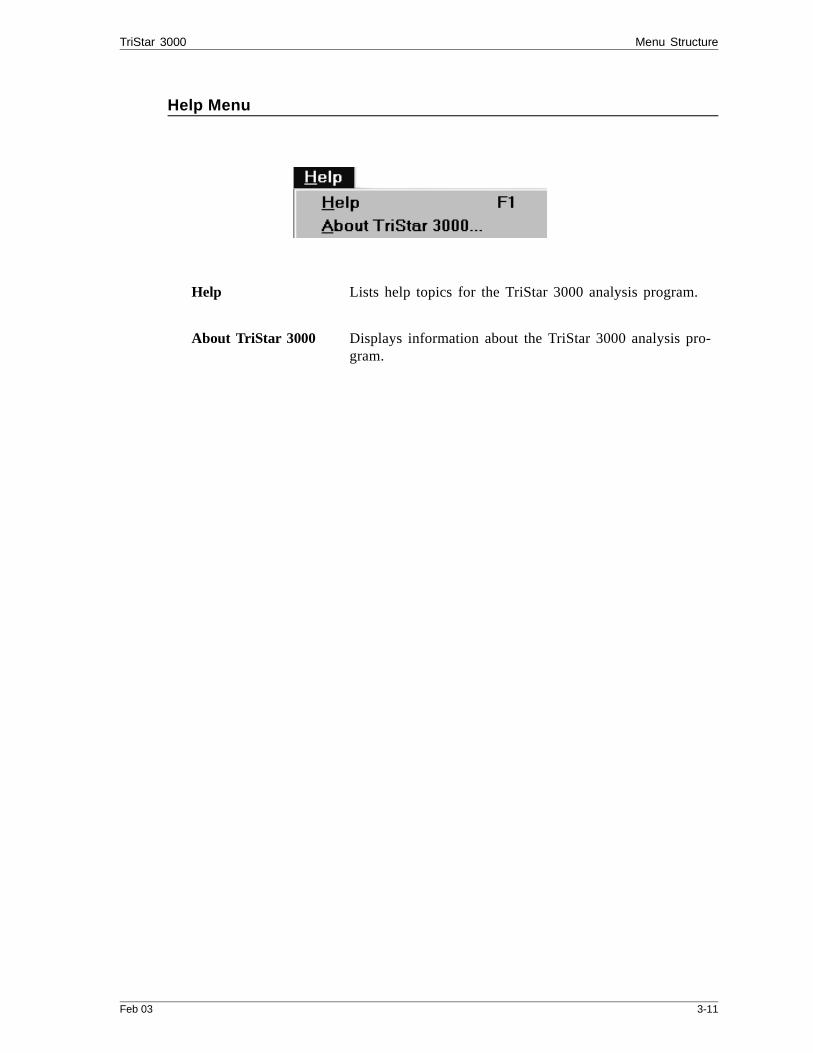
Help Menu
Help Lists help topics for the TriStar 3000 analysis program.
About TriStar 3000 Displays information about the TriStar 3000 analysis pro-gram.
TriStar 3000 Menu Structure
Feb 03 3-11

CHAPTER 4
OPERATIONAL PROCEDURES
• Specifying Sample Defaults
• Defining Parameter Files
• Creating a Sample File
• Cleaning and Labeling Sample Tubes
• Calibrating Sample Tubes
• Preparing the Sample for Analysis
• Performing an Analysis
• Printing File Contents
• Generating a List of File Statistics
• Exporting Isotherm Data
• Generating Graph Overlays

OPERATIONAL PROCEDURES
This chapter contains step-by-step procedures for operating the TriStar 3000. Itdoes not provide detailed descriptions of the fields in the dialogs used to performthese procedures. Refer to Chapters 5 through 8 for field descriptions.
Specifying Sample Defaults
Sample information files include the information required by the TriStar to per-form an analysis and collect data. The TriStar automatically generates sample in-formation file names and assigns the default values which you specify.
The sample information presentation can be presented in a basic or advanced for-mat. Accordingly, sample defaults also are specified in the basic and advanced for-mats. If desired, you may define parameter files before entering sample defaults(refer to Defining Parameter Files in this chapter).
Basic Format
Perform the following steps to define defaults for a sample information file in theBasic format.
Select Option Presentation on the Options menu and ensure that Basic is se-lected as the format.
1. From the Options menu, select Sample Defaults; the Sample DeFaults dialogis displayed.
TriStar 3000 Specifying Sample Defaults
Feb 03 4-1
2. In the Sequence field, specify a default string. This is the number that is in-crementally sequenced and displays in the File name field when you selectFile, Open, Sample information.
3. In the field on the right of the Sample line, enter a format for the identifica-tion. Be sure to include the $ symbol if you wish to have the sample filenumber included as part of the identification.
You also can edit the word Sample. For example, you may prefer to use Test.
4. Enter a default value in the Mass field. You can edit this value at the time ofanalysis.
5. In the Density field, enter a value for the material to be analyzed. This infor-mation is required only for the Quasi-Gemini and computed free-spacemethods.
6. Select the down arrow to the right of the following fields to specify defaultparameter files:
• Sample Tube• Degas Conditions• Analysis Conditions• Adsorptive Properties• Report Options
7. Click , then .Save Close
Specifying Sample Defaults TriStar 3000
4-2 Feb 03

Advanced Format
Perform the following steps to define defaults for a sample information file in theAdvanced format.
Select Option Presentation on the Options menu and ensure that Advanced isselected as the format.
1. From the Options menu, select Sample Defaults; the Default Advanced Sam-ple Information dialog is displayed.
2. In the Sequence field, specify a default string. This is the number that is in-crementally sequenced and displays in the File name field when you selectFile, Open, Sample information.
3. In the field on the right of the Sample line, enter a format for the identifica-tion. Be sure to include the $ symbol if you wish to have the sample filenumber included as part of the identification.
You also can edit the word Sample. For example, you may prefer to use Test.
4. Edit the Operator and Submitter lines as desired. Or you may have either(or both) of these lines omitted entirely by selecting Omit.
5. Enter default values for the sample’s mass and density. Both of these valuesmay be edited at the time of analysis.
TriStar 3000 Specifying Sample Defaults
Feb 03 4-3

6. In the Type of Data group box, choose whether you wish to collect data auto-matically or enter it manually.
7. After you complete the Sample Information dialog, click on the parametertabs to open associated dialogs; specify defaults as desired.
The defaults you specify for parameters serve as defaults for new parameterfiles. For example, the values you specify in the Analysis conditions portionof the sample file display as the default values for newly created stand-aloneAnalysis conditions files.
8. Click , then .Save Close
Specifying Sample Defaults TriStar 3000
4-4 Feb 03
Defining Parameter Files
The following file types can exist as part of the sample information file, as wellas individual parameter files:
• Sample tube• Degas conditions• Analysis conditions• Adsorptive properties• Report options
Having these files exist independently allows you to use them over and overagain.
Several predefined parameter files (located in the PARAMS directory) are in-cluded with the TriStar 3000 analysis program. Although these files may comeclose to the needs of your laboratory, you may wish to define additional ones. Oryou can use a predefined file as a starting point. You can do this by creating anew file and then selecting . A dialog is displayed so that you can selectthe existing parameter file. Then you can make any changes you need to makeand the original file remains unchanged.
Make sure you save these files to the directory specified as the Parameter File di-rectory (refer to Chapter 8 for additional information). If you do not save thesefiles to the specified directory, they will not display in the drop-down lists on theBasic sample file editor.
Parameter files may be defined using either the Basic or Advanced format. Thefollowing sections provide instructions for using the Basic format; the dialogs forthe Advanced format are the same as the ones on the Basic format.
Sample Tube
Sample tube files are used only for the Quasi-Gemini or Calculated free-spacemethods.
Perform the following steps to define a sample tube file:
1. From the File menu, select Open, Sample tube; the Open Sample Tube dia-log is displayed.
2. Enter a name in the File name field, then click .
Replace
OK
TriStar 3000 Defining Parameter Files
Feb 03 4-5

3. Click to create the file; the Sample Tube dialog is displayed:
4. Enter a description in the Sample Tube field. Be sure to use an intuitive de-scription so that you can recognize it easily.
5. Select the stem diameter of the sample tube you plan to use.
6. Enter the volume of the sample tube below the red line on the sample tubestem. This value is obtained by calibrating the sample tube. (Refer to Cali-brating Sample Tubes in this chapter.)
This value is required only if you plan to use the quasi-Gemini or calculatedmethod for free-space measurement.
7. Select whether you plan to use a filler rod and/or an isothermal jacket.
8. Click , then .
Yes
Save Close
Defining Parameter Files TriStar 3000
4-6 Feb 03
Degas Conditions
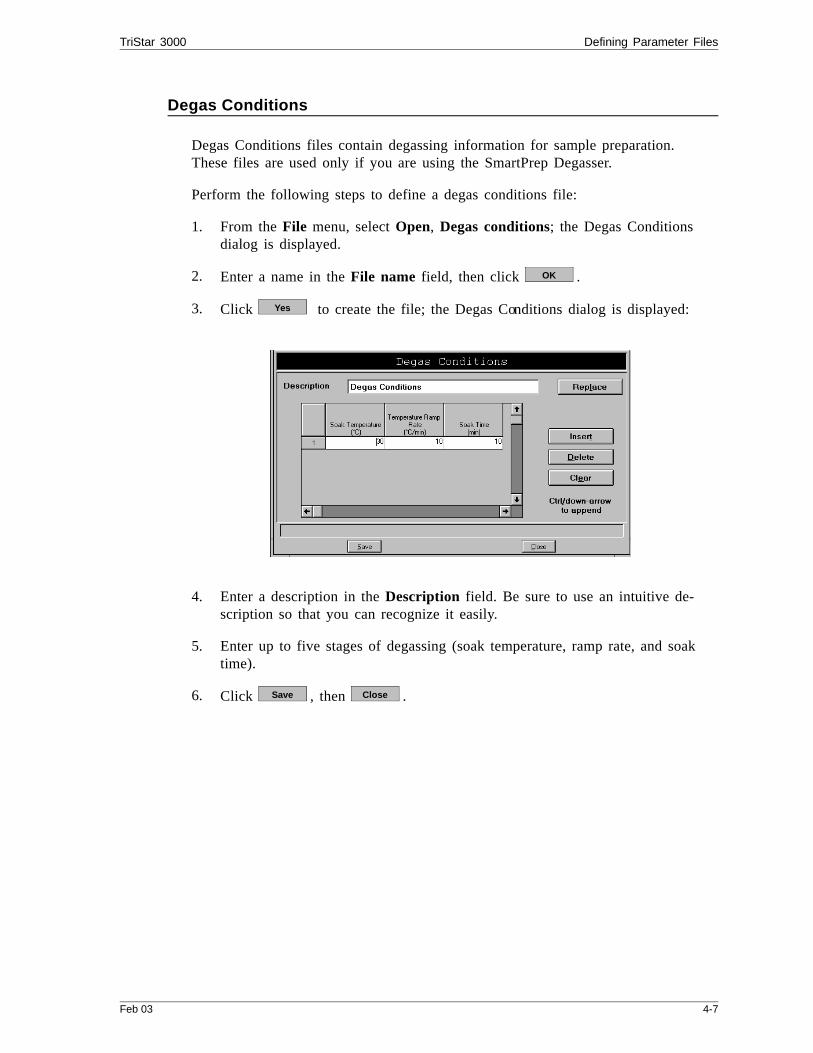
Degas Conditions files contain degassing information for sample preparation.These files are used only if you are using the SmartPrep Degasser.
Perform the following steps to define a degas conditions file:
1. From the File menu, select Open, Degas conditions; the Degas Conditionsdialog is displayed.
2. Enter a name in the File name field, then click .
3. Click to create the file; the Degas Conditions dialog is displayed:
4. Enter a description in the Description field. Be sure to use an intuitive de-scription so that you can recognize it easily.
5. Enter up to five stages of degassing (soak temperature, ramp rate, and soaktime).
6. Click , then .
OK
Yes
Save Close
TriStar 3000 Defining Parameter Files
Feb 03 4-7

Analysis Conditions
Analysis conditions specify the data used to guide an analysis.
Perform the following steps to define an analysis conditions file:
1. From the File menu, select Open, Analysis conditions; the Analysis Condi-tions dialog is displayed.
2. Enter a name in the File name field, then click .
3. Click to create the file; the Analysis Conditions dialog is displayed:
4. Enter a description in the Description field. Be sure to use an intuitive de-scription so that you can recognize it easily.
5. Choose whether you wish to have the isotherm collected by target pressuresor dose increments. Then specify the options required for your choice.
6. Click to specify evacuation and leak test values.
7. Click to specify how the free space is to be measured.
8. Click to specify how the saturation pressure (Po) is to be meas-ured and the analysis bath temperature.
9. Click to specify the equilibration interval and its delay time.
10. Click , then .
OK
Yes
Preparation...
Free space...
Po and T...
Equilibration...
Save Close
Defining Parameter Files TriStar 3000
4-8 Feb 03

Adsorptive Properties
Adsorptive properties provide the adsorptive characteristics for the analysis.
Perform the following steps to create an adsorptive properties file:
1. From the File menu, select Open, Adsorptive properties; the Open Adsorp-tive Properties dialog is displayed.
2. Enter a name in the File name field, then click .
3. Click to create the file; the Adsorptive Properties dialog is displayed:
4. Verify that Nitrogen is displayed as the adsorptive. Nitrogen is the appropri-ate adsorptive in most analyses.
5. Enter information (or accept the defaults) in the following fields (refer to Ad-sorptive Properties in Chapter 5):
Maximum manifold pressureNon-ideality factorDensity conversion factorMolecular cross-sectional area
6. Click , then
OK
Yes
Save Close
TriStar 3000 Defining Parameter Files
Feb 03 4-9
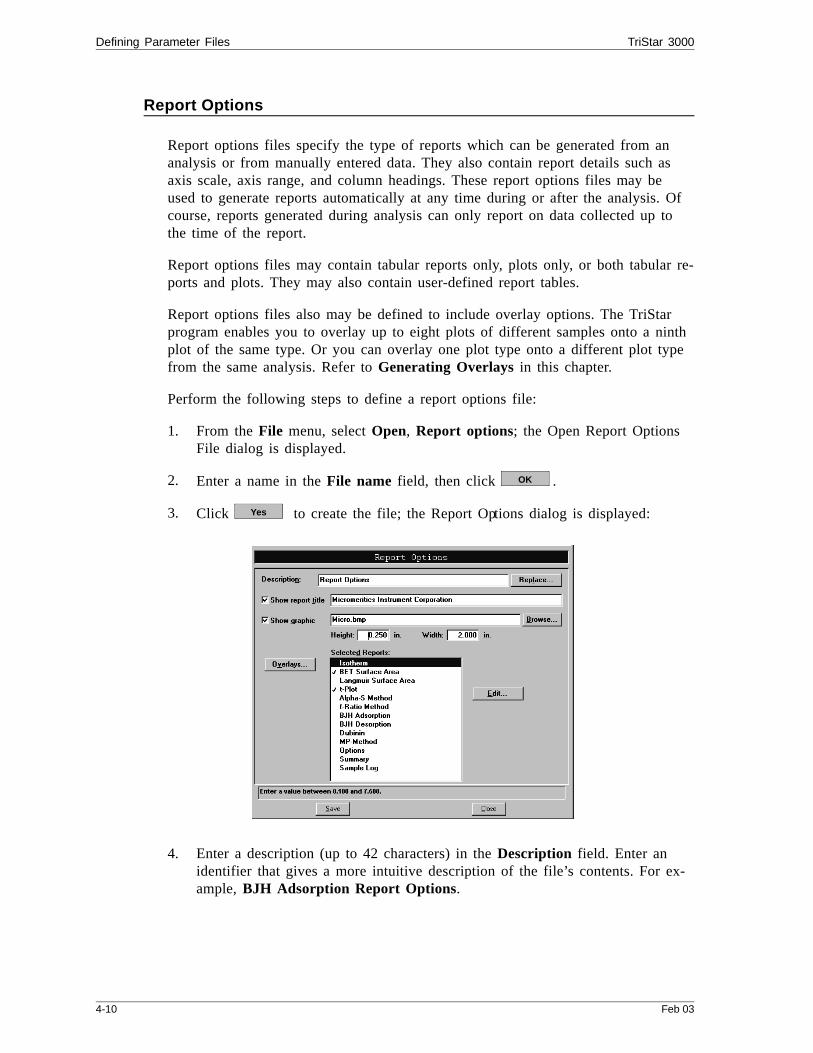
Report Options
Report options files specify the type of reports which can be generated from ananalysis or from manually entered data. They also contain report details such asaxis scale, axis range, and column headings. These report options files may beused to generate reports automatically at any time during or after the analysis. Ofcourse, reports generated during analysis can only report on data collected up tothe time of the report.
Report options files may contain tabular reports only, plots only, or both tabular re-ports and plots. They may also contain user-defined report tables.
Report options files also may be defined to include overlay options. The TriStarprogram enables you to overlay up to eight plots of different samples onto a ninthplot of the same type. Or you can overlay one plot type onto a different plot typefrom the same analysis. Refer to Generating Overlays in this chapter.
Perform the following steps to define a report options file:
1. From the File menu, select Open, Report options; the Open Report OptionsFile dialog is displayed.
2. Enter a name in the File name field, then click .
3. Click to create the file; the Report Options dialog is displayed:
4. Enter a description (up to 42 characters) in the Description field. Enter anidentifier that gives a more intuitive description of the file’s contents. For ex-ample, BJH Adsorption Report Options.
OK
Yes
Defining Parameter Files TriStar 3000
4-10 Feb 03

5. Select Show report title and enter the title you wish to appear at the top ofthe report. Or deselect this option if you prefer not to have a report title.
If your company logo exists as a bitmap (bmp) or enhanced metafile (emf),you can have it display in the report header by selecting Show graphic. Click
to select the file; use the Height and Width fields to specify the size.
6. If you wish to compare the same type of graph from multiple files, click and choose the files. Then be sure you edit the graph from the
Selected Reports window and choose Samples from the Overlay drop-downlist.
7. The reports that may be generated are listed in the Selected Reports list.Select reports by double-clicking on the desired report. Reports are deselectedin the same manner. A report is selected when it is preceded by a check mark.
You can edit some reports by highlighting the desired report and clicking .
8. Click , then to save the information and close the dialog.
Browse...
Overlays
Edit...
Save Close
TriStar 3000 Defining Parameter Files
Feb 03 4-11
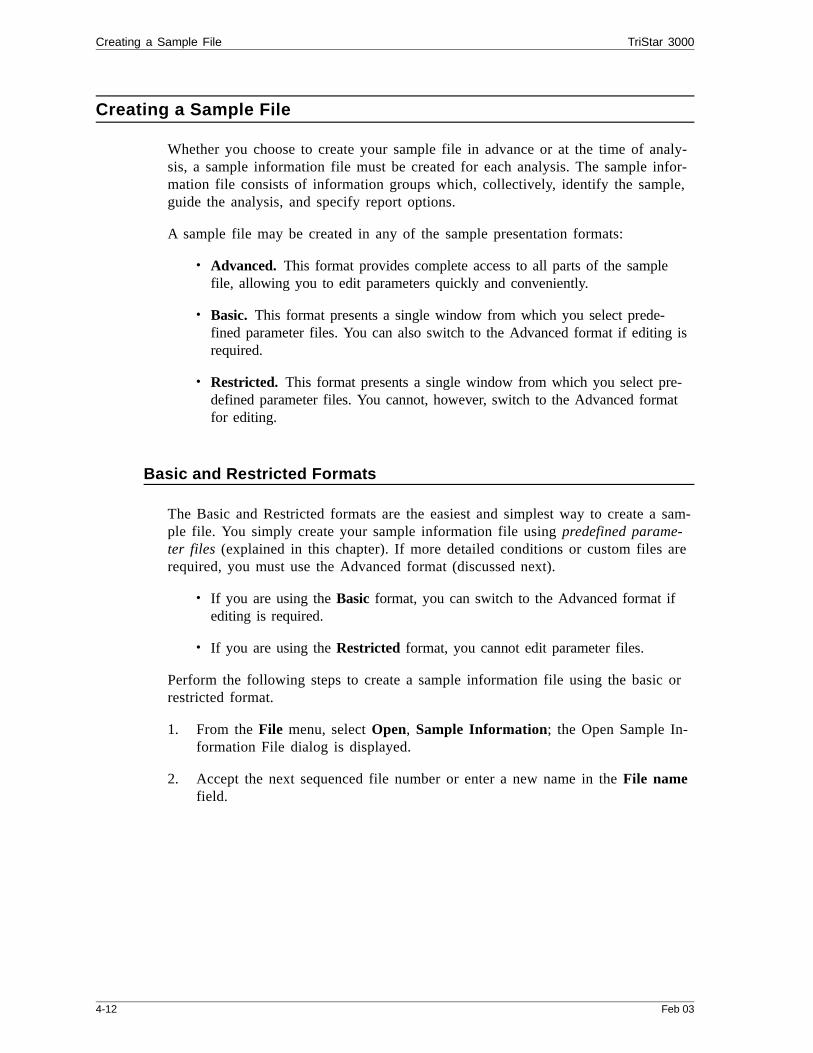
Creating a Sample File
Whether you choose to create your sample file in advance or at the time of analy-sis, a sample information file must be created for each analysis. The sample infor-mation file consists of information groups which, collectively, identify the sample,guide the analysis, and specify report options.
A sample file may be created in any of the sample presentation formats:
• Advanced. This format provides complete access to all parts of the samplefile, allowing you to edit parameters quickly and conveniently.
• Basic. This format presents a single window from which you select prede-fined parameter files. You can also switch to the Advanced format if editing isrequired.
• Restricted. This format presents a single window from which you select pre-defined parameter files. You cannot, however, switch to the Advanced formatfor editing.
Basic and Restricted Formats
The Basic and Restricted formats are the easiest and simplest way to create a sam-ple file. You simply create your sample information file using predefined parame-ter files (explained in this chapter). If more detailed conditions or custom files arerequired, you must use the Advanced format (discussed next).
• If you are using the Basic format, you can switch to the Advanced format ifediting is required.
• If you are using the Restricted format, you cannot edit parameter files.
Perform the following steps to create a sample information file using the basic orrestricted format.
1. From the File menu, select Open, Sample Information; the Open Sample In-formation File dialog is displayed.
2. Accept the next sequenced file number or enter a new name in the File namefield.
Creating a Sample File TriStar 3000
4-12 Feb 03
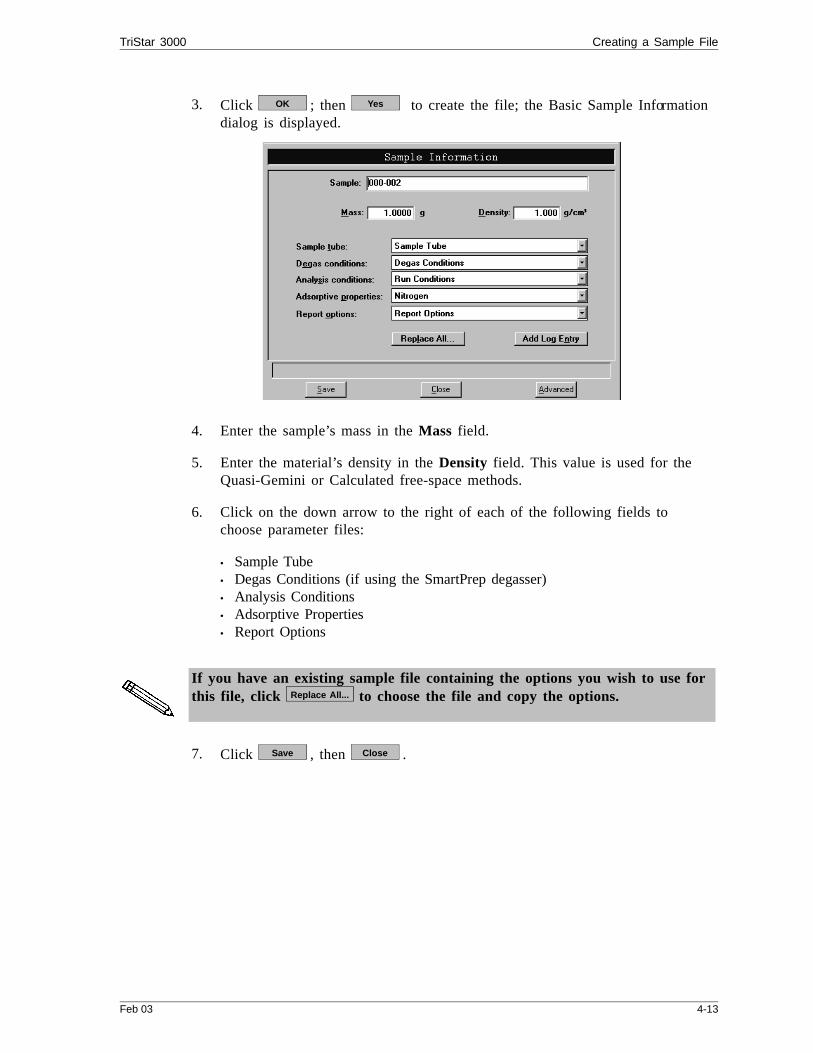
3. Click ; then to create the file; the Basic Sample Informationdialog is displayed.
4. Enter the sample’s mass in the Mass field.
5. Enter the material’s density in the Density field. This value is used for theQuasi-Gemini or Calculated free-space methods.
6. Click on the down arrow to the right of each of the following fields tochoose parameter files:
• Sample Tube• Degas Conditions (if using the SmartPrep degasser)• Analysis Conditions• Adsorptive Properties• Report Options
If you have an existing sample file containing the options you wish to use forthis file, click to choose the file and copy the options.
7. Click , then .
OK Yes
Replace All...
Save Close
TriStar 3000 Creating a Sample File
Feb 03 4-13
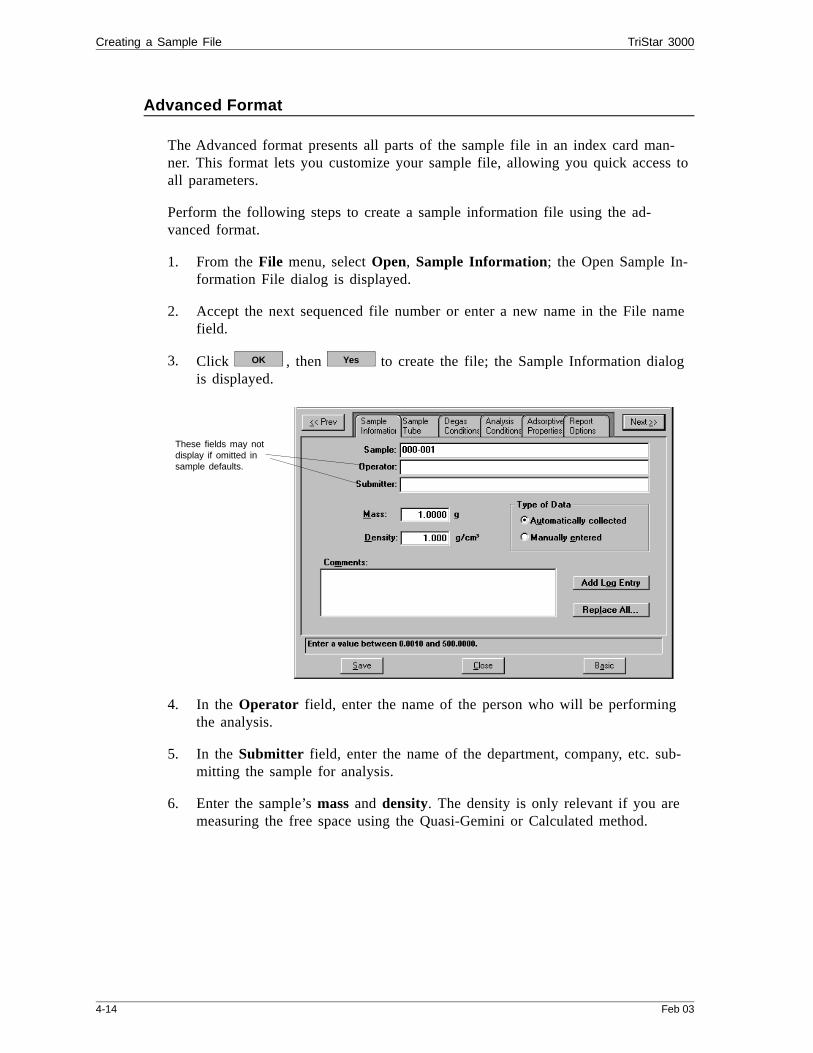
Advanced Format
The Advanced format presents all parts of the sample file in an index card man-ner. This format lets you customize your sample file, allowing you quick access toall parameters.
Perform the following steps to create a sample information file using the ad-vanced format.
1. From the File menu, select Open, Sample Information; the Open Sample In-formation File dialog is displayed.
2. Accept the next sequenced file number or enter a new name in the File namefield.
3. Click , then to create the file; the Sample Information dialogis displayed.
4. In the Operator field, enter the name of the person who will be performingthe analysis.
5. In the Submitter field, enter the name of the department, company, etc. sub-mitting the sample for analysis.
6. Enter the sample’s mass and density. The density is only relevant if you aremeasuring the free space using the Quasi-Gemini or Calculated method.
OK Yes
These fields may notdisplay if omitted insample defaults.
Creating a Sample File TriStar 3000
4-14 Feb 03

7. Choose whether you are going to use manually entered data or have it auto-matically collected.
8. After you complete the Sample Information dialog, click on the parametertabs to open associated dialogs and edit as desired. Instructions for complet-ing these dialogs are explained in Defining Parameter Files in this chapter.
9. After you have completed all parameters, click , then .Save Close
TriStar 3000 Creating a Sample File
Feb 03 4-15

Cleaning and Labeling Sample Tubes
Sample tubes and filler rods must be clean and dry before samples are added andweighed. The following procedures are recommended. Refer to Table 4-1 for a listof materials needed to clean and weigh samples.
Table 4-1. Materials Required to Clean and Weigh Sample Tubes
Supplied by Micromeritics Supplied by User
Sample tubeFiller rod (if used)Sample tube brushStopper for sample tubeSample tube rackSample weighing supportSample data worksheet (copiedfrom Appendix A of this manual)
Drying ovenUltrasonic cleaning unitDetergentRubber gloves or lint-free clothAcetone or isopropyl alcoholSafety glassesWaste containerBalancePipe cleaners
1. Turn on the drying oven used for heating the sample tubes and filler rods andset the temperature to 110 oC.
2. Check the reservoir of the ultrasonic cleaning unit to make sure it is clean.
3. Using 5 grams of Alconox (or other suitable detergent) per 500 mL of warmwater, fill the reservoir of the ultrasonic unit with enough water to cover thesample tubes and filler rods. Make sure the detergent is dissolved before plac-ing the sample tubes and filler rods into the water. If too much detergent isused, it may be difficult to rinse from the sample tubes.
4. Fill the sample tubes with warm water and place them in the reservoir of theultrasonic cleaning unit. Place the filler rods in the bowl also. Turn on the ul-trasonic cleaning unit for approximately fifteen minutes.
Cleaning and Labeling Sample Tubes TriStar 3000
4-16 Feb 03
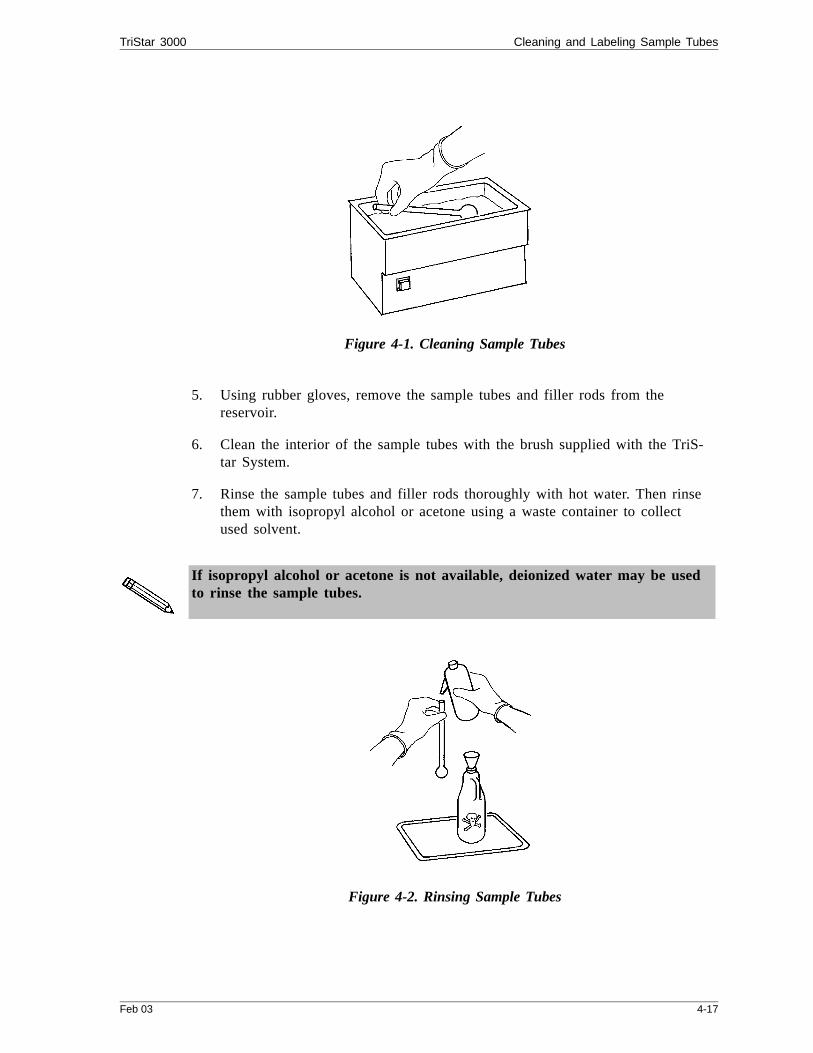
Figure 4-1. Cleaning Sample Tubes
5. Using rubber gloves, remove the sample tubes and filler rods from thereservoir.
6. Clean the interior of the sample tubes with the brush supplied with the TriS-tar System.
7. Rinse the sample tubes and filler rods thoroughly with hot water. Then rinsethem with isopropyl alcohol or acetone using a waste container to collectused solvent.
If isopropyl alcohol or acetone is not available, deionized water may be usedto rinse the sample tubes.
Figure 4-2. Rinsing Sample Tubes
TriStar 3000 Cleaning and Labeling Sample Tubes
Feb 03 4-17

8. Using nitrogen, dry the interior of the sample tubes and filler rods under avent hood. Use a tubing extension long enough and small enough in diameterto fit inside the tubes.
Figure 4-3. Drying Sample Tubes
9. Stand the sample tubes on the sample tube rack and place the filler rods in abasket or in the rack. Bake in a vacuum oven for two hours.
10. Remove the sample tubes and filler rods from the oven and allow them tocool.
Do not insert the filler rods at this time. Filler rods are inserted just beforethe sample tube is installed on the analysis port.
11. Wipe a rubber stopper with a lint-free cloth.
12. Label the sample tube and stopper for identification.
Cleaning and Labeling Sample Tubes TriStar 3000
4-18 Feb 03

Calibrating Sample Tubes
You must calibrate sample tubes if you wish to use them to perform Quasi-Gem-ini analyses or to calculate free space. The calibrated volume is entered in thesample tube parameter file.
Make a copy of the Sample Tube Calibration Worksheet provided in AppendixA, then proceed with the instructions provided below.
1. Write the Sample Tube Identification on the worksheet.
2. Place the sample weighing support on the balance. Tare the balance and allowit to stabilize at zero (0).
3. Place a clean, empty sample tube (without stopper) on the sample weighingsupport. Record the stabilized weight on the worksheet as Empty sample tubeweight. .
Figure 4-4. Weighing Sample Tube
4. Fill the sample tube with deionized water to the red line on the stem; the me-niscus should be even with the line.
Figure 4-5. Level of Deionized Water
Meniscus
Red Line
TriStar 3000 Calibrating Sample Tubes
Feb 03 4-19

5. Place the sample tube containing water on the sample weighing support. Re-cord this weight on the worksheet as Sample tube plus water.
6. Subtract the empty sample weight (step 3) from the weight of the sampletube containing water (step 5). Record this value on the worksheet as Weightof the water.
7. Insert a thermometer into the water to obtain its temperature, then refer to Ta-ble 4-2 to determine the water’s density. Record the density on the worksheet.
Table 4-2. Water Density
Temperature(°C)
Density(g/cm3)
Temperature(°C)
Density(g/cm3)
15 0.9991016 23 0.9975412
16 0.9989450 24 0.9972994
17 0.9987769 25 0.9970480
18 0.9985976 26 0.9967870
19 0.9984073 27 0.9965166
20 0.9982063 28 0.9962371
21 0.9979948 29 0.9959486
22 0.9977730 30 0.9956511
8. Divide the weight of the water (step 6) by the density of water (step 7) to ob-tain the physical volume below the red line on the sample tube.
a. Record this value on the worksheet.
b. Enter this value in the Physical volume below mark field in the SampleTube dialog box.
Calibrating Sample Tubes TriStar 3000
4-20 Feb 03

Preparing the Sample for Analysis
A sample must be properly weighed and degassed before installing it on the sam-ple port for analysis.
Make a copy of the Sample Data Worksheet provided in Appendix A, then pro-ceed with the instructions provided below.
Weighing the Sample
Analysis results are expressed in units of surface area per gram of sample; there-fore, the true sample mass must be known. Carefully weigh each sample tube set(sample tube and stopper) and sample as described below.
1. Write the Sample Tube Identification on the Sample Data Worksheet.
2. Place the sample weighing support on the balance. Tare the balance and allowit to stabilize at zero (0).
3. Place the sample tube set on the sample weighing support. Record the stabi-lized weight on the Sample Data Worksheet as Empty sample tube mass. Re-move the sample weighing support and sample tube set from the balance.
Figure 4-6. Weighing Sample Tube Set
4. Place a sample weighing container onto the balance. Tare the balance and al-low it to stabilize at zero (0).
Do not touch the sample with bare hands while performing the next six steps.Doing so could affect the accuracy of results.
TriStar 3000 Preparing the Sample for Analysis
Feb 03 4-21
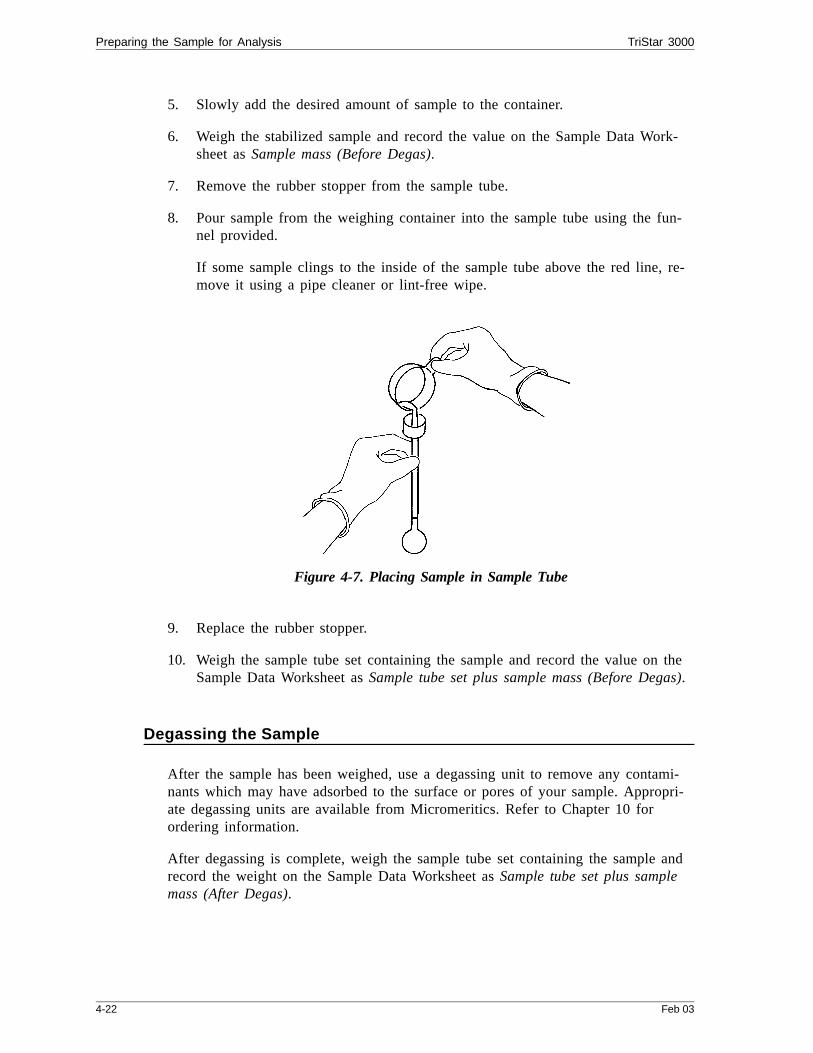
5. Slowly add the desired amount of sample to the container.
6. Weigh the stabilized sample and record the value on the Sample Data Work-sheet as Sample mass (Before Degas).
7. Remove the rubber stopper from the sample tube.
8. Pour sample from the weighing container into the sample tube using the fun-nel provided.
If some sample clings to the inside of the sample tube above the red line, re-move it using a pipe cleaner or lint-free wipe.
Figure 4-7. Placing Sample in Sample Tube
9. Replace the rubber stopper.
10. Weigh the sample tube set containing the sample and record the value on theSample Data Worksheet as Sample tube set plus sample mass (Before Degas).
Degassing the Sample
After the sample has been weighed, use a degassing unit to remove any contami-nants which may have adsorbed to the surface or pores of your sample. Appropri-ate degassing units are available from Micromeritics. Refer to Chapter 10 forordering information.
After degassing is complete, weigh the sample tube set containing the sample andrecord the weight on the Sample Data Worksheet as Sample tube set plus samplemass (After Degas).
Preparing the Sample for Analysis TriStar 3000
4-22 Feb 03

Installing the Sample Tube
You may use the three analysis ports as follows:
• Port 1 for a sample analysis
• Port 2 for a sample analysis or a Quasi-Gemini (blank sample tube)measurement
• Port 3 for a sample analysis or continuous Po measurement
To attach a sample tube to a port, follow the steps below.
1. Remove the sample tube stopper.
2. If using an isothermal jacket: slide the jacket down over the stem of the sam-ple tube until it touches the bulb of the sample tube.
3. Install the dewar cover by inserting the sample tube through one of the holesin the cover. Make sure the tapered side of the cover is toward the bulb ofthe sample tube.
Figure 4-8. Attaching a Sample Tube to an Analysis Port
4. Place the connector nut, ferrule, and O-ring onto the sample tube stem.
5. Carefully insert a filler rod (if used) into the sample tube.
6. Attach the sample tube to the analysis port. Make sure it is fully in theport. Secure it in place by screwing the connector nut onto the analysis port.Hand-tighten the connector nut.
7. Slide the dewar cover upward until it stops.
O-ring
Ferrule
Connector Nut
Dewar Cover
TriStar 3000 Preparing the Sample for Analysis
Feb 03 4-23
Installing the Analysis Dewar
Prepare the analysis Dewar after you have installed the sample tube(s),
Always handle Dewars with care. Any product incorporating a vacuum is apotential safety hazard and should be treated with caution. Always observethe precautions listed below.
We recommend the following be observed when handling Dewars containing lique-fied gases:
• Protect yourself by wearing 1) goggles (or a face shield), 2) an insulated orrubber apron, and 3) insulated gloves.
• When pouring liquefied gases from one container to another: 1) cool the re-ceiving container gradually to minimize thermal shock, 2) pour the liquefiedgas slowly to prevent splashing, and 3) vent the receiving container to the at-mosphere.
• Use a plastic stirring rod when stirring substances in a Dewar containing lique-fied gases (or other materials of extremely low temperature). Do not use aglass or metal stirring rod unless it is coated with some type of protective coat-ing.
• Do not remove the mesh covering from the Dewar flask. This covering is inplace to minimize the risk of flying particles if the Dewar is accidentallyknocked over or dropped and broken.
• Do not handle heavy objects above the Dewar. If unavoidable, place a protec-tive cover over the Dewar’s opening. If an object of sufficient weight is acci-dentally dropped into the Dewar, shattering may occur.
Install the analysis Dewar as follows:
1. Fill the dewar with the analysis bath liquid (liquid nitrogen) to about 5 cm (2in.) from the top.
Incorrect fluid levels can lead to measurement errors. You should check thelevel of the bath liquid before each analysis.
2. Insert the dipstick into the dewar and check the level of the analysis bath liq-uid.
Preparing the Sample for Analysis TriStar 3000
4-24 Feb 03
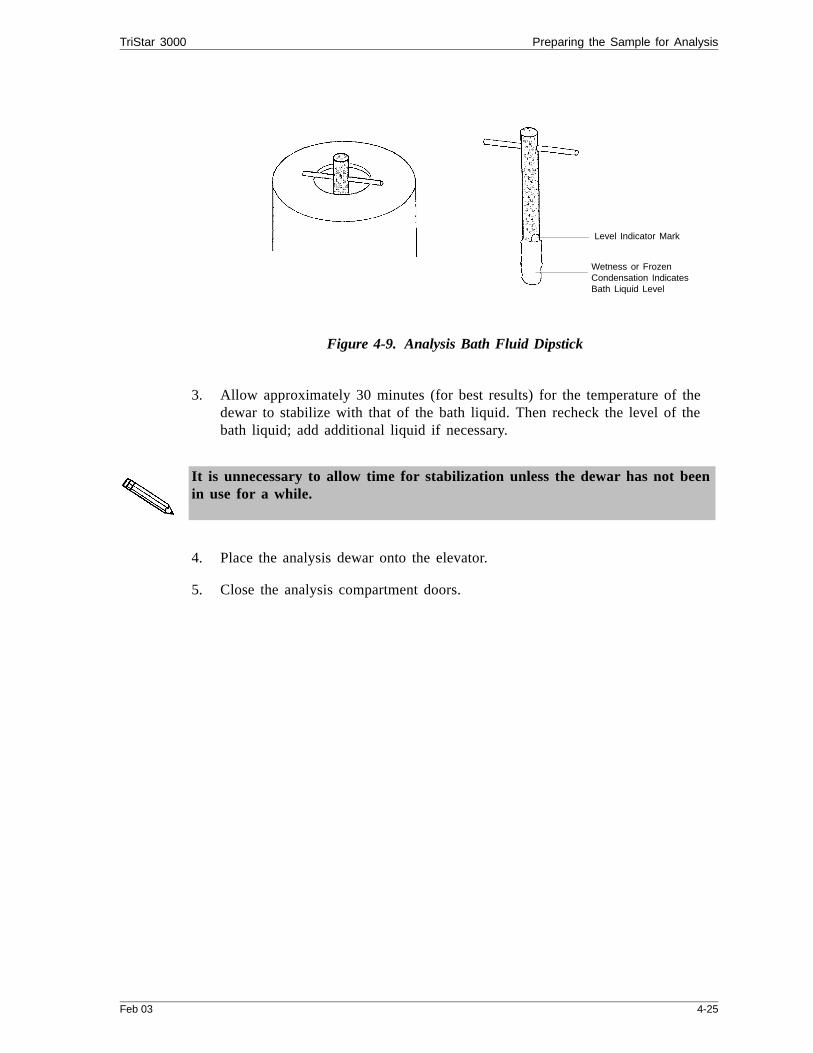
Figure 4-9. Analysis Bath Fluid Dipstick
3. Allow approximately 30 minutes (for best results) for the temperature of thedewar to stabilize with that of the bath liquid. Then recheck the level of thebath liquid; add additional liquid if necessary.
It is unnecessary to allow time for stabilization unless the dewar has not beenin use for a while.
4. Place the analysis dewar onto the elevator.
5. Close the analysis compartment doors.
Level Indicator Mark
Wetness or FrozenCondensation IndicatesBath Liquid Level
TriStar 3000 Preparing the Sample for Analysis
Feb 03 4-25

Performing an Analysis
Once a sample has been degassed and transferred to an analysis port, you may be-gin analysis. The TriStar provides two types of analyses from which you maychoose:
• Standard - allows you to perform up to three analyses using different analysisconditions.
• QuickStart - allows you to perform multiple sample analyses using the sameanalysis conditions.
Refer to chapter 6 for a detailed description of the dialog boxes shown in this seci-ton.
Standard Analysis
1. From the Unit menu, select Sample Analysis; the following dialog box is dis-played.
2. Click to choose a sample information file to be used for each port.
3. The sample identification, sample weight, and sample density contained in thesample information file are displayed. Verify the sample weight and density.The density value is irrelevant unless you are using the Quasi-Gemini or Cal-culate method for the free-space determination.
Browse...
Indicates Freespace Meas-urement and shows onlythe Sample Tube Filefield and the Browse pushbutton when this port is be-ing used for the QuasiGemini Method.
Indicates Po Measurement(no other fields are shownwhen this port is being usedto measure the Po on a con-tinuous basis.
Performing an Analysis TriStar 3000
4-26 Feb 03
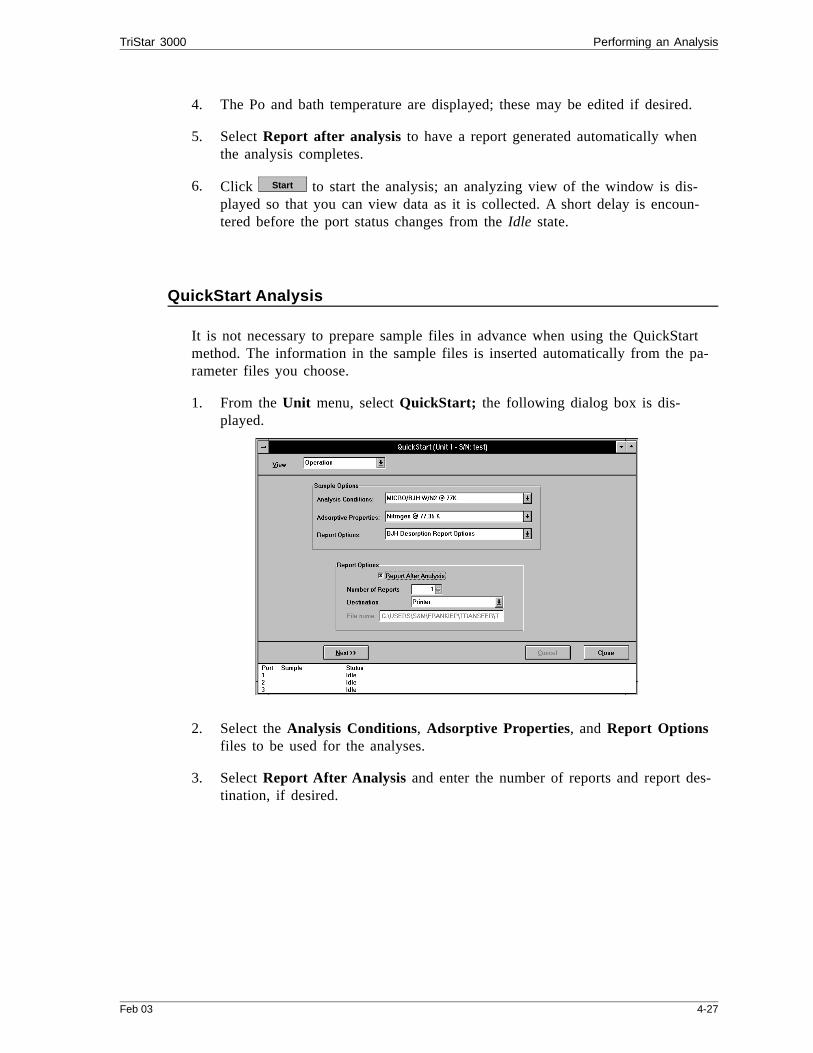
4. The Po and bath temperature are displayed; these may be edited if desired.
5. Select Report after analysis to have a report generated automatically whenthe analysis completes.
6. Click to start the analysis; an analyzing view of the window is dis-played so that you can view data as it is collected. A short delay is encoun-tered before the port status changes from the Idle state.
QuickStart Analysis
It is not necessary to prepare sample files in advance when using the QuickStartmethod. The information in the sample files is inserted automatically from the pa-rameter files you choose.
1. From the Unit menu, select QuickStart; the following dialog box is dis-played.
2. Select the Analysis Conditions, Adsorptive Properties, and Report Optionsfiles to be used for the analyses.
3. Select Report After Analysis and enter the number of reports and report des-tination, if desired.
Start
TriStar 3000 Performing an Analysis
Feb 03 4-27
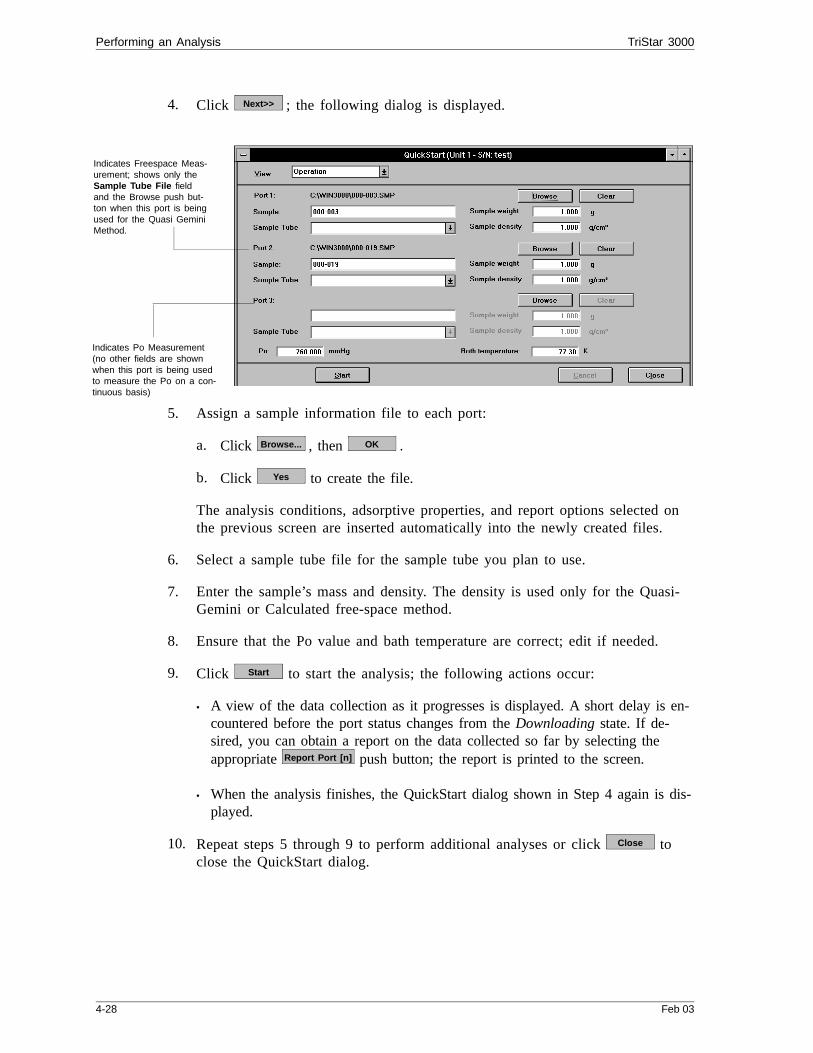
4. Click ; the following dialog is displayed.
5. Assign a sample information file to each port:
a. Click , then .
b. Click to create the file.
The analysis conditions, adsorptive properties, and report options selected onthe previous screen are inserted automatically into the newly created files.
6. Select a sample tube file for the sample tube you plan to use.
7. Enter the sample’s mass and density. The density is used only for the Quasi-Gemini or Calculated free-space method.
8. Ensure that the Po value and bath temperature are correct; edit if needed.
9. Click to start the analysis; the following actions occur:
• A view of the data collection as it progresses is displayed. A short delay is en-countered before the port status changes from the Downloading state. If de-sired, you can obtain a report on the data collected so far by selecting theappropriate push button; the report is printed to the screen.
• When the analysis finishes, the QuickStart dialog shown in Step 4 again is dis-played.
10. Repeat steps 5 through 9 to perform additional analyses or click toclose the QuickStart dialog.
Next>>
Browse... OK
Yes
Start
Report Port [n]
Close
Indicates Freespace Meas-urement; shows only theSample Tube File fieldand the Browse push but-ton when this port is beingused for the Quasi GeminiMethod.
Indicates Po Measurement(no other fields are shownwhen this port is being usedto measure the Po on a con-tinuous basis)
Performing an Analysis TriStar 3000
4-28 Feb 03

Printing File Contents
You can print the contents of one or more of the following file types to thescreen, a printer, or to a file on disk.
• Sample information• Sample tube• Degas conditions• Analysis conditions• Adsorptive properties• Report options
1. From the File menu, select Print. A drop-down list containing file types isdisplayed.
2. Choose the file type; a dialog similar to this one is displayed.
3. From the Files list box, select the file you wish to print. If you plan to printmultiple files, hold down while clicking on the desired files.
4. From the Settings group box, choose a Destination for your file. If youchoose File as the destination, enter a name in the File name field, or acceptthe default. If you have selected multiple files, individual files are exportedas their file name with the extension .RPT.
5. Click ; the file is printed to the specified destination.
Ctrl
OK
Choose thedestination.
Choose the fileyou wish to print.
Click to completethe printing process.
TriStar 3000 Printing File Contents
Feb 03 4-29

Generating a List
You can generate a list of the following information on one or more files to thescreen, a printer, or to a file on disk.
• File name• Date the file was created (or last edited)• Time the file was created (or last edited)• File identification• Status
1. From the File menu, select List. A drop-down list containing the followingfile types is displayed.
• Sample information• Sample tube • Degas conditions• Analysis conditions• Adsorptive properties• Report options
2. Choose the file type; a dialog similar to this one is displayed.
3. From the Files list box, select the file from which you wish to have a listgenerated. If you plan to list information for multiple files, hold down while clicking on the desired files.
Ctrl
Click to complete theprocess.
Choose thedestination.
Choose the file(s)on which you wishto generate a list.
Generating a List TriStar 3000
4-30 Feb 03
4. From the Settings group box, choose a Destination for your list. If youchoose File as the destination, enter a name in the File name field, or acceptthe default. If you have selected multiple files, individual files are exportedas their file name with the extension .LST.
5. Click ; the list is printed to the specified destination.OK
TriStar 3000 Generating a List
Feb 03 4-31
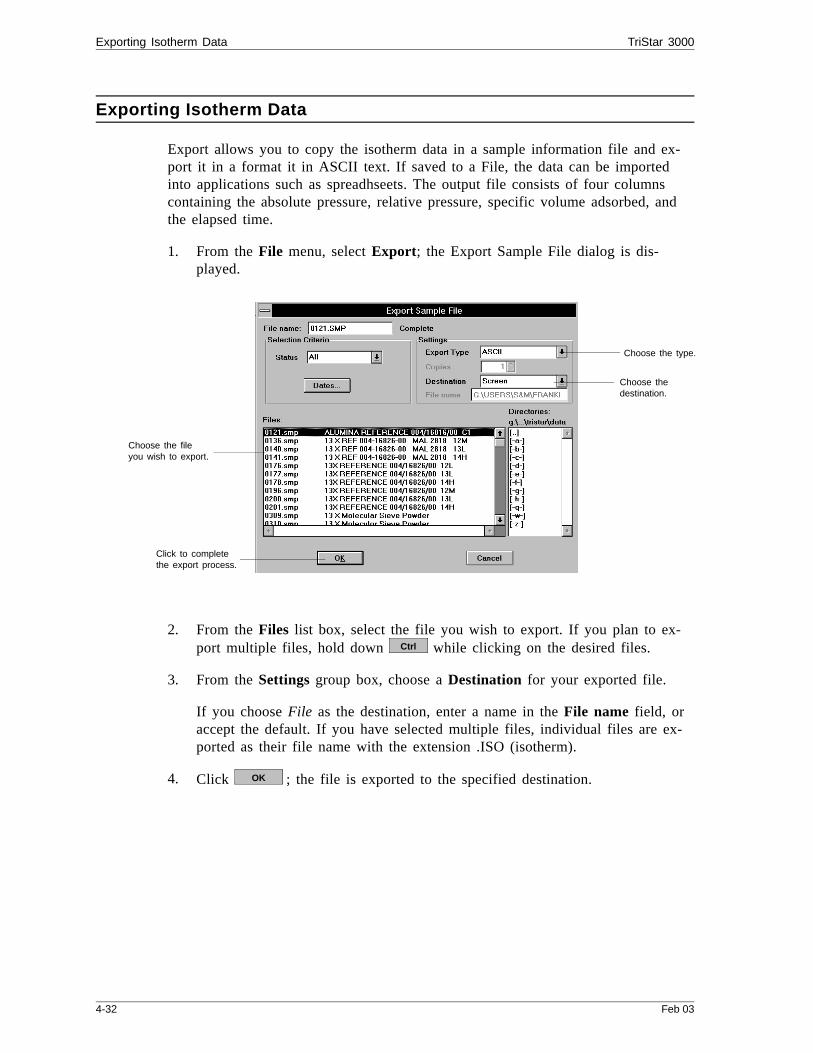
Exporting Isotherm Data
Export allows you to copy the isotherm data in a sample information file and ex-port it in a format it in ASCII text. If saved to a File, the data can be importedinto applications such as spreadhseets. The output file consists of four columnscontaining the absolute pressure, relative pressure, specific volume adsorbed, andthe elapsed time.
1. From the File menu, select Export; the Export Sample File dialog is dis-played.
2. From the Files list box, select the file you wish to export. If you plan to ex-port multiple files, hold down while clicking on the desired files.
3. From the Settings group box, choose a Destination for your exported file.
If you choose File as the destination, enter a name in the File name field, oraccept the default. If you have selected multiple files, individual files are ex-ported as their file name with the extension .ISO (isotherm).
4. Click ; the file is exported to the specified destination.
Ctrl
OK
Choose the type.
Choose thedestination.
Choose the fileyou wish to export.
Click to completethe export process.
Exporting Isotherm Data TriStar 3000
4-32 Feb 03

Generating Graph Overlays
Use the graph overlay function when you wish to compare graphically multiplegraph options. Overlays may be generated in two ways:
• Multiple Graph Overlays
Overlaying two different types of graphs from the same sample on top ofeach other. This type of overlay is available for BJH Adsorption/ Desorp-tion reports only.
• Multiple Sample Overlays
Overlaying the same type of graph for up to eight samples on top of apreviously selected sample.
Varying symbols are used to differentiate the graphical lines and reported in a leg-end at the top of the output. If color output is available, different colors are usedinstead.
Multiple Graph Overlays
To overlay two different types of graphs from the same sample file:
1. From the File menu, select Open, Sample Information. Double-click on thedesired file. If your window is presented in the Basic format, click .
2. Select the Report Options tab.
3. Select the type of report on which you wish to have overlays generated. Re-member, only BJH Adsorption/Desorption reports can be chosen for this typeof overlay.
Advanced
TriStar 3000 Generating Graph Overlays
Feb 03 4-33

4. Click ; the BJH Adsorption/Desorption dialog is displayed.
5. From the Selected Reports window, choose the report variable on which youwish to have another variable overlaid, then click . A dialog similarto this one is displayed.
6. From the Overlay drop-down list, choose the report variable you wish tooverlay, then click .
You do not have to save these options before generating overlay reports. Ifyou do save, the report options for your original sample file will be replacedwith the new ones.
Edit...
Edit...
OK
Click to choose thesecond reportvariable.
Select the reportvariable
Displays the firstreport variable.
Choose the secondvariable from thisdrop-down list.
Generating Graph Overlays TriStar 3000
4-34 Feb 03

7. From the Reports menu, select Start report; the Start Report dialog is dis-played. In most cases, your file name will be highlighted and displayed in theFile name: field. If it is not, simply navigate to the appropriate directory andchoose the file.
8. Click ; the Select Reports dialog is displayed. Click again toclose the dialog and generate the overlays.
Multiple Sample Overlays
To overlay the same type of graph on multiple samples:
1. From the File menu, select Open, Sample Information. Double-click on thedesired file. If your window is presented in the Basic format, click .
2. Select the Report Options tab.
3. Choose the type of report from the Selected Reports window; then click .
4. Choose one:
If you are overlayingthese types of reports.... Then....
IsothermBET Surface AreaLangmuir Surface Areat-Plot
Select the Overlay Samples checkbox.
Click .
BJH AdsorptionBJH Desorption
Choose the report variable from the SelectedReports window, then click .
Click on the down arrow in the Overlay: fieldand choose Samples; then click .
Click again to close the BJHAdsorption/Desorption dialog and display theReport Options dialog.
5. From the Report Options dialog, click ; the Graph Overlays Sam-ples dialog is displayed.
OK OK
Advanced
Edit...
OK
Edit...
OK
OK
Overlays...
TriStar 3000 Generating Graph Overlays
Feb 03 4-35

6. Click to the right of the Sample [n] field; the Open Sample Informa-tion dialog is displayed.
7. Choose the file containing the graph you wish to overlay, then click .You may choose up to eight files in this manner.
You do not have to save these options before generating overlay reports. Ifyou do save, the report options for your original sample file will be replacedwith the new ones.
8. From the Reports menu, select Start report; the Start Report dialog is dis-played. Your primary file should be highlighted and in the File name: field.If it is not, simply navigate to the appropriate directory and choose the file.
9. Click ; the Select Reports dialog is displayed. Click again toclose the dialog and generate the overlays.
Browse...
OK
OK OK
Generating Graph Overlays TriStar 3000
4-36 Feb 03

CHAPTER 5
FILE MENU
• Description
• Open
• Save
• Save As
• Save All
• Close
• Close All
• List
• Export
• Exit
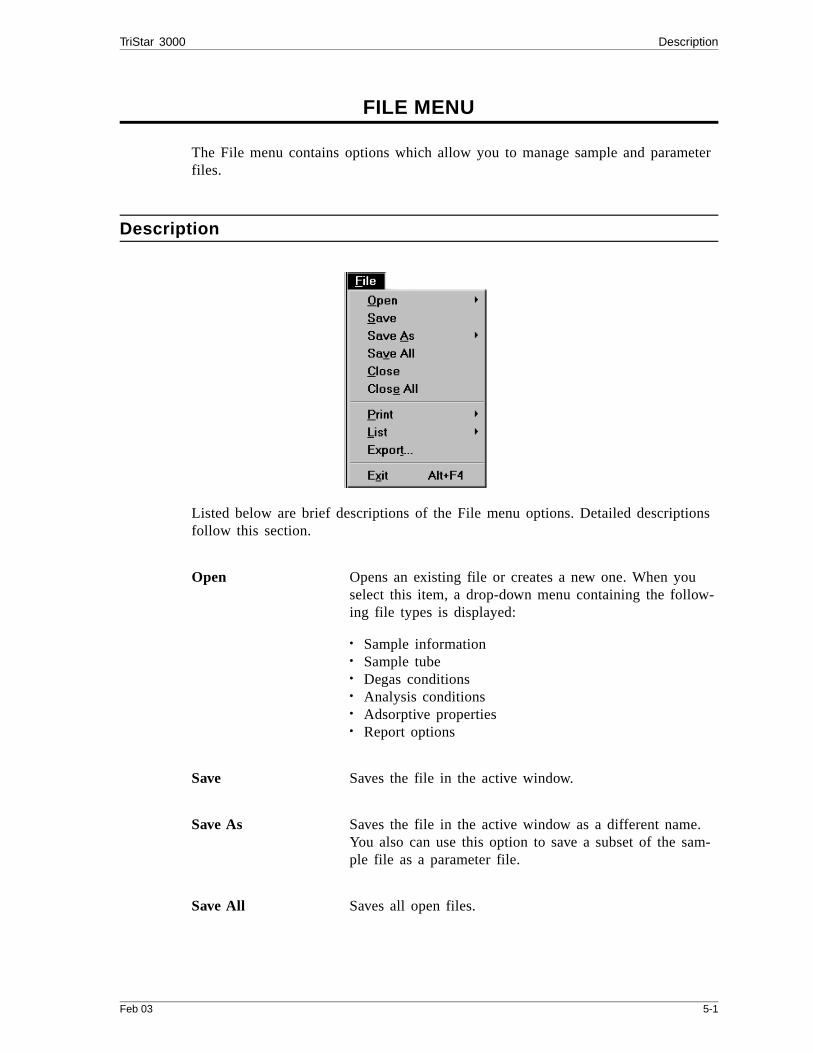
FILE MENU
The File menu contains options which allow you to manage sample and parameterfiles.
Description
Listed below are brief descriptions of the File menu options. Detailed descriptionsfollow this section.
Open Opens an existing file or creates a new one. When youselect this item, a drop-down menu containing the follow-ing file types is displayed:
• Sample information• Sample tube• Degas conditions• Analysis conditions• Adsorptive properties• Report options
Save Saves the file in the active window.
Save As Saves the file in the active window as a different name.You also can use this option to save a subset of the sam-ple file as a parameter file.
Save All Saves all open files.
TriStar 3000 Description
Feb 03 5-1
Close Closes the file in the active window.
Close All Closes all open files.
Print Prints the contents of a sample or parameter file.
List Generates a list of certain information for sample or pa-rameter files.
Export Exports the isotherm data contained in a sample file.
Exit Exits the analysis program.
Description TriStar 3000
5-2 Feb 03
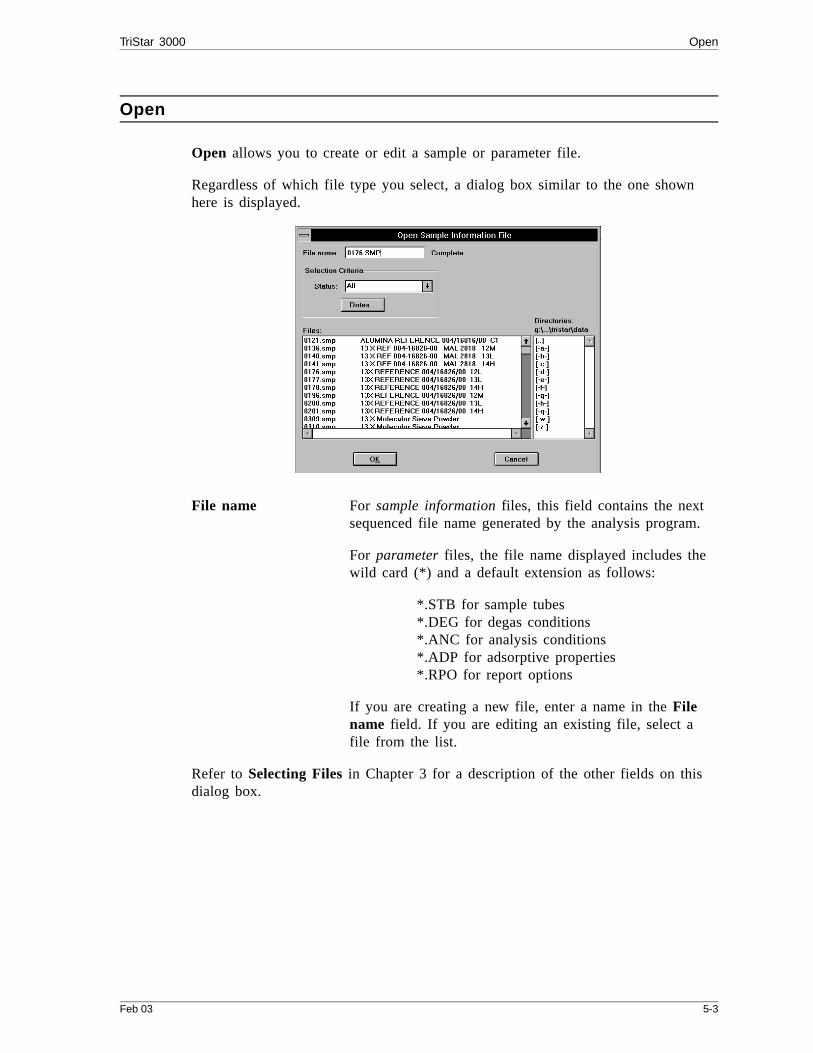
Open
Open allows you to create or edit a sample or parameter file.
Regardless of which file type you select, a dialog box similar to the one shownhere is displayed.
File name For sample information files, this field contains the nextsequenced file name generated by the analysis program.
For parameter files, the file name displayed includes thewild card (*) and a default extension as follows:
*.STB for sample tubes*.DEG for degas conditions*.ANC for analysis conditions*.ADP for adsorptive properties*.RPO for report options
If you are creating a new file, enter a name in the Filename field. If you are editing an existing file, select afile from the list.
Refer to Selecting Files in Chapter 3 for a description of the other fields on thisdialog box.
TriStar 3000 Open
Feb 03 5-3

Sample Information
Sample information files contain information used to control the analysis. There-fore, every analysis must be linked with a sample information file before theanalysis can proceed. A sample information file is comprised of the following:
• sample identification• sample tube parameters• degas conditions (if using automatic degassing)• analysis conditions• adsorptive properties• report options• collected/entered data (when an analysis has been completed)
Parts of the sample information file can also exist as parameter files which areseparate from the sample information file itself. Having these files exist inde-pendently allows you to use them as many times as you wish. For example, ifyou typically use the same analysis conditions for many of your analyses, you cancreate an analysis conditions file containing those conditions. Then when you cre-ate your sample file, select that file for your analysis conditions. Once it becomespart of the new sample file, you can edit it in any way you wish without chang-ing the file from which it was copied.
Sample information files are presented in three formats: Advanced, Basic andRestricted.
Specify or change your format by selecting Option presentation from the Op-tions menu.
• Basic Presents the entire sample information file in a single dialog. With this for-mat, you can quickly create a sample information file using previously de-fined parameter files. This format also allows you to switch to theAdvanced format to view or edit parameters.
• Advanced Presents all parts of the sample information file in a single, index cardtabbed dialog. Each tab opens its associated dialog. Use this format to cre-ate customized files.
• Restricted Presents the sample information file in a single dialog similar to the Basicformat. With the Restricted format, however, you cannot switch to the Ad-vanced format to edit parameters. Some menu items also are unavilable.
Open TriStar 3000
5-4 Feb 03

Basic
When you open an existing sample information file or create a new one using theBasic format, all parts of that file are contained on a single dialog. With the Ba-sic format, you can quickly create a sample information file using previously de-fined parameter files. This format also allows you to switch to the Advancedformat to view or edit parameters. Chapter 4 provides step-by-step instructions forcreating a Basic sample information file.
If you are creating a new file, this dialog displays the defaults you specifiedin Sample defaults. Chapter 8 explains how to establish sample defaults.
Sample Displays the next sequenced file description or the nameof the file you are opening. You may enter a new descrip-tion or add to the existing one.
Range: 50 alphanumeric characters
Mass Enter the mass of the sample to be analyzed.
Use 1.0000 when performing a blank analysis.
Density Enter the density of the sample to be analyzed. Thisvalue is used only for the Quasi-Gemini or Calculatedfree-space method.
Use 0.000 when performing a blank analysis.
TriStar 3000 Open
Feb 03 5-5
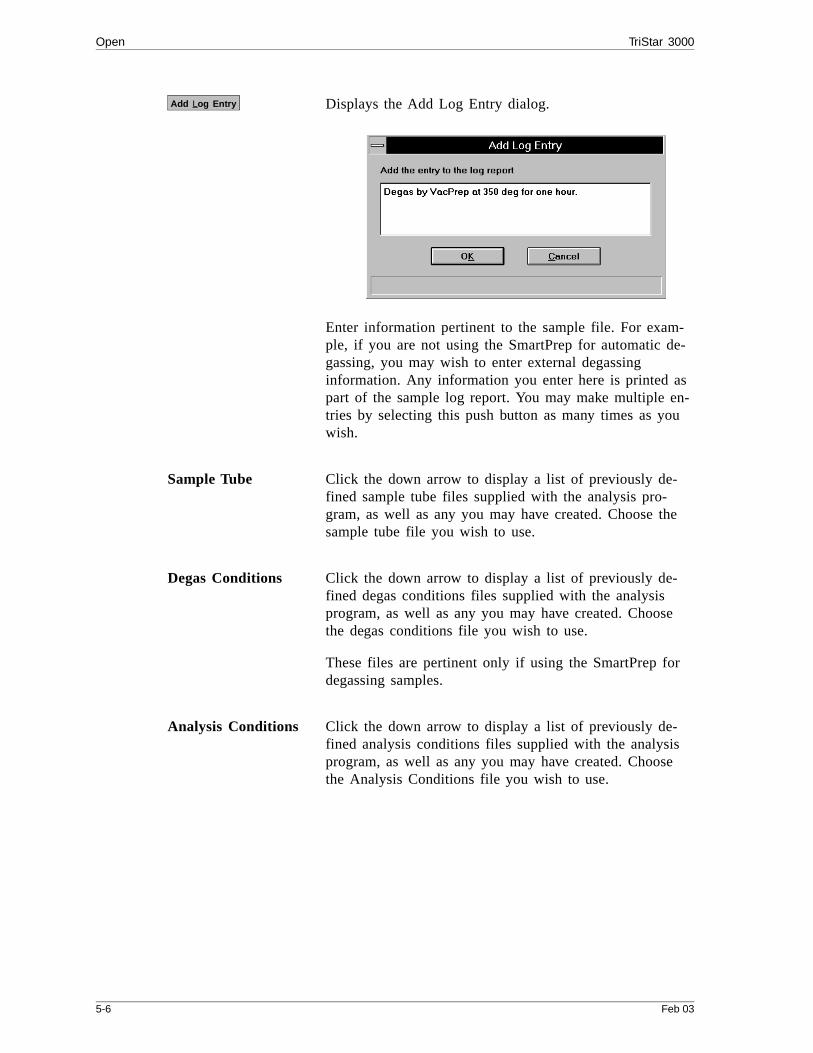
Displays the Add Log Entry dialog.
Enter information pertinent to the sample file. For exam-ple, if you are not using the SmartPrep for automatic de-gassing, you may wish to enter external degassinginformation. Any information you enter here is printed aspart of the sample log report. You may make multiple en-tries by selecting this push button as many times as youwish.
Sample Tube Click the down arrow to display a list of previously de-fined sample tube files supplied with the analysis pro-gram, as well as any you may have created. Choose thesample tube file you wish to use.
Degas Conditions Click the down arrow to display a list of previously de-fined degas conditions files supplied with the analysisprogram, as well as any you may have created. Choosethe degas conditions file you wish to use.
These files are pertinent only if using the SmartPrep fordegassing samples.
Analysis Conditions Click the down arrow to display a list of previously de-fined analysis conditions files supplied with the analysisprogram, as well as any you may have created. Choosethe Analysis Conditions file you wish to use.
Add Log Entry
Open TriStar 3000
5-6 Feb 03
Adsorptive Properties
Click the down arrow to display a list of previously de-fined adsorptive properties files supplied with the analy-sis program, as well as any you may have created.Choose the adsorptive properties file you wish to use.
Report Options Click the down arrow to display a list of previously de-fined report options files supplied with the analysis pro-gram, as well as any you may have created. Choose theReport options file you wish to use.
Allows you to copy all parameters of an existing samplefile’s values into the sample information file you are cre-ating. An “open file” dialog is displayed so that you mayselect the desired file. Click ; the values are cop-ied into the new file automatically. You may edit the val-ues in the new file; the file from which they were copiedremains unchanged.
Saves the information you have specified for this samplefile.
Closes the dialog box. If a file containing unsavedchanges is open, you are prompted to save before the dia-log box closes.
Displays the sample information file in the advanced for-mat, allowing you to view or edit parameters.
Replace All...
OK
Save
Close
Advanced
TriStar 3000 Open
Feb 03 5-7

Advanced
When you open an existing sample information file or create a new one using theAdvanced format, all parts of the sample file are displayed in a tabbed dialog.The Advanced format allows you to customize sample files. Chapter 4 providesstep-by-step instructions for creating an Advanced sample information file.
The prompts for the Sample, Operator, and Submitter fields may be customizedby selecting Options, Sample defaults. Refer to Chapter 8 for instructions on cus-tomizing these prompts.
Sample Displays the next sequenced file description or the nameof the file you are opening. You may enter a new descrip-tion or add to the existing one.
Range: 50 alphanumeric characters
OperatorSubmitter
Enter the name of the operator who will be performingthe analysis and the name of the person (or department)submitting the sample for analysis. Either or both ofthese fields may be omitted from this dialog by choosingto do so when establishing defaults (Chapter 8).
Range: 40 characters
Open TriStar 3000
5-8 Feb 03
Mass Enter the sample’s mass.
Use 1.000 when performing a blank analysis.
Density This value is used only for the Quasi-Gemini or Calcu-lated free-space method.
Use 0.000 when performing a blank analysis.
Type of Data Choose whether data are to be collected automatically bythe analysis program or manually entered.
If you choose Manually entered, an “Entered” tab isadded so that you may enter the desired data.
Displays a dialog box so that you may enter pertinent in-formation relating to the sample file. For example, if youare not using automatic degassing, you may wish to en-ter external degassing information. Any information youenter here is printed as part of the sample log report.You may make multiple entries by selecting this push but-ton as many times as you wish.
Allows you to copy an existing sample file’s values intothe sample information file you are creating. An “openfile” dialog is displayed so that you may select the de-sired file. Click ; the values are copied into thenew file automatically. You may edit the values in thenew file; the file from which they were copied remainsunchanged. This replaces all parameters of the entire sam-ple information file, excluding any collected data fromthe other file.
Each of the individual tabbed dialogs contains a push button if youwish only to replace specific parameters and not the entire contents.
Comments Enter comments about the sample or its analysis condi-tions. Comments entered here are printed in the headerof the reports.
Saves the information you have specified for this samplefile.
Add Log Entry
Replace All...
OK
Replace...
Save
TriStar 3000 Open
Feb 03 5-9

Closes the dialog box. If changes have been made in thedialog and have not been saved, you will be prompted tosave before the dialog box closes.
Displays the sample information file in the basic format.
Close
Basic
Open TriStar 3000
5-10 Feb 03
Sample Tube
This dialog allows you to enter the specifics for a sample tube. A sample tubefile can be created as an independent parameter file or as part of the sample infor-mation file.
Be sure to save this file to the directory you specified as the Parameter Filesdirectory if it is to be included in the drop-down list of the Basic Sample In-formation dialog (see Parameter Files Directory in Chapter 8).
Sample Tube Enter a description for the file.
Range: 40 alphanumeric characters (at least onecharacter is required)
Allows you to replace the values in the current sampletube file with those from an existing file. An “open file”dialog is displayed so that you may select the desiredfile. Click ; the values are copied into the newfile automatically. You may edit the values in the newfile; the file from which they were copied remains un-changed
Stem Diameter Select the diameter of the sample tube you are using forthis analysis.
Replace...
OK
TriStar 3000 Open
Feb 03 5-11
Physical volume below mark
Enter the volume below the red line on the sample tube.Refer to Calibrating the Sample Tube in Chapter 2.
This value is used only when using the Quasi-Gemini orCalculated method for measuring the free space.
If you plan to use a calculated free space or the Quasi-Gemini method, it is agood idea to set up these files for your sample tubes.
Use isothermal jacketUse filler rod
Select whether you are using an isothermal jacket and/ora filler rod.
A filler rod is used to reduce the stem free-spacevolume, resulting in reduction of free-space error.
An isothermal jacket is used to maintain a constant tem-perature profile along the sample tube stem during an ex-tended analysis (more than 1 or 2 hours).
Open TriStar 3000
5-12 Feb 03
Degas Conditions
This dialog is used only if you are using the SmartPrep Degasser for degassingyour sample.
Be sure to save this file to the directory you specified as the Parameter Filesdirectory if it is to be included in the drop-down list of the Basic Sample In-formation dialog (see Parameter Files Directory in Chapter 8).
Description If you are opening an existing file, this field contains thedescription.
If this is a new file, enter a description.
Range: 40 alphanumeric characters (at least onecharacter is required)
Allows you to copy the values of an existing degas condi-tions file into the file you have open. An “open file” dia-log is displayed so that you may select the desired file.Click ; the values are copied into the new fileautomatically. You may edit the values in the new file;the file from which they were copied remains unchanged.
Conditions Table Allows you to enter up to five stages of degas condi-tions.
Replace...
OK
TriStar 3000 Open
Feb 03 5-13

Soak Temperature Enter the temperature at which the sample is to soakwhile flowing gas.
Ramp Rate Enter the rate at which the temperature is to changewhen advancing to the soak temperature.
Soak Time Enter the amount of time to soak the sample.
Inserts a row into the conditions table. A row is insertedabove the selected line; the cursor moves to the new line.
Deletes the selected row from the conditions table.
Clears all entries contained in the conditions table. Therows do not have to be selected.
Insert
Delete
Clear
Open TriStar 3000
5-14 Feb 03
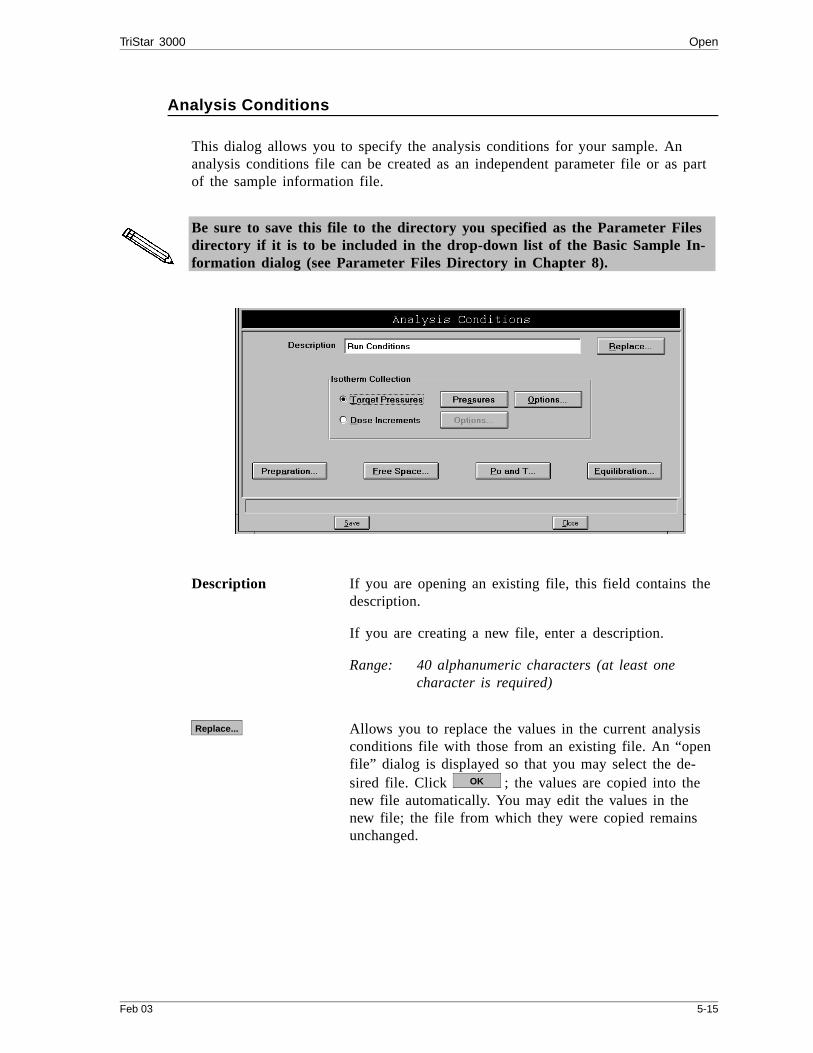
Analysis Conditions
This dialog allows you to specify the analysis conditions for your sample. Ananalysis conditions file can be created as an independent parameter file or as partof the sample information file.
Be sure to save this file to the directory you specified as the Parameter Filesdirectory if it is to be included in the drop-down list of the Basic Sample In-formation dialog (see Parameter Files Directory in Chapter 8).
Description If you are opening an existing file, this field contains thedescription.
If you are creating a new file, enter a description.
Range: 40 alphanumeric characters (at least one character is required)
Allows you to replace the values in the current analysisconditions file with those from an existing file. An “openfile” dialog is displayed so that you may select the de-sired file. Click ; the values are copied into thenew file automatically. You may edit the values in thenew file; the file from which they were copied remainsunchanged.
Replace...
OK
TriStar 3000 Open
Feb 03 5-15
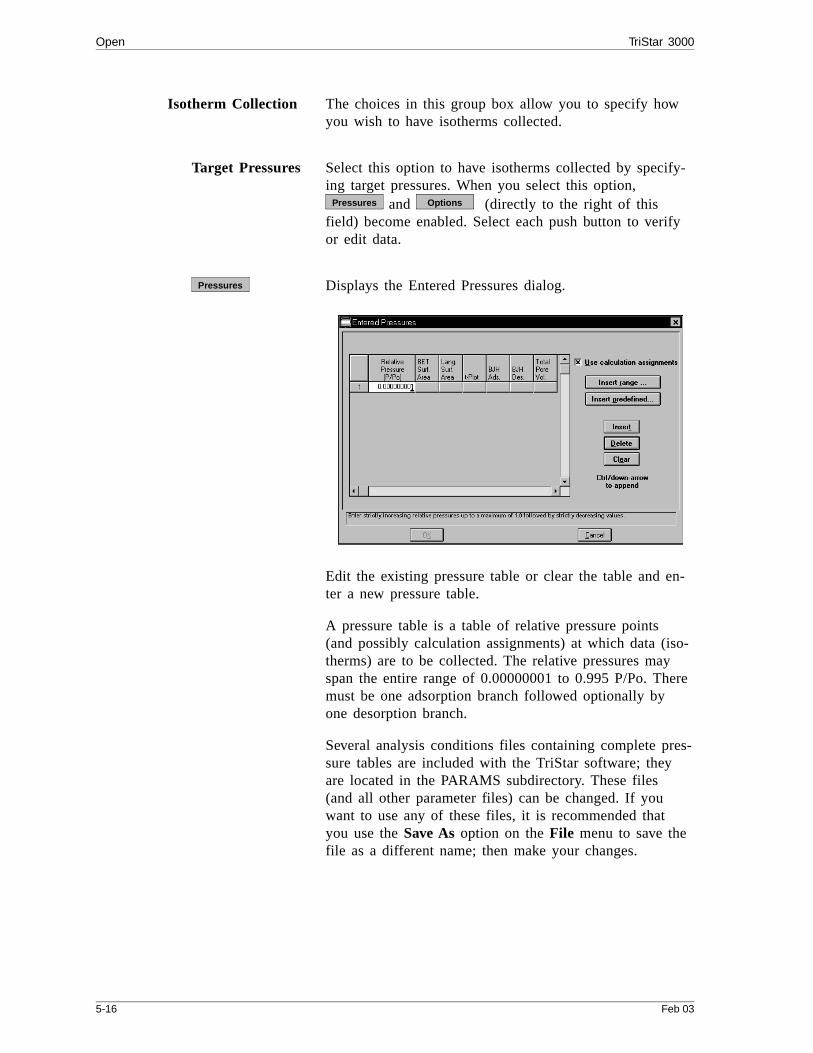
Isotherm Collection The choices in this group box allow you to specify howyou wish to have isotherms collected.
Target Pressures Select this option to have isotherms collected by specify-ing target pressures. When you select this option,
and (directly to the right of thisfield) become enabled. Select each push button to verifyor edit data.
Displays the Entered Pressures dialog.
Edit the existing pressure table or clear the table and en-ter a new pressure table.
A pressure table is a table of relative pressure points(and possibly calculation assignments) at which data (iso-therms) are to be collected. The relative pressures mayspan the entire range of 0.00000001 to 0.995 P/Po. Theremust be one adsorption branch followed optionally byone desorption branch.
Several analysis conditions files containing complete pres-sure tables are included with the TriStar software; theyare located in the PARAMS subdirectory. These files(and all other parameter files) can be changed. If youwant to use any of these files, it is recommended thatyou use the Save As option on the File menu to save thefile as a different name; then make your changes.
Pressures Options
Pressures
Open TriStar 3000
5-16 Feb 03

(continued)
The pressure table for automatically collected data in-cludes the pressure points for data collection and (whenUse calculation assignments is selected) identifies calcu-lations through which the data are processed. The systemprocesses data for the following reports:
• BET surface area• Langmuir surface area• t-Plot• BJH Adsorption• BJH Desorption• Total pore volume
Displays the Insert Pressure Range dialog.
This dialog allows you to specify the starting pressure,the ending pressure, the number of points to insertwithin the specified range, and whether you wish to havelinear or geometric progression.
Choose Linear to insert evenly spaced points into your ta-ble.
Choose Geometric from low pressure to insert geometri-cally spaced points from the low pressure range. For ex-ample, if you wish to insert 5 points with a 0.01 startingpressure and a 0.16 ending pressure, the following pointsare inserted into the table:
0.010.020.040.080.16
Pressures
Insert range...
TriStar 3000 Open
Feb 03 5-17

(continued)
Choose Geometric from saturation to insert geometricallyspaced points from the saturation pressure. For example,if you wish to insert 5 points with a 0.99 starting pres-sure and a 0.84 ending pressure, the following points areinserted into the table:
0.990.980.960.920.84
Displays the Insert Predefined Pressures dialog.
Choose predefined pressure points for surface area, t-Plotmicropore and/or BJH adsorption/desorption.
Click on the down arrow of each field to choose the de-sired set of points. You can also specify Adsorp-tion/desorption total pore volume and saturation.
Inserts a row into the pressure table. A row is insertedabove the selected line; the cursor moves to the new line.
Deletes the selected row.
Clears all entries from the table. The rows do not haveto be selected.
Pressures
Insert predefined
Insert
Delete
Clear
Open TriStar 3000
5-18 Feb 03

Allows you to specify target pressure options; the TargetPressure Options dialog box is displayed.
First Pressure Fixed Dose Select this option to have the sample dosed with a speci-fied amount of gas until the first pressure point isreached. This initial dosing quickly meets the adsorptivedemand of the sample.
The first point on the pressure table is the thresholdvalue. Once this first pressure point is reached, pointsare equilibrated and recorded in accordance with thespecified pressure table.
You may wish to use this mode if you are performing astandard nitrogen analysis of microporous or highlymesoporous materials such as catalysts. If the first pres-sure table point is low, and you expect the gas uptake ofthe sample to be high, choosing this mode can shortenthe time required to reach the first point on the pressuretable.
Maximum volume increment Select this option to specify when additional data pointsare to be collected between target pressures in regions ofhigh adsorption. When the maximum increment has beenadsorbed since the last collected data point, another pointis equilibrated and collected.
When using this option, reaching pressure points exactlyis not important; therefore, the tolerances should be setrelatively large (10 mmHg and 10% or so) for properfunctioning of the algorithm. The pressure table shouldalso have several points scattered over the region of inter-est.
Options
TriStar 3000 Open
Feb 03 5-19
(continued)
During desorption, this field is treated as a maximum vol-ume “decrement” value.
Absolute pressure toleranceRelative pressure toleranceThese values are used to determine how close the actualpressure must be to each target pressure from the pres-sure table. At lower pressures the relative tolerancevalue is lower, and at higher pressures the absolute toler-ance value is lower. For example:
Experiment 1: you have an absolute tolerance of 5mmHg, a relative tolerance of 5%, and a target pressureof 40 mmHg; 5% of 40 mmHg is 2 mmHg. Since 2mmHg (relative tolerance) is lower than 5 mmHg (abso-lute tolerance), 2 mmHg is used. Therefore a minimumpressure of 38 mmHg (40 - 2) must be attained to col-lect data for a target pressure of 40 mmHg.
Experiment 2: you have an absolute tolerance of 5mmHg, a relative tolerance of 5%, and a target pressureof 200 mmHg; 5% of 200 mmHg is 10 mmHg. Since 5mmHg (absolute tolerance) is lower than 10 mmHg (rela-tive tolerance), 5 mmHg is used. Therefore a minimumpressure of 195 mmHg (200 - 5) must be attained to col-lect data for a target pressure of 200 mmHg.
Normally, surface area measurement points are widelyspaced, and the resulting measurement is not very sensi-tive to the precise location of points so wider tolerancesmay be used. Unnecessarily tight tolerances lengthen theanalysis.
Options
Open TriStar 3000
5-20 Feb 03
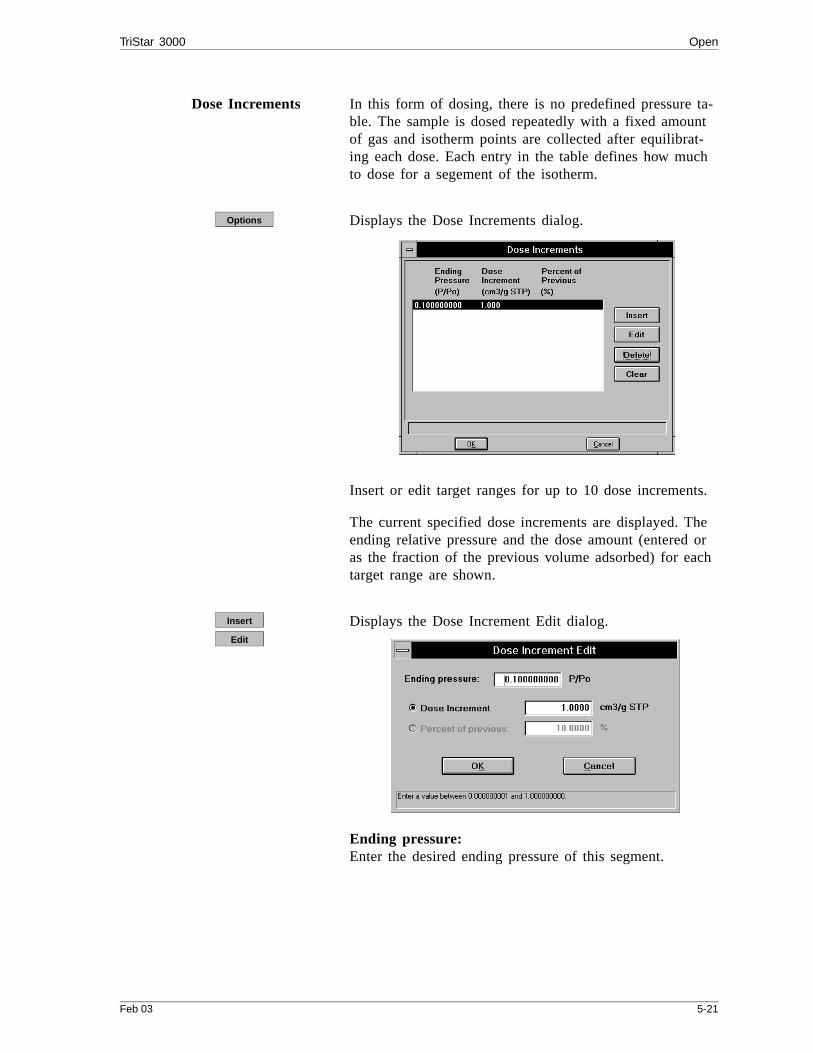
Dose Increments In this form of dosing, there is no predefined pressure ta-ble. The sample is dosed repeatedly with a fixed amountof gas and isotherm points are collected after equilibrat-ing each dose. Each entry in the table defines how muchto dose for a segement of the isotherm.
Displays the Dose Increments dialog.
Insert or edit target ranges for up to 10 dose increments.
The current specified dose increments are displayed. Theending relative pressure and the dose amount (entered oras the fraction of the previous volume adsorbed) for eachtarget range are shown.
Displays the Dose Increment Edit dialog.
Ending pressure:Enter the desired ending pressure of this segment.
Options
Insert
Edit
TriStar 3000 Open
Feb 03 5-21
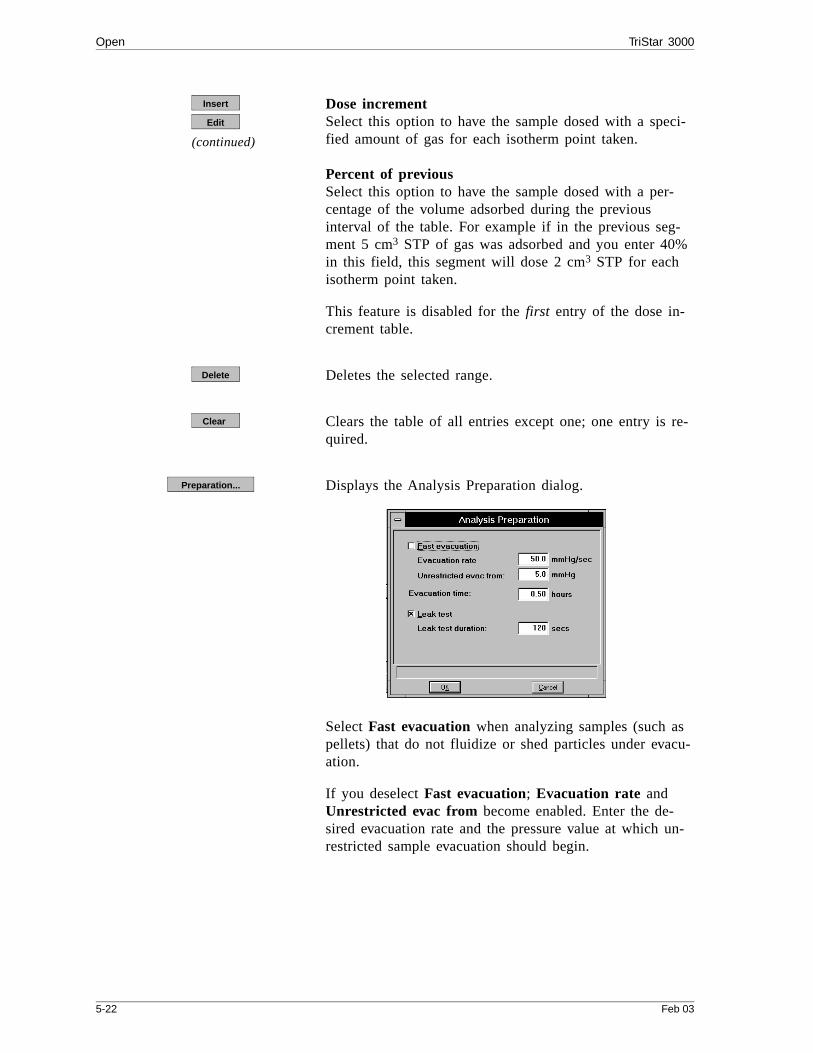
(continued)
Dose incrementSelect this option to have the sample dosed with a speci-fied amount of gas for each isotherm point taken.
Percent of previousSelect this option to have the sample dosed with a per-centage of the volume adsorbed during the previousinterval of the table. For example if in the previous seg-ment 5 cm3 STP of gas was adsorbed and you enter 40%in this field, this segment will dose 2 cm3 STP for eachisotherm point taken.
This feature is disabled for the first entry of the dose in-crement table.
Deletes the selected range.
Clears the table of all entries except one; one entry is re-quired.
Displays the Analysis Preparation dialog.
Select Fast evacuation when analyzing samples (such aspellets) that do not fluidize or shed particles under evacu-ation.
If you deselect Fast evacuation; Evacuation rate andUnrestricted evac from become enabled. Enter the de-sired evacuation rate and the pressure value at which un-restricted sample evacuation should begin.
Insert
Edit
Delete
Clear
Preparation...
Open TriStar 3000
5-22 Feb 03

(continued)
In the Evacuation time field, enter the time you wish toallow for preliminary evacuation which takes place priorto free-space measurement.
Select Leak test to check for system leaks or sample out-gassing before the analysis. The leak test seals the sam-ple tube and monitors the pressure. If the pressure risesmore than 0.15 mmHg, the analysis does not proceedand you are notified with a message. While leak testingslightly increases analysis time, it prevents the continu-ation of analysis and collection of erroneous data if aleak exists.
If you select Leak Test, enter the amount of time youwant the pressure monitored.
Displays the Free Space dialog.
Specify the type of free-space measurement you wish tohave performed. Refer to Appendix F for a discussion offree-space methods.
Measure Measures the free space automatically over the sampleprior to data collection.
Lower Dewar for evacuationLowers the dewar during evacuation.
Evacuation timeEnter the time you wish to allow for evacuation after thefree-space measurement.
Preparation...
Free Space...
TriStar 3000 Open
Feb 03 5-23

Measure(continued)
Outgas testChecks the system for sample outgassing after the free-space measurement. The outgas test seals the sampletube and monitors the pressure. If the pressure risesmore than 0.025 mmHg within the time specified for theoutgas test duration, outgassing is present. If outgassingis found, the test repeats up to nine times with a 30-min-ute evacuation time between each test. If the 10th testfails, the analysis does not proceed and you are notifiedof its cancellation. Outgas testing slightly increases analy-sis time, but it prevents continuation of analysis and col-lection of erroneous data if outgassing is present.
Enter the outgas test duration.
Quasi-Gemini Select this option to have the free space of the sampletube continuously balanced against an identical emptysample tube. For each data point taken on the isotherm,a corresponding measurement is taken with the emptysample tube (must be connected on port 2) and that gas quantity subtracted from the gasquantity in the actual sample tube.
Calculate Select this option to have the free-space measurement cal-culated using the sample and tube parameters.
Enter Enables the Warm free space and Cold free spacefields so that you may enter the free space manually.
The warm free space is the sample tube gas capacitymeasured at room temperature.
The cold free space is the sample tube gas capacity meas-ured with the Dewar raised.
Open TriStar 3000
5-24 Feb 03

Displays the Po and Temperature Options dialog.
This dialog provides four options for obtaining the satura-tion pressure (Po) and analysis bath temperature. Click-ing on each option prompts you for the entry of relatedparameters in the lower portion of the dialog box.
Option Prompts for...
1 a measurement interval (how often duringanalysis the Po is to be measured) and theanalysis bath temperature
This method may slow analysis time slightlysince the sample port and the Po tube bothrequire interaction with the manifoldplumbing system.
2 a Po and analysis bath temperature
This methoid uses the values you enter inthe Po and temperature fields.
3 an analysis bath temperature and an estimatefor the initial Po.
This method measures the Po over thesample. After the Po is measured, the valueis reapplied to all data points.
Po and T...
TriStar 3000 Open
Feb 03 5-25
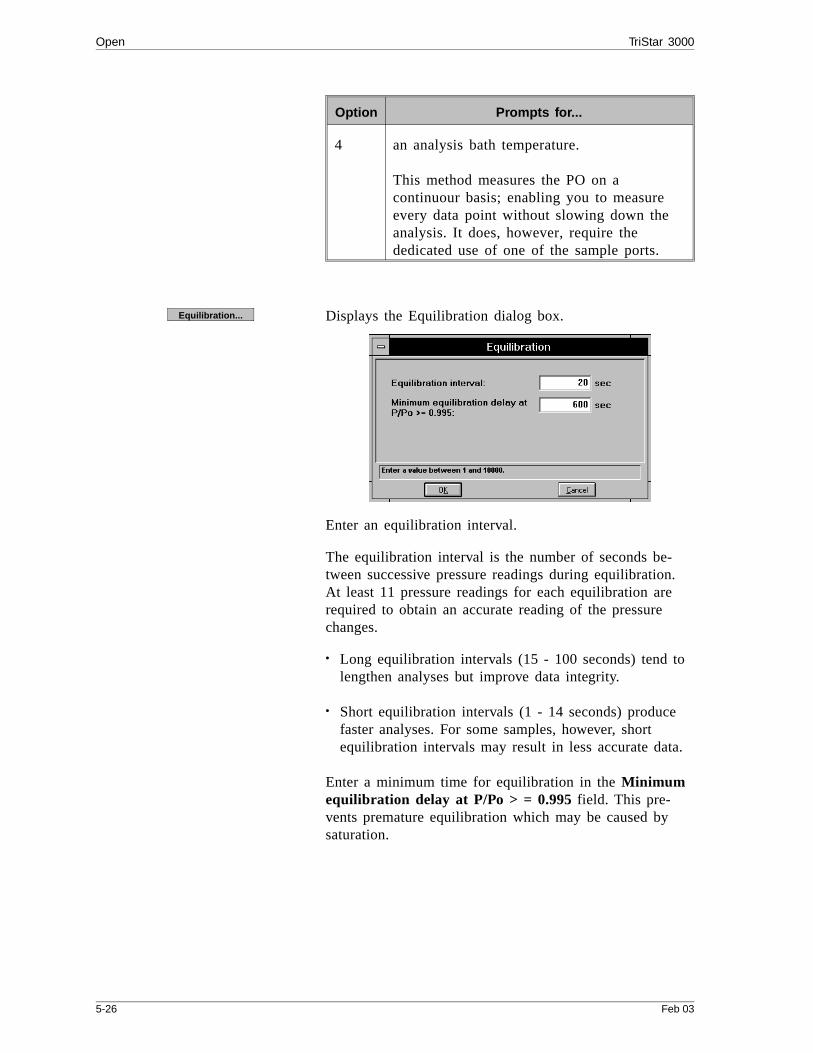
Option Prompts for...
4 an analysis bath temperature.
This method measures the PO on acontinuour basis; enabling you to measureevery data point without slowing down theanalysis. It does, however, require thededicated use of one of the sample ports.
Displays the Equilibration dialog box.
Enter an equilibration interval.
The equilibration interval is the number of seconds be-tween successive pressure readings during equilibration.At least 11 pressure readings for each equilibration arerequired to obtain an accurate reading of the pressurechanges.
• Long equilibration intervals (15 - 100 seconds) tend tolengthen analyses but improve data integrity.
• Short equilibration intervals (1 - 14 seconds) producefaster analyses. For some samples, however, shortequilibration intervals may result in less accurate data.
Enter a minimum time for equilibration in the Minimumequilibration delay at P/Po > = 0.995 field. This pre-vents premature equilibration which may be caused bysaturation.
Equilibration...
Open TriStar 3000
5-26 Feb 03
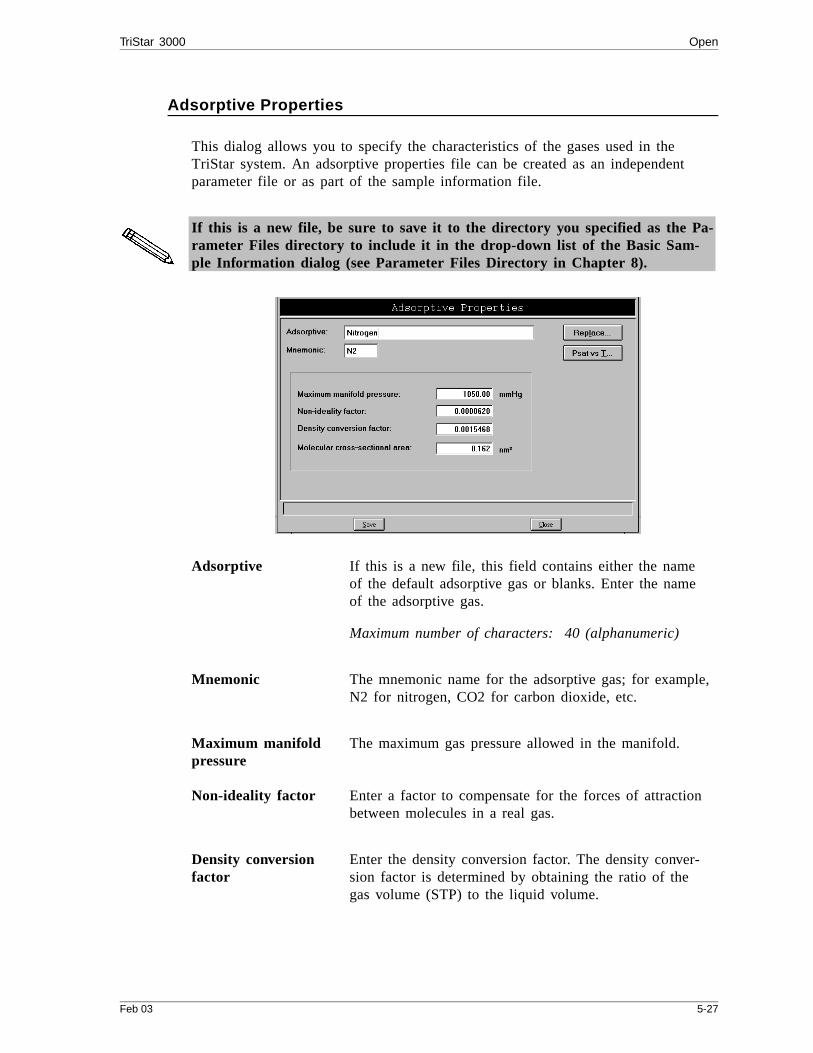
Adsorptive Properties
This dialog allows you to specify the characteristics of the gases used in theTriStar system. An adsorptive properties file can be created as an independentparameter file or as part of the sample information file.
If this is a new file, be sure to save it to the directory you specified as the Pa-rameter Files directory to include it in the drop-down list of the Basic Sam-ple Information dialog (see Parameter Files Directory in Chapter 8).
Adsorptive If this is a new file, this field contains either the nameof the default adsorptive gas or blanks. Enter the nameof the adsorptive gas.
Maximum number of characters: 40 (alphanumeric)
Mnemonic The mnemonic name for the adsorptive gas; for example,N2 for nitrogen, CO2 for carbon dioxide, etc.
Maximum manifold pressure
The maximum gas pressure allowed in the manifold.
Non-ideality factor Enter a factor to compensate for the forces of attractionbetween molecules in a real gas.
Density conversion factor
Enter the density conversion factor. The density conver-sion factor is determined by obtaining the ratio of thegas volume (STP) to the liquid volume.
TriStar 3000 Open
Feb 03 5-27

Molecular cross-sectional area
The molecular cross-sectional area.
Allows you to replace the values in the current adsorp-tive properties file with those from another file. An“open file” dialog box is displayed so that you may se-lect the desired file. Click ; the values are cop-ied into the new file automatically. You may edit thevalues in the new file; the file from which they were cop-ied remains unchanged.
Displays the Psat vs. Temperature dialog for the adsorp-tive gas.
This table contains saturation pressures and their corre-sponding temperatures. The table may include as manyas ten entries; at least two are required.
Edit the table by moving the cursor to the desired satura-tion pressure or temperature and entering a differentvalue. Points always have to be in an ascending order. Ifyou try to add a point which is less than the previousone, you will receive an error message.
Inserts a new row. A row is inserted above the selectedline; the cursor moves to the new line.
Deletes the selected row.
Replace...
OK
Psat vs t...
Insert
Delete
Open TriStar 3000
5-28 Feb 03
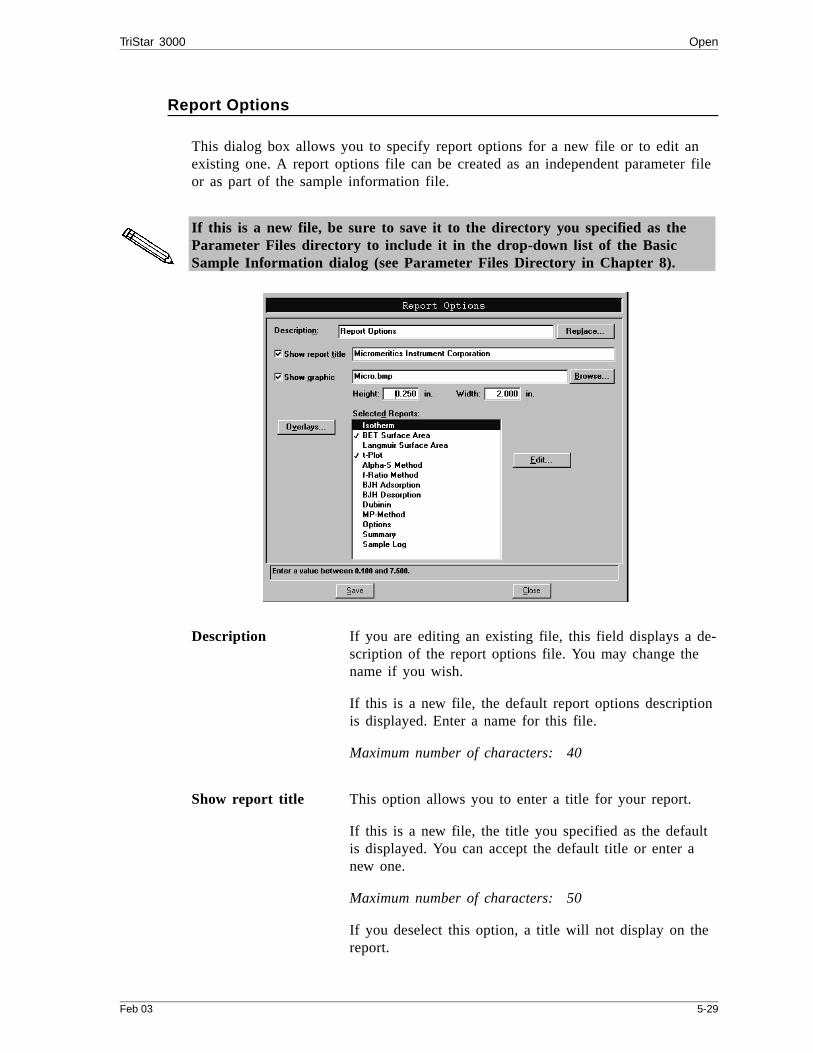
Report Options
This dialog box allows you to specify report options for a new file or to edit anexisting one. A report options file can be created as an independent parameter fileor as part of the sample information file.
If this is a new file, be sure to save it to the directory you specified as theParameter Files directory to include it in the drop-down list of the BasicSample Information dialog (see Parameter Files Directory in Chapter 8).
Description If you are editing an existing file, this field displays a de-scription of the report options file. You may change thename if you wish.
If this is a new file, the default report options descriptionis displayed. Enter a name for this file.
Maximum number of characters: 40
Show report title This option allows you to enter a title for your report.
If this is a new file, the title you specified as the defaultis displayed. You can accept the default title or enter anew one.
Maximum number of characters: 50
If you deselect this option, a title will not display on thereport.
TriStar 3000 Open
Feb 03 5-29

Show graphic Select this option to have a graphic display above the re-port title. The graphic can be in a bitmap (bmp) or an en-hanced metafile (emf) format. For example, you maywish to display your company logo.
Click to choose the graphic, then enter theheight and width in the appropriate fields. This imagecan also be edited from the report window.
Allows you to replace the values in the current report op-tions file with those from an existing file. An “open file”dialog box is displayed so that you may select the de-sired file. Click ; the values are copied into thenew file automatically. You may edit the values in thenew file; the file from which they were copied remainsunchanged.
Displays the Graph Overlay Samples dialog.
Choose the sample files you wish to overlay ontoselected plots.
Click to the right of the sample [n] field tochoose a file. You may select up to eight files. Afterchoosing your file(s), be sure to select the “Overlay sam-ples” option for each report type you plan to overlay. Re-fer to Chapter 4 for instructions on generating overlays.
Browse...
Replace...
OK
Overlays
Browse...
Open TriStar 3000
5-30 Feb 03
Selected Reports Contains a list of available reports:
• Isotherm• BET Surface Area• Langmuir Surface Area• t-Plot• Alpha-S Method• f-Ratio Method• BJH Adsorption• BJH Desorption• Dubinin• MP-Method• Options Report• Summary Report• Sample Log Report
You can find examples of these reports in Chapter 7.
Using the mouse pointer or the arrow keys, move to thedesired report and double-click the left mouse button, orpress . A report is selected when it is precededwith a check mark. You may deselect it in the same man-ner.
Displays an associated dialog for the selected report. Edit-ing options for available reports are shown in the follow-ing sections.
This button is disabled for some reports, such as the Op-tions and Sample Log reports, since they do not containparameters which may be edited.
Spacebar
Edit
TriStar 3000 Open
Feb 03 5-31
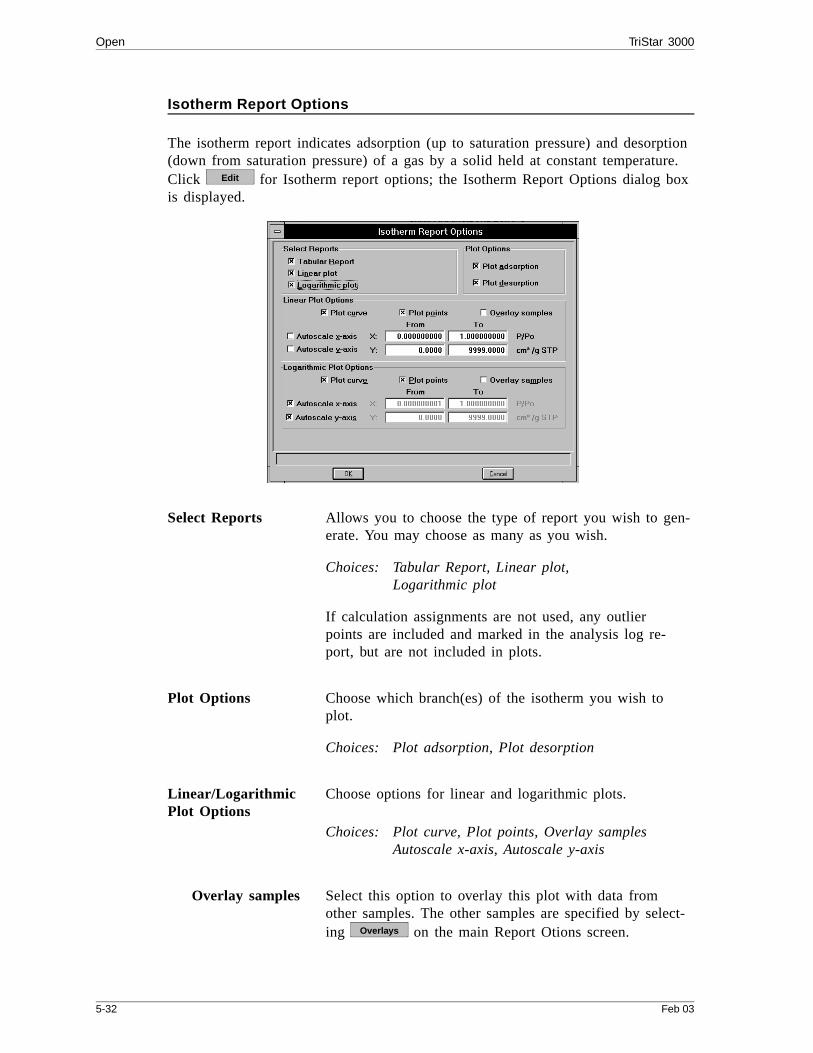
Isotherm Report Options
The isotherm report indicates adsorption (up to saturation pressure) and desorption(down from saturation pressure) of a gas by a solid held at constant temperature.Click for Isotherm report options; the Isotherm Report Options dialog boxis displayed.
Select Reports Allows you to choose the type of report you wish to gen-erate. You may choose as many as you wish.
Choices: Tabular Report, Linear plot, Logarithmic plot
If calculation assignments are not used, any outlierpoints are included and marked in the analysis log re-port, but are not included in plots.
Plot Options Choose which branch(es) of the isotherm you wish toplot.
Choices: Plot adsorption, Plot desorption
Linear/LogarithmicPlot Options
Choose options for linear and logarithmic plots.
Choices: Plot curve, Plot points, Overlay samplesAutoscale x-axis, Autoscale y-axis
Overlay samples Select this option to overlay this plot with data fromother samples. The other samples are specified by select-ing on the main Report Otions screen.
Edit
Overlays
Open TriStar 3000
5-32 Feb 03
Autoscale x-axisAutoscale y-axis
Choose this option to have the x- and/or y-axes scaledautomatically. The lowest and highest values collectedduring analysis are used as the beginning and endingpoints.
Deselect the autoscale options to specify beginning andending ranges; the corresponding From and To fields be-come enabled.
The X-axis shows the relative pressure.
The Y-axis shows the volume of gas adsorbed.
From/To fields Specify beginning and ending values for the x- and y-axes ranges when you choose not to autoscale data. Datacollected outside these ranges are not included in the plot.
TriStar 3000 Open
Feb 03 5-33

BET/Langmuir Surface Area Report Options
• The BET calculation obtains the sample surface area value by determiningthe monolayer volume of adsorbed gas from the isotherm data.
• The Langmuir calculation determines the surface area of a sample by relat-ing the surface area to the volume of gas adsorbed as a monolayer.
Click for BET (or Langmuir) surface area report options; the BET (orLangmuir) Surface Area Report Options dialog box is displayed.
The Langmuir and BET Surface Area dialogs include the same fields; theoperating instructions for both are the same.
Tabular report Select this option to have a tabular report of the plotteddata.
BET (or Langmuir)Transform plot
Generates a traditional BET (Langmuir) surface area plotthat is used to determine monolayer volume and BET Cconstant.
BET (or Langmuir)Isotherm plot
Uses the BET (Langmuir) monolayer volume and con-stant to produce an isotherm.
Edit
Displays as LangmuirSurface Area ReportOptions if the Langmuirreport is being edited.
Open TriStar 3000
5-34 Feb 03

Overlay samples Allows you to overlay data of the selected type from thecurrent plot with data from other samples. The other sam-ples are selected by clicking on the main Re-port Options screen.
Autoscale x-axis Autoscale y-axis
Select these options to have the X- and/or Y-axes scaledautomatically.
Both X- and Y-axes begin at zero; the system uses thehighest values collected during analysis as the endingpoints. If you choose not to autoscale data, the Fromand To fields are enabled, allowing you to enter theranges.
The X-Axis Range fields show the relative pressure.
The Y-Axis Range fields show the quantity of gasadsorbed.
From/To fields Enabled when you choose not to autoscale data (deselectthe Autoscale option), allowing you to specify the begin-ning and ending ranges of the X- and/or Y-axis. Data col-lected outside these ranges are not included in the plot.The valus entered in the To field must be greater thanthe value entered in the From field.
Displays the Report Relative Pressure Table dialog sothat you may edit or enter relative pressure points.
Overlays
Pressures
TriStar 3000 Open
Feb 03 5-35

(continued)
• If Use calculation assignments is not selected on thecollected/Entered dialog, the isotherm is interpolated tothese pressure points, and those interpolated values areused in the BET calculations.
• If Use calculation assignments is selected, collecteddata are used.
Displays the Surface Area Report Pressure Selection dia-log, allowing you to select predefined points.
Choices: None, 1 Point, 3 Point, 5 Point, 5 Point Low Pressure
Inserts a row into the table above the selected line; thecursor moves to the new line.
Deletes the selected row.
Removes all but the one required entry from the table.The rows do not have to be selected. A warning messagerequesting confirmation is displayed before the table iscleared.
Pressures
Insert predefined
Insert
Delete
Clear
Open TriStar 3000
5-36 Feb 03
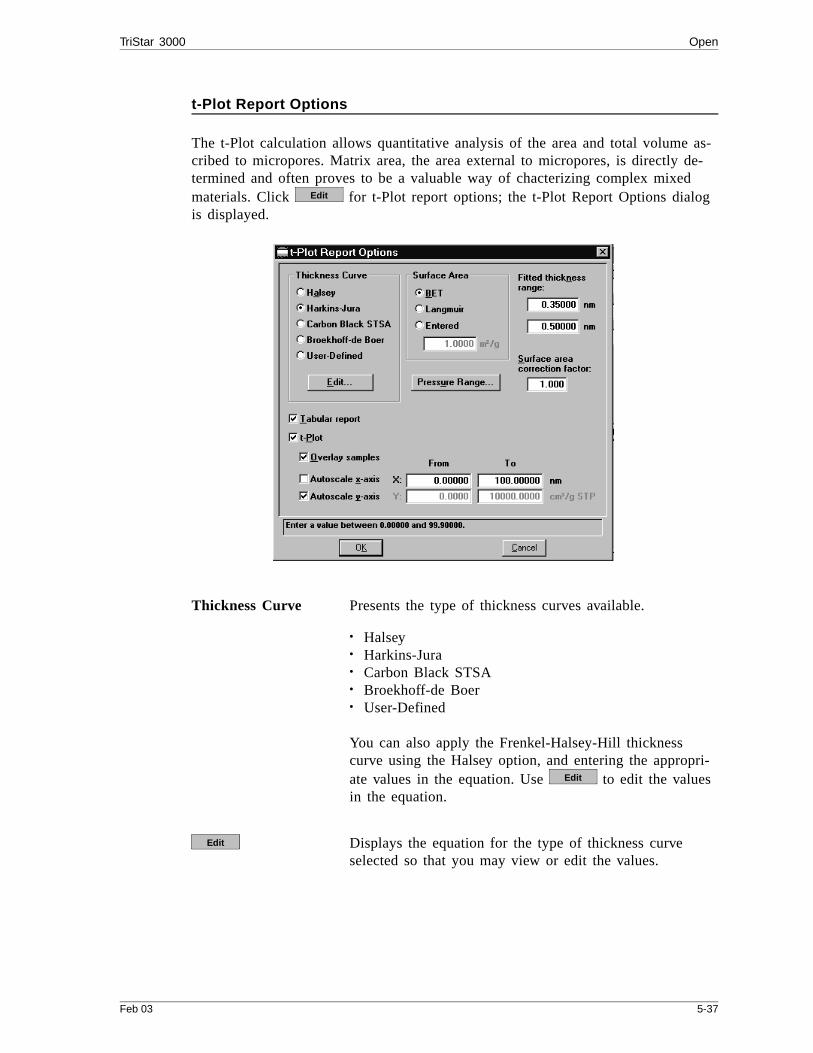
t-Plot Report Options
The t-Plot calculation allows quantitative analysis of the area and total volume as-cribed to micropores. Matrix area, the area external to micropores, is directly de-termined and often proves to be a valuable way of chacterizing complex mixedmaterials. Click for t-Plot report options; the t-Plot Report Options dialogis displayed.
Thickness Curve Presents the type of thickness curves available.
• Halsey• Harkins-Jura• Carbon Black STSA• Broekhoff-de Boer• User-Defined
You can also apply the Frenkel-Halsey-Hill thicknesscurve using the Halsey option, and entering the appropri-ate values in the equation. Use to edit the valuesin the equation.
Displays the equation for the type of thickness curveselected so that you may view or edit the values.
Edit
Edit
Edit
TriStar 3000 Open
Feb 03 5-37
Halsey Displays the Halsey Thickness Equation dialog.
You can edit the values for the multiplier, numerator, andexponent.
Refer to Appendix C, Calculations, for more informa-tion.
Harkins-Jura Displays the Harkins-Jura Thickness Equation dialog.
You can edit the values for the numerator, first elementof the denominator, and exponent.
Refer to Appendix C, Calculations, for more informa-tion.
Carbon Black STSA
Displays the STSA Thickness Equation dialog.
All coefficients can be edited.
Open TriStar 3000
5-38 Feb 03
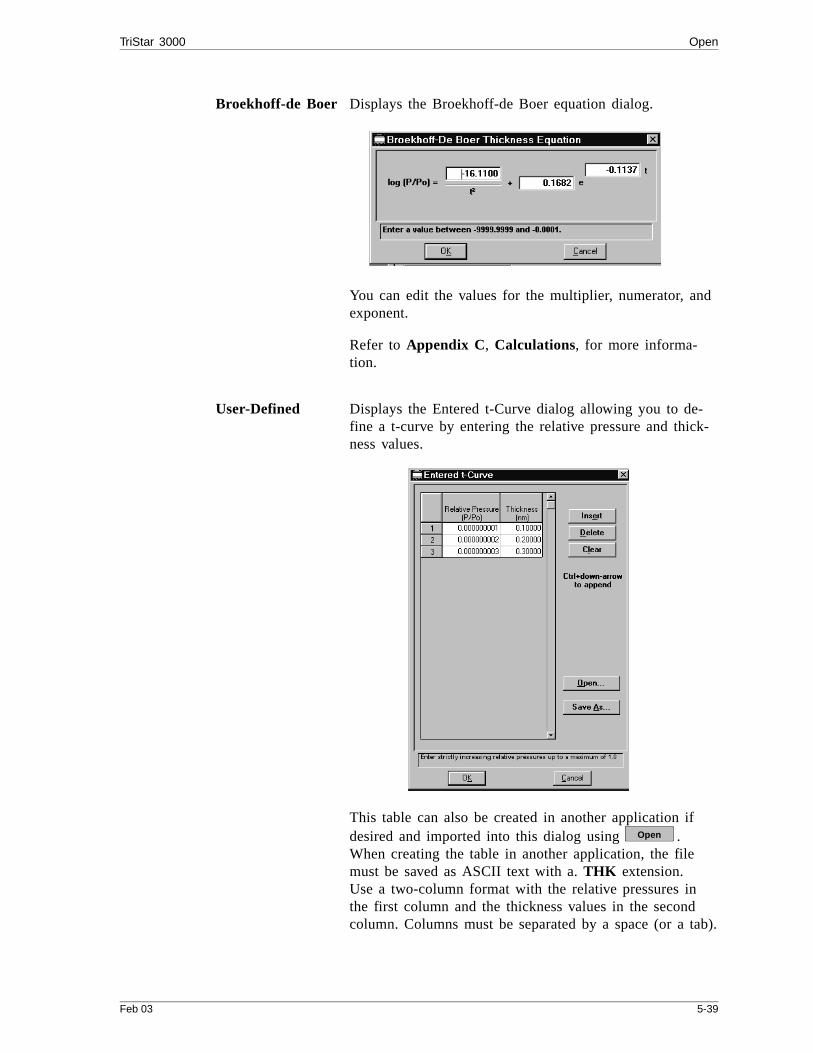
Broekhoff-de Boer Displays the Broekhoff-de Boer equation dialog.
You can edit the values for the multiplier, numerator, andexponent.
Refer to Appendix C, Calculations, for more informa-tion.
User-Defined Displays the Entered t-Curve dialog allowing you to de-fine a t-curve by entering the relative pressure and thick-ness values.
This table can also be created in another application ifdesired and imported into this dialog using .When creating the table in another application, the filemust be saved as ASCII text with a. THK extension.Use a two-column format with the relative pressures inthe first column and the thickness values in the secondcolumn. Columns must be separated by a space (or a tab).
Open
TriStar 3000 Open
Feb 03 5-39

Allows you to import the values from an existing thick-ness curve (THK) into this table. One predefined curveis shipped with the analysis program and is found in theReferenc directory. The Referenc directory is defaultedwhen you select this push button.
After the values are copied into the table, you may editthem if desired. Editing these values will not affect thefile from which they were copied.
Enables you to save the current table of values under afile name.
Clears the table of all but one entry; one entry is re-quired.
Surface Areagroup box
Allows you to choose the surface area value used forthickness calculations. You can use BET (most commonlyused), Langmuir, or enter one of preference.
Displays the Report Relative Pressure Range dialog sothat you may specify minimum and maximum relativepressures to use with this report.
• If Use calculation assignments is not selected on theCollected/Entered dialog, all of the nonoutlier pointsof the collected data within the specified range areused for calculating the data for this report..
• If Use calculation assignments is selected, collecteddata points which are assigned to this report type areused.
Open
Save as
Clear
Pressure range
Open TriStar 3000
5-40 Feb 03
Fitted ThicknessRange
Provides two fields, allowing you to enter the minimumand maximum thicknesses you wish to include in thethickness curve.
The values entered for the thicknesses can be expressed in angstroms ornanometers. Select Data presentation from the Options menu to specify de-sired units.
Surface area correction factor
This value corrects for surface areas that are not smoothand brings the values for BET surface area and micro-pore surface area into accordance. For most samples, thedefault value of 1.000 is adequate.
Tabular report Select this option to have a tabular report generated.
t-Plot Select this option to have a graphical representation ofdata.
Overlay samples Allows you to overlay data from the current sample filewith data from other sample file(s). The other samplefile(s) are chosen by clicking on the main Re-port Options screen.
Autoscale x-axis Autoscale y-axis
Select these options to have the X- and/or Y-axes scaledautomatically.
Both X- and Y-axes begin at zero; the system uses thehighest values collected during analysis as the endingpoints.
If you choose not to autoscale data, the From and Tofields are enabled, allowing you to enter the ranges.
From/To fields Enabled when you choose not to autoscale data (deselectthe Autoscale option), allowing you to specify the begin-ning and ending ranges of the X- and/or Y-axis. Data col-lected outside these ranges are not included in the plot.
The value entered in the To field must be greater thanthe value entered in the From field.
• The X-Axis Range fields show the relative pressure• The Y-Axis Range fields show the quantity of gas
adsorbed.
Overlays
TriStar 3000 Open
Feb 03 5-41

Alpha-S Plot
The Alpha-S plot converts the standard adsorption isotherm into a dimensionlessisotherm using the quantity adsorbed at a relative pressure of 0.4.
Table Provides two columns for entering the relative pressure(first column) and the alpha-s values (second column).
This table can also be created in another application ifdesired and imported into this dialog using .When creating the table in another application, the filemust be saved as ASCII text with an ALS extension. Usea two-column format with the relative pressures in thefirst column and the alpha-s values in the second col-umn. Columns must be separated by a space (or a tab).
Allows you to import the values from an existing alpha-scurve (ALS) into the table. One predefined curve isshipped with the analysis program and is located in theReferenc directory. The Referenc directory is defaultedwhen you click this push button. After the values are cop-ied into the table, you may edit them if desired. Editingthese values will not affect the file from which theywere copied.
Open
Open
Open TriStar 3000
5-42 Feb 03
Enables you to save the current table of values under afile name.
Clears the table of all entries.
Fitted alpha-S Range Provides two fields for entering the minimum and maxi-mum relative pressures from which the fit will be deter-mined.
Relative pressurerange
Provides two fields for entering a pressure range whencalculation assignments are not used.
Tabular report Choose this option to have a tabular report generated
Alpha-S Plot Choose this option to have the data plotted as a graph.
Overlay samples Allows you to overlay data from the current sample filewith data from other sample file(s). The other samplefile(s1 are chosen by clicking on the main Re-port Options screen.
Autoscale x-axis Autoscale y-axis
Select these options to have the X- and/or Y-axes scaledautomatically.
Both X- and Y-axes begin at zero; the system uses thehighest values collected during analysis as the endingpoints.
If you choose not to autoscale data, the From and Tofields are enabled, allowing you to enter the ranges.
From/To fields Enabled when you choose not to autoscale data (deselectthe Autoscale option), allowing you to specify the begin-ning and ending ranges of the X- and/or Y-axis. Data col-lected outside these ranges are not included in the plot.The valus entered in the To field must be greater thanthe value entered in the From field.
• The X-Axis Range fields show the relative pressure.• The Y-Axis Range fields show the quantity of gas
adsorbed.
Save as
Clear
Overlays
TriStar 3000 Open
Feb 03 5-43
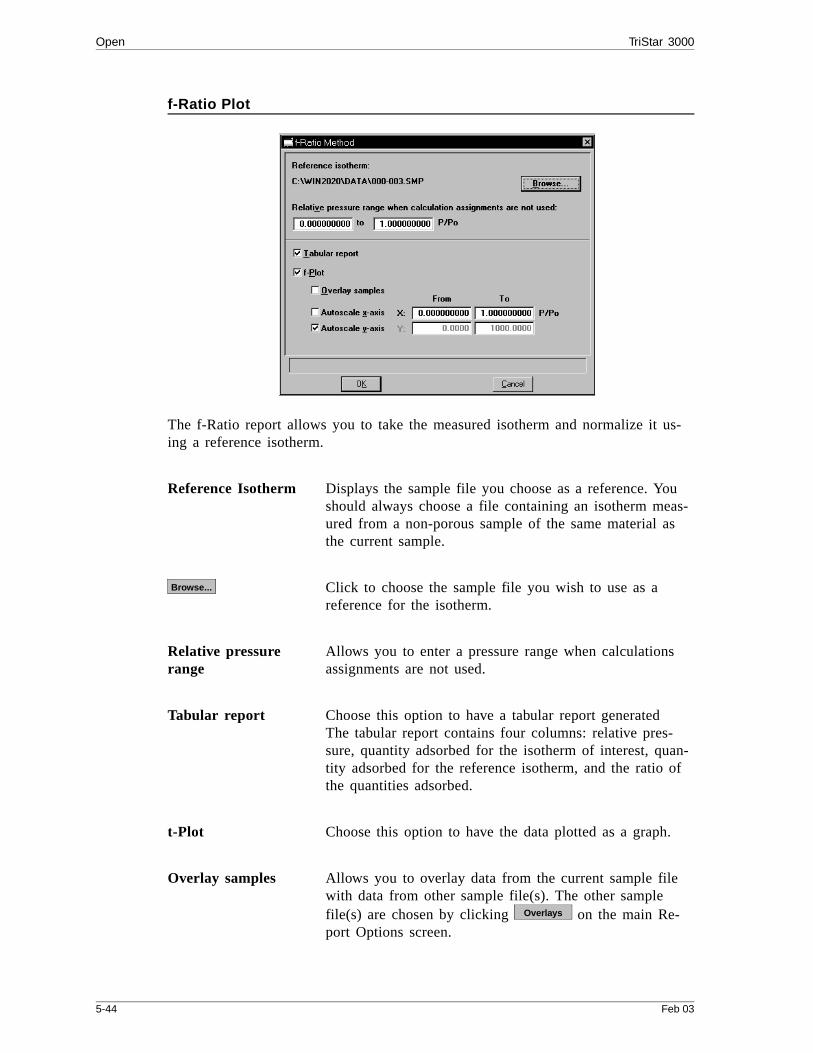
f-Ratio Plot
The f-Ratio report allows you to take the measured isotherm and normalize it us-ing a reference isotherm.
Reference Isotherm Displays the sample file you choose as a reference. Youshould always choose a file containing an isotherm meas-ured from a non-porous sample of the same material asthe current sample.
Click to choose the sample file you wish to use as areference for the isotherm.
Relative pressure range
Allows you to enter a pressure range when calculationsassignments are not used.
Tabular report Choose this option to have a tabular report generatedThe tabular report contains four columns: relative pres-sure, quantity adsorbed for the isotherm of interest, quan-tity adsorbed for the reference isotherm, and the ratio ofthe quantities adsorbed.
t-Plot Choose this option to have the data plotted as a graph.
Overlay samples Allows you to overlay data from the current sample filewith data from other sample file(s). The other samplefile(s) are chosen by clicking on the main Re-port Options screen.
Browse...
Overlays
Open TriStar 3000
5-44 Feb 03

Autoscale x-axisAutoscale y-axis
Select these options to have the X- and/or Y-axes scaledautomatically.
Both X- and Y-axes begin at zero; the system uses thehighest values collected during analysis as the endingpoints.
If you choose not to autoscale data, the From and Tofields are enabled, allowing you to enter the ranges.
From/To fields Enabled when you choose not to autoscale the axis, al-lowing you to enter a range.
TriStar 3000 Open
Feb 03 5-45
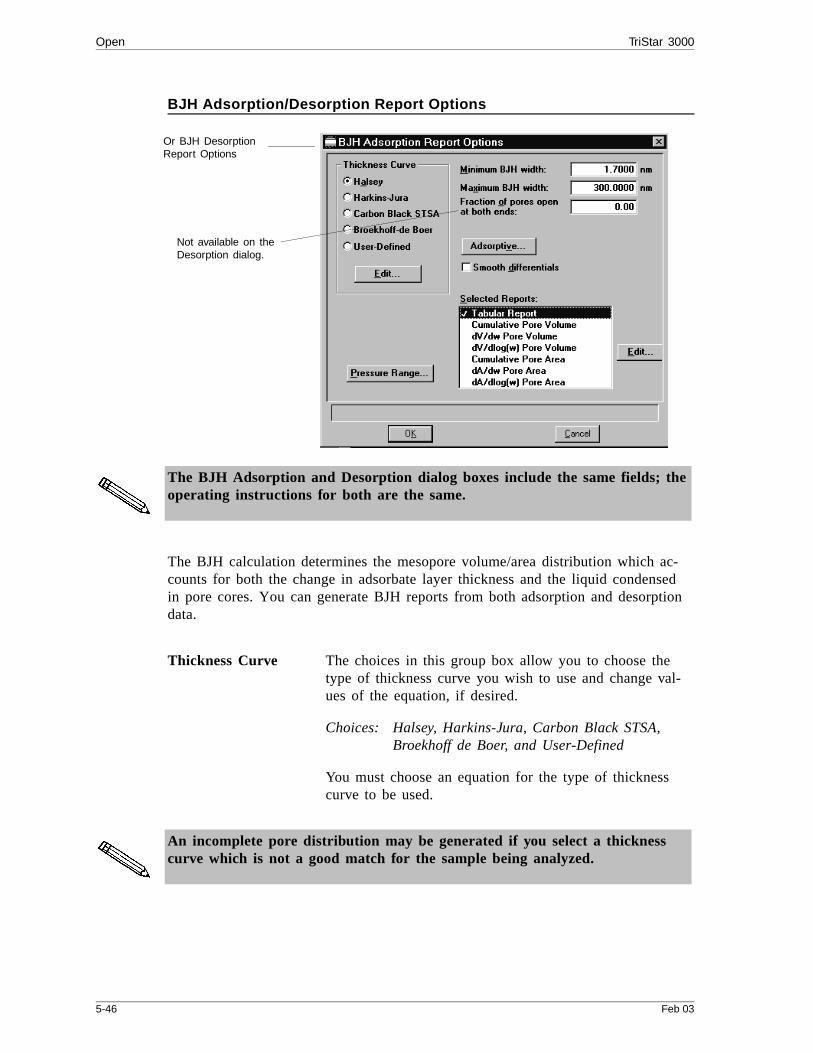
BJH Adsorption/Desorption Report Options
The BJH Adsorption and Desorption dialog boxes include the same fields; theoperating instructions for both are the same.
The BJH calculation determines the mesopore volume/area distribution which ac-counts for both the change in adsorbate layer thickness and the liquid condensedin pore cores. You can generate BJH reports from both adsorption and desorptiondata.
Thickness Curve The choices in this group box allow you to choose thetype of thickness curve you wish to use and change val-ues of the equation, if desired.
Choices: Halsey, Harkins-Jura, Carbon Black STSA,Broekhoff de Boer, and User-Defined
You must choose an equation for the type of thicknesscurve to be used.
An incomplete pore distribution may be generated if you select a thicknesscurve which is not a good match for the sample being analyzed.
Or BJH DesorptionReport Options
Not available on theDesorption dialog.
Open TriStar 3000
5-46 Feb 03
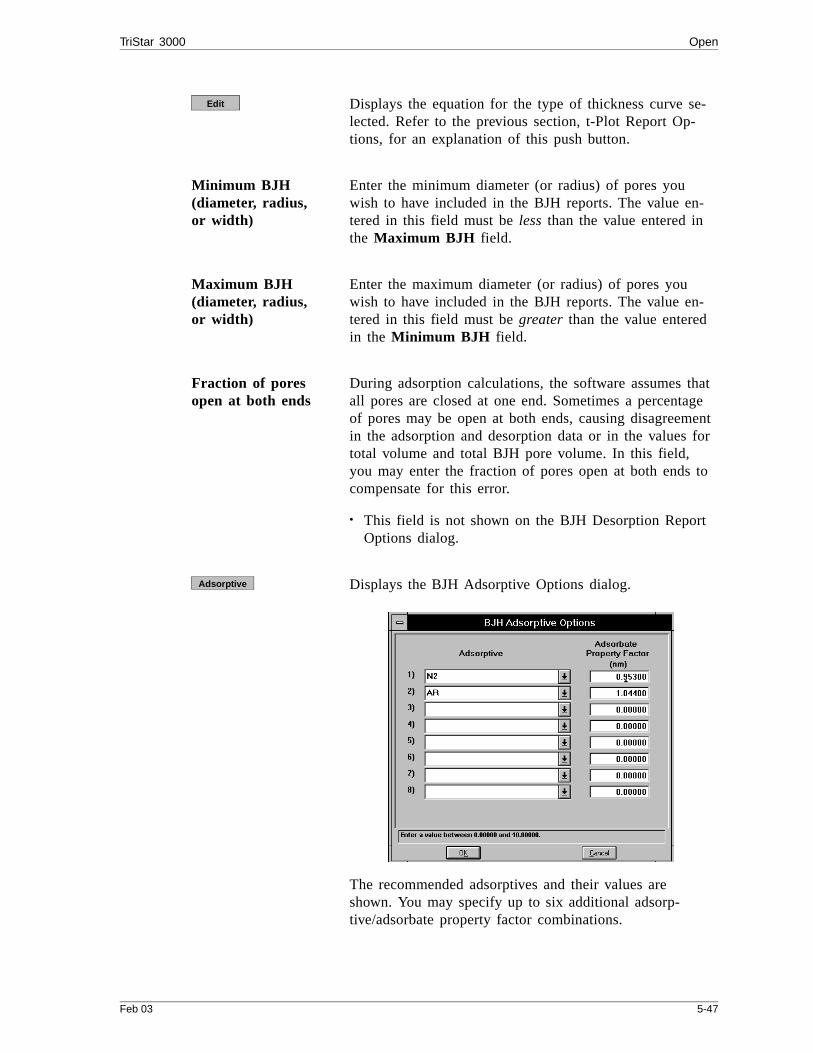
Displays the equation for the type of thickness curve se-lected. Refer to the previous section, t-Plot Report Op-tions, for an explanation of this push button.
Minimum BJH (diameter, radius, or width)
Enter the minimum diameter (or radius) of pores youwish to have included in the BJH reports. The value en-tered in this field must be less than the value entered inthe Maximum BJH field.
Maximum BJH (diameter, radius, or width)
Enter the maximum diameter (or radius) of pores youwish to have included in the BJH reports. The value en-tered in this field must be greater than the value enteredin the Minimum BJH field.
Fraction of pores open at both ends
During adsorption calculations, the software assumes thatall pores are closed at one end. Sometimes a percentageof pores may be open at both ends, causing disagreementin the adsorption and desorption data or in the values fortotal volume and total BJH pore volume. In this field,you may enter the fraction of pores open at both ends tocompensate for this error.
• This field is not shown on the BJH Desorption ReportOptions dialog.
Displays the BJH Adsorptive Options dialog.
The recommended adsorptives and their values areshown. You may specify up to six additional adsorp-tive/adsorbate property factor combinations.
Edit
Adsorptive
TriStar 3000 Open
Feb 03 5-47
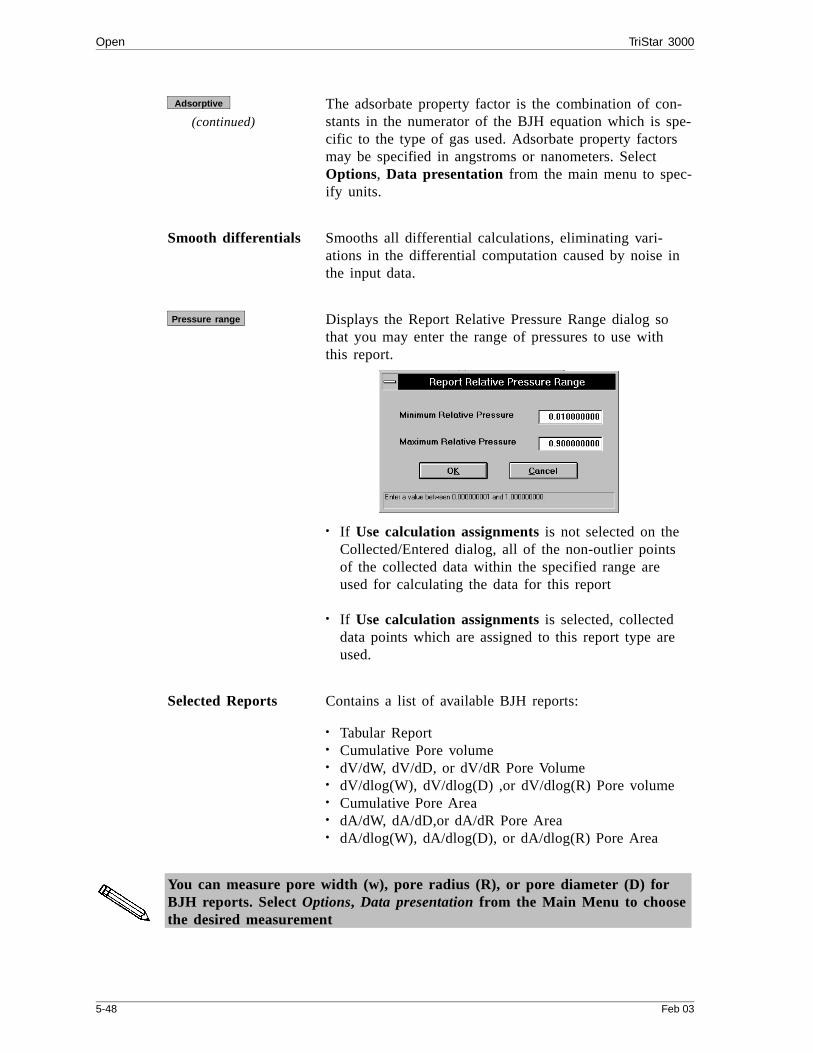
(continued)The adsorbate property factor is the combination of con-stants in the numerator of the BJH equation which is spe-cific to the type of gas used. Adsorbate property factorsmay be specified in angstroms or nanometers. SelectOptions, Data presentation from the main menu to spec-ify units.
Smooth differentials Smooths all differential calculations, eliminating vari-ations in the differential computation caused by noise inthe input data.
Displays the Report Relative Pressure Range dialog sothat you may enter the range of pressures to use withthis report.
• If Use calculation assignments is not selected on theCollected/Entered dialog, all of the non-outlier pointsof the collected data within the specified range areused for calculating the data for this report
• If Use calculation assignments is selected, collecteddata points which are assigned to this report type areused.
Selected Reports Contains a list of available BJH reports:
• Tabular Report• Cumulative Pore volume• dV/dW, dV/dD, or dV/dR Pore Volume• dV/dlog(W), dV/dlog(D) ,or dV/dlog(R) Pore volume• Cumulative Pore Area• dA/dW, dA/dD,or dA/dR Pore Area• dA/dlog(W), dA/dlog(D), or dA/dlog(R) Pore Area
You can measure pore width (w), pore radius (R), or pore diameter (D) forBJH reports. Select Options, Data presentation from the Main Menu to choosethe desired measurement
Adsorptive
Pressure range
Open TriStar 3000
5-48 Feb 03
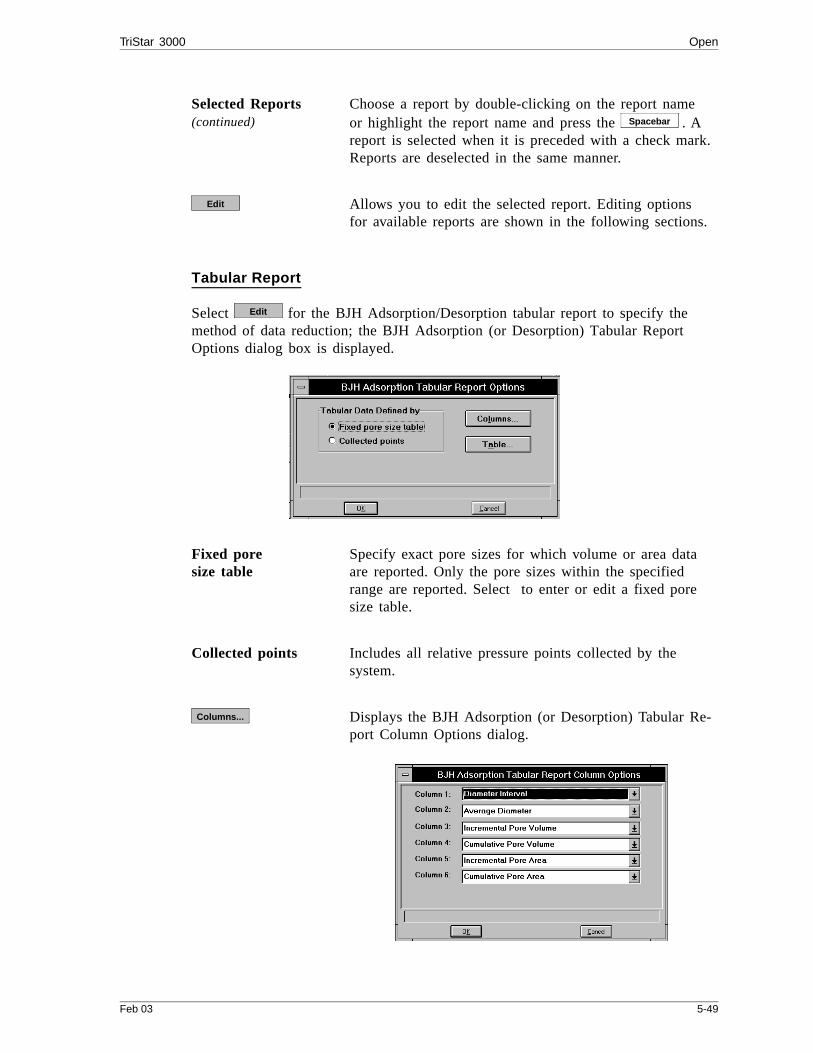
Selected Reports(continued)
Choose a report by double-clicking on the report nameor highlight the report name and press the . Areport is selected when it is preceded with a check mark.Reports are deselected in the same manner.
Allows you to edit the selected report. Editing optionsfor available reports are shown in the following sections.
Tabular Report
Select for the BJH Adsorption/Desorption tabular report to specify themethod of data reduction; the BJH Adsorption (or Desorption) Tabular ReportOptions dialog box is displayed.
Fixed pore size table
Specify exact pore sizes for which volume or area dataare reported. Only the pore sizes within the specifiedrange are reported. Select to enter or edit a fixed poresize table.
Collected points Includes all relative pressure points collected by thesystem.
Displays the BJH Adsorption (or Desorption) Tabular Re-port Column Options dialog.
Spacebar
Edit
Edit
Columns...
TriStar 3000 Open
Feb 03 5-49

(continued)
The default column title appears next to the column num-ber. Each column includes a pull-down list of the datatypes available for inclusion in the report. You can meas-ure pore width, pore radius, or pore diameter.
Enabled when you choose Fixed pore size table. Dis-plays the BJH Adsorption (or Desorption) Fixed PoreSize Table dialog so that you may enter or edit a fixedpore size table.
The fixed pore size table must contain a minimum oftwo points and may include as many as 1000. The pointsmust be strictly decreasing.
Inserts a row into the pressure table. The row is insertedabove the selected row and the cursor moves to the newrow.
Deletes the selected row from the pressure table.
Clears all points from the pressure table; none have to beselected.
Columns...
Table...
Insert
Delete
Clear
Open TriStar 3000
5-50 Feb 03

Plot Options
Click for BJH Adsorption/Desorption plots to specify plotting methodsand to customize plots. The following plots are available:
A dialog box similar to the following is displayed when you select a BJH plot.
Plot Options Lists the data presentation styles available for BJH plots.You may choose to plot as a curve, points, or both.
X-axis Lists the scale options for the x-axis.
Linear/Logarithmic
Choose whether you wish to have the X-axis on a loga-rithmic or linear scale.
Autoscale Select this option to have the x-axis scaled automatically.The lowest and highest values collected during analysisare used as the beginning and ending points.
When you deselect this option, the adjacent fields are en-abled so that you can specify beginning and endingvalues.
Data ranges are displayed in the information bar acrossthe bottom of the dialog box when a cursor is in a nu-merical data field.
Edit
Valid ranges display here.
TriStar 3000 Open
Feb 03 5-51
Y-axis Lists the options for the y-axis.
Variable Choose the desired variable for the Y-axis.
Overlay Displays a list of overlay choices. You may choose tooverlay the current plot with data from other samples orwith other plots from this sample.
Autoscale Select this option if you wish to have the y-axis scaledautomatically. The lowest and highest values collectedduring analysis are used as the beginning and endingpoints.
When you deselect this option, the adjacent fields are en-abled so that you can specify beginning and endingvalues.
Data ranges are displayed in the information bar acrossthe bottom of the dialog box when the cursor is in a nu-merical data field..
Open TriStar 3000
5-52 Feb 03
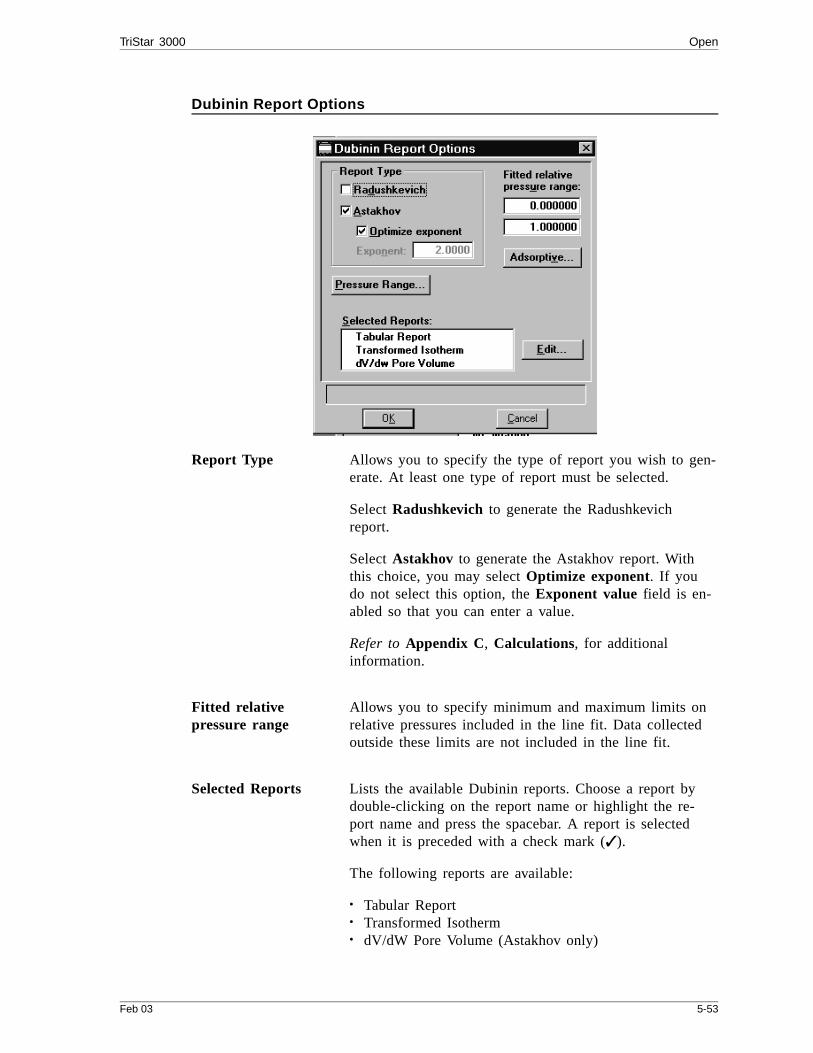
Dubinin Report Options
Report Type Allows you to specify the type of report you wish to gen-erate. At least one type of report must be selected.
Select Radushkevich to generate the Radushkevichreport.
Select Astakhov to generate the Astakhov report. Withthis choice, you may select Optimize exponent. If youdo not select this option, the Exponent value field is en-abled so that you can enter a value.
Refer to Appendix C, Calculations, for additionalinformation.
Fitted relative pressure range
Allows you to specify minimum and maximum limits onrelative pressures included in the line fit. Data collectedoutside these limits are not included in the line fit.
Selected Reports Lists the available Dubinin reports. Choose a report bydouble-clicking on the report name or highlight the re-port name and press the spacebar. A report is selectedwhen it is preceded with a check mark ( ).
The following reports are available:
• Tabular Report• Transformed Isotherm• dV/dW Pore Volume (Astakhov only)
TriStar 3000 Open
Feb 03 5-53

Allows you to specify up to ten adsorptive/affinity coeffi-cient (beta) combinations. The Dubinin Adsorptive Op-tions dialog is displayed.
Displays the Report Relative Pressure Range dialog sothat you may specify minimum and maximum relativepressures to use with this report.
• If Use calculation assignments is not selected on theCollected/Entered dialog, all of the nonoutlier pointsof the collected data within the specified range areused for calculating the data for this report..
• If Use calculation assignments is selected, collecteddata points which are assigned to this report type areused.
Adsorptive
Pressure range
Open TriStar 3000
5-54 Feb 03

Tabular Report Options
Selecting Tabular Report from the Dubinin Report Options dialog box enablesyou to customize your report with one to six columns of data for Astakhov re-ports and one to five columns of data for Radushkevich reports. The DubininTabular Report Column Options dialog is displayed.
The default column title appears next to the column number. Each column in-cludes a drop-down list of the data types to include in the report.
*The value for n (shown in Column 5) is the optimized exponent if OptimizedAstakhov exponent is selected on the Dubinin Report Options dialog box. If not,then the value for n is the entered exponent value.
Oct 99 5-55
TriStar 3000 Open
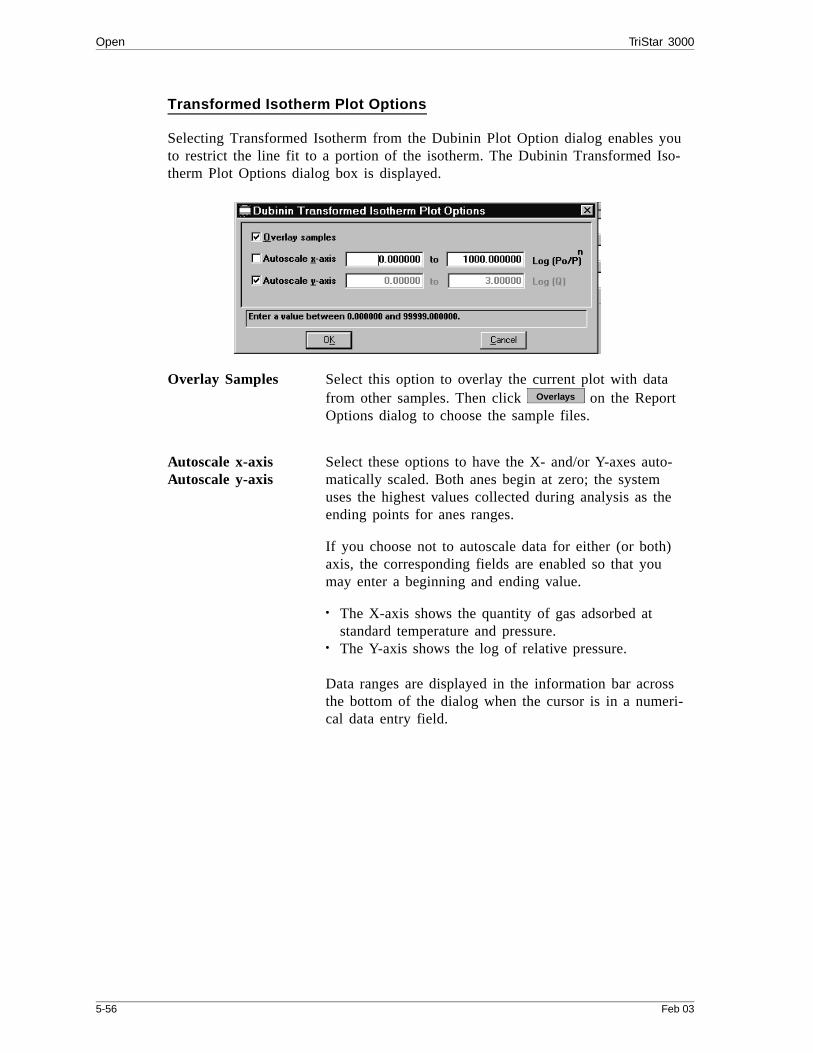
Transformed Isotherm Plot Options
Selecting Transformed Isotherm from the Dubinin Plot Option dialog enables youto restrict the line fit to a portion of the isotherm. The Dubinin Transformed Iso-therm Plot Options dialog box is displayed.
Overlay Samples Select this option to overlay the current plot with datafrom other samples. Then click on the ReportOptions dialog to choose the sample files.
Autoscale x-axisAutoscale y-axis
Select these options to have the X- and/or Y-axes auto-matically scaled. Both anes begin at zero; the systemuses the highest values collected during analysis as theending points for anes ranges.
If you choose not to autoscale data for either (or both)axis, the corresponding fields are enabled so that youmay enter a beginning and ending value.
• The X-axis shows the quantity of gas adsorbed atstandard temperature and pressure.
• The Y-axis shows the log of relative pressure.
Data ranges are displayed in the information bar acrossthe bottom of the dialog when the cursor is in a numeri-cal data entry field.
Overlays
Open TriStar 3000
5-56 Feb 03
Pore Volume Options
When you select dV/dW Pore Volume from the Dubinin Report Options dialogbox, the Dubinin dV/dw Pore Volume Options dialog is displayed.
Plot options Choose to plot curve, points, or both.
Overlay Samples Select this option to overlay data from other samples.Then click on the Report Options dialog tochoose the files.
Autoscale x-axisAutoscale y-axis
Select these options to have the X- and/or Y-axes auto-matically scaled. Both axes begin at zero; the systemuses the highest values collected during analysis as theending points.
If you choose not to autoscale data for either (or both)axis, the corresponding fields are enabled so that youmay enter a beginning and ending value. Data collectedoutside these ranges are not included in the plot.
Data ranges are displaye din the information bar acrossthe bottom of the dialog when the cursor is in a numeri-cal data entry field.
Overlays
TriStar 3000 Open
Feb 03 5-57

MP-Method Report Options
Pore size can be expressed in Angstroms or nanometers. Select Data Presenta-tion, Units from the Options menu to secify desired unit.
Thickness Curve Select the thickness curve type from this group box. Youmust choose either the Halsey equation or the Harkins-Jura equation. Use to edit the values in theequation.
Displays the equation for the type of thickness curveselected.
Harkins-Jura Displays the Harkins-Jura Thickness Equation dialog box.
You can edit the values for the numerator, first elementof the denominator, and exponent.
Equation
Equation
Open TriStar 3000
5-58 Feb 03
Halsey Displays the Halsey Thickness Equation dialog box.
You can edit the values for the multiplier, numerator, andexponent.
Refer to Appendix C, Calculations, for more information
Selected Reports Lists the available MP-Method reports. Choose a reportby double-clicking on the report name or highlight the re-port name and press the spacebar. A report is selectedwhen it is preceded with a check mark ( ).
The following reports are available:
• Tabular Report • Cumulative Pore Volume• dV/dW Pore Volume • Cumulative Pore Area• dA/dW Pore Area
The data for these reports are measured in pore widthonly.
TriStar 3000 Open
Feb 03 5-59

Tabular Report Options
Selecting Tabular Report from the MP-Method Report Options dialog box en-ables you to customize your report with one to six columns of data. (The datatypes in the first and second columns cannot be changed.) The MP-Method Tabu-lar Report Column Options dialog box is displayed.
The default column title appears next to the column number for columns threethrough six. Each of these columns includes a pull-down list of the data types toinclude in the report. The following data types are available:
Columns 1 and 2 are fixed and cannot be edited.
The MP-Method reports hydraulic radius only. If you select Pore size in di-ameter from the Data presentation menu, the MP-Method still reports poresize in radius.
Open TriStar 3000
5-60 Feb 03

Plot Options
Selecting an MP-Method plot option from the MP-Method Report Options dialogboxes enables you to specify the plotting method used for your report and to cus-tomize the plot. The following plots are available:
• Cumulative Pore Volume• dV/dw Pore Volume• Cumulative Pore Area• dA/dw Pore Area
When you select any of these plots from the MP-Method Report Options dialogbox, a dialog box similar to the following one is displayed. The fields on all dia-log boxes are the same.
Plot options Choose to plot a curve, points, or both.
X-Axis Choose Autoscale x-axis to have the x-axis scaled auto-matically. The X-axis begins at zero and the system usesthe highest values collected during analysis as the endingpoint.
If you deselect Autoscale, the corresponding fields areenabled so that you may enter a beginning and endingvalue. Data collected outside these ranges are not in-cluded in the plot.
Data ranges are displaye din the information bar acrossthe bottom of the dialog when the cursor is in a numeri-cal data entry field.
TriStar 3000 Open
Feb 03 5-61
Y-Axis Variable Click on the down-arrow to choose a variable for the
Y-axis.
Overlay You can use the choices in this drop-down list to overlayplots. You can choose a different type of plot for the cur-rent sample to overlay with the listed Variable, or youcan choose Samples to overlay the variable plot with thesame type of plot from other samples. Click onthe Reports Options dialog box to choose the samples.
Autoscale Choose this option to have the y-axis scaled automat-ically. Y-axes begin at zero. The system uses the highestvalues collected during analysis as the ending points foraxes ranges.
If you deselect this option, the corresponding fields areenabled so that you may enter a beginning and endingvalue. Data collected outside these ranges are not in-cluded in the plot.
Y-axis range fields show the volume of gas adsorbed.
Data ranges are displaye din the information bar acrossthe bottom of the dialog when the cursor is in a numeri-cal data entry field.
Overlays
Open TriStar 3000
5-62 Feb 03

Summary Report
The summary report provides a condensed listing of data results. Click for Summary report options; the Summary Report Options dialog box is displayed.
The choices on this dialog box allow you to choose the types of data to includein the Summary report.
If you choose Adsorption or Desorption total for Pore Volume data the P/Pofield is enabled so that you can enter the relative pressure at which to calculatethe total pore volume. If Use calculation assignments (Collected Data screen) isnot selected, the isotherm is interpolated to this value and that point used for theTotal pore volume calculation. Otherwise, the point selected with calculation as-signment is used.
Selects all choices on the dialog box.
Deselects all choices on the dialog box..
Edit
Select all
Deselect all
TriStar 3000 Open
Feb 03 5-63

Options Report
The Options report is a subset of the contents report; it provides pertinent informa-tion for the following:
• Sample tube• Degas conditions• Adsorptive properties• Analysis conditions• Free space• Po and temperature• Equilibration• Isotherm collection
Sample Log Report
The Sample Log report displays the following:
• Manual control operations performed during analysis• Information entered using on the sample file editor• Warnings and/or errors which occurred during analysis
Add Log Entry
Open TriStar 3000
5-64 Feb 03

Collected/Entered Data
This dialog is displayed only in the Advanced mode of the sample file presenta-tion, and only after an analysis has been completed.
Pressure table For collected data, columns for the following are dis-played:
• absolute pressure• relative pressure• quantity adsorbed• outliers (if Use calculation assignments is not se-
lected)• calculation assignments for each requested report op-
tion (if Use calculation assignments is selected)
For entered data, columns for the following aredisplayed:
• absolute or relative pressure, depending on theselection in the Pressures group box
• quantity adsorbed
Enabled only for entered data. Inserts a row into the pres-sure table.
Insert
TriStar 3000 Open
Feb 03 5-65
Enabled only for entered data. Deletes the selected row.
Enabled only for entered data. Clears the entire table;rows do not have to be selected.
Use calculationassignments
If selected, allows you to assign the points to be col-lected for each report type.
If deselected, each report (with the exception of Lang-muir and BET) uses a range of pressures as selected inthe report options. The Langmuir and BET reports inter-polate to entered relative pressures on the report options.
The outlier points can be selected so that they will notbe reported.
Displays the Po and T dialog.
This dialog box allows you to edit the Po measurementand analysis bath temperature.
Delete
Clear
Po and T...
Open TriStar 3000
5-66 Feb 03

Displays the Free Space dialog, allowing you to edit free-space values.
This dialog also shows the isotherm for the analysis. Theisotherm is redrawn each time values are edited.
MeasureQuasi-Gemini
Either of these choices is enabled only if selected as themethod used in the original analysis.
If Quasi-Gemini was selected, is enabled sothat you may edit the parameters of the sample tube usedas the balance in the Quasi-Gemini method.
Calculated Select this option to have the free-space measurement cal-culated using the sample conditions and sample tube pa-rameters.
Enter Enables the Warm free space and Cold free spacefields so that you may enter the free space manually.
The warm free space is the sample tube gas capacitymeasured at room temperature.
Range: 1.0000 to 999.0000 cm3
Default: 16.000 cm3
The cold free space is the sample tube gas capacity meas-ured with the Dewar raised.
Range: 1.0000 to 999.0000 cm3
Default: 45.0000 cm3
Free Space...
Sample Tube...
TriStar 3000 Open
Feb 03 5-67

Save
Save enables you to save any changes you have made to the file in the active win-dow. The file is saved under its current name.
Save As
Save As enables you to:
• save a sample or parameter file in the active window under a differentname. This option is useful for making a duplicate copy of a file that youcan modify as desired without changing the original one. The original fileremains open when you use this function, so be sure to open the new filebefore making any changes.
• save a subset (parameter) of the sample file in the active window as astandalone parameter file. For example, select Analysis Conditions from theSave As menu to create a standalone parameter file of the analysis condi-tions portion of the active sample file.
• save as an ASCII file the relative pressures and corresponding thicknesses.These data are derived by dividing the condensed volume of adsorptive bythe selected surface area. The density conversion factor in the adsorptiveproperties file is used to convert quantity adsorbed to volume of condensedadsoptive.
• save as an ASCII file the relative pressures and resulting quantities ad-sorbed. These data are derived by taking the isotherm and dividing it bythe quantity adsorbed at 0.4 relative pressure.
Save As TriStar 3000
5-68 Feb 03

A dialog similar to the one shown below is displayed when you select the SaveAs command.
Enter a file name (up to eight characters) in the File name field; the appropriateextension is appended automatically when you click . The new file issaved as specified, but does not remain in the active window. Be sure to open thenew file before making any changes to the file.
When saving Alpha-S files, the Save As t-Curve dialog box is shown first, allow-ing you to select the type of curve.
OK
TriStar 3000 Save As
Feb 03 5-69
Save All
Save All enables you to save all open files under their current names. This optionprovides a faster way to save all open files at one time and avoids having to per-form a Save operation on each individual file.
Close
Close enables you to close the file in the active window. The following messageis displayed if changes have been made to the file:
(File name) has been changed.Save changes before closing?
• Yes saves any changes and closes the active window.• No discards any changes and closes the active window;.• Cancel returns you to the open file.
Close All
Close All enables you to close all open files under their current names. The fol-lowing message is displayed for each file in which changes have been made:
(File name) has been changed.Save changes before closing?
• Yes saves any changes and closes the active window.• No discards any changes and closes the active window.• Cancel returns you to the open file.
Yes No Cancel
Yes No Cancel
Close All TriStar 3000
5-70 Feb 03
Print enables you to print the entire contents of a file. When you select File,Print from the main menu, the following choices are presented:
• Sample information• Sample tube• Degas conditions • Analysis conditions• Adsorptive properties• Report options
Regardless of which file type you select, a dialog box similar to the one shownbelow is displayed.
File name The name of the file you select from the Files: list boxis copied to this field.
FilesDirectories
This push button and the contents of these list boxes areexplained in Selecting Files in Chapter 3.
Destination: Contains a drop-down list of the available print destina-tions.
If you select Screen, Printer, or Printer/Plotter, the re-quested file is sent to that specified destination.
Dates...
TriStar 3000 Print
Feb 03 5-71

Destination:(continued)
If you select File, the requested file is converted to atext file which can be viewed with a text editor or othertext file manipulation tools. You also must enter a namein the File name field of the Settings group box (or ac-cept the default).
Settings, File name Enabled only if you select File as the destination. A de-fault name is displayed in the field, but you may enter anew one if you wish.
Print TriStar 3000
5-72 Feb 03

List
List enables you to generate a listing of the following information on a selectedsample or parameter file.
• File name• Date the file was created• Time the file was created• File identification• File status
The List dialog is common to all file types. The title bar displays the type of fileon which you have requested a list.
File name If you select only one file from the Files: list box, thename is copied to this field. If multiple files are selected,the last one selected displays in this field.
You may request a list of multiple files by holding down while selectingfiles. If no files are selected, a list is generated for all files.
FilesDirectories
This push button and the contents of these list boxes areexplained in Selecting Files in Chapter 3.
Ctrl
Dates...
TriStar 3000 List
Feb 03 5-73
Destination Contains a drop-down list of the available print destina-tions.
Choices: Screen, Printer, Printer/Plotter, File
If you select File, enter a name in the File name field ofthe Settings group box.
Settings, File name Enabled only if you select File as the destination. Entera name in the File name field.
List TriStar 3000
5-74 Feb 03
Export
Export allows you to copy the isotherm data in a sample information file and re-format it in an ASCII format acceptable to other programs, such as spreadsheets.
The output file consists of four columns containing the absolute pressure, relativepressure, specific quantity absorbed, and the elapsed time.
You may select multiple files by holding down and clicking the leftmouse button once on each file.
Select File, Export from the main menu; the Export Sample File dialog box isdisplayed.
File name The name of the file you select from the Files list box iscopied to this field.
FilesDirectories
This push button and the contents of these list boxes areexplained in Selecting Files in Chapter 3.
Ctrl
Dates...
TriStar 3000 Export
Feb 03 5-75

Settings Export Type Fixed at Isotherm.
Destination Contains a drop-down list of the available print destina-tions.
Choices: Screen, Printer, Printer/Plotter, File
If you select File, the File name field is enabled.
File name Allows you to specify a name for your exported file, oryou may accept the default.
Export TriStar 3000
5-76 Feb 03

Exit
Exit enables you to exit the TriStar analysis program. Select File, Exit from themain menu. Even if an analysis is in progress, it will continue until completion;analysis data are collected and stored in an embedded controller.
• If a window containing a modified file is open, the following message isdisplayed:
Modifications have been made to (file name).do you want to save the modifications?
Yes saves any changes and exits the analysis program; No abandons anychanges and exits the analysis program; and Cancel returns you to theopen file.
• If an analysis is in progress, the following message is displayed:
CAUTION: Sample analysis is in progress. If you exitthe program analysis will continue to completion, but the data are not saved to disk until the program is restarted. Do you want to exit the program?
Yes exits the analysis program; No leaves the analysis program active andallows the analysis to finish
Although data are stored in an embedded controller when you exit theprogram, data are not saved to disk in the control module until you reenterthe program and save the data. If a power failure occurs and the analyzerdoes not have an Uninterruptible Power Supply (UPS), any unsaved dataare lost.
• If a report is in progress, the following message is displayed:
CAUTION: Reports are being generated. If you exit the program these reports will be canceled. Do you want to cancel reports and exit the program?
Yes cancels the reports and exits the analysis program; No leaves theanalysis program active and allows the reports to finish.
Yes No Cancel
Yes No
Yes No
TriStar 3000 Exit
Feb 03 5-77

CHAPTER 6
UNIT MENU
• Description
• Sample Analysis
• QuickStart
• Enable Manual Control
• Show Instrument Schematic
• Show Status
• Show Instrument Log
• Unit configuration
• Calibration

UNIT MENU
The Unit menu contains the options for the operations which can be performedwith the TriStar 3000. The main menu will contain a Unit menu for each attachedanalyzer. For example, if you have two attached analyzers, the main menu con-tains two Unit menus. For easy differentiation, the status displays associated witheach unit are displayed in different colors. The unit number and the serial numberalso are displayed in the title bar of the operational windows. This is especiallyconvenient if you have more than one analyzer attached to the same control mod-ule.
This menu does not appear on the menu bar if the analysis program is beingused for offline data operations on a computer other than the one controllingthe analyzer.
Description
Listed below are brief descriptions of the Unit menu options. Detailed descrip-tions are found later in this chapter.
Sample Analysis Allows you to perform up to three analyses using differ-ent analysis conditions.
QuickStart Allows you to perform multiple sample analyses usingthe same analysis conditions, allowing you to create sam-ple files at the time of analysis.
Enable Manual Control
Allows you to control the system manually.
TriStar 3000 Description
Feb 03 6-1
Show Instrument Schematic
Displays the analyzer’s schematic.
Show Status Displays the status window.
Show InstrumentLog
Displays a log of recent analyses, calibrations, and errormessages.
Unit Configuration Displays software version, hardware configuration, andcalibration information. Also allows you to enter mne-monic names for port gases.
Calibrate Allows you to calibrate the manifold temperature, thepressure scale, pressure offset, manifold volume, andservo valve. It also allows you to save calibration files aswell as load previously saved files.
Service Test Enables you to perform certain troubleshooting proce-dures. This option is enabled only with the direction of aMicromeritics service representative.
Description TriStar 3000
6-2 Feb 03
Sample Analysis
Use this mode of operation to schedule analyses which have different analysis con-ditions or report options. You may schedule up to three analyses at a time, depend-ing on the number of ports you have available. All three ports are available forsample analyses if you are not using:
• port 2 for a Quasi-Gemini measurement• port 3 for a continuous Po measurement
You can continue to schedule analyses by clicking (appears after the firstseries of analyses are finished) on the analyzing view of the Analysis dialog.
Select Sample Analysis from the Unit menu to display this view of the Analysisdialog box.
View Allows you to choose the view you wish to display inthe window.
Choices: Operation, Instrument Schematic,Instrument Log
Operation displays the current mode of operation.
Instrument Schematic displays a schematic of the TriStarsystem. Refer to Show Instrument Schematic later inthis chapter for additional information.
Instrument Log displays a list of recent analyses, calibra-tions, and errors or messages. Refer to Show InstrumentLog later in this chapter for additional information.
Next>>
TriStar 3000 Sample Analysis
Feb 03 6-3
Port [n] This field is blank until you choose a file to use for theoperation on this port.
• If port 2 is being used for a Quasi-Gemini free-spacemeasurement, a message stating so is displayed.
• If port 3 is being used to measure the Po, a messagestating so is displayed.
Sample Displays an identification of the sample file.
Mass Enter a value for the sample mass.
This field is not shown for ports 2 and 3 when:
• Port 2 is being used for a Quasi-Gemini measurement.• Port 3 is being used for a Po measurement.
Density Displays the density of the sample specified in the sam-ple information file.
This field is not shown for ports 2 and 3 when:
• Port 2 is being used for a Quasi-Gemini measurement.• Port 3 is being used for a Po measurement.
Click to:
• Select a sample information file when using the portfor an analysis; the Open Sample Information dialog isdisplayed.
• Select a sample tube file when using the port for aQuasi-Gemini measurement; the Open Sample Tube dia-log is displayed.
The file name you select is copied to the Port [n] field.
Clears the information displayed for this port.
Po Enabled if you have selected Entered for the Po measure-ment for at least one file. Enter the Po value, or edit thecurrent one.
Bath temperature Enter the temperature for the analysis bath.
Browse...
Clear
Sample Analysis TriStar 3000
6-4 Feb 03

Allows you to have a report generated automatically afterthe analysis; displays the Report Settings dialog so thatyou may specify output options.
Starts the analysis; displays an analyzing view of theAnalysis dialog box.
This view also displays port activity as well as the statuswindow.
Report after analysis...
Start
Port Activity
Status Window
TriStar 3000 Sample Analysis
Feb 03 6-5

Skips an analysis; visible only when an analysis is in pro-gress. The Skip dialog is displayed so that you maychoose the port(s) containing the analysis you wish toskip.
Suspends an analysis; visible only when an analysis is inprogress. A dialog similar to the one shown above is dis-played so that you may choose the port(s) containing theanalysis you wish to suspend.
Resumes a suspended analysis; visible only when ananalysis is suspended. A dialog similar to the one shownabove is displayed so that you may choose the port(s)containing the analysis you wish to resume.
These push buttons allow you to generate reports ondata collected at that time for the sample in the respec-tive port. The reports are printed to the screen only.
Enabled when analysis is complete, allowing you toclose all sample port valves immediately; otherwise thevalves close in approximately five minutes.
Cancels an analysis; enabled only when an analysis is inprogress. A dialog similar to the one shown above is dis-played so that you may choose the port(s) containing theanalysis you wish to cancel.
On this view of the Analysis dialog box, this push buttonchanges to when analyses are finished.
Returns you to the first view of the Analysis dialog boxso that you may schedule additional analyses.
Closes the Analysis dialog.
Skip
Suspend
Resume
Report Port [n]
Close Valves
Cancel
Start
Next>>
Next>>
Close
Sample Analysis TriStar 3000
6-6 Feb 03

QuickStart
Use this mode of operation to analyze samples of the same type using the sameanalysis conditions, adsorptive properties, and report options. You may scheduleup to three analyses at a time, depending on the number of ports you have avail-able. All three ports are available if you are not using:
• port 2 for a Quasi-Gemini measurement• port 3 for a continuous Po measurement
You can continue to schedule analyses by clicking (appears after the firstseries of analyses are finished) on the analyzing view of the Analysis dialog.
When you select this option from the Unit menu, the QuickStart dialog box is dis-played.
View Click the down arrow to choose the view you wish tohave displayed in the window.
Choices: Operation, Instrument Schematic,Instrument Log
Operation displays the current mode of operation.
Instrument Schematic displays a schematic of the TriStarsystem. Refer to Show Instrument Schematic later inthis chapter for additional information.
Instrument Log displays a list of recent analyses, calibra-tions, and errors or messages. Refer to Show InstrumentLog later in this chapter for additional information.
Next>>
TriStar 3000 QuickStart
Feb 03 6-7

Sample Options This group box provides drop-down lists of previously de-fined files (including any you may have created) foranalysis conditions, adsorptive properties, and report op-tions. Choose a file from each list to be used in the sam-ple files for this series of analyses.
Report Options This group box allows you to have a report generated af-ter each analysis. You may also specify the number of re-ports you want and a destination. If you choose File as adestination, the File name field is enabled. You can ac-cept the default name or enter a new one.
Advances you to the second view of the QuickStart dia-log.
The second view of the QuickStart dialog allows you to specify sample informa-tion for this set of samples.
Port [n] This field is blank until you choose a file to use for theoperation on this port.
• If port 2 is being used for a Quasi-Gemini free-spacemeasurement, a message stating so is displayed. Noother fields are available for this port.
• If port 3 is being used to measure the Po, a messagestating so is displayed. The Sample Tube field and
are shown so that you can select a file.
Next>>
Browse...
QuickStart TriStar 3000
6-8 Feb 03
Sample Displays the identification of the sample file.
Sample Tube Select the sample tube file you wish to use with thisanalysis.
Mass Enter a value for the sample mass.
This field is not shown for ports 2 and 3 when:
• Port 2 is being used for a Quasi-Gemini measurement.• Port 3 is being used for a Po measurement.
Density Displays the density of the sample specified in the Analy-sis conditions file.
This field is not shown for ports 2 and 3 when:
• Port 2 is being used for a Quasi-Gemini measurement.• Port 3 is being used for a Po measurement.
Click to display:
• The Open Sample Information File dialog (if using theport for an analysis), allowing you to create a file forthe analysis on the current port. The analysis condi-tions, adsorptive properties, and report options selectedon the previous screen are used.
• The Open Sample Tube dialog (if using the port for aQuasi-Gemini measurement), allowing you to select asample tube file.
Clears the information displayed for this port.
Po Enabled if you have selected Entered for the Po measure-ment. Enter the Po value you wish to use if it has not al-ready been entered, or if you wish to change it.
Bath temperature Enter the temperature of the analysis bath.
Browse...
Clear
TriStar 3000 QuickStart
Feb 03 6-9
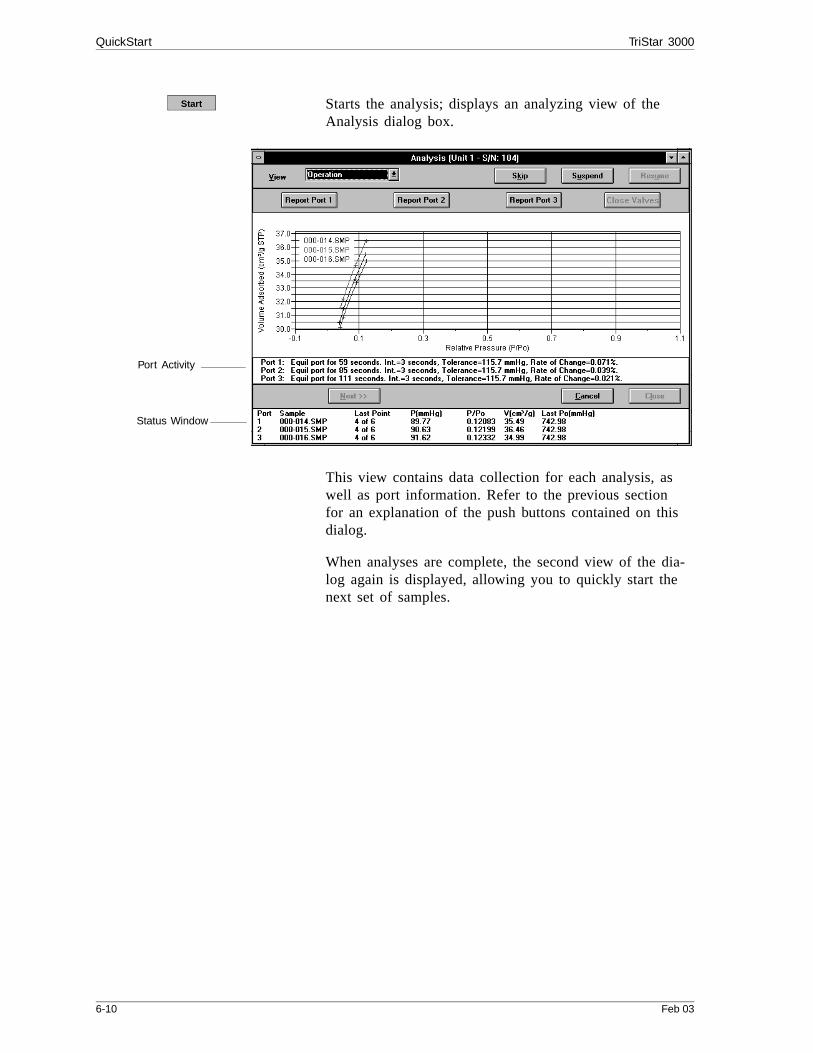
Starts the analysis; displays an analyzing view of theAnalysis dialog box.
This view contains data collection for each analysis, aswell as port information. Refer to the previous sectionfor an explanation of the push buttons contained on thisdialog.
When analyses are complete, the second view of the dia-log again is displayed, allowing you to quickly start thenext set of samples.
Start
Port Activity
Status Window
QuickStart TriStar 3000
6-10 Feb 03

Enable Manual Control
Select this option to control certain components of your system manually. The in-strument schematic must be visible to use this option. If it is not visible, selectShow Instrument Schematic.
When manual control is enabled, the valve symbols change color on the monitorscreen to indicate their status.
• Green = open• Yellow = closed
Use the mouse to move to the desired component and click the left mouse buttononce to select it.
Each component that can be actuated has a shortcut menu displaying the opera-tions available for that particular component. These menus may be accessed by se-lecting the desired component, then clicking the right mouse button once, orpressing .
The options available for the components on the instrument schematic are:
Valves 1 through 13 Open, Close, Pulse
Open and Close open and close the valves. You may alsoopen and close the valves by double-clicking on thevalve or by pressing while the valve is selected.
↑ Shift F9
Spacebar
Elevator
Servo Valve
TriStar 3000 Enable Manual Control
Feb 03 6-11
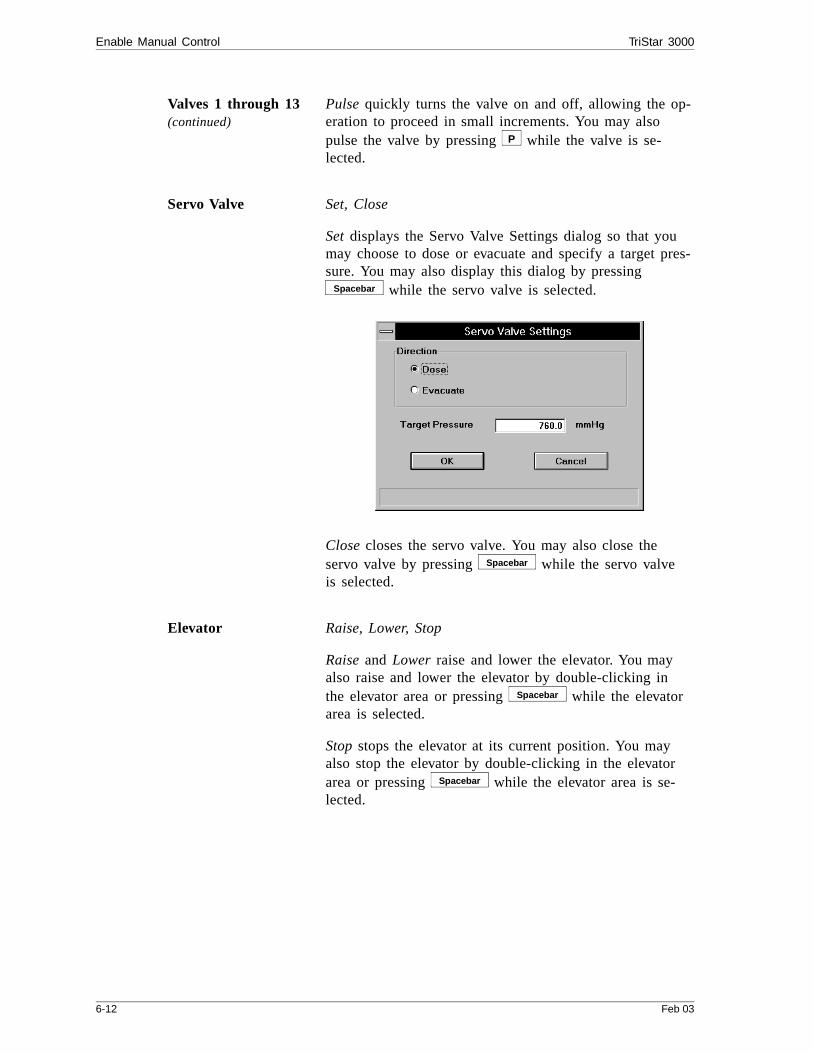
Valves 1 through 13(continued)
Pulse quickly turns the valve on and off, allowing the op-eration to proceed in small increments. You may alsopulse the valve by pressing while the valve is se-lected.
Servo Valve Set, Close
Set displays the Servo Valve Settings dialog so that youmay choose to dose or evacuate and specify a target pres-sure. You may also display this dialog by pressing
while the servo valve is selected.
Close closes the servo valve. You may also close theservo valve by pressing while the servo valveis selected.
Elevator Raise, Lower, Stop
Raise and Lower raise and lower the elevator. You mayalso raise and lower the elevator by double-clicking inthe elevator area or pressing while the elevatorarea is selected.
Stop stops the elevator at its current position. You mayalso stop the elevator by double-clicking in the elevatorarea or pressing while the elevator area is se-lected.
P
Spacebar
Spacebar
Spacebar
Spacebar
Enable Manual Control TriStar 3000
6-12 Feb 03

Show Instrument Schematic
Select this option to display a schematic of the analyzer. Refer to the previous sec-tion for an explanation of the components contained on the instrument schematic.
Even if manual control is not enabled, you still can determine the state of thevalves by their color.
• Green = open• White = closed
If you wish to change the state of a valve, you must enable manual control.
TriStar 3000 Show Instrument Schematic
Feb 03 6-13

Show Status
Select this option to show only the status window of the analyzer.
If you have multiple instruments attached to your control module, the statusbar for each instrument is displayed in a different color.
The status window shows the current status for each port.
You may wish to use this option if:
• You have an automatic operation in progress and you wish to edit a samplefile. This way, you can keep up with the status of your operation while per-forming another task.
• You have multiple units attached to your control module. You can selectShow Status on each unit menu and have the status for all units displayedat one time.
Show Status TriStar 3000
6-14 Feb 03

Show Instrument Log
Displays a log of recent analyses, calibrations, and errors or messages. By default,this information is logged for a 7-day period for analyses and a 30-day period formessages and calibrations. You may change the time for which this information isretained in the Unit section of the WIN3000.INI file.
You can choose the type of information to display in the window by selectingonly the desired item(s). For example, select only the Calibration option to dis-play calibration information:
TriStar 3000 Show Instrument Log
Feb 03 6-15

AnalysisCalibrationMessage
These options allow you to choose which entries are dis-played in the window.
Displays the Log Report Settings dialog so that you canspecify report output options.
Use the Start Date field to specify a date at which tostart the printout. You can specify a date using one ofthe following methods:
• Highlight the field (or press to clear the field) andtype in the desired date
• Double-click in the field (or press ) to display acalendar to choose a date
• Press to clear the field, then to insert the cur-rent date
Select the number of reports desired in the Number ofReports field; you may print up to 4. This field is dis-abled if you are printing to a File or to the Screen.
Choose the report destination in the Destination field. Ifyou choose File as the destination, the File name field isenabled, allowing you to enter a name for the printedfile (or you may accept the default).
Report...
F2
F4
F2 F3
Show Instrument Log TriStar 3000
6-16 Feb 03
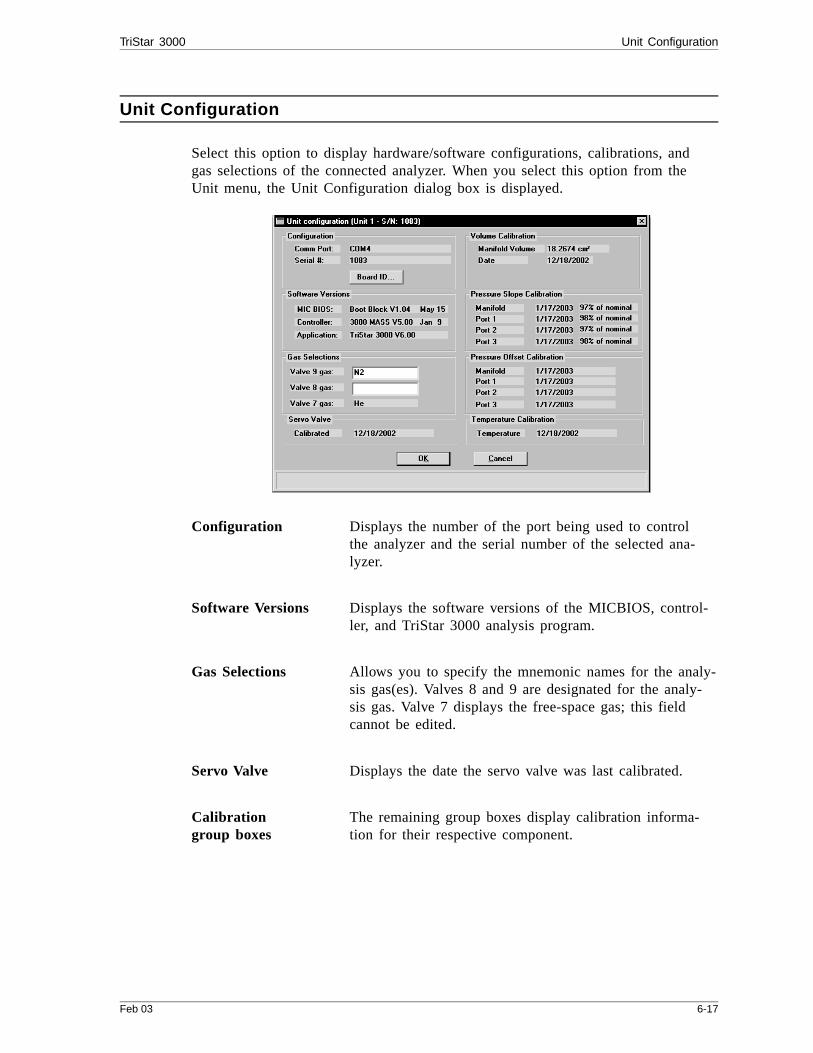
Unit Configuration
Select this option to display hardware/software configurations, calibrations, andgas selections of the connected analyzer. When you select this option from theUnit menu, the Unit Configuration dialog box is displayed.
Configuration Displays the number of the port being used to controlthe analyzer and the serial number of the selected ana-lyzer.
Software Versions Displays the software versions of the MICBIOS, control-ler, and TriStar 3000 analysis program.
Gas Selections Allows you to specify the mnemonic names for the analy-sis gas(es). Valves 8 and 9 are designated for the analy-sis gas. Valve 7 displays the free-space gas; this fieldcannot be edited.
Servo Valve Displays the date the servo valve was last calibrated.
Calibration group boxes
The remaining group boxes display calibration informa-tion for their respective component.
TriStar 3000 Unit Configuration
Feb 03 6-17

Calibration
This option allows you to calibrate the manifold temperature, pressure scale, zeropressure, servo valve, and system volume. You can also save the current calibra-tions to a file or load a different calibration file. Refer to Chapter 9 for step-by-step instructions for each calibration procedure.
Temperature
Use this option to adjust the offset of the manifold temperature sensor to agreewith a value obtained using a calibration device. The Calibrate Manifold Tempera-ture dialog is displayed so that you may enter the measured value.
Calibration TriStar 3000
6-18 Feb 03
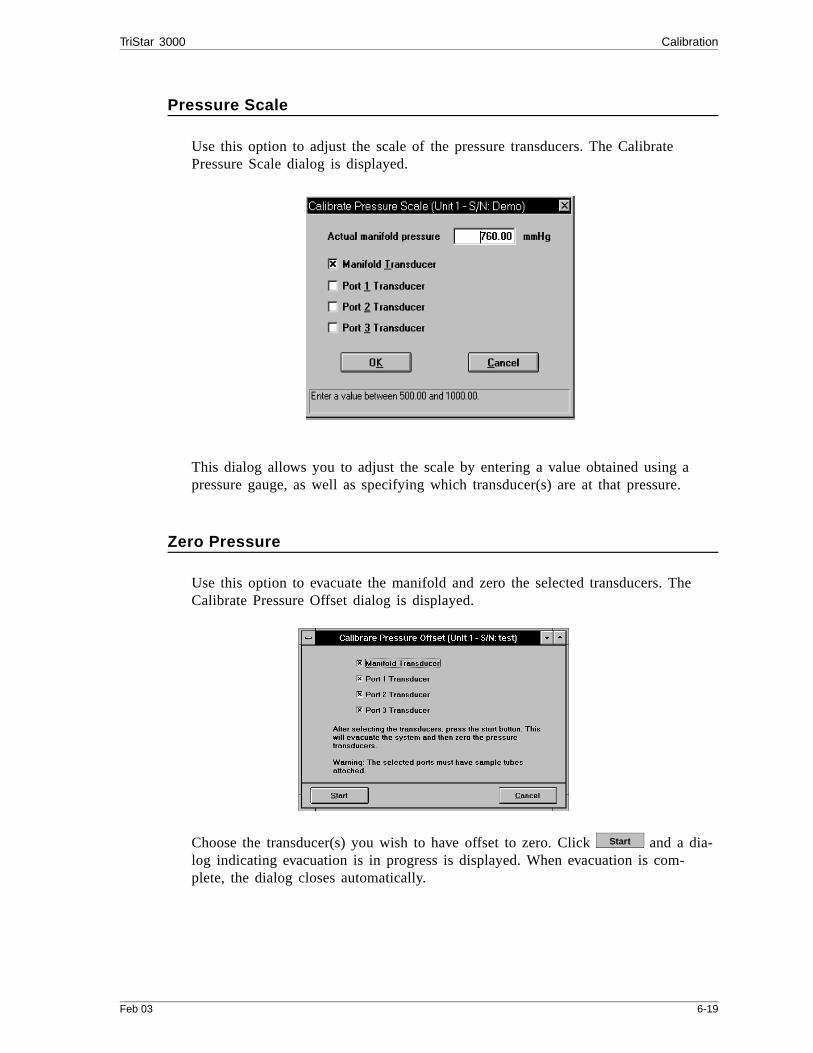
Pressure Scale
Use this option to adjust the scale of the pressure transducers. The CalibratePressure Scale dialog is displayed.
This dialog allows you to adjust the scale by entering a value obtained using apressure gauge, as well as specifying which transducer(s) are at that pressure.
Zero Pressure
Use this option to evacuate the manifold and zero the selected transducers. TheCalibrate Pressure Offset dialog is displayed.
Choose the transducer(s) you wish to have offset to zero. Click and a dia-log indicating evacuation is in progress is displayed. When evacuation is com-plete, the dialog closes automatically.
Start
TriStar 3000 Calibration
Feb 03 6-19

Reset Pressure Calibration
Use this option to restore factory calibration settings for all transducers; a warn-ing dialog is displayed.
Click to restore the values; current values will be overwritten. Click to retain current values.
Servo Valve
Use this option to calibrate the servo valve to the manifold pressure transducer.The servo valve should always be recalibrated after a pressure calibration hasbeen performed. The Calibrate Servo Valve dialog is displayed.
The only action required here is to click . The servo valve is then used tofill and equilibrate the manifold, first to 100 mmHg and then to 760 mmHg. Thepressure transducer readings (previously calibrated) at these points are used to cali-brate the servo set point. Status messages are displayed during this procedure,then the dialog closes automatically.
OK
Cancel
Start
Calibration TriStar 3000
6-20 Feb 03

Volume
Use this option to calibrate the system volume. The Calibrate Volume dialog is dis-played so that you may specify how you want the volume calibrated.
Previous Retains the current system volume which is displayed tothe left of this choice.
Entered Enter a value to use for the system volume.
Measured Allows you to measure the system volume using an en-tered reference volume.
Closes the dialog; displays for the Previous and Enteredselections.
Advances you to the next view of the Calibrate Volumedialog; displays for the Measured selection.
This view of the Calibrate Volume dialog allows you toenter the parameters required when using a reference vol-ume to calibrate the system volume.
Done
Next>>
Displays as Next>> ifyou choose Measured.
TriStar 3000 Calibration
Feb 03 6-21

Reference Volume Enter the volume of the reference device.
Reference Volume Temp.
Enter the temperature of the reference volume.
Perform measurement
Enter the number of measurements you wish to make.
Thermal equilibration time
Enter the amount of time you wish to have the gasequilibrate in the reference volume before taking the pres-sure measurement.
Begins the calibration; a status view is displayed. Afterthe calibration has finished, a confirmation view is dis-played.
This dialog allows you to confirm the calculated volume.The Measured field contains the value of the last meas-urement; for example, the value for the third measure-ment is shown if you selected three measurements. TheAverage field contains an average of the number of se-lected measurements. This dialog also gives you the op-portunity to return to the Previous or Entered value.
Click to close this dialog.
Start
Done
Calibration TriStar 3000
6-22 Feb 03

Save to File
Use this dialog to save the current calibration settings to a file. The Select Calibra-tion File dialog is displayed.
File name Defaults to the current date. You can enter a differentname if you wish.
Load from File
Displays the Select Calibration File dialog (shown above) so that you can load adifferent calibration file.
TriStar 3000 Calibration
Feb 03 6-23
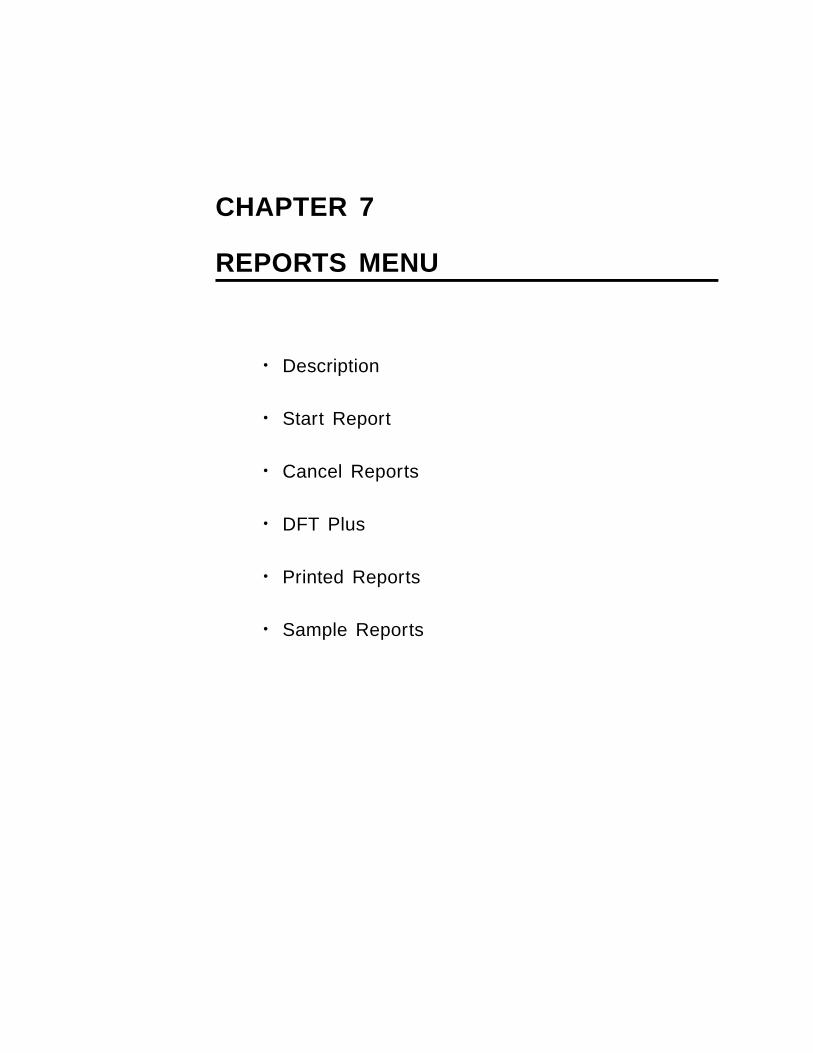
CHAPTER 7
REPORTS MENU
• Description
• Start Report
• Cancel Reports
• DFT Plus
• Printed Reports
• Sample Reports

REPORTS MENU
This chapter describes the commands on the Reports menu; it also contains exam-ples of reports.
Reports can be generated for data:
• collected on a sample that has completed analysis• collected on a sample that is currently being analyzed (includes only the in-
formation collected up to the time of the report)• that is manually entered
Description
Listed below are brief descriptions of the commands contained on the Reportsmenu. Detailed descriptions follow this section.
Start report Allows you to generate a report on a completed sampleanalysis or on the data collected thus far for an analysisin progress.
Close reports Closes all open report window(s).
DFT Plus Invokes the DFT Plus program, allowing you to generateDFT Plus reports.
This option is functional only if the DFT Plus programis installed.
TriStar 3000 Description
Feb 03 7-1

Start Report
Select this option to generate a report on a sample analysis. Select Start reportfrom the Reports menu to display the Start Report dialog.
File name The name of the sample file you select from the Fileslist window is copied to this field. If you select multiplefiles, the last one selected is displayed. If you have asample file open, its name defaults to this field.
• If you select multiple files on which to have reports gen-erated, the reports specified in each sample file areprinted to the output destination.
• If you choose a single file, the Select Reports dialog con-taining the available reports is displayed. This dialog al-lows you to choose the reports you wish to generate.Refer to Chapter 5 for information on available reports.
Start Report TriStar 3000
7-2 Feb 03

File name(continued)
Select (or deselect) reports by double-clicking on the de-sired report (reports are selected when they are precededwith a check mark). Alternatively, you can hightlight thereport and press the .
Status This drop-down list determines what type of sample filesare displayed in the Files list window in the specified di-rectory for all dates, or within the specified range ofdates (using push button).
Choices: All, Analyzing, Complete, Entered
All displays all types of samples files (Analyzing, Com-plete, and Entered).
Analyzing displays sample files that are currently beingused in an analysis.
Complete displays sample files that have been used in ananalysis.
Entered displays sample files that contain maually en-tered data.
Displays the Select Dates dialog so that you may specifya range of dates. Refer to Selecting Files in Chapter 3for a description of this push button.
Copies Enabled when the Printer or Printer/Plotter destinationis chosen. This option allows you to print up to four cop-ies of the selected report(s).
Destination Displays a drop-down list of output destinations.
Choices: File, Printer, Printer/Plotter, Screen
If you select Printer or Printer/Plotter, requested reportsare printed to the selected printer and/or plotter. This op-tion also enables the Copies field allowing you to printup to four copies of each report.
If you select Screen, reports are displayed onscreen. Us-ing this option allows flexibility for manipulating and cus-tomizing reports. Refer to Printed Reports later in thischapter.
Spacebar
Dates...
Dates...
TriStar 3000 Start Report
Feb 03 7-3

Destination(continued)
If you select File, the tabular reports of the requestedfile are converted to a text file which can be viewed witha text editor or other text file manipulation tool.
File name Enabled when you select File as the destination. Allowsyou to enter a name, or you may accept the default.
Files list box Displays a list of the available sample files for thechoice shown in the Status field and within the range ofdates specified in the Dates dialog..
Directories Displays a list of available drives and directories. Thedrive and directory last accessed is displayed immedi-ately above the Directories list box.
Start Report TriStar 3000
7-4 Feb 03

Close Reports
This option enables you to close all open report windows at one time. This avoidshaving to select close on each report window. This option is unavailable if reportsare being generated.
DFT Plus
DFT Plus® is an enhanced data reduction application. This program allows you tocalculate pore volume, surface energy, and surface area distribution from the ad-sorption isotherm of materials which have been previously analyzed on aMicromeritics physisorption analyzer.
This option is nonfunctional if the DFT Plus program is not installed. See Chap-ter 10 for ordering information.
TriStar 3000 DFT Plus
Feb 03 7-5
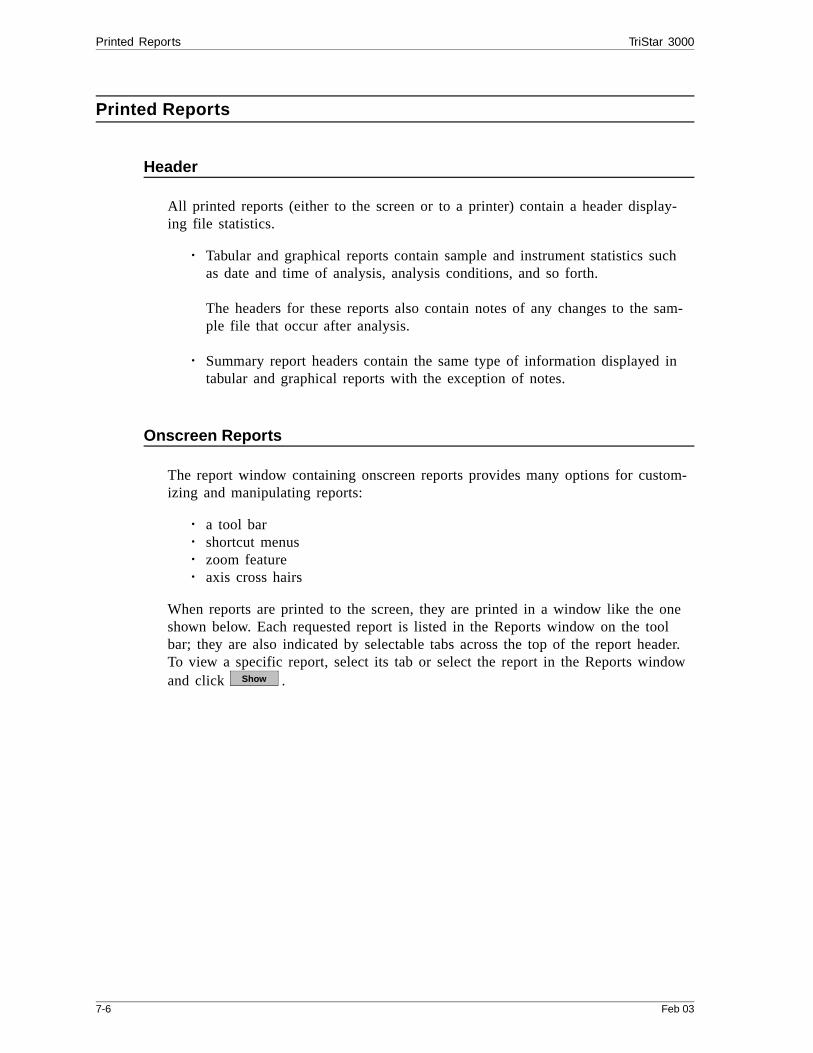
Printed Reports
Header
All printed reports (either to the screen or to a printer) contain a header display-ing file statistics.
• Tabular and graphical reports contain sample and instrument statistics suchas date and time of analysis, analysis conditions, and so forth.
The headers for these reports also contain notes of any changes to the sam-ple file that occur after analysis.
• Summary report headers contain the same type of information displayed intabular and graphical reports with the exception of notes.
Onscreen Reports
The report window containing onscreen reports provides many options for custom-izing and manipulating reports:
• a tool bar• shortcut menus• zoom feature• axis cross hairs
When reports are printed to the screen, they are printed in a window like the oneshown below. Each requested report is listed in the Reports window on the toolbar; they are also indicated by selectable tabs across the top of the report header.To view a specific report, select its tab or select the report in the Reports windowand click .Show
Printed Reports TriStar 3000
7-6 Feb 03

Tool Bar
Reports Contains a list of all requested reports.
Shows the selected report in the report window. If the re-port has been hidden, it and its associated tab will be-come visible.
Show
Options onTool Bar
List of reportsrequested.
Header
Tabs display for each type of report you choose to generate.
Displays graphical(or tabular) data.
TriStar 3000 Printed Reports
Feb 03 7-7
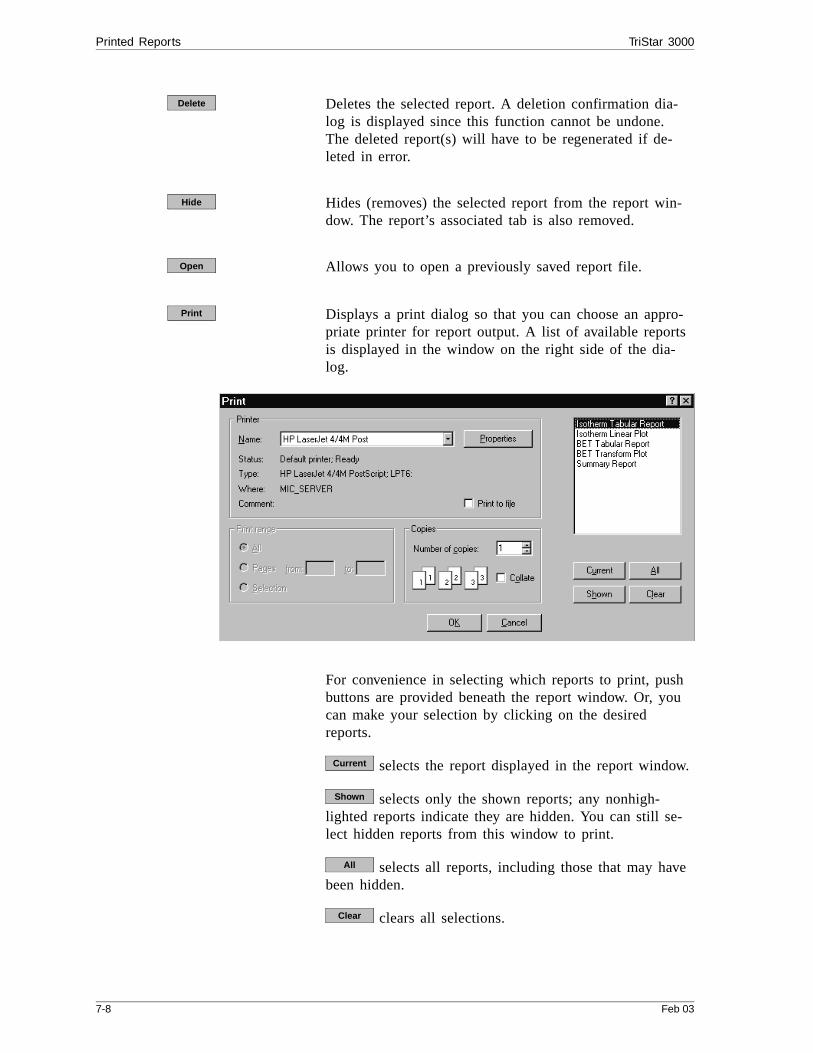
Deletes the selected report. A deletion confirmation dia-log is displayed since this function cannot be undone.The deleted report(s) will have to be regenerated if de-leted in error.
Hides (removes) the selected report from the report win-dow. The report’s associated tab is also removed.
Allows you to open a previously saved report file.
Displays a print dialog so that you can choose an appro-priate printer for report output. A list of available reportsis displayed in the window on the right side of the dia-log.
For convenience in selecting which reports to print, pushbuttons are provided beneath the report window. Or, youcan make your selection by clicking on the desiredreports.
selects the report displayed in the report window.
selects only the shown reports; any nonhigh-lighted reports indicate they are hidden. You can still se-lect hidden reports from this window to print.
selects all reports, including those that may havebeen hidden.
clears all selections.
Delete
Hide
Open
Current
Shown
All
Clear
Printed Reports TriStar 3000
7-8 Feb 03

Saves all reports of the currently open file in a report for-mat using the same name as the sample file, only withan rep extension. If you wish to specify a name and/orspecific reports to save, use the push button.
Saves all or specified reports from the currently openfile. The push buttons displayed on this dialog performin the same manner as the print dialog (explained above).
Reports can be saved in three different formats:
Report system (*.rep): Saved in a format which allowsyou to reopen the file using the push button onthe Report window tool bar.
Spreadsheet (*.xls): Saved in a format which can be im-ported into most spreadsheet programs.
Ascii Text (*.txt): Saved in ASCII text which can be im-ported into programs accepting this type of file.
Displays the Default Fonts dialog so that you can editreport fonts.
The window on the left lists the items for which the fontcan be edited.
Click to edit the font of a selected item; a fontdialog is displayed so that you can specify the desiredfont and attributes.
Click to save the changes as the default. If youdo not click , the changes will apply to the cur-rent report set only. The next reports will revert to thedefault font.
Save
Save as
Save as
Open
Default Fonts
Edit
Save
Save
TriStar 3000 Printed Reports
Feb 03 7-9

(continued)Click to load the default font of a selected item.
Click to close the dialog.
Shortcut Menus
Shortcut menus are accessed when you right-click on the tabular or graphical por-tion of a report.
Tabular Reports
Resize column Displays a dialog so that you can specify the width ofthe selected column (in inches).
Rename column Displays a dialog so that you can edit the name of theselected column. Use to insert line feeds.
Move column Allows you to move the location of the selected columnto the left or to the right.
Align column Enables you to right-align, left-align, or center the datain the selected column.
Hide column Displays a list of all columns, enabling you to select theone you wish to hide.
Show column Displays a list of all hidden columns, enabling you toselect the one you wish to have shown again.
Default Fonts Load
Close
Printed Reports TriStar 3000
7-10 Feb 03
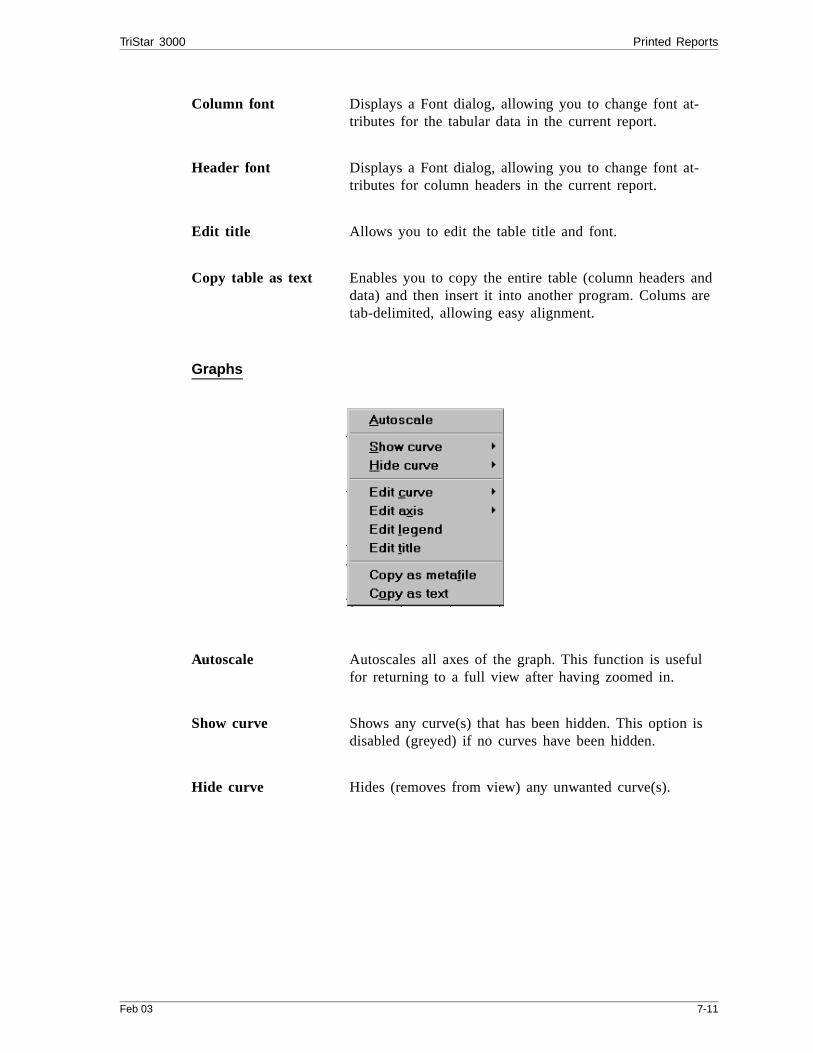
Column font Displays a Font dialog, allowing you to change font at-tributes for the tabular data in the current report.
Header font Displays a Font dialog, allowing you to change font at-tributes for column headers in the current report.
Edit title Allows you to edit the table title and font.
Copy table as text Enables you to copy the entire table (column headers anddata) and then insert it into another program. Colums aretab-delimited, allowing easy alignment.
Graphs
Autoscale Autoscales all axes of the graph. This function is usefulfor returning to a full view after having zoomed in.
Show curve Shows any curve(s) that has been hidden. This option isdisabled (greyed) if no curves have been hidden.
Hide curve Hides (removes from view) any unwanted curve(s).
TriStar 3000 Printed Reports
Feb 03 7-11

Edit curve Displays the Curve Properties dialog, allowing you toedit curve properties.
Title Displays the title of the curve you are editing.
Style Drop-down list containing styles in which collected datacan be displayed.
Choices: Curve, Histogram, Points, Curve and Points
Curve group box
Contains options for curves and points. You can edit thecurve interpolation, the style of curve and/or points, aswell as the pen color. The options in this group box aredisabled if Histogram is chosen in the Style drop-downlist.
Histogramgroup box
Allows you to specify the type of fill as well as thecolor if Histogram is chosen as the style for collecteddata.
Printed Reports TriStar 3000
7-12 Feb 03
Edit axis Displays the Axis Properties dialog, allowing you to editaxis properties.
Edit legend Displays the Legend Properties dialog, allowing you toedit the placement of the legend.
Edit title Displays the Title Properties dialog, allowing you to editthe current graph’s title and font.
Copy as metafile Copies the graph and places it on the clipboard, allowingyou to paste it into other applications accepting Windowsmetafiles.
Copy as text Copies the data used to generate the graph as a series oftab-delimited columns of text.
TriStar 3000 Printed Reports
Feb 03 7-13
Zoom Feature
A zoom feature is included with the report system so that you can zoom in to ex-amine fine details. To use this feature, simply hold down the left mouse buttonand drag the mouse cursor (drawing a box) across the area you wish to view;then release the button. The enlarged area immediately fills the graph area. Right-click in the graph area and choose Autoscale from the shortcut menu to return tothe normal view
Axis Cross Hair
A cross-hair function is available so that you can view axis coordinates. To usethis feature, simply left-click in the desired area of the graph.
Right-click in the graph area and choose Autoscale form the shortcut menu to re-move cross-hair lines and return to the normal view. Alternatively, you can clickoutside of the graph area.
Point of Coordination Y-axis position
X-axis position
Printed Reports TriStar 3000
7-14 Feb 03

Report Examples
The remainder of this section contains samples of some of the reports which maybe generated by the TriStar 3000 Analysis Program. Most of the reports can bevaried through entries on the report options screens.
TriStar 3000 Report Examples
Feb 03 7-15
Analysis Log
Report Examples TriStar 3000
7-16 Feb 03

Isotherm Plot
TriStar 3000 Report Examples
Feb 03 7-17
BET Surface Area Report
Report Examples TriStar 3000
7-18 Feb 03
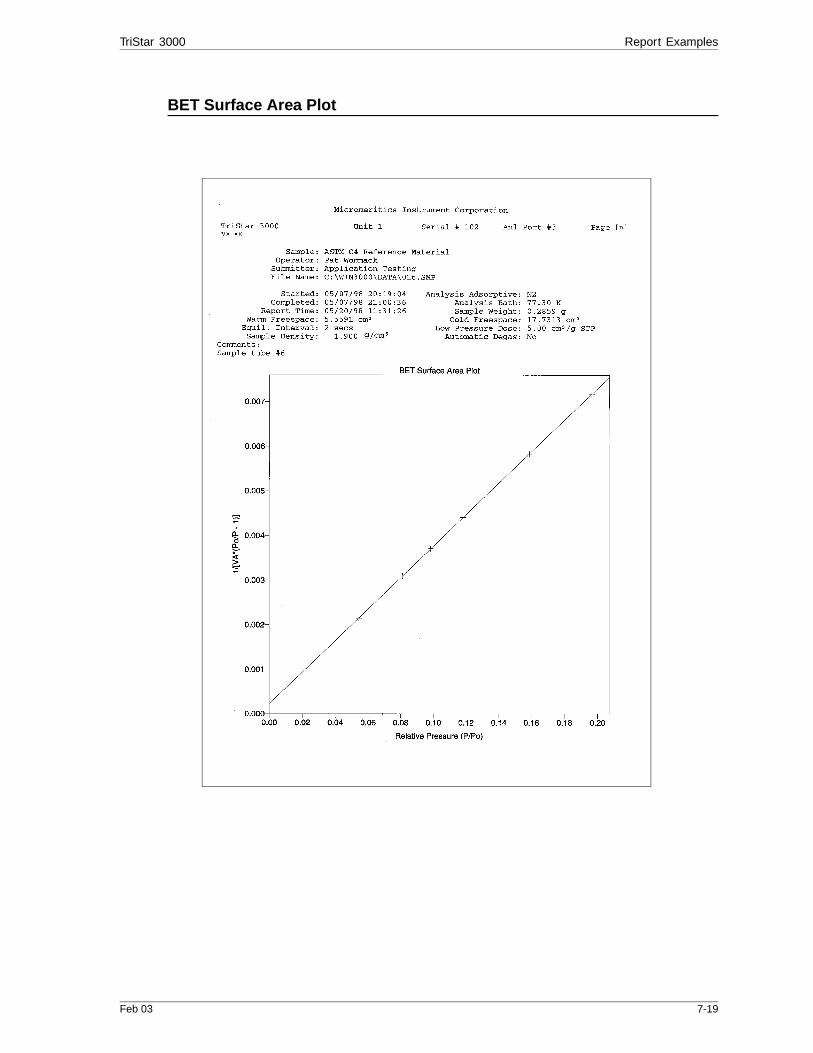
BET Surface Area Plot
TriStar 3000 Report Examples
Feb 03 7-19

Langmuir Surface Area Plot
Report Examples TriStar 3000
7-20 Feb 03
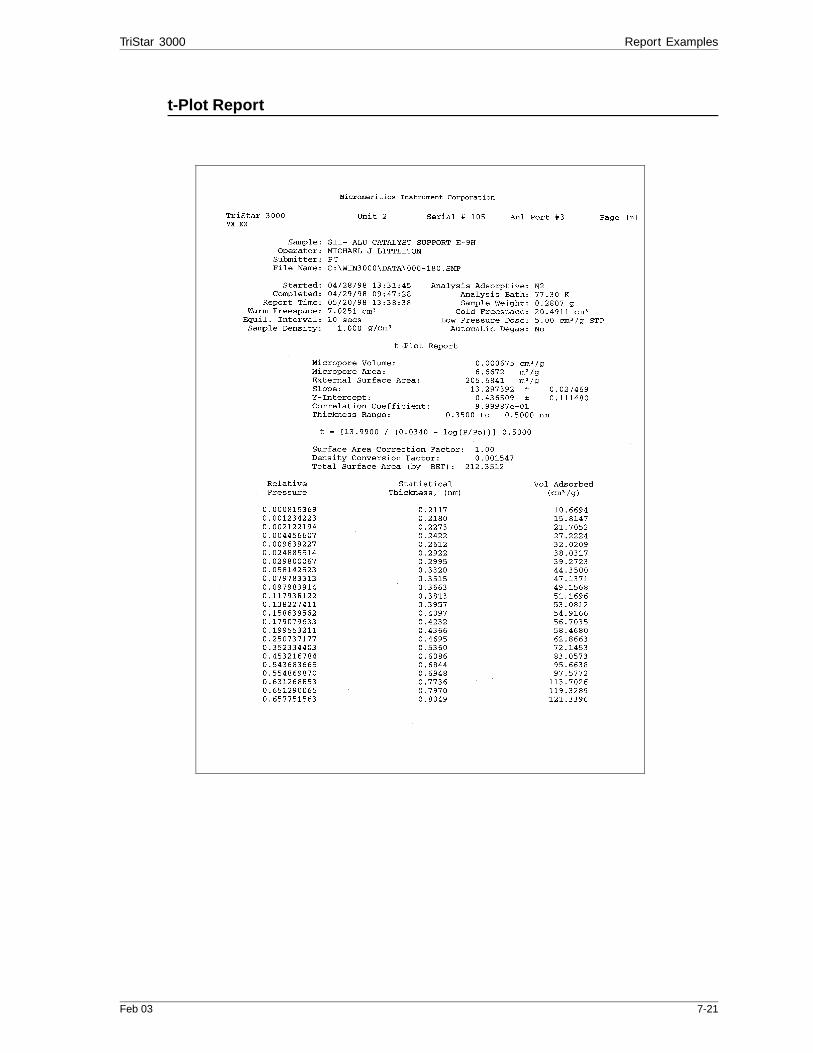
t-Plot Report
TriStar 3000 Report Examples
Feb 03 7-21
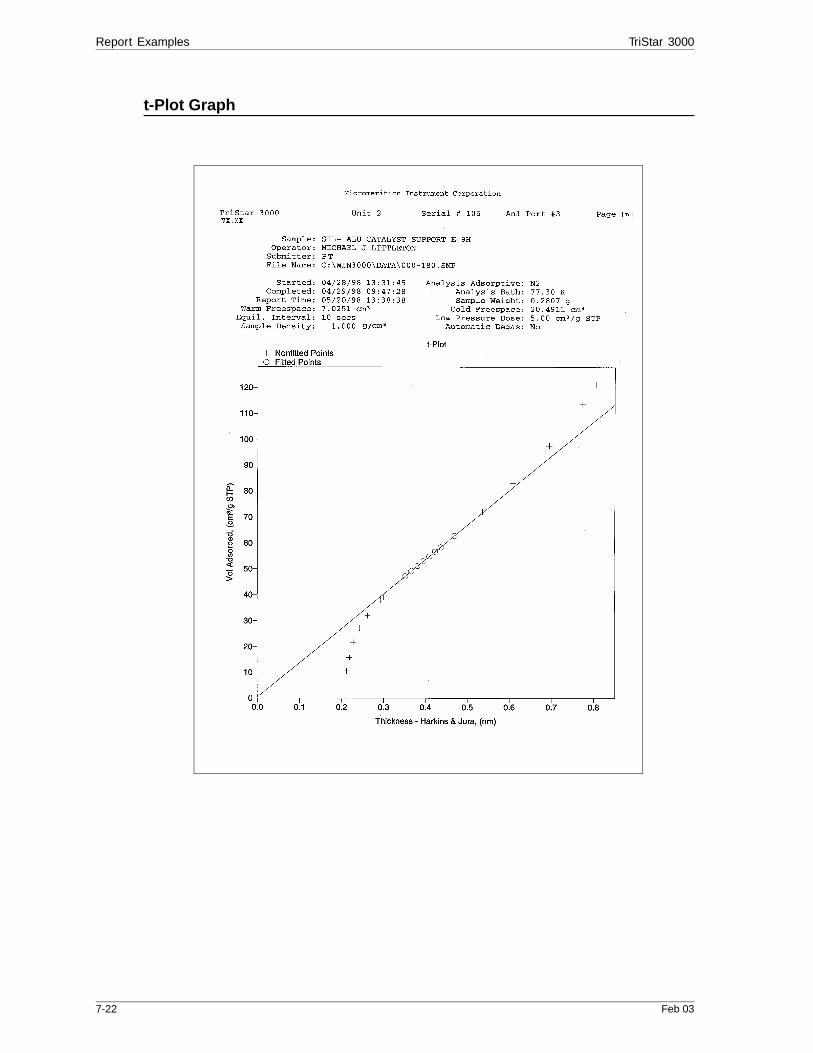
t-Plot Graph
Report Examples TriStar 3000
7-22 Feb 03
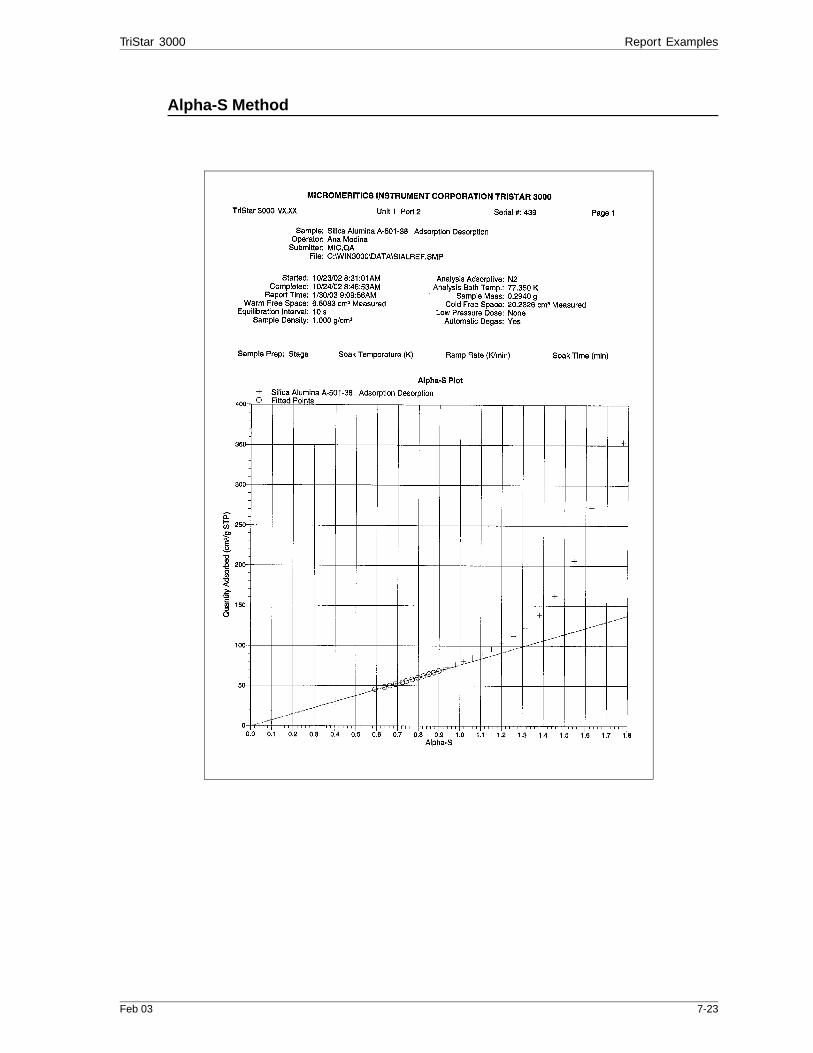
Alpha-S Method
TriStar 3000 Report Examples
Feb 03 7-23

f-Ratio Method
Report Examples TriStar 3000
7-24 Feb 03
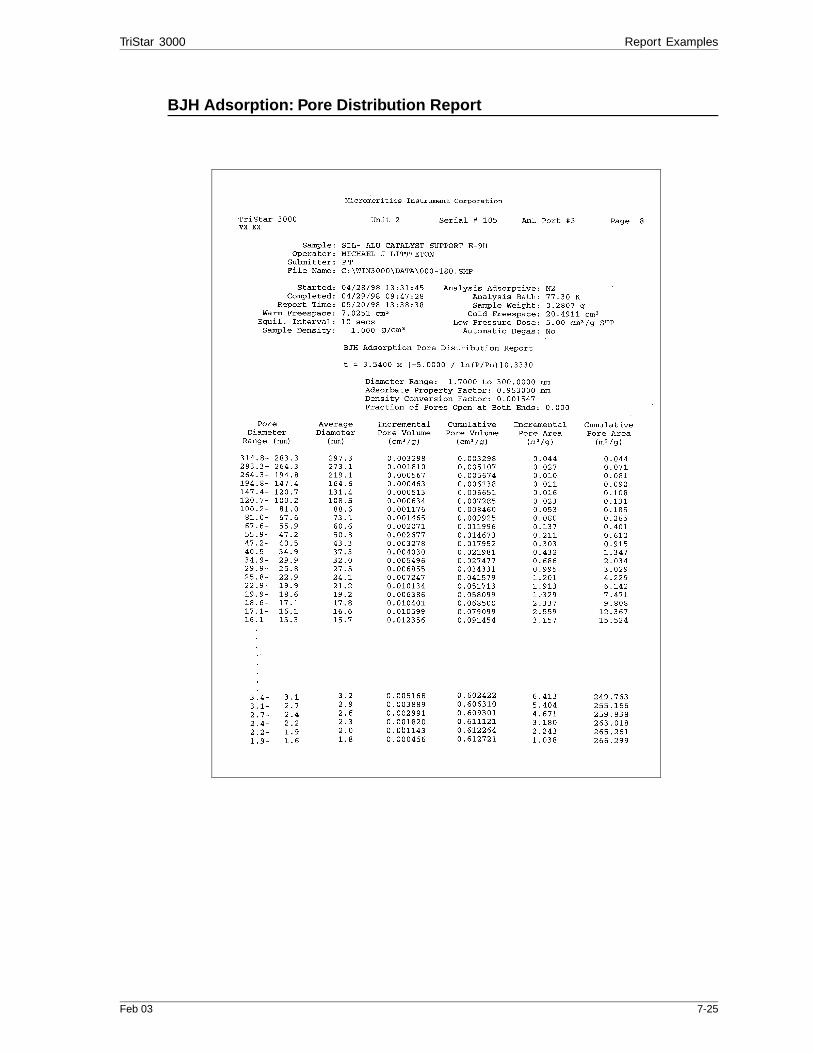
BJH Adsorption: Pore Distribution Report
TriStar 3000 Report Examples
Feb 03 7-25
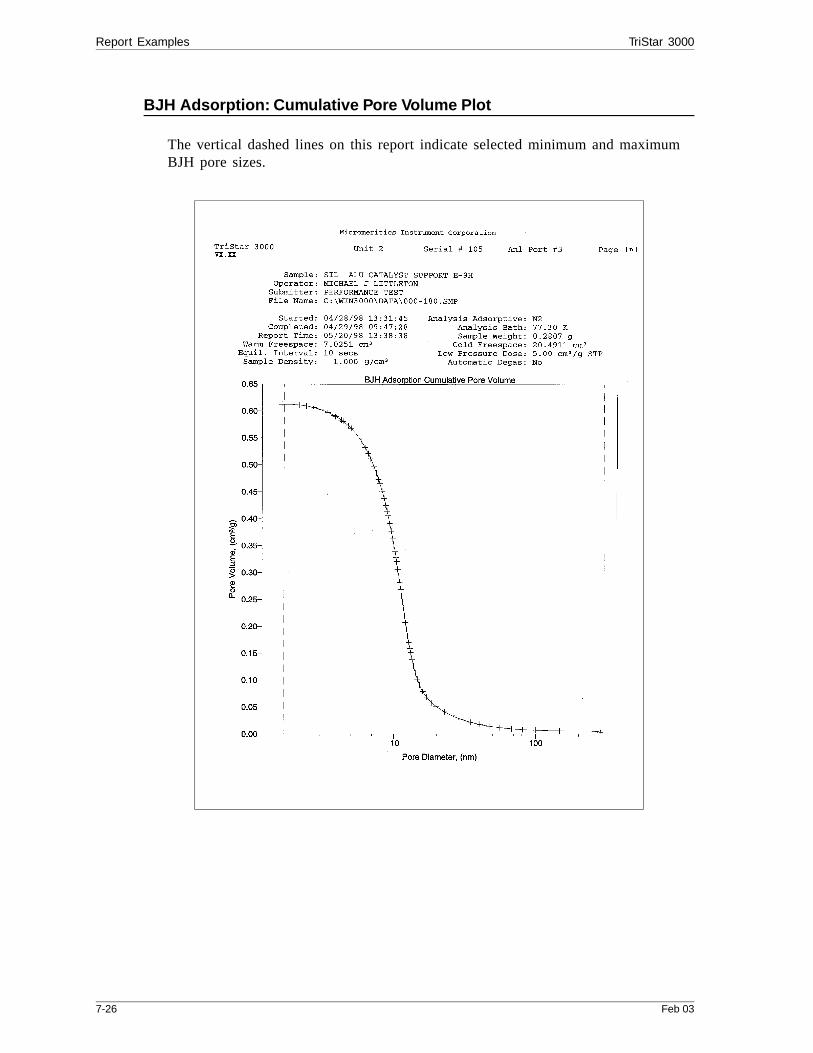
BJH Adsorption: Cumulative Pore Volume Plot
The vertical dashed lines on this report indicate selected minimum and maximumBJH pore sizes.
Report Examples TriStar 3000
7-26 Feb 03
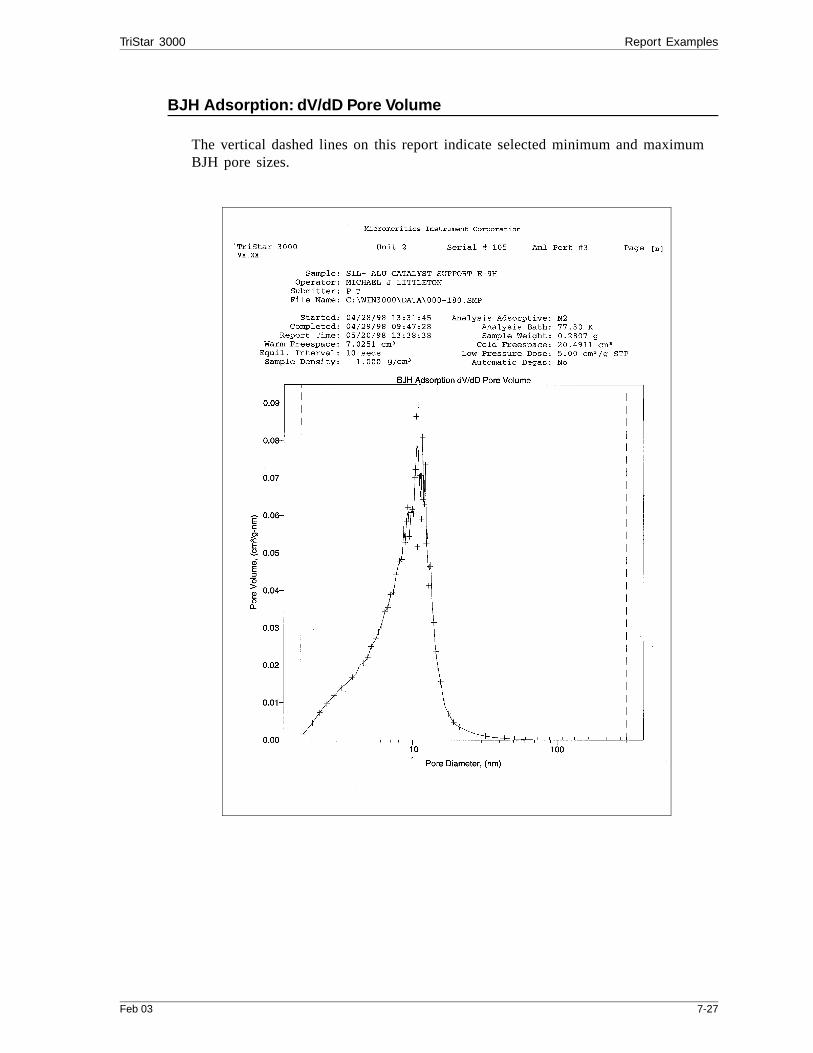
BJH Adsorption: dV/dD Pore Volume
The vertical dashed lines on this report indicate selected minimum and maximumBJH pore sizes.
TriStar 3000 Report Examples
Feb 03 7-27

BJH Adsorption: dV/dlog(D) Pore Volume
The vertical dashed lines on this report indicate selected minimum and maximumBJH pore sizes.
Report Examples TriStar 3000
7-28 Feb 03
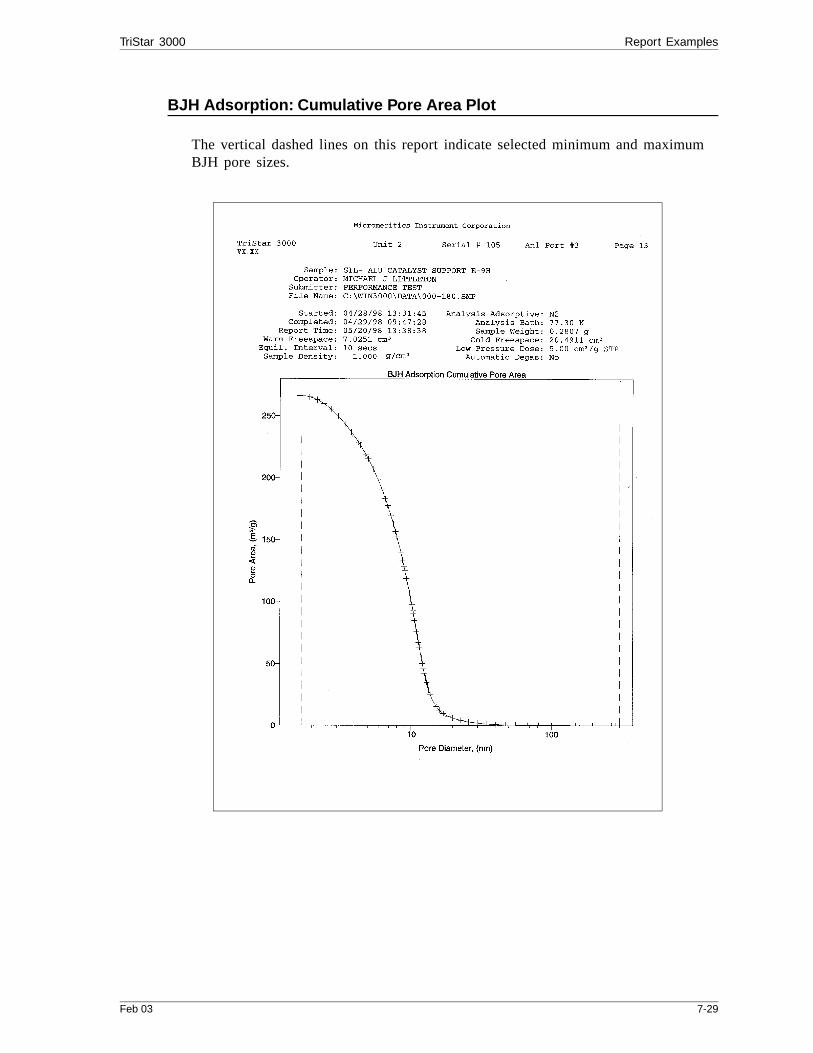
BJH Adsorption: Cumulative Pore Area Plot
The vertical dashed lines on this report indicate selected minimum and maximumBJH pore sizes.
TriStar 3000 Report Examples
Feb 03 7-29

BJH Adsorption: dA/dD Pore Area Plot
The vertical dashed lines on this report indicate selected minimum and maximumBJH pore sizes.
Report Examples TriStar 3000
7-30 Feb 03
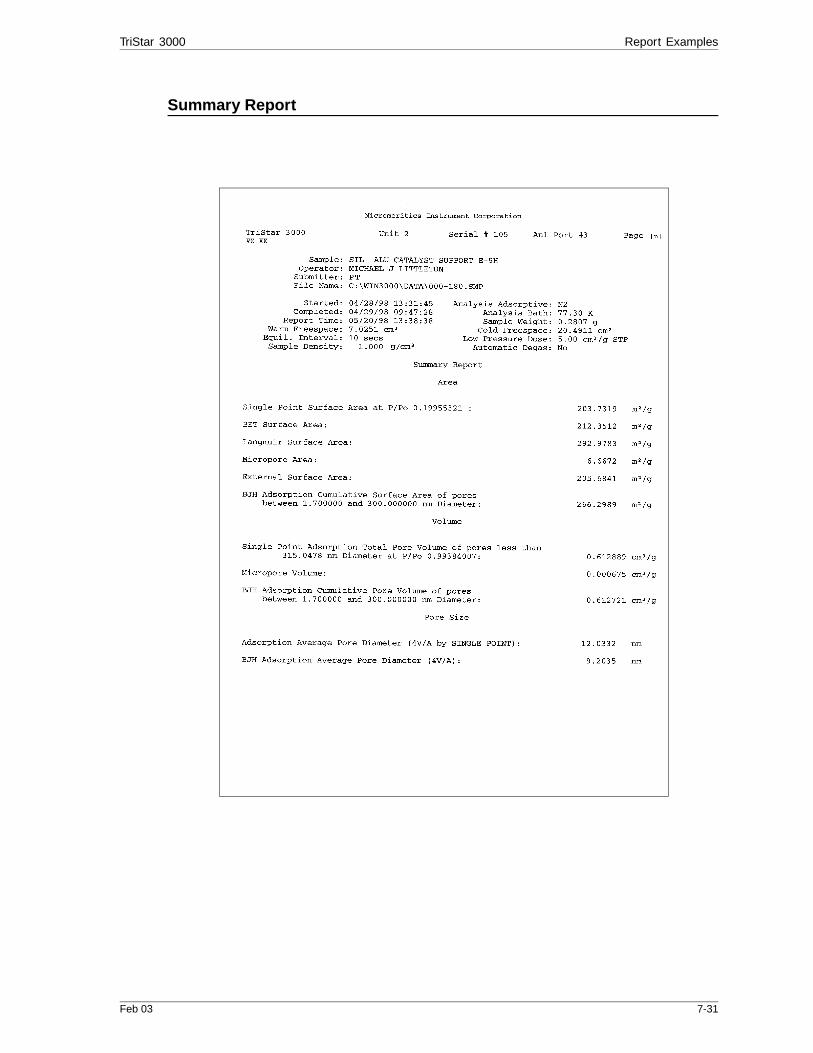
Summary Report
TriStar 3000 Report Examples
Feb 03 7-31

Sample Log Report
Report Examples TriStar 3000
7-32 Feb 03

CHAPTER 8
OPTIONS MENU
• Description
• Option Presentation
• Data Presentation
• Sample Defaults
• System Configuration
• Parameter Files Directory
• Service Test Mode

OPTIONS MENU
The Options menu contains options which allow you to configure the system toyour laboratory’s requirements. With the options on this menu, you can:
• Choose between basic, advanced, or restricted mode• Edit program defaults• Specify data presentation modes• Specify printer/plotter options• Specify a directory for predefined parameter files
Description
Listed below are brief descriptions of the options contained on the Options menu.Detailed descriptions follow this section.
Option presentation Allows you to display the sample file dialog in either Ba-sic, Advanced, or Restricted format.
Data presentaton Allows you to choose the way in which data are pre-sented on the screen and in printed reports.
Sample defaults Allows you to specify defaults for the parameters con-tained in the sample information and parameter files.
Tube characteristics Enabled only when in Service Test Mode.
System configuration Allows you to specify the printer and/or plotter to whichyou wish to have reports sent.
TriStar 3000 Description
Feb 03 8-1

Parameter filesdiretory
Allows you to specify a location for the predefined pa-rameter files used by the Basic format.
Service Test Mode Enables you to perform certain troubleshooting proce-dures. This option is available only under the direction ofa Micromeritics service representative.
Description TriStar 3000
8-2 Feb 03
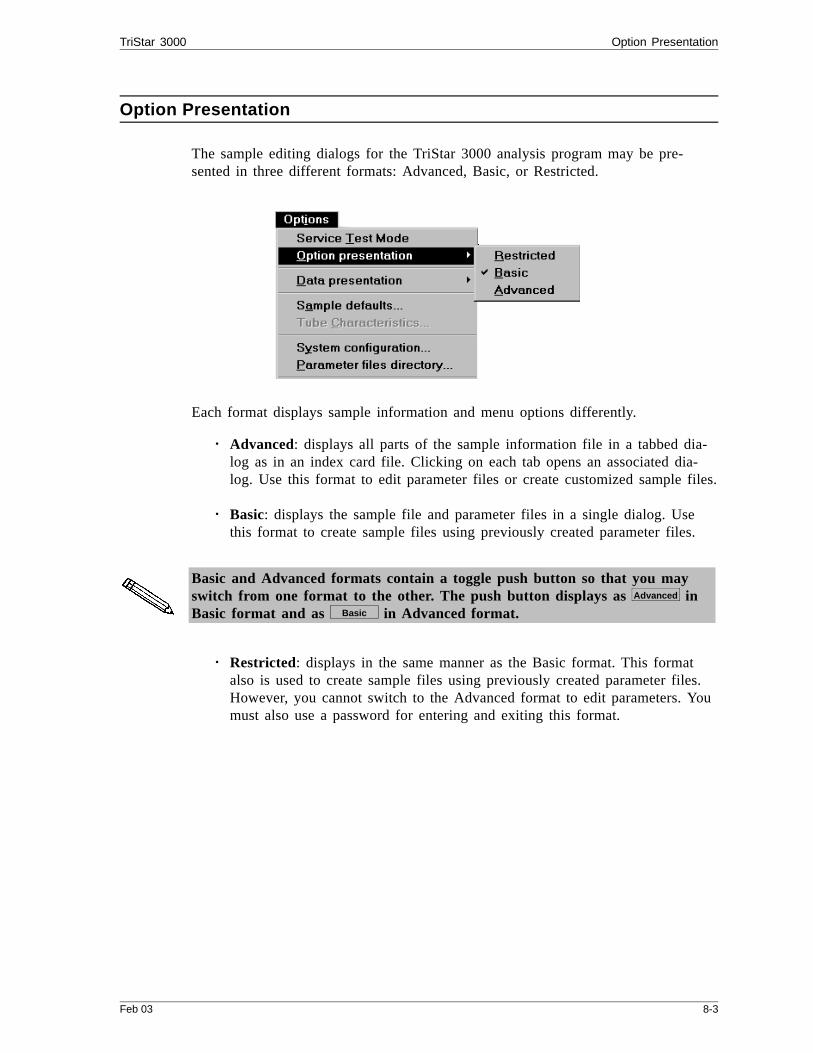
Option Presentation
The sample editing dialogs for the TriStar 3000 analysis program may be pre-sented in three different formats: Advanced, Basic, or Restricted.
Each format displays sample information and menu options differently.
• Advanced: displays all parts of the sample information file in a tabbed dia-log as in an index card file. Clicking on each tab opens an associated dia-log. Use this format to edit parameter files or create customized sample files.
• Basic: displays the sample file and parameter files in a single dialog. Usethis format to create sample files using previously created parameter files.
Basic and Advanced formats contain a toggle push button so that you mayswitch from one format to the other. The push button displays as inBasic format and as in Advanced format.
• Restricted: displays in the same manner as the Basic format. This formatalso is used to create sample files using previously created parameter files.However, you cannot switch to the Advanced format to edit parameters. Youmust also use a password for entering and exiting this format.
Advanced
Basic
TriStar 3000 Option Presentation
Feb 03 8-3

Advanced
The Advanced format presents all parts of the sample information file in a tabbeddialog. For example, if you wish to open or create a sample file using the Ad-vanced format, the following dialog is displayed.
The Advanced format is used to create customized sample files — easily andquickly. You can also switch to the Basic format, if desired, by clicking .Chapter 5 provides a detailed description of this dialog.
Basic
If you are open-ing an existingfile, this dialogalso contains atab for Collectedor Entered Data.
Option Presentation TriStar 3000
8-4 Feb 03

Basic
The Basic format presents the sample information file and its parameter files in asingle dialog. For example, if you wish to open or create a sample informationfile using the Basic format, the dialog box is displayed in this manner.
The Basic format is used to create sample information files using previously de-fined parameter files. You can easily switch to Advanced format, if desired, byclicking . Chapter 5 provides a detailed description of this dialog.Advanced
This pushbutton doesnot displaywhen in theRestrictedformat.
TriStar 3000 Option Presentation
Feb 03 8-5
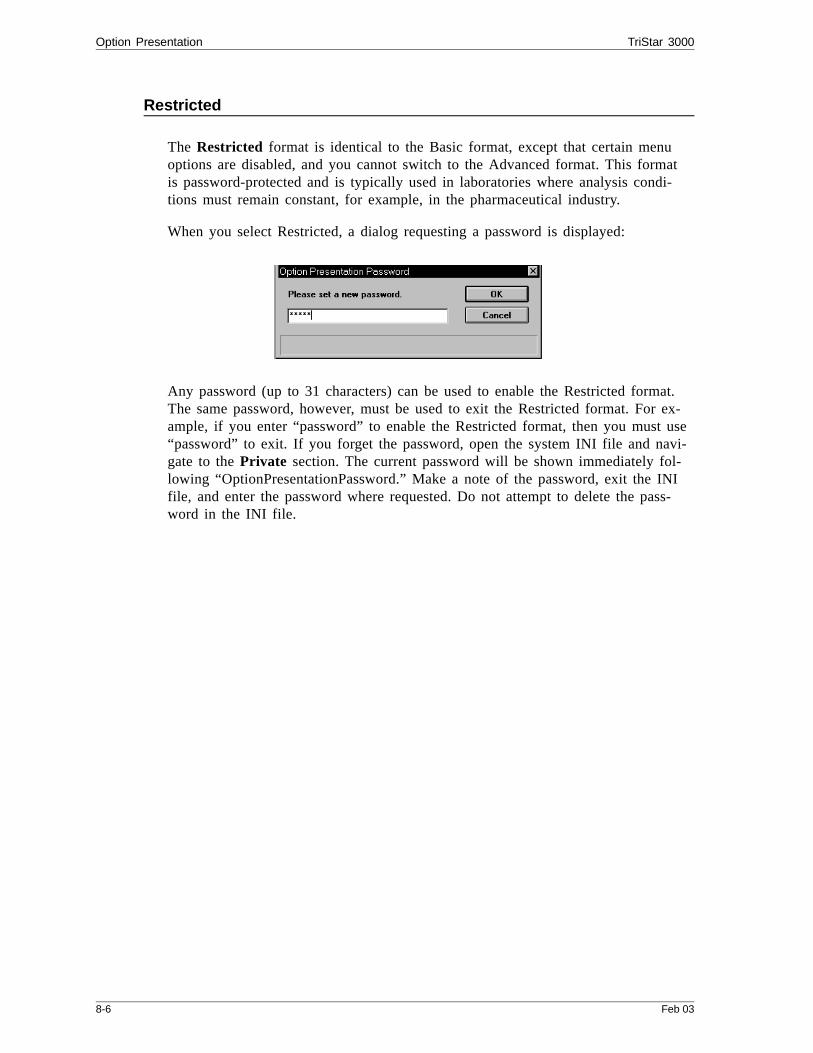
Restricted
The Restricted format is identical to the Basic format, except that certain menuoptions are disabled, and you cannot switch to the Advanced format. This formatis password-protected and is typically used in laboratories where analysis condi-tions must remain constant, for example, in the pharmaceutical industry.
When you select Restricted, a dialog requesting a password is displayed:
Any password (up to 31 characters) can be used to enable the Restricted format.The same password, however, must be used to exit the Restricted format. For ex-ample, if you enter “password” to enable the Restricted format, then you must use“password” to exit. If you forget the password, open the system INI file and navi-gate to the Private section. The current password will be shown immediately fol-lowing “OptionPresentationPassword.” Make a note of the password, exit the INIfile, and enter the password where requested. Do not attempt to delete the pass-word in the INI file.
Option Presentation TriStar 3000
8-6 Feb 03
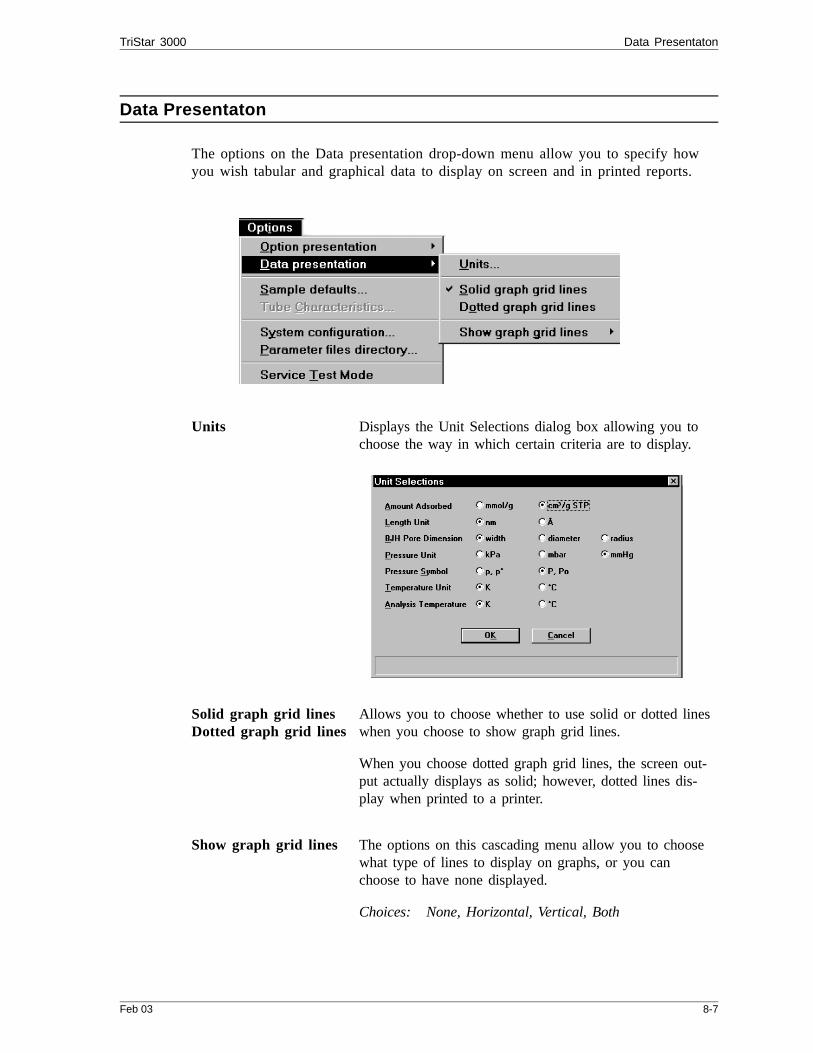
Data Presentaton
The options on the Data presentation drop-down menu allow you to specify howyou wish tabular and graphical data to display on screen and in printed reports.
Units Displays the Unit Selections dialog box allowing you tochoose the way in which certain criteria are to display.
Solid graph grid linesDotted graph grid lines
Allows you to choose whether to use solid or dotted lineswhen you choose to show graph grid lines.
When you choose dotted graph grid lines, the screen out-put actually displays as solid; however, dotted lines dis-play when printed to a printer.
Show graph grid lines The options on this cascading menu allow you to choosewhat type of lines to display on graphs, or you canchoose to have none displayed.
Choices: None, Horizontal, Vertical, Both
TriStar 3000 Data Presentaton
Feb 03 8-7

Sample Defaults
This option allows you to specify default parameters for sample information files.This option is presented in two formats: Advanced and Basic. Select Option pres-entation from the Options menu to choose the format you wish to use. Alterna-tively, you can switch between the two formats using the / togglepush button displayed on the lower right side of the screen.
Basic
When you select Sample Defaults while using the Basic format, the Default BasicSample Information dialog box is displayed.
Sequence Specify a default sequence for the sample file name. Thenumber you specify is sequenced incrementally each timeyou create a sample file. It is the number that appears inthe File name: field when you select File, Open, Sampleinformation.
• Use numbers, letters, or other printable characters,such as dashes. At least three numbers must be in-cluded.
• Use up to eight characters.
• DOS prohibits using such characters as * or ?. Referto your DOS manual for more information.
Advanced Basic
Sample Defaults TriStar 3000
8-8 Feb 03

Sample Allows you to enter an additional identification that pro-vides more information than the sample file name alone.
In the field on the left, edit the prompt for Sample if youwish. For example, you may prefer to use Test or Mate-rial. The maximum number of characters is 20.
In the field on the right, specify a format for the sampleidentification.
• Use numbers, letters, or other printable characters,such as dashes.
• Maximum number of characters is 42, plus the $ sym-bol.
• Include the automatically generated file name as partof the identification by using the $ symbol whereyou want the sequence number to appear.
For example, if the sequence number is 000-001, en-ter the sample identification as follows:
Lab #25 - $
The resulting sample identification for the first sam-ple information file would be:
Lab #25 - 000-001
and the second:
Lab #25 - 000-002, and so on.
Mass Enter a default value for the sample mass. Regardless ofwhat weight you enter as the default, the value can be ed-ited in the sample information file.
Density Enter the density of the material you are analyzing.
TriStar 3000 Sample Defaults
Feb 03 8-9

Sample TubeDegas ConditionsAnalysis ConditionsAdsorptive PropertiesReport Options
Each parameter contains a drop-down list containing filesof that type which were included with the software, aswell as any you may have created. Choose the file youwish to use as the default.
Allows you to replace all parameters of the default sam-ple file you are creating with parameters from an existingsample file. For example, you may have an existing sam-ple file that contains most (or all) of the parameters thatyou wish to use. You can click this push button, choosethe file, and then . All parameters of the file youchoose are copied into the sample defaults dialog. Youcan even change the values in these files (if needed) with-out affecting the file from which they were copied.
Saves the specified defaults.
Closes the dialog.
Replace all...
OK
Save
Close
Sample Defaults TriStar 3000
8-10 Feb 03

Advanced
When you select Sample Defaults while in the Advanced format, the SampleDefaults dialog box with the Sample Information dialog is displayed.
Sequence Allows you to specify a default sequence for the samplefile name. The number you specify is sequenced incremen-tally each time you create a sample file. It is the numberthat appears in the File name: field when you select File,Open, Sample information.
• Use numbers, letters, or other printable characters,such as dashes. At least three numbers must be in-cluded.
• Use up to eight characters.
• DOS prohibits using such characters as * or ?. Referto your DOS manual for more information.
Sample Allows you to enter an additional identification that pro-vides more information than the sample file name alone.
In the field on the left, you can edit the prompt for Sam-ple if you wish. For example, you may prefer to use Testor Material. The maximum number of characters is 20.
In the field on the right, specify a format for the sampleidentification.
TriStar 3000 Sample Defaults
Feb 03 8-11

Sample(continued)
• Use numbers, letters, or other printable characters,such as dashes.
• Maximum number of characters is 42, plus the $ sym-bol.
• Include the automatically generated file name as partof the identification by using the $ symbol whereyou want the sequence number to appear.
For example, if the sequence number is 000-001, en-ter the sample identification as follows:
Lab #25 - $
The resulting sample identification for the first sam-ple information file would be:
Lab #25 - 000-001
and the second:
Lab #25 - 000-002, and so on.
OperatorSubmitter
Allow you to enter the name (or other identification) ofthe operator performing the analysis and the name of theperson, department, customer, etc. that submitted the sam-ple for analysis.
The fields on the left can be edited to display somethingother than Operator and Submitter if you like.
The fields on the right allow you to specify default namesor titles.
• Include the automatically generated file name as partof the identification by using the symbol $ whereyou want the sequence number to appear. Refer tothe example in the previous section.
• Maximum number of characters for the prompt is 20.
• Maximum number of characters for the identificationis 42, including the $ symbol.
• Omit this item entirely from the sample informationfile by selecting Omit.
Sample Defaults TriStar 3000
8-12 Feb 03

Mass Enter a default value for the sample’s mass. Regardless ofthe value you enter in this field, the value can be editedin the sample file.
Density Enter a default density. If there is a material you analyzequite often, you may wish to use its default in this field.This value can be edited in the sample information file.
Comments Allows you to enter comments about the sample or itsanalysis conditions. Anything you ener in this window isprinted in the report header.
Allows you to enter comments about the sample or itsanalysis conditions. Anything you enter using this optionappears in the Instrument Log Report; it does not displayin the report header.
Allows you to replace the contents of all parameter filescontained in the current default sample file with thosefrom an existing sample file. For example, you may havean existing sample file that contains most (or all) of theparameters that you wish to use. You can select this pushbutton, choose the file, and then . All parameterfiles of the file you choose are copied into the sample de-faults dialog. You can even change the values in thesefiles (if needed) without affecting the file from whichthey were copied.
Click on each remaining tab of the Advanced Sample dialog to establish parame-ter defaults. Refer to Chapter 5 if you need assistance on the fields of these dia-logs.
Add Log Entry
Replace all...
OK
TriStar 3000 Sample Defaults
Feb 03 8-13

System Configuration
This option allows you to specify printer and plotter destinations for report output;the System Configuration dialog box is displayed.
Printer namePlotter name
The printer and plotter names are shown exactly as theyappear in the Operating System Print Manager.
Select Default if you wish to use the default printer andplotter as designated in the Print Manager.
If you wish to change the default printer, deselectDefault. Then choose another printer (or plotter) from thedrop-down list.
System Configuration TriStar 3000
8-14 Feb 03

Parameter Files Directory
This option allows you to select the location for the predefined parameter files dis-played in the drop-down lists on the Basic Sample Information dialog box.
When you select this option, the Parameter File Directory Selection dialog is dis-played.
The directory specified here is the one you should use when creating parameterfiles to be included in the drop-down lists on the Basic sample information dialog.It is where the software goes to obtain the files for the drop-down lists. If parame-ter files are not saved to this directory, they are not included in the lists.
TriStar 3000 Parameter Files Directory
Feb 03 8-15

Service Test Mode
Certain service tests are included in the TriStar operating program. These tests,however, can be performed only with the assistance of a trained Micromeriticsservice representative. When you select Service Test Mode from the Optionsmenu, a dialog box prompting you to enter a password is displayed. This pass-word is coded to change on a regular basis and, therefore, is known only by yourservice representative. You will be unable to perform these tests without his guid-ance.
After Service Test Mode has been enabled, the tests are accessible from the Unitmenu.
Service Test Mode TriStar 3000
8-16 Feb 03
CHAPTER 9
TROUBLESHOOTING ANDMAINTENANCE
• Cleaning the Analyzer
• Replacing Port Frit and O-ring
• Calibrating the System

TROUBLESHOOTING AND MAINTENANCE
The TriStar 3000 system has been designed to provide efficient and continuousservice. However, certain maintenance procedures should be followed to obtain thebest results over the longest period of time. This chapter includes maintenanceprocedures and calibration procedures.
Cleaning the Analyzer
The exterior casing of the analyzer may be cleaned using a clean cloth, dampenedwith isopropyl alcohol (IPA), a mild detergent, or a 3% hydrogen peroxide solu-tion.
Do not allow liquid to penetrate the casing of the analyzer. Doing so could re-sult in damage to the unit.
TriStar 3000 Cleaning the Analyzer
Feb 03 9-1
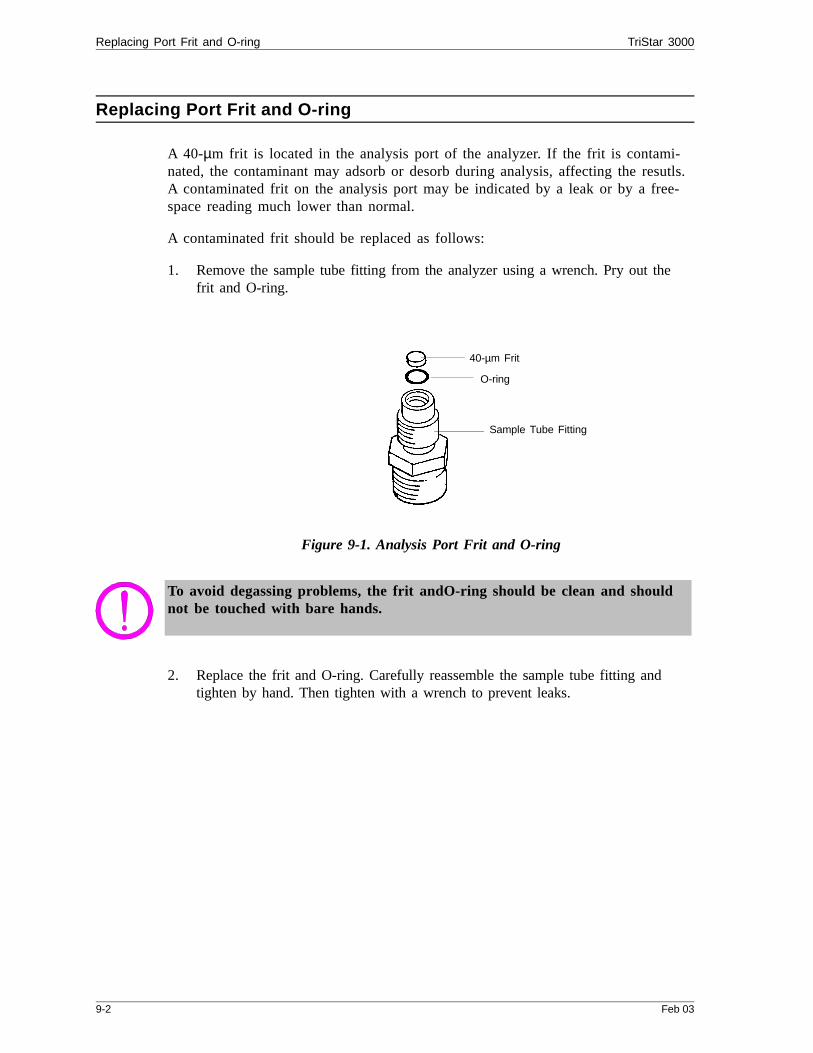
Replacing Port Frit and O-ring
A 40-µm frit is located in the analysis port of the analyzer. If the frit is contami-nated, the contaminant may adsorb or desorb during analysis, affecting the resutls.A contaminated frit on the analysis port may be indicated by a leak or by a free-space reading much lower than normal.
A contaminated frit should be replaced as follows:
1. Remove the sample tube fitting from the analyzer using a wrench. Pry out thefrit and O-ring.
Figure 9-1. Analysis Port Frit and O-ring
To avoid degassing problems, the frit andO-ring should be clean and shouldnot be touched with bare hands.
2. Replace the frit and O-ring. Carefully reassemble the sample tube fitting andtighten by hand. Then tighten with a wrench to prevent leaks.
40-µm Frit
O-ring
Sample Tube Fitting
Replacing Port Frit and O-ring TriStar 3000
9-2 Feb 03
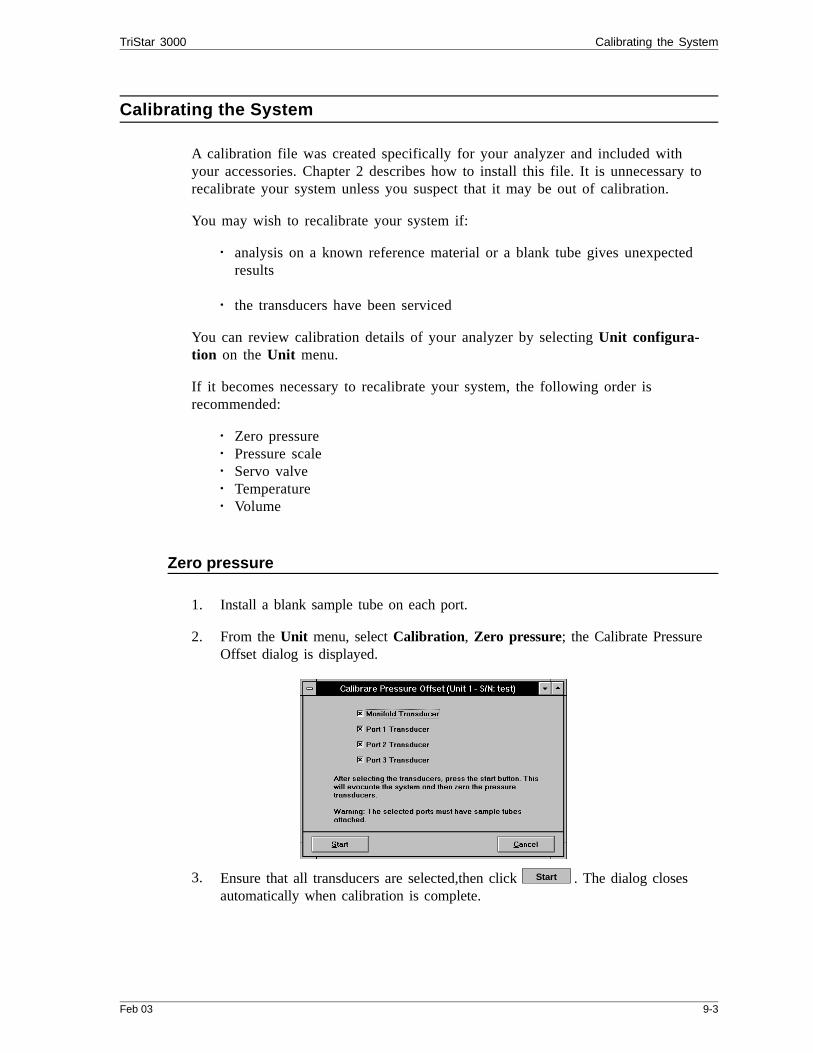
Calibrating the System
A calibration file was created specifically for your analyzer and included withyour accessories. Chapter 2 describes how to install this file. It is unnecessary torecalibrate your system unless you suspect that it may be out of calibration.
You may wish to recalibrate your system if:
• analysis on a known reference material or a blank tube gives unexpectedresults
• the transducers have been serviced
You can review calibration details of your analyzer by selecting Unit configura-tion on the Unit menu.
If it becomes necessary to recalibrate your system, the following order isrecommended:
• Zero pressure• Pressure scale• Servo valve• Temperature• Volume
Zero pressure
1. Install a blank sample tube on each port.
2. From the Unit menu, select Calibration, Zero pressure; the Calibrate PressureOffset dialog is displayed.
3. Ensure that all transducers are selected,then click . The dialog closesautomatically when calibration is complete.
Start
TriStar 3000 Calibrating the System
Feb 03 9-3
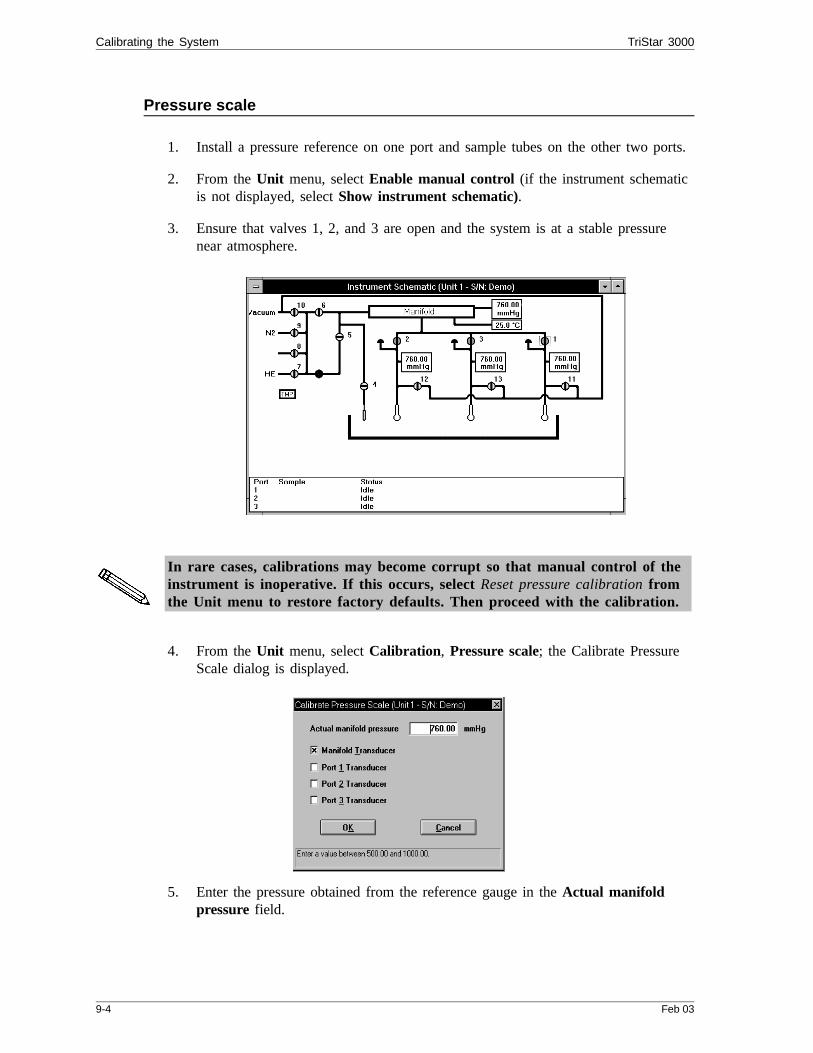
Pressure scale
1. Install a pressure reference on one port and sample tubes on the other two ports.
2. From the Unit menu, select Enable manual control (if the instrument schematicis not displayed, select Show instrument schematic).
3. Ensure that valves 1, 2, and 3 are open and the system is at a stable pressurenear atmosphere.
In rare cases, calibrations may become corrupt so that manual control of theinstrument is inoperative. If this occurs, select Reset pressure calibration fromthe Unit menu to restore factory defaults. Then proceed with the calibration.
4. From the Unit menu, select Calibration, Pressure scale; the Calibrate PressureScale dialog is displayed.
5. Enter the pressure obtained from the reference gauge in the Actual manifoldpressure field.
Calibrating the System TriStar 3000
9-4 Feb 03
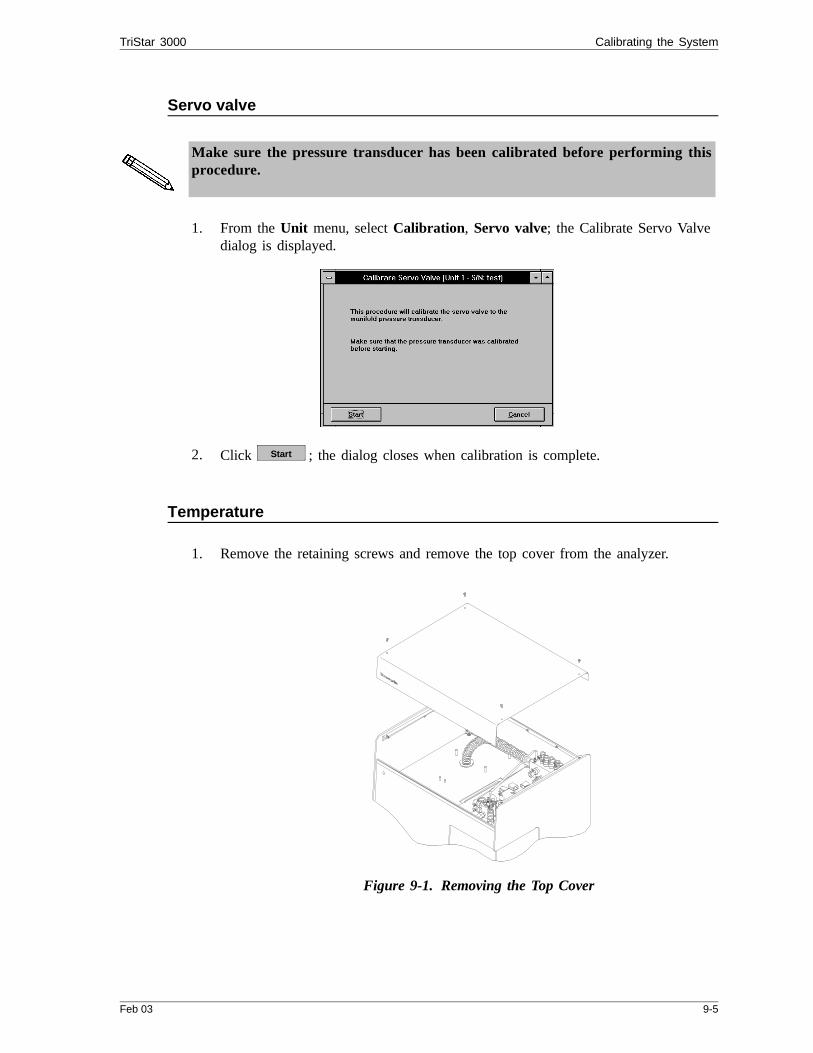
Servo valve
Make sure the pressure transducer has been calibrated before performing thisprocedure.
1. From the Unit menu, select Calibration, Servo valve; the Calibrate Servo Valvedialog is displayed.
2. Click ; the dialog closes when calibration is complete.
Temperature
1. Remove the retaining screws and remove the top cover from the analyzer.
Figure 9-1. Removing the Top Cover
Start
TriStar 3000 Calibrating the System
Feb 03 9-5

2. Locate the dosing manifold and insert the calibration device into the hole next tothe RTD (resistance thermal device).
Figure 9-2. Inserting the Calibration Device
3. Wait until the temperature stabilizes (approximately 1 to 2 minutes).
4. From the Unit menu, select Calibration, Temperature; the Calibrate ManifoldTemperature dialog is displayed.
5. Enter the temperature obtained using the calibration device, then click .OK
Calibration Device
Dosing Manifold
RTD
Calibration Device
RTD
Calibrating the System TriStar 3000
9-6 Feb 03
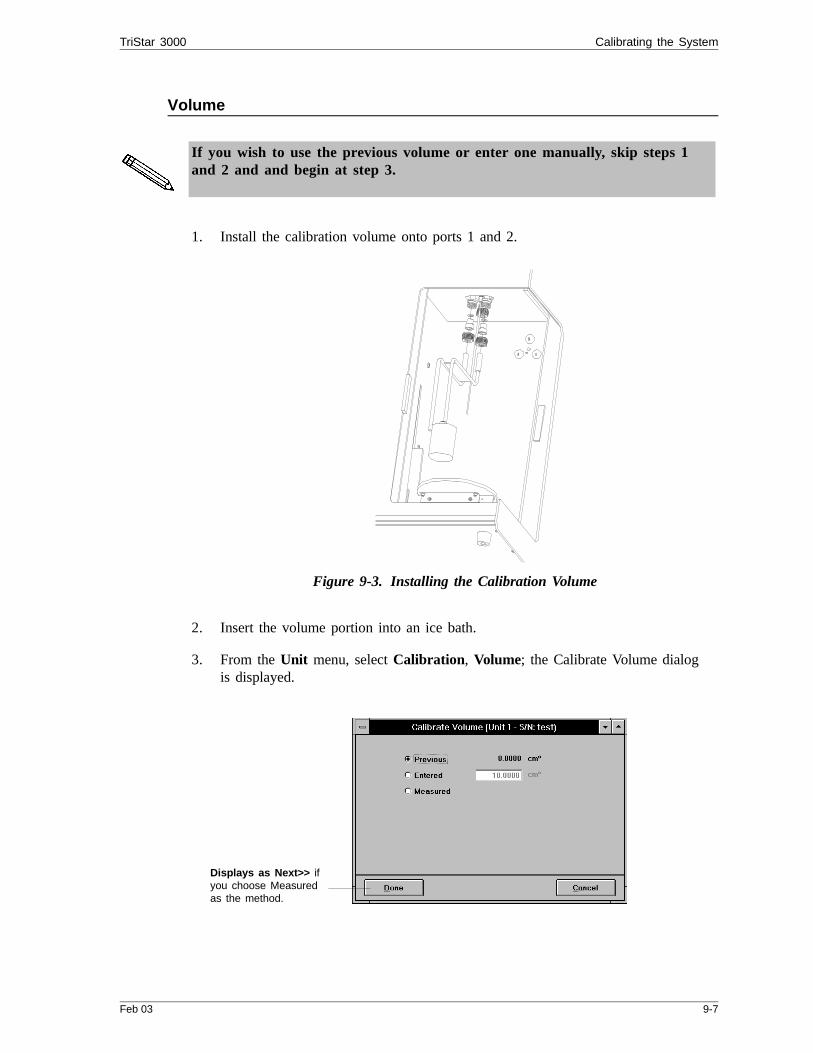
Volume
If you wish to use the previous volume or enter one manually, skip steps 1and 2 and and begin at step 3.
1. Install the calibration volume onto ports 1 and 2.
Figure 9-3. Installing the Calibration Volume
2. Insert the volume portion into an ice bath.
3. From the Unit menu, select Calibration, Volume; the Calibrate Volume dialogis displayed.
Displays as Next>> ifyou choose Measuredas the method.
TriStar 3000 Calibrating the System
Feb 03 9-7

4. Choose the method you wish to use for calibrating the volume.
• Previous: simply click to close the dialog box; the previous vol-ume is used.
• Entered: enter the volume you wish to use, then click to close thedialog box.
• Measured: click ; a second view of the Calibrate Volume dialog isdisplayed.
5. Enter the volume of the calibration volume device.
6. Ensure that the temperature is 0.00 ± 0.10 °C.
7. Select (or enter) the number of measurements you wish to make; generally, 3 issufficient.
8. Select (or enter) an equilibration time; generally, 10 minutes are sufficient.
9. Click to begin calibration; an informational dialog displaying calibrationstatus is displayed. After calibration is complete, a final view of the CalibrationVolume dialog is displayed.
10. Confirm that the value is acceptable and click to close the dialog.
Done
Done
Next >>
Start
Done
Calibrating the System TriStar 3000
9-8 Feb 03

CHAPTER 10
ORDERING INFORMATION
ORDERING INFORMATION
The TriStar 3000 Analysis System components and accessories can be orderedthrough our Customer Order Entry Department - (770) 662-3636. When ordering,please use the information provided in the following table.
Table 10-1. TriStar 3000 System Components and Accessories
Part Number Item and Description
065-00000-00 SmartPrep 065, Windows interface allowing programmableramp and soak rates; degasses up to six samples with flowinggas
060-00030-00 FlowPrep 060, degasses up to six samples at up to 400 °C with flowing gas
061-00030-00 VacPrep 061, degasses up to six samples at up to 400 °C; uses flowing gas or evacuation by vacuum(evacuation requires a vacuum pump and a regulator)
062-00000-11 Vacuum pump with built-in anti-suckback valve, 100/120VAC, includes hose kit
062-00000-23 Vacuum pump with built-in anti-suckback valve, 220/240VAC, includes hose kit
062-33002-00 Activated alumina oil vapor trap
004-16830-00 Activated alumina, 500 grams; for oil vapor trap
003-22617-00 Valve, solenoid 24 VDC 10-32 Mt, 0.025-in. orifice, forstandard evacuation (Valves 1 through 10)
003-22626-00 Valve, solenoid 24 VDC 10-32 Mt, 0.060-in. orifice, for fastevacuation (Valves 11, 12, and 13)
004-62230-58 CGA 580 fitting, 30 psig (He, N2)
004-62230-32 CGA 320, 30 psig (CO2)
004-33601-00 Expansion Kit; adds an additional outlet to the gas regulator
004-33602-00 Pressure Relief Kit; prevents excessive gas pressure in theevent of regulator failure (not to be used with toxic gases)
004-16833-00 Reference Material, Carbon black, SA~23.8 m2/g
004-16821-00 Reference Material, Silica alumina, SA~215 m2/g, PV~0.6 cc/g
003-20665-00 Cable, M/F 9-pin D 6 ft. straight thru
TriStar 3000 Ordering Information
Mar 03 10-1
Part Number Item and Description
004-25549-00 Reducer, 1/8-in. tube x 1/4-in. tube
230-02001-00 Gas inlet line
240-14855-00 Rack, sample tube
240-25853-00 Funnel, sample tube
240-25901-00 Dip stick
300-33601-00 Sample Tube Kit, 1/4-in; includes sample tubes,isothermal jackets, filler rods, ferrules, O-rings, caps, anddewar cover
300-33602-00 Sample Tube Kit, 3/8-in; includes sample tubes, brush (forcleaning sample tubes), isothermal jackets, filler rods,ferrules, O-rings, stoppers, and dewar cover
300-33603-00 Sample Tube Kit, 1/2-in; includes sample tubes, brush (forcleaning sample tubes), isothermal jackets, filler rods,ferrules, O-rings, stoppers, and dewar cover
300-61001-00 Sample tube, 1/4-in. stem OD; for analyzing powderedsamples where free-space management (with a filler rodinserted) is critical
300-61002-00 Sample tube, 3/8-in. stem OD; for analyzing any type ofsample
300-61003-00 Sample tube, 1/2-in. stem OD; for analyzing larger piecesof granular or pelleted samples
300-25901-00 Isothermal jacket, for sample tube
300-25902-00 Isothermal jacket, for 3/8-in. sample tube
300-25903-00 Isothermal jacket, for 1/2-in. sample tube
300-25904-00 Filler rod assembly, for 1/4-in. sample tube
300-25905-00 Filler rod assembly, for 3/8-in. sample tube300-25906-00 Filler rod assembly, for 1/2-in. sample tube
004-25466-00 O-Ring, for sample port and 1/4-in. sample tube
004-25022-00 O-Ring, for 3/8-in. sample tube
004-25469-00 O-Ring, for 1/2-in. sample tube
300-31802-02 Dewar cover, for 1/4-in. and 3/8-in. sample tubes
300-31802-03 Dewar cover, for 1/2-in. sample tube
004-54104-00 Brush, for cleaning 3/8-in. sample tubes
004-54609-00 Brush, for cleaning 1/2-in. sample tubes
Ordering Information TriStar 3000
10-2 Dec 06
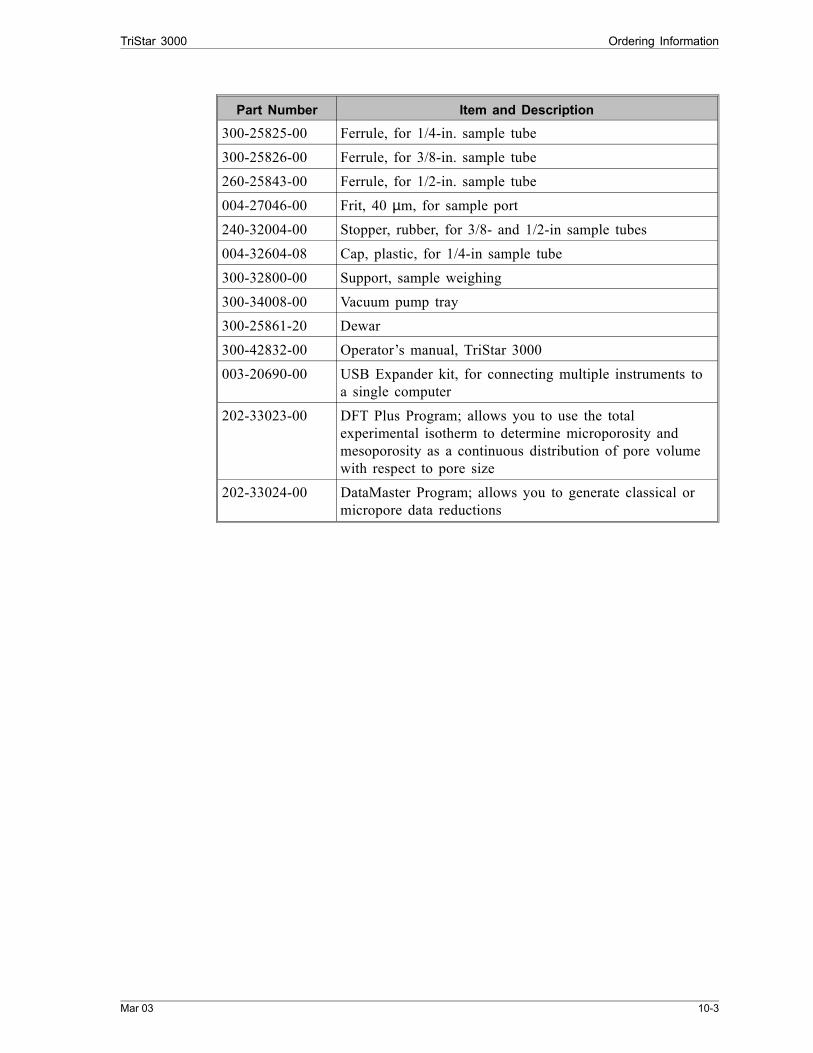
Part Number Item and Description
300-25825-00 Ferrule, for 1/4-in. sample tube
300-25826-00 Ferrule, for 3/8-in. sample tube
260-25843-00 Ferrule, for 1/2-in. sample tube
004-27046-00 Frit, 40 µm, for sample port
240-32004-00 Stopper, rubber, for 3/8- and 1/2-in sample tubes
004-32604-08 Cap, plastic, for 1/4-in sample tube
300-32800-00 Support, sample weighing
300-34008-00 Vacuum pump tray300-25861-20 Dewar
300-42832-00 Operator’s manual, TriStar 3000
003-20690-00 USB Expander kit, for connecting multiple instruments toa single computer
202-33023-00 DFT Plus Program; allows you to use the totalexperimental isotherm to determine microporosity andmesoporosity as a continuous distribution of pore volumewith respect to pore size
202-33024-00 DataMaster Program; allows you to generate classical ormicropore data reductions
TriStar 3000 Ordering Information
Mar 03 10-3
APPENDIX A
FORMS
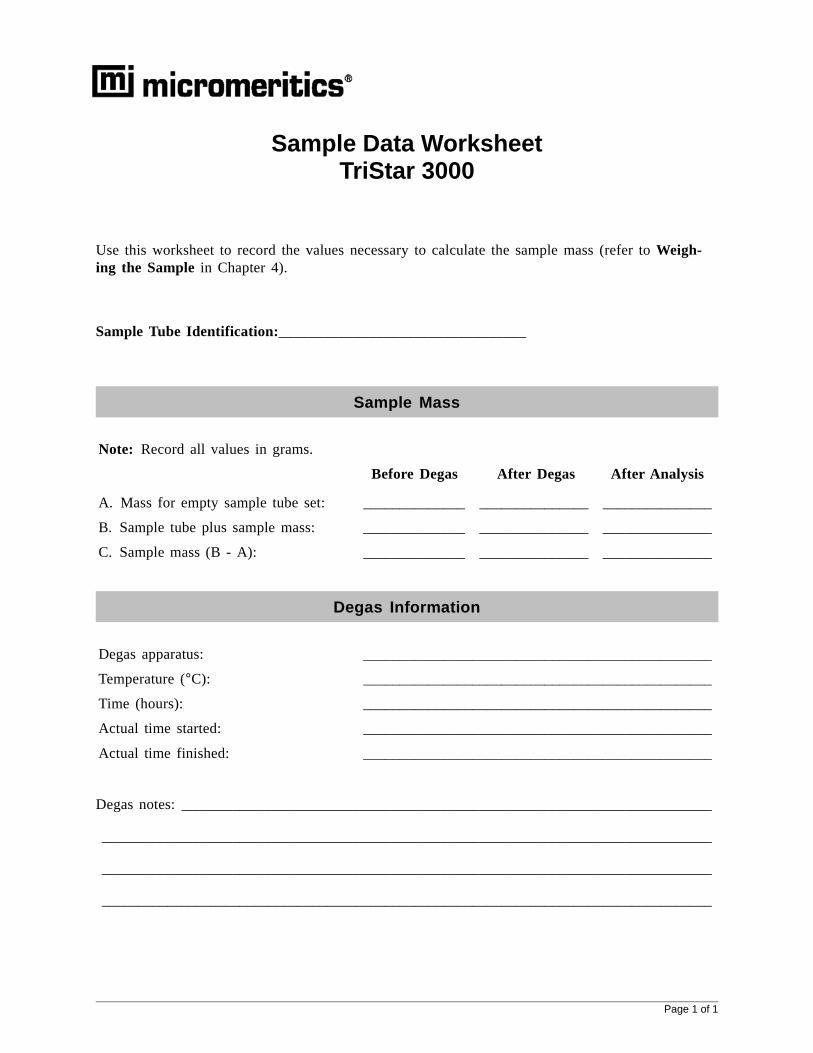
Sample Data WorksheetTriStar 3000
Use this worksheet to record the values necessary to calculate the sample mass (refer to Weigh-ing the Sample in Chapter 4).
Sample Tube Identification:_________________________________
Sample Mass
Note: Record all values in grams.
Before Degas After Degas After Analysis
A. Mass for empty sample tube set: ______________ _______________ _______________
B. Sample tube plus sample mass: ______________ _______________ _______________
C. Sample mass (B - A): ______________ _______________ _______________
Degas Information
Degas apparatus: ________________________________________________
Temperature (°C): ________________________________________________
Time (hours): ________________________________________________
Actual time started: ________________________________________________
Actual time finished: ________________________________________________
Degas notes: _________________________________________________________________________
____________________________________________________________________________________
____________________________________________________________________________________
____________________________________________________________________________________
Page 1 of 1
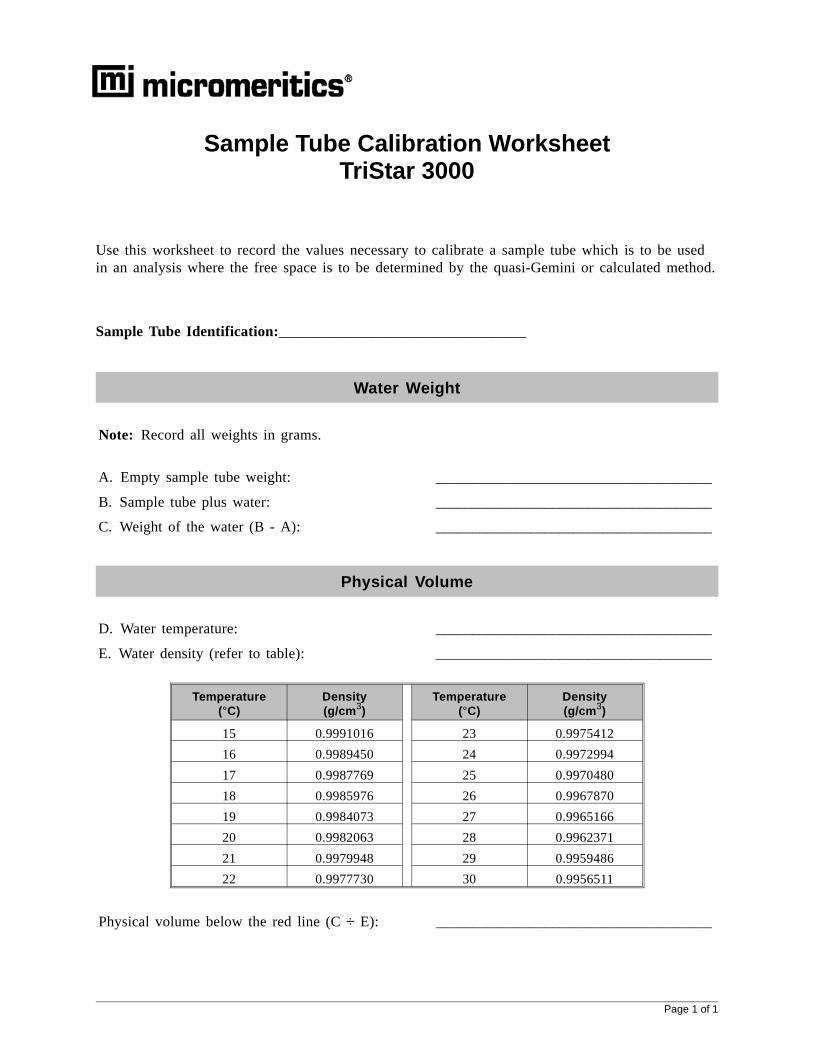
Sample Tube Calibration WorksheetTriStar 3000
Use this worksheet to record the values necessary to calibrate a sample tube which is to be usedin an analysis where the free space is to be determined by the quasi-Gemini or calculated method.
Sample Tube Identification:_________________________________
Water Weight
Note: Record all weights in grams.
A. Empty sample tube weight: ______________________________________
B. Sample tube plus water: ______________________________________
C. Weight of the water (B - A): ______________________________________
Physical Volume
D. Water temperature: ______________________________________
E. Water density (refer to table): ______________________________________
Temperature(°C)
Density(g/cm3)
Temperature(°C)
Density(g/cm3)
15 0.9991016 23 0.9975412
16 0.9989450 24 0.9972994
17 0.9987769 25 0.9970480
18 0.9985976 26 0.9967870
19 0.9984073 27 0.9965166
20 0.9982063 28 0.9962371
21 0.9979948 29 0.9959486
22 0.9977730 30 0.9956511
Physical volume below the red line (C ÷ E): ______________________________________
Page 1 of 1

APPENDIX B
ERROR MESSAGES

ERROR MESSAGES
Error messages for the are listed numerically. If the Action response instructs you tocontact your service representative, record the error message and make backup copiesof any files involved in the operation.
The 1000 series error messages, used primarily for software testing, are not in-cluded in this appendix. These errors should not occur during normal opera-tion. If you receive a 1000 series error message, contact your servicerepresentative after making backup copies of any files involved in the operation.
2401- FATAL ERROR: (error message)2402- MMDevice- Invalid state seen in T/O table.2403- MMDevice- Invalid state seen in ERR table.2404- MMDevice- Invalid state seen in DONE table.2405- MMDevice- Invalid CmdType in DONE table.2406- MMDevice- Invalid I/O State returned.2407- MMDevice- CommandManager failed.2408- MMDevice- XModem failed.2409- MMDevice- SerialComm failed.2410- MMDevice- Invalid UserID returned.2411- MMDevice- Invalid state reached. cannot continue.2412- MMDevice- Time-out. Canceling operation.2413- MMDevice- Time-out during block receive. Retrying.2414- MMDevice- Error. State was (number).2415- CommandMgr- Invalid state reached. cannot continue.2416- CommandMgr- Time-out. State was (number).2417- CommandMgr- Parity or overrun error in receive.2418- CommandMgr- Bad ACK received.2419- CommandMgr- MICIC reports a command receive error: (number).2420- CommandMgr- Unknown ACK (number number number) vs
(number number number).2421- CommandMgr- ’Last ACK’ received from MICIC.2422- XModem- Invalid state reached. cannot continue.2423- XModemSender- Invalid state reached. cannot continue.2424- XModemRcvr- Invalid state (number). cannot continue.2425- XModemRcvr- Time-out. State was (number).2426- XModemRcvr- Error. State was (number).2427- XModemRcvr- Packet received out of sequence.2428- XModemRcvr- Packet failed CRC validate.2429- XModemRcvr- Duplicate packet received.
Cause: An internal processing and/or hardware error has occurred duringcommunication with the analyzer.
Action: Contact your service representative if you continue to receive thismessage.
TriStar 3000 Appendix B
Jan 05 B-1

2430- Error accessing file (file name), error code = (number).
Cause A: Diskette may be damaged.
Action A: Clean the diskette drive. If this does not eliminate the problem, at-tempt operation using a backup copy of the file.
Cause B: Hard disk may be damaged.
Action B: Contact your service representative.
Cause C: A software error occurred when the file was accessed.
Action C: Contact your service representative.
Cause D: The name specified contains one or more invalid characters.
Action D: Enter a valid DOS filename (refer to your operating systems man-ual).
2431- Error writing file (file name), error code = (number).
Cause: The hard disk does not have enough space left to perform the opera-tion.
Action: Copy files not used regularly from the hard disk to diskette, deletethem from the hard disk, and then try the operation again.
2432- Invalid response from MMI ’FILE_READ’ request.
Cause: An internal processing and/or hardware error has occurred.
Action: Contact your service representative if you continue to receive this er-ror message.
Appendix B TriStar
B-2 Jan 05

2433- New entries have been found in this directory. Refresh the directoryinformation?
Cause: Several TriStar 3000 files (sample information, analysis conditions,adsorptive properties, or report options) have been added to this di-rectory by some function other than the TriStar 3000 program.
Action: Select to update the directory information with data from eachnew file. This operation may take a minute.
Select if you do not want to spend the time updating the direc-tory information. This option may be feasible if a large number offiles have been copied into the directory and you know the name ofthe file you wish to access.
2434- File (file name) — Subset # (number) wrote wrong amount of data.
Cause: An internal processing and/or hardware error has occurred.
Action: Contact your service representative if you continue to receive this er-ror message.
2435- SerialComm Rcv Time-out — Expected (number) | Rcv’d (number).
Cause: An internal processing and/or hardware error has occurred duringcommunication with the interface controller.
Action: Contact your service representative if you continue to receive this er-ror message.
2436- Path specification (path name) is invalid.
Cause: You entered an invalid path name and/or extension.
Action: Type a valid path name (including the proper extension) and press .
2437- File (file name) does not exist.
Cause: You entered a file specification that does not exist.
Action: Enter an existing file specification or select a file name from thelist box.
Yes
No
↵ Enter
TriStar 3000 Appendix B
Jan 05 B-3

2438- Disk drive (letter): is inaccessible.2439- Could not register file.2440- Subset not found.2441- Seek within file failed.2442- Bad header in subset file.2443- Subset owner denied access.2444- Not a valid file format.2445- Subset wrote the wrong amount of data.2446- Error reading data.2447- Error writing data.
Cause: An unexpected error occurred when you tried to access a data file.
Action: Contact your service representative.
2448- File directory (path name) is invalid. Resetting to the installation directory.
Cause: A working directory specified in the .INI file is invalid. The direc-tory may have been deleted or moved to a different location.
Action: The installation directory will be substituted. The next time youopen a file, use the Directories: list to move to the correct directory.
2449- This field does not contain a valid file specification.
Cause: You entered an invalid file name.
Action: See the description of file naming conventions in your DOS or Win-dows manual and re-enter the name.
2458- An instrument is performing a critical operation. Wait a few momentsbefore exiting the application.
Cause: You are attempting to exit the application while the instrument isperforming a critical operation. This operation must be completedbefore the application can be stopped.
Action: Wait a short time and attempt to stop the application again.
Appendix B TriStar
B-4 Jan 05

2459- An instrument is busy. A delay in restarting this application could result inloss of new data. Continue with program Exit? (Yes, No)
Cause: You are attempting to exit the application while an analysis is inprogress. While this is possible, the data collected while the applica-tion is inactive will not be permanently recorded until the applica-tion is re-started. A power failure to the instrument could causesome data to be lost.
Action: If you are not concerned with the potential for loss of data should apower failure occur, select Yes to continue; otherwise select No.
2460- Fatal Communications error on (Unit n - S/N: nnnn)
Cause: There was a fatal error in the serial communications between the ap-plication and the software in the instrument. All displays for that in-strument will be closed.
Action: Ensure that the analyzer is connected to the computer on the com-munications port configured in the Setup program. Stop the TriStar3000 software and then restart it. If this error persists, contact yourservice representative.
2461- No instruments are in operation. This application will unconditionally termi-nate.
Cause: At least one instrument must be active for the application to oper-ate. The initialization of all of the instruments configured with theSetup program has failed. The application stops.
Action A: Usually this message is preceded by another message giving the rea-son for the instrument’s failure to initialize. See the instructions forthat message.
Action B: Ensure that the instrument is attached to the computer on the com-munications port configured with the Setup program. Verify that theinstrument has the power switch in the ON position and that thelight on the front panel is illuminated. If the application continuesto fail in its attempts to initialize the instrument, contact your serv-ice representative.
TriStar 3000 Appendix B
Jan 05 B-5

2462- Non-Fatal timer error on Unit n - S/N: nnnn.
Cause: The software has detected a non-fatal error in the timer.
Action: One of the instrument’s internal components has failed. Contactyour service representative.
2463- Non-Fatal DMA error on Unit n - S/N: nnnn.
Cause: The software has detected a non-fatal error in the analyzer’s DirectMemory Access component.
Action: One of the instrument’s internal components has failed. Contactyour service representative.
2464- Non-Fatal memory bank 3 error on Unit n - S/N: nnnn.
Cause: The software has detected a non-fatal error in the analyzer’s mem-ory bank 3.
Action: One of the instrument’s internal components has failed. Contactyour service representative.
2465- Non-Fatal memory bank 4 error on Unit n - S/N: nnnn.
Cause: The software has detected a non-fatal error in the analyzer’s mem-ory bank 4.
Action: One of the instrument’s internal components has failed. Contactyour service representative.
2466- Unit n - S/N: nnnn has no interface card and cannot be initialized.
Cause: The software has detected that the analyzer’s electronic componentscannot support the software.
Action: Contact your Mircromeritics Service Representative.
Appendix B TriStar
B-6 Jan 05
2467- Not enough memory error on Unit n - S/N: nnnn
Cause: The software has detected insufficient memory in the instrument forthe software to execute properly.
Action: One of the instrument’s internal components has failed. Contactyour service representative.
2468- The instrument contains a different software version. Do you want to reset it?
Cause: The application has discovered that a different version of softwareis already running on the instrument.
Action: If there is no chance that some instrument other than the TriStar3000 is connected to the instrument, select Yes to reset the instru-ment and download the proper software. Otherwise, select No toleave the instrument unchanged.
2469- The instrument software did not initialize properly on Unit n - S/N: nnnn.
Cause: The software in the instrument failed to execute properly.
Action: Reinstall the TriStar 3000 software, then restart it. If the problempersists, contact your service representative.
2470- Unable to read instrument software file for Unit n - S/N: nnnn.
Cause: The application tried to read the instrument software file to down-load it to the instrument. It was unable to do so.
Action: Reinstall the TriStar 3000 software, then restart it.
2471- Unit n - S/N: nnnn has an invalid communications port specified. It cannot be initialized.
2472- Unit n - S/N: nnnn communications port specified in the program control files is not a valid device. Unit cannot initialize.2473- Unit n - S/N: nnnn communications port specified in the program
control files is not physically installed in the Control Module. Unit cannot initialize.
Cause: The communications port associated with this unit was not valid.
Action: Run the Setup program, specifying a valid port for this unit, whenyou are prompted to do so.
TriStar 3000 Appendix B
Jan 05 B-7
2474- Unit n - S/N: nnnn communications port specified in the program control files is already in use. Unit cannot initialize.
Cause A: The communications port associated with this instrument is in useby some other program in the system.
Action A: Close the other program to release the port. Restart the TriStar 3000software.
Cause B: The component associated with this unit is also being used by theSmartPrep.
Action B: Run the Setup program and specify different communication portsfor each TriStar and the SmartPrep.
2475- Unit n - S/N: nnnn communications port specified in the program control files cannot be accessed. Unit cannot initialize.
2476- Unit n - S/N: nnnn startup failed. Could not initialize the communications port.
Cause: The communications port associated with this unit was not valid.
Action: Run the Setup program, specifying a valid port for this unit, whenyou are prompted to do so.
2477- Unit n - S/N: nnnn did not properly initialize.
Cause: The software was unable to initialize this instrument; this is usuallycaused by one of the conditions listed in the error messages above.
Action: Correct the problem as described above, then restart the application.
2480- File <name> cannot be analyzed. It is currently being edited.
Cause: You are trying to start an analysis using a file that is open for edit-ing.
Action: Finish editing the file, save and close it, then start the analysis.
2481- Error accessing the sample information file <name>.
Cause: An unexplained error prevents you from accessing this file.
Action: The hard disk drive may be corrupt. Run diagnositics.
Appendix B TriStar
B-8 Jan 05
2484- The edit session for <name> must be saved before the analysis. Save changes and continue with the analysis? (yes, no)
Cause: You are trying to start an analysis using a file that contains unsavedchanges and is open for editing.
Action: Select to save the changes and proceed with the analysis; se-lect to cancel the analysis and continue editing the Sample In-formation file.
2486- Could not construct (name) report type. Program will terminate.
Cause A: You may not have full rights to the application’s folders and files.
Action A: Contact your system administrator to have full rights granted.
Cause B: An internal processing and/or hardware error has occurred.
Action B: Contact your service representative if you continue to receive this er-ror message.
2487- Could not start report generator. Error code (number). Program will terminate.
Cause: An internal processing and/or hardware error has occurred.
Action: Contact your service representative if you continue to receive this er-ror message.
2488- File (file name) cannot be opened for editing. It is already in use.
Cause: The file you specified is being used in another edit operation.
Action: Check the Windows list to locate the other edit session.
2489- File (file name) cannot be opened for writing. It is already in use.
Cause: The file you specified in a Save As operation is already open foredit.
Action: Select a different file for the Save As operation.
Yes
No
TriStar 3000 Appendix B
Jan 05 B-9
2490- No ’.INI’ file present. Application will terminate.
Cause: The ASCII file containing initialization information and system op-tions information used during program startup does not exist.
Action: Run the TriStar 3000 Setup program, select Change analyzersetup, and create the control file used by the TriStar 3000.
2492- This field’s entry is invalid.
Cause: The highlighted field contains an invalid entry.
Action: Check the entry and correct the error.
2493- An entry is required for this field.
Cause: This field requires a valid entry for you to proceed.
Action: Enter or select an appropriate value.
2494- Value is out of the valid range.
Cause: The value you entered in the highlighted field is outside the validrange of values.
Action: Check the entry and enter or select an appropriate value.
2495- Value is out of the valid range. Enter a value between (value) and (value).
Cause: The value you entered in the highlighted field is outside the validrange of values.
Action: Check the entry and enter or select a value within the indicatedrange.
2496- Invalid number.
Cause: The number you entered in the highlighted field is invalid.
Action: Check the entry and enter or select a valid number.
Appendix B TriStar
B-10 Jan 05

2497- This field contains an invalid character.
Cause: You entered an invalid character in the highlighted field.
Action: Check the entry and enter valid characters.
2498- The requested change to the Sample’s status is invalid at this time.
Cause: A request to change the file’s status (for example, from automat-ically collected to manually entered) could not be done.
Action: Contact your service representative if you continue to receive this er-ror message. Record the name of the sample file in which the prob-lem occurred.
2499- Sequence number must contain at least 3 digits.
Cause: You tried to enter a sequence number that did not contain at leastthree digits.
Action: Enter a sequence number that contains at least three digits.
TriStar 3000 Appendix B
Jan 05 B-11
2500- All sample file names that can be created using the sequence number pat-tern already exist. You may want to modify the next sequence number.
Cause: No more sample information files can be created using the currentlyentered file name sequence number.
Action: Select Sample defaults from Options on the Main Menu and enteranother sequence number.
2501- System resources have reached a dangerously low level. Please closesome windows to avoid the loss of data.
Cause: A large number of windows are open and consuming the system re-sources available to all applications.
Action: Close one or more windows on the screen. Contact your service rep-resentative if you continue to receive this error message.
2505- Error Logger cannot be initialized! Error code (number). Program will exit.
Cause: An internal processing and/or hardware error has occurred.
Action: Contact your service representative.
2506- (sample file) Output device (name) is not installed. Printing cannot be ac-complished.
Cause: The selected output device is not installed in Windows.
Action: Select a different output device in the System Configuration dialogbox. Install the device using the Control Panel - Printers operation.
2508- (sample file) Overlay file (name) was not found. It will not be included inthe reports.
Cause: The specified overlay file could not be found.
Action: Ensure that the file specified as an overlay does exist.
Appendix B TriStar
B-12 Jan 05
2509- (sample file) Error opening file (name): (error). Reports cannot be produced.
Cause: An error occurred while the program was opening a file necessaryto the report operation.
Action: Use the name given in the error message to investigate. Contactyour service representative if you continue to receive this error mes-sage.
2510- (sample file) Error parsing reports from file (name). Reports cannot be pro-duced.
Cause A: One or more data entry fields in the sample file may contain an in-valid character (such as a single quote or double quotes).
Action A: Review the data entry fields (for example, the Sample field) and re-move the invalid character.
Cause B: The system was unable to create the usual temporary files duringthe report, possibly due to insufficient disk space.
Action B: Check the space available on the hard disk.
Cause C: An internal processing error occurred.
Action C: Contact your service representative.
2511- Print job (name) has been cancelled due to insufficient disk space. Deleteunnecessary files and restart the report.
Cause: The disk drive does not have enough space for the temporary file re-quired by the Windows Print Manager. Therefore, printing of the re-quested report has been canceled.
Action: Delete unnecessary files from the disk. You will require at least fivemegabytes of free space for normal operation.
2512- Print job (name) cancelled.
Cause: The requested print job was canceled at your request.
Action: None required.
TriStar 3000 Appendix B
Jan 05 B-13

4000- Memory Allocation Error.4001- Error Smoothing Data.
Cause: An internal processing and/or hardware error occurred during reportgeneration.
Action: Contact your service representative if you continue to receive this er-ror message.
4002- Thermal Transpiration correction had no effect.
Cause: The Thermal transpiration correction option was selected on theReport Options dialog box. However, the correction did not changeany pressure by more than one percent.
Action: Deselect this option to disable this message. This correction is onlymeaningful for very low pressures.
4003- Error Converting Pressures.4004- Error Computing Volume Adsorbed.
Cause: An internal processing and/or hardware error occurred during reportgeneration.
Action: Contact your service representative if you continue to receive this er-ror message.
4005- Pressures were not smoothed. Not enough pressures below 0.10 P/Po.
Cause: The Smooth pressures below 0.10 P/Po option was selected on theReport Options dialog box. There must be at least 10 pressureswithin this range for smoothing to occur.
Action: Deselect this option to disable this message.
4006- Report Type Not Found.4007- Error Processing Report.
Cause: An internal processing and/or hardware error occurred during reportgeneration.
Action: Contact your service representative if you continue to receive this er-ror message.
Appendix B TriStar
B-14 Jan 05

4008- Report requested on sample file with no data points.
Cause: You selected a file for reporting which contains no collected data.
Action: Select another file which contains collective data and restart the re-port.
4010- Summary Report was not included in the Selected Reports.
Cause: You did not select a plot or a table for any of the Selected Reportsin the Report Options dialog; you selected the reports only to gener-ate an entry in the summary. However, the Summary was not in-cluded in the Selected Reports.
Action: Select a plot or table in one or more of the Selected Reports, and/oradd the Summary to the Selected Reports.
4015- Error creating export file for sample <sample file name>.
Cause: A file error occurred during creation of an export output file.
Action: The output file name may be invalid. Ensure that the target direc-tory exists. Ensure that the target diskette is not full or write pro-tected. The target disk drive may be damaged or inoperative. Verifythat other files may be created on the same drive. Contact your serv-ice representative if you continue to receive this error message.
4016- Sample <sample file name> has no data for export to ISO/DFT.
Cause: The file selected for export has a status of No Analysis. No exportfile will be created.
Action: Select a file which contains analysis data.
4023- The file <name> cannot be prepared for analysis. It is open for editing andcontains errors.
Cause: You are trying to start an analysis using a file that contains errorsand is open for editing.
Action: Finish editing this file, save and close it, then start the analysis.
TriStar 3000 Appendix B
Jan 05 B-15

4400- The communications port specified for the SmartPrep(s) is not physicallyinstalled in the Control Module. Cannot initialize.
Cause: The communications port associated with this unit was not valid.
Action: Run the setup program and set up the unit on a valid port.
4401- The communications port specified for the SmartPrep(s) is already in use.Cannot initialize.
Cause: The communications port associated with this instrument is in useby some other program in the system.
Action: Close the other program to release the port. Restart the TriStar 3000application.
4402- The communications port specified for the SmartPrep(s) cannot be accessed. Cannot initialize.
4403- Cannot communicate with SmartPrep Unit %d - S/N: %s.
Cause: The communications port associated with this unit was not valid.
Action: Run the setup program and set up the unit on a valid port.
4404- The application version of the SmartPrep Unit n - S/N: nn is invalid.
Cause: The controller software running on the designated instrument is inva-lid.
Action: Use the SmartPrep setup program to download the proper controllersoftware to the instrument, or contact a service representative if un-available.
4405- Fatal communications error with SmartPrep Unit n - S/N: nn.
Cause: There was a fatal error in the serial communications between the ap-plication and the SmartPrep Instrument Controller. All displays forthat SmartPrep will be closed.
Action: Ensure that the SmartPrep is properly chained to the computer onthe communications port configured in the Setup program. Stopand re-start the application. If this error persists, contact your serv-ice representative.
Appendix B TriStar
B-16 Jan 05

6000- An error occurred while loading the application control information. Dataentry cannot be performed. (Code number)
Cause: An error occurred accessing the control information disk file re-quired by this application.
Action: The disk drive may have failed or be corrupt. Run diagnostics onthe disk drive.
6003- Unable to read the calibration file (number).
Cause: Your attempt to load a previously saved calibration file was unsuc-cessful.
Action: Make sure the file exists, and that you have entered the file namecorrectly, then try again.
6004- Unable to write the calibration file (number).
Cause: Your attempt to save the calibration to a separate file was unsuccess-ful.
Action: Make sure that the disk is neither full nor write-protected, then tryagain.
6005- The sample has an invalid status and cannot be used for this analysis.
Cause: You selected a sample file with a status other than No Analysis orPrepared.
Action: Select a sample file with a status of No Analysis or Prepared.
6006- Cannot do quasi-gemini freespace with sample selected on port 2.
Cause: You attempted to select a file requesting Quasi-Gemini free spacefor analysis, but have already selected a sample for port 2. In Quasi-Gemini free space, port 2 is used for the balance tube and cannothave a sample selected.
Action: Select a file that does not request Quasi-Gemini free space or clearthe sample file on port 2 and reselect the file.
TriStar 3000 Appendix B
Jan 05 B-17
6007- Cannot do Po measurement in sample tube with sample selected on port 3.
Cause: You attempted to select a file requesting Po in Port 3 measurement,but have already selected a sample for port 3.
Action: Select a file that does not request Po in port 3 measurement orclear the sample file on port 3 and reselect the file.
6008- At least one sample must be selected to proceed.
Cause: You attempted to start an analysis without selecting any sample files.
Action: Select at least one file, then start the analysis.
6009- You must select a sample tube on port 2 to do a Quasi-Gemini analysis.
Cause: You attempted to start an analysis requesting Quasi-Geminifreespace, but have not selected the sample tube file for the balancetube on port 2.
Action: Select a sample tube file for port 2 describing the balance tube used.
6010- This sample requires a different adsorptive and cannot be analyzed at thesame time as the other samples.
Cause: You selected a sample file for analysis that requires a different ad-sorptive gas than the sample file already selected.
Action: Select only sample files to be analyzed with the same adsorptiveand perform the analysis. Then perform the analysis with the otheradsorptive.
6011- The adsorptive required by this analysis is not available on this instrument.
Cause: You attempted to start an analysis with an adsorptive that is not con-nected to the instrument.
Action A: Make sure that the adsorptive is connected to the instrument, andthen select the unit configuration item of this unit’s menu to tell theapplication that the gas is connected.
Action B: Select only sample files for which the analysis gas is available.
Appendix B TriStar
B-18 Jan 05

6012- Cannot read the analysis conditions parameter file.6013- Cannot read the adsorptive properties parameter file.6014- Cannot read the report options parameter file.6015- Cannot read the sample tube properties parameter file.
Cause: The parameter set you selected on the QuickStart opening screencannot be read.
Action: Close ands restart QuickStart analysis and reselect the parametersfrom the available set.
6016- Dosing manifold from valve (number) failed.
Cause A: The maximum time was exceeded before the target pressure pointwas reached. The nitrogen regulator may be set too low or turnedoff.
Action A: Set the analysis gas regulator to 10 psig (0.7 bar), then resume theanalysis.
Cause B: The analysis gas bottle is empty.
Action B: Connect a new analysis gas bottle, then resume the analysis.
6017- Leak test failed on port (number).
Cause: With the sample port valve closed, the sample pressure increased by0.15 mmHg before the leak test duration was completed.
Action: Check sample tube fitting and ensure that it is securely attached tothe port, then restart the analysis.
TriStar 3000 Appendix B
Jan 05 B-19

6019- Elevator failed to reach upper/lower limit switch.
Cause A: The maximum time for the analysis was exceeded before the eleva-tor reached the UP position. Ice may be present in the bottom orthe neck of the dewar.
Action A: Check the dewar and remove ice if necessary. Then restart the analy-sis.
Cause B: The Psat tube is interfering with elevator movement.
Action B: Make sure the Psat tube is close to the sample tube and the dewarcover is over both the sample and Psat tubes. Then restart the analy-sis.
6020- Warning, servo valve performance is out of specification.
Cause: The servo valve tried to dose to a pressure but was unable to reachit within specification. The analysis will continue.
Action: At the next appropriate time, calibrate the servo valve to bring itback within specification (refer to Chapter 9).
6021- Servo calibration failed.
Cause A: The maximum time was exceeded before the target pressure pointwas reached. The nitrogen regulator may be set too low or turnedoff.
Action A: Set the analysis gas regulator to 10 psig (0.7 bar), then resume theanalysis.
Cause B: The analysis gas bottle is empty.
Action B: Connect a new analysis gas bottle, then resume the analysis.
6022- This file already selected for the analysis.
Cause: You tried to choose a file for this analysis which has been selectedfor another analysis.
Action: Choose a different file.
Appendix B TriStar
B-20 Jan 05
6023- The instrument (number) is not calibrated.
Cause: The TriStar application is in the process of initializing the instru-ment and has noticed that no calibration information is available forthat unit.
Action: Click . When the instrument has initialized, open the calibra-tion screen and calibrate the instrument.
6024- Evacuation failed.
Cause: While attempting to zero the pressure transducers, the instrumentwas unable to evacuate to a pressure of less than 1 mmHg. Thismay be due to a leak or a bad calibration.
Action A: Check the sample tube fitting and ensure that it is securely attachedto the port.
Action B: Calibrate the pressure offsset. If this calibration fails because thesystem cannot be evacuated, select Reset pressure calibration fromthe Calibration menu to restore the factory calibration settings. Thiswill overwrite the current calibration settings.
6026- Psat gas is not condensing.
Cause A: The working Dewar does not contain enough bath liquid.
Action A: Refill the Dewar and try the operation again.
Cause B: The Psat gas is contaminated.
Action B: Replace the Psat gas supply.
Cause C: The Psat tubing from the regulator to the instrument is contaminated.
Action C: Pump out the tubing.
OK
Jan 05 B-21
TriStar 3000 Appendix B

APPENDIX C
CALCULATIONS
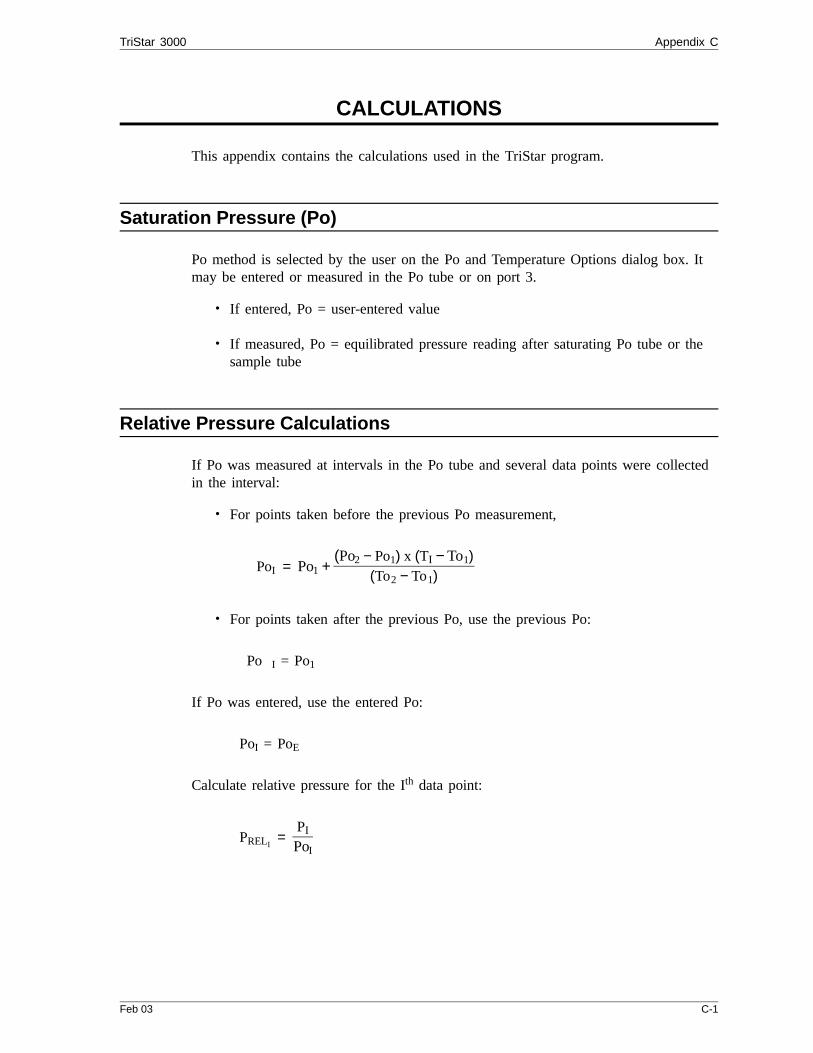
CALCULATIONS
This appendix contains the calculations used in the TriStar program.
Saturation Pressure (Po)
Po method is selected by the user on the Po and Temperature Options dialog box. Itmay be entered or measured in the Po tube or on port 3.
• If entered, Po = user-entered value
• If measured, Po = equilibrated pressure reading after saturating Po tube or thesample tube
Relative Pressure Calculations
If Po was measured at intervals in the Po tube and several data points were collectedin the interval:
• For points taken before the previous Po measurement,
PoI = Po1 + (Po2 − Po1) x (TI − To1)
(To2 − To1)
• For points taken after the previous Po, use the previous Po:
Po I = Po1
If Po was entered, use the entered Po:
PoI = PoE
Calculate relative pressure for the Ith data point:
PRELI =
PI
PoI
TriStar 3000 Appendix C
Feb 03 C-1

where:
PoI = saturation pressure for the Ith data point (mmHg)Po1 = most previous measured saturation pressure before Ith data
point (mmHg)Po2 = first measured saturation pressure after the Ith data point (mmHg)PoE = entered saturation pressure (mmHg)TI = time when the Ith data point was taken (minutes)To1 = time when Po1 was measured (minutes)To2 = time when Po2 was measured (minutes)PRELI
= relative pressure for the Ith data point (mmHg)PI = absolute pressure for the Ith data point, taken at equilibrium (mmHg)
Appendix C TriStar 3000
C-2 Feb 03

Volume Adsorbed Calculations
Free Space
The free space can be measured, calculated, entered, or obtained using the Quasi-Gemini method. The quantities used for the data reduction are the warm free space(VFW), the cold free space (VFC), and the analysis bath temperature.
Measured, Calculated, and Entered
For measured free space, the cold and warm free space volumes are calculated as fol-lows:
VFW = VMAN
T1 x
P1
P2 − 1
x TSTD
VFC = VMAN
T2 x
P1
P3 − 1
x TSTD
For calculated free space, the cold and warm free space volumes are calculated inthree steps.
First, the sample volume is determined:
VSAMP = WSAMP
DSAMP
Second, the warm and cold portions of the free space are determined:
• With a filler rod:
VFWP = (VPORT + VSTEMWARM) x TSTD
TMAN
VFCP = (VBELOW + VSTEMCOLD − VSAM) x TSTD
TANLS
TriStar 3000 Appendix C
Feb 03 C-3
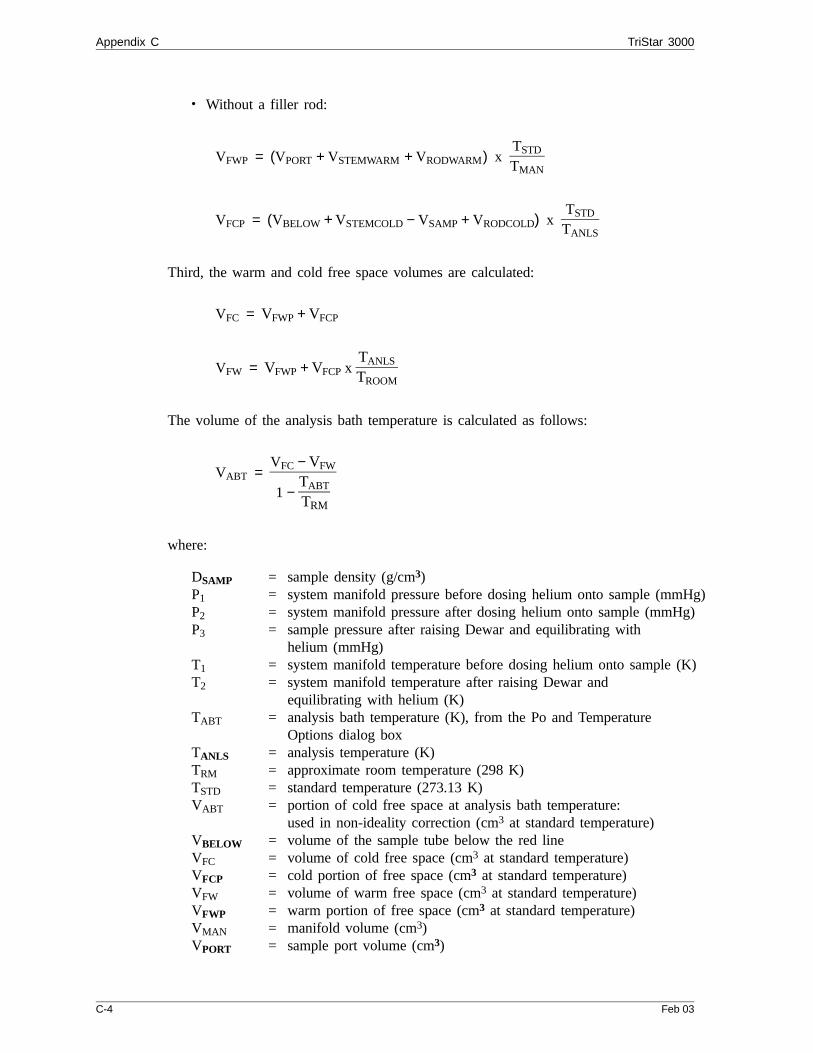
• Without a filler rod:
VFWP = (VPORT + VSTEMWARM + VRODWARM) x TSTD
TMAN
VFCP = (VBELOW + VSTEMCOLD − VSAMP + VRODCOLD) x TSTD
TANLS
Third, the warm and cold free space volumes are calculated:
VFC = VFWP + VFCP
VFW = VFWP + VFCP x TANLS
TROOM
The volume of the analysis bath temperature is calculated as follows:
VABT = VFC − VFW
1 − TABT
TRM
where:
DSAMP = sample density (g/cm3)P1 = system manifold pressure before dosing helium onto sample (mmHg)P2 = system manifold pressure after dosing helium onto sample (mmHg)P3 = sample pressure after raising Dewar and equilibrating with
helium (mmHg)T1 = system manifold temperature before dosing helium onto sample (K)T2 = system manifold temperature after raising Dewar and
equilibrating with helium (K)TABT = analysis bath temperature (K), from the Po and Temperature
Options dialog boxTANLS = analysis temperature (K)TRM = approximate room temperature (298 K)TSTD = standard temperature (273.13 K)VABT = portion of cold free space at analysis bath temperature:
used in non-ideality correction (cm3 at standard temperature)VBELOW = volume of the sample tube below the red lineVFC = volume of cold free space (cm3 at standard temperature)VFCP = cold portion of free space (cm3 at standard temperature)VFW = volume of warm free space (cm3 at standard temperature)VFWP = warm portion of free space (cm3 at standard temperature)VMAN = manifold volume (cm3)VPORT = sample port volume (cm3)
Appendix C TriStar 3000
C-4 Feb 03
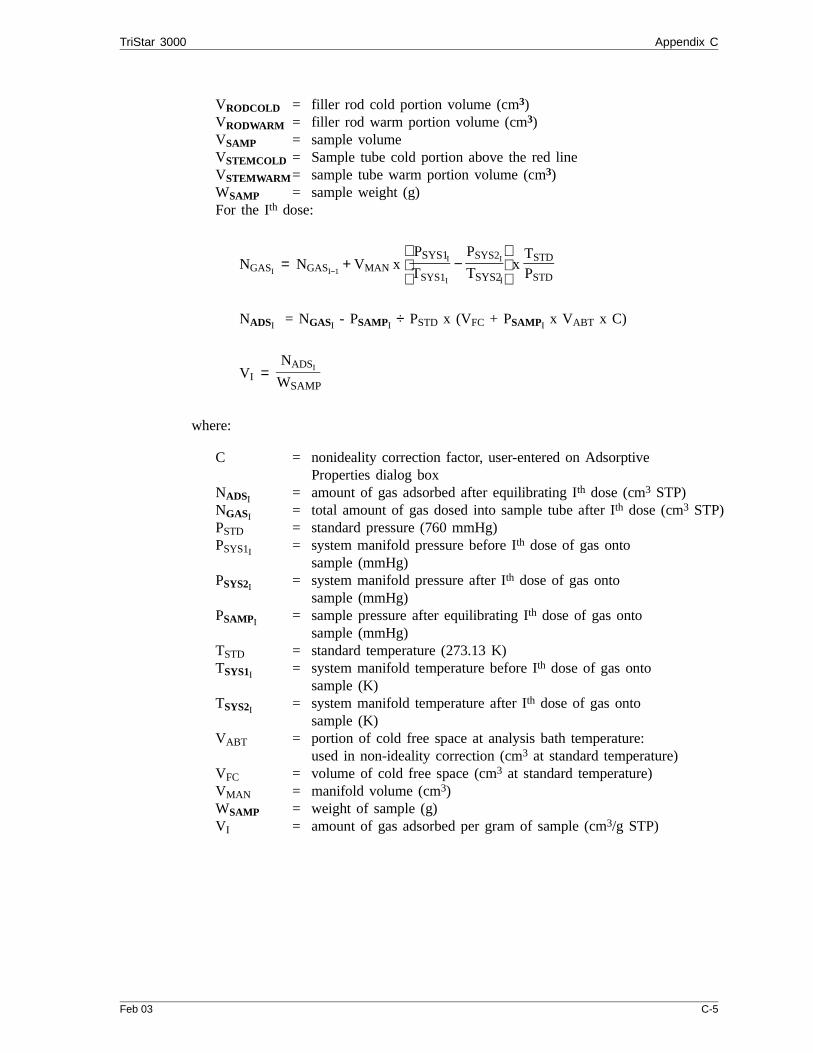
VRODCOLD = filler rod cold portion volume (cm3)VRODWARM = filler rod warm portion volume (cm3)VSAMP = sample volumeVSTEMCOLD = Sample tube cold portion above the red lineVSTEMWARM= sample tube warm portion volume (cm3)WSAMP = sample weight (g)For the Ith dose:
NGASI = NGASI−1
+ VMAN x
PSYS1I
TSYS1I
− PSYS2I
TSYS2I
x
TSTD
PSTD
NADSI = NGASI - PSAMPI ÷ PSTD x (VFC + PSAMPI x VABT x C)
VI = NADSI
WSAMP
where:
C = nonideality correction factor, user-entered on Adsorptive Properties dialog box
NADSI = amount of gas adsorbed after equilibrating Ith dose (cm3 STP)NGASI = total amount of gas dosed into sample tube after Ith dose (cm3 STP)PSTD = standard pressure (760 mmHg)PSYS1I = system manifold pressure before Ith dose of gas onto
sample (mmHg)PSYS2I = system manifold pressure after Ith dose of gas onto
sample (mmHg)PSAMPI = sample pressure after equilibrating Ith dose of gas onto
sample (mmHg)TSTD = standard temperature (273.13 K)TSYS1I = system manifold temperature before Ith dose of gas onto
sample (K)TSYS2I = system manifold temperature after Ith dose of gas onto
sample (K)VABT = portion of cold free space at analysis bath temperature:
used in non-ideality correction (cm3 at standard temperature)VFC = volume of cold free space (cm3 at standard temperature)VMAN = manifold volume (cm3)WSAMP = weight of sample (g) VI = amount of gas adsorbed per gram of sample (cm3/g STP)
TriStar 3000 Appendix C
Feb 03 C-5

Quasi Gemini
The quantity adsorbed, NADSi, is calculated as follows:
NADSI = NDOSEDI - ComputedColdSampleGas - BlankPressureCorrection x (NBLANKI - ComputedColdBlankGas)
where:
ComputedColdSampleGas =
PsamI
PSTD x VFCPSAMP
x
RSTD
TANLS
] x (1 + PSAMPI
x C)
BlankPressureCorrection = PSAMPI
x (1 + PSAMPI x C)
PBLANKI x (1 + PBLANKI
x C)
ComputedColdBlankGas =
PBLANKI
PSTD x VFCPBLANK
x TSTD
TANLS
x (1 + PBLANKI
x C)
NDOSEDI = total quantity dosed for the Ith pointNBLANKI = volume dosed into the blank tubePBLANK = pressure of the blank tubePSAMPI
= pressure at which the equilibrated sample point was takenPSTD = standard pressure (760 mmHg)TANLS = analysis temperature (K)TSTD = standard temperature (273.13 K)VFCPBLANK = cold portion of free space for blank tube (see calculation for
calculated free space)VFCPSAMP = Cold portion of free space for sample tube (see calculation for
calculated free space)VSAMP = sample volume
Appendix C TriStar 3000
C-6 Feb 03

Equilibration
Equilibration is reached when the pressure change per equilibration time interval (firstderivative) is less than 0.01% of the average pressure during the interval. Both thefirst derivative and average pressure are calculated using the Savitzky-Golay1 convolu-tion method for polynomial functions. The equations below are those used to com-pute weighted average and first derivative, respectively, for the 6th point of an11-point window.
PAVG = −36(P1 + P11) + 9(P2 + P10) + 44(P3 + P9) + 69(P4 + P8) + 84(P5 + P7) + 89(P6)
429
PCHG = 5(P1 − P11) + 4(P2 − P10) + 3(P3 − P9) + 2(P4 − P8) + (P5 − P7)
110
PPCPI = 100% PCHG
PAVG
where the numerical constants are from the Savitzky-Golay convolution arrays, and
PAVG = average pressure (mmHg)PCHG = change in pressure (mmHg)PPCPI = Percent change per intervalPI = Ith pressure reading taken at equilibrium intervals (mmHg)
If the value you enter for the maximum equilibration time is too small, thepoints are collected before equilibration is reached.
If PAVG is greater than 0.995 times the current Po, equilibration will not takeplace until the Minimum equilibration delay for P/Po > 0.995 has expired, in addi-tion to the standard equilibration criteria.
TriStar 3000 Appendix C
Feb 03 C-7

BET Surface Area Calculations2
For each point designated for surface area calculations, the BET transformation is cal-culated as follows:
BI = PrelI
(1.0 − PrelI) x NadsI
where BI is in units of g/cm3 STP.
A least-squares fit is performed on the (PrelI ,BI) designated pairs where PrelI is the in-dependent variable and BI is the dependent variable. The following are calculated:
a. Slope (S g/cm3 STP)
b. Y-intercept (YINT g/cm3 STP)
c. Error of the slope (SERR g/cm3 STP)
d. Error of the y-intercept (YIERR g/cm3 STP)
e. Correlation coefficient (Cc)
Using the results of the above calculations, the following can be calculated:
BET Surface Area (m2/g):
SABET = CSA x (6.023 x 10²³)
(22414 cm3 STP) x (1018 nm2⁄m2) x (S + YINT)
where
CSA = analysis gas molecular cross-sectional area (nm2), user-entered on the Adsorptive Properties dialog box
BET C value:
C = S + YINT
YINT
Volume of the Monolayer (cm3/g STP):
VM = 1
C x YINT =
1S + YINT
Appendix C TriStar 3000
C-8 Feb 03
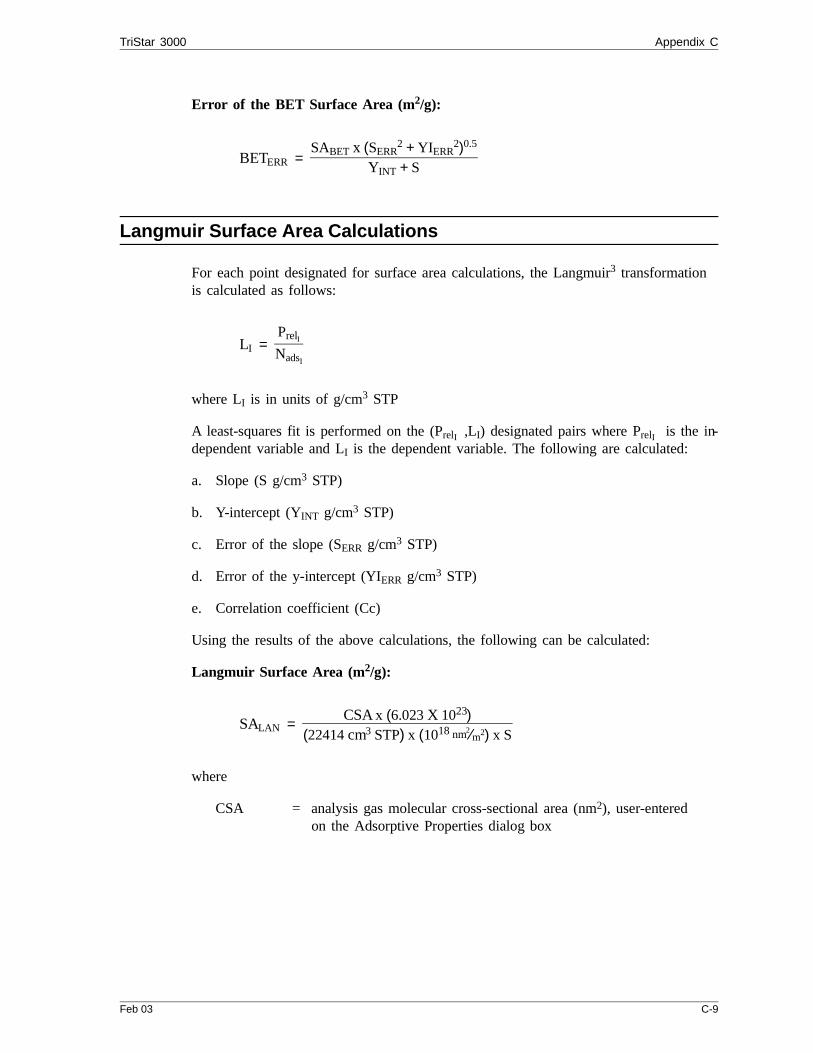
Error of the BET Surface Area (m2/g):
BETERR = SABET x (SERR
2 + YIERR2)0.5
YINT + S
Langmuir Surface Area Calculations
For each point designated for surface area calculations, the Langmuir3 transformationis calculated as follows:
LI = PrelI
NadsI
where LI is in units of g/cm3 STP
A least-squares fit is performed on the (PrelI ,LI) designated pairs where PrelI is the in-dependent variable and LI is the dependent variable. The following are calculated:
a. Slope (S g/cm3 STP)
b. Y-intercept (YINT g/cm3 STP)
c. Error of the slope (SERR g/cm3 STP)
d. Error of the y-intercept (YIERR g/cm3 STP)
e. Correlation coefficient (Cc)
Using the results of the above calculations, the following can be calculated:
Langmuir Surface Area (m2/g):
SALAN = CSA x (6.023 X 10²³)
(22414 cm3 STP) x (1018 nm2⁄m2) x S
where
CSA = analysis gas molecular cross-sectional area (nm2), user-entered on the Adsorptive Properties dialog box
TriStar 3000 Appendix C
Feb 03 C-9
Volume of the Monolayer (cm3/g STP):
VM = 1S
Langmuir b Value:
b = (YINT) (VM)
Error of the Langmuir Surface Area (m2/g):
LANERR = SALAN x SERR
S
Appendix C TriStar 3000
C-10 Feb 03

t-Plot Calculations4
For each point designated for t-Plot calculations, the following calculations are done:
Thickness for the Ith point (Å):
tI = HP1 x
HP2ln(PrelI)
HP3
(Halsey5 )
or
tI =
HJP1HJP2 − log(PrelI)
HJP3(Harkins and Jura6)
or
tI = STSA1(PrelI)2 + STSA2(PrelI) + STSA3
where:
tI = thickness for Ith point HP1 = Halsey parameter #1HP2 = Halsey parameter #2HP3 = Halsey parameter #3HJP1 = Harkins and Jura parameter #1HJP2 = Harkins and Jura parameter #2HJP3 = Harkins and Jura parameter #3PrelI = relative pressure for the Ith point (mmHg)STSA1 = statistical thickness surface area parameter #1STSA2 = statistical thickness surface area parameter #2STSA3 = statistical thickness surface area parameter #3
A least-squares analysis fit is performed on the (tI, NadsI) data pairs where tI is the in-
dependent variable and NadsI is the dependent variable. Only the values of tI betweentMIN and tMAX, the minimum and maximum thickness, are used. The following are cal-culated:
a. Slope (S cm3/g-Å STP)
b. Y-intercept (YINT cm3/g STP)
c. Error of the slope (SERR cm3/g-Å STP)
TriStar 3000 Appendix C
Feb 03 C-11

d. Error of the Y-intercept (YIERR cm3/g STP)
e. Correlation coefficient (Cc)
Using the results of the above calculations, the following can be calculated:
External Surface Area (m2/g):
SAEXT = (S cm3 ⁄ g−Å STP) x (1010 Å ⁄ m) x (D cm3 liquid ⁄ cm3 STP)
F x (106 cm3 ⁄ m3 )
where
F = surface area correction factor, user-entered on the t-Polot Report Options dialog box
D = density conversion factor, user-entered on the Adsorptive Properties dialog box
Micropore Surface Area (m2/g):
SAµP = SATOT − SAEXT
where SATOT is the BET surface area if the user enabled the BET report exclusively,or Langmuir surface area if the user enabled the Langmuir report exclusively. If nei-ther report has been selected, SATOT is the BET surface area value calculated using aset of default parameters.
Micropore Volume (cm3 liquid/g):
VµP = (YINT cm3 ⁄ g STP) x (D cm3 liquid ⁄ cm3 STP)
Appendix C TriStar 3000
C-12 Feb 03

BJH Pore Volume and Area Distribution Calculations
For adsorption data, the relative pressure and volume adsorbed data point pairs col-lected during an analysis must be arranged in reverse order from which the pointswere collected during analysis. All calculations are performed based on a desorptionmodel, regardless of whether adsorption or desorption data are being used.
The data used in these calculations must be in order of strictly decreasing numericalvalue. Points which do not meet this criterion are omitted. The remaining data set iscomposed of relative pressure (Pr), volume adsorbed (Va) pairs from (Pr1, Va1) to(PrN, VaN) where (PrN = 0, VaN = 0) is assumed as a final point. Each data pair repre-sents an interval boundary (or desorption step boundary) for intervals i=1 to i=N-1where N = total number of (Pr, Va) pairs.
Generally, the desorption branch of an isotherm is used to relate the amount of adsor-bate lost in a desorption step to the average size of pores emptied in the step. A poreloses its condensed liquid adsorbate, known as the core of the pore, at a particularrelative pressure related to the core radius by the Kelvin7 equation. After the core hasevaporated, a layer of adsorbate remains on the wall of the pore. The thickness ofthis layer is calculated for a particular relative pressure from the thickness equation.This layer becomes thinner with successive decreases in pressure, so that the meas-ured quantity of gas desorbed in a step is composed of a quantity equivalent to theliquid cores evaporated in that step plus the quantity desorbed from the pore walls ofpores whose cores have been evaporated in that and previous steps. Barrett, Joyner,and Halenda8 developed the method (known as the BJH method) which incorporatesthese ideas. The algorithm used on the TriStar 3000 is an implementation of the BJHmethod.
Explanation of Terms
A pore filled with condensed liquid nitrogen has three zones:
a. The core - evaporates all at once when the critical pressure for that radius isreached; the relationship between the core radius and the critical pressure isdefined by the Kelvin equation.
b. The adsorbed layer - composed of adsorbed gas that is stripped off a bit ata time with each pressure step; the relationship between the thickness of thelayer and the relative pressure is defined by the thickness equation.
TriStar 3000 Appendix C
Feb 03 C-13
c. The walls of the cylindrical pore - the diameter of the empty pore is re-quired to determine the pore volume and pore area. End area is neglected.
Calculations
The volumes adsorbed (Va) are converted to the liquid equivalent volumes (V1,cm3/g):
VlI = (Va I)(D)
where D is the Density Conversion Factor from the Adsorptive Properties dialog box.
The relative pressure (Pr1) is assumed to be close to unity so that substantially all thepores in the sample are filled.
The corresponding Kelvin core radius is calculated. Only pores smaller than this sizewill be included:
Rc1 = −A
(1 + F)[ln(Pr1)]
where
A = adsorbate property factor (the BJH Adsorptive Options dialog box)F = fraction of pores open at both ends (from the BJH Adsorption
Report Options dialog box or the BJH Desorption Report Options dialog box); assumed to be zero for desorption
This radius will be adjusted for the thickness of the adsorbed layer during subsequentcalculation steps.
adsorbed
layer
pore
core wall
Insignificantcompared tocore length
Appendix C TriStar 3000
C-14 Feb 03
The thickness of the remaining adsorbed layer at this relative pressure is calculated:
Tw1 = HP1
HP2ln(Pr1)
HP3
where
HP1, HP2, and HP3 are Halsey Parameters 1, 2, and 3 (respectively) from the HalseyThickness Equation dialog box.
These calculations illustrate the use of the Halsey thickness equation. If the Harkins-Jura equation was selected, substitute the following wherever the thickness equationappears:
Tw1 =
HJ1HJ2 − log(Pr1)
HJ3
where
HJ1, HJ2, and HJ3 are Harkins-Jura Parameters 1, 2, and 3 (respectively) from theHarkins-Jura Thickness Equation dialog box.
The following calculations (a-c) are made for each relative pressure interval based onthe increment of volume desorbed during that interval. The variable I refers to the in-terval number, that is I=1 for the first interval from Pr1 to Pr2, and so on. J refers toeach previous interval during which new pores were found. K refers to the total num-ber of intervals in which new pores have been found. K is also the number of linesreported on the BJH table for collected data.
a. The thickness of the adsorbed layer at the end of the interval is calculated asfollows:
Tw1+1 = HP1
HP2ln(Pr1+1)
HP3
(For the last pressure interval from the lowest PrI to zero relative pressure,TwI+1 = 0.)
For the first pressure interval, there are no previously opened pores so thevolume desorbed from walls of previously opened pores is zero (Vd1 = 0),and the remainder of Step a is skipped.
The change in thickness of the wall layer due to desorption from preivouslyopened pores is calculated:
∆Tw = TwI − TwI+1
TriStar 3000 Appendix C
Feb 03 C-15
The annular cross-sectional area of the wall layer desorbed is calculated forall previously opened pores:
CSAJ = π [(Rcj + ∆Tw)2 − Rcj 2] (10−16 cm2 ⁄ A2)
The total volume of gas desorbed from walls of previously opened pores iscalculated:
VdI = ∑(LpJ)(CSAaJ) for all previously opened pores
where LPJ = length of previously opened pores as calculated in Step b(2).
b. The physical processes occurring for this pressure interval are determined asfollows:
(1) If VdI is greater than the current increment of volume desorbed (VlI - VlI+1 ), desorption from walls only is occurring. Total surface ofwalls exposed thus far (cm2/g) is calculated as follows:
SAw = ∑ π (LpJ)(DavgJ)(10−8 cm ⁄ A) for all previously opened pores
where
DavgJ = weighted average pore diameter calculated below in
Step b(2).
A new layer thickness (∆Tw) that will not overcompensate for the ac-tual volume desorbed in this interval is calculated:
∆Tw = (VlI − VlI+1)(108 A ⁄ cm)
SAwI
Since no cores are evaporated in this pressure interval, no new poresare revealed. Thus no ending Kelvin radius and average pore diameterare calculated for this interval. Note that this means the report mayhave fewer tabulated intervals on the collected data report than experi-mental pressure intervals.
(2) If VdI is less than the volume increment desorbed during this interval(VlI − VlI+1) the remaining volume is due to new pores with core evapo-ration taking place in this interval. K, the number of intervals with newpores exposed, is increased by 1. (For the interval from the lowest PrI
to zero relative pressure, no new pore volume is calculated and the restof Step b is skipped.)
Appendix C TriStar 3000
C-16 Feb 03

The volume desorbed from newly opened pores in this interval is calcu-lated as follows:
VcI = (VlI − VlI+1) − VdI
The Kelvin radius for the end of the interval is calculated as follows:
RcK+1 = −A
(1 + F)[ln(PrI+1)]
All new pores opened in this interval are represented by one pore hav-ing a length-weighted average pore diameter and a corresponding lengthsufficient to account for the required volume of adsorbate. The weightedaverage pore diameter is calculated as follows:
DavgK =
(2) (RcK + RcK+1) (RcK) (RcK+1)RcK 2 + RcK+1 2
DavgK is the diameter of a pore which would have a surface area that is
the average of the areas for pores with radius RcK and RcK+1, if itslength was the mean of the lengths at those radii.
The relative pressure corresponding to DavgK is calculated as follows:
PavgK = ln−1
−2A(1 + F)(DavgK
)
The thickness of the adsorbed layer at this pressure is calculated as fol-lows:
TwavgK = HP1
HP2ln(PavgK
)
HP3
TriStar 3000 Appendix C
Feb 03 C-17

The decrease in thickness of the wall layer by desorption from the wallsof new pores during the lower portion of the pressure interval is calcu-lated as follows:
∆Td = TwavgK − TwI+1
The cross-sectional area of the newly opened pores is calculated as fol-lows:
CSAcK =
DavgK
2 + ∆Td
2
(10−16 cm2 ⁄ A2)
The length of the newly opened pores is calculated as follows:
LpK = VcI
CSAcK
c. Pore diameters and radii are adjusted for the change in thickness of the ad-sorbed wall layer during this interval. If new pores were opened during thisinterval, the average diameter is adjusted by the change in layer thicknessduring the second portion of the desorption interval as follows:
DavgKnew = DavgKold
+ 2(∆Td)
The layer thickness change during the whole interval is added to diametersof previously opened pores as follows:
DavgJnew = DavgJold
+ 2(∆Tw)
(not including DavgK)
The layer thickness change desorbed during this interval also is added to theradii corresponding to the ends of the pressure intervals as follows:
RcJnew = RcJold
+ ∆Tw
for all except RcK+1.
Steps a to c are repeated for each pressure interval.
Appendix C TriStar 3000
C-18 Feb 03

After the above calculations have been performed, the diameters correspond-ing to the ends of the intervals are calculated as follows:
DpJ = 2(RcJ)
for all RcJ including RcK+1.
The remaining calculations are based on Dp(I), Davg(I), and Lp(I). These calcu-
lations are only done for Davg(I) values that fall between the Minimum BJH
diameter and the Maximum BJH diameter specified by the operator on theBJH Adsorption Report Options dialog box or the BJH Desorption ReportOptions dialog box.
1) Incremental Pore Volume (VpI,cm3 ⁄ g):
VpI = π (LpI)
DavgI
2
2
1016 cm2 ⁄ A2
2) Cumulative Pore Volume (VpCUM(I), cm3 ⁄ g):
VpCUM(I) = ∑ VpJ for J ≤ I
3) Incremental Surface Area (SAI, m2 ⁄ g):
SAI = π (LpI)(10−2 m ⁄ cm)(DavgI)(10−10 m ⁄ A)
4) Cumulative Surface Area (SACUM(I), m2 ⁄ g):
SACUM(I) = ∑ SAJ for J ≤ I
5) dV/dD pore volume (dV ⁄ dDI, cm3 ⁄ g−A):
dV ⁄ dDI = VPI
DpI − DpI+1
6) dV/dlog(D) pore volume (dV ⁄ dlog(D)I, cm3 ⁄ g):
dV ⁄ dlog(D)I = VpI ⁄ log(DpI
⁄ DpI+1)
TriStar 3000 Appendix C
Feb 03 C-19
7) dA/dD pore area (dA ⁄ dDI, m2 ⁄ g−A):
dA ⁄ dDI = SAI
DpI − DpI+1
8) dA/dlog(D) pore area [dA ⁄ dlog(D)I, m2 ⁄ g]:
dA ⁄ dlog(D)I = SAI ⁄ log(DPI
⁄ DpI+1)
For fixed pore size tables (if selected), the following calculations are performed:
1) Average Fixed Pore Size (DFavgJ, A):
DFavgJ =
DpFJ + DpFJ+1
2
calculated for all intervals in the fixed pore size table.
For the intervals with DFavgI between the Minimum BJH diameter and the
Maximum BJH diameter.
2) Cumulative Pore volume (VpFCUMI, cm3 ⁄ g):
VpFCUMI = INTERP(DpFI+1)
where INTERP(x) is the value interpolated from the function X = DpJ+1 andY = VpCUMJ
, using an AKIMA semi-spline interpolation.
3) Incremental Pore Volume (VpFI, cm3 ⁄ g):
VpFI = VpFCUMI − VpFCUMI−1
where VpFCUM0 = 0.
4) Cumulative Surface Area (SAFCUMI, m2 ⁄ g):
SAFCUMI = INTERP(DpFI+1)
where INTERP(x) is the value interpolated from the function X = DpJ+1 andY = SACUMJ
.
Appendix C TriStar 3000
C-20 Feb 03

5) Incremental Surface Area (SAFI, m2 ⁄ g):
SAFI = SAFCUMI − SAFCUMI−1
where SAFCUM0 = 0.
6) dV/dD pore volume (dV ⁄ dDpFI, cm3 ⁄ g−A):
dV ⁄ dDpFI = INTERP(DpFI+1)
where INTERP(x) is the value interpolated from the function X = DavgJ and
Y = dV ⁄ dDJ.
7) dV/dlog(D) pore volume [dV ⁄ dlog(DpF)I, cm3 ⁄ g]:
dV ⁄ dlog(DpFI = INTERP(DpFI+1)
where INTERP(x) is the value interpolated from the function X = DavgJ and
Y = dV ⁄ dlog(D)J.
8) dA/dD pore area (dA ⁄ dDpFI, m2 ⁄ g−A):
dA ⁄ dDpFI = INTERP(DpFI+1).
where INTERP(x) is the value interpolated from the function X = DavgJ and
Y = dA ⁄ dDJ.
9) dA/dlog(D) pore area [dA ⁄ dlog(DpFI ), m2 ⁄ g]:
dA ⁄ dlog(DpFI = INTERP(DpFI+1)
where INTERP(x) is the value interpolated from the function X = DavgJ and
Y = dA ⁄ dlog(D)J.
TriStar 3000 Appendix C
Feb 03 C-21

Compendium of Variables
Va = quantity adsorbed expressed as a volume (cm3/g STP)Vl = liquid equivalent volume of volume adsorbed (cm3/g)D = density conversion factor from the Adsorptive Properties dialog box
(cm3/cm3 STP)Pr = relative pressureDp = pore (or core) diameter (A)Rc = Kelvin radius (A) of coreA = adsorbate property factor; from the BJH Adsorptive Options dialog boxF = fraction of pores open at both ends; from the BJH Adsorption Report
Options dialog box or the BJH Desorption Report Options dialog box∆Tw = thickness of adsorbed layer desorbed during interval (A)Tw = thickness of remaining adsorbed wall (A)
HP1, HP2, and HP3 are Halsey parameters from the Halsey Thickness Equation dia-log box.
HJ1, HJ2, and HJ3 are Harkins and Jura parameters from the Harkins-Jura ThicknessEquation dialog box.
STSA1, STSA2, and STSA3 are STSA parameters from the STSA Thickness Equa-tion dialog box.
Vd = volume of gas desorbed from walls of previously opened pores (cm3/g)Davg = average pore diameter (A)CSAa = annular cross-sectional area of the desorbed layer (cm2)CSAc = cross-sectional area of opening of newly opened pores (cm2)SAw = total surface area of walls exposed (cm2/g)∆Td = thickness of layer desorbed from walls of newly opened pores (A)Vc = volume desorbed from cores of newly opened pores (cm3/g)Lp = length of pore (cm/g)
Appendix C TriStar 3000
C-22 Feb 03

Dubinin-Radushkevich Calculations9
The Dubinin-Radushkevich equation is as follows:
log (V) = log (Vo ) − B x T2
β x log
PoP
2
where:
V = volume adsorbed at equilibrium pressure (cm3/g STP)Vo = the micropore capacity (cm3/g STP)Po = saturation vapor pressure of gas at temperature T (mmHg) P = equilibrium pressure (mmHg)B = a constantβ = the affinity coefficient of analysis gas relative to Po gas
(for this application β is taken to be 1)T = analysis bath temperature (K), from the Po and Temperature
Options dialog box
For each point designated for Dubinin-Radushkevich calculations, the following calcu-lations are done:
LV = log (V)
LP = log PoP
2
The intercept, log(Vo) can be found by performing a least-squares fit on the (LP,LV)designated pairs where LP is the independent variable and LV is the dependent vari-able. Assuming the adsorption of gas is restricted to a monolayer, Vo is the mono-layer capacity. Based on this assumption, the following are calculated:
a. Slope (S cm3/g STP)
b. Y-intercept (YI cm3/g STP)
c. Error of the slope (SERR cm3/g STP)
d. Error of the y-intercept (YIERR cm3/g STP)
e. Correlation coefficient (Cc)
TriStar 3000 Appendix C
Feb 03 C-23
Using the results of the above calculations, the following can be calculated:
Monolayer Capacity (cm3/g STP):
Vo = 10YI
Error of Monolayer Capacity (cm3/g STP):
VoERR = Vo x (10YIERR - 1.0)
Micropore surface area (m2/g):
SDP = σ x Vo x (6.023 x 10²³)
22414 cm3 x (1018 nm2 ⁄ m2)
where:
σ = molecular cross sectional area of gas (nm2) from the Adsorptive Properties dialog box
Appendix C TriStar 3000
C-24 Feb 03

Dubinin-Astakhov Calculations
The Dubinin-Astakhov equation is a follows:
log (V) = log (Vo) − (R x T)
βEo
N
x log
PoP
N
where:
V = volume adsorbed at equilibrium pressure (cm3/g STP)Vo = the micropore capacity (cm3/g STP)Po = saturation vapor pressure of gas at temperature T (mmHg) P = equilibrium pressure (mmHg)T = analysis bath temperature (K) R = the gas constant (0.0083144 KJ/K-mole)E0 = characteristic energy (KJ/mole)N = Astakhov exponent, may be optimized or user entered
from the Dubinin Report Options dialog boxβ = the affinity coefficient of the analysis gas relative to the Po gas,
from the Dubinin Adsorptive Options dialog box
For each point designated for Dubinin-Astakhov calculations, the following calcula-tions are done:
LV = log(V)
LP = log
PoP
N
A least-squares fit is performed on the (LP,LV) designated pairs where LP is the inde-pendent variable and LV is the dependent variable. If the user selected yes for the Op-timize Astakhov Exponent prompt, a systematic search for the optimum value of N isconducted by recalculating the linear regression and selecting the value of N thatgives the smallest standard error of the y-intercept. The exponent N is optimized towithin 10-4. If the optimum value for N is not found in this range, an exponent of 2is used. The following are calculated:
a. Slope (S cm3/g STP)
b. Y-intercept (YI cm3/g STP)
c. Error of the slope (SERR cm3/g STP)
d. Error of the y-intercept (YIERR cm3/g STP)
e. Correlation coefficient (Cc)
TriStar 3000 Appendix C
Feb 03 C-25
f. Optimized Astakhov exponent (N)
Using the results of the above calculations, the following can be calculated:
Monolayer Capacity (cm3/g STP):
Vo = 10YI
Micropore Volume (cm3/g):
WI = (VI x D)
where
D = density conversion factor (cm3 liquid/cm3 STP) from the Adsorptive Properties dialog box
Limiting Micropore Volume (cm3/g):
Wo = (Vo x D)
where
D = density conversion factor (cm3 liquid/cm3 STP) from the Adsorptive Properties dialog box
Error of Limiting Micropore Volume (cm3/g):
WoERR = Wo x (10YIERR - 1.0)
Characteristic Energy (KJ/mole):
E = 2.303 x R x T(2.303 x S)1⁄N
Appendix C TriStar 3000
C-26 Feb 03
Modal Equivalent Pore Diameter (Å):
DMODE = 2 x
3N3N + 1
1⁄N
x
103 nm3 ⁄ Å3
β ⋅ Eo
1⁄3
where
β = affinity coefficient of the analysis gas relative to the Po gas from the Dubinin Adsorptive Options dialog box
Maximum Differential Pore Volume (cm3/g-Å):
This value is also known as frequency of the mode12
dVdDmode
Max = 0.5 x (3N + 1) x Wo x 3N + 1
3N
1⁄3N
x
β ⋅ E0
(103 nm3 ⁄ Å3 )
1⁄3
x e−
3N + 1
3N
Mean Equivalent Pore Diameter (Å)
DMEAN = 2 x
103 nm3 ⁄ Å3
β ⋅ Eo
1 ⁄ 3
Γ 3N + 1
3N
Micropore surface area (m2/g):
SDA = 10000 x 2.0 x Wo x
β ⋅ E103 nm3 ⁄ Å3
1⁄3
x Γ 3N + 1
3N
Γ is calculated by a polynomial approximation11 over the domain 0 ≤ x ≤ 1 as fol-lows:
Γ(x+1) = 1+b1x + b2x2 + b3x3 + b4x4 + b5x5 + b6x6 + b7x7 + b8x8 + ε(x)
| ε(x) | ≤ 3 x 10⁻⁷
TriStar 3000 Appendix C
Feb 03 C-27

b1 = -0.57719 1652b2 = 0.98820 5891b3 = -0.89705 6937b4 = 0.91820 6857b5 = -0.75670 4078b6 = 0.48219 9394b7 = -0.19352 7818b8 = 0.03586 8343
and where
x + 1 = 3N +1
3N
Equivalent Pore diameter (Å):
DI = 2 x
−
103 nm3 ⁄ Å3
β ⋅ E0
N
ln(WI) − ln(Wo)
1⁄3N
dV/dD Pore Volume (cm3/g-Å):
dVdDI
= 0.5 x
Wo x 3N x
103 nm3 ⁄ Å3
β ⋅ E0
N
x DI
2
−(3N+1)
x e
−
103 nm3 ⁄ Å3
β ⋅ E0 x
DI
2
−3N
Appendix C TriStar 3000
C-28 Feb 03
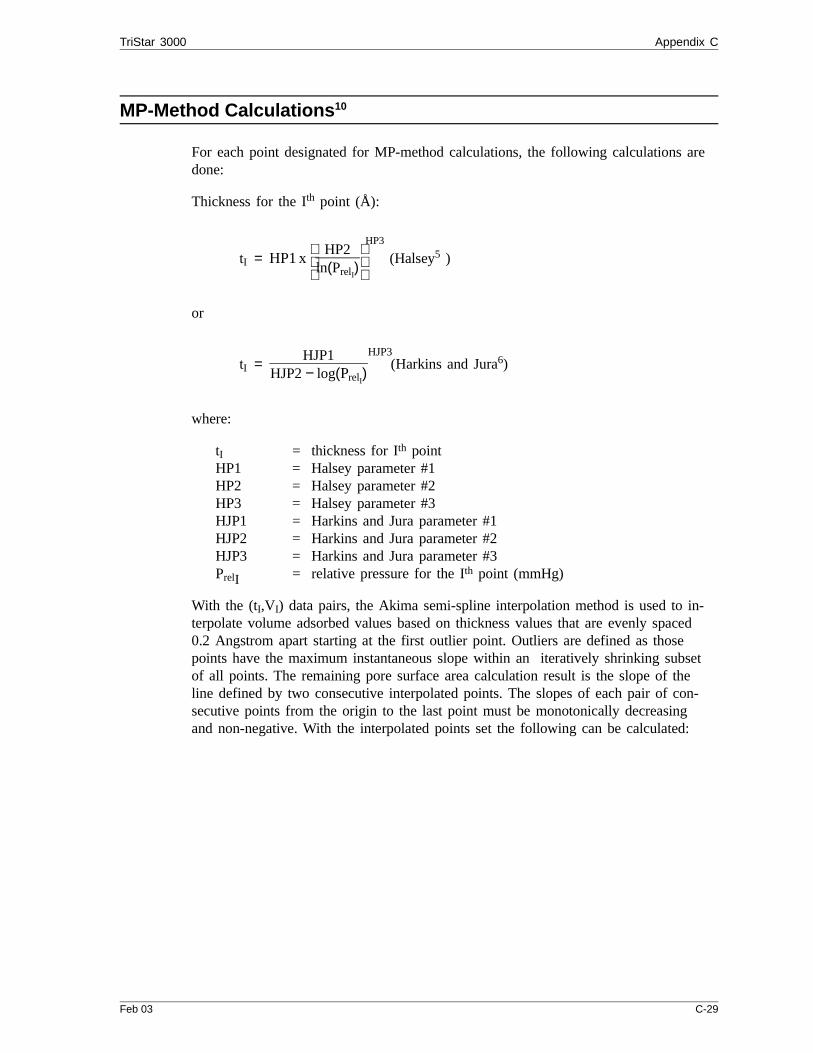
MP-Method Calculations10
For each point designated for MP-method calculations, the following calculations aredone:
Thickness for the Ith point (Å):
tI = HP1 x
HP2ln(PrelI)
HP3
(Halsey5 )
or
tI = HJP1
HJP2 − log(PrelI)HJP3
(Harkins and Jura6)
where:
tI = thickness for Ith point HP1 = Halsey parameter #1HP2 = Halsey parameter #2HP3 = Halsey parameter #3HJP1 = Harkins and Jura parameter #1HJP2 = Harkins and Jura parameter #2HJP3 = Harkins and Jura parameter #3PrelI = relative pressure for the Ith point (mmHg)
With the (tI,VI) data pairs, the Akima semi-spline interpolation method is used to in-terpolate volume adsorbed values based on thickness values that are evenly spaced0.2 Angstrom apart starting at the first outlier point. Outliers are defined as thosepoints have the maximum instantaneous slope within an iteratively shrinking subsetof all points. The remaining pore surface area calculation result is the slope of theline defined by two consecutive interpolated points. The slopes of each pair of con-secutive points from the origin to the last point must be monotonically decreasingand non-negative. With the interpolated points set the following can be calculated:
TriStar 3000 Appendix C
Feb 03 C-29
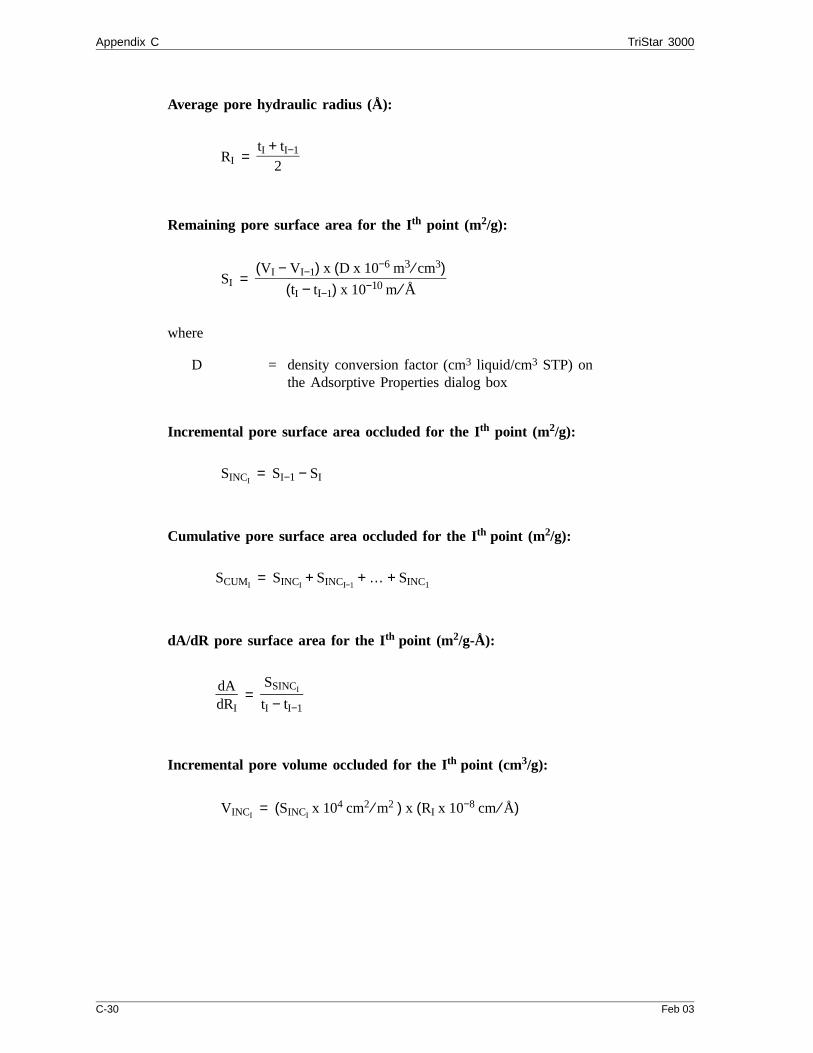
Average pore hydraulic radius (Å):
RI = tI + tI−1
2
Remaining pore surface area for the Ith point (m2/g):
SI = (VI − VI−1) x (D x 10−6 m3 ⁄ cm3)
(tI − tI−1) x 10−10 m ⁄ Å
where
D = density conversion factor (cm3 liquid/cm3 STP) on the Adsorptive Properties dialog box
Incremental pore surface area occluded for the Ith point (m2/g):
SINCI = SI−1 − SI
Cumulative pore surface area occluded for the Ith point (m2/g):
SCUMI = SINCI
+ SINCI−1 + … + SINC1
dA/dR pore surface area for the Ith point (m2/g-Å):
dAdRI
= SSINCI
tI − tI−1
Incremental pore volume occluded for the Ith point (cm3/g):
VINCI = (SINCI
x 104 cm2 ⁄ m2 ) x (RI x 10−8 cm ⁄ Å)
Appendix C TriStar 3000
C-30 Feb 03

Cumulative pore volume occluded for the Ith point (cm3/g):
VCUMI = VINCI
+ VINCI−1 + … + VINC1
dV/dR pore volume for the Ith point (cm3/g-Å):
dVdRI
= VINCI
tI − tI−1
TriStar 3000 Appendix C
Feb 03 C-31
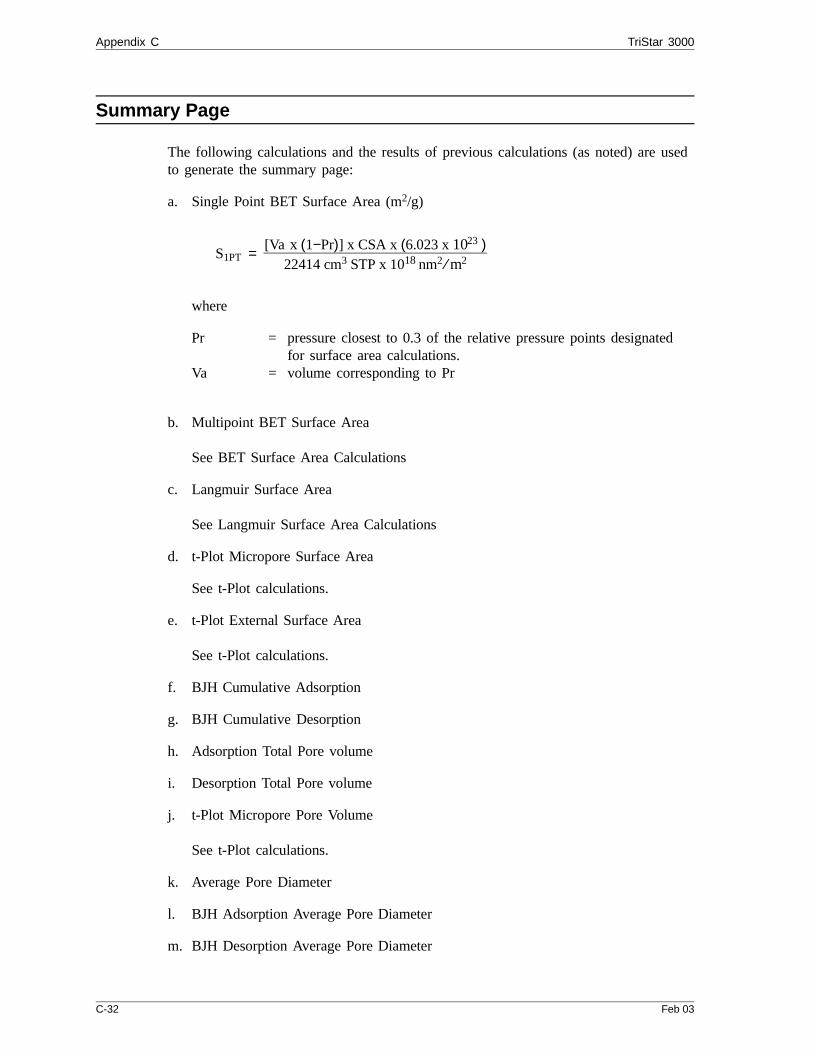
Summary Page
The following calculations and the results of previous calculations (as noted) are usedto generate the summary page:
a. Single Point BET Surface Area (m2/g)
S1PT = [Va x (1−Pr)] x CSA x (6.023 x 10²³ )
22414 cm3 STP x 1018 nm2 ⁄ m2
where
Pr = pressure closest to 0.3 of the relative pressure points designated for surface area calculations.
Va = volume corresponding to Pr
b. Multipoint BET Surface Area
See BET Surface Area Calculations
c. Langmuir Surface Area
See Langmuir Surface Area Calculations
d. t-Plot Micropore Surface Area
See t-Plot calculations.
e. t-Plot External Surface Area
See t-Plot calculations.
f. BJH Cumulative Adsorption
g. BJH Cumulative Desorption
h. Adsorption Total Pore volume
i. Desorption Total Pore volume
j. t-Plot Micropore Pore Volume
See t-Plot calculations.
k. Average Pore Diameter
l. BJH Adsorption Average Pore Diameter
m. BJH Desorption Average Pore Diameter
Appendix C TriStar 3000
C-32 Feb 03
References
1. Savitzky, A. and Golay, M.J.E., Anal. Chem. 36, 1627 (1964).
2. Brunauer, S.; Emmett, P.H.; and Teller, E., J. Am. Chem. Soc. 60, 309 (1938).
3. Langmuir, I., J. Am. Chem. Soc. 38, 2267 (1916); J. Am. Chem. Soc. 40,1361 (1918); Phys. Rev 8, 149 (1916).
4. deBoer, J.H., et al, J. Catalysis 3, 32, 38, 44, 268 (1964); J. Catalysis 4,319, 643, 649 (1965); Cranston, R. and Inkley, F., Adv. Catalysis 9, 143(1957).
5. Halsey, G., J. Chem. Phys. 16, 931-937 (1948).
6. Harkins, W.D. and Jura, G., J. Chem. Phys. 11, 431 (1943).
7. Kelvin, J. (published under the name of Sir William Thomson), Phil. Mag.42, 448-452 (1871).
8. Barrett, E.P.; Joyner, L.S.; and Halenda, P.P., J. Am. Chem. Soc. 73, 373-380(1951).
9. Dubinin, M., Carbon 21, 359 (1983); Dubinin, M., Progress in Surface andMembrane Science 9, 1, Academic Press, New York (1975); Dubinin, M. andAstakhov, V., Adv. Chem. Ser. 102, 69 (1971); Lamond, T. and Marsh, H.,Carbon 1, 281, 293 (1964); Medek, J., Fuel 56, 131 (1977); Polanyi, M.,Trans. Faraday Soc. 28, 316 (1932); Radushkevich, L., Zh. fiz. Kemi. 33,2202 (1949); Stoeckli, H., et al, Carbon 27, 125 (1989).
10. Mikhail, R., Brunauer, S. and Bodor, E., J. Colloid and Interface Sci. 24, 45(1968).
TriStar 3000 Appendix C
Feb 03 C-33

APPENDIX D
FREE-SPACE CORRECTION

FREE-SPACE CORRECTION
Free space is that volume of the sample tube which is unoccupied by the sample.The quantity of gas dosed into the sample tube is calculated from the differencein pressures in the manifold before and after the dose is delivered. The quantityof gas adsorbed by the sample is calculated by subtracting the quantity of gas re-maining in the free space of the sample tube after equilibrium is established fromthe quantity of gas originally dosed into the sample tube. Free space must be de-termined accurately to obtain a precise value for quantity adsorbed.
Static-volumetric systems such as the TriStar 3000 consist basically of a gas mani-fold joined to a sample tube by an isolation valve. The manifold section has con-nections for an absolute pressure transducer, a temperature gauge, and a vacuumsystem. It also has inlets for the adsorptive gas and helium. A Dewar flask contain-ing a cryogenic liquid (usually LN2 at approximately 77 K) is situated so that itcan be raised to immerse most of the sample tube. Two temperature zones existwithin the sample tube when immersed in the cryogenic bath: a warm zone (thevolume above the liquid level and near ambient temperature) and a cold zone (thevolume below the liquid level at cryogenic temperature). Not only must the totalfree-space volume be determined, but it also is necessary to determine the quan-tity of gas residing within the “cold” zone since a nonideality correction must beapplied to only that quantity of gas.
The total quantity of gas in the partly immersed sample holder cannot simply bedetermined using n = PV/RT because temperature is not constant over the totalvolume, but instead is distributed as two temperature zones with a steep tempera-ture gradient between them. A convenient method for resolving this problem is toderive two factors which, for the existing temperature profile, can be multipliedby the prevailing pressure to reveal the molar volume of gas contained in the coldzone and the total quantity residing in the free volume of the immersed sampleholder (the cold free space).
The TriStar 3000 system provides four methods for free-space determination:
• Measure• Quasi-Gemini• Calculate• Enter
TriStar 3000 Appendix D
Feb 03 D-1

Measure
Generally, this method, although requiring a little more time (approximately 10minutes) is the most preferred one for determining free space. It is simple, auto-matic, requires very little information, and essentially is error-proof. With thismethod, the instrument first evacuates the manifold and sample tube (containingsample), then isolates the sample tube by closing the valve. Then the manifold ischarged with helium, the pressure measured, and the valve opened allowing thehelium to expand into the sample tube at ambient temperature. Again the pressureis measured.
The dewar is raised and the sample tube is cooled to cryogenic temperature.Again pressure drops; when pressure has equilibrated, the value is recorded. Warmand cold free spaces are calculated from (1) system volume, (2) system, ambient,and bath temperatures, and (3) measured pressures. From these, the value of theportion of cold free space at cryogenic temperature which requires correction fornonideality can be determined.
This method may be undesirable if:
• Helium is unavailable; free-space determination by the TriStar 3000 requiresthe use of helium
• Analysis speed is a major factor; a helium free-space measurement of 10 to15 minutes is required
• Your sample tends to absorb and retain helium for a prolonged period of timeor if it adsorbs helium
Appendix D TriStar 3000
D-2 Feb 03

Quasi-Gemini
This method requires the dedicated use of port 2, allowing concurrent free-spacecorrection. With this method, an empty sample tube (called the “balance” tube) isinstalled on port 2 to run concurrently with one or two analyses on the otherport(s). You must enter the following information accurately for best results:
• Sample tube stem nominal diameter (found on the Sample Tube dialog)• Indicate whether a filler rod is being used (found on the Sample Tube dialog)• Analysis bath temperature (found on the Po and Temperature dialog)• Sample tube volume below the index mark for the sample and balance tubes
(refer to Calibrating the Sample Tube in Chapter 4)• Sample weight and density (found on the Sample Information dialog)
A separate pressure table is not required for the balance tube. Its pressure table isa composite of the pressure table(s) for the analysis. Therefore, each data pointcollected for the analysis has a corresponding pressure point on the balance tuberecord from which a computed pressure/volume point may be interpolated to ex-actly the pressure obtained by the analysis.
Calculate
This method is the most rapid and efficient way of compensating for free space.You must enter the following information accurately:
• Sample tube stem diameter (found on the Sample Tube dialog)• Indicate whether a filler rod is being used (found on the Sample Tube dialog)• Sample tube volume below the index (red) mark• Analysis bath temperature (found on the Po and Temperature dialog)• Sample’s weight and density (found on the Sample Information dialog)
The volume of the portion of the sample tube below the index mark is measuredby filling the sample tube to the index mark, weighing, and calculating the vol-ume using the weight and density of the fluid. This value is used in calculatingthe free space and should be engraved onto the sample tube for future use. Referto Calibrating the Sample Tube in Chapter 4.
TriStar 3000 Appendix D
Feb 03 D-3
Enter
This method allows you to enter predetermined values for the warm and cold freespaces. The values to enter may be obtained in one of two ways:
• A pre-analysis free-space calibration of the sample tube containing sample
• The total free space of an empty sample tube is measured and the displace-ment of the sample calculated from its mass and density and subtracted fromthe total free space
In either procedure, ensure that the level (or, in cases where the Isothermal Jacketis used, the effective level) of the cryogen bath on the sample tube is the samewhen the analysis is performed as it was when gathering data for free-space calcu-lations.
Appendix D TriStar 3000
D-4 Feb 03

APPENDIX E
MAINTAINING HIGH PURITY GASES
Maintaining High Purity Gases
The TriStar 3000 was designed to measure accurately the surface area of all typesof materials. It is important that the gases (nitrogen or helium) used for thesemeasurements be of highest purity, especially when analyzing low surface areasamples. Three ways to ensure high purity gases are to always maintain:
• thoroughly purged gas pressure regulators• non-permeable gas lines• leak-free connections
Impure gas is strongly indicated, for example, if a series of measurements on alow surface area material yields decreasing specific surface areas with decreasingquantities of sample. The TriStar uses very small amounts of helium; thereforeany residual air in the regulator can distort results of subsequent analyses forquite some time.
Micromeritics offers the following suggestions to assist you in maintaining highpurity gases (particularly helium) for the TriStar.
• Use metal gas lines only• Remove trapped air from the regulator and gas lines• Purge the regulator and instrument lines after periods of non-use (this step
is unnecessary if you are using V2.00 or higher)
Using Metal Gas Lines
You should always use metal gas lines which have been carefully cleaned of anyoils and greases used in the manufacturing process. Do not use plastic or rubbergas lines. When these types of permeable, nonmetallic gas lines are used with he-lium, contaminants accumulate at a much faster rate. This causes errors in analy-sis results and can also contaminate a clean sample.
Removing Trapped Air
When connecting the regulator to the gas bottle, air is unavoidably trapped on thehigh- and low-pressure sides of the regulator, as well as in the gas lines. Youshould remove as much of this air as is possible before opening the gas bottlevalve. If this air is allowed to remain in the regulator, it will mix with the heliumand cause inaccurate results in subsequent analyses. Or if the valve is open forany length of time, the air trapped on the high pressure side may diffuse backinto the gas bottle and contaminate its entire contents.
TriStar 3000 Appendix E
Feb 03 E-1

There are two methods for removing trapped air from the regulator lines: thePurge Method and the Evacuation Method.
Purge Method
This is the preferred method for removing trapped air.
1. From the Unit menu, select Enable manual control (if the instrument sche-matic is not displayed, select Show instrument schematic).
If you have multiple TriStars installed, make sure you choose the correct Unitmenu.
2. Close all valves.
3. Open the regulator Shut-off valve.
4. Open the gas bottle valve briefly and allow the regulator to be charged withgas until the high pressure gauge reads just over half the tank pressure; thenquickly close the valve.
E-2 Aug 01
E-2 Feb 03

5. Using the Pressure Control knob, set the output pressure (gas bottle pressuregauge) to 15 psig.
6. Loosen the fitting at the helium inlet (on the rear panel of the TriStar) untilthe low pressure side drops to approximatley 3 psig (0.02 MPa), then tightenthe fitting.
7. Repeat steps 4, 5, and 6 three times.
8. Briefly open the gas bottle valve; then, using the Pressure Control knob, resetthe regulator output pressure to 15 psig.
9. After the pressure has stabilized (indicating there are no leaks), open the gasbottle valve.
Gas Bottle ValveOutlet Pressure Gauge(Low Pressure Side)
Gas Bottle Pressure Gauge(High Pressure Side)
Pressure Control Knob
To Analyzer
Shut-Off Valve
TriStar 3000 Appendix E
Feb 03 E-3

Evacuation Method
To use this method, your gas tank must be within 10 feet of the instrument.
1. Do one of the following:
If... Then...
The regulator has notbeen filled with gasand the gas line isattached to theinstrument:
Close the gas bottle valve.
Open the regulator Shut-off valve.
The regulator is filledwith gas:
Close the gas bottle valve.
Open the regulator Shut-off valve.
Loosen the helium inlet fitting (or nut) on therear panel of the instrument.
Allow all of the gas in the regulator to expelfrom the line (pressure reading will be zero).
Retighten the helium inlet fitting (or nut).
2. From the Unit menu, select Enable manual control (if the instrument sche-matic is not displayed, select Show instrument schematic).
If you have multiple TriStars installed, make sure you choose the correct Unitmenu.
3. Close all valves; then open valves 6, 7, and 10.
Open valves 6,7, and 10.
E-4 Aug 01
E-4 Feb 03

4. Allow evacuation to continue for 20 minutes. This pulls a vacuum on the he-lium line to the gas bottle. The manifold pressure transducer should fall closeto zero.
Be sure to allow evacuation for a full 20 minutes. If evacuation time is too short,trapped air may remain in the lines.
5. Close valves 6, 7, and 10.
TriStar 3000 Appendix E
Feb 03 E-5

Purging the System After Non-use
These steps are unnecessary if your analysis program is V2.00 or higher. V2.00(or higher) provides automatic purges before analysis if your system is idle formore than 24 hours.
You should always purge the regulator after periods of non-use. Even though theregulator and lines have been carefully cleaned, vapors sometimes permeate the O-rings and seals in the TriStar system. These permeated vapors gradually increasethe level of contaminants in the helium line and regulator when the instrument isidle for more than hours. Use the following guidelines:
• Always purge the regulator and lines when the TriStar has been idle for72 hours (3 days).
• Purge the regulator and lines when the TriStar has been idle for morethan 24 hours if your sample has a total surface area of less than a few
meters squared and you plan to measure the free space.
Using an open sample port, purge the regulator and lines as follows:
1. Remove the sample tube or plug from port 2 (in this example).
2. From the Unit menu, select Enable manual control (if the instrument sche-matic is not displayed, select Show instrument schematic).
If you have multiple TriStars installed, make sure you choose the correct Unitmenu.
3. Open Valves 2, 6, and 7, allowing the helium to flow through the system topurge the lines.
1. Open valve 2.
3. Open valve 7.
2. Open valve 6.
E-6 Aug 01
E-6 Feb 03

4. After approximately 1 to 2 minutes, close valve 7.
5. Open the nitrogen valve (8 or 9); allow the nitrogen to flow through the sys-tem for one minute. This allows the helium to be flushed from the system.
It is important that you flush the helium from the manifold after purging. If he-lium is allowed to remain in the manifold for a sufficient amount of time,transducer offset problems may be encountered.
6. Close the nitrogen valve.
TriStar 3000 Appendix E
Feb 03 E-7

INDEX

INDEX
$ symbol, 8-9
AAbsolute pressure tolerance, 5-20Add log entry, 8-13Add Log Entry push button, 5-6, 5-9Adding an analyzer, 2-16Adsorbate property factor, 5-48Adsorptive properties file, 5-27
defining, 4-9printing contents, 5-71
Adsorptive push buttonBJH report, 5-47Dubinin report, 5-54
Advanced format, 5-4, 5-8, 8-3sample defaults, 8-11sample information file, 4-14, 8-4
Alpha-S reportexample of, 7-23options, 5-42
Analysesperforming, 4-26, 6-3QuickStart method, 4-27, 6-7
Analysis conditions file, 5-15defining, 4-8printing contents, 5-71
Analysis dewarSee Dewar
Analysis Log reportexample of, 7-16
Analysis Preparation dialog, 5-22Analysis program
exiting, 5-77installing, 2-10installing upgrade, 2-15uninstalling, 2-23using, 3-2
Analyzeradding another, 2-16changing setup, 2-21cleaning, 9-1configurations, 6-17installing, 2-3moving to a different computer, 2-17removing, 2-20schematic, 6-11turning on/off, 3-1
Astakhov report, 5-53calculations, C-25
Autoscale, 5-33, 5-52, 5-61, 5-62Axis
coordinates, viewing, 7-14properties, editing, 7-13
Axis Properties dialog, 7-13
BBasic format, 5-4, 5-5, 8-3
sample file defaults, 8-8sample information file, 4-12, 8-5
Bath temperature, 6-9calculations, C-4
BET surface area reportcalculations, C-8, C-9example of, 7-18options, 5-34
BJH Adsorption/Desorption reportcalculations, C-13examples of, 7-25options, 5-46
BJH Adsorptive Property Factor dialog, 5-47Broekhoff-de Boer thickness curve, 5-39Browse push button, 3-6, 6-4, 6-9
CCalibration
information, 6-17manifold temperature, 6-18, 9-5Pressure scale, 6-19, 9-4sample tube, 4-19servo valve, 6-20, 9-5system volume, 6-21, 9-7zero pressure, 9-3
Calibration fileloading, 6-23reinstalling, 2-22saving, 6-23
Cancel push button, 6-6Carbon Black STSA thickness curve, 5-38Catalysts, 5-19Cautions, 1-2Check box, 3-5Close All command, 5-70Close command, 5-70
Feb 03 Index-3
Close Reports command, 7-5Cold free space, 5-24
calculations, C-4Collected data, 5-65Columns, editing on onscreen reports, 7-10Comments window, 8-13Computer
connecting analyzer, 2-3connecting peripheral equipment, 2-6
Cross hair, axis, 7-14Curve Properties dialog, 7-12
DData
collected, 5-65entered, 5-65
Data Presentation command, 8-7Date format, changing, 3-7Dates push button, 3-7Default Basic Sample Information dialog box, 8-8Degas conditions file, 5-13
defining, 4-7printing contents, 5-71
Degassing unit, 1-3, 10-1Density conversion factor, 5-27Dewar
installing, 4-24precautions, 4-24
DFT Plus command, 7-5Dialog boxes, using, 3-4Dose increment, 5-21, 5-22Dose Increments dialog, 5-21Dubinin Adsorptive Options dialog box, 5-54Dubinin report
calculations, C-23options, 5-53types available, 5-53
Dubinin Report Options dialog box, 5-55Dubinin Tabular Report Column Options dialog,
5-55Dubinin-Radushkevich
calculations, C-24
EElevator options, 6-12Enable Manual Control command, 6-11Entered data, 5-65Equation
Broekhoff-de Boer, 5-39Halsey, 5-59
Harkins-Jura, 5-58STSA Carbon Black, 5-38
Equation push button, 5-37, 5-47, 5-58Equilibration
calculations, C-7push button, 5-26
Error messages, B-1Evacuation options, 5-22Exit command, 5-77Exiting the analysis program, 5-77Export command, 5-75Exporting sample files, 4-32, 5-75
Ff-Ratio report
example of, 7-24options, 5-44
Fileprinting contents, 4-29printing to, 7-4selecting, 3-6status, 3-7
File menuClose All command, 5-70Close command, 5-70description, 5-1Exit command, 5-77Export command, 5-75List command, 5-73Open command, 5-3Print command, 5-71Save All command, 5-70Save command, 5-68
File namedefault extensions, 3-8, 5-3included as part of ID, 8-9sequence, 8-8
Filler rod, 5-12Fixed dose, 5-19Forms, 1-1Free Space, D-1
calculated method, 5-24, D-3calculations, C-3cold, 5-24dialog, 5-23entered method, 5-24, D-4measured method, D-2Quasi-Gemini method, 5-24, D-3warm, 5-24
Function keysSee Shortcut keys
Index TriStar 3000
Index-4 Feb 03

GGas supply
connecting regulators, 2-7specifying, 2-25
Gasesmaintaining high purity, E-1selecting, 6-17
Graphcopying as metafile, 7-13editing onscreen, 7-11grid lines, 8-7legend, editing, 7-13
Graph overlay, 4-33for multiple graphs, 4-33for multiple samples, 4-35
Graph Overlay Samples dialog, 5-30Graphic, appearing in report title, 5-30Grid lines, 8-7
HHalsey equation, 5-59Halsey thickness curve, 5-38Halsey Thickness Equation dialog box, 5-59Harkins and Jura thickness curve, 5-38Harkins/Jura equation, 5-58Help menu, 3-11Help, online, 1-5
IIncrement, maximum volume, 5-19Insert Pressure Range dialog, 5-17Installation
analysis program, 2-10sample tube, 4-23
Instrument log, 6-2, 6-15Instrument Schematic dialog box, 6-11Instrument schematic, showing, 6-13Isotherm
collecting, 5-16data, exporting, 5-75report options, 5-32
Isotherm collectiondose increments, 5-21target pressures, 5-16
Isotherm reportexample of, 7-17options, 5-32
Isothermal jacket, 5-12
LLangmuir surface area report
calculations, C-9example of, 7-20options, 5-34
Leak test, 5-23Legend Properties dialog, 7-13List command, 5-73List, generating, 4-30, 5-73Log entry, 5-6Log Report settings, 6-16Low surface area sample, analyzing, E-1
MMaintenance, system, 9-1Manifold temperature, 6-18Manual
conventions, 1-2organization, 1-1
Manual control, 6-11accessing shortcut menu, 6-11enabling, 6-11
Maximum BJH diameter (or radius), 5-47Maximum volume increment, 5-19Menu bar, 3-9Menu structure, 3-9Mesoporous materials, 5-19Metafile, copying graphs as, 7-13Minimum BJH diameter (or radius), 5-47MP-Method Cumulative Pore Area Options dialog,
5-61MP-Method Cumulative Pore Volume Options
dialog, 5-61MP-Method dA/dR Pore Area Options dialog,
5-61MP-Method dV/dR Pore Volume Options dialog,
5-61MP-Method report, 5-58
calculation, C-29options, 5-58types available, 5-59
MP-Method Tabular Report Column Option dialog, 5-60
NNext push button, 6-6Non-ideality factor, 5-27Notes, 1-2
TriStar 3000 Index
Feb 03 Index-5

OO-ring, port
replacing, 9-2Open command, 5-3Operator, specifying, 8-12Option Presentation command, 8-3Options menu
Data Presentation command, 8-7description, 8-1Option presentation command, 8-3Parameter Files Directory command, 8-15Sample Defaults command, 8-8Service Test Mode command, 8-16System configuration command, 8-14
Options report, 5-64Outgas test, 5-24Overlay samples, 5-35, 5-41, 5-43, 5-44Overlays push button, 5-30
PParameter files, 5-4
defining, 4-5specifying location, 8-15
Parameter Files Directory command, 8-15Password, restricted format, 8-6Physical volume below mark, 5-12Po and T push button, 5-25Po and Temperature Options dialog box, C-4, C-23Po value, 6-4Ports
Gas connection, 3-10Preparation push button, 5-22Presentation options, 8-3Pressure
relative, calculations, C-2saturation, C-1table, 5-16target, 5-16tolerance, 5-20
Pressure offset, 6-19Pressure scale calibration, 6-19Pressures push button, 5-48Print command, 5-71Printer/plotter, specifying default, 8-14Printing to a File
description, 5-72Psat vs t push button, 5-28Push button, 3-5
Browse, 3-6Dates, 3-7Equilibration, 5-26
Free Space, 5-23Overlays, 5-30Po and T, 5-25Preparation, 5-22Psat vs t, 5-28Replace, 3-6Skip, 6-6Suspend, 6-6
QQuasi-Gemini
calculations, C-6free-space method, D-3
QuickStart command, 6-7QuickStart dialog box, 6-7
RRadio button, 3-5Radushkevich report, 5-53
calculations, C-23Ramp rate, 5-14Ranges, valid, 3-4Relative pressure
calculations, C-1See also Pressure
Relative pressure tolerance, 5-20Removing an analyzer, 2-20Replace All pushbutton, 5-7, 5-9Replace push button, 3-6, 5-11, 5-13, 5-15, 5-28,
5-30Report
Alpha-S method, 5-42Analysis Log, 7-16BET Surface Area, 5-34BJH Adsorption/Desorption, 5-46closing, 7-5displaying company logo in title, 5-30Dubinin, 5-53examples, 7-15f-Ratio method, 5-44generating, 7-2graphs, editing onscreen, 7-11header, 7-6Isotherm, 5-32, 7-17Langmuir surface area, 5-34legend, editing, 7-13onscreen, 7-6onscreen, shortcut menus for, 7-10Options, 5-64Sample log, 5-64
Index TriStar 3000
Index-6 Feb 03

saving in other formats, 7-9Summary, 5-63t-Plot, 5-37Tabular, 5-49Tabular, editing onscreen, 7-10Tool bar, 7-7types available, 5-31zoom feature, 7-14
Report options file, 5-29defining, 4-10printing contents, 5-71
Reportsheader, 7-6MP-Method, 5-58
Reports menuClose Reports command, 7-5description, 7-1DFT Plus command, 7-5Start Report command, 7-2
Restricted format, 8-3, 8-6sample information file, 4-12
Resume push button, 6-6Returning equipment, 2-1
SSample
degassing, 4-22entering density, 8-9low surface area, E-1
Sample Analysis command, 6-3Sample defaults
Advanced format, 4-3, 8-11Basic format, 4-1specifying, 8-8
Sample file namespecifying default sequence, 8-11
Sample information file, 3-6, 5-4Advanced format, 5-4, 5-8Basic format, 5-4, 5-5creating in Advanced format, 4-14creating in Basic format, 4-12exporting, 4-32, 5-75generating a list, 5-73printing contents, 5-71Restricted format, 5-4specifying defaults, 8-8
Sample Log report, 5-64example of, 7-32
Sample tubecalibrating, 4-19cleaning and labeling, 4-16file, 5-11
installing, 4-23Sample Tube file, 4-5Saturation pressure, C-1Save All command, 5-70Save As command, 5-68Save command, 5-68Schematic, 6-11Select Dates dialog, 3-7Selecting
files, 3-6Service Test mode, 8-16Servo valve
calibrating, 6-20settings, 6-12
Setup programadding an analyzer, 2-16changing an analyzer setup, 2-21moving an analyzer to a different computer, 2-17reinstalling analysis program, 2-15reinstalling calibration files, 2-22removing an analyzer from the computer, 2-20uninstalling the software, 2-23using for other functions, 2-13
Shortcut keys, 3-2for Select Dates dialog, 3-7list of, 3-3
Shortcut menu, 3-2for graphs, 7-11for instrument schematic, 6-11for tabular reports, 7-10
Show Instrument Log command, 6-15Show Instrument Schematic command, 6-13Show Status command, 6-14Skip push button, 6-6SmartPrep Degasser, 1-3Soak
temperature, 5-14time, 5-14
Softwareinstalling, 2-10installing upgrade, 2-15using, 3-2
Specifications, 1-6Spreadsheet format
exporting isotherm data, 5-75saving reports, 7-9
Start push button, 6-6Start Report command, 7-2Start Report dialog box, 7-2Status list, 7-3Status window, 6-14STSA thickness curve, 5-38Submitter, specifying, 8-12
TriStar 3000 Index
Feb 03 Index-7

Summary Reportcalculations, C-32example of, 7-31options, 5-63
Surface area correction factor, 5-41Suspend push button, 6-6System configuration command, 8-14System volume, calibrating, 6-21
Tt-Plot report
calculations, C-11example of, 7-21options, 5-37
Target pressure, 5-16Temperature
bath, 6-9manifold, 6-18soak, 5-14
Text, copy graph data as, 7-13Thickness curve, 5-37, 5-46, 5-58
Broekhoff-de Boer, 5-39Carbon Black STSA, 5-38Halsey, 5-38, 5-59Harkins and Jura, 5-38Harkins-Jura, 5-58User-defined, 5-39
Title Properties dialog, 7-13Tool bar, reports window, 7-7Transducer offset, 6-19TriStar
See also Analyzerdescription, 1-3specifications, 1-6unpacking/inspection, 2-1
UUnit configuration, 6-17Unit Menu
description, 6-1Enable Manual Control command, 6-11QuickStart command, 6-7Sample Analysis command, 6-3Show Instrument Log command, 6-15Show Instrument Schematic command, 6-13Show Status command, 6-14Unit Configuration command, 6-17
Units dialog box, 8-7Use calculation assignments, 5-66User-defined thickness curve, 5-39
VVacuum pump, 1-4
connecting to analyzer, 2-4View, 6-7
WWarm free space, 5-24
calculations, C-4Warnings, 1-2Weighing
sample, 4-21Window
tile, 3-10Windows menu, 3-10Worksheet
See Forms
ZZero pressure calibration, 6-19Zoom feature, 7-14
Index TriStar 3000
Index-8 Feb 03