trophic ecology of summer flounder in lower … · trophic ecology of summer flounder in lower...
TRANSCRIPT
Transactions of the American Fisheries Society 140:1240–1254, 2011C© American Fisheries Society 2011ISSN: 0002-8487 print / 1548-8659 onlineDOI: 10.1080/00028487.2011.618364
ARTICLE
Trophic Ecology of Summer Flounder in Lower ChesapeakeBay Inferred from Stomach Content and Stable IsotopeAnalyses
Andre Buchheister* and Robert J. LatourVirginia Institute of Marine Science, College of William and Mary, Post Office Box 1346,Gloucester Point, Virginia 23062, USA
AbstractTrophic studies of summer flounder Paralichthys dentatus have relied on traditional stomach content analyses
to infer contributions of prey to species productivity. We applied both stable isotope and stomach content analysesto identify prey groups that are responsible for summer flounder productivity in lower Chesapeake Bay and toexplore ontogenetic patterns in prey utilization. Summer flounder (total length = 138–682 mm; age = 0–11 years)were collected for stomach and tissue samples (liver, blood, and muscle) during spring–summer (May–July) and fall(November) of 2006 and 2007. Commonly consumed crustacean and fish prey species were also collected: mysidshrimp Neomysis americana, sevenspine bay shrimp Crangon septemspinosa, mantis shrimp Squilla empusa, bayanchovy Anchoa mitchilli, spotted hake Urophycis regia, and juvenile sciaenids. Analysis of the nitrogen stable isotoperatio (δ15N; ratio of 15N to 14N relative to a standard) revealed that crustaceans comprised the majority (72–100%on average) of the summer flounder diet except in spring 2006, when fish consumption was more dominant. Analysisof corresponding stomach contents indicated a lower contribution of crustacean prey. Based on isotopes, summerflounder tended to occupy the same trophic level as the prey fishes. The δ15N in all tissues exhibited a positivetrend with body length, indicating that larger summer flounder fed at approximately one trophic level above smallerindividuals; the positive trend also corresponded with increasing proportions of fish in summer flounder stomachs.Our stable isotope analysis indicates that growth and production of summer flounder in lower Chesapeake Bayare highly dependent on assimilation of mysid shrimp, sevenspine bay shrimp, and mantis shrimp—more so thanpreviously expected based on stomach content research.
Along the U.S. eastern seaboard, the Chesapeake Bay actsas a primary juvenile nursery and crucial foraging habitat fora broad fauna of coastal migratory fishes (Murdy et al. 1997),but the prey resources that support fishery production in thisregion have not been thoroughly examined with methods otherthan traditional stomach content analysis. The summer flounderParalichthys dentatus is a seasonal inhabitant of ChesapeakeBay that resides in the estuary from spring to fall (Able et al.1990; Szedlmayer et al. 1992; Bonzek et al. 2008) before mi-grating to spawning regions on the continental shelf (Packeret al. 1999; Terceiro 2002; Able and Fahay 2010). Owing to theeconomic and ecological importance of summer flounder along
*Corresponding author: [email protected] October 4, 2010; accepted March 11, 2011
the U.S. Atlantic coast, this species has been strictly managed(Terceiro 2002). To support management needs and multispeciesmodeling efforts, summer flounder and other bay fishes havebeen monitored by the Chesapeake Bay Multispecies Monitor-ing and Assessment Program (ChesMMAP) since 2002 (Latouret al. 2003). To date, summer flounder diet assessments fromthis program (Latour et al. 2008) and trophic studies conductedin similar environments have relied solely on stomach contentanalyses (e.g., Burke 1995; Rountree and Able 1992; Link et al.2002). These studies have documented that summer flounderprimarily consume crustaceans (e.g., mysid shrimp Neomysisamericana, sevenspine bay shrimp Crangon septemspinosa, and
1240
Dow
nloa
ded
by [
Col
lege
of
Will
iam
& M
ary]
at 0
6:20
22
Sept
embe
r 20
11

TROPHIC ECOLOGY OF SUMMER FLOUNDER 1241
mantis shrimp Squilla empusa) and small fishes (e.g., bay an-chovy Anchoa mitchilli and sciaenids), but it remains unclearhow each prey group contributes to actual somatic growth andproduction.
Stable isotopes have emerged as a valuable complement totraditional stomach content analyses by contributing to the char-acterization of trophic relationships and aiding in food webmodeling. Dietary studies involving stable isotope ratios (e.g.,δ15N: the ratio of 15N to 14N relative to a standard) rely onthe fact that an organism’s tissue is synthesized from assimi-lated organic matter and reflects the isotopic signatures of theconsumed prey (Fry 2006). The consumer’s tissue will be atime-integrated dietary representation on a scale of weeks tomonths (e.g., Buchheister and Latour 2010), unlike stomachcontents, which document feeding habits on the order of hours.Thus, stable isotopes can elucidate the prey groups that are di-rectly responsible for driving tissue growth and production ofconsumer species (Fry 2006). This information is important forecosystem modeling efforts requiring quantitative informationon food web relationships over longer time periods that aremore relevant to ecosystem processes. Stable isotope analysesdo not attain the same level of taxonomic resolution affordedby stomach content analysis, but isotope techniques are usefulfor identifying broader sources of production and for differen-tiating between benthic and pelagic trophic pathways (Fry andSherr 1989).
The goal of this study was to use stable isotopes in multipletissues of summer flounder to build upon previous ChesMMAPstomach content analyses by providing a broader understandingof the prey groups driving summer flounder production inlower Chesapeake Bay. The specific objectives were to (1)characterize and compare summer flounder food habits in thebay’s main stem by means of both stomach content analysisand stable isotope methods and (2) explore ontogenetic patternsin resource use. Diet analyses conducted by Latour et al.(2008) are expanded in the present paper by examining anotheryear of ChesMMAP data, but here we focus primarily onstable isotope analyses of summer flounder diets. Despite theprominent role of Chesapeake Bay in the life histories of manyfishes, few studies have applied stable isotope techniques toaddress diets of species at higher trophic levels in this estuary(Hoffman et al. 2007). To our knowledge, this is the firststudy to use stable isotopes from multiple tissues to assesssummer flounder food habits. We demonstrate the utility ofisotopic approaches while also highlighting the assumptionsand complications associated with applying stable isotopesto migratory fish species that inhabit dynamic estuarineenvironments.
METHODSSample collection.—Samples of summer flounder and prey
species for stable isotope analysis were primarily obtained byusing the ChesMMAP bottom trawl survey to complement the
routine analysis of stomach contents by the monitoring program.The ChesMMAP survey, operated by the Virginia Institute ofMarine Science (VIMS), fishes a four-seam balloon trawl with7.6-cm stretch mesh and monitors the main stem of Chesa-peake Bay (for a detailed description of trawl procedures andgear, see Hoffman et al. 2009). Samples of summer flounderand common prey species were collected from the Virginia por-tion of Chesapeake Bay, where summer flounder distributiontends to be concentrated (Latour et al. 2008; Figure 1). Targetedprey items included mysid shrimp (primarily N. americana),sevenspine bay shrimp, mantis shrimp, bay anchovy, weakfishCynoscion regalis, spot Leiostomus xanthurus, Atlantic croakerMicropogonias undulatus, and spotted hake Urophycis regia.Sampled prey were restricted to sizes found in the stomach con-tents of summer flounder (Table 1; Latour et al. 2008). Fishesand mantis shrimp were collected by the ChesMMAP trawl,whereas mysid shrimp and sevenspine bay shrimp were pickedfrom habitat (e.g., hydroids) caught in the net. When possible,samples of summer flounder and prey species were collectedconcurrently at the same stations, but species distributions andgear selectivity often prevented this. Samples of smaller fishesand invertebrates were augmented with collections from theVIMS Juvenile Finfish and Blue Crab Trawl Survey, which usesa smaller, finer-mesh net with a cod-end liner (for a descriptionof trawl procedures and gear, see Fabrizio and Tuckey 2008). Incases where samples from the VIMS trawl survey were required,they were obtained from similar locations and time periods asthe ChesMMAP collections. Because of difficulties in obtainingmysid shrimp during November 2007, freshly consumed spec-imens were collected from the stomachs of summer floundercaptured in September and October of that year (Grey et al.2002). Any temporal or spatial discrepancies between preda-tor and prey samples were acceptable given that (1) the goalof the study was to look at broad-scale patterns of resourceuse by summer flounder within lower Chesapeake Bay and(2) isotopic signatures integrate consumed material over weeksto months, incorporating similar temporal and spatial isotopicvariability.
Upon capture of summer flounder on the ChesMMAP sur-vey, the fish were processed to determine total length (TL) andwet weight, and otoliths were removed for later sectioning andage determination. When multiple distinct size-classes of sum-mer flounder were captured, subsamples from each size-groupwere collected. Stomachs (up to 10 per station) were excisedand preserved in formalin for future diet analysis in the labo-ratory. Samples of blood, muscle, and liver from a portion ofsummer flounder were collected for isotopic determination ofdiets to be compared with the standard stomach content analy-ses. Whole blood (∼1 mL) was withdrawn from the caudal veinand placed in a sterile vial, and small samples of white mus-cle (from the ocular side above the pectoral fin) and liver wereexcised and bagged individually. Samples of blood, muscle,and liver from summer flounder were immediately frozen forlater isotope analysis. Samples of prey with smaller body sizes
Dow
nloa
ded
by [
Col
lege
of
Will
iam
& M
ary]
at 0
6:20
22
Sept
embe
r 20
11

1242 BUCHHEISTER AND LATOUR
TABLE 1. Summary description of summer flounder samples and other taxa collected for stable isotope analyses, including number of samples, mean ± SDC:N ratio, and mean ± SD length (summer flounder length-classes: small [S] < 225 mm total length [TL]; medium [M] = 225–374 mm TL; large [L] ≥ 375 mmTL). Lengths were measured as the total length (Atlantic croaker, spotted hake, weakfish, and summer flounder), fork length (bay anchovy and spot), or carapacelength (mantis shrimp, mysid shrimp, and sevenspine bay shrimp).
Number of samples
Length- Spring Fall Spring Fall LengthGroup Species Tissue class 2006 2006 2007 2007 C:N (mm)
Fish prey Atlantic croaker Muscle 6 8 3.2 ± 0.2 62 ± 15Bay anchovy Muscle 9 8 8 9 3.4 ± 0.3 61 ± 8Spot Muscle 8 8 6 3.4 ± 0.4 133 ± 16Spotted hake Muscle 4 3.8 ± 0.2 155 ± 12Weakfish Muscle 4 6 6 3.2 ± 0.2 97 ± 34
Crustacean Mantis shrimp Whole body 6 4 6 6 3.9 ± 0.3 100 ± 20prey Mysid shrimp Whole body 2 9 9 3.7 ± 0.2 —a
Sevenspine bay shrimp Whole body 9 8 6 4 3.7 ± 0.2 29 ± 7Predator Summer flounder Muscle S 1 3 8 3.1 ± 0.2 181 ± 27
M 6 6 5 14 3.1 ± 0.2 275 ± 34L 7 6 3 3.1 ± 0.4 460 ± 78
Blood S 6 3.9 ± 0.1 161 ± 19M 5 14 3.7 ± 0.1 275 ± 31L 3 3.7 ± 0.1 424 ± 37
Liver S 7 5.1 ± 0.3 165 ± 20M 5 14 6.3 ± 1.7 275 ± 31L 3 10.0 ± 3.8 424 ± 37
aIndividual lengths were not measured for mysid shrimp, but sizes ranged from approximately 5 to 15 mm.
(e.g., juvenile fishes and invertebrates) were frozen whole. Forlarger fish prey, pieces of white muscle were excised from themusculature below the first dorsal fin and were frozen. Preser-vation by freezing was selected for isotope samples becausefreezing has a minimal effect on δ13C and δ15N values (Kaehlerand Pakhomov 2001; Sweeting et al. 2004). All collection pro-tocols were approved by the Institutional Animal Care and UseCommittee at the College of William and Mary.
Collections were made during different time periods to char-acterize seasonal dietary patterns and account for temporal vari-ability in isotopic signatures resulting from migration or fluctu-ations in prey isotopic signatures. Stable isotope samples werecollected in 2006 and 2007 during two seasonal periods. Sam-ples collected in May, June, or July represented the spring andearly summer (hereafter, “spring”), while samples collected inNovember represented the fall season. Largely owing to theavailability of summer flounder and their prey, more southernstations were represented in 2006 samples than in 2007 samples(Figure 1). Blood and liver samples were not collected fromsummer flounder in 2006, and individual prey species were notrepresented in every season × year combination, mostly becauseof seasonal trends in species abundances (Table 1). Summerflounder stomachs (regularly sampled by the ChesMMAP sur-vey) were collected during all ChesMMAP cruises conducted inMarch, May, July, September, and November of 2006 and 2007(except September 2007, when a cruise was cancelled).
Laboratory processing.—Stomach contents were sorted andanalyzed in the laboratory by following the methods of Latouret al. (2008). Briefly, prey items found in the stomachs wereidentified to the lowest possible taxon, and wet weight wasrecorded to the nearest 0.001 g. For age determination, otolithsof summer flounder were sectioned with cuts made perpendic-ular to the sulcal groove through the nucleus by following themethod of Sipe and Chittenden (2001), and annuli were exam-ined by two readers to assign ages.
Samples for stable isotope analysis were processed in thelaboratory. Smaller samples (∼1–2 g) of white dorsal musclewere taken from each summer flounder and prey fish collectedin the field; for any fish prey that was collected whole, themuscle sample was removed after fish length was measured.Invertebrate samples were measured for carapace length andprocessed whole. For mysid shrimp, multiple individuals wereaggregated to obtain sufficient mass for stable isotope analysis.All muscle, liver, and whole-body samples were rinsed withdeionized water, dried at 50◦C, and ground with a mortar andpestle. Blood samples were dried and ground in their storagevials. Carbonates found in exoskeletons of the crustacean preywere acidified with added drops of 10% HCl (Pinnegar andPolunin 1999). Dry subsamples (1.0 ± 0.2 mg) of all tissueswere packaged in tin capsules and analyzed at the Stable IsotopeFacility, University of California–Davis, by use of a EuropaHydra 20/20 continuous-flow isotope ratio mass spectrometer.
Dow
nloa
ded
by [
Col
lege
of
Will
iam
& M
ary]
at 0
6:20
22
Sept
embe
r 20
11

TROPHIC ECOLOGY OF SUMMER FLOUNDER 1243
FIGURE 1. Sampling locations within lower Chesapeake Bay, where summer flounder and their common prey types were collected. Symbol shape indicatessampling year (squares = 2006; circles = 2007); symbol color represents season of capture (gray = spring; black = fall).
Stable isotope ratios are reported in relation to conventionalstandards, that is,
δX = [(Rsample − Rstandard)/Rstandard] × 1,000, (1)
where X is either 13C or 15N, and R is the mass ratio ofthe heavy to light stable isotopes (13C/12C or 15N/14N) for ei-ther the sample or the standard. The conventional standardsused for the analyses were Pee Dee Belemnite for carbonand air for nitrogen. The value for δX is reported in per
Dow
nloa
ded
by [
Col
lege
of
Will
iam
& M
ary]
at 0
6:20
22
Sept
embe
r 20
11

1244 BUCHHEISTER AND LATOUR
mille (‰) units. Repeated measurements of a calibration stan-dard indicated that instrument precision (SD) was 0.29‰ forδ13C and 0.12‰ for δ15N. The mass ratio of elemental car-bon and nitrogen (C:N) was also obtained for each analyzedsample.
Because of the high lipid concentrations in liver, which areknown to bias δ13C values, a mathematical correction was usedto normalize the liver δ13C values because of the high lipidconcentrations in liver, which are known to bias δ13C values(DeNiro and Epstein 1977; McConnaughey and McRoy 1979).Each raw value of liver δ13C was converted to a lipid-adjustedvalue based on measured C:N (a proxy for lipid content) byusing an empirically derived conversion equation (Buchheisterand Latour 2010). Lipid corrections were not applied to δ13C formuscle and blood due to their relatively low C:N values (Table1; Post et al. 2007), limited variability across individuals, andpresumably small effects on δ13C (Kiljunen et al. 2006).
Data analysis.—Diet compositions based on stomach con-tent analyses were calculated as percent contribution by weight;based on the methods of Latour et al. (2008), a cluster sam-pling estimator was used to account for dietary similarity amongfish caught at the same location. Summer flounder were clas-sified into three size-classes (small < 225 mm TL; medium =225–374 mm TL; large ≥ 375 mm TL) to capture broad on-togenetic changes in diet as documented in previous research(Latour et al. 2008). Diets were calculated by year, month, andsize-class; we present only those results that were determinedwith a minimum of five stomachs. For a closer correspon-dence to summer flounder isotopic samples, analysis of Ches-MMAP stomach content data were restricted to individuals thatwere captured within Virginia waters of the lower ChesapeakeBay.
Isotopic contributions of prey to summer flounder diets wereassessed graphically and were calculated by use of mixingmodels. Prey species were separated into two broad taxonomicgroups (crustaceans and fishes) to capture the major differencesin stable isotope signatures (Phillips et al. 2005; McIntyre et al.2006). Prey were assigned to the two taxonomic groups basedon similarity among prey isotopic signatures; this was done toreduce the number of sources and to calculate unique solutionsin the mixing model. IsoError, a two-source mixing model thataccounts for variability in both prey and predator isotope values,was used to calculate the mean contribution (±SE) of each preygroup to summer flounder diets (Phillips and Gregg 2001). Toapply the mixing models, we first adjusted the summer flounderδ13C and δ15N values to account for isotopic fractionation (i.e.,changes in isotopic values caused by physiological processing ofconsumed material). Tissue- and isotope-specific fractionationsof δ13C and δ15N (represented as �13C and �15N, respectively)were derived from growth-based turnover models of wild sum-mer flounder that were subjected to a dietary shift experimentin the laboratory (Buchheister and Latour 2010). Applied val-ues of �13C were +0.71‰ for muscle, +3.27‰ for blood, and+3.05‰ for liver; applied values of �15N were +2.53‰ for
muscle, +2.80‰ for blood, and +2.28‰ for liver. The mixingmodel was applied to each summer flounder tissue from eachyear, season, and length-class by using the corresponding preyisotope values for the season and year.
A multivariate analysis of variance (MANOVA) was used totest for significant year and season effects on the mean stableisotope values (δ13C and δ15N) of each prey group. Assumptionsof normality and homogeneity of variance for the MANOVAwere upheld based on residual analysis, Kolmogorov–Smirnovtests, and Levene’s tests. For each prey group, the following apriori comparisons were made with the Wilks’ lambda statisticat an α-level of 0.05: season effects were tested within each year,and year effects were tested within each season. The analyseswere conducted in the Statistical Analysis System version 9.1(SAS Institute, Cary, North Carolina).
Regression analyses were used to test for significant onto-genetic trends in summer flounder isotopic signatures and toexamine dietary shifts inferred from tissue comparisons. On-togenetic trends in δ13C and δ15N were assessed by regress-ing the isotopic values on fish TL. Dietary shifts that occurwithin the time frame of the tissue with the slowest turnoverrate can be reflected by differences in isotopic values betweentissues (MacNeil et al. 2005; Fry 2006). For each individual,fractionation-adjusted δ13C and δ15N values for muscle weresubtracted from fractionation-adjusted blood and liver values toexamine recent shifts in summer flounder feeding and potentialontogenetic trends. For example, a recent dietary shift towardfeeding on prey with enriched (i.e., more-positive) δ15N wouldmanifest as a positive difference between liver and muscle tis-sues owing to the faster turnover of the liver (Buchheister andLatour 2010). Differences between tissue pairs were calculatedand plotted against fish length for both δ13C and δ15N, and re-gression analysis was used to test for significant relationships.
RESULTS
Stomach ContentsIn total, 563 fish (with nonempty stomachs; TL =
138–682 mm; age = 0–11 years) from 301 stations were an-alyzed for stomach contents during the 2-year study period. Theprey species that were sampled for stable isotopes representedthe majority of consumed material in the stomachs of all length-classes (86–96% in 2006; 71–91% in 2007), thus confirmingthe importance of the prey species that were selected for sam-pling. Overall, summer flounder stomach contents from bothyears showed a consistent shift from crustacean prey to fishprey with increasing predator length (Figure 2). Mysid shrimpwere the dominant prey item (contributing up to 86% of the dietby weight) for small summer flounder, whereas larger individ-uals had diverse diets that included greater percentages of bayanchovy, weakfish, spot, and other fishes. Fish prey (mostlybay anchovy) comprised a greater proportion of the diet in2006 than in 2007 by an average of 21% (range = 7–40%) foreach month and size-class but most notably for medium-sized
Dow
nloa
ded
by [
Col
lege
of
Will
iam
& M
ary]
at 0
6:20
22
Sept
embe
r 20
11

TROPHIC ECOLOGY OF SUMMER FLOUNDER 1245
FIGURE 2. Monthly mean percent diet composition (by weight) based on stomach contents of small (<225 mm total length [TL]), medium (225–374 mm TL),and large (≥375 mm TL) summer flounder collected in (a) 2006 and (b) 2007. Fill patterns represent different prey species (s. bay shrimp = sevenspine bayshrimp; other crust. = other crustaceans), and colors indicate prey groups (white = crustaceans; gray = fishes; black = other). Values above each bar are thenumber of analyzed fish and the number of represented stations (in parentheses). Months in which fewer than five stomachs were sampled were omitted.
summer flounder (Figure 2). The contributions of individualprey species to the diets varied by month. For example, sev-enspine bay shrimp were particularly important in the dietsof medium-sized summer flounder in late winter and spring(March and May), whereas mysid shrimp increased in the di-ets of medium-sized summer flounder during summer and fall(Figure 2).
Stable IsotopesFifty-nine summer flounder were analyzed for δ13C and δ15N
(Table 1); most of these individuals ranged from 138 to 478 mmTL and from 0 to 3 years of age. However, there were threeoutliers in spring 2006 (TL = 599–624 mm; age = 4–7 years).Sampled fish included 32 females, 26 males, and 1 fish of un-known sex. Larger individuals were predominantly females, thusreflecting the skewed sex ratio of age-1 and older summer floun-der in the Middle Atlantic Bight and lower Chesapeake Bay(Morse 1981; Bonzek et al. 2008).
Aggregation of summer flounder prey into two prey groups(crustaceans and fishes) was supported by the isotopic separa-tion between the groups, particularly for δ15N (Figure 3). Fishesgenerally exhibited δ15N values that were approximately 3‰greater than those for crustaceans; this result conforms to the tra-ditional assumption of an approximately 3.4‰ shift per trophiclevel (Post 2002; Sweeting et al. 2007). The δ13C was not a use-ful dietary indicator because of (1) the similarity and overlap ofprey δ13C values and (2) the high variability in summer flounderδ13C values, which often extended beyond the constraints ofprey δ13C (e.g., Figure 3a). Consequently, the mixing models inthis study were applied by using δ15N values only.
Isotopic values of summer flounder resembled the values ofthe fish prey (Figure 3), which suggests a shared nutritionalreliance on the lower prey group (i.e., crustaceans). Summerflounder predation on fishes would have been indicated by tis-sue δ15N values greater than those of prey fishes, but the averageδ15N values for small-, medium-, and large-sized summer floun-der were not significantly greater than the δ15N of prey fishes(ANOVA: P > 0.05) except in spring 2006. For fall samplesin both years, the mixing model results (based on δ15N only)indicated that crustaceans dominated the diets of summer floun-der, reaching 100% for some sizes (Table 2). On average, fishesaccounted for 35% or less of the total diet during fall, but SEvalues for the estimates ranged from 9% to 24%, indicating thatsome individuals may rely more heavily on fish prey than others.During spring 2006, summer flounder appeared to assimilate agreater amount of fish (54–68%). Highly depleted δ15N valuesof tissues in spring 2007 prevented the use of the mixing modelfor this season (Table 2), but the raw δ15N values placed smallsummer flounder at a trophic level similar to that of the crus-taceans and placed medium summer flounder at a trophic levelsimilar to that of the sampled fish prey (Figure 3c).
Temporal Variability in Prey Stable IsotopesIsotopic values of prey groups were not temporally consis-
tent; rather, they exhibited seasonal patterns that differed byyear. From spring to fall in 2006, crustacean δ13C became moredepleted while δ15N became more enriched, but the oppositepattern was observed in 2007 (Table 3). Prey fishes experi-enced a similar depletion of δ13C and enrichment of δ15N fromspring to fall during 2006, but seasonal differences in isotopesignatures of fishes were not significant in 2007 (F = 2.69,
Dow
nloa
ded
by [
Col
lege
of
Will
iam
& M
ary]
at 0
6:20
22
Sept
embe
r 20
11

1246 BUCHHEISTER AND LATOUR
d. Fall 2007
δ13C
-22 -20 -18 -16
ba cr
mamy
sb
we
b. Fall 2006
δ13C
-22 -20 -18 -16
δ15N
12
14
16
18ba
cr
ma
my
sb
we sp
c. Spring 2007
ba
sp
ma
my
sb
we
a. Spring 2006
δ15N
12
14
16
18
ba
sp
ma
sb
ha
FIGURE 3. Biplots of carbon and nitrogen stable isotope ratios (δ13C and δ15N; mean ± SD) for summer flounder and other sampled species collected in (a)spring 2006, (b) fall 2006, (c) spring 2007, and (d) fall 2007. Values for muscle are plotted for three summer flounder length-classes (gray circles = small [<225mm total length]; gray triangles = medium [225–374 mm]; gray squares = large [≥375 mm]). For figure clarity, blood and liver values from summer flounder arenot plotted. Values for fish prey (black squares) and crustacean prey (white squares) are labeled by species (ba = bay anchovy; cr = Atlantic croaker; ha = spottedhake; ma = mantis shrimp; my = mysid shrimp; sb = sevenspine bay shrimp; sp = spot; we = weakfish).
P > 0.05). Isotopic differences between seasons within a preygroup were relatively small and typically less than 1.4‰ inmagnitude; however, the SDs for group means reached 1.66‰due to interspecies and intraspecies variability (Table 3). Iso-tope means of prey groups also tended to vary by year, as mostmultivariate ANOVA tests of interannual differences by seasonyielded significant results (P < 0.05; Table 3). Only the isotopicmeans of prey fishes in spring were found to be similar between2006 and 2007.
Ontogenetic Trends in Stable Isotope SignaturesPositive relationships between δ15N and summer flounder
TL indicated an ontogenetic shift toward feeding at highertrophic levels as the fish grew (Figure 4). This effect was mostpronounced in 2007, manifesting in all sampled tissues, andwas most evident for the spring sampling. Based on the as-sumed δ15N fractionations of 2.3–2.8‰ for the sampled tissues(Buchheister and Latour 2010), relatively large summer floun-der were feeding at approximately one trophic level above small
Dow
nloa
ded
by [
Col
lege
of
Will
iam
& M
ary]
at 0
6:20
22
Sept
embe
r 20
11

TROPHIC ECOLOGY OF SUMMER FLOUNDER 1247
TABLE 2. Results of mixing models examining the contribution of fish and crustacean prey to summer flounder diets (%; mean ± SE) based on the nitrogenstable isotope ratio (δ15N; mean ± SD). Contribution to the diet was calculated for each combination of summer flounder total length (small [S] < 225 mm;medium [M] = 225–374 mm; large [L] ≥ 375 mm) and tissue. Results for spring 2007 are not shown because all mean values were not constrained by 0% and100%. Note that summer flounder δ15N values were adjusted for fractionation (see Methods).
Summer flounder Fish prey Crustacean prey
Time period Length-class Tissue δ15N n δ15N n % in diet δ15N n % in diet
Spring 2006 S Muscle 13.9 ± 0 1 15.1 ± 1.2 21 54 ± 6 12.4 ± 0.6 15 46 ± 6M Muscle 14.1 ± 1.1 6 15.1 ± 1.2 21 61 ± 18 12.4 ± 0.6 15 39 ± 18L Muscle 14.2 ± 0.5 7 15.1 ± 1.2 21 68 ± 10 12.4 ± 0.6 15 32 ± 10
Fall 2006 S Muscle 13.6 ± 0.3 3 16.5 ± 1.5 26 −6 ± 10 13.8 ± 0.6 14 106 ± 10M Muscle 14.6 ± 1.5 6 16.5 ± 1.5 26 28 ± 24 13.8 ± 0.6 14 72 ± 24L Muscle 14.4 ± 0.4 6 16.5 ± 1.5 26 22 ± 9 13.8 ± 0.6 14 78 ± 9
Fall 2007 M Muscle 13.7 ± 0.9 14 15.8 ± 0.8 23 25 ± 10 12.9 ± 0.9 21 75 ± 10Liver 12.9 ± 0.9 14 15.8 ± 0.8 23 2 ± 10 12.9 ± 0.9 21 98 ± 10Blood 13.0 ± 0.7 14 15.8 ± 0.8 23 −1 ± 11 12.9 ± 0.9 21 101 ± 11
L Muscle 14.0 ± 0.6 3 15.8 ± 0.8 23 35 ± 14 12.9 ± 0.9 21 65 ± 14Liver 13.4 ± 0.6 3 15.8 ± 0.8 23 −28 ± 16 12.9 ± 0.9 19 128 ± 16Blood 12.1 ± 0.6 3 15.8 ± 0.8 23 16 ± 14 12.9 ± 0.9 19 84 ± 14
summer flounder. Larger summer flounder exhibited δ15N val-ues that were similar to or slightly greater than those of preyfishes, and the δ15N values of some individual summer floun-der were more than 1 SD greater than the mean for fish prey(Figure 4). For each tissue, linear regressions of δ15N on summerflounder TL were significant (P < 0.05) when 2007 data werepooled. When the three fish exceeding 350 mm were excludedfrom the analysis, slopes were not significantly different amongtissues (estimated slope [mean ± SE], muscle: 0.016 ± 0.003;blood: 0.020 ± 0.002; liver: 0.015 ± 0.003). Although not pre-sented, strong relationships between δ15N and individual masswere also observed for fish captured in 2007. In 2006, however,significant relationships were not observed between δ15N andTL (or mass), possibly because small, age-0 individuals werelacking in samples collected during spring, a season when sizeand dietary differences between length-classes may be most
pronounced. Relationships between δ13C and summer flounderTL were not observed except in 2006, when there was a slighttrend of more-enriched δ13C in the muscle tissue of larger fish(Figure 5).
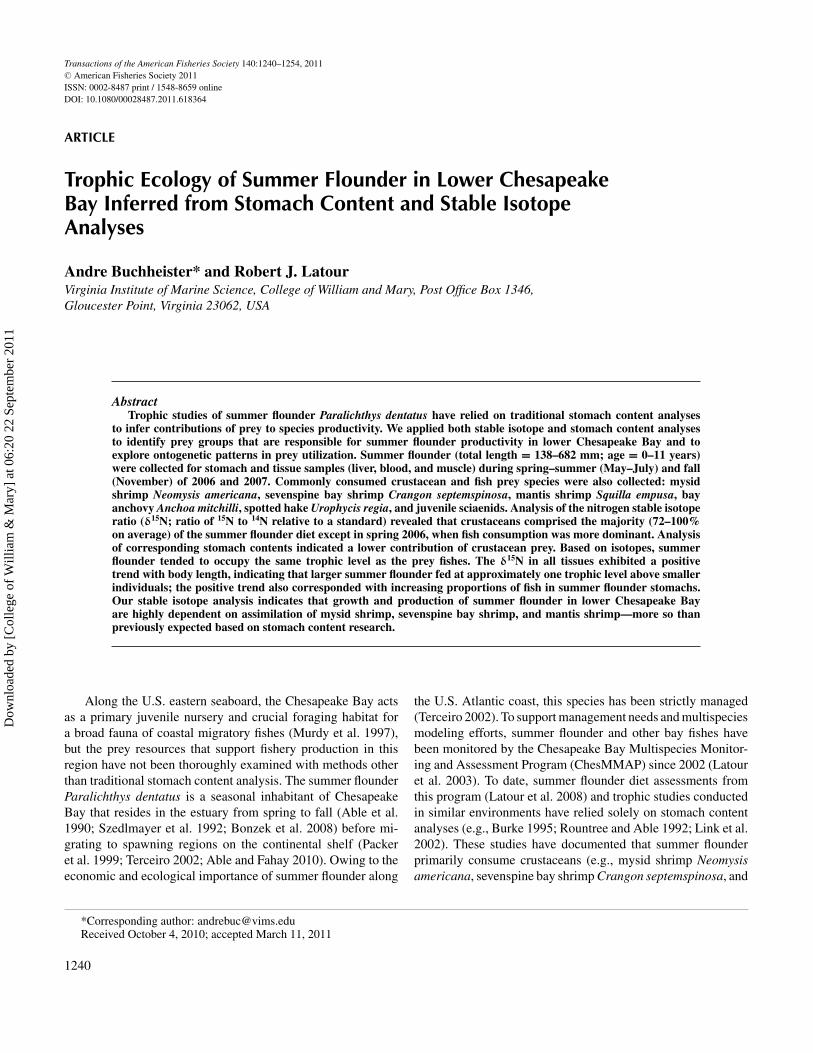
Summer Flounder Tissue DifferencesIsotopic values for blood and liver were mostly depleted rel-
ative to muscle and showed some significant relationships (P <
0.05) with fish TL (Figure 6). For δ15N, blood samples weremost depleted relative to muscle for small summer flounder,and tissue differences were diminished with increasing length(Figure 6a). Unlike blood δ15N, liver δ15N showed a negativerelationship with fish length, although the fit of the linear regres-sion model was poor (r2 = 0.19) and largely driven by the fourlargest individuals (Figure 6a). Although most of the tissue δ15Ndifferences were negative (as low as −2.4‰), these values were
TABLE 3. Mean carbon and nitrogen stable isotope ratios (δ13C and δ15N; with SDs) for samples of summer flounder prey groups collected in the lowerChesapeake Bay main stem. For each prey group, significant multivariate ANOVA (MANOVA) results (for the season effect tested within each year and the yeareffect tested within each season; P < 0.05) are indicated by different letters.
δ13C δ15N
Prey group Time period n Mean SD Mean SD MANOVA
Crustaceans Spring 2006 15 −18.66 0.41 12.41 0.59 aFall 2006 14 −19.28 1.15 13.81 0.58 bSpring 2007 21 −19.17 0.61 13.95 1.11 cFall 2007 19 −18.17 0.93 12.95 0.90 d
Fishes Spring 2006 21 −18.63 0.73 15.11 1.23 aFall 2006 26 −19.97 1.66 16.48 1.53 bSpring 2007 20 −18.29 1.34 15.04 1.14 acFall 2007 23 −18.97 0.89 15.81 0.83 c
Dow
nloa
ded
by [
Col
lege
of
Will
iam
& M
ary]
at 0
6:20
22
Sept
embe
r 20
11

1248 BUCHHEISTER AND LATOUR
δ15 N
13
14
15
16
17
18
19
20
Length (mm)
100 200 300 400 500 600
13
14
15
16
17
18
19
20
13
14
15
16
17
18
19
20
Spring 2006Fall 2006Spring 2007Fall 2007
a. muscle
b. blood
c. liver
FIGURE 4. Nitrogen stable isotope ratios (δ15N) for (a) muscle, (b) blood,and (c) liver plotted in relation to total length (mm) for individual summerflounder. Symbol shape represents season of capture (circles = spring; squares =fall), and symbol color indicates year (white = 2006; black = 2007). Forreference, the mean δ15N (dashed line; with SD, dotted lines) of prey fishescollected in fall 2007 is plotted.
particularly sensitive to the choice of applied fractionation value.If a muscle �15N of 3.4‰ (Vander Zanden and Rasmussen2001) had been applied instead of 2.53‰ (Buchheister andLatour 2010) as described in Methods, the tissue δ15N differ-ences would have been mostly centered around zero (Figure 6a).
Length (mm)
100 200 300 400 500 600
-21
-20
-19
-18
-17
-16
-15
-21
-20
-19
-18
-17
-16
-15
Spring 2006Fall 2006Spring 2007Fall 2007
δ13 C
-21
-20
-19
-18
-17
-16
-15
a. muscle
b. blood
c. liver
FIGURE 5. Carbon stable isotope ratios (δ13C) for (a) muscle, (b) blood, and(c) liver plotted in relation to total length (mm) for individual summer flounder.Symbol shape represents season of capture (circles = spring; squares = fall),and symbol color indicates year (white = 2006; black = 2007).
For δ13C, blood values were consistently more than 2.9‰ de-pleted relative to muscle values but showed a significant positiverelationship with summer flounder TL (Figure 6b). Liver δ13Cvalues were typically 0–2.5‰ lower than muscle δ13C valuesand showed no significant relationship with length.
Dow
nloa
ded
by [
Col
lege
of
Will
iam
& M
ary]
at 0
6:20
22
Sept
embe
r 20
11
TROPHIC ECOLOGY OF SUMMER FLOUNDER 1249
Length (mm)
100 150 200 250 300 350 400 450 500
δ15N
- δ
15N
mu
s
-3.0
-2.5
-2.0
-1.5
-1.0
-0.5
0.0
0.5
Length (mm)
100 150 200 250 300 350 400 450 500
δ13C
- δ
13C
mu
s
-5
-4
-3
-2
-1
0
a.
b.
FIGURE 6. Differences in nitrogen or carbon stable isotope ratio (δ15N orδ13C) values between tissues of summer flounder as a function of fish totallength. After all tissues were adjusted for fractionation effects, the (a) δ15Nof muscle (δ15Nmus) or (b) δ13C of muscle (δ13Cmus) was subtracted from thevalue obtained from the blood (shaded symbols) or liver (open symbols) ofeach fish collected in spring 2007 (circles) and fall 2007 (squares). Significantregression lines are plotted for blood (solid line) and liver (dashed line) tissues(data pooled across seasons). The horizontal dotted line represents a differenceof zero if the δ15N fractionation value (�15N) of 3.4‰ is applied for muscleinstead of the �15N measured for summer flounder (see Methods).
DISCUSSION
Stable Isotopes versus Stomach ContentsStable isotope and stomach content analyses presented dif-
fering results on the relative importance of crustacean and fishprey in the diets of summer flounder; stable isotope analysissuggested higher levels of crustacean consumption than didstomach content analysis. Although this discrepancy is reducedwhen the SEs from mixing model results are considered (SE fordietary contribution based on δ15N was as high as ±24%), di-etary differences were also probably influenced by the differenttime periods represented by the two methodologies. Stomachcontent analysis identifies prey that were recently consumed
(i.e., on the order of hours; Hyslop 1980), whereas stable iso-topes provide a more time-integrated dietary representation on ascale of weeks to months (MacNeil et al. 2006; Buchheister andLatour 2010). Consequently, even if diet characterizations bythe two methods differ, they can both be accurate. For example,higher levels of presumed fish consumption in the late summerand fall (based on stomach contents) may be reflected weaklyin isotopic signatures because juvenile growth rates (and thusisotopic assimilation) are reduced by October and Novemberrelative to spring and summer (Powell 1982; Rountree and Able1992).
The discrepancy between methodologies could also resultfrom underrepresentation of mysid shrimp in stomach contentsbecause of differences in prey digestibility, evacuation rates,and periodicity in prey availability (Hyslop 1980). Relativeto fish prey or to crustacean prey with more-robust exoskele-tons (e.g., sevenspine bay shrimp and mantis shrimp), mysidshrimp possess a small size, a high surface-to-volume ratio,and a thin exoskeleton, all of which can facilitate digestionand evacuation (Lankford and Targett 1997; Andersen 1999).In addition, consumption of mysid shrimp by summer floun-der, whose eyes are well adapted for visual foraging in low light(Horodysky et al. 2010), is probably greater at night, when mysidshrimp migrate out of benthic refuges and into the water column(Hulburt 1957; Herman 1963). Consequently, the daytime sam-pling by ChesMMAP may have captured summer flounder attimes when crustacean prey were not as available to the preda-tors or when a large proportion of prey consumed at dusk andnight had already been evacuated from the gut.
Ontogenetic Patterns in Summer Flounder FeedingBoth the stable isotope and stomach content analyses con-
firmed that summer flounder undergo an ontogenetic transi-tion to prey resources at higher trophic levels as predator sizeincreases. In accordance with general size-based predation the-ories (Werner and Hall 1974; Scharf et al. 2000), ontoge-netic changes in summer flounder feeding have previously beendemonstrated for different life stages by using stomach contents(Burke 1995; Link et al. 2002; Latour et al. 2008); however,ours is the first study to show such trends for summer flounderby use of stable isotope analysis. The size-based trend in δ15Nwas strongly driven by small fish (<225 mm TL) collected dur-ing spring 2007, supporting the size cutoffs presented by Latouret al. (2008). The 225-mm size may represent a morphologicalpoint of transition at which gape width or swimming speed aidsin capture of the piscine prey that occupy higher trophic levels.
For spring 2007, the use of the mixing model to corrobo-rate the strong relationship between summer flounder size andδ15N was prevented by δ15N values that were depleted relativeto prey samples. According to δ15N values in this season, smallindividuals occupied a trophic level that was more consistentwith the sampled invertebrates and did not feed on fishes. How-ever, contrary to the implications of this information, stomachcontent analyses provide no evidence that summer flounder (of
Dow
nloa
ded
by [
Col
lege
of
Will
iam
& M
ary]
at 0
6:20
22
Sept
embe
r 20
11
1250 BUCHHEISTER AND LATOUR
the sizes examined here) feed on smaller zooplankton (e.g.,copepods; Grimes et al. 1989; Rountree and Able 1992; Latouret al. 2008). Consequently, the prey sampled in spring 2007may not have been isotopically representative of consumed or-ganisms because of regional or temporal variability in δ15N. Forexample, small shifts in basal organic matter sources or smallchanges in the δ15N of primary producers can be transferredup the food web, altering the isotopic signatures of organismsat lower trophic levels more strongly (Horrigan et al. 1990;Montoya et al. 1990; Perga and Gerdeaux 2005; Hoffman et al.2007). This possibility was supported by the unusually smallseparation (1.09‰) in δ15N between the crustacean and fishprey groups and the higher variability in crustacean δ15N duringspring 2007.
Stable Isotopes of Multiple TissuesAnalysis of multiple tissues with varying turnover rates was
important for this study given the life history of summer flounderand the temporal variability in prey stable isotopes. Age-0 andadult summer flounder migrate into lower Chesapeake Bay fromoffshore spawning locations in the spring (March–April) to uti-lize the productive estuarine habitat (Able et al. 1990; Packer etal. 1999). From late spring to fall, juveniles use a variety of habi-tats (e.g., estuarine marsh creeks, seagrass beds, mud flats, andopen bay areas; Packer et al. 1999), and growth rates remain highthrough the summer (Powell 1982; Malloy and Targett 1994).During this time, summer flounder can show a high degree ofsite fidelity or can move several kilometers among estuarine lo-cations (Szedlmayer and Able 1993; Able and Fahay 2010; M.Henderson, Virginia Institute of Marine Science, unpublisheddata). Adults and juveniles migrate out of Chesapeake Bay inthe fall (approximately October–December). Muscle tissue hasa slow turnover rate and would equilibrate to a fish’s diet afterabout 5 months (Buchheister and Latour 2010). Consequently,the muscle isotopic values measured in spring for medium- andlarge-sized fish (age > 0) could reflect prey consumption thatoccurred while the fish were offshore. In addition, both δ15N andδ13C of primary producers and lower trophic levels can vary spa-tially and temporally in Chesapeake Bay (Montoya et al. 1990;Zimmerman and Canuel 2001; Hagy 2002). Such variabilitycan complicate interpretation of isotopic data for muscle tis-sue, especially for any summer flounder that are more mobilewithin the bay. Unlike muscle, liver and blood would approachequilibrium with a dietary signal in approximately 20 d (liver)or 75 d (blood; Buchheister and Latour 2010). In our study,analysis of tissues with faster turnover rates helped to minimizeany bias resulting from fish movements or from isotopic het-erogeneity of prey. The relatively consistent conclusions drawnfrom the different tissues analyzed indicate that the fish didnot move between habitats with drastically different isotopiccharacteristics.
All three tissues captured the same ontogenetic trend of in-creasing δ15N with increasing size while also producing dietestimates that emphasized crustacean assimilation. Given the
positive relationship between δ15N and length, we expected tosee enriched δ15N values for the tissues with faster turnover rates(blood and liver) relative to muscle, which would better repre-sent an individual’s more recent consumption at higher trophiclevels (Fry 2006). Instead, the δ15N values for blood and liverwere depleted relative to muscle. This pattern could indicaterecent nutritional augmentation from lower-trophic-level crus-tacean prey (opposing the general trend from stomach contents)or perhaps an overall depletion in δ15N across the local preycommunity (O’Reilly et al. 2002). However, we argue that theexpected positive ontogenetic signal within an individual’s tis-sues was probably obscured by fractionation assumptions andby isotopic variability of the sampled organisms. This possibil-ity was supported by the sensitivity of the δ15N tissue differencesto the choice of applied fractionation values, especially consid-ering the small isotopic differences that we were trying to detectbetween tissues (Figure 6). However, the positive trend for bloodδ15N (irrespective of the absolute values) suggests that relativelylarge summer flounder have recently shifted to prey types thatare less depleted than the summer flounder’s long-term diet,which would be consistent with increased consumption of fish.Higher variability in liver δ15N may have masked such a signalin that tissue.
Tissue differences in δ13C were probably also influencedby fractionation assumptions. Although the depleted blood andliver δ13C values could potentially indicate more recent feedingon δ13C-depleted prey, this pattern was not supported as stronglyby δ13C values for liver tissue, which has the fastest turnoverrate (Figure 6b). The relative consistency in the phenomenon ofdepleted blood δ13C across seasons and sizes—in conjunctionwith the weaker signal in the liver tissue—suggests that theapplied fractionation for blood may have contributed some biasto these δ13C results.
Sources of ErrorThe fractionation values applied here contributed to some
error in the results, but the major conclusions were not altered.As recommended for stable isotope applications (Gannes et al.1997), we applied δ13C and δ15N fractionations that were empir-ically determined (Buchheister and Latour 2010) for the samespecies, same tissues, and similar body sizes as were used inthis study. However, fractionation values can also vary by diet(Gorokhova and Hansson 1999), dietary protein content (Kellyand Martinez del Rio 2010), feeding mode (Vander Zanden andRasmussen 2001), growth rate (Trueman et al. 2005), and tis-sue composition (Kelly and Martinez del Rio 2010; Pecquerieet al. 2010). Additionally, laboratory fractionations tend to belarger than field-derived values (Vander Zanden and Rasmussen2001), as appeared to be the case with the δ13C in summerflounder blood. Errors in the applied fractionations would alsoaffect mixing model estimates, particularly since isotopic sep-aration between prey groups was small (Vander Zanden andRasmussen 2001). However, unlike δ13C fractionations, theδ15N fractionation estimates used in the mixing models did not
Dow
nloa
ded
by [
Col
lege
of
Will
iam
& M
ary]
at 0
6:20
22
Sept
embe
r 20
11

TROPHIC ECOLOGY OF SUMMER FLOUNDER 1251
deviate as greatly from previous research (Post 2002; Sweetinget al. 2007), and mixing model results for δ15N were relativelysimilar across tissues. More importantly, the fractionations didnot change the major conclusions because the unadjusted sum-mer flounder δ13C and δ15N values coincided with those of theother sampled fishes, indicating that summer flounder and otherfishes fed at a similar trophic level and utilized similar prey.
Isotopic routing is another potential source of error in mixingmodel estimates (Martinez del Rio et al. 2009). Dietary compo-nents that are isotopically distinct can be allocated or “routed”unequally among a consumer’s tissues such that mixing modelresults from individual tissues may provide biased results (e.g.,Kelly and Martinez del Rio 2010). However, biases introducedby isotopic routing would be minimal for summer flounder giventheir carnivorous diets; isotopic routing is more problematic foromnivores, which consume materials that differ markedly withrespect to protein composition (Martinez del Rio et al. 2009).
Isotopic signatures of the crustacean and fish groups exhib-ited temporal variability, as can be expected in large, dynamic es-tuaries such as Chesapeake Bay (Cifuentes et al. 1988; Montoyaet al. 1990; Cloern et al. 2002). Seasonal and annual differences(typically < 1.4‰) within prey groups were probably mediatedthrough bottom-up effects (Peterson and Fry 1987; Cloern et al.2002) and were also influenced by natural fluctuations of speciesabundances in the bay, which generated seasonal differences inthe representative species that were actually sampled (Murdyet al. 1997; Able and Fahay 2010). However, the similarity indietary evaluations among tissues with fast and slow turnoverrates suggests that such variability would not compromise thedocumented importance of crustaceans in the diets of summerflounder.
Lower Chesapeake Bay Food WebCarbon isotope signatures for the sampled species in this
study corresponded with mixed organic matter sources to thefood web of lower Chesapeake Bay. The value of δ13C, whichis commonly used to identify sources of primary production(Peterson and Fry 1987), ranged from approximately −22‰to −16‰ at our main-stem stations. These values could resultfrom mixed consumption of carbon from marine phytoplank-ton (∼ −21‰), benthic microalgae (∼ −17‰), and possiblyC4 marsh grasses (∼ −13‰) or seagrasses (∼ −10‰; Fry andSherr 1989). The δ13C values of summer flounder were interme-diate between these organic matter sources, indicating that bothpelagic (i.e., phytoplankton) and benthic organic matter sourcesare important for summer flounder production. Although manysampling locations were several kilometers away from coastalwetlands and samples were collected at depths where benthicphotosynthesis would be light limited (Kemp et al. 2005), sum-mer flounder can be highly mobile and are known to use shallowhabitats where benthic primary production is greater (Rountreeand Able 1992; Packer et al. 1999; Fabrizio et al. 2007). Incor-poration of dead phytoplankton and other detritus into a longerbenthic food chain may also help to explain some of the more-
enriched δ13C values that were measured for summer flounderand other species (e.g., spot and mantis shrimp) that are morestrongly coupled to benthic food sources, in contrast to pelagicspecies (e.g., bay anchovy; Fry and Sherr 1989). Generally, thesampled species demonstrated a high degree of overlap in δ13Cvalues and relied on mixed organic matter sources, making car-bon a poor dietary tracer for summer flounder in the main stemof the lower Chesapeake Bay.
Compared with δ13C, values of δ15N yielded better isotopicdifferentiation among sampled species in this study and sup-ported the relative trophic positions of these groups in a gener-alized Chesapeake Bay food web (Baird and Ulanowicz 1989;Hagy 2002). Excluding the data from spring 2007, prey fishesexhibited δ15N values that were on average 2.7–2.9‰ greaterthan those of the crustacean group, which equates to a differ-ence of approximately one trophic level (Sweeting et al. 2007).These results corroborate stomach content studies showing thepredominance of mesozooplankton (particularly mysid shrimp)in the diets of bay anchovy (Hartman et al. 2004), juvenile weak-fish (R.J.L., unpublished data), and spotted hake (Steimle et al.2000). Spot and Atlantic croakers are more strongly associatedwith benthic habitats, and a greater contribution of amphipods,copepods, and annelids to their diets may explain their tendencyto exhibit δ15N values that were intermediate between those ofcrustaceans and the other, more-pelagic fishes (Stickney et al.1975; Nemerson and Able 2004). The δ15N values for our sam-pled prey (and their corresponding trophic level; A.B., unpub-lished data) also agreed with available isotopic and trophic leveldata for these species in Chesapeake Bay and similar environ-ments (Hagy 2002; Litvin and Weinstein 2003; Hoffman et al.2007; Douglass 2008). This agreement helps to validate the ac-curacy of the summer flounder results, for which comparablestable isotope data do not exist.
CONCLUSIONSWithin the lower Chesapeake Bay main stem, stable isotope
analysis of multiple summer flounder tissues revealed a strongdietary reliance on crustacean prey, including mysid shrimp,mantis shrimp, and sevenspine bay shrimp. Although some in-dividual summer flounder appeared to assimilate appreciableamounts of fish prey, calculated mean contributions (based onδ15N) of the crustacean group to summer flounder diets rangedfrom 65% to over 100% during the fall, indicating that the ma-jority of assimilated tissue was generated from crustacean foodsources. Consequently, the crustacean prey can play an impor-tant role in energy transfer as a critical food web link for juvenileand young adult summer flounder. Given their preponderancein summer flounder stomachs, mysid shrimp in particular maybe the most important prey driving summer flounder productiv-ity (Latour et al. 2008; this study). Fish prey also contributedto tissue growth and metabolism in summer flounder, espe-cially larger individuals, but dietary contributions by fish exhib-ited annual variability. Summer flounder δ15N values generally
Dow
nloa
ded
by [
Col
lege
of
Will
iam
& M
ary]
at 0
6:20
22
Sept
embe
r 20
11

1252 BUCHHEISTER AND LATOUR
mirrored the values for other small fishes (bay anchovy andjuvenile sciaenids), which suggests that these species occupieda similar trophic level in the food web of lower ChesapeakeBay. Isotopic results were in general agreement with the re-sults of stomach content analysis, although the importance ofcrustaceans may have been underrepresented in stomach con-tents, particularly those of larger summer flounder. Overall,we support recommendations that stable isotope methods arebest when applied in conjunction with additional techniques indiet studies (Cloern et al. 2002; Fry 2006). The use of stom-ach content and stable isotope analyses combined providedboth taxonomic specificity and integrative information on as-similation. Together, these methods characterized the diets ofsummer flounder more comprehensively and can be of greaterbenefit to resource managers, ecosystem modelers, and otherresearchers.
ACKNOWLEDGMENTSWe thank the crew of the RV Bay Eagle (Captain L. D.
Ward and J. E. Olney Jr.), members of the ChesMMAP group(C. Bonzek, E. Brasseur, M. Chattin, J. Gartland, R. M. Johnson,D. Lange, P. Lynch, E. McComber, and D. Parthree), and thestaff of the VIMS Juvenile Fish and Blue Crab Trawl Sur-vey (H. Brooks, A. Halverson, W. Lowery, and A. Rhea) fortheir assistance in collecting field samples. We also thank theChesMMAP staff for their diligent work in analyzing fish stom-ach contents. D. A. Bronk, M. C. Fabrizio, J. E. Olney Sr., J.Hoffman, and two anonymous reviewers provided constructivecomments on earlier drafts of this manuscript. This paper isContribution Number 3134 of VIMS, College of William andMary.
REFERENCESAble, K. W., and M. P. Fahay. 2010. Ecology of estuarine fishes: temperate wa-
ters of the western North Atlantic. Johns Hopkins University Press, Baltimore,Maryland.
Able, K. W., R. E. Matheson, W. W. Morse, M. P. Fahay, and G. P. Shepherd.1990. Patterns of summer flounder (Paralichthys dentatus) early life historyin the Mid-Atlantic Bight and New Jersey estuaries. U.S. National MarineFisheries Service Fishery Bulletin 88:1–12.
Andersen, N. G. 1999. The effects of predator size, temperature, and preycharacteristics on gastric evacuation in whiting. Journal of Fish Biology54:287–301.
Baird, D., and R. E. Ulanowicz. 1989. The seasonal dynamics of the ChesapeakeBay ecosystem. Ecological Modelling 59:329–364.
Bonzek, C. F., R. J. Latour, and J. Gartland. 2008. Data collection and analysis insupport of single and multispecies stock assessments in Chesapeake Bay: theChesapeake Bay Multispecies Monitoring and Assessment Program. VirginiaInstitute of Marine Science, Gloucester Point.
Buchheister, A., and R. J. Latour. 2010. Turnover and fractionation of carbonand nitrogen stable isotopes in tissues of a migratory coastal predator, summerflounder (Paralichthys dentatus). Canadian Journal of Fisheries and AquaticSciences 67:445–461.
Burke, J. S. 1995. Role of feeding and prey distribution of summer and southernflounder in selection of estuarine nursery habitats. Journal of Fish Biology47:355–366.
Cifuentes, L. A., J. H. Sharp, and M. L. Fogel. 1988. Stable carbon and nitrogenisotope biogeochemistry in the Delaware estuary. Limnology and Oceanog-raphy 33:1102–1115.
Cloern, J. E., E. A. Canuel, and D. Harris. 2002. Stable carbon and nitrogenisotope composition of aquatic and terrestrial plants of the San Francisco Bayestuarine system. Limnology and Oceanography 47:713–729.
DeNiro, M. J., and S. Epstein. 1977. Mechanism of carbon isotope fractionationassociated with lipid synthesis. Science (Washington, D.C.) 197;261–263.
Douglass, J. G. 2008. Community dynamics in submersed aquatic vegetation:intermediate consumers as mediators of environmental change. College ofWilliam and Mary, Gloucester Point, Virginia.
Fabrizio, M. C., M. J. Henderson, and J. A. Lucy. 2007. Understand-ing localized movements and habitat associations of summer flounder inChesapeake Bay using passive acoustic arrays. Virginia Marine ResourcesCommission, Final Report, Richmond. Available: www.mrc.state.va.us/vsrfdf/pdf/RF06–11 Dec07.pdf. (October 2010).
Fabrizio, M. C., and T. D. Tuckey. 2008. Estimating relative juvenile abundanceof ecologically important finfish in the Virginia portion of Chesapeake Bay.Virginia Marine Resources Commission, Federal Aid in Sport Fish Restora-tion, Project F-104-R-12, Annual Report, Richmond.
Fry, B. 2006. Stable isotope ecology. Springer-Verlag, New York.Fry, B., and E. B. Sherr. 1989. δ13C measurements as indicators of carbon flow
in marine and freshwater ecosystems. Pages 196–229 in P. W. Rundel, J. R.Ehleringer, and K. A. Nagy, editors. Stable isotopes in ecological research.Springer-Verlag, New York.
Gannes, L. Z., D. M. O’Brien, and C. M. del Rio. 1997. Stable isotopes in animalecology: assumptions, caveats, and a call for more laboratory experiments.Ecology (Washington, D.C.) 78:1271–1276.
Gorokhova, E., and S. Hansson. 1999. An experimental study on variations instable carbon and nitrogen isotope fractionation during growth of Mysis mixtaand Neomysis integer. Canadian Journal of Fisheries and Aquatic Sciences56:2203–2210.
Grey, J., S. J. Thackeray, R. I. Jones, and A. Shine. 2002. Ferox trout(Salmo trutta) as ‘Russian dolls’: complementary gut content and stableisotope analyses of the Loch Ness food web. Freshwater Biology 47:1235–1243.
Grimes, B. H., M. T. Huish, and J. H. Kerby. 1989. Species profile: life his-tories and environmental requirements of coastal fishes and invertebrates(Mid-Atlantic)—summer and winter flounder. U.S. Fish and Wildlife ServiceBiological Report 82 (11.112).
Hagy, J. D. 2002. Eutrophication, hypoxia and trophic transfer efficiency inChesapeake Bay. Doctoral dissertation. University of Maryland, College Park.
Hartman, K. J., J. Howell, and J. A. Sweka. 2004. Diet and daily ration ofbay anchovy in the Hudson River, New York. Transactions of the AmericanFisheries Society 133:762–771.
Herman, S. S. 1963. Vertical migration of the opossum shrimp Neomysis amer-icana Smith. Limnology and Oceanography 8:228–238.
Hoffman, J. C., C. F. Bonzek, and R. J. Latour. 2009. Estimation of bottom trawlcatch efficiency for two demersal fishes, the Atlantic croaker and white perch,in Chesapeake Bay. Marine and Coastal Fisheries: Dynamics, Management,and Ecosystem Science [online serial] 1:255–269.
Hoffman, J. C., D. A. Bronk, and J. E. Olney. 2007. Tracking nursery habi-tat use in the York River estuary, Virginia, by young American shad usingstable isotopes. Transactions of the American Fisheries Society 136:1285–1297.
Horodysky, A. Z., R. W. Brill, E. J. Warrant, J. A. Musick, and R. J. Latour. 2010.Comparative visual function in four piscivorous fishes inhabiting ChesapeakeBay. Journal of Experimental Biology 213:1751–1761.
Horrigan, S. G., J. P. Montoya, J. L. Nevins, and J. J. McCarthy. 1990. Naturalisotopic composition of dissolved inorganic nitrogen in the Chesapeake Bay.Estuarine, Coastal, and Shelf Science 30:393–410.
Hulburt, E. 1957. The distribution of Neomysis americana in the estuary of theDelaware River. Limnology and Oceanography 2:1–11.
Hyslop, E. J. 1980. Stomach contents analysis: a review of methods and theirapplication. Journal of Fish Biology 17:411–429.
Dow
nloa
ded
by [
Col
lege
of
Will
iam
& M
ary]
at 0
6:20
22
Sept
embe
r 20
11

TROPHIC ECOLOGY OF SUMMER FLOUNDER 1253
Kaehler, S., and E. A. Pakhomov. 2001. Effects of storage and preservationon the delta C-13 and delta N-15 signatures of selected marine organisms.Marine Ecology Progress Series 219:299–304.
Kelly, L. J., and C. Martinez del Rio. 2010. The fate of carbon in growing fish:an experimental study of isotopic routing. Physiological and BiochemicalZoology 83:473–480.
Kemp, W. M., W. R. Boynton, J. E. Andolf, D. F. Boesch, W. C. Boicourt, G.Brush, J. C. Cornwell, T. R. Fisher, P. M. Glibert, J. D. Hagy, L. W. Harding,E. D. Houde, D. G. Kimmel, W. D. Miller, R. I. E. Newell, M. R. Roman,E. M. Smith, and J. C. Stevenson. 2005. Eutrophication of Chesapeake Bay:historical trends and ecological interactions. Marine Ecology Progress Series303:1–29.
Kiljunen, M., J. Grey, T. Sinisalo, C. Harrod, H. Immonen, and R. I. Jones.2006. A revised model for lipid-normalizing delta C-13 values from aquaticorganisms, with implications for isotope mixing models. Journal of AppliedEcology 43:1213–1222.
Lankford, T. E., and T. E. Targett. 1997. Selective predation by juvenile weakfish:post-consumptive constraints on energy maximization and growth. Ecology(Washington, D.C.) 78:1049–1061.
Latour, R. J., M. J. Brush, and C. F. Bonzek. 2003. Toward ecosystem-basedfisheries management: strategies for multispecies modeling and associateddata requirements. Fisheries 28(9):10–22.
Latour, R. J., J. Gartland, C. F. Bonzek, and R. A. Johnson. 2008. The trophicdynamics of summer flounder (Paralichthys dentatus) in Chesapeake Bay.U.S. National Marine Fisheries Service Fishery Bulletin 106:47–57.
Link, J. S., K. Bolles, and C. G. Milliken. 2002. The feeding ecology of flatfishin the Northwest Atlantic. Journal of Northwest Atlantic Fishery Science30:1–17.
Litvin, S. Y., and M. P. Weinstein. 2003. Life history strategies of estuarine nek-ton: the role of marsh macrophytes, benthic microalgae, and phytoplanktonin the trophic spectrum. Estuaries 26:552–562.
MacNeil, M. A., K. G. Drouillard, and A. T. Fisk. 2006. Variable uptake andelimination of stable nitrogen isotopes between tissues in fish. CanadianJournal of Fisheries and Aquatic Sciences 63:345–353.
MacNeil, M. A., G. B. Skomal, and A. T. Fisk. 2005. Stable isotopes frommultiple tissues reveal diet switching in sharks. Marine Ecology ProgressSeries 302:199–206.
Malloy, K. D., and T. E. Targett. 1994. The use of RNA: DNA ratios to predictgrowth limitation of juvenile summer flounder (Paralichthys dentatus) fromDelaware and North Carolina estuaries. Marine Biology 118:367–375.
Martinez del Rio, C., N. Wolf, S. A. Carleton, and L. Z. Gannes. 2009. Isotopicecology ten years after a call for more laboratory experiments. BiologicalReviews 84:91–111.
McConnaughey, T., and C. P. McRoy. 1979. Food-web structure and the frac-tionation of carbon isotopes in the Bering Sea. Marine Biology 53:257–262.
McIntyre, J. K., D. A. Beauchamp, M. M. Mazur, and N. C. Overman. 2006.Ontogenetic trophic interactions and benthopelagic coupling in Lake Wash-ington: evidence from stable isotopes and diet analysis. Transactions of theAmerican Fisheries Society 135:1312–1328.
Montoya, J. P., S. G. Horrigan, and J. J. McCarthy. 1990. Natural abundance of15N in particulate nitrogen and zooplankton in the Chesapeake Bay. MarineEcology Progress Series 65:35–61.
Morse, W. W. 1981. Reproduction of the summer flounder, Paralichthys dentatus(L.). Journal of Fish Biology 19:189–203.
Murdy, E. O., R. S. Birdsong, and J. A. Musick. 1997. Fishes of ChesapeakeBay. Smithsonian Institution Press, Washington, D.C.
Nemerson, D. M., and K. W. Able. 2004. Spatial patterns in diet and distri-bution of juveniles of four fish species in Delaware Bay marsh creeks: fac-tors influencing fish abundance. Marine Ecology Progress Series 276:249–262.
O’Reilly, C. M., R. E. Hecky, A. S. Cohen, and P. D. Plisnier. 2002. Interpret-ing stable isotopes in food webs: recognizing the role of time averaging atdifferent trophic levels. Limnology and Oceanography 47:306–309.
Packer, D. B., S. J. Griesbach, P. L. Berrien, C. A. Zetlin, D. L. Johnson, andW. W. Morse. 1999. Essential fish habitat document: summer flounder, Par-alichthys dentatus, life history and habitat characteristics. NOAA TechnicalMemorandum NMFS-NE-151.
Pecquerie, L., R. M. Nisbet, R. Fablet, A. Lorrain, and S. A. L. M. Kooijman.2010. The impact of metabolism on stable isotope dynamics: a theoreticalframework. Philosophical Transactions of the Royal Society of London B365:3455–3468.
Perga, M. E., and D. Gerdeaux. 2005. ‘Are fish what they eat’ all year round?Oecologia (Heidelberg) 144:598–606.
Peterson, B. J., and B. Fry. 1987. Stable isotopes in ecosystem studies. AnnualReview of Ecology and Systematics 18:293–320.
Phillips, D. L., and J. W. Gregg. 2001. Uncertainty in source partitioning usingstable isotopes. Oecologia (Heidelberg) 127:171–179.
Phillips, D. L., S. D. Newsome, and J. W. Gregg. 2005. Combining sources instable isotope mixing models: alternative methods. Oecologia (Heidelberg)144:520–527.
Pinnegar, J. K., and N. V. C. Polunin. 1999. Differential fractionation of δ13Cand δ15N among fish tissues: implications for the study of trophic interac-tions. Functional Ecology 13:225–231.
Post, D. M. 2002. Using stable isotopes to estimate trophic position: mod-els, methods, and assumptions. Ecology (Washington, D.C.) 83:703–718.
Post, D. M., C. A. Layman, D. A. Arrington, G. Takimoto, J. Quattrochi, andC. G. Montana. 2007. Getting to the fat of the matter: models, methods andassumptions for dealing with lipids in stable isotope analyses. Oecologia(Heidelberg) 152:179–189.
Powell, A. B. 1982. Annulus formation on otoliths and growth of young summerflounder from Pamlico Sound, North Carolina. Transactions of the AmericanFisheries Society 111:688–693.
Rountree, R. A., and K. W. Able. 1992. Foraging habits, growth, and temporalpatterns of salt-marsh creek habitat use by young-of-year summer flounderin New Jersey. Transactions of the American Fisheries Society 121:765–776.
Scharf, F. S., F. Juanes, and R. A. Rountree. 2000. Predator size-prey sizerelationships of marine fish predators: interspecific variation and effects ofontogeny and body size on trophic-niche breadth. Marine Ecology ProgressSeries 208:229–248.
Sipe, A. M., and M. E. Chittenden. 2001. A comparison of calcified structuresfor aging summer flounder, Paralichthys dentatus. U.S. National MarineFisheries Service Fishery Bulletin 99:628–640.
Steimle, F. W., R. A. Pikanowski, D. G. McMillan, C. A. Zetlin, and S. J.Wilk. 2000. Demersal fish and American lobster diets in the lower Hudson-Raritan estuary, volume 161. National Marine Fisheries Service, Woods Hole,Massachusetts.
Stickney, R. R., G. L. Taylor, and D. B. White. 1975. Food habits of fivespecies of young southeastern United States estuarine Sciaenidae. ChesapeakeScience 16:104–114.
Sweeting, C. J., J. Barry, C. Barnes, N. V. C. Polunin, and S. Jennings. 2007.Effects of body size and environment on diet-tissue δ15N fractionation infishes. Journal of Experimental Marine Biology and Ecology 340:1–10.
Sweeting, C. J., N. V. C. Polunin, and S. Jennings. 2004. Tissue and fixativedependent shifts of δ13C and δ15N in preserved ecological material. RapidCommunications in Mass Spectrometry 18:2587–2592.
Szedlmayer, S. T., and K. W. Able. 1993. Ultrasonic telemetry of age-0 summerflounder, Paralichthys dentatus, movements in a southern New Jersey estuary.Copeia 1993:728–736.
Szedlmayer, S. T., K. W. Able, and R. A. Rountree. 1992. Growthand temperature-induced mortality of young-of-the-year summer flounder(Paralichthys dentatus) in southern New Jersey. Copeia 1992:120–128.
Terceiro, M. 2002. The summer flounder chronicles: science, politics, andlitigation, 1975–2000. Reviews in Fish Biology and Fisheries 11:125–168.
Dow
nloa
ded
by [
Col
lege
of
Will
iam
& M
ary]
at 0
6:20
22
Sept
embe
r 20
11

1254 BUCHHEISTER AND LATOUR
Trueman, C. N., R. A. R. McGill, and P. H. Guyard. 2005. The effect of growthrate on tissue-diet isotopic spacing in rapidly growing animals: an experi-mental study with Atlantic salmon (Salmo salar). Rapid Communications inMass Spectrometry 19:3239–3247.
Vander Zanden, M. J., and J. B. Rasmussen. 2001. Variation in delta N-15 anddelta C-13 trophic fractionation: implications for aquatic food web studies.Limnology and Oceanography 46:2061–2066.
Werner, E. E., and D. J. Hall. 1974. Optimal foraging and the size selection ofprey by the bluegill sunfish (Lepomis macrochirus). Ecology (Washington,D.C.) 55:1042–1052.
Zimmerman, A. R., and E. A. Canuel. 2001. Bulk organic matter and lipidbiomarker composition of Chesapeake Bay surficial sediments as indicatorsof environmental processes. Estuarine, Coastal, and Shelf Science 53:319–341.
Dow
nloa
ded
by [
Col
lege
of
Will
iam
& M
ary]
at 0
6:20
22
Sept
embe
r 20
11