tropical air mass advection and frontal instability …rrp.infim.ro/2009_61_1/art11georgescu.pdf ·...
TRANSCRIPT

Romanian Reports in Physics, Vol. 61, No. 1, P. 129–138, 2009
TROPICAL AIR MASS ADVECTION AND FRONTAL INSTABILITY IN SEVERE WEATHER EVENTS –
A CASE STUDY*
FLORINELA GEORGESCU, SIMONA TASCU, DOINA BANCIU,
National Meteorological Administration, Bucharest, Romania [email protected]
(Received July 2, 2008)
Abstract. The 2007 summer in Romania was characterized by unusually high frequency air mass advections of tropical origin over leading to extremely high temperature periods. These very hot periods were followed by short events of intense atmospheric instability. During the period 10-12th of July, the atmospheric instability covered the entire Romanian area. Heavy rain, strong winds and flash floods affected especially the eastern part of Romania.
The aim of this paper is to emphasize the characteristics of the tropical air mass invasions and to analyze the tropical air mass and frontal instability features for the above mentioned episode. Classical observations and remote sensing data together with global and limited area models output were used for the analysis of meteorological fields evolution mainly in upper and medium troposphere.
Key words: tropical air mass, doubled tropopause, atmospheric instability.
1. INTRODUCTION
The hot weather periods in Romania are associated to the tropical air mass advection, mainly from North Africa, the air mass water vapor content being enhanced by crossing the Mediterranean Sea. More seldom the tropical air mass is coming from the tropical Atlantic; the maritime air mass is getting gradually continental features by evolving over Europe.
One of the specific characteristics of the tropical air mass is the tropopause structure, which, during the time, was the subject of many studies, especially concerning the climatology of the tropical and subtropical zones.
There is a clear distinction between the height of the tropopause in the tropics (around 16 km), and that of the extra tropical tropopause, which is lower (usually between 8 and 12 km). In the Tropics the influence of the stratospheric circulation
* Paper presented at the Annual Scientific Conference, June 6, 2008, Faculty of Physics, Buc harest University, Romania.

Florinela Georgescu, Simona Tascu, Doina Banciu 2 130
is found to extend down at least as far as the main convective outflow level, some 5 km below the temperature minimum [1]. The extra-tropical tropopause features are related to the baroclinic wave dynamics [2, 3]. Haynes et al. [4] (2001) showed, by using a simple model, that a realistic extra tropical tropopause structure, marked by a strong change both in meteorological variables such as lapse rate and in transport characteristics, may be achieved solely through the stirring effects of baroclinic eddies acting against a smooth thermal relaxation. In the transition region, the tropopause is split and the subtropical jet stream seams to be associated with a second tropopause [5, 6]. There are also situations of multiple tropopauses, revealed by soundings [7]. Since 1937 [8], the multiple tropopauses have been studied, using especially research aircraft observations [9, 10]. In the last years, the tropopause is studied in relation with tropospheric O3 sources- local pollution, O3 associated with convection and lightning, stratosphere-troposphere exchange [11, 12] and even with climate change [13].
According to the definition of WMO [14], the first tropopause (i.e., the conventional tropopause) is defined as the lowest level at which the lapse rate decreases to 2 K/km or less, and the average lapse rate from this level to any level within the next higher 2 km does not exceed 2 K/km. If above the first tropopause the average lapse rate between any level and all higher levels within 1 km exceed 3 K/km, then a second tropopause is defined by the same criterion as under the statement above. This tropopause may be either within or above the 1 km layer.
For this paper, the severe weather period of 10–12 July 2007 over Romania was chosen to illustrate the specific evolution of the tropical air mass in the extra-tropical zone. The dynamics of the tropical air mass, subtropical jet and doubled tropopause were analyzed using all available observation data, global and limited area numerical prediction models. The study reveals the presence of two episodes with strong atmospheric instability: one within the tropical air mass (displaced far from the origin zone towards north) and the other associated to the replacement of the tropical air mass by polar air (frontal instability), which led to heavy rain, strong wind and flash floods.
2. DATA AND METHODS
All available observation data at the National Meteorological Administration (NMA) of Romania, like surface observation, radio soundings, radar and satellite data, have been used within the study. The water vapor satellite data were of big interest, the configuration of the cloud/humidity pattern in this channel being associated to the dynamical processes in the upper troposphere and even for low stratosphere [15] offering as well information about the nature of air masses and convective processes.

3 Severe weather events 131
The three dimensional atmospheric structure was completed by numerical prediction model output (analysis and forecasts). The large scale analysis was mainly based on the global model of the European Center of Medium Range Weather Forecast (ECMWF) [16] and the meso-scale analysis on the limited aria model ALADIN [17], operational at NMA since 1998 in the hydrostatic version. A large number of charts with model meteorological parameters (and derived ones) to standard pressure, model, and non standard (for instance 1.5 and 2 PVU, i.e. potential vorticity units) levels, and vertical cross sections on different locations have been used for the analysis of this case. Obviously the graphics presented in the paper represents a severe selection of the base material which was used.
3. SYNOPTIC AND MESO-SCALE ANALYSIS
The 2007 summer in Romania was characterized by hot weather. The maximum temperature exceeded often 40°C in the South and South-Eastern Romania, where a new absolute record for July was register (44.3°C at Calafat, on 24th of July). The periods with extremely high temperatures were followed by short periods with strong atmospheric instability.
By analyzing the hot periods one can notice a specific weather evolution pattern. There are distinguishable two types of atmospheric instability: one within the tropical air mass where convective meso-scale systems are generated and the frontal instability appearing when the tropical air mass is displaced. Often it is difficult to distinguish between the two types of instability, especially when the cold front is approaching.
The interval of 10–12th of July is typical for this weather pattern. On July 10, the medium and upper troposphere over Central Europe was
dominated by a short wave trough slowly moving eastwards while a warm ridge, extended up to the Baltic countries was covering the south-eastern part of Europe. At the 300-hPa level, the temperature and strong wind gradient area (Fig. 1, left side) on the ascending part of the trough were situated below the jet stream level, located around 200 hPa level.
The tropopause pressure distribution (Fig. 2) points out the presence of the tropical air mass over the south and southeastern part of the continent, with typical tropopause pressure values of 125–200 hPa over Romania aria.
The warm ridge of the tropical air mass over Romania is well marked also in the lower troposphere. One can notice the high values of wet bulb potential temperature on the analysis of the ALADIN model (Fig. 3). But the low-pressure field is not well organized. The small present cyclonic nuclei (Fig. 3) ahead of the Azores anticyclone (the ridge of the Azores anticyclone is represented on Fig. 3 by high mean level pressure values, west of Romania) could have, in the present context, a thermal causality.

Florinela Georgescu, Simona Tascu, Doina Banciu 4 132
Fig. 1 – ECMWF analysis of the geopotential height [damg] at 300 hPa level at 2008.07.10, 00 UTC
(left) and at 2008.07.12, 00 UTC (right).
Fig. 2 – Observed pressure [hPa] at tropopause level 2008.07.10, 00 UC.
Fig. 3 – ALADIN model analysis of the mean sea level pressure [hPa] (isolines) and wet bulb
potential temperature [°C] (fill color) for 2007.07.10, 12 UTC (left), 200707.11, 00 UTC (center) and 2007.07.12, 00 UTC. (right).The arrow of the central figure show the position of the vertical
cross section.

5 Severe weather events 133
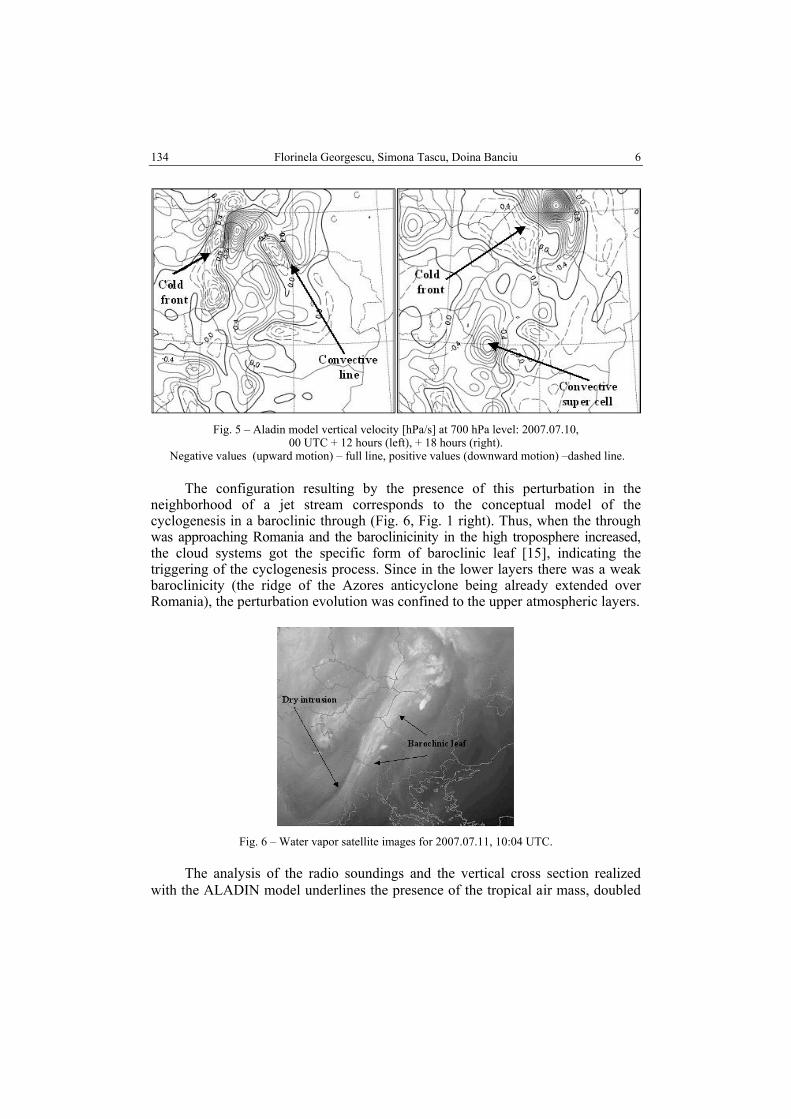
During the day of July 10, a strong atmospheric instability was manifested in the west, north and central part of Romania. The analysis of surface and upper air charts, of radio soundings and satellite images emphasizes the generation of a convective line, initially in the Northern Romania, ahead of the cold front advancing from Central Europe. Following the radar data, the top of cumulonimbus clouds reached and overtook the tropopause height. This interpretation is sustained by the water vapor satellite images (Fig. 4 left) and by the distribution of vertical velocity field at 700 hPa level (Fig. 5 left). Two marked pairs of negative (upward motion) / positive (downward motion) indicate the cold front and the convective line.
During the day, the cold front was blocked over the extreme west of Romania and the convective line extended towards southwest during the afternoon (Fig. 4 right and Fig. 5 right). A super convective cell was developed over the South Banat generating heavy rains, hail and wind gusts. Correspondingly on the vertical velocity field it was noticed a strong updraft (see Fig. 5 right). Step by step the cold front merged the convective line, the upper air cold through advancing behind it. The cold front displacement velocity was higher in the north part of the country, where the characteristics of the tropical air mass were less pronounced. Only in this area the pair of negative /positive velocity nuclei is still well marked (Fig. 5 right). Less marked pairs are visible indicating the re-generation of convective cells in the south edge of convective line.
As well, in Fig. 4 left, the black band, marked by a dashed line, behind the convective line is indicating the subtropical jet stream
As a consequence of the cold advection, on July 11, in the morning, a secondary cold front was generated west of Romania, which crossed the country within the next 18 hours. It is worth to notice that the upper air short wave through, approaching Romania became narrower and extended towards the Mediterranean Sea (Fig. 1 right). A cut-off was formed close to the west-northwest Romania.
Fig. 4 – Water vapor satellite images for 2007.07.10, 12:04 UTC (left),
2007.07.10, 17:51 UTC (right).
Florinela Georgescu, Simona Tascu, Doina Banciu 6 134
Fig. 5 – Aladin model vertical velocity [hPa/s] at 700 hPa level: 2007.07.10,
00 UTC + 12 hours (left), + 18 hours (right). Negative values (upward motion) – full line, positive values (downward motion) –dashed line.
The configuration resulting by the presence of this perturbation in the
neighborhood of a jet stream corresponds to the conceptual model of the cyclogenesis in a baroclinic through (Fig. 6, Fig. 1 right). Thus, when the through was approaching Romania and the baroclinicinity in the high troposphere increased, the cloud systems got the specific form of baroclinic leaf [15], indicating the triggering of the cyclogenesis process. Since in the lower layers there was a weak baroclinicity (the ridge of the Azores anticyclone being already extended over Romania), the perturbation evolution was confined to the upper atmospheric layers.
Fig. 6 – Water vapor satellite images for 2007.07.11, 10:04 UTC.
The analysis of the radio soundings and the vertical cross section realized with the ALADIN model underlines the presence of the tropical air mass, doubled

7 Severe weather events 135
tropopause and subtropical jet stream. Accordingly to the conceptual model of doubled tropopause [6] this appears near the subtropical jet stream, which is located above the lowest tropopause (and very close), while the second tropopause is situated much higher. Climatologically, the present structure is typical to subtropical areas, its presence at mid latitudes being a proof of tropical air masses at these latitudes during heat waves periods (Fig. 7).
Fig. 7 ALADIN model vertical cross section (temperature and wind) following the line marked on
figure 3 by an arrow (left side) centered on Bucharest and radio soundings at Bucharest (right side). The graphics are valid at 2007.07.11, 00 UTC (top) and 2007.07.12, 00 UTC (bottom).
For Bucharest location a comparison between the vertical cross section (following the line indicated by the arrow in Fig. 3) and the corresponding soundings has been carried out. There is a good concordance of the observed

Florinela Georgescu, Simona Tascu, Doina Banciu 8 136
heights of the tropopauses (first height tropopause – 12210 m, second tropopause –16650 m) and the position indicated by the relaxed temperature gradient on the Aladin model vertical cross sections. Just above the first tropopause there is a maximum wind velocity core (marked on Fig. 7 by a full line ellipse) that following the conceptual model is to be assimilated to the subtropical jet stream. A second maximum wind velocity core (marked on Fig. 7 by a dashed line ellipse) much more lower (about 3000 m) that could be associated to the convective phenomena generated by the cold front passage.
Fig. 8 – ALADIN model vertical cross section – potential vorticity [m2s-1Kkg-1] following the line
marked on Fig. 3 by an arrow (left side) centered on Bucharest: 2007.07.12, 00 UTC.
The same vertical cross section for potential vorticity shows the tropopause folding in the cold front neighborhood and the anomalies through the entire troposphere, supporting the development of the convective processes.
4. CONCLUSIONS
The analyzed period of 10-12th of July was characteristic for the 2007 summer in Romania, which was one of the warmest summers of the last decade, with many heat wave episodes.
During the study a specific summer instability scenario in the presence of the tropical air mass was revealed:
– Ahead of the cold front, a strong instability is developed in the persistent tropical air mass where meso-scale convective systems are generated. – When the front approaches Romania, the upper level dynamics indicate a strong baroclinicity, the presence of the subtropical jet stream and of the doubled tropopause. The jet is situated just above the lowest tropopause.

9 Severe weather events 137
– The tropical air mass instability is less and less distinguishable of the frontal one since the corresponding cloud systems have different displacement velocity. In the cold front neighborhood, the tropopause decay and the positive potential vorticity anomalies through the entire troposphere sustain the development of the convective processes. – The tropical air mass is gradually displaced, usually during night when the convective activity decreases. For the first time the presence and the structure of the subtropical jet stream
and associated doubled tropopause over Romania were analyzed using conceptual models and a limited area model. The upper level dynamics have been analyzed using conceptual models for the water vapor images patterns and thus the presence of the subtropical jet stream and the triggering of the upper level cyclogenesis process have been emphasized. Further detailed analysis was carried out with the help of the numerical weather prediction model. The Aladin model, which simulated well this situation, offered a consistent three-dimensional analysis and evolution of the meteorological fields at high resolution, contributing to the validation of the conceptual model (for instance the good agreement between the observed and simulated heights of the tropopauses as revealed by vertical cross sections).
The agreement between the observed patterns over Romania and the conceptual model of doubled tropopause, designed for Tropics, suggests that this model is also applicable for mid latitudes during the heat wave episodes.
The better understanding of this case could improve the operational weather forecast when a tropical air mass covers Romania. Further investigation of smaller scale phenomena is necessary for understanding the local forcing in the lower troposphere.
Acknowledgments. Many thanks to dr. Ion Draghici for useful discussions, observations on this paper and suggestions for necessary further investigation, especially in the meso-scale analysis direction.
REFERENCES
1. J. Thuburn and G. C. Craig, GCM tests of theories for the height of the tropopause, J. Atmos. Sci., 54, 869–882 (1997).
2. I. M. Held, On the Height of the Tropopause and the Static Stability of the Troposphere, J. Atmos. Sci., 39, 412–417 (1982).
3. P. A. Hirschberg and J.M. Fritsch, Tropopause Undulations and the Development of Extratropical Cyclones. Part II: Diagnostic Analysis and Conceptual Model., Mon. Wea. Rev., 119, 518–550 (1991).
4. P. Haynes, J. Scinocca, and M. Greenslade, Formation and Maintenance of the Extratropical Tropopause by Baroclinic Eddies, Geophys. Res. Lett., 28, 22, 4179–4182 (2001).
5. D. J. Seidel and W. J. Randel, Variability and trends in the global tropopause estimated from radiosonde data, J. Geophys. Res., 111, D21101, doi:10.1029/2006JD007363, 2006.

Florinela Georgescu, Simona Tascu, Doina Banciu 10 138
6. W. J. Randel, D.J. Seidel, L.L. Pan, Observational characteristics of double tropopauses, J. Geophys. Res., 112: DOI: 10.1029/2006JD007904, 2007.
7. T. Schmidt, G. Beyerle, S. Heise, J. Wickert, M. Rothacher, A climatology of multiple tropopauses derived from GPS radio occultations with CHAMP and SAC-C, Geophys. Res. Lett., 33, L04808, DOI: 10.1029/2005GL024600, 2006.
8. J. Bjerknes and E. Palmén, Investigations of selected European cyclones by means of serial ascents, Geophys. Publ., 12, 2, 1-62 (1937).
9. M. A. Shapiro, Further evidence of the mesoscale and turbulent structure of upper level jet stream –frontal zone systems, Mon. Weather Rev., 106, 1100–1110 (1978).
10. D. Keyser and M. A. Shapiro, A review of the structure and dynamics of upper-level frontal zones, Mon. Wea. Rev., 114, 452–499 (1986).
11. M.A. Thompson, J. E. Yorks, S. K. Miller, J. C. Witte, K. M. Dougherty, G. A. Morris, D. Baumgardner, L. Ladino, and B. Rappenglueck, Tropospheric ozone sources and wave activity over Mexico City and Houston during MILAGRO/Intercontinental Transport Experiment (INTEX-B) zonesonde Network Study, 2006 (IONS-06), Atmos. Chem. Phys. Discuss., 8, 5979–6007 (2008).
12. C. Varotsos, C. Cartalis, A. Vlamakis, C. Tzanis, and I. Keramitsoglou, The longterm coupling between column ozone and tropopause properties, J. Climate, 17, 3843–3854 (2004).
13. World Meteorological Organization, Scientific Assessment of Ozone Depletion: 2002. Global Ozone Research and Monitoring, Project Report, 47, 2003.
14. World Meteorological Organization, Meteorology - A three-dimensional science: Second session of the Commission for Aerology, WMO Bulletin, IV, 4, 134–138 (1957).
15. P. Santurette, C. Georgiev, Weather Analysis and Forecasting. Applying Satellite Water Vapor Imagery and Potential Vorticity Analysis, Elsevier Academic Press, Massachusetts, pp. 28–58, 2005.
16. *** http://www.ecmwf.int/research/ifs/ 17. *** http://www.cnrm.meteo.fr/aladin/