tropical cyclone hilda
TRANSCRIPT

Tropical Cyclone Hilda
26 – 29 December 2017
February 2018

Published by the Bureau of Meteorology
© Commonwealth of Australia 2019 This work is copyright. Apart from any use as permitted under the Copyright Act 1968, no part may be reproduced without prior written permission from the Bureau of Meteorology. Requests and inquiries concerning reproduction and rights should be addressed to the Communication Section, Bureau of Meteorology, GPO Box 1289, Melbourne 3001. Requests for reproduction of material from the Bureau website should be addressed to AMDISS, Bureau of Meteorology, at the same address.

i
Table of Contents
1 Summary ....................................................................................................................... 1
FIGURE 1. Best track of Hilda 26 – 29 December 2017 (times in AWST, UTC+8). ........ 2
2 Meteorological Description ............................................................................................. 3
2.1 Intensity analysis ................................................................................................ 3 2.2 Structure ............................................................................................................ 4 2.3 Motion ................................................................................................................ 4
3 Impact ............................................................................................................................ 5
4 Observations ................................................................................................................. 6
4.1 Wind ................................................................................................................... 6 4.2 Pressure ............................................................................................................ 6 4.3 Rainfall ............................................................................................................... 6
5 Forecast Performance ................................................................................................... 7
TABLE 1. Best track summary for Tropical Cyclone Hilda .............................................. 8 FIGURE 2. Tropical Cyclone Special Sensor Microwave Imager/Sounder (TCSSMIS)
pass at 0805 UTC 26 December 2017 during the early stages of Hilda’s development. ..................................................................................................... 9
FIGURE 3. AMSR2 image at 0448 UTC 27 December which shows significant development of the tropical cyclone had occurred over a 24 hour period. ........ 10
FIGURE 4 A plot of the accuracy figure for Hilda compared to the five year mean....... 11 FIGURE 5 Model guidance for Hilda, top left panel is ECMF, top right panel is GFS,
bottom left is Australian Community Climate and Earth-System Simulator Regional (ACCESS R), bottom right is Japan Meteorology Agency (JMA). The validity time for all panels is 0600 UTC 27 December....................................... 12


1
Tropical Cyclone Hilda was a very small tropical cyclone that, unusually, reached
tropical cyclone strength over land. A low was first identified between Browse and
Adele Islands,) to the north of the Dampier Peninsular, off the northwest Kimberley
coast, at 0000 Universal Time Co-ordinated (UTC) 26 December (0800 Australian
Western Standard Time (AWST) = UTC+8 hours. The low moved south and crossed
the Western Australian coastline near Cape Leveque at 1800 UTC 26 December. The
low reached tropical cyclone strength at 0600 UTC 26 December, while over land, and
passed very close to the town of Broome at 0900 UTC 26 December. Surface
observations indicated a peak 10-minute mean wind of 55 knots (kn) (102 kilometres
per hour (km/h)) was reached around this time. Hilda moved offshore for about 9 hours
(h) before crossing the coast just north of the community of Bidyadanga at around 1500
UTC 26 December. The tropical cyclone quickly weakened and dissipated inland.
A maximum 3-second wind gust of 71 kn (131 km/h) at 0957 UTC 27 December was
recorded at the Broome National Tidal Centre (NTC) Comparison Automatic Weather
Station (AWS). Some structural and vegetation damage was reported at both
Bidyadanga and at the Eco Beach resort as the system passed nearby. Minor
vegetation damage and felled trees were reported at Broome. More significant was the
rainfall that fell during this event. Heavy rainfall occurred along mainly coastal locations
of the northwest Kimberley coast with 24 hour totals of 292 millimetres (mm) at Cygnet
Bay (to 0900 AWST on 27 December) and 201 mm at Kilto Station (to 0900 AWST 28
December) recorded. Localised flooding was reported in Broome and road closures
due to water occurred throughout the western Kimberley, eastern Pilbara and the North
and South Interior districts.
1 Summary

2
FIGURE 1. Best track of Hilda 26 – 29 December 2017 (times in AWST, UTC+8).
3
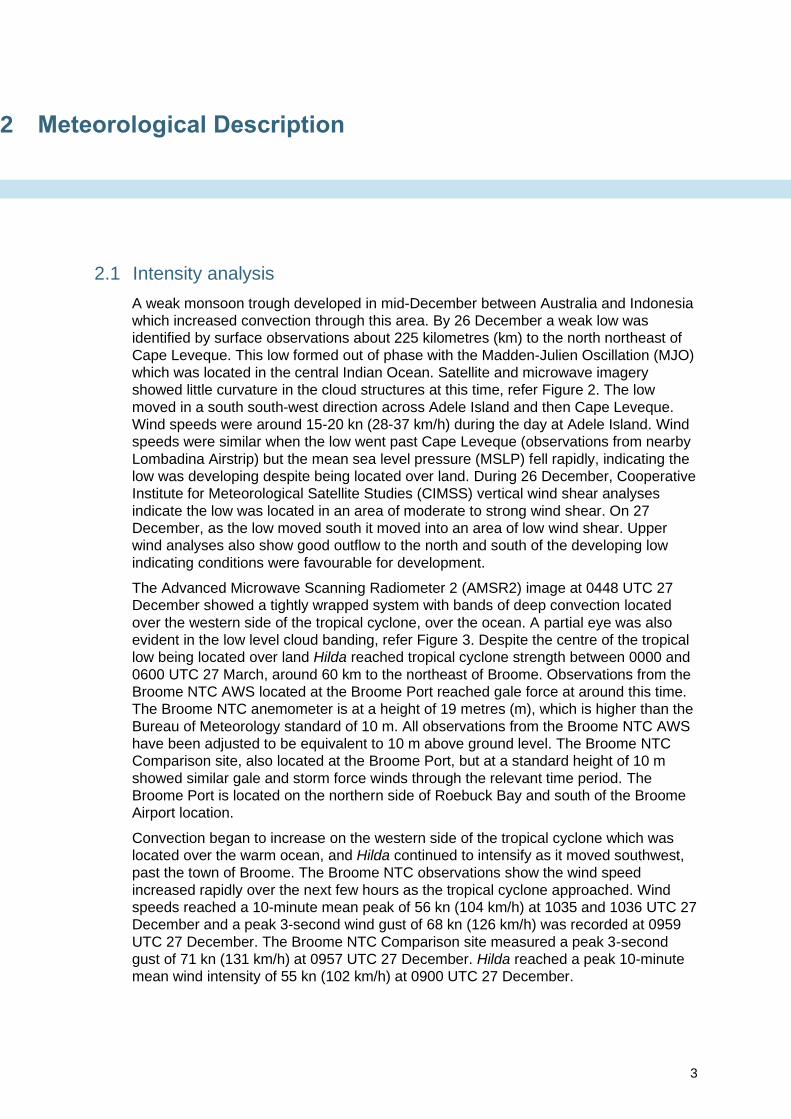
2.1 Intensity analysis
A weak monsoon trough developed in mid-December between Australia and Indonesia
which increased convection through this area. By 26 December a weak low was
identified by surface observations about 225 kilometres (km) to the north northeast of
Cape Leveque. This low formed out of phase with the Madden-Julien Oscillation (MJO)
which was located in the central Indian Ocean. Satellite and microwave imagery
showed little curvature in the cloud structures at this time, refer Figure 2. The low
moved in a south south-west direction across Adele Island and then Cape Leveque.
Wind speeds were around 15-20 kn (28-37 km/h) during the day at Adele Island. Wind
speeds were similar when the low went past Cape Leveque (observations from nearby
Lombadina Airstrip) but the mean sea level pressure (MSLP) fell rapidly, indicating the
low was developing despite being located over land. During 26 December, Cooperative
Institute for Meteorological Satellite Studies (CIMSS) vertical wind shear analyses
indicate the low was located in an area of moderate to strong wind shear. On 27
December, as the low moved south it moved into an area of low wind shear. Upper
wind analyses also show good outflow to the north and south of the developing low
indicating conditions were favourable for development.
The Advanced Microwave Scanning Radiometer 2 (AMSR2) image at 0448 UTC 27
December showed a tightly wrapped system with bands of deep convection located
over the western side of the tropical cyclone, over the ocean. A partial eye was also
evident in the low level cloud banding, refer Figure 3. Despite the centre of the tropical
low being located over land Hilda reached tropical cyclone strength between 0000 and
0600 UTC 27 March, around 60 km to the northeast of Broome. Observations from the
Broome NTC AWS located at the Broome Port reached gale force at around this time.
The Broome NTC anemometer is at a height of 19 metres (m), which is higher than the
Bureau of Meteorology standard of 10 m. All observations from the Broome NTC AWS
have been adjusted to be equivalent to 10 m above ground level. The Broome NTC
Comparison site, also located at the Broome Port, but at a standard height of 10 m
showed similar gale and storm force winds through the relevant time period. The
Broome Port is located on the northern side of Roebuck Bay and south of the Broome
Airport location.
Convection began to increase on the western side of the tropical cyclone which was
located over the warm ocean, and Hilda continued to intensify as it moved southwest,
past the town of Broome. The Broome NTC observations show the wind speed
increased rapidly over the next few hours as the tropical cyclone approached. Wind
speeds reached a 10-minute mean peak of 56 kn (104 km/h) at 1035 and 1036 UTC 27
December and a peak 3-second wind gust of 68 kn (126 km/h) was recorded at 0959
UTC 27 December. The Broome NTC Comparison site measured a peak 3-second
gust of 71 kn (131 km/h) at 0957 UTC 27 December. Hilda reached a peak 10-minute
mean wind intensity of 55 kn (102 km/h) at 0900 UTC 27 December.
2 Meteorological Description

4
Hilda continued to move on a southwest track across open water until it crossed the
coast just north of Bidyadanga around 1500 UTC 27 December. The radar signature
showed the tropical cyclone weakening and intensity was downgraded from 1200 UTC
27 December. Hilda continued along an inland path and weakened below tropical
cyclone strength by 0000 UC 28 December.
No objective intensity guidance was available during Hilda. Subjective Dvorak was also
not applicable due to land interaction.
2.2 Structure
Hilda was a very small tropical cyclone. The radius to gales was 35 nautical miles (nm)
(65 km) in the southwest quadrant decreasing down to 20 nm (37 km) in the northern
quadrants. The storm radii ranged from 10 nm (18 km) in the northern quadrants to 15
nm (28 km) in the southern quadrants. The radius to maximum wind (RMW) ranged
from 35 nm (65 km/h) in initial stages to 10 nm (18 km) at its most intense.
2.3 Motion
Hilda was steered in a generally southerly direction by the mid-level ridge to the east.
By the 28 December a mid-level trough located over the southern half of Western
Australia steered the remnants to the southeast.

5
Hilda did have an impact on the west Kimberley communities during its lifetime. The
town of Broome reported minor vegetation damage and felled trees. There was also
significant localised flooding in Broome due to heavy rainfall. Some structural damage
was reported from the Eco Beach Resort which is located along the southeast side of
Roebuck Bay, about 80 km north of Bidyadanga. The force of the winds forced pool
fencing through the restaurant windows. The community of Bidyadanga also reported
some structural damage but mostly tree damage and downed power lines.
Heavy rainfall occurred along mainly coastal locations of the northwest Kimberley coast
with 24 hour totals of 292 mm at Cygnet Bay (to 9am on 27 December) and 201 mm at
Kilto Station (to 9am 28 December) being recorded. Significant disruptions occurred
due to inundation of roads throughout the western Kimberley, eastern Pilbara and the
North and South Interior districts.
3 Impact
6
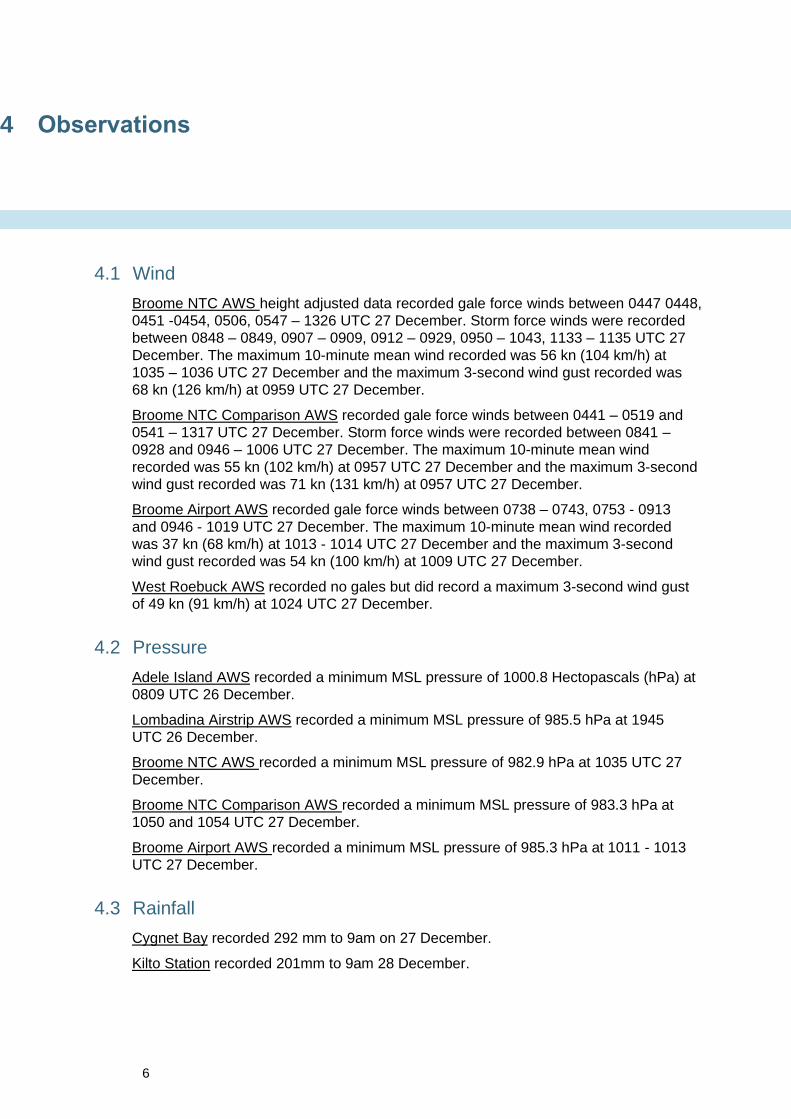
4.1 Wind
Broome NTC AWS height adjusted data recorded gale force winds between 0447 0448,
0451 -0454, 0506, 0547 – 1326 UTC 27 December. Storm force winds were recorded
between 0848 – 0849, 0907 – 0909, 0912 – 0929, 0950 – 1043, 1133 – 1135 UTC 27
December. The maximum 10-minute mean wind recorded was 56 kn (104 km/h) at
1035 – 1036 UTC 27 December and the maximum 3-second wind gust recorded was
68 kn (126 km/h) at 0959 UTC 27 December.
Broome NTC Comparison AWS recorded gale force winds between 0441 – 0519 and
0541 – 1317 UTC 27 December. Storm force winds were recorded between 0841 –
0928 and 0946 – 1006 UTC 27 December. The maximum 10-minute mean wind
recorded was 55 kn (102 km/h) at 0957 UTC 27 December and the maximum 3-second
wind gust recorded was 71 kn (131 km/h) at 0957 UTC 27 December.
Broome Airport AWS recorded gale force winds between 0738 – 0743, 0753 - 0913
and 0946 - 1019 UTC 27 December. The maximum 10-minute mean wind recorded
was 37 kn (68 km/h) at 1013 - 1014 UTC 27 December and the maximum 3-second
wind gust recorded was 54 kn (100 km/h) at 1009 UTC 27 December.
West Roebuck AWS recorded no gales but did record a maximum 3-second wind gust
of 49 kn (91 km/h) at 1024 UTC 27 December.
4.2 Pressure
Adele Island AWS recorded a minimum MSL pressure of 1000.8 Hectopascals (hPa) at
0809 UTC 26 December.
Lombadina Airstrip AWS recorded a minimum MSL pressure of 985.5 hPa at 1945
UTC 26 December.
Broome NTC AWS recorded a minimum MSL pressure of 982.9 hPa at 1035 UTC 27
December.
Broome NTC Comparison AWS recorded a minimum MSL pressure of 983.3 hPa at
1050 and 1054 UTC 27 December.
Broome Airport AWS recorded a minimum MSL pressure of 985.3 hPa at 1011 - 1013
UTC 27 December.
4.3 Rainfall
Cygnet Bay recorded 292 mm to 9am on 27 December.
Kilto Station recorded 201mm to 9am 28 December.
4 Observations
7
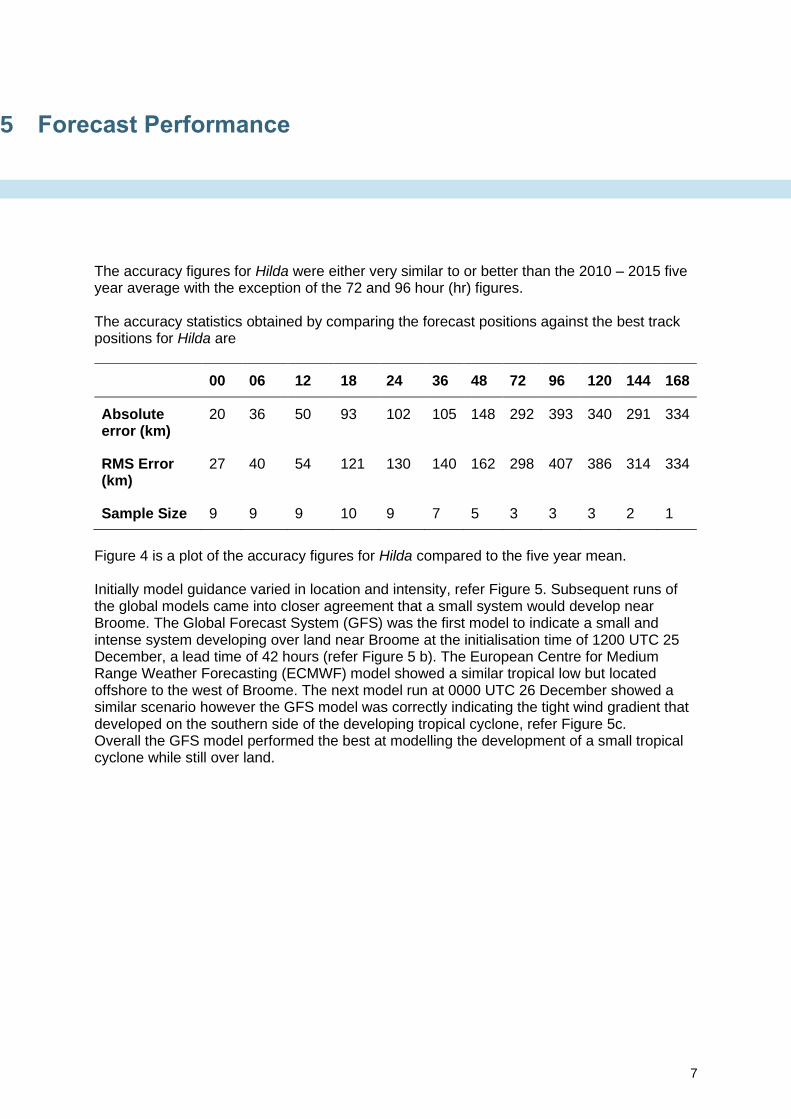
The accuracy figures for Hilda were either very similar to or better than the 2010 – 2015 five year average with the exception of the 72 and 96 hour (hr) figures. The accuracy statistics obtained by comparing the forecast positions against the best track positions for Hilda are
00 06 12 18 24 36 48 72 96 120 144 168
Absolute error (km)
20 36 50 93 102 105 148 292 393 340 291 334
RMS Error (km)
27 40 54 121 130 140 162 298 407 386 314 334
Sample Size 9 9 9 10 9 7 5 3 3 3 2 1
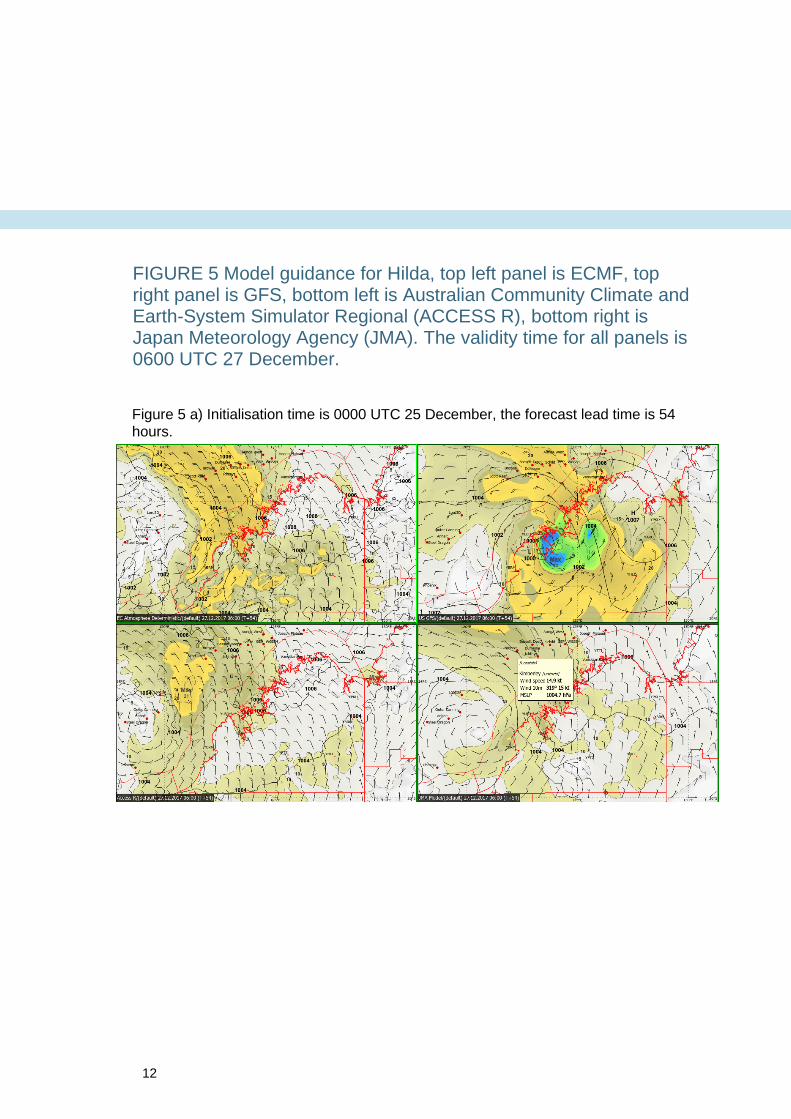
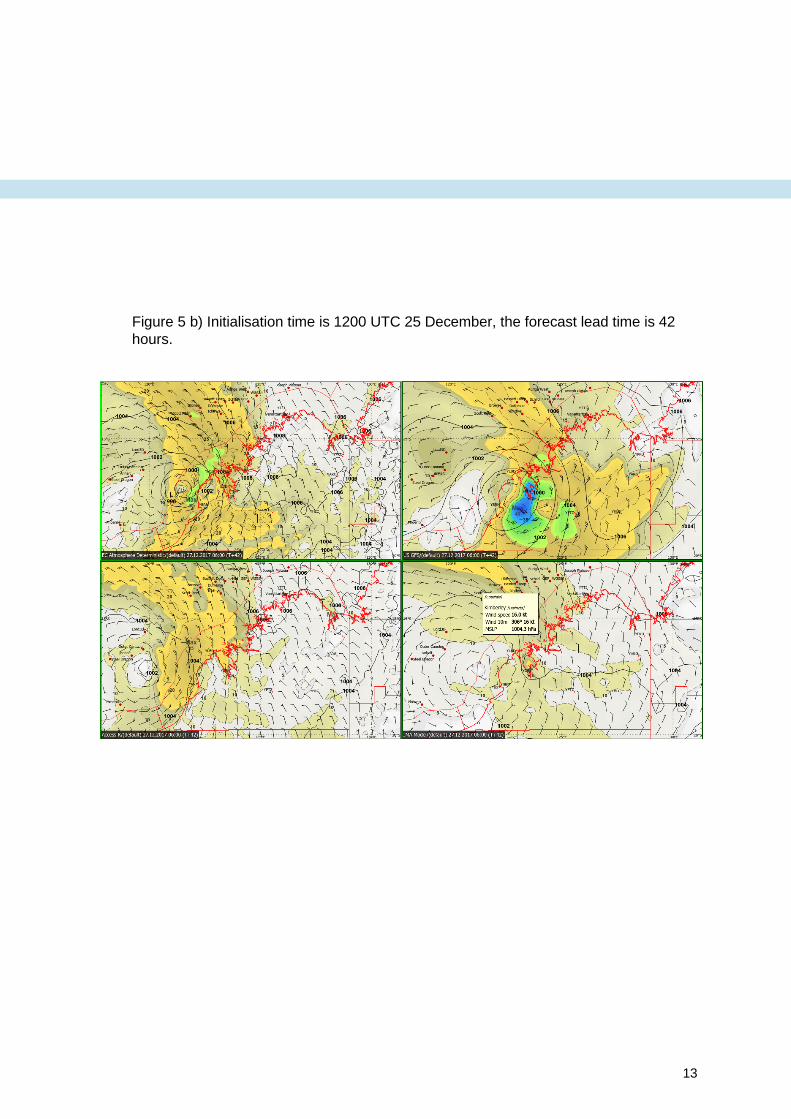
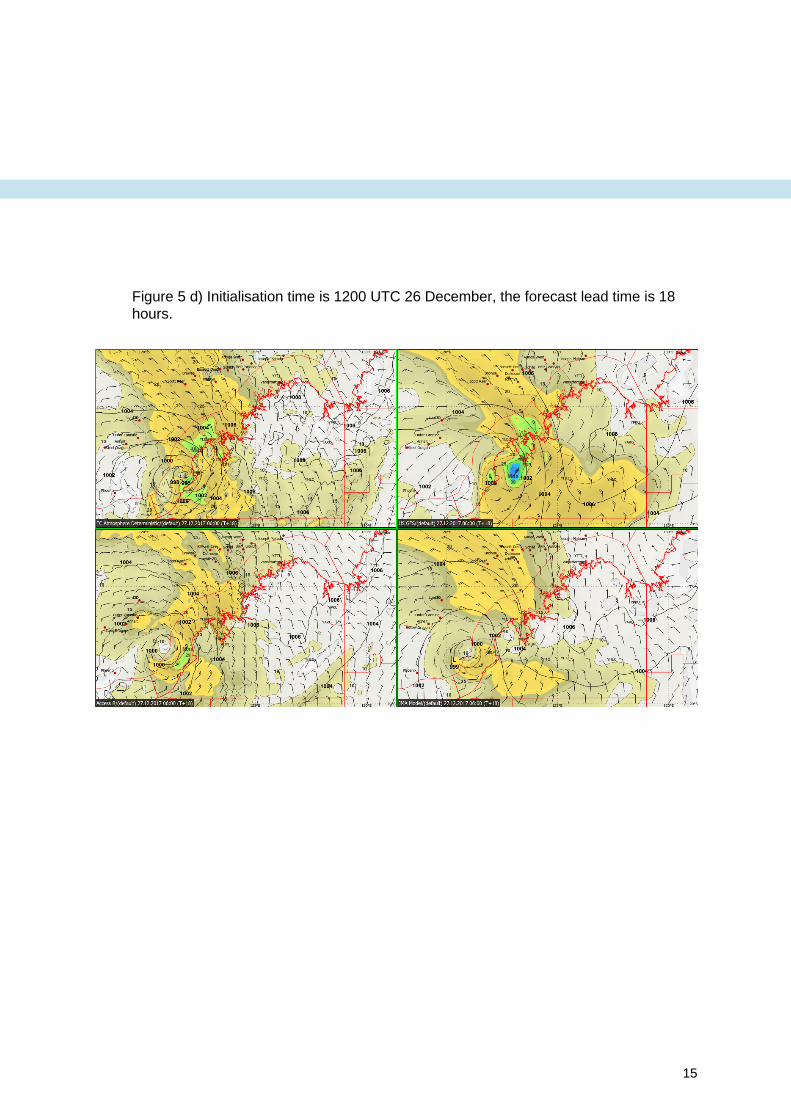
Figure 4 is a plot of the accuracy figures for Hilda compared to the five year mean. Initially model guidance varied in location and intensity, refer Figure 5. Subsequent runs of the global models came into closer agreement that a small system would develop near Broome. The Global Forecast System (GFS) was the first model to indicate a small and intense system developing over land near Broome at the initialisation time of 1200 UTC 25 December, a lead time of 42 hours (refer Figure 5 b). The European Centre for Medium Range Weather Forecasting (ECMWF) model showed a similar tropical low but located offshore to the west of Broome. The next model run at 0000 UTC 26 December showed a similar scenario however the GFS model was correctly indicating the tight wind gradient that developed on the southern side of the developing tropical cyclone, refer Figure 5c. Overall the GFS model performed the best at modelling the development of a small tropical cyclone while still over land.
5 Forecast Performance
8
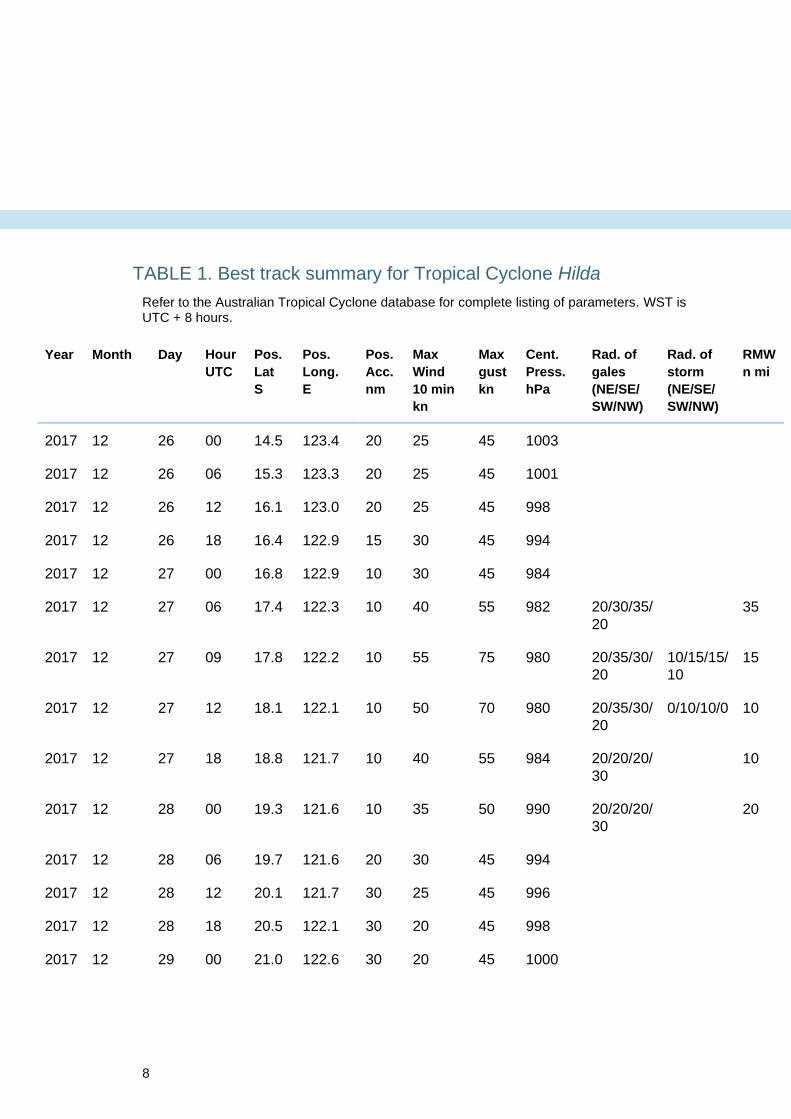
TABLE 1. Best track summary for Tropical Cyclone Hilda
Refer to the Australian Tropical Cyclone database for complete listing of parameters. WST is UTC + 8 hours.
Year Month Day Hour
UTC
Pos.
Lat
S
Pos.
Long.
E
Pos.
Acc.
nm
Max
Wind
10 min
kn
Max
gust
kn
Cent.
Press.
hPa
Rad. of
gales
(NE/SE/
SW/NW)
Rad. of
storm
(NE/SE/
SW/NW)
RMW
n mi
2017 12 26 00 14.5 123.4 20 25 45 1003
2017 12 26 06 15.3 123.3 20 25 45 1001
2017 12 26 12 16.1 123.0 20 25 45 998
2017 12 26 18 16.4 122.9 15 30 45 994
2017 12 27 00 16.8 122.9 10 30 45 984
2017 12 27 06 17.4 122.3 10 40 55 982 20/30/35/
20
35
2017 12 27 09 17.8 122.2 10 55 75 980 20/35/30/
20
10/15/15/
10
15
2017 12 27 12 18.1 122.1 10 50 70 980 20/35/30/
20
0/10/10/0 10
2017 12 27 18 18.8 121.7 10 40 55 984 20/20/20/
30
10
2017 12 28 00 19.3 121.6 10 35 50 990 20/20/20/
30
20
2017 12 28 06 19.7 121.6 20 30 45 994
2017 12 28 12 20.1 121.7 30 25 45 996
2017 12 28 18 20.5 122.1 30 20 45 998
2017 12 29 00 21.0 122.6 30 20 45 1000

9
FIGURE 2. Tropical Cyclone Special Sensor Microwave Imager/Sounder (TCSSMIS) pass at 0805 UTC 26 December 2017 during the early stages of Hilda’s development.
Image courtesy of https://manati.star.nesdis.noaa.gov/datasets/ASCATData.php

10
FIGURE 3. AMSR2 image at 0448 UTC 27 December which shows significant development of the tropical cyclone had occurred over a 24 hour period.

11
FIGURE 4 A plot of the accuracy figure for Hilda compared to the five year mean.
12
FIGURE 5 Model guidance for Hilda, top left panel is ECMF, top right panel is GFS, bottom left is Australian Community Climate and Earth-System Simulator Regional (ACCESS R), bottom right is Japan Meteorology Agency (JMA). The validity time for all panels is 0600 UTC 27 December.
Figure 5 a) Initialisation time is 0000 UTC 25 December, the forecast lead time is 54
hours.
13
Figure 5 b) Initialisation time is 1200 UTC 25 December, the forecast lead time is 42
hours.

14
Figure 5 c) Initialisation time is 0000 UTC 26 December, the forecast lead time is 30
hours.
15
Figure 5 d) Initialisation time is 1200 UTC 26 December, the forecast lead time is 18
hours.

16
Figure 5 e) Initialisation time is 0000 UTC 27 December, the forecast lead time is 6
hours.