tropical storm elsa open file report
TRANSCRIPT

Tropical Storm Elsa –Open File ReportSouth Carolina State Climatology OfficeReport Date: July 15, 2021Website: http://www.dnr.sc.gov/climate/sco
PRELIMINARYStorm History and Impacts ReportJune 7-8, 2021

Table of Contents
THIS REPORT SERVES AS A PRELIMINARY DISSEMINATION OF INFORMATION ON THE IMPACTS OF TROPICAL STORM ELSA ON
THE STATE OF SOUTH CAROLINA.
Dr. Hope MizzellState [email protected]
Ms. Melissa GriffinAsst. State [email protected]
Mr. Frank StraitSevere Weather [email protected]
Synoptic Analysis . . . . . . . . . . . . . . . . . . . . . . . .Rainfall Reports . . . . . . . . . . . . . . . . . . . . . . . . . Storm Surge. . . . . . . . . . . . . . . . . . . . . . . . . . . . .Wind Reports . . . . . . . . . . . . . . . . . . . . . . . . . . .Tornadoes . . . . . . . . . . . . . . . . . . . . . . . . . . . . .
Cover Picture Credit
This is True Color RGB imagery generated by the University of Wisconsin’s RealEarth website from GOES-16 satellite data of Tropical Storm Elsa at 9:30 a.m. on July 8, 2021, while the storm was centered over or near Richland County. Additional figures and pictures used throughout this report were retrieved from the National Hurricane Center, University of Wisconsin, National Weather Service Damage Assessment Tool and WeatherBELL Analytics, LLC.
FOR MORE DETAILED DATA, PLEASE CONTACT:
379
1011
Synoptic Analysis
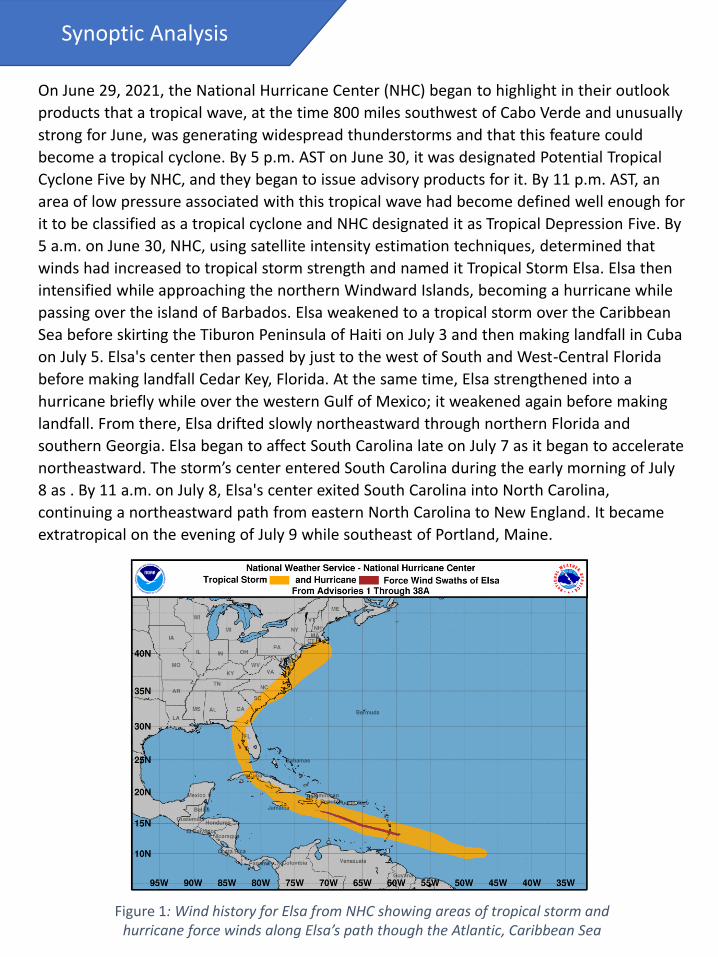
On June 29, 2021, the National Hurricane Center (NHC) began to highlight in their outlook
products that a tropical wave, at the time 800 miles southwest of Cabo Verde and unusually
strong for June, was generating widespread thunderstorms and that this feature could
become a tropical cyclone. By 5 p.m. AST on June 30, it was designated Potential Tropical
Cyclone Five by NHC, and they began to issue advisory products for it. By 11 p.m. AST, an
area of low pressure associated with this tropical wave had become defined well enough for
it to be classified as a tropical cyclone and NHC designated it as Tropical Depression Five. By
5 a.m. on June 30, NHC, using satellite intensity estimation techniques, determined that
winds had increased to tropical storm strength and named it Tropical Storm Elsa. Elsa then
intensified while approaching the northern Windward Islands, becoming a hurricane while
passing over the island of Barbados. Elsa weakened to a tropical storm over the Caribbean
Sea before skirting the Tiburon Peninsula of Haiti on July 3 and then making landfall in Cuba
on July 5. Elsa's center then passed by just to the west of South and West-Central Florida
before making landfall Cedar Key, Florida. At the same time, Elsa strengthened into a
hurricane briefly while over the western Gulf of Mexico; it weakened again before making
landfall. From there, Elsa drifted slowly northeastward through northern Florida and
southern Georgia. Elsa began to affect South Carolina late on July 7 as it began to accelerate
northeastward. The storm’s center entered South Carolina during the early morning of July
8 as . By 11 a.m. on July 8, Elsa's center exited South Carolina into North Carolina,
continuing a northeastward path from eastern North Carolina to New England. It became
extratropical on the evening of July 9 while southeast of Portland, Maine.
Figure 1: Wind history for Elsa from NHC showing areas of tropical storm and hurricane force winds along Elsa’s path though the Atlantic, Caribbean Sea

Several factors influenced Elsa during its life as a tropical cyclone. A strong upper-level ridge
predominantly steered Elsa over the western Atlantic ocean, which kept it on a southerly
track through the Caribbean and the Greater Antilles. An unseasonably strong and deep
upper trough was present over the eastern part of the United States as Elsa formed and
moved into the Caribbean. This feature weakened and lifted out ahead of Elsa's arrival in
the Greater Antilles but left enough of a weakness in the upper ridge behind for Elsa to track
more northward as it approached Cuba and then moved into the eastern Gulf of Mexico. A
new upper trough arrived in the Midwestern United States and around the Great Lakes on
July 6, which caused Elsa to turn more northeastward after landfall in northern Florida, then
carried Elsa northeastward across South Carolina and then toward New England.
Figure 2, top left: 500 millibar height analysis for 12Z July 2 showing the upper ridge steering Elsa (at the time near Barbados) westward and the unusually deep upper trough over the eastern United States.
Figure 3, top right: 500 millibar height analysis for 0Z July 6 (when Elsa was centered near western Cuba) showing a weakness in the upper ridge left behind by the departing trough.
Figure 4, bottom: 500 millibar height analysis for 12Z July 8 showing the new upper trough over the Great Lakes causing Elsa (at the time centered over South Carolina) to accelerate northeastward.
Synoptic Analysis

Elsa tracked across very warm waters along its entire path through the Atlantic, the
Caribbean Sea, and the Gulf of Mexico. Sea surface temperatures over the northern half of
the eastern and central Caribbean were near 28°C (82.4°F). Over the northwestern
Caribbean, the sea surface temperatures were around 29.5°C (85.1°F). Water temperatures
were near 29°C (84.2°F) in the southeastern Gulf of Mexico, but slightly cooler over the
northeastern Gulf of Mexico, near 28°C.
Synoptic Analysis
Figure 5, left: OSTIA sea surface temperature plot for 0Z June 30 (image from WeatherBELL)
Figure 6, right: OSTIA sea surface temperature plot for 0Z July 4 (image from WeatherBELL)
Elsa was in a low-shear environment when it traveled across the tropical Atlantic and the
Caribbean Sea. However, its rapid forward motion, 25-30 mph, hindered it from gaining
strength over the warm Caribbean waters. Shear increased as Elsa reached the
southeastern Gulf of Mexico due to strong westerly winds aloft in that area and this shear
was present until Elsa made landfall in Florida.
Figure 7, left: Shear analysis from 12Z July 6 (image from University of Wisconsin CIMSS)
Figure 8, right: Shear analysis from 12Z July 7 (image from University of Wisconsin CIMSS)

The Madden-Julian Oscillation (MJO), discovered in 1971 by researchers at the National
Center for Atmospheric Research, is well-known to modulate thunderstorms and tropical
cyclone activity in the world’s tropics. The location and intensity of the MJO's wave pattern
have proven to be useful in forecasting tropical cyclones. The pattern produces a dipole of
upward and downward motion which both cover large portions of the equatorial regions,
sometimes extending into the midlatitudes. This dipole typically drifts eastward at 15-20
mph. The MJO's cycle is divided into eight phases defined by the area of the world's tropics
where upward motion, favorable for widespread thunderstorm activity, is located. The
Atlantic basin is under favorable conditions for tropical thunderstorm activity and potential
tropical cyclone formation when the MJO is in Phases 8, 1, and 2.
When the tropical wave which gave rise to Elsa was crossing the Atlantic, the MJO was in
Phase 2 and close to reaching Phase 3. The intensity of the MJO pattern was also not
particularly strong at the time. The result was favorable conditions in the area where Elsa
formed and along the first part of Elsa's track. However, an unfavorable downward motion
area was encroaching on the western Caribbean Sea and the Gulf of Mexico at the time, and
Elsa moved into this area as it reached the central Caribbean Sea. This general area of
sinking air likely played a role in weakening Elsa as it passed south of Hispaniola and helped
to keep it from gaining much intensity as it crossed the Gulf of Mexico.
Synoptic Analysis
Figure 9: 200 hPa (millibar) level Velocity Potential Anomaly plotted by the Climate Prediction Center on June 30, showing upper divergence (green contours), corresponding to general rising motion, over Africa and much of the Atlantic Ocean. Elsa at the time was developing midway between Africa and the Lesser Antilles.
Figure 10: 200 hPa (millibar) level Velocity Potential Anomaly plotted by the Climate Prediction Center on July 5, showing upper convergence (brown contours), corresponding to general downward motion, over the Americas, Gulf of Mexico and Caribbean Sea. Elsa at the time was located just south of Cuba.

Rainfall Reports
StationStation
Type
Rainfall Total (in)
Beaufort 1.6 SSW CoCoRaHS 7.15
Green Pond 1.3 S CoCoRaHS 6.74
Bluffton 6.2 WNW CoCoRaHS 6.64
Beaufort 4.2 WSW CoCoRaHS 6.64
Bluffton 7.2 WNW CoCoRaHS 6.39
Bluffton 7.0 W CoCoRaHS 6.34
Charleston 2.5 WNW CoCoRaHS 6.18
The most significant impact from Elsa on
South Carolina was heavy rainfall. The
Lowcountry saw the heaviest rainfall,
with parts of Beaufort, Charleston, and
Colleton Counties receiving more than
six inches of rain. Three-inch or greater
rainfall was widespread over much of
the state's Coastal Plain. Rainfall from
Elsa was much less over the Midlands
and spotty over the Upstate. While
Elsa's rain set no records, minor flooding
was reported over parts of the
Lowcountry and Pee Dee.
Figure 11: Rainfall totals for July 7-9 across South Carolina, showing that the heaviest rainfall occurred over the Lowcountry and that widespread heavy rainfall of two inches or more occurred along the Coastal Plain.

Rainfall Reports
While Elsa's rainfall caused flooding in some areas, particularly along the coast, where it
coincided with high tide and the highest storm surge, some areas found the rain beneficial.
Parts of the state had been unusually dry in the weeks leading up to Elsa's arrival, and much
of the Pee Dee was still in a mild to moderate drought. The rain from Elsa was beneficial
from a drought standpoint in this area. Rainfall could also be considered helpful in the
northern Midlands and in the Upstate, which had also seen below-average rainfall in the
preceding 90 days leading up to Elsa's arrival.
Figure 12, top left: Rainfall departure for the previous 30-days ending July 6, 2021
Figure 13, top right: Rainfall departure for the previous 60-days ending July 6, 2021
Figure 14, bottom: Rainfall departure for the previous 90-days ending July 6, 2021

Storm Surge
Storm surge peaked at near 2 feet along the South Carolina coast. The small storm surge
combined with its occurrence near low tide in the Lowcountry resulted in few impacts along
the coast of the Lowcountry. The surge occurred near high tide along the Horry County coast;
however, the net effect was typical high astronomical high tide. There were numerous reports
of minor coastal flooding, but no significant coastal flooding was reported.
Figure 15: Observed (red) and predicted (blue) water levels at NOAA Tide Gauge 8665530, Charleston Cooper River Entrance, for July 7-8 (from NOAA Tides and Currents). Action Stage is 6.5 feet MLLW. Minor Flood Stage is 7.0 ft MLLW.
Figure 16: Observed (red) and predicted (blue) water levels at NOAA Tide Gauge 8661070, Springmaid Pier, for July 7-8 (from NOAA Tides and Currents). Action Stage is 7.0 feet MLLW and Minor Flood Stage is 7.5 feet MLLW.
Figure 17: Observed (red) and predicted (blue) water levels at NOAA Tide Gauge 8662245, North Inlet Estuary, for July 7-8 (from NOAA Tides and Currents). Action Stage is 7 feet MLLW.

Wind Reports
The Calibogue Sound WeatherFlow station is situated on a channel marker located in the entrance to Calibogue Sound. The Capers Nearshore Buoy is moored in a location about 5.5 miles southeast of Capers Island. The Fripp Nearshore Buoy is moored about 5.2 miles southeast of Fripp Island. The Murrell’s Inlet WeatherFlow station is situated on a channel marker located near the entrance to Murrell’s Inlet. All other wind reports are from land stations.
Location Peak Wind Gust (mph)
Date and Time (EDT)
Station Type
Calibogue Sound 81 11:13 p.m. July 7 WeatherFlow
Capers Nearshore Buoy 60 6:23 a.m. July 8 National Data Buoy Center
Myrtle Beach 54 6:24 a.m. July 8 National Weather Service
North Myrtle Beach 51 11:23 a.m. July 8 National Weather Service
MCAS Beaufort 51 2:47 a.m. July 8 National Weather Service
Beaufort 50 2:40 a.m. July 8 WeatherFlow
Fort Sumter 49 4:51 a.m. July 8 WeatherFlow
Fripp Nearshore Buoy 49 4:08 a.m. July 8 National Data Buoy Center
Murrells Inlet 49 9:23 a.m. July 8 WeatherFlow
Isle of Palms 48 5:41 a.m. July 8 WeatherFlow
Arthur Ravenel Bridge 48 5:15 a.m. July 8 SCDOT, MesoWest
Buoy 41008 47 10:50 p.m. July 7 National Weather Service
Charleston International Airport 47 2:03 a.m. July 8 National Weather Service
Florence Regional Airport 45 5:45 a.m. July 8 National Weather Service
Beaufort Executive Airport 44 3:15 a.m. July 8 National Weather Service
Hilton Head Island Airport 44 11:55 p.m. July 7 National Weather Service
Mount Pleasant Regional Airport 44 5:35 a.m. July 8 National Weather Service
Folly Island CMAN 43 5:00 a.m. July 8 National Data Buoy Center
Charleston Executive Airport 43 4:55 a.m. July 8 National Weather Service
Battery Point 42 4:24 a.m. July 8 WeatherFlow
Elsa generated tropical storm force winds along most of the South Carolina coast. The table
below summarizes the strongest wind gusts reported in South Carolina of 40 mph or greater.
Tornadoes
A total of five tornadoes spawned by Elsa were confirmed to have touched down in South
Carolina by National Weather Service storm survey teams on July 8. There was one in Beaufort
County, two in Charleston County, and one in Clarendon County. All the tornadoes were
relatively weak; there were four rated at EF-1 and one rated at EF-0.
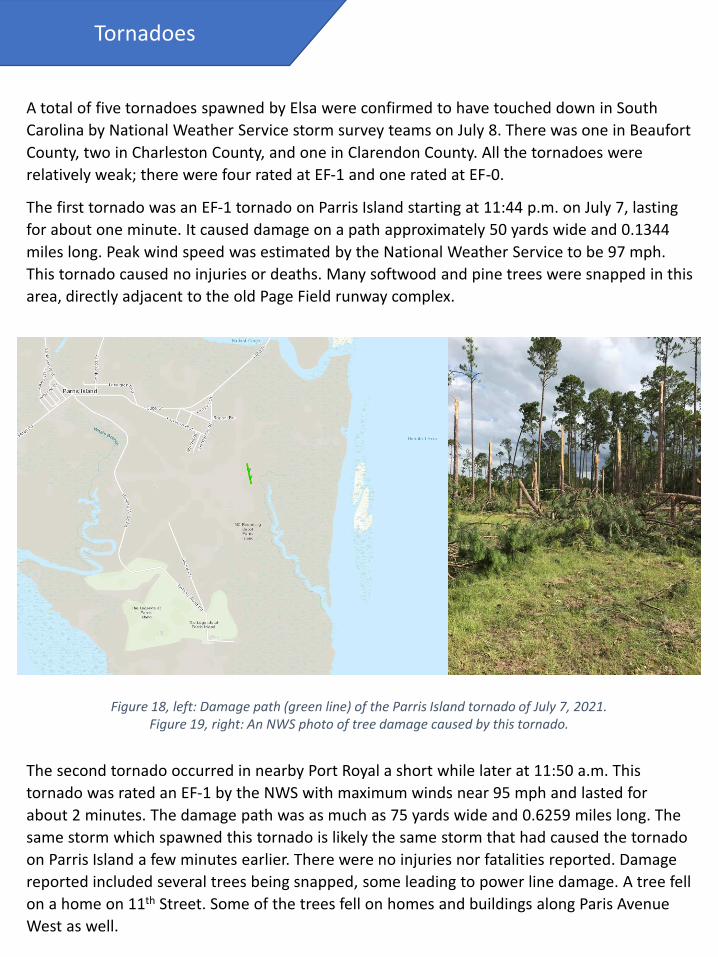
The first tornado was an EF-1 tornado on Parris Island starting at 11:44 p.m. on July 7, lasting
for about one minute. It caused damage on a path approximately 50 yards wide and 0.1344
miles long. Peak wind speed was estimated by the National Weather Service to be 97 mph.
This tornado caused no injuries or deaths. Many softwood and pine trees were snapped in this
area, directly adjacent to the old Page Field runway complex.
Figure 18, left: Damage path (green line) of the Parris Island tornado of July 7, 2021.Figure 19, right: An NWS photo of tree damage caused by this tornado.
The second tornado occurred in nearby Port Royal a short while later at 11:50 a.m. This
tornado was rated an EF-1 by the NWS with maximum winds near 95 mph and lasted for
about 2 minutes. The damage path was as much as 75 yards wide and 0.6259 miles long. The
same storm which spawned this tornado is likely the same storm that had caused the tornado
on Parris Island a few minutes earlier. There were no injuries nor fatalities reported. Damage
reported included several trees being snapped, some leading to power line damage. A tree fell
on a home on 11th Street. Some of the trees fell on homes and buildings along Paris Avenue
West as well.
Tornadoes
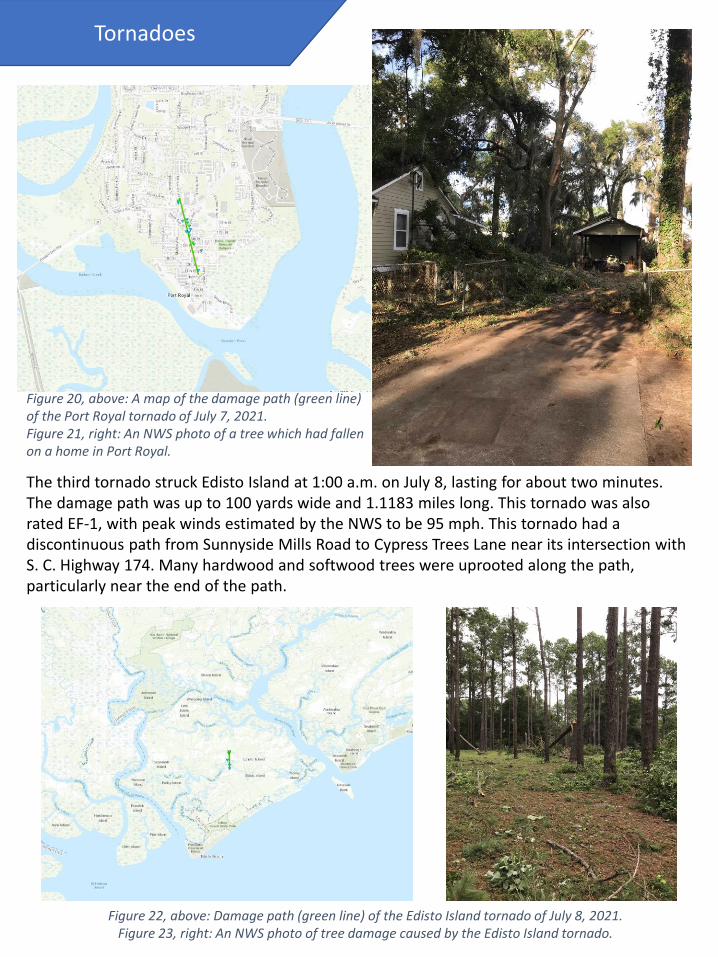
The third tornado struck Edisto Island at 1:00 a.m. on July 8, lasting for about two minutes. The damage path was up to 100 yards wide and 1.1183 miles long. This tornado was also rated EF-1, with peak winds estimated by the NWS to be 95 mph. This tornado had a discontinuous path from Sunnyside Mills Road to Cypress Trees Lane near its intersection with S. C. Highway 174. Many hardwood and softwood trees were uprooted along the path, particularly near the end of the path.
Figure 20, above: A map of the damage path (green line) of the Port Royal tornado of July 7, 2021.Figure 21, right: An NWS photo of a tree which had fallen on a home in Port Royal.
Figure 22, above: Damage path (green line) of the Edisto Island tornado of July 8, 2021.Figure 23, right: An NWS photo of tree damage caused by the Edisto Island tornado.
Tornadoes
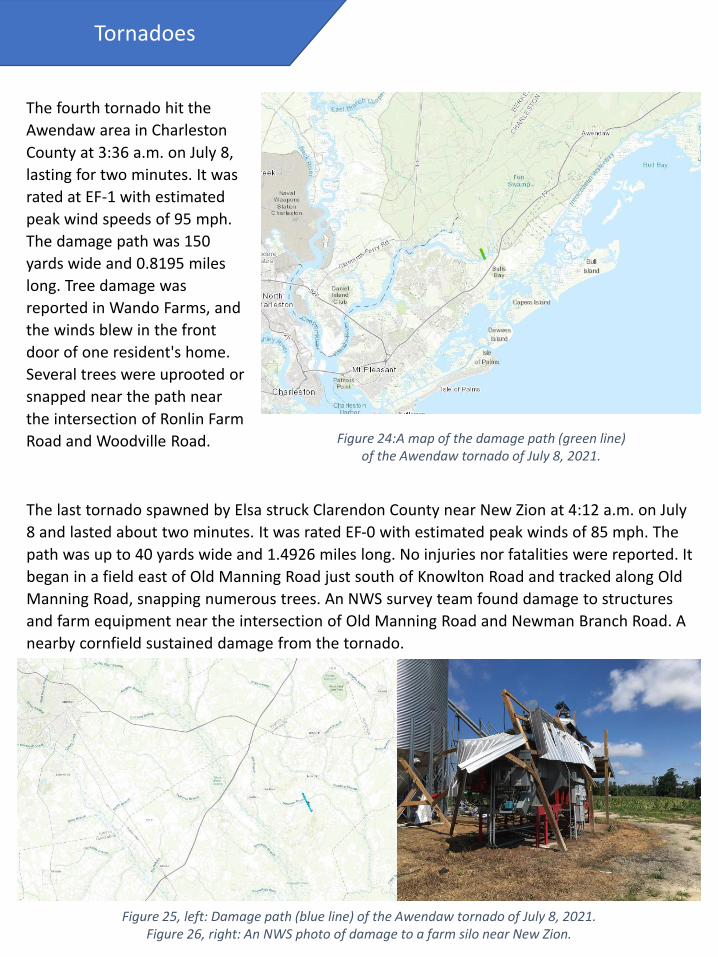
The fourth tornado hit the
Awendaw area in Charleston
County at 3:36 a.m. on July 8,
lasting for two minutes. It was
rated at EF-1 with estimated
peak wind speeds of 95 mph.
The damage path was 150
yards wide and 0.8195 miles
long. Tree damage was
reported in Wando Farms, and
the winds blew in the front
door of one resident's home.
Several trees were uprooted or
snapped near the path near
the intersection of Ronlin Farm
Road and Woodville Road. Figure 24:A map of the damage path (green line)of the Awendaw tornado of July 8, 2021.
The last tornado spawned by Elsa struck Clarendon County near New Zion at 4:12 a.m. on July
8 and lasted about two minutes. It was rated EF-0 with estimated peak winds of 85 mph. The
path was up to 40 yards wide and 1.4926 miles long. No injuries nor fatalities were reported. It
began in a field east of Old Manning Road just south of Knowlton Road and tracked along Old
Manning Road, snapping numerous trees. An NWS survey team found damage to structures
and farm equipment near the intersection of Old Manning Road and Newman Branch Road. A
nearby cornfield sustained damage from the tornado.
Figure 25, left: Damage path (blue line) of the Awendaw tornado of July 8, 2021.Figure 26, right: An NWS photo of damage to a farm silo near New Zion.