tropospheric ozone in louisiana and synoptic circulation · 1438 journal of applied meteorology...
TRANSCRIPT

1438 VOLUME 43J O U R N A L O F A P P L I E D M E T E O R O L O G Y
q 2004 American Meteorological Society
Tropospheric Ozone in Louisiana and Synoptic Circulation
ROBERT V. ROHLI AND MICHELLE M. RUSSO
Department of Geography and Anthropology, Louisiana State University, Baton Rouge, Louisiana
ANTHONY J. VEGA
Department of Anthropology, Geography, and Earth Sciences, Clarion University, Clarion, Pennsylvania
JOHN B. COLE
Animal Improvement Programs Laboratory, Beltsville, Maryland
(Manuscript received 11 September 2003, in final form 20 April 2004)
ABSTRACT
Tropospheric ozone (O3) is a pollutant of increasing concern in many urban areas in the United States. Thereis an increasing need to understand the geographical and meteorological properties associated with O3, particularlybecause of the changing criteria that are being implemented by the U.S. Environmental Protection Agency tomonitor O3. This research examines the relationship between O3 mixing ratios in Louisiana and surface andlow-tropospheric synoptic circulation patterns. Results suggest that local conditions and synoptic influences areboth important in determining the behavior of observed O3 in Louisiana during this period in which ‘‘exceedance’’frequencies decreased until 2000–01, at which time they increased again. Furthermore, the expected pattern ofsurface anticyclonic activity, low-tropospheric ridging, weak pressure gradients, and subsidence from the lowertroposphere is found to be associated with anomalously high O3, both at most local sites in the state and ondays with anomalously high O3 statewide. More surprising, however, is the tendency for high O3 to be associatedwith low surface pressure in the Great Plains, perhaps in advance of a midlatitude wave cyclone to the north.This and other surface patterns may be linked to advection from the southeastern Texas urban–industrial corridor.A temporally increasing tendency for surface and lower-tropospheric ridging over the 1994–2001 study periodprovides at least a partial explanation for the absence of a frequency decline in statewide anomalously highozone days during a time of increasing public awareness and concern for meeting the O3 standard.
1. Introduction
Tropospheric ozone (O3) is becoming a pollutant ofincreasing concern in many urban areas in the UnitedStates. Approximately 50 metropolitan areas in the Unit-ed States exceed the U.S. Environmental ProtectionAgency’s (EPA) primary standard of 125 parts per bil-lion (ppb) averaged over a 1-h period more than threetimes in any 3-yr period. Moreover, the number of met-ropolitan areas in nonattainment is increasing becauseas a metropolitan area is deemed to meet the standard,it becomes subjected to the new, generally more strin-gent standard of 85 ppb averaged over an 8-h period(Hsu et al. 2000). Because of the economic implicationsassociated with repeated noncompliance with these stan-dards, including reduced federal highway funding, re-quirements for the use of cleaner-burning fuels, and caps
Corresponding author address: Robert V. Rohli, Department ofGeography and Anthropology, Louisiana State University, BatonRouge, LA 70803-4105.E-mail: [email protected]
on industrial growth, local environmental and economicplanners have become increasingly interested in under-standing the factors that contribute to O3 ‘‘exceedances’’so that these federal clean-air standards can be met.
Baton Rouge, Louisiana, is one metropolitan area thatfails to meet the existing standard, despite exceedancefrequencies that generally decreased until 2000, atwhich time they increased again. In February of 2003,it was reclassified from the ‘‘serious’’ category into themore ominous ‘‘severe’’ category. Quantitative modelshave already been investigated for predicting O3 mixingratios in Baton Rouge (Rohli et al. 2003).
One phenomenon related to Louisiana O3 that has notyet been investigated completely, however, is the roleof advection. In specific terms, Louisiana officials claimthat advection may transport O3 from distant sourcessuch as the southeast Texas urban–industrial corridortoward sites in Louisiana. Such a phenomenon may sug-gest that O3 problems in Louisiana may not be solelythe result of local emission of the nitrogen oxides (NOx)that serve as precursor pollutants to O3, and such aphenomenon could have some impact on policy and

OCTOBER 2004 1439R O H L I E T A L .
alerting the public about imminent poor air quality.Modeling studies have recently been undertaken to as-sess the role of O3 transport (e.g., Barna and Lamb 2000;Jiang et al. 2003), but no formal synoptic approach hasinvestigated this phenomenon in Louisiana.
2. Purpose
The purpose of this research is to identify the rela-tionship between tropospheric O3 concentrations andsurface and low-tropospheric synoptic weather patternsin Louisiana. Additional analyses are undertaken toeliminate spurious nonmeteorological effects producedby local emissions, by considering separately the dayswith high mixing ratios statewide. Moreover, we areinterested in the effect of synoptic circulation through-out the year, even outside of the traditionally defined‘‘O3 season’’ of 1 May through 31 October. To be spe-cific, do unseasonably high tropospheric O3 mixing ra-tios recur under the same synoptic pattern(s)? Does this(these) pattern(s) advect O3 from other areas, particu-larly the urban–industrial corridor of southeastern Tex-as?
3. Literature
a. Ozone
Ozone is a photochemical oxidant formed from re-actions between NOx and hydrocarbons (HC) in thepresence of sunlight. Both of these precursor com-pounds result from automobile and industrial emissions,and HC also result from biogenic emissions. The com-plex interactions among NOx, HC, and a combinationof meteorological variables such as temperature, at-mospheric stability, incoming shortwave radiation, in-version height, and long-range transport determine thelocation, severity, and duration of a tropospheric O3
pollution event (Chock et al. 1982; Altshuller 1986;Seinfeld 1989; Comrie 1990). Because synoptic-scalecirculation affects all of the above meteorological fea-tures, this research seeks to identify the synoptic-scalecirculation patterns that influence O3 concentrations inLouisiana.
b. Ozone and synoptic-scale circulation
Synoptic climatology seeks to relate the atmosphericcirculation to an environmental variable using empiricaland statistical techniques (Yarnal 1993). Many studieshave examined the relationship between pollution, suchas O3, and synoptic-scale circulation in various regions(e.g., Chock et al. 1982; Altshuller 1986; Heidorn andYap 1986; Comrie 1990, 1992; Comrie and Yarnal 1992;McKendry 1994; McGregor and Bamzelis 1995; O’Hareand Wilby 1995; Leighton and Spark 1997; Shahge-danova et al. 1998; Greene et al. 1999; Lennartson andSchwartz 1999; Cheng and Lam 2000). Other studies
include other variables, such as temperature, wind, andradiation, in the forecasting, analysis, and classificationof high tropospheric O3 events (Ryan et al. 1992; Moodyet al. 1995; Ellis et al. 2000). Little research has beenconducted on synoptic circulation associated with O3
on the central Gulf Coast—a region that is affected fre-quently by ‘‘back of the high’’ extratropical anticyclonicactivity (Rohli and Henderson 1997) and Gulf of Mex-ico anticyclonic weather events (Muller 1977) and thuspossibly O3 advection. The most closely associatedcomprehensive synoptic climatological study conductedwas for Birmingham, Alabama (Greene et al. 1999).
c. Principal Components Analysis
One method of extracting the major modes of vari-ability in a dataset is through principal components anal-ysis (PCA). In PCA, each of the original variables isreplaced by a combination of principal components thatare linearly independent of each other and are orderedin the amount of variance they explain. The matrix ofloadings is used to quantify the correlations between theoriginal data and each component and is calculated as
0.5L 5 EL , (1)
where E is the matrix of eigenvectors and L representsthe eigenvalue matrix.
In analyses that include spatial and temporal obser-vations of the same variable, the spatial pattern of load-ings for each component identifies the geographical re-gions that are affected most directly by variability ex-plained by that component. Likewise, principal com-ponent scores are calculated to identify temporalrelationships between the original variables and the prin-cipal components. Thus, PCA can allow for the simul-taneous characterization of variability in a variableacross space and time.
Rotation of the principal components is necessary tominimize problems related to domain-shape dependence(Buell 1975, 1979; Legates 1991), subdomain instabil-ity, sampling, and inaccurate portrayal of the physicalrelationships in the input (Richman 1986) when PCAis used to identify the spatial mode of variability overa mapped surface (White et al. 1991; Yarnal 1993).Orthogonal rotation procedures maintain the ‘‘purity’’of each component identified by ensuring that the com-ponents remain uncorrelated with each other while stilloptimizing the explained variance among the set of re-tained components. Because of this preservation of or-thogonality among components, ‘‘varimax’’ is generallyconsidered to be an effective rotation scheme in map-pattern classification (Yarnal 1993) such as this analysis.Oblique rotation schemes are preferred for regionali-zations, for which shared variance among componentsis not as problematic (e.g., Fovell 1997; Comrie andGlenn 1998).

1440 VOLUME 43J O U R N A L O F A P P L I E D M E T E O R O L O G Y
FIG. 1. Ozone-monitoring sites in Louisiana.
4. Data and method
a. Tropospheric ozone
Hourly average O3 mixing ratio data were collectedby the Louisiana Department of Environmental Quality(LDEQ; M. Vanichchagorn 2001, personal communi-cation). These data consist of the set of 29 stations inLouisiana for which hourly tropospheric O3 mixing ra-tios are monitored for the 1995–2000 period (Fig. 1).Because of poor data coverage, LeBleau was eliminatedfrom consideration.
The procedures used to handle missing observationsfrom the LDEQ data are identical to those implementedby EPA for assessing compliance according to the mostupdated standard (U.S. Code of Federal Regulations Ti-tle 40, Part 50, Appendix I, Section 2.1: Data Reportingand Handling Conventions; available online at http://ecfr.gpoaccess.gov). To be specific, running 8-h aver-ages are computed from the hourly O3 mixing ratio datafor each hour of the year, with the resulting data storedin the first hour of the 8-h period. An 8-h mean is com-puted if at least six of the hourly averages of the 8-hperiod are available. For cases in which only six (orseven) hourly averages are reported, the 8-h mean iscomputed on the basis of the hours available, using six(or seven) as the divisor. A daily maximum 8-h mean
mixing ratio is computed based on the 24 8-h mixingratios and is considered to be valid if at least 18 of the24 8-h averages can be computed or if the daily max-imum 8-h average mixing ratio for that day is at least85 ppb (regardless of how many missing observationsare present). In accordance with EPA’s guidelines, anyday in which the above criterion is not met is still con-sidered to be valid if the maximum daily 8-h averagemixing ratio exceeds the standard. Data completenessat the 28 sites ranges from 90.3% (Grosse Tete) to 96.5%(Garyville) and averages 94.0%.
To eliminate short-term and seasonal variation in ab-solute O3 mixing ratios (Rao et al. 1997) to facilitatecomparison of O3 levels across the year, the daily peakO3 data are statistically standardized by month at eachsite. The result is a time series of daily z scores overthe 6-yr period for each site, calculated by subtractingthe mean daily peak O3 for that month from the dailyobservation and then dividing by the standard deviation.Thus, the mean z score for the set of approximately 180days in each of the 12 months is 0.0 and the standarddeviation is 1.0. Because this study also addresses un-seasonably high O3 days on the statewide scale (i.e.,regardless of whether a single local emission may haveproduced a local exceedance), it is important to identifya method for defining a ‘‘statewide anomalously high

OCTOBER 2004 1441R O H L I E T A L .
FIG. 2. Data points used in SLP, 850-hPa, and 700-hPa flowpattern analysis.
O3 day’’ (SAOD). Any day for which at least one-thirdof the available sites (28 possible) had a z score over2.0 (i.e., the upper 2.2% of the distribution) was con-sidered to be a SAOD.
b. Sea level pressure/Geopotential height data
Daily 1200 UTC sea level pressure (SLP) and 850-and 700-hPa geopotential height data were obtainedfrom the National Centers for Environmental Predic-tion’s 1977-point octagonal grid (University Corpora-tion for Atmospheric Research 2002). The purpose isto link synoptic-scale flow patterns with O3 mixing ra-tios in Louisiana. Even though the O3 data were onlyavailable for the 1995–2000 period, SLP–geopotentialheight data for 1994–2001 were included for this partof the analysis. The expanded dataset was used to pro-vide a sufficient number of observations by month toprovide a representative climatological description ofSLP and upper-level heights, which represents flow pat-terns from the surface to approximately 3 km. A totalof 49 days were missing from the dataset, yielding ananalysis of 2873 daily maps at each of the three levels,while peak O3 mixing ratio data were available for amaximum of 2192 days [365 days 3 6 years (1995–2000) plus two leap-year days].
The spatial domain is bounded by 158–458N and1058–658W, resulting in an extraction of 141 data pointsfrom the 1977-point grid for each of the three levels(Fig. 2). The domain was selected so that the pressurefield is centered on Louisiana and is sufficiently largeto detect synoptic-scale variability associated with theBermuda high on the east while still avoiding the highelevations (and, therefore, ‘‘upper level’’ data that ac-tually represent the near-surface atmosphere) of themountain cordillera of western North America. Thenorthern and southern boundaries of the study regionwere selected to facilitate the depiction of pressure var-
iability associated with both midlatitude wave cyclones(in the north) and tropical disturbances (in the south).
The SLP–geopotential height data were statisticallystandardized by month to eliminate their natural vari-ability through the course of the year and to facilitatetheir comparison across space and time with the stan-dardized O3 data. PCA was run on this standardizeddataset for SLP (and in separate analyses, also for 850-and 700-hPa geopotential heights) to identify the modesof variability across the study region. In all three da-tasets, varimax rotation of principal components wasperformed to eliminate spurious spatial patterns of SLP/geopotential height across the study area. The spatialpattern and sign of loadings were used as an indicatorof the pressure fields that explain the most daily SLP–geopotential height variability in the study region.
For each daily dataset, temporal trends in SLP–geo-potential height values (represented by the scores ma-trix) were identified, because temporal changes in pres-sure and height values may represent long-term changesin flow patterns (which in turn may affect O3 concen-trations). For this analysis, simple linear tests for trendin observations [numbered sequentially from 1 (1 Jan-uary 1994) through 2922 (31 December 2001) vs rotatedPCA score by component] were conducted for each da-taset. The standardized daily 8-h peak O3 mixing ratiowas then correlated with the daily varimax-rotated PCAscore for the components retained after rotation.
For all SAODs identified, a composite map of thepressure–geopotential height field was produced foreach of the three synoptic levels. This analysis providesa snapshot of the synoptic circulation exclusively duringanomalously high O3 days rather than during all days,as was provided by the spatial pattern of loadings. Fur-thermore, mean PCA-generated scores on the SAODswere calculated at each level. The spatial pattern ofloadings for those components whose scores show thehighest departures from zero are those associated mostdirectly with a SAOD.
5. Results and discussion
a. Characteristics of daily peak 8-h O3 mixing ratios
Each of the 28 stations has daily peak 8-h O3 mixingratios that correlate significantly with those at everyother station. A total of 48 days from the 1995–2000period were found to have O3 mixing ratios exceeding2.0 std dev above the mean for that month at one-thirdof the available sites in the state. Each month of theyear is represented in this SAOD dataset.
b. Sea level pressure patterns
1) ALL DAYS
Examination of a scree plot (Cattell 1966) of the ei-genvalues in the initial PCA procedure and a prioriknowledge of the number of major modes of variability

1442 VOLUME 43J O U R N A L O F A P P L I E D M E T E O R O L O G Y
in surface atmospheric circulation suggest that six com-ponents, collectively explaining 85.9% of the datasetvariance, should be retained for rotation. As expectedin an orthogonal rotation procedure such as varimax,components are uncorrelated with one another. The spa-tial pattern of loadings for each of the six retained com-ponents is shown in Figs. 3a–f. Component 1 showsmaximum explained variance in the southwestern partof the study area, over the Bay of Campeche. This resultis somewhat surprising, but perhaps only because fewstudies have concentrated on variability in a similarstudy domain as that employed here. Component 2 iden-tifies maximum loadings in the Caribbean, perhaps as-sociated with the Bermuda high. This pattern has beenidentified previously for a similar study area (Vega1994). The third component shows a pattern of highestloadings in the western Atlantic Ocean with a secondaryarea of opposite sign concentrated over the upper mid-western United States. The fourth component suggestsvariability over the Great Plains, and the fifth and sixthcomponents also identify specific regions of high var-iability over the eastern Great Lakes and Florida, re-spectively.
Scores for rotated component 1 are significantly (de-fined as probability a # 0.05) positively correlated tostandardized O3 mixing ratio at 25 of the 28 sites, withno relationship at the remaining 3 sites (Table 1). Thus,on days when an intense surface ridge exists over theBay of Campeche (Fig. 3a), O3 levels are high in Lou-isiana. Because this pattern explains the most variabilityin the dataset, it appears likely that many days may havesynoptic situations that could support high O3 in Lou-isiana. This pattern also appears reminiscent of the‘‘Gulf high’’ weather type (Muller 1977) and suggeststhat subsidence may trap locally generated O3, in par-ticular over southern Louisiana where most of the mon-itoring stations are located. Nevertheless, the spatial pat-tern also suggests circumstantially that synoptic-scaleadvection from the urban–industrial corridor of south-eastern Texas may also be a contributor to O3 problemsin Louisiana.
In addition, because scores for rotated component 1became more positive over time (a 5 0.0001), it isimportant to attempt to understand the physical mech-anisms behind this trend so that an assessment can bemade of whether this pattern might be expected to per-sist into the future. If so, the frequency of future ex-ceedances might be expected to increase in Louisiana.However, such an investigation is beyond the scope ofthis research. Nevertheless, note that with a standardi-zation approach such as that adopted here, even if theabsolute and mean concentrations decrease, the samenumber of days will have z scores above 2.0.
In contrast to the results from analysis of component1, O3 levels associated with component 2 appear to bedriven by local rather than synoptic advection. The pres-sure gradients depicted by the isolines of loadings areextremely weak across most of North America (Fig. 3b).
Moreover, significant relationships to O3 are found atall 28 sites, with 11 positive and 17 negative correla-tions. In general, positive relationships are found im-mediately north of urban and industrial areas, in par-ticular in the New Orleans–Baton Rouge and LakeCharles petrochemical corridors, and negative relation-ships are found on the southern and western sides ofurban and industrial areas. The results imply that slightbreezes from the Gulf of Mexico may cause local driftbut are not sufficiently strong to provide much synoptic-scale advection. Furthermore, component 2 is the onlypattern other than component 1 to show a temporal trendin scores, with a significant increase over time (a 50.0001). If such a trend were to persist into the future,it might change the distribution of stations that expe-rience exceedance days; stations south of urban and in-dustrial areas may experience fewer future exceedancedays in Louisiana.
Component 3 shows scores that are significantly neg-atively correlated with standardized O3 concentration atall 28 sites (Table 1). Thus, on days when SLP is anom-alously high over the western Atlantic (Fig. 3c), O3 isanomalously low over Louisiana. This pattern wouldplace Louisiana in a back-of-the-high synoptic situation,advecting O3 and its precursors from the urban and in-dustrial corridor of southeastern Louisiana northward(away from most of the monitoring sites) while the mon-itoring stations receive advection of relatively clean airfrom the Gulf of Mexico. Although component 2 alsosuggests return flow from the gulf, SLP gradients werevery slight in that pattern; thus, dilution of pollutantswas not as likely in the case of component 2 as it is forcomponent 3.
Scores for rotated component 4 (Fig. 3d) are signif-icantly negatively correlated with standardized O3 mix-ing ratio at 25 sites (Table 1). This relationship is easilyexplained at the synoptic scale, because the positivemode of variability depicted by the loadings pattern inFig. 3d would advect air from relatively sparsely pop-ulated and lesser-industrialized locations in Mississippiinto Louisiana. This pattern is associated with below-normal O3 levels throughout Louisiana. Few monitoringstations are located immediately southwest of majoremission areas, but even those that are, such as Carville,Convent, Port Allen, and Bayou Plaquemine, tend tohave significantly negative relationships between com-ponent-4 scores and O3 levels. The inverse flow patternsuggested by rotated component 4 would produce sur-face southwesterly winds in a relatively steep SLP gra-dient (and above-normal O3 mixing ratios) perhaps inadvance of an approaching midlatitude wave cyclone,reminiscent of the ‘‘frontal gulf return’’ weather type(Muller 1977). This pattern of meteorological conditionsis not normally associated with high O3 but it appearsto be important in Louisiana, possibly because of someO3 advection from the west. In general, it appears thatsynoptic influences on O3 may outweigh local factorsin this pattern.

OCTOBER 2004 1443R O H L I E T A L .
FIG. 3. Spatial pattern of loadings in rotated PCA based on monthly standardized daily SLPs: (a) component 1, (b) component 2, (c)component 3, (d) component 4, (e) component 5, and (f ) component 6.
1444 VOLUME 43J O U R N A L O F A P P L I E D M E T E O R O L O G Y
TABLE 1. Sites with significant correlations (a , 0.05) between standardized ozone mixing ratios and PCA-generated scores, 1995–2000.
SLP
1 2 3 4 5 6
850-hPa
1 2 3
700-hPa height
1 2 3
ArabiBakerBaton Rouge CapitolBaton Rouge Louisiana
State UniversityBayou Plaquemine
111
11
222
22
222
22
2
22
111
11
2
2
22
111
11
222
22
2
2
22
111
11
222
22
222
22
BentleyCarlyssCarvilleConventDixie
11111
22222
22222
22222
12
22222
11111
22222
22222
11111
22222
22222
DutchtownFrench SettlementGaryvilleGrosse TeteHahnville
11111
22222
22222
22222
2
222
11111
22222
22222
11111
22222
22222
KennerLafayetteMonroeMorgan CityNew Orleans
11
11
22111
22222
2222
1
2
22
11
11111
22222
22222
11111
22222
22222
New RoadsPort AllenPrideRagleyShreveport
1111
11111
22222
22222
222
1
2
11111
22222
2
222
11111
22222
22222
ThibodauxVintonWestlake
11
111
222
222
21
1 111
222
222
111
222
222
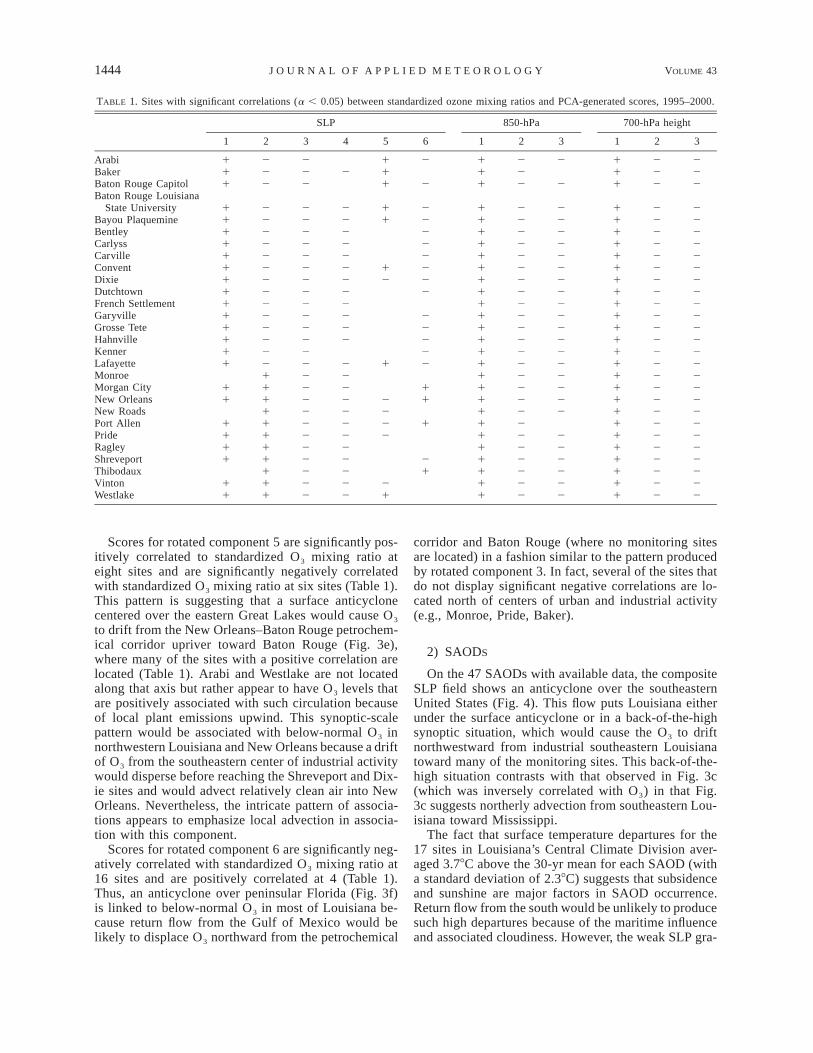
Scores for rotated component 5 are significantly pos-itively correlated to standardized O3 mixing ratio ateight sites and are significantly negatively correlatedwith standardized O3 mixing ratio at six sites (Table 1).This pattern is suggesting that a surface anticyclonecentered over the eastern Great Lakes would cause O3
to drift from the New Orleans–Baton Rouge petrochem-ical corridor upriver toward Baton Rouge (Fig. 3e),where many of the sites with a positive correlation arelocated (Table 1). Arabi and Westlake are not locatedalong that axis but rather appear to have O3 levels thatare positively associated with such circulation becauseof local plant emissions upwind. This synoptic-scalepattern would be associated with below-normal O3 innorthwestern Louisiana and New Orleans because a driftof O3 from the southeastern center of industrial activitywould disperse before reaching the Shreveport and Dix-ie sites and would advect relatively clean air into NewOrleans. Nevertheless, the intricate pattern of associa-tions appears to emphasize local advection in associa-tion with this component.
Scores for rotated component 6 are significantly neg-atively correlated with standardized O3 mixing ratio at16 sites and are positively correlated at 4 (Table 1).Thus, an anticyclone over peninsular Florida (Fig. 3f)is linked to below-normal O3 in most of Louisiana be-cause return flow from the Gulf of Mexico would belikely to displace O3 northward from the petrochemical
corridor and Baton Rouge (where no monitoring sitesare located) in a fashion similar to the pattern producedby rotated component 3. In fact, several of the sites thatdo not display significant negative correlations are lo-cated north of centers of urban and industrial activity(e.g., Monroe, Pride, Baker).
2) SAODS
On the 47 SAODs with available data, the compositeSLP field shows an anticyclone over the southeasternUnited States (Fig. 4). This flow puts Louisiana eitherunder the surface anticyclone or in a back-of-the-highsynoptic situation, which would cause the O3 to driftnorthwestward from industrial southeastern Louisianatoward many of the monitoring sites. This back-of-the-high situation contrasts with that observed in Fig. 3c(which was inversely correlated with O3) in that Fig.3c suggests northerly advection from southeastern Lou-isiana toward Mississippi.
The fact that surface temperature departures for the17 sites in Louisiana’s Central Climate Division aver-aged 3.78C above the 30-yr mean for each SAOD (witha standard deviation of 2.38C) suggests that subsidenceand sunshine are major factors in SAOD occurrence.Return flow from the south would be unlikely to producesuch high departures because of the maritime influenceand associated cloudiness. However, the weak SLP gra-

OCTOBER 2004 1445R O H L I E T A L .
FIG. 4. Composite SLP pattern on days with anomalously hightropospheric ozone mixing ratios across Louisiana.
TABLE 2. Mean rotated PCA-derived scores and T values on state-wide anomalously high ozone days in Louisiana, by component andlevel.
N Mean Std devT value
(one-sided test)
SLP component 1SLP component 2SLP component 3SLP component 4SLP component 5
4747474747
0.47620.27920.21620.303
0.057
0.9481.0460.8990.8810.865
3.443**21.829**21.647*22.358**
0.452SLP component 6850-hPa
component 1850-hPa
component 2850-hPa
component 3700-hPa
component 1
47
47
47
47
47
20.36
0.416
20.297
20.024
0.613
1.023
0.843
0.932
0.963
0.932
20.241
3.383**
22.185**
20.171
4.509**700-hPa
component 2700-hPa
component 3
47
47
20.384
20.038
0.954
0.909
22.670**
20.287
* Significantly different from the set of scores for all days in timeseries (mean m 5 0, std dev s 5 1.0) at a 5 0.10.
** Significantly different from the set of scores for all days in timeseries (m 5 0, s 5 1.0) at a 5 0.05.
dients across most of the study area on those days sug-gest that O3 drift from the southeast is occurring, butnot to the extent that it would produce a significant‘‘cleansing’’ effect from the Gulf of Mexico. Thus, itappears that both local and synoptic factors may con-tribute to O3 loadings on SAODs.
Because of the standardization process, the meanscore for all days in the time series on any componentis zero. However, the set of rotated PCA scores on theSAODs shows large departures from zero on compo-nents 1, 2, and 4 (a 5 0.05; Table 2), and 3 (a 5 0.10;Table 2). For all six components, the sign of departuressuggests that the same pattern of height anomalies thatis associated with high ozone at most sites for the ‘‘alldays’’ dataset is also linked to the SAODs. The strongestpositive association on SAODs is for component 1, sug-gesting that the presence of a surface anticyclone overthe western Gulf of Mexico and coincident ridge overthe Mississippi valley is linked most closely to anom-alously high O3 mixing ratios statewide. This patternshows that surface advection from the west may poten-tially be supporting such events. Nevertheless, the highvariability within these O3 days and the relatively smallsample of days included invite caution in the interpre-tation of results.
Likewise, synoptic situations dominated by low SLPover the Caribbean (component 2), the Great Plains(component 4), or possibly the mid-Atlantic region(component 3) are associated with SAODs. The resultfor component 4 is particularly interesting because min-imum mean scores on SAODs exist for component 4(Table 2) and because this is the pattern that is notusually considered to be important in contributing toexcessive O3 events. Thus, it seems possible that amechanism other than subsidence and clear skies as-sociated with extreme atmospheric stability may be re-sponsible for at least some of these SAODs. Such apattern supports the notion that advection of surface air
from the southeastern Texas industrial corridor relatesto high O3 in much of Louisiana.
When the SAODs are segregated by season (Figs. 5a–d), similar composite SLP patterns emerge as for thecomposite map of SLP shown in Fig. 4. Louisiana is ina gentle pressure gradient in a back-of-the-high synopticsituation that would produce drifting from the south orsoutheast; this situation would be associated with highO3 levels statewide. The winter and autumn synopticpatterns (Figs. 5a and 5d, respectively) appear to benearly identical to that shown in Fig. 4. Spring is alsosimilar (Fig. 5b), except that the high is larger and oc-cupies much of the eastern United States. Summer (Fig.5c) shows a weaker pressure gradient than the otherseasons. Of course, caution should be exercised in theinterpretation of these results, because of the low num-ber of SAODs used in the seasonal compositing pro-cedure (10 in winter, 11 in spring, and 13 each in sum-mer and autumn).
c. 850-hPa analysis
Three components that collectively explain 72.3% ofthe dataset variance were retained for varimax rotation.The first rotated component (Fig. 6a) identifies an in-tense ridge over the southern Great Plains, with pro-nounced upstream and downstream troughs over the At-lantic and Pacific coasts of the United States. The secondrotated component (Fig. 6b) shows a ridge over theCaribbean basin, with weak gradients over the north andwestern parts of the study area. Rotated component 3(Fig. 6c) depicts an intense ridge over the mid-Atlantic

1446 VOLUME 43J O U R N A L O F A P P L I E D M E T E O R O L O G Y
FIG. 5. As in Fig. 4, but by season: (a) winter (Dec–Feb; DJF), (b) spring (Mar–May; MAM), (c) summer (Jun–Aug; JJA), and (d)autumn (Sep–Nov; SON).
seaboard of the United States. The first and second com-ponents both show significantly increasing trends inscores over the 8-yr period. In addition, a near-signif-icant (a 5 0.057) positive trend in scores occurs forcomponent 3.
Standardized O3 levels are correlated significantlywith rotated PCA-generated scores at all 28 O3-moni-toring sites for the first two components (positively forthe first component and negatively for the second, at allsites, Table 1). Thus, 850-hPa ridges immediately westof Louisiana and over the Caribbean basin are linkedto above- and below-normal O3 levels, respectively. Thesignificant positive trends in these scores suggest thatmidcontinental ridging became a bigger contributor tothe O3 problem over time, because the increasing ten-dency for Caribbean ridging over time is linked to be-low-normal O3 across Louisiana. The nearly significanttemporal increase in scores for rotated component 3(which is associated with below-normal O3; Table 1) isalso notable. The midcontinental ridge seems to have
compensated for the other two circulation patterns thatwould have been operating to decrease the O3 mixingratios. Indeed, this midcontinental ridge has been linkedto historical drought events (Walsh et al. 1982; Keables1988; Groisman and Easterling 1994; Lettenmaier et al.1994; Chang and Smith 2001).
The composite 850-hPa geopotential height field dur-ing SAODs (Fig. 7) shows very weak height gradientsover the southern half of the study region, with a steepergradient in the northern half. The ridge axis is situatedalmost directly over Louisiana, with the surface anticy-clone appearing directly beneath the ridge-to-trough sideof the 850-hPa wave (Fig. 4). Thus, while the presenceof the 850-hPa ridge might suggest that subsidence isimportant, the strong vertical synoptic correlation mightalso suggest the importance of advection from the west.
Not surprising is that the significantly high positivescores for component 1 on SAODs (Table 2) confirmthat an intense midcontinental 850-hPa ridge is asso-ciated with anomalously high O3 mixing ratios across

OCTOBER 2004 1447R O H L I E T A L .
FIG. 6. Spatial pattern of rotated PCA loadings based on monthly standardized daily 850-hPa geopotential heights: (a) component 1, (b)component 2, and (c) component 3.
FIG. 7. Composite 850-hPa pattern on the days with anomalouslyhigh tropospheric ozone mixing ratios across Louisiana.
Louisiana. The second component shows significantlynegative scores for SAODs (Table 2), suggesting thatexcessive O3 days tend to be associated with below-normal height in the Caribbean (and associated ridgingover the midcontinent). Thus, the synoptic pattern con-tributing to SAODs is similar to that associated with O3
variability in general.When the composites are examined by season (Figs.
8a–d), Louisiana again appears under the ridge axis thatappears in the ‘‘all SAOD’’ composite (Fig. 7). In par-ticular, a closed isohypse exists near Louisiana in winterand over Louisiana in autumn (Figs. 8a and 8d, re-spectively), and spring shows a well-developed ridgeaxis over the state (Fig. 8b). Figure 8c suggests that anextension from the Atlantic subtropical anticycloneacross Louisiana is important on summer SAODs.
d. 700-hPa analysis
Three components were also retained for rotation atthis level, explaining 71.5% of the dataset variance. The

1448 VOLUME 43J O U R N A L O F A P P L I E D M E T E O R O L O G Y
FIG. 8. As in Fig. 7, but by season: (a) winter (DJF), (b) spring (MAM), (c) summer (JJA), and (d) autumn (SON).
spatial patterns of the loadings after varimax rotation aredepicted in Figs. 9a–c. The patterns are nearly identicalto those at the 850-hPa level. The first component againshows a very prominent ridge over the southern GreatPlains with troughs over western North American andthe western Atlantic basin. Component 2 is associatedwith anomalously high heights over the Caribbean andlow heights over the northern part of the study domain,suggesting zonal flow across the study area. The thirdcomponent reveals an intense ridge over the eastern Unit-ed States. The first and third components display signif-icantly increasing scores over the study period.
Standardized O3 mixing ratios show significant cor-relations to rotated PCA-generated scores for all three ofthe above patterns at all 28 sites in Louisiana (Table 1).Because O3 is correlated positively with the first patternand negatively with the third, it seems that the increasingprominence of these two patterns (revealed by their sig-nificantly increasing scores over time) resulted in theobserved number of high-O3 days throughout the studyperiod. In specific terms, the increasing prominence of
the pattern displayed in Fig. 9a created favorable con-ditions for high O3. However, that tendency may havebeen somewhat offset by the increasing prominence ofthe pattern displayed in Fig. 9c, which advected flowfrom the Gulf of Mexico and had a cleansing effect onthe atmosphere. From these patterns, it appears that 700-hPa flow from Texas directly contributes little O3 ad-vection toward Louisiana. However, the subsidence sug-gested by Louisiana’s position on the ridge-to-trough sideof the 700-hPa wave in Fig. 9a, combined with the near-surface advection from southeastern Texas suggested bythe vertical synoptic correlation at the three levels, mayexplain the O3 anomalies.
On SAODs, a very similar composite flow pattern tothat observed at 850-hPa occurs (Fig. 10). A prominentridge axis exists slightly west of the Mississippi River,with very weak height gradients south of Arkansas andmuch stronger gradients north of Arkansas. The firstcomponent again shows significantly positive meanscores on SAODs, and the second again shows signif-icantly negative scores (Table 2). Therefore, the 700-

OCTOBER 2004 1449R O H L I E T A L .
FIG. 9. Spatial pattern of rotated PCA loadings based on monthly standardized daily 700-hPa geopotential heights: (a) component 1, (b)component 2, and (c) component 3.
FIG. 10. Composite 700-hPa pattern on the days with anomalouslyhigh tropospheric ozone mixing ratios across Louisiana.
hPa analysis corroborates the results identified at the850-hPa level. Together, the surface, 850- and 700-hPapatterns suggest that both lower-tropospheric subsidenceand near–surface level advection from the west tend tobe present in SAODs.
As was the case for the 850-hPa level and the surface,the seasonal composites on SAODs (Figs. 11a–d) iden-tify synoptic features similar to that for the overall com-posite map (Fig. 10). As expected, a decrease in theisohypse gradient is apparent from the cold season tothe warm season. Thus, similar synoptic patterns onSAODs exist throughout the year, but the increased iso-hypse gradient in the cold season may contribute to agreater amount of advection from the west than duringthe high-sun season.
6. Summary and future work
This research investigated the role of synoptic andlocal circulations in contributing to tropospheric O3

1450 VOLUME 43J O U R N A L O F A P P L I E D M E T E O R O L O G Y
FIG. 11. As in Fig. 10, but by season: (a) winter (DJF), (b) spring (MAM), (c) summer (JJA), and (d) autumn (SON).
mixing ratios in Louisiana. Results suggest that cappinginversions/subsidence and, in some cases, surface syn-optic-scale advection from the west are important con-tributors to tropospheric O3 in Louisiana. Few majordifferences in the link between O3 anomalies and syn-optic patterns are identified between statewide anoma-lously high O3 days and other days. Although drift fromthe southeastern part of the state is relatively importantin contributing to SAODs, slight changes in the directionof drift from southeasterly to southerly can contributeto large differences in O3 mixing ratios. Persistent sur-face and lower-tropospheric ridging are probably themain reason that the frequency of SAODs did not de-cline over the 1994–2001 study period.
Future work must also analyze the role of persistenceof quasi-static weakly forced synoptic features onSAODs and consider an ‘‘environment to circulation’’approach (Yarnal 1993) to analyze differences withinSAODs. More specific, closer investigation of the dis-tinguishing meteorological features of the various typesof SAODs must be conducted, perhaps using objective
methods. Field measurement of the vertical profile ofO3 mixing ratios during meteorological conditions thatare not normally associated with high tropospheric O3
(such as sea level rotated component 4) would assist inidentifying the role of possible stratospheric–tropo-spheric exchange. In addition, more detailed time seriesanalysis could be employed to identify nonlinear trendsin PCA scores. Such an analysis might characterize therole of ENSO, the Pacific decadal oscillation, and otherlow-frequency teleconnections in pressure–geopotentialheight variability over the study area. However, the shorttime series of available data complicate such analysesat this time. Nevertheless, these and other analyseswould provide a greater understanding of the forcingmechanisms associated with such events and would af-ford environmental planners an advantage in formulat-ing policy designed to ensure that Louisiana complieswith federal O3 regulations.
Acknowledgments. The authors gratefully acknowl-edge the support of the Louisiana Board of Regents

OCTOBER 2004 1451R O H L I E T A L .
Research Competitiveness Subprogram [LEQSF (2001-04)-RD-A-09] and the cooperation of Brian Blanchard,S. A. Hsu, Michael McDaniel, and Manop Vanichcha-gorn in the completion of this research. We also thankClifford Duplechin for cartographic assistance and theanonymous reviewers for their helpful comments.
REFERENCES
Altshuller, A. P., 1986: The role of nitrogen oxides in non-urban ozoneformation in the planetary boundary layer over North America,West Europe and adjacent areas of the ocean. Atmos. Environ.,20, 245–268.
Barna, M., and B. Lamb, 2000: Improving ozone modeling in regionsof complex terrain using observational nudging in a prognosticmeteorological model. Atmos. Environ., 34, 4889–4906.
Buell, C. E., 1975: The topography of empirical orthogonal functions.Proc. Fourth Conf. on Probability and Statistics in AtmosphericScience, Tallahassee, FL, Amer. Meteor. Soc., 118.
——, 1979: On the physical interpretation of empirical orthogonalfunctions. Proc. Sixth Conf. on Probability and Statistics in At-mospheric Science, Boston, MA, Amer. Meteor. Soc., 112–117.
Cattell, R. B., 1966: The scree test for the number of factors. Mul-tivariate Behav. Res., 1, 245–276.
Chang, F. C., and E. A. Smith, 2001: Hydrological and dynamicalcharacteristics of summertime droughts over U.S. Great Plains.J. Climate, 14, 2296–2316.
Cheng, S. Q., and K. C. Lam, 2000: Synoptic typing and its appli-cation to the assessment of climatic impact on concentrations ofsulfur dioxide and nitrogen oxides in Hong Kong. Atmos. En-viron., 34, 585–594.
Chock, D. P., S. Kumar, and R. W. Herrmann, 1982: An analysis oftrends in oxidant air quality in the South Coast Air Basin ofCalifornia. Atmos. Environ., 16, 2615–2624.
Comrie, A. C., 1990: The climatology of surface ozone in rural areas:A conceptual model. Prog. Phys. Geogr., 14, 295–316.
——, 1992: An enhanced synoptic climatology of ozone using asequencing technique. Phys. Geogr., 13, 53–65.
——, and B. Yarnal, 1992: Relationships between synoptic-scale at-mospheric circulation and ozone concentrations in metropolitanPittsburgh, Pennsylvania. Atmos. Environ., 26B, 301–312.
——, and E. C. Glenn, 1998: Principal component-based regionali-zation of precipitation regimes across the southwest UnitedStates and northern Mexico, with an application to monsoonprecipitation variability. Climate Res., 10, 201–215.
Ellis, A. W., M. L. Hildebrandt, W. H. Thomas, and H. J. S. Fernando,2000: Analysis of the climatic mechanisms contributing to thesummertime transport of lower atmospheric ozone across met-ropolitan Phoenix, Arizona, USA. Climate Res., 15, 13–31.
Fovell, R. G., 1997: Consensus clustering of U.S. temperature andprecipitation data. J. Climate, 10, 1405–1427.
Greene, J. S., L. S. Kalkstein, H. Ye, and K. Smoyer, 1999: Rela-tionships between synoptic climatology and atmospheric pol-lution at 4 U.S. cities. Theor. Appl. Climatol., 62, 163–174.
Groisman, P. Y., and D. R. Easterling, 1994: Variability and trendsof total precipitation and snowfall over the United States andCanada. J. Climate, 7, 184–205.
Heidorn, K. C., and D. Yap, 1986: A synoptic climatology for surfaceozone concentrations in southern Ontario, 1976-1891. Atmos.Environ., 20, 695–703.
Hsu, S. A., B. W. Blanchard, J. M. Grymes, and R. V. Rohli, 2000:Development of short-range projection of the air quality indexfor the Baton Rouge area. Louisiana Department of Environ-mental Quality, 49 pp.
Jiang, G. F., B. Lamb, and H. Westberg, 2003: Using back trajectoriesand process analysis to investigate photochemical ozone pro-duction in the Puget Sound region. Atmos. Environ., 37, 1489–1502.
Keables, M. J., 1988: Spatial associations of midtropospheric cir-culation and upper Mississippi river basin hydrology. Ann. As-soc. Amer. Geogr., 78, 74–92.
Legates, D. R., 1991: The effect of domain shape on principal com-ponents analysis. Int. J. Climatol., 11, 135–146.
Leighton, R. M., and E. Spark, 1997: Relationship between synopticclimatology and pollution events in Sydney. Int. J. Biometeor.,41, 76–89.
Lennartson, G. J., and M. D. Schwartz, 1999: A synoptic climatologyof surface-level ozone in eastern Wisconsin, USA. Climate Res.,13, 207–220.
Lettenmaier, D. P., E. F. Wood, and J. R. Wallis, 1994: Hydro-cli-matological trends in the continental United States, 1948–88. J.Climate, 7, 586–607.
McGregor, G. R., and D. Bamzelis, 1995: Synoptic typing and itsapplication to the investigation of weather air-pollution rela-tionships, Birmingham, United Kingdom. Theor. Appl. Clima-tol., 51, 223–236.
McKendry, I. G., 1994: Synoptic circulation and summertime ground-level ozone concentrations at Vancouver, British Columbia. J.Appl. Meteor., 33, 627–641.
Moody, J. L., S. J. Oltmans, H. Levy, and J. T. Merrill, 1995: Transportclimatology of tropospheric ozone: Bermuda, 1988–1991. J.Geophys. Res., 100, 7179–7194.
Muller, R. A., 1977: A synoptic climatology for environmental base-line analysis: New Orleans. J. Appl. Meteor., 16, 20–33.
O’Hare, G. P., and R. Wilby, 1995: A review of ozone pollution inthe United Kingdom and Ireland with an analysis using Lambweather types. Geogr. J., 161, 1–20.
Rao, S. T., I. G. Zurbenko, R. Neagu, P. S. Porter, J. Y. Ku, and R.F. Henry, 1997: Space and time scales in ambient ozone data.Bull. Amer. Meteor. Soc., 78, 2153–2166.
Richman, M. B., 1986: Rotation of principal components. J. Cli-matol., 6, 293–335.
Rohli, R. V., and K. G. Henderson, 1997: Winter anticyclone changeson the central Gulf Coast of the U.S.A. Int. J. Climatol., 17,1183–1193.
——, S. A. Hsu, B. W. Blanchard, and R. L. Fontenant, 2003: Short-range prediction of tropospheric ozone concentrations and ex-ceedances for Baton Rouge, Louisiana. Wea. Forecasting, 18,371–383.
Ryan, W. F., R. R. Dickerson, G. J. Huffman, and W. T. Luke, 1992:Tropospheric chemistry over the lower Great Plains of the UnitedStates. 1. Meteorology. J. Geophys. Res., 97, 17 963–17 984.
Seinfeld, J. H., 1989: Urban air pollution: State of science. Science,243, 745–752.
Shahgedanova, M., T. P. Burt, and T. D. Davies, 1998: Synoptic cli-matology of air pollution in Moscow. Theor. Appl. Climatol.,61, 85–102.
University Corporation for Atmospheric Research, cited 2002: North-ern Hemisphere octagonal grid data. [Available online athttp://www.dss.ucar.edu.]
Vega, A. J., 1994: The influence of regional-scale circulation on pre-cipitation variability in the southern United States. Ph.D. dis-sertation, Louisiana State University, 280 pp.
Walsh, J. E., M. B. Richman, and D. W. Allen, 1982: Spatial coher-ence of monthly precipitation in the United States. Mon. Wea.Rev., 110, 272–286.
White, D., M. Richman, and B. Yarnal, 1991: Climate regionalizationand rotation of principal components. Int. J. Climatol., 11, 1–25.
Yarnal, B., 1993: Synoptic Climatology in Environmental Analysis:A Primer. Belhaven Press, 195 pp.
