troublemaker records - sas.com · [email protected] troublemaker records. flora fang liu....
TRANSCRIPT

Troublemaker Records• Flora Fang LiuToronto, Canada
SAS and all other SAS Institute Inc. product or service names are registered trademarks or trademarks of SAS Institute Inc. in the USA and other countries. ® indicates USA registration. Other brand and product names are trademarks of their respective companies.
Troublemaker RecordsFlora Fang LiuToronto, Canada
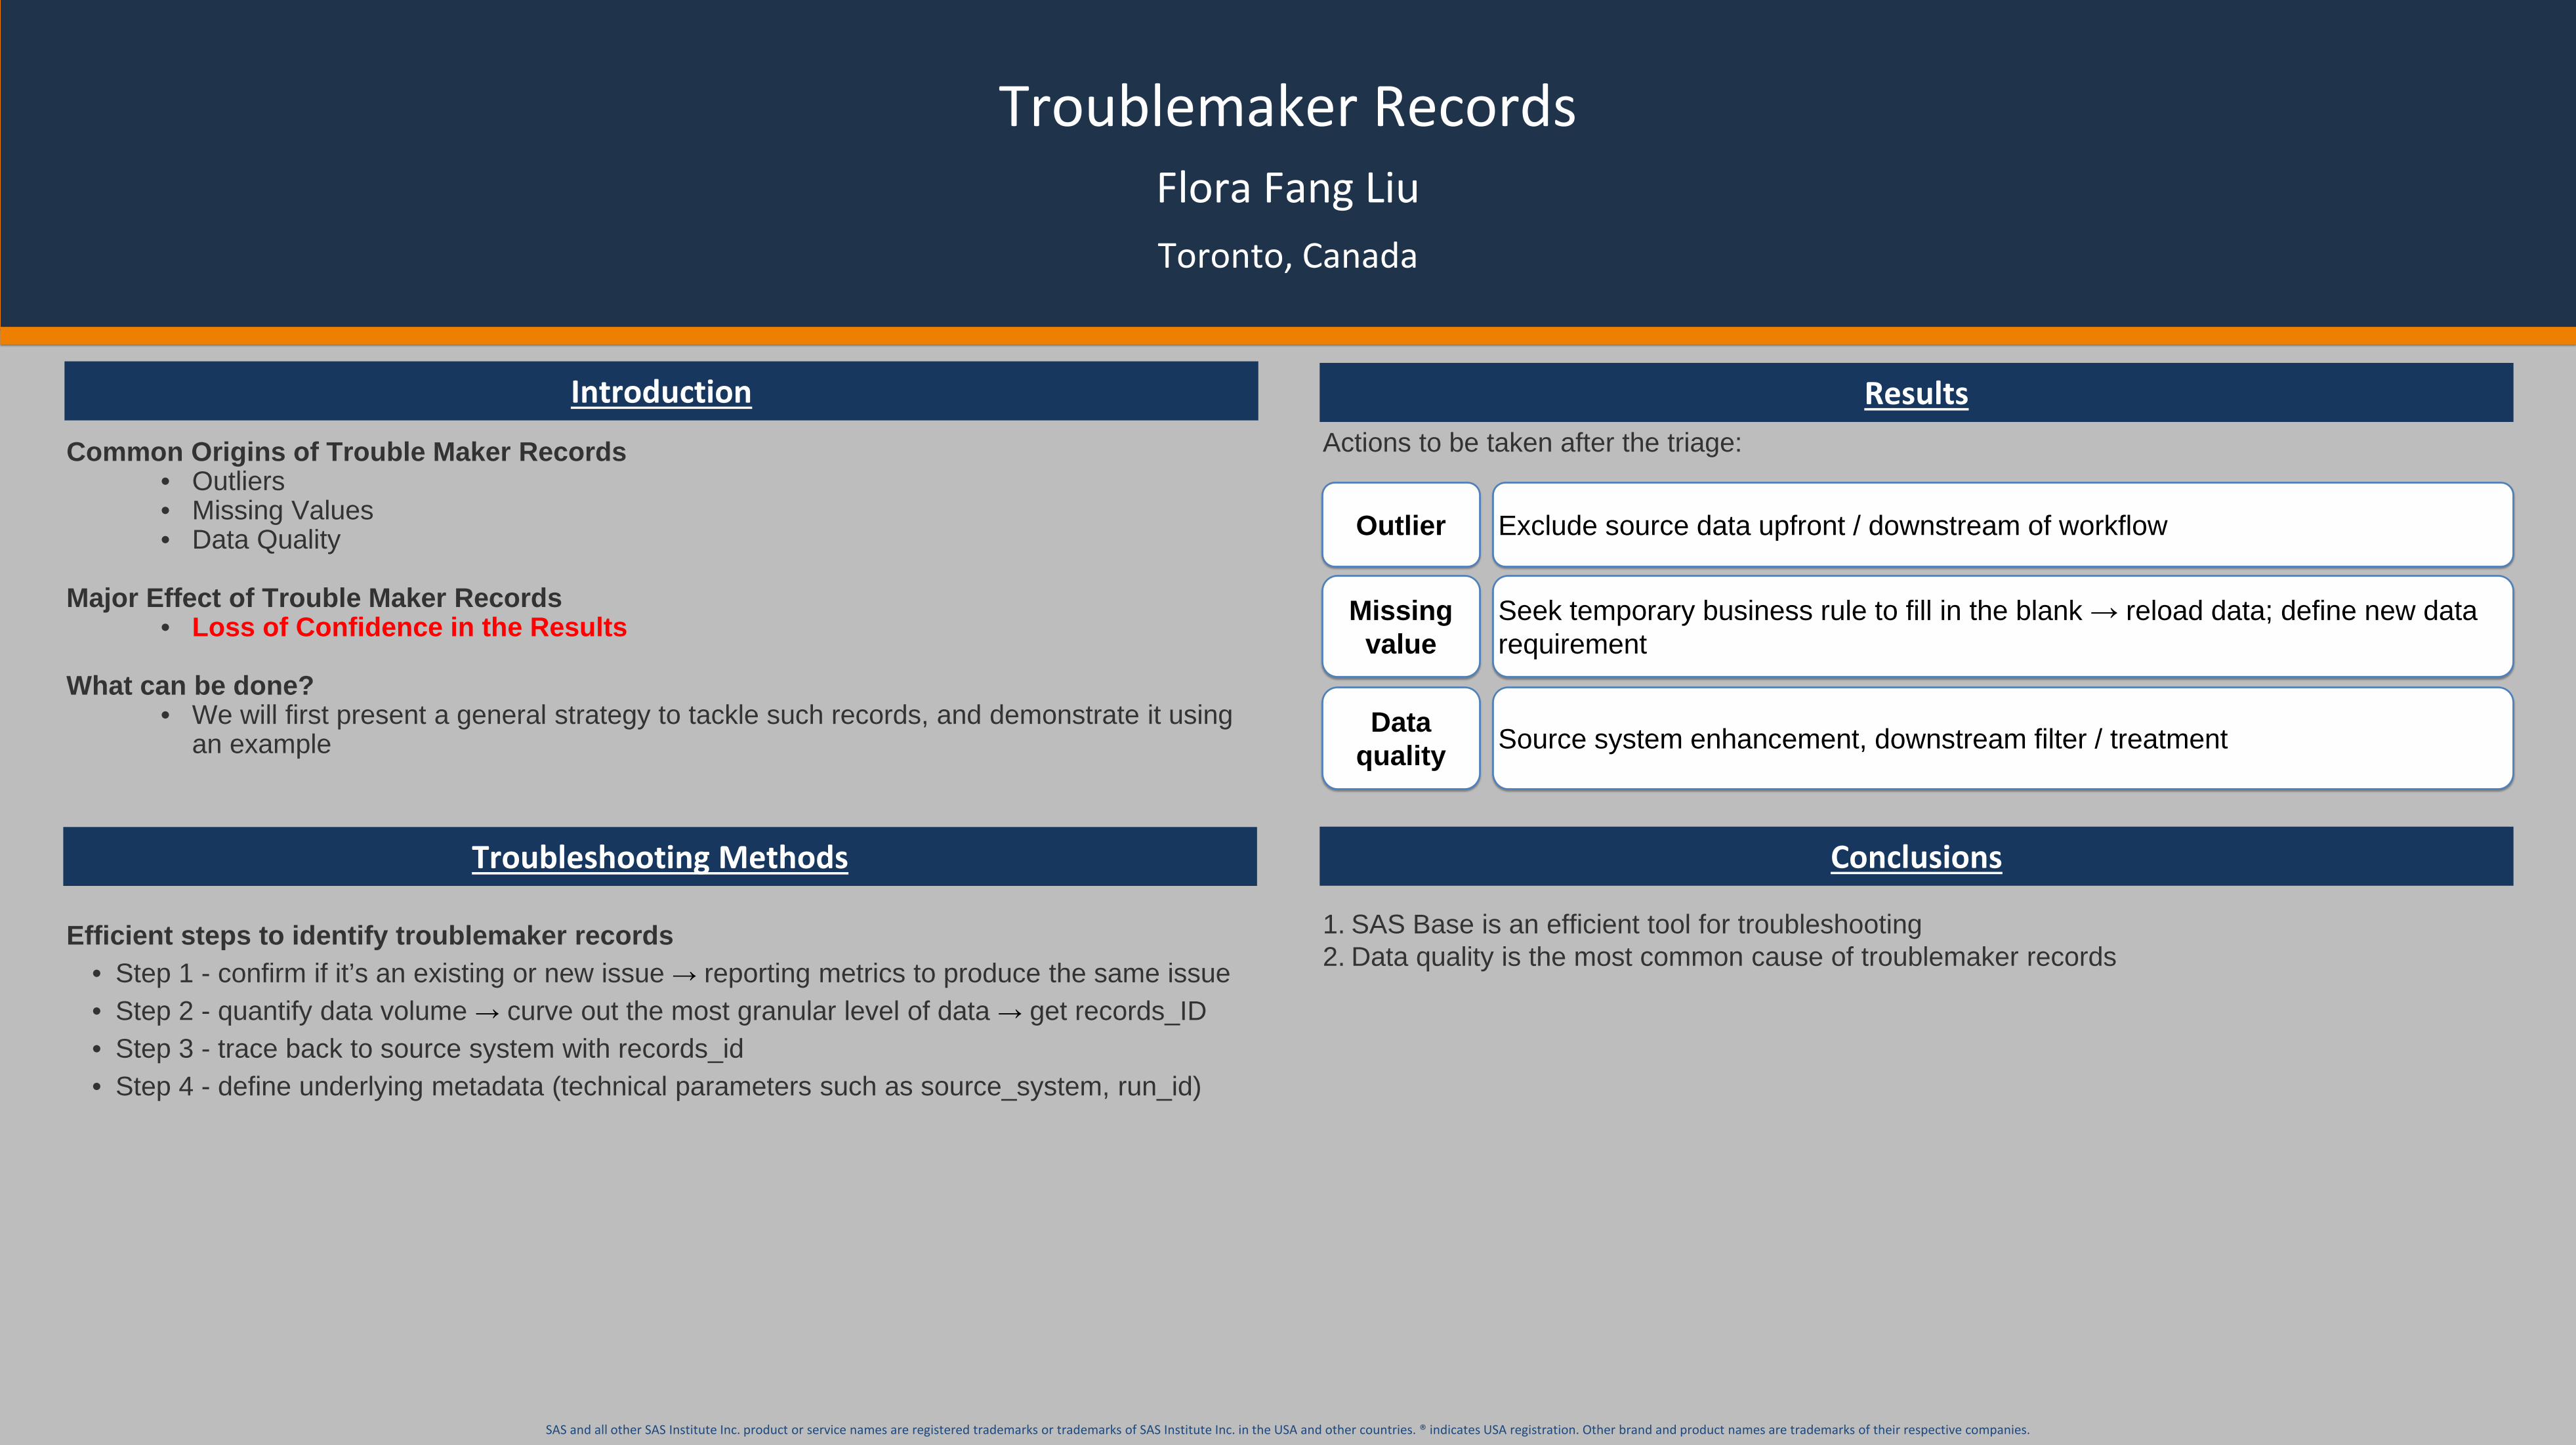
Introduction
Common Origins of Trouble Maker Records• Outliers• Missing Values• Data Quality
Major Effect of Trouble Maker Records• Loss of Confidence in the Results
What can be done?• We will first present a general strategy to tackle such records, and demonstrate it using
an example
Troubleshooting Methods
Efficient steps to identify troublemaker records• Step 1 - confirm if it’s an existing or new issue → reporting metrics to produce the same issue• Step 2 - quantify data volume → curve out the most granular level of data → get records_ID• Step 3 - trace back to source system with records_id• Step 4 - define underlying metadata (technical parameters such as source_system, run_id)
Results
SAS and all other SAS Institute Inc. product or service names are registered trademarks or trademarks of SAS Institute Inc. in the USA and other countries. ® indicates USA registration. Other brand and product names are trademarks of their respective companies.
Actions to be taken after the triage:
Outlier
Missing value
Data quality
Exclude source data upfront / downstream of workflow
Seek temporary business rule to fill in the blank → reload data; define new data requirement
Source system enhancement, downstream filter / treatment
Conclusions
1. SAS Base is an efficient tool for troubleshooting2. Data quality is the most common cause of troublemaker records

Troublemaker RecordsFlora Fang Liu
Part 1 - Background
Background of Enterprise Wide Stress Testing Typically workflow of a Stress Testing Workflow
REFERENCES
SAS and all other SAS Institute Inc. product or service names are registered trademarks or trademarks of SAS Institute Inc. in the USA and other countries. ® indicates USA registration. Other brand and product names are trademarks of their respective companies.
What is Stress Testing?- The term Stress Test is from Engineering meaning to determine the stability of a given system or entity. Stress Testing involves testing beyond normal operational capacity, often to a breaking point, in order to observe the results.- After the Financial Crisis in 2009, Stress Testing is required by Regulators l (Federal Reserve).
Objective:Financial Institutions use Enterprise Wide Stress Testing as part of their internal risk management tool to evaluate capital adequacy on both a regulatory and an economic capital basis.
Example of Stress Tests:Capital Analysis and Review (CCAR), Dodd-Frank Act stress testing (DFAST), Internal Capital Adequacy Assessment Process (ICAAP) and Macro-economic Stress Testing (MST).
Main pieces in Stress Testing in for Financial Institutions- Losses, including Credit Losses- Revenue
Underlying methodology and technology- PD LGD models (PD: probability of Default, LGD: Loss Given Default)- PPNR models (PPNR: Pre-Provision Net Revenue)- Robust platform for risk implementation, calculation, reporting
- Enterprise Wide Risk related information (Federal Reserve, OCC, OSFI, Basel III)- Credit Risk PD LGD Methodology- Moody’s presentation - Leveraging an Enterprise-wide Stress Testing Automation - link: https://www.slideshare.net/MoodysAnalytics/leveraging-an-enterprisewide-stress-testing-automation- Data troubleshooting- Supervisory and bank stress testing: range of practices (Dec 2017) – link: https://www.bis.org/bcbs/publ/d427.pdf- Principles for sound stress testing practices and supervision https://www.bis.org/publ/bcbs155.pdf
Output
Input 1 Input 2
Reporting metrics

Troublemaker RecordsFlora Fang Liu
Part 2 - Use Cases / step 1
Step 1 – Unreasonable numbers raised by Business Users Business User OLAP Cube Screenshot
Housing Market size in CanadaRanking Province Main cities
1 Ontario Toronto, Ottawa2 British Columbia Vancouver, Victoria3 Quebec Montreal
Housing Products Quebec OntarioInsured Mortgage 84 BN 186 BN
Uninsured Mortgage 179BN 76BNHELOC (Home Equity Line of Credit) 89BN 33BN
IssueBusiness user raised a concern from SAS OLAP Cube (Online Analytical
Processing Reporting) that ‘Uninsured Mortgage’ is relatively low in Ontario, and relatively high in Quebec. (Reminder: Toronto’s housing
marketing is the biggest in Canada)
Actions1.1 Capture reporting metrics to replicate the issue
1.2 Define if it’s new or existing issue
For the given use case, the issue was not new.
Tips & reminder:
Online Analytical Processing (OLAP) Cube is a handy reporting analysis tool with ‘Drill Through Details’ functionality, but it’s slow and is not guaranteed to work as expected; SAS Base is the most efficient tool to investigate and resolve the problem.
SAS and all other SAS Institute Inc. product or service names are registered trademarks or trademarks of SAS Institute Inc. in the USA and other countries. ® indicates USA registration. Other brand and product names are trademarks of their respective companies.
Right click for ‘Drill Down Analysis’ function
Note: all numbers are fictive and not related to information of presenter's employer

Troublemaker RecordsFlora Fang Liu
Part 2 - Use Cases / step 2
SAS and all other SAS Institute Inc. product or service names are registered trademarks or trademarks of SAS Institute Inc. in the USA and other countries. ® indicates USA registration. Other brand and product names are trademarks of their respective companies.
2.1 Define the metadata in order to quantify the number of records, the impact and start diagnostics. For the given business case, the metadata is shown below
Func
tiona
l or
repo
rtin
g m
etad
ata
Reporting Metadata Value
Province_id Ontario, QuebecProduct_id Uninsured Mortgage
Case_Study_run_id Study_Project_sk1User_input_data_id Used_scenario1
Tech
nica
l M
etad
ata Underlying Technical Metadata Value
System_Input_data_id Dataload#1
Step 2.1 - Get raw data without aggregationmetadata
Step 2.2 - Get raw data without aggregationraw records
2.2 Quantify the number of records with pre-defined metadata2.3 Extract the most granular level of records (Note: pay attention to the source system)
Record_id Reporting Metadata
Tech metadata
Reporting numbers Source_system
Loan#1 Dataload#1
Loan#2 Dataload#1
Loan#N Dataload#1
Contact: Flora Fang Liu
[email protected] https://www.linkedin.com/in/florafangliu/

Troublemaker RecordsFlora Fang Liu
Part 2 - Use Cases / step 3-4
SAS and all other SAS Institute Inc. product or service names are registered trademarks or trademarks of SAS Institute Inc. in the USA and other countries. ® indicates USA registration. Other brand and product names are trademarks of their respective companies.
Trace back to the original data source system with Records_id list and dataload_id. For the given use case, there are two levels: N-1 (centralized_source_system), and N-2 (individual_DataInput_system).Objective: compare to see if data are consistent between systems. If not, there will be a transformation problem or a business rule to be reviewed
Step 3 – Trace back to Source Systems Step 4 – Working meeting to provide solution
N-1:Centralized_source_systemRecord_id Key information
Loan#1Loan#2Loan#N
N-2: Input source systemRecord_id Key information
Loan#1Loan#2Loan#N
Record_id MetadataLoan#1Loan#2Loan#N
• Send the datasets (N-1, N-2) to source system stakeholder for review and analysis.
• Working group meeting: gather a working meeting to clarify the issue /impact and find solution.
Conclusion:
Prior to the working meeting, we have the first conclusion, i.e. for the given Business Case, the trouble records consist of variance records, the province_id is provided by source data input system.
Therefore, our question is ‘why all records for adjustment purpose are put in only Ontario and Quebec, with the same absolute value?’
After working group discussion, it was clarified that those records are for intercompany transactions; it’s a data quality issue that can’t be changed right away. To eliminated the downstream impact, a new business process needs to be developed when entering these intercompany transfers.
Solution: we proposed our Business user to exclude those variance records (both in Ontario and Quebec) from the reporting within our platform.Source data 1
Centralized data
Source data 2
Calculated results data
Contact: Flora Fang Liu
[email protected] https://www.linkedin.com/in/florafangliu/

SAS and all other SAS Institute Inc. product or service names are registered trademarks or trademarks of SAS Institute Inc. in the USA and other countries. ® indicates USA registration. Other brand and product names are trademarks of their respective companies.