trump paradox: how immigration and trade affected voting
TRANSCRIPT
CPIP Working Paper Series Paper #20210
Trump Paradox: How Immigration and Trade Affected Voting in 2016 and 2018 UCI Center for Population, Inequality, and Policy
Raul Hinojosa, UCLA Edward Telles, UC Irvine
11-1-2020
1
Trump Paradox: How Immigration and Trade Affected Voting in 2016 and 2018
Raul Hinojosa, University of California, Los Angeles
Edward Telles, University of California, Irvine
9-1-2020
Keywords: racial resentment, voting, attitudes, China, Mexico
Word Count:
Abstract: 146 Words
Text: 5900 Words
2
ABSTRACT
We show that less educated and lower incomes whites were especially likely to vote for
candidate Trump, presumably because he promised to curtail immigration, claiming it was
responsible for their diminishing prospects. However, our research – the first that examines
actual immigration and trade - finds that white voting for Trump was generally unrelated to the
actual presence of immigrants or trade. Rather, our findings show that anti-immigrant and anti-
trade attitudes rather than actual immigration and trade consistently and strongly explain Trump
voting while levels of immigration and trade explain the loss of 40 Republican House seats, two
years later. The overall results suggest that Trump rallied white voter support by stoking
xenophobic, racist and nationalist fears. However, the backlash against Republican candidates in
the 2018 House midterms was largely from a growing rejection of the appeal to fear in the face
of actual immigration and trade.

3
Much has been made of early studies that equated Donald Trump’s victory in 2016 with
voters who had been hard hit by free trade policies and by job competition and social
disintegration created by an increase in immigration—even though the actual economic and
social impacts of immigration and trade have not been considered. In particular, immigration
from Latin America (Huntington and Dunn 2004, Chavez, 2013) and trade with China (Autor,
Dorn and Hanson, 2016) and Mexico (Yúnez-Naude , Mora-Rivera and Govea-Vargas
unpublished) have been portrayed as particularly threatening since at least the past two decades
but such depictions have been especially menacing under Trump.
Donald Trump made the fear of immigration and trade central to his Presidential campaign
and now his Presidency, wielding threats to end, curtail or heavily tax trade with those two
countries and curtail immigration across the Mexican border. Specifically, Trump’s rhetoric and
policy recommendations blame the deteriorating position of American workers on immigration
and trade and are consistent with his nationalist narrative to make America great again (Green,
2018). Trump successfully defended this position in his Presidential campaign and many
Republican legislative candidates staked out similar positions in 2016 and 2018 (Kamarck &
Podkul, 2018).
In this study, we examine the extent to which actual economic and social exposure to
immigration from Latin America and Chinese and Mexican trade or attitudes about immigration
and trade affected voting among whites in the 2016 Presidential election and then again in the
2018 midterms. Despite the centrality of immigration and trade to Trump’s campaign and his
ongoing messaging as President, there is surprisingly little evidence on how immigration and
trade are related to his support. We also explore whether the socioeconomic conditions of whites
were related to local levels or attitudes about immigration and trade.

4
The U.S.-Mexico Narrative and Economic Self-Interest
From the launch of his campaign in June 2015, Donald Trump adeptly focused on U.S.-Mexico
relations to create a media narrative that America ceased being great because of border raiding
illegal immigrants (“murderers and rapists”) and trade agreements like NAFTA (North American
Free Trade Agreement; the new version is called USMCA) and TPP (Trans Pacific Partnership)
that ship U.S. jobs across the border (Green, 2017). In this narrative, “real” American working
people are hurt because America's border is being overrun by Mexico sending their worst people
and "unfair" trade deals made by our “bad” leaders. This diagnosis leads to the Trump solution
that he can “Make America Great Again” by building a “Big, Beautiful Wall,” deporting millions
and renegotiating trade agreements with greater tariffs and protections for American workers.
"We have no choice.” “Without borders, we don’t have a country." (Thrush, 2020). He has
continued to use this narrative with great success among his political base.
The dog whistle of this simply construed yet dangerously fictitious cross-border
narrative—not to mention the full-throated denunciations of Mexicans and Central Americans—
should not have been underestimated, especially given Trump’s openly racist demonizing,
unprecedented for modern presidential campaigns (Bobo, 2017). His narrative of nostalgia
forged as it is by white racial identity politics invokes a long historical legacy of privileged
supremacy but with a twist. In this telling of the story it is an “embattled” white citizenry that
must make a stand or be swallowed up by a demographic transformation to a non-white
dominant multiracial America (Abrajano & Hajnal, 2015).
The collective failure by media and political leaders to immediately counter not only the
blatant bigotry of his initial position but also its basis in fact, allowed Trump to elaborate a 21st
5
century nativism, based on anti-immigrant politics and reminiscent of past waves of nativism in
American history (Young, 2017). Then as now, Trump’s nativist narrative insults immigrants,
particularly Mexicans, with calls for: Deporting all undocumented immigrants and their U.S.
born children and making Mexico pay for the wall by seizing family remittances sent to Mexico
(Ordoñez, & Kumar, 2018). Today, the narrative is augmented by vilifying international trade,
especially from China and Mexico. Trade policies promoted by Trump’s narrative include
voiding NAFTA and imposing tariffs as coercive threats around international migration
(Nakamura, Wagner, & Miroff 2019). He has now claimed victory that the Mexican President,
by succumbing to Trump’s tariff pressures, has built a virtual wall on the border by preventing
immigration to the United States.
Journalists accepted preliminary scholarship suggesting voters’ economic insecurity was
the basis for Trump’s appeal and h electoral victory in key swing states (Davis & Hilsenrath,
2016;Waldow, 2018). They inferred that attitudes about immigration and trade were the result of
actual immigration and trade, conflating these attitudes with the idea that Trump supporters had
experienced negative impacts from both migration and U.S. trade in a global economy.
Extrapolating from a well-known research paper’s (Autor, Dorn, and Hanson 2016) analysis of
the “trade exposure” caused by Chinese imports on some economic sectors in some parts of the
country, Davis and Hilsenrath (2016) attribute a wide array of the US economy’s shortcomings to
trade with China and Trump’s support in these parts of the country. They report that in
“presidential primary races, Mr. Trump won 89 of the 100 counties most affected by competition
from China.”
6
Immigrants from Latin America tend to be low-skilled and are mostly the subject of
Trump’s messaging that they take American jobs but there is little evidence of the effects of
actual immigration on voting. Scholars have generally shown that immigration means greater
economic growth for the United States and there are small economic consequences for U.S.
native workers, as immigrant workers have in fact become a needed labor source for continued
prosperity where the size of the American workforce is shrinking (National Academies, 2016;
Myers, 2007). On the other hand, fiscal impacts are often negative in the short term, especially
for some states (due primarily to child education expenditures) but positive in the long run.
Overall, immigrants tend to be a boon for the U.S. economy and American with relatively small
negative effects workers (National Academies, 2016). However, our point is that despite actual
positive or negative impacts of immigration, Trump regularly and mistakenly claims its effects
are negative in order to shore up support for himself and Republicans.
On trade, some economists use data on temporally specific regional impacts, looking for
correlations between the “China Shock” of increased imports in the early 2000s and voting that
swung for Trump in 2016 (Autor, Dorn, Hanson, & Majlesi, 2016; Autor, Dorn, & Hanson,
2016). Chinese import penetration was also found to be a predictor of the rise of right-wing
candidates and nationalism in Europe (Colantone & Stanig, 2018). Other economists found a
correlation between the decline in manufacturing employment, the sector that is especially
vulnerable to international trade, and the counties that voted for Trump (Altik, Atkeson, &
Hansen, 2018). Economists have increasingly found that economy-wide gains from globalization
and free trade appear highly concentrated among the upper decile of earners while the broad
majority of the population receive defused gains from trade (Rodrik, 2017).

7
Anti-Immigrant Attitudes and Racial Resentments
In contrast to the economic interests position, arguments for the importance of attitudes
are based on at least three decades of sociological and political science research. Work in group
position theory, for example, posits that increases in the size of a given racial minority group can
be seen as a group threat to political and social resources by the majority, triggering the fear that
immigrants pose a potential challenge to the dominance of the white majority and generating
hostility and negative stereotyping of the minority group (Blalock, 1967; Hood III & Morris,
1997; Quillian, 1995). Because of the growing size of the Latino population across the United
States (Krogstad & Lopez, 2015), Latinos and particularly Mexicans may be perceived as a
major threat to the white majority, especially when those fears are activated by political
candidates (Chavez, 2013). Hainmueller and Hiscox (2010) used a survey experiment (not actual
immigration) to find that voter attitudes toward immigration are not explained by economic self-
interests, arguing that instead they are probably related to ethnocentrism or considerations about
how the local economy as a whole may be affected by immigration
Similarly, growing trade may threaten whites by challenging their sense of not only racial
but global supremacy. In this way, white Americans situate themselves as the “real” Americans
in a world where “America’s” global leadership is at stake. White anxieties or negative attitudes
about immigration and trade may also be stirred up by political actors. These actors activate
latent racial hostilities (Hopkins, 2010; Valentino, Hutchings, & White, 2002) as well as a
preference for like-minded candidates (Mendelberg, 2001), independently of actual immigration
and trade.
Regarding Trump’s election, Political scientist Diana Mutz (2018) in a highly-publicized
paper uses data from election panel surveys to infer that attitudes concerning white status, rather

8
than white economic interests, better explained Trump’s victory. She concludes that candidate
Trump was able to tap into white voter anxiety about globalization and diversity and concerns
about job displacement predicted greater support for Trump than actual threats to the economic
security of American workers (Mutz, 2018 a). In a reanalysis of Mutz’s data, Stephen Morgan
(2018a) concludes that she overstated the status threat explanation, Rather, Morgan claims,
voters’ perceptions of economic interests were at least as important and their economic interests
were intertwined with status issues, which Mutz (2018b) rebuts. Political scientists Marc Hooghe
and Ruth Dassoneville (2018) found that anti-immigrant attitudes and racial resentments
explained much of the Trump vote, though neither they nor any of the other mentioned authors
explored actual levels of immigration or trade.
We examine local levels of trade and immigration and attitudes about immigration and trade.
As far as we know, no one has examined the effect of immigration on the 2016 election and the
only paper that we know of that has examined trade flows (goods and services that are bought
and sold between countries) is that by labor economist David Autor and his colleagues on
Chinese imports (Autor, Dorn and Hansen 2016, Autor, Dorn, Hansen and Majlesi 2016), though
they did not examine attitudes. In particular, we focus on trade from China and Mexico and
immigration from Latin America, which is predominantly from Mexico and has been particularly
vilified by Trump’s campaign and his presidency as a primary source of the nation’s economic
and social ills (Green, 2017). Moreover, we question how these attitudes themselves are related
to immigration and trade.
Data and Methods: Trump Support, Trade, and Immigration
9
We examine voting patterns at the national level for whites. We use hierarchical logit regression
to analyze both individual data on Trump voting at both the individual and county levels.
Individual data come from the Cooperative Congressional Election Study (CCES), which is a
50,000+ person national stratified sample survey of the adult U.S. population administered by
YouGov.com. For our analysis of the extent of local immigration and trade, we use county level
data, which provide refined local contextual effects of immigration and trade.
Our dependent variables are whether or not individual whites voted for candidate Trump
in 2016 among all white voters and those that voted for Romney in 2012 (Table 1) and whether
Trump voters flipped their vote to a Democratic candidate in the 2018 house elections (Table 2).
Our independent variables are partisanship, education, gender, age, income and employment
status as well as attitudes about immigration and trade. For education and age, we use college
educated (B.A. or more) and age over 65, as commonly operationalized in studies of voter
behaviors (Altick, Atkeson, & Hansen, 2018). Family income, temporarily laid off, unemployed
and whether working in the manufacturing sector represent socioeconomic conditions. Table 4
regresses the immigration and trade attitudes on the remaining independent variables, among all
whites in the CCES.
The CCES items on immigration and trade attitudes that we use are for immigration:
agreement or disagreement on whether the U.S government should deport undocumented
immigrants (2016) or whether we should build the border wall (2018) and for trade: whether
voters support the Trans-Pacific Partnership Act (TPP), in both 2016 and 2018. There were no
similar questions for immigration in 2016 and 2018. The trade questions were similar but slightly
different. The 2016 item queried simply whether respondents were for or against the TPP while
the 2018 question referred to whether the U.S. should withdraw from the TPP. These variables

10
are independent variables in alternate models in Tables 1 and 2. For Table 3, we utilize logistic
regression to analyze immigration and trade attitudes as our dependent variables. The
independent variables for this analysis are the remaining independent variables in the analysis of
voting.
We are particularly interested in parsing out the effects of actual trade and immigration
versus attitudes about them, independent of personal economic situations and social
characteristics. To combine the personal behavior and characteristics with the contextual
influence of immigration and trade, we use hierarchical linear regression models that model these
variables at the individual and county levels (Raudenbush & Bryk, 2002). At the county level,
we include the main independent variables of the proportion immigrants from Latin America and
per capita trade imports from China and Mexico. To do this, we link the individuals in the CESS
data to the information about immigration and trade in the county in which they reside.
We use immigration from Latin America in particular because this segment, particularly
Mexicans and Central Americans who make up the vast majority, was particularly vilified by
Trump in his candidacy and throughout his Presidency. To quantify the stock of immigration
from Latin America, we use the percent foreign-born Hispanic population, which is based on the
2016 American Community Survey.
We hypothesize that white voting and attitudes may also respond to Hispanic
immigration in places where it grew suddenly rather than simply its size. There is evidence that
white attitudes about immigration may be particularly hostile in new destinations where
immigration grew suddenly and resentment against them was particularly strong (McDermott
2011; Marrow 2019). Thus, we also introduce a second immigration variable: the percentage
growth of the Hispanic immigrant population from 1990-2000, which is based on the U.S.
11
Census. This represents the peak years of Latino immigration (Pew, 2015), when many places
with few Latinos -so-called new destinations -had suddenly grown to have sizeable Latino
populations. For example, the Latino population of North Carolina grew 3.9 times in the 1990s
and particular counties grew well more than that (Haverluck & Trautman, 2008).
To examine the level of imports from Mexico and China repeatedly referred to by Trump,
we use data on imports by sector (e.g., agricultural products, textiles) from the World Institute
for Strategic Economic Research (WISER) trade database. To distribute this trade data at the
county level we created a ratio based on county sales by sector and then distributed the higher
level data according to this ratio. This sector sales data was collected from the U.S. Census
Bureau’s 2012 Survey of Business Owners and Self-Employed (SBO). Our analysis sought to
replicate core aspects of the methodology used by Autor, Dorn and Hanson (2016) for measuring
regional trade exposures in U.S. trade with China. Their analysis of U.S.-China trade is based on
“the share of each industry in region (e.g. county’s) i’s total sales on the U.S. market”1; it
summarizes differences across U.S. regions in industry specialization patterns (for example, for
the distribution of labor, goods and services in particular industries). Thus, their methodology
captures variation in regional exposure to China’s supply-driven export growth. For our analysis
of U.S. trade with Mexico, we also extended and, we believe, improved the specificity of this
measurement by including imports from China and Mexico for counties. Finally, we divide this
measure of variation in regional exposure by total population to get a per-capita measure of
1 Trade sectors include, for example, agricultural products; forest products; electronic products,
chemical products; energy products; minerals and metals; textiles, apparel, and footwear;
machinery; and transportation equipment.
12
trade. Since we don’t have full data on very small counties, we end up with data on 3030 of the
3142 counties in the United States, which represent 99.88 percent of the national population.
Finally, we control for anti-immigrant and anti-trade attitudes. In 2016, these are based on
whether respondents agreed that “illegal aliens should be identified and deported” and whether
they are against the TPP, which is explained in the survey item. In 2018, these are based on
whether respondents agree that “the U.S. should increase spending on border security by $25
billion, including build a wall between the U.S. and Mexico” and if they agree that the U.S.
“should withdraw from the Transpacific-Partnership trade agreement that included the U.S.,
Japan, Australia, Vietnam, Canada, Chile, others” (CCES 2020).
Findings
Figures 1 and 2 show bivariate relations between immigration and trade with
Trump/Republican voting. Figure 1 presents scatterplots that show the relation between Trump
voting and immigration and trade for counties in the United States. The figures show that the
extent of immigration and trade is negatively related to the proportion in each county that voted
for Trump in 2016. That is, Trump voting tends to be greater where there are fewer immigrants
and less trade with Mexico or China. Although these relations are highly significant as indicated
by the p values, the correlations are modest reflecting wide dispersion in the relationship. Of
course, these relations are bivariate so we employ multivariable regressions to control for
potential confounding influences referred to earlier in this paper.
Figure 1 about here
For the 2018 midterm elections, Figure 2 examines the mean immigration and trade
characteristics of all US Congressional Districts by whether they switched from Republican to
13
Democrat (RD) between 2016 and 2018, remained Democratic (DD) or remained Republican
(RR). Significantly, the districts that switched from R to D had much higher levels of
immigration and imports from both Mexico and China compared to those that remained
Republican. In general, the midterms elections heightened a Trump paradox at the bivariate
level, whereby districts that switched had more immigrants and trade, leaving the remaining
GOP voting districts even less exposed to immigration and imports than GOP voting districts in
2016.
Table 1 shows coefficients and standard errors for four hierarchical logit regression
models predicting the extent to which whites voted for Trump. Model 1 represents the baseline
model controlling partisanship, demographic and socioeconomic characteristics of individuals
and levels of immigration and trade in the counties in which they reside. We then introduce anti-
immigration and anti-trade attitudes in model 2. For a robustness check, we present Models 3
and 4, which repeats the same pair of models but we change the sample for a stricter test of a
Trump effect. Specifically, we restrict the sample to whites that voted for Romney in 2012.
TABLE 1 ABOUT HERE
At the individual level, our evidence shows that Republican, Independent, less educated
and senior white voters tended to vote for Trump, in all four models. Not surprisingly, being
Republican has by far the strongest effect on voting for Trump as Republicans were about five
times as likely to vote for Trump as Democrats as Models 1 and 2 show. Of course, party effects
diminish for the sample of Romney voters in Models 3 and 4. Both models 1 and 3 show that
males and those that were unemployed and in manufacturing jobs were more likely to vote for
Trump, until we introduced controls for attitudes in Models 2 and 4. Income had no effect in any
of the models although missing income data, which tends to select those with higher incomes,
14
shows that they are more likely to have voted for Trump. Although not always significant,
results for education, unemployment, being laid off and income suggest that Trump’s candidacy
may have appealed to less fortunate whites. Trump voters also tended to work in manufacturing
industries, suggesting that persons in those sectors may have felt particularly vulnerable
economically (Altick, Atkeson, & Hansen, 2018). Notably, our analysis of Trump voting was
fairly consistent across the two samples, at the individual level.
When attitudes are introduced, models 2 and 4 reveal that anti-immigration and anti-trade
attitudes were strongly and positively related to Trump voting, in both samples. Indeed, the
coefficients suggest that these may be the most important effects predicting Trump voting, aside
from partisanship. Thus, our results suggest that candidate Trump was able to mobilize anti-
immigrant and anti-trade sentiments among white voters through his narratives, whether or not
there was an actual presence or threat of immigration or trade.
The results in the bottom rows of Table 2 show our results for actual levels of
immigration and trade. The proportion of Hispanic immigrants is unrelated to Trump voting, in
all four models. This is strong evidence that white voting for Trump had nothing to do with the
presence of Hispanics even though he pontificated that they were taking their jobs and bringing
crime. Rather, anti-immigrant attitudes accounted for Trump voting. However, Hispanic
immigrant growth is positive and significant, indicating that white voters that experienced rapid
demographic change from Hispanic growth were especially likely to vote for Trump. Models 2
and 4 reveal that this effect remains after attitudinal controls, suggesting that white voters felt
threatened by demographic change from immigration, regardless of whether they reported being
anti-immigrant. However, the effect of immigration growth is clearly stronger when the sample
is restricted to Romney voters, suggesting that while traditional Republican voters tend to be
15
more anti-immigrant and anti-trade, candidate Trump was particularly successful in attracting
white voters in counties with rapid immigrant growth.
Results for the presence of trade show that Trump voting tended to be positively
correlated or unrelated with greater imports from Mexico or China. The one exception among the
eight cases is that Trump voting was negatively correlated with Mexico imports in Model 1 but
that correlation was barely significant and reversed in Models 3 and 4, with the stricter modeling
of a Trump effect. This suggests that Trump may have led white voters to feel particularly
vulnerable to Mexico imports, although such a change in the sample weakens the effect of China
imports.
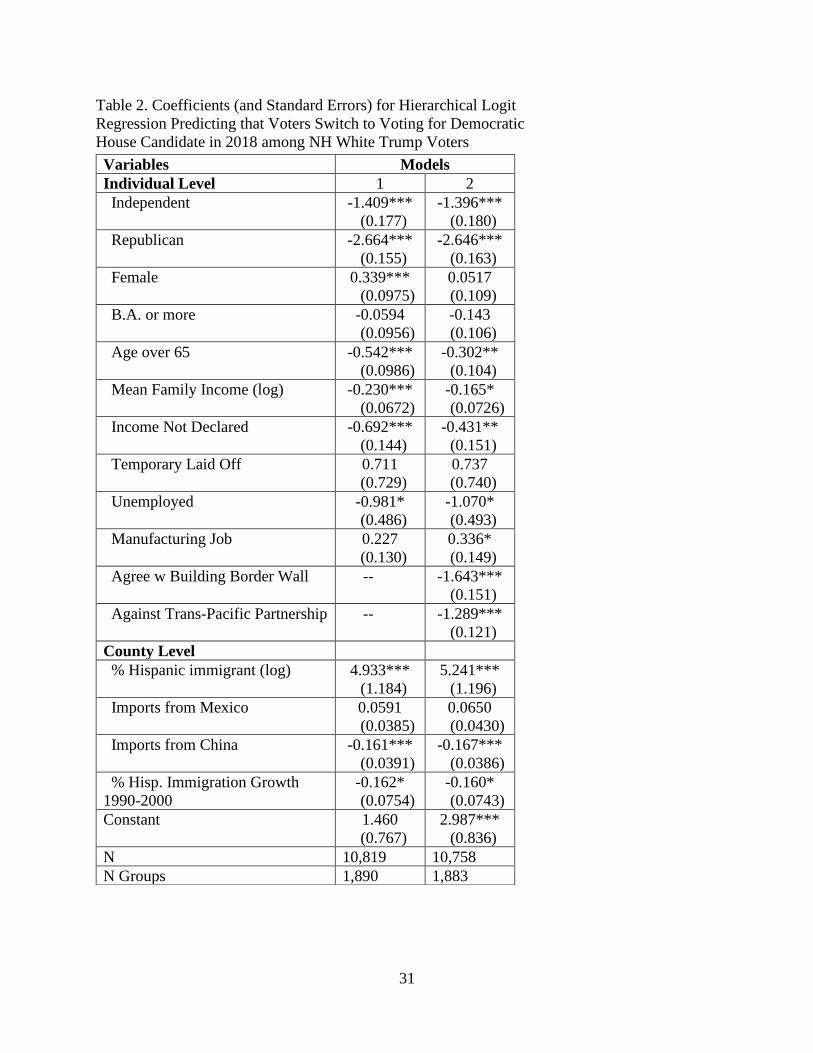
Table 2 models results for the midterm House elections in 2018 in which fully 40
congressional seats switched from Republican to Democrat, representing a voter backlash against
the Trump presidency. The Table 2 sample consists of persons that voted for Trump in 2016 and
the dependent variable represents whether they flipped to vote for a Democratic candidate for the
House in 2018. Table 2 is set up to mirror the models in Table 1, except that the signs for
coefficients are reversed because the dependent variable represents voting for a Democrat rather
than a Republican. For example, the coefficient for female in Model 1 shows that women who
voted for Trump in 2016 were more likely than men to vote for Democratic candidates in 2018,
though this effect disappears when attitudes are controlled. Younger, lower income and
unemployed persons are likely to have switched, in both models though consistently negative
and significant coefficients reveal continued loyalties to Republican candidates (and Trump)
among seniors, higher income persons and the employed. We show that manufacturing workers
were more likely to flip, when attitudes are controlled. Read together, Table 1 and Table 2 results
show that while whites in manufacturing jobs, the unemployed and those with lower incomes
16
were more likely to vote for Trump in 2016, in 2018 they were especially likely to switch their
votes to Democratic House candidates.
Model 2 shows that negative attitudes about both immigration and trade continued to
drive voters against Democrats and the effects are strong in 2018, as they were in 2016. Our
findings also suggest that gender differences disappear with controls for anti-immigration and
anti-trade attitudes in 2016 and 2018.
TABLE 2 ABOUT HERE
However, again actual immigration and trade may be a different story. Unlike in 2016
when the presence of immigrants from Latin America was unrelated to Trump voting, white
voters in counties with more immigrants were more likely to flip to Democrat in 2018. This
effect is particularly strong, at the highest level of significance. This suggests support for a
contact hypothesis, that this time proximity to immigrants may have led to turning away from the
Republican party, which had become increasingly anti-immigrant under the leadership of Donald
Trump. On the other hand, Hispanic immigration growth is negatively related, suggesting that
white voters in new destinations remain especially attached or even deepened their commitment
to the Republican/Trumpian base.
We also find that imports from Mexico is unrelated to White voter flipping while China
imports is negatively related. That is, white voters who went from voting for Trump to
supporting a Democratic candidate in the 2018 midterms lived in counties that had fewer imports
from China. In no case, was greater international trade associated with White voters flipping to
Democratic candidates.
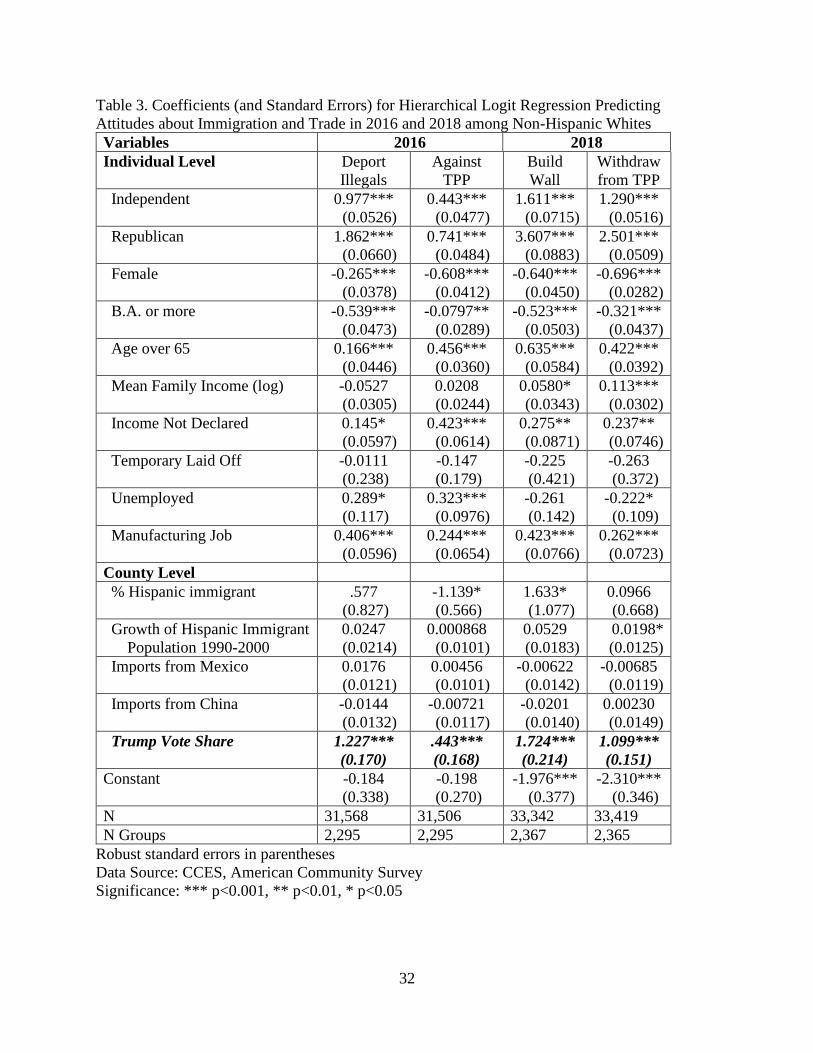
In Table 3, we analyze the anti-immigrant and anti-trade attitudes of whites in 2016 and
2018 by regressing them on the other variables. In addition, we have added a county level

17
variable of the percent voting for Trump (Trump Vote Share). Statistically significant
coefficients show in all four models that Independents and especially Republican voters were
more likely than Democrats to be anti-immigrant and anti-trade, though the magnitude of the
coefficients suggest that the intensity of these attitudes increased, which we show in Table 4 with
more direct evidence. Among the white voters we examine, men, those without a college degree,
seniors, and those working in manufacturing were consistently more likely to have anti-
immigrant and anti-trade attitudes. Interestingly, the unemployed tended to have more negative
immigration and trade attitudes in 2016 but in 2018 they had developed positive attitudes about
trade and their attitudes on immigration were not different from the employed. Although,
income bore no relation to anti-immigrant and anti-trade attitudes for the 2016 Presidential race,
higher income whites tended to be more anti-immigrant and anti-trade in 2018.
TABLE 3 ABOUT HERE
Regarding county level variables, the Trump Vote Share variable that we added is
positive and highly significant in all four models. Thus, in 2016 and 2018, white voters were
clearly more likely to express anti-immigrant and anti-trade attitudes in counties where Trump
support was greater. This suggests that Trump’s anti-immigrant and anti-trade messaging was
most effective in counties where he had his largest base of support.
Table 3 reveals little relation between actual immigration and trade with attitudes. There
is a negative correlation between immigrant size and anti-trade attitudes in 2016 and a positive
relation with immigration in 2018 but these relations are both only at the p<.05 level. However,
both immigration variables were clearly stronger before Trump Vote Share was introduced (data
not shown but in appendix or available from authors). Thus, the negative messaging of Trump
about trade and immigration was effective in places with more support rather than the levels of

18
immigration. Although white voters in new immigrant destinations were more likely to vote for
Trump, they did not seem to become more anti-immigrant or anti-trade; rather they voted for
Trump where his messaging gained more resonance. However, the direction of immigrant places
changed white voting in the midterms. The presence of immigrants had no effect on white voting
in 2016 but whites flipped their votes to Democrats in 2018 where there were more Latino
immigrants. White voters were less likely to vote for Trump where there more immigrants but by
2018, immigrant presence no longer had an effect. Finally, there was no correlation between
attitudes and local extent of trade with China or Mexico, in 2016 or 2018.
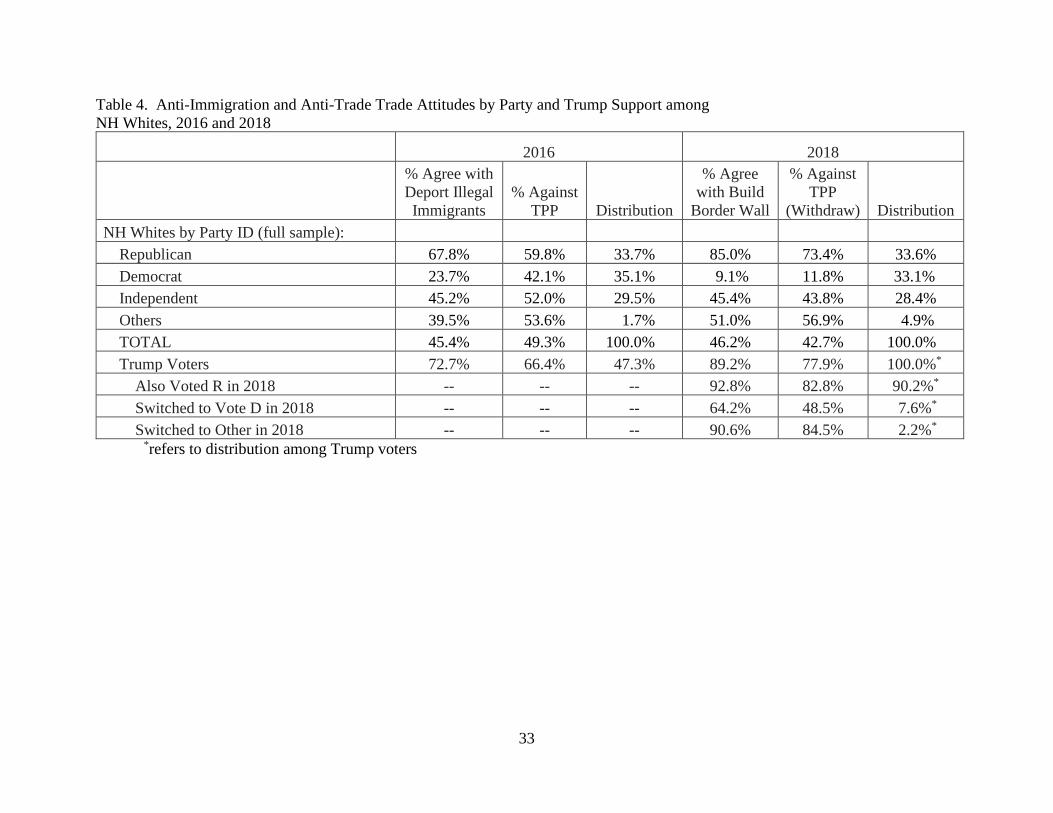
Table 4 uses the CCES data to show changes in anti-immigrant and anti-trade attitudes in
2016 and 2018. The top panel of Table 4 presents anti-trade and anti-immigration attitudes by
party for both years while the bottom panel shows 2018 attitudes among Trump voters that also
voted for a Republican candidate in the 2018 midterms versus those that flipped to vote for a
Democrat. The top panel of Table 4 are snapshots of American attitudes two years apart and the
bottom panel is retrospective and refers to voters in 2018 who had voted for Trump in 2016.
The top panel of Table 4 reveals that although the anti-immigrant attitudes being
measured differ in 2016 and 2018, the direction of the change in both immigrant and trade
attitudes by party reveals a contrasting shift in voter attitudes by party. Regarding immigration,
53 percent of Republicans agreed with deporting illegal immigrants in 2016 compared to 55
percent agreeing with building the border wall in 2018, a small change albeit these represent
distinct measures of immigrant attitudes. However, the contrast in changing attitudes by party is
striking. While anti-immigrant sentiments among Republicans increased for Republicans, anti-
immigrant attitudes declined from 23.7 to 9.1 percent among Democrats, a fall of fully 260
percent! Similarly, for trade attitudes. The share of Republicans against the TPP increased from
19
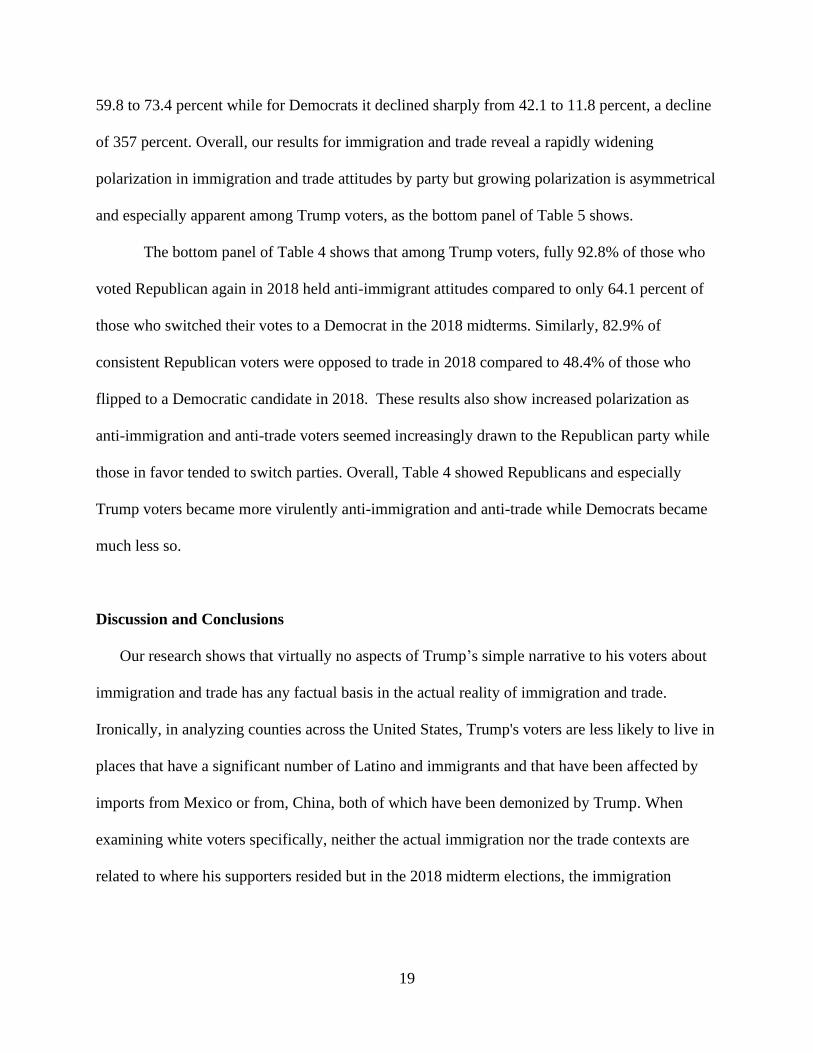
59.8 to 73.4 percent while for Democrats it declined sharply from 42.1 to 11.8 percent, a decline
of 357 percent. Overall, our results for immigration and trade reveal a rapidly widening
polarization in immigration and trade attitudes by party but growing polarization is asymmetrical
and especially apparent among Trump voters, as the bottom panel of Table 5 shows.
The bottom panel of Table 4 shows that among Trump voters, fully 92.8% of those who
voted Republican again in 2018 held anti-immigrant attitudes compared to only 64.1 percent of
those who switched their votes to a Democrat in the 2018 midterms. Similarly, 82.9% of
consistent Republican voters were opposed to trade in 2018 compared to 48.4% of those who
flipped to a Democratic candidate in 2018. These results also show increased polarization as
anti-immigration and anti-trade voters seemed increasingly drawn to the Republican party while
those in favor tended to switch parties. Overall, Table 4 showed Republicans and especially
Trump voters became more virulently anti-immigration and anti-trade while Democrats became
much less so.
Discussion and Conclusions
Our research shows that virtually no aspects of Trump’s simple narrative to his voters about
immigration and trade has any factual basis in the actual reality of immigration and trade.
Ironically, in analyzing counties across the United States, Trump's voters are less likely to live in
places that have a significant number of Latino and immigrants and that have been affected by
imports from Mexico or from, China, both of which have been demonized by Trump. When
examining white voters specifically, neither the actual immigration nor the trade contexts are
related to where his supporters resided but in the 2018 midterm elections, the immigration

20
context may have become important as many Trump voters switched to vote for Democrats,
especially in counties with more Latino immigrants.
When we did find a relation between immigration and Republican voting in 2016 and
2018, it was paradoxically negative. That is, whites voted for Republicans in places where there
were fewer Latino immigrants (stock), suggesting that contact with Latino immigrants may have
led to greater acceptance and reduced fear of them and an understanding of their economic and
social benefits. These places tended to have a longstanding presence of Latinos and better
economic prosperity than in the U.S. heartland. On the other hand, we also find that white voters
went for Trump and Republicans where there was greater percentage growth in the Latino
immigrant population, which characterize the so-called “new destinations.” These places had few
Latinos before the 1990s. Trump’s nativist and anti-Latino rhetoric seems to have resonated
with whites experiencing the sudden appearance of Latinos and their own economic problems,
even though the latter were not associated with immigration. Most importantly, our findings
show that anti-immigrant and anti-trade attitudes rather than actual immigration and trade, more
consistently and more strongly explain Trump voting in 2016 and the loss of 40 Republican
House seats, two years later.
Our research demonstrates that using data on actual trade and migration challenges both the
economic and attitudinal based explanations for Trump support. Rather our research shows the
existence of a Trump Paradox which exposes dual yet systematic contradictions between Trump
voter behavior and actual economic exposure to trade and immigration, as well as contradictions
between the attitudinally perceived economic and social impacts compared to actual economic
and social exposure to trade and immigration. We do, however, confirm that places that voted

21
for Trump are more economically challenged by unemployment and failing incomes than others.
Yet these challenging economic conditions are unrelated to exposure to trade and immigration.
Trump used nationalist rhetoric to tie poor economic conditions with globalization and
diversity (Monnat, 2016; Rothwell & Rosell, 2016), successfully mobilizing voters on the
underlying sentiments that trade and immigration have hurt them. However, his rhetoric
obfuscates the deeper underlying dynamics of high unemployment and low income by falsely
blaming trade and immigration for the economic challenges of unemployment and poverty. The
challenging economic conditions in much of Trump country are real but are unrelated to local
exposure to international trade and immigration. In the wake of Trump’s political ascension, the
worst thing that America’s policy makers could do is to treat Trump supporters’ misdirected
anger as a set of legitimate grievances in need of redress through anti-immigrant and anti-trade
policies.
The overall results suggest that Trump rallied white voters to support him by stoking
xenophobic and racist sentiments. Indeed, Trump’s strategy was likely based on corralling voters
by enhancing these feelings rather than any real concerns over the economic interests of voters.
However, the backlash against Republican candidates in the House midterms seems to reflect a
growing rejection of that strategy as Republicans with more moderate immigration and trade
attitudes flipped to Democratic candidates. Party polarization also increased as Republicans
overall became more stridently anti-immigrant and anti-trade while the percent of Democrats
holding those attitudes greatly diminished.
Trump’s ability to successfully tap into anxieties about immigration and trade rather than the
presence or threat of actual immigration and trade is consistent with social science research
showing that economic self-interest generally has relatively little effect on sociopolitical

22
attitudes, especially when they concern issues of race and immigration (Sears & Funk, 1991;
Citrin et al., 1997; Green & McElwee, 2018). Instead attitudes about immigrants or racialized
others may be based on factors such as media exposure (Herricourt & Spielvogel, 2014),
religious identity (Margolis, 2018), racial anxieties (Sears & Funk, 1991) or stereotypes about
Latinos (Timberlake, Howell, Grau & Williams, 2016), all of which have been further stimulated
during Trump’s campaign and administration. They may see people of color growing in political
power and changing the meaning of American culture because of immigration. Whites may
perceive that globalization, largely represented by international trade, also threatens American
power (Mutz, 2018). Our evidence suggests that Trump’s support is based on such racialized
beliefs even though leading scientific evidence suggests that diversity and globalization may be
beneficial to (or at least, does not harm) even white working-class voters (National Academies of
Sciences, 2017).
The need to provide solid data and critical analysis is now more important than ever,
particularly with respect to an understanding of the real forces driving the Trump phenomenon.
Rarely does research examine actual trade and migration and weakly informed questioning by
the media and their misleading reports legitimizes Donald Trump’s false claims about the real
problems facing the economy has implicitly endorsed a dangerously wrong-headed set of
solutions: implementing the highly restrictive trade and/or migration policy that Trump proposes
would disproportionately hurt those areas that voted for Trump.

23
References
Abrajano, M., and Hajnal, Z. 2015. White backlash: Immigration, race, and American politics.
New Jersey. Princeton University Press.
Autor, D., D. Dorn, and G.H. Hanson. 2016. The China shock: Learning from labor-market
adjustment to large changes in trade. Annual Review of Economics 8: 205–40.
Autor, D., D. Dorn, G.H. Hanson, and K. Majlesi. 2016. Importing Political Polarization? The
Electoral Consequences of Rising Trade Exposure. No. w22637. Cambridge, MA:
National Bureau of Economic Research.
Altick, J.R., L.R. Atkeson, and W.L. Hansen. 2018. Economic voting and the 2016 election.
Unpublished manuscript.
Blalock, H.M. 1967. Toward a Theory of Minority-Group Relations. New York: John Wiley &
Sons.
Bobo, L.D., 2017. Racism in Trump's America: reflections on culture, sociology, and the 2016
US presidential election. The British Journal of Sociology, 68, pp.S85-S104.
Chavez, L., 2013. The Latino threat: Constructing immigrants, citizens, and the nation. Stanford
University Press.
Citrin, J., D.P. Green, C. Muste, and C. Wong. 1997. Public opinion toward immigration reform:
The role of economic motivations. Journal of Politics 59(3): 858–81. Retrieved from
https://www.journals.uchicago.edu/doi/abs/10.2307/2998640.
Colantone, I., and P. Stanig. 2018. The trade origins of economic nationalism: Import
competition and voting behavior in Western Europe. American Journal of Political
Science (April 18). DOI.org/10.1111/ajps.12358.
CCES (Congressional Cooperative Election Survey) 2020. Data and surveys consulted at various
periods in 2019 and 2020 at https://cces.gov.harvard.edu.

24
Davis, B., and J. Hilsenrath. 2016.. How the China shock, deep and swift, spurred the rise of
Trump. Wall Street Journal, August 11. Retrieved from
https://www.wsj.com/articles/how-the-china-shock-deep-and-swift-spurred-the-rise-of-
trump-1470929543.
Furman, J. 2018. How immigrants can make the economy, and the nation, stronger: Toxic
nationalism will exacerbate the economic slowdown that fueled its emergence. Market
Watch. Retrieved from https://www.marketwatch.com/story/how-immigrants-can-make-
the-economy-and-the-nation-stronger-2018-07-18.
Green, J. 2017. Devil’s Bargain: Steve Bannon, Donald Trump, and the Storming of the
Presidency. New York: Penguin.
Green, J., and S. McElwee. 2018. The differential effects of economic conditions and racial
attitudes in the election of Donald Trump. Perspectives on Politics 1–22.
Greenstone, M., and A. Looney. 2010. Ten facts about immigration. Policy Memo. The Hamilton
Project. Retrieved from https://www.brookings.edu/wp-
content/uploads/2016/06/09_immigration.pdf.
Hainmueller, Jens and Michael J. Hiscox. “Attitudes toward Highly Skilled and Low-skilled
Immigration: Evidence from a Survey Experiment.” American Political Science Review
104.01 (2010): 61-84.
Héricourt, J. and Spielvogel, G., 2014. Beliefs, media exposure and policy preferences on
immigration: Evidence from Europe. Applied Economics, 46(2), pp.225-239.
Hood III, M.V., and I.L. Morris. 1997 ¿Amigo o enemigo? Context, attitudes, and Anglo public
opinion toward immigration. Social Science Quarterly78(2): 309–23.
Hooghe, M., and R. Dassonneville. 2018. Explaining the Trump vote: The effect of racist
resentment and anti-immigrant sentiments. PS: Political Science & Politics 51(3): 528–
34. DOI: https://doi.org/10.1017/S1049096518000367.
25
Hopkins, D. J. 2010. Politicized places: Explaining where and when immigrants provoke local
opposition. American Political Science Review 104(1): 40–60.
Huntington, S.P. and S. Dunn 2004. Who are we? The challenges to America´s national identity.
New York: Simon & Schuster.
Kamarck, E., and Podkul, A. 2018. Role reversal: Democrats and Republicans express surprising
views on trade, foreign policy, and immigration. Brookings Institute. Retrieved from
https://www.brookings.edu/blog/fixgov/2018/10/25/role-reversal-democrats-and-
republicans-express-surprising-views-on-trade-foreign-policy-and-immigration/
King, G. 2013. A Solution to the Ecological Inference Problem: Reconstructing Individual
Behavior from Aggregate Data. Princeton, NJ: Princeton University Press.
Krogstand, J.M., and M.H. Lopez. 2015. Hispanic population reaches record 55 million, but
growth has cooled. June 25. Pew Research Center, Washington, DC. Retrieved from
https://www.pewresearch.org/fact-tank/2015/06/25/u-s-hispanic-population-growth-
surge-cools/
Margolis, M.F., 2018. How politics affects religion: Partisanship, socialization, and religiosity in
America. The Journal of Politics, 80(1), pp.30-43.
McDermott, Monica. 2011. "Black attitudes and Hispanic immigrants in South Carolina." In
Edward Telles, Mark Sawyer and Gaspar Salgado (eds.) Just neighbors? Black-Latino
Relations in the United States. New York: Russel Sage Foundation Press: 242-26
Marrow, Helen B. 2020. "Hope turned sour: second-generation incorporation and mobility in
US new immigrant destinations." Ethnic and Racial Studies 43.1: 99-118.
McElvein, E. 2016. Border Battle: New Survey Reveals Americans’ Views on Immigration,
Cultural Change. Washington, DC: Brookings Institution Press.
Mendelberg, T. 2001. The Race Card: Campaign Strategy, Implicit Messages, and the Norm of

26
Equality. Princeton, NY: Princeton University Press.
Monnat, S.M. 2016. Deaths of despair and support for Trump in the 2016 presidential election.
Research Brief 5. Department of Agricultural Economics, Pennsylvania State University,
University Park.
Morgan, S.L. 2018. Status threat, material interests, and the 2016 presidential vote. Socius 4: 1-
17. DOI/10.1177/ 2378023118788217.
Mutz, D. 2018a. Status threat, not economic hardship, explains the 2016 presidential vote.
Proceedings of the National Academy of Sciences 115(19): E4330–E4339.
DOI.org/10.1073/pnas.1718155115.
Mutz, D., 2018b. Response to Morgan: On the role of status threat and material interests in the
2016 election. Socius 4: 1-11.
Myers, D., 2007. Immigrants and boomers: Forging a new social contract for the future of
America. Russell Sage Foundation.
National Academies of Sciences, Engineering, and Medicine. 2017. The Economic and Fiscal
Consequences of Immigration. Washington, DC: National Academies Press.
Nakamura, D., Wagner, J., and Miroff, N. 2019. Trump announces migration deal with Mexico,
averting threatened tariffs. The Washington Post. Retrieved from
https://www.washingtonpost.com/politics/trump-could-decide-over-the-weekend-to-hold-
off-on-tariffs-white-house-official-says/2019/06/07/6adb7d86-892d-11e9-98c1-
e945ae5db8fb_story.html
Ordoñez, F., and Kumar, A. 2018. How Trump plans to make Mexico pay for the wall. Yes,
really. McClatchy DC. Retrieved from https://www.mcclatchydc.com/news/politics-
government/white-house/article198740894.html
Quillian, L. 1995. Prejudice as a response to perceived group threat: Population composition and
anti-immigrant and racial prejudice in Europe. American Sociological Review, 60(4):
27
586–611.
Raudenbush, S.W., and A.S. Bryk. 2002. Hierarchical Linear Models: Applications and Data
Analysis Methods. Vol. 1. Thousand Oaks, CA: Sage.
Rothwell, J.T., and P. Diego-Rosell. 2016. Explaining nationalist political views: The case of
Donald Trump. November 2. Retrieved from
https://papers.ssrn.com/sol3/papers.cfm?abstract_id=2822059.
Sears, D.O., and C. Funk. 1991. The role of self-interest in social and political attitudes.
Advances in Experimental Social Psychology 24: 1–91.
Thrush, G. 2020. Full Transcript: President Trump´s Republican National Convention Speech.
The New York Times. Retrieved from:
https://www.nytimes.com/2020/08/28/us/politics/trump-rnc-speech-transcript.html
Valentino, N.A., V.L. Hutchings, and I.K. White. 2002. Cues that matter: How political ads prime
racial attitudes during campaigns. American Political Science Review 96(1): 75–90.
Waldow, Julia. 2018. “What Journalists Got Wrong about Voters in the 2016 Election.” Cnn.com.
Date?
Young, J. 2017. Making America 1920 Again? Nativism and US Immigration Past and Present.
Journal on Migration and Human Security 5: 217-235. New York. Center for Migration
Studies of New York.
Yúnez-Naude , Antonio, Jorge Mora-Rivera, and Yatziry Govea-Vargas. 2020. What Is the
Relationship between US-Mexico Migration and Trade in Agriculture? Unpublished
manuscript.

28
Figure 1. Trump Vote Share in 2016 by logged Hispanic Immigration
and Imports from Mexico and China for U.S. Counties

29
Figure 2. US House Elections Results for 2016-2018 by Party
by logged Hispanic Immigration and Imports from Mexico and
China for U.S. Counties

30
Table 1. Coefficients (and Standard Errors) for Hierarchical Regressions Predicting Trump Vote
among NH White Voters (Models 1 & 2) Levels and Trump Vote among Whites that Voted for
Romney in 2012 (Jiahui, please insert standard errors in models 3 and 4), 2016
Samples and Models
All White Voters Whites that Voted for Romney
Individual Level 1 2 3 4
Independent 1.830***
(0.0693)
1.603***
(0.0697)
0.877*** 0.791***
Republican 4.008***
(0.123)
3.731***
(0.117)
2.039*** 1.977***
Female -0.229***
(0.0462)
-0.00874
(0.0459)
-0.330*** -0.0397
B.A. or more -0.733***
(0.0472)
-0.572***
(0.0562)
-0.838*** -0.741***
Age over 65 0.383***
(0.0607)
0.293***
(0.0707)
0.751*** 0.638***
Mean Family Income (log) -0.0569
(0.0319)
-0.0363
(0.0371)
0.0269 0.0512
Income Undeclared 0.199**
(0.0672)
0.0844
(0.0707)
0.505*** 0.410***
Temporary Laid Off -0.298
(0.342)
-0.222
(0.360)
1.031** 1.074*
Unemployed 0.482***
(0.133)
0.285
(0.147)
0.234 -0.0909
Manufacturing Job 0.346***
(0.0900)
0.135
(0.0967)
0.237* 0.118
Agree w Deporting Illegals -- 1.991***
(0.0485)
1.381***
Against Trans-Pacific
Partnership (TPP)
-- 0.854***
(0.0476)
1.228***
County Level
% Hispanic immigrant (log) -1.049
(1.542)
-0.134
(1.462)
-2.179 -1.446
Imports from Mexico -0.0292*
(0.0135)
-0.0247
(0.0151)
0.0535** 0.0493*
Imports from China 0.0923***
(0.0201)
0.0919***
(0.0208)
-0.0409 -0.0262
% Hisp. Immigration Growth
1990-2000
0.0352**
(0.0133)
0.0356*
(0.0146)
0.125*** 0.130***
Constant -0.891*
(0.382)
-2.514***
(0.432)
0.907 -0.974
N 29,593 29,536 12,420 12,400
N Groups 2,262 2,262 1,901 1,901
Source: CCES (individual data) & xxxx
Robust standard errors in parentheses
Significance: *** p<0.001, ** p<0.01, * p<0.05
31
Table 2. Coefficients (and Standard Errors) for Hierarchical Logit
Regression Predicting that Voters Switch to Voting for Democratic
House Candidate in 2018 among NH White Trump Voters
Variables Models
Individual Level 1 2
Independent -1.409***
(0.177)
-1.396***
(0.180)
Republican -2.664***
(0.155)
-2.646***
(0.163)
Female 0.339***
(0.0975)
0.0517
(0.109)
B.A. or more -0.0594
(0.0956)
-0.143
(0.106)
Age over 65 -0.542***
(0.0986)
-0.302**
(0.104)
Mean Family Income (log) -0.230***
(0.0672)
-0.165*
(0.0726)
Income Not Declared -0.692***
(0.144)
-0.431**
(0.151)
Temporary Laid Off 0.711
(0.729)
0.737
(0.740)
Unemployed -0.981*
(0.486)
-1.070*
(0.493)
Manufacturing Job 0.227
(0.130)
0.336*
(0.149)
Agree w Building Border Wall -- -1.643***
(0.151)
Against Trans-Pacific Partnership -- -1.289***
(0.121)
County Level
% Hispanic immigrant (log) 4.933***
(1.184)
5.241***
(1.196)
Imports from Mexico 0.0591
(0.0385)
0.0650
(0.0430)
Imports from China -0.161***
(0.0391)
-0.167***
(0.0386)
% Hisp. Immigration Growth
1990-2000
-0.162*
(0.0754)
-0.160*
(0.0743)
Constant 1.460
(0.767)
2.987***
(0.836)
N 10,819 10,758
N Groups 1,890 1,883
32
Table 3. Coefficients (and Standard Errors) for Hierarchical Logit Regression Predicting
Attitudes about Immigration and Trade in 2016 and 2018 among Non-Hispanic Whites
Variables 2016 2018
Individual Level Deport
Illegals
Against
TPP
Build
Wall
Withdraw
from TPP
Independent 0.977***
(0.0526)
0.443***
(0.0477)
1.611***
(0.0715)
1.290***
(0.0516)
Republican 1.862***
(0.0660)
0.741***
(0.0484)
3.607***
(0.0883)
2.501***
(0.0509)
Female -0.265***
(0.0378)
-0.608***
(0.0412)
-0.640***
(0.0450)
-0.696***
(0.0282)
B.A. or more -0.539***
(0.0473)
-0.0797**
(0.0289)
-0.523***
(0.0503)
-0.321***
(0.0437)
Age over 65 0.166***
(0.0446)
0.456***
(0.0360)
0.635***
(0.0584)
0.422***
(0.0392)
Mean Family Income (log) -0.0527
(0.0305)
0.0208
(0.0244)
0.0580*
(0.0343)
0.113***
(0.0302)
Income Not Declared 0.145*
(0.0597)
0.423***
(0.0614)
0.275**
(0.0871)
0.237**
(0.0746)
Temporary Laid Off -0.0111
(0.238)
-0.147
(0.179)
-0.225
(0.421)
-0.263
(0.372)
Unemployed 0.289*
(0.117)
0.323***
(0.0976)
-0.261
(0.142)
-0.222*
(0.109)
Manufacturing Job 0.406***
(0.0596)
0.244***
(0.0654)
0.423***
(0.0766)
0.262***
(0.0723)
County Level
% Hispanic immigrant .577
(0.827)
-1.139*
(0.566)
1.633*
(1.077)
0.0966
(0.668)
Growth of Hispanic Immigrant
Population 1990-2000
0.0247
(0.0214)
0.000868
(0.0101)
0.0529
(0.0183)
0.0198*
(0.0125)
Imports from Mexico 0.0176
(0.0121)
0.00456
(0.0101)
-0.00622
(0.0142)
-0.00685
(0.0119)
Imports from China -0.0144
(0.0132)
-0.00721
(0.0117)
-0.0201
(0.0140)
0.00230
(0.0149)
Trump Vote Share 1.227***
(0.170)
.443***
(0.168)
1.724***
(0.214)
1.099***
(0.151)
Constant -0.184
(0.338)
-0.198
(0.270)
-1.976***
(0.377)
-2.310***
(0.346)
N 31,568 31,506 33,342 33,419
N Groups 2,295 2,295 2,367 2,365
Robust standard errors in parentheses
Data Source: CCES, American Community Survey
Significance: *** p<0.001, ** p<0.01, * p<0.05
33
Table 4. Anti-Immigration and Anti-Trade Trade Attitudes by Party and Trump Support among
NH Whites, 2016 and 2018
2016 2018
% Agree with
Deport Illegal
Immigrants
% Against
TPP Distribution
% Agree
with Build
Border Wall
% Against
TPP
(Withdraw) Distribution
NH Whites by Party ID (full sample):
Republican 67.8% 59.8% 33.7% 85.0% 73.4% 33.6%
Democrat 23.7% 42.1% 35.1% 9.1% 11.8% 33.1%
Independent 45.2% 52.0% 29.5% 45.4% 43.8% 28.4%
Others 39.5% 53.6% 1.7% 51.0% 56.9% 4.9%
TOTAL 45.4% 49.3% 100.0% 46.2% 42.7% 100.0%
Trump Voters 72.7% 66.4% 47.3% 89.2% 77.9% 100.0%*
Also Voted R in 2018 -- -- -- 92.8% 82.8% 90.2%*
Switched to Vote D in 2018 -- -- -- 64.2% 48.5% 7.6%*
Switched to Other in 2018 -- -- -- 90.6% 84.5% 2.2%* *refers to distribution among Trump voters
34
Appendix
The Following are Available from Authors:
Maps of Counties by Trump Voting, Immigration and Imports
Individual Level Regressions with Congressional District Level Data
Regressions at County Level
Regressions at Congressional District Level