trust and development: the deep structure of institutions
TRANSCRIPT

Doctoral thesis
Trust and Development: The Deep Structure of Institutions-
Building and Socio-Economic Performance
Gao, Lin
Fachbereich Wirtschaftswissenschaft
Gutachter:
1. Prof. Dr. Wolfram Elsner
2. Prof. Dr. Christian Cordes
September 2019


Contents
List of figures ............................................................................................................................ v List of tables ............................................................................................................................ vii Acknowledgements .................................................................................................................. ix
Chapter 0: Introduction ............................................................................................................... 1 0.1 Issues under study ..................................................................................................... 1 0.2 Structure of this thesis ............................................................................................... 5 0.3 Methods applied ........................................................................................................ 6
0.3.1 Comparison analysis ......................................................................................... 6 0.3.2 Empirical analysis ............................................................................................. 6 0.3.3 Agent-based modeling ...................................................................................... 8
0.4 Expected contributions to scientific research .......................................................... 10 Chapter 1: Thinking Trust Systemically in Socio-Economic Environment .............................. 12
1.1 Trust ........................................................................................................................ 12 1.1.1 Describing trust ............................................................................................... 12 1.1.2 Characteristics of trust ..................................................................................... 13 1.1.3 Types of trust ................................................................................................... 16
1.2 On generalized trust ................................................................................................ 19 1.2.1 Generalized trust and particularized trust, and trust in strangers: a revision of understanding .................................................................................................................. 19 1.2.2 Group trust and generalized trust .................................................................... 21 1.2.3 Formation and implementation of general trust .............................................. 23 1.2.4 Experience and expectation ............................................................................. 27
1.3 Measures and representation of (general) trust ....................................................... 29 1.3.1 Measuring general trust at micro level using survey data ............................... 29 1.3.2 Measuring general trust at macro level using survey data .............................. 31 1.3.3 Measuring trust using the investment actions in a trust game ......................... 31 1.3.4 Measuring social trust using the cooperation share in evolutionary game theoretical agent-based modeling .................................................................................... 32 1.3.5 Representing micro trust using probability ..................................................... 33
1.4 Trust at the micro level: both thoughts and behavior matter ................................... 33 1.4.1 Thoughts and trust ........................................................................................... 33 1.4.2 Behavior and trust ........................................................................................... 34
1.5 Trust and trustworthiness ........................................................................................ 36 1.5.1 Relation between trust and trustworthiness ..................................................... 36 1.5.2 Individual and social costs of untrustworthiness ............................................. 37 1.5.3 Correspondence and superposition of the role as a trustor and a trustee ......... 38 1.5.4 Supply of and demand for trust and trustworthiness ....................................... 40
1.6 Information acquisition and output: social learning and interactions...................... 41

1.6.1 Types of behavior ............................................................................................ 41 1.6.2 Types and filtering process of information ...................................................... 43 1.6.3 Bandura (1977): Social learning theory .......................................................... 46 1.6.4 Types of social learning ................................................................................... 47 1.6.5 What to learn? – Social learning and trust and trustworthiness ...................... 48 1.6.6 Examples of objects of (generalized) social learning: perspective of interpersonal relationships .............................................................................................. 50 1.6.7 Learning channels: in and beyond individual immediate interaction network 52 1.6.8 Distances and interpersonal relationships ....................................................... 54 1.6.9 Networking micro to macro and heterogeneity of networks ........................... 58
1.7 Spatial mobility and trust, and social mobility ........................................................ 61 1.7.1 Geographical mobility ..................................................................................... 61 1.7.2 Geographical mobility and trust ...................................................................... 63 1.7.3 A short discussion on geographic mobility and social mobility, and social capital 65
1.8 Institutions ............................................................................................................... 65 1.8.1 Categorization I of institutions: problem-solving, problem-avoiding, influence-controlling and blame-apportioning ................................................................................ 66 1.8.2 Manifestation of potential problems ............................................................... 67 1.8.3 Deepness of institutions .................................................................................. 68 1.8.4 Categorization II of institutions: value-type institutions and constructed institutions ....................................................................................................................... 68 1.8.5 On the origin of institutions ............................................................................ 69 1.8.6 On the diffusion of institutions ........................................................................ 71 1.8.7 Reasons of conforming to institutions ............................................................. 75 1.8.8 Trustworthiness as an institution and institutionalized trust............................ 77
1.9 Three networks: Institutional networks, causality networks and information networks 79
1.9.1 Institutional networks ...................................................................................... 79 1.9.2 Causality network ............................................................................................ 81 1.9.3 Personal information networks ........................................................................ 82 1.9.4 Trust in the three networks .............................................................................. 86
1.10 (Dis)Trust and economic transactions ..................................................................... 88 1.11 Interim conclusion ................................................................................................... 91
Chapter 2: Some Socio-Economic Aspects of China and Scandinavia ..................................... 95 2.1 Introduction ............................................................................................................. 95 2.2 Population and network structures .......................................................................... 96
2.2.1 Meaning of population to trust ........................................................................ 96 2.2.2 Population size and composition of China and Scandinavia ........................... 99 2.2.3 Social structure: China vs. the West .............................................................. 104 2.2.4 Family structure: Denmark vs. China............................................................ 107 2.2.5 Membership: China vs. Scandinavia ............................................................. 113
2.3 Welfare, equality, change, expectations, and certainty .......................................... 122

2.3.1 The Nordic welfare model: an overview ....................................................... 122 2.3.2 Welfare policies in Scandinavia and China ................................................... 128 2.3.3 Equality ......................................................................................................... 133 2.3.4 Uncertainty .................................................................................................... 138
2.4 Social mobility and geographic mobility in China ................................................ 140 2.4.1 Social mobility .............................................................................................. 140 2.4.2 Geographic mobility ...................................................................................... 143
2.5 Social capital ......................................................................................................... 146 2.5.1 What is social capital? ................................................................................... 146 2.5.2 Elements of social capital .............................................................................. 147 2.5.3 People and channels of acquiring social capital ............................................ 148
2.6 Interpersonal trust.................................................................................................. 155 2.6.1 General trust .................................................................................................. 156 2.6.2 Trust in different kinds of people .................................................................. 160
2.7 Other socio-economic performance ...................................................................... 165 2.7.1 Performance of macro-economy ................................................................... 165 2.7.2 Public security ............................................................................................... 172
2.8 Interim conclusions ............................................................................................... 173
Chapter 3: What Affect General Trust? Perspective from Norm-Conforming, Opinion Similarity and Geographic Mobility: Empirical Evidence from China ......................................................... 178
3.1 Introduction ........................................................................................................... 178 3.2 Determinants of general trust: a new perspective ................................................. 180
3.2.1 Impact of others’ behavior: breaching norms ................................................ 180 3.2.2 Impact of others’ opinion .............................................................................. 184 3.2.3 Geographical mobility ................................................................................... 184 3.2.4 Other factors .................................................................................................. 185
3.3 Data, variables and descriptive statistics ............................................................... 186 3.3.1 Data set overview .......................................................................................... 186 3.3.2 Variable selection and construction ............................................................... 186
3.4 Econometric models and results ............................................................................ 191 3.4.1 Ordered logit model ...................................................................................... 191 3.4.2 (Multi)Correlation between explanatory variables ........................................ 192 3.4.3 Regression results of ordered logit model ..................................................... 199
3.5 Interim conclusions ............................................................................................... 211
Chapter 4: Between Trust and Performance: An Information-driven Socio-Economic Mechanism on Directed Weighted Regular Ring with Agent-Based Modeling ............................ 213
4.1 Introduction ........................................................................................................... 213 4.2 Interested parameters ............................................................................................ 215 4.3 Experimental design .............................................................................................. 216
4.3.1 Artificial society and network structure ........................................................ 216 4.3.2 Initialization of agents’ attributes .................................................................. 216 4.3.3 Micro-level process ....................................................................................... 218
4.4 Results and analysis .............................................................................................. 228 4.4.1 Baseline simulation ....................................................................................... 230 4.4.2 Degree of embeddedness in social network .................................................. 230 4.4.3 Mutation probability of payoff matrix ........................................................... 231 4.4.4 Mutated payoff matrix ................................................................................... 232 4.4.5 Probability of information diffusion in neighbors ......................................... 233 4.4.6 Probability of information diffusion in non-neighbors ................................. 234
4.5 Interim conclusions ............................................................................................... 235
Chapter 5: Summary and Conclusions, with Some Thoughts on Information, Education and Formal Institutions ........................................................................................................................ 237
5.1 Summary and conclusions ..................................................................................... 237 5.2 Some thoughts on information, education and formal institutions ........................ 244
5.2.1 About information ......................................................................................... 244 5.2.2 About education ............................................................................................ 245 5.2.3 About formal institutions .............................................................................. 246
Appendix A: Selected questions from CGSS 2013 Questionnaire B .......................... 247 Appendix B: Resident population and inter-provincial immigration of selected provincial administrative divisions of P.R. China, 2010 ....................................................... 249 Bibliography ......................................................................................................................... 251

v
List of figures
Figure 1.1 Types of trust. ........................................................................................................ 18 Figure 1.2 A possible relation of generalized trust and trust in strangers. ............................... 20 Figure 1.3 Formation and implementation of general trust. .................................................... 26 Figure 1.4 Experience and expectation. .................................................................................. 27 Figure 1.5 Correspondence and superposition of the role as a trustor and a trustee in an
interaction in a 2-person trust relationship. ..................................................................... 39 Figure 1.6 The supply and demand of trust and trustworthiness. ............................................ 41 Figure 1.7 Interaction information feedback between micro- and macro-level. ..................... 45 Figure 1.8 Reciprocal determinism in psychological function of Bandura’s (1977) Social
Learning Theory. ............................................................................................................. 46 Figure 1.9 Social distance and social class. ............................................................................ 56 Figure 1.10 Individual geographical mobility: short-time vs. long-time. ............................... 63 Figure 1.11 (Dis)Continuous geographical distribution of population in an institution’s
diffusion. ......................................................................................................................... 72 Figure 1.12 Institutional diffusion with population mobility. ................................................. 74 Figure 1.13 Formation of reputation. ...................................................................................... 76 Figure 1.14 Reputation diffusors. ............................................................................................ 77 Figure 1.15 An institutional network and its supporting psychological factors. ..................... 80 Figure 1.16 Types of causality between two factors. .............................................................. 81 Figure 1.17 Personal information networks without spatial mobility. .................................... 84 Figure 1.18 Personal information networks with spatial mobility. ......................................... 85 Figure 1.19 Trust and institutional network, personal information network and causality
network ........................................................................................................................... 87 Figure 2.1 One of the differences between the social life of the West and China. ................ 105 Figure 2.2 Number of memberships in China. ...................................................................... 121 Figure 2.3 Number of memberships in Sweden. ................................................................... 121 Figure 2.4 Organisational chart of the financial structure of the Danish healthcare system. 131 Figure 2.5 Subjective social stratum at 14 years old and currently. ...................................... 141 Figure 2.6 Subjective socio-economic status compared with peers ...................................... 142 Figure 2.7 Subjective socio-economic status compared with 3 years ago ............................ 142 Figure 2.8 Frequency of meeting friends, relatives or colleagues, Denmark, Norway and
Sweden. ......................................................................................................................... 150 Figure 2.9 Frequency of taking part in social activities compared to peers. ......................... 151 Figure 2.10 Number of persons to whom one can discuss intimate or personal matters. ..... 152 Figure 2.11 Social activities in leisure time, China. .............................................................. 153 Figure 2.12 Occupations in social networks, China. ............................................................. 154 Figure 2.13 Diversity of occupations in social networks, China ........................................... 155 Figure 2.14 General trust in China, Denmark, Norway and Sweden. ................................... 157 Figure 2.15 General trust in China from CGSS. ................................................................... 158 Figure 2.16 General trust of Denmark, Norway and Sweden, 2002 – 2016. ........................ 159 Figure 2.17 Trust in people of different relations, China vs. Sweden. .................................. 162

vi
Figure 2.18 Trust in different kinds of people in social interactions without pecuniary benefits........................................................................................................................................ 163
Figure 2.19 Classification of working-age population. ......................................................... 166 Figure 2.20 Registered urban unemployment rate of China, 1997-2016. ............................. 166 Figure 2.21 Unemployment rate of Denmark, Norway and Sweden, 2000 – 2017. ............. 167 Figure 2.22 GDP (current US$) of China, Denmark, Norway and Sweden, 1960 – 2016. ... 169 Figure 2.23 GDP annual growth of China, Denmark, Norway and Sweden, 1961 – 2016. .. 170 Figure 2.24 GDP per capital, PPP (current international $) of China, Denmark, Norway and
Sweden, 1990 – 2016. ................................................................................................... 171 Figure 2.25 Have you been the victim of a crime during the past year? – China. ................ 172 Figure 2.26 And what about your immediate family – has someone in your family been the
victim of a crime during the last year? – China. ........................................................... 172 Figure 2.27 Have you been the victim of a crime during the past year? – Sweden. ............. 173 Figure 2.28 And what about your immediate family – has someone in your family been the
victim of a crime during the last year? – Sweden. ........................................................ 173 Figure 4.1 An overall framework for micro-level process. ................................................... 219 Figure 4.2 A flow chart for “Interaction, information diffusion and trust-updating” in each sub-
time period. ................................................................................................................... 220 Figure 4.3 Baseline simulation. ............................................................................................. 230 Figure 4.4 Comparing degrees of embeddedness in social networks. ................................... 231 Figure 4.5 Comparing mutation probabilities of payoff structures. ...................................... 232 Figure 4.6 Comparing mutated payoff matrices. ................................................................... 233 Figure 4.7 Comparing probabilities of information diffusion in neighbors. ......................... 234 Figure 4.8 Comparing probabilities of information diffusion in non-neighbors. .................. 235

vii
List of tables
Table 1.1 Impact of expectation and later facts on trust. ......................................................... 27 Table 1.2 Forms of trust in two-party interactions and its main behavioral party. .................. 36 Table 1.3 Possible mechanisms behind behavior: a perspective from internalized values. .... 43 Table 1.4 Types of causality between two factors. .................................................................. 81 Table 2.1 Population size of Denmark, Norway and Sweden from 2000 to 2017. ............... 100 Table 2.2 Population composition of Denmark. .................................................................... 100 Table 2.3 Membership of the National Church of Denmark from 2011 to 2017. ................. 100 Table 2.4 Immigrations and emigration of Sweden, 2011-2016. .......................................... 101 Table 2.5 Chinese population and its composition, 2010 – 2016. ......................................... 103 Table 2.6 Number of children 0-17 years old with siblings of Denmark, 2008-2017. .......... 109 Table 2.7 Children 0-17 years old by family type and number of siblings in Denmark, 2008 &
2017. .............................................................................................................................. 110 Table 2.8 Membership in Denmark, Norway and Sweden. ................................................... 115 Table 2.9 Membership in China. ........................................................................................... 117 Table 2.10 Active or inactive membership in China, Denmark, Norway and Sweden. ........ 119 Table 2.11 Average membership, China and Sweden. .......................................................... 122 Table 2.12 Percentage of expenditure on social protection in GDP ...................................... 126 Table 2.13 Percentage of total expenditure on social benefits in total expenditure on social
protection. ..................................................................................................................... 126 Table 2.14 Social benefits by function, % of total benefits. .................................................. 127 Table 2.15 Total expenditure on social protection per head of population, ECU/EUR. ........ 128 Table 2.16 The amount of children and youth benefit in 2017.............................................. 129 Table 2.17 Pension Index of China, Denmark, Norway and Sweden, 2017 ......................... 132 Table 2.18 Gini coefficients of market income (before taxes and transfers) of China, Denmark,
Norway and Sweden. .................................................................................................... 135 Table 2.19 Gini coefficients of disposable income (post taxes and transfers) of China, Denmark,
Norway and Sweden. .................................................................................................... 135 Table 2.20 Gini coefficient of equivalised disposable income of Denmark, Norway and Sweden
....................................................................................................................................... 136 Table 2.21 Gender gap index of China, Denmark, Norway and Sweden, 2006 – 2017 ........ 137 Table 2.22 Corruption perceptions indices of China, Denmark, Norway, and Sweden, 2012-
2017. .............................................................................................................................. 140 Table 2.23 Population of residence-registration inconsistency and floating population in China,
2000 – 2016. .................................................................................................................. 145 Table 2.24 Data existence of general trust in WVS and EVS for China, Denmark, Norway and
Sweden. ......................................................................................................................... 156 Table 3.1 Variable selection and construction from CGSS 2013. ......................................... 189 Table 3.2 Descriptive statistics of micro variables from CGSS 2013. .................................. 190 Table 3.3 Correlation between independent variables. .......................................................... 194 Table 3.4 Partial correlation between explanatory variables. ................................................ 196 Table 3.5 VIFs of explanatory variables. .............................................................................. 198

viii
Table 3.6 Ordered logit regression (Core explanatory variables only).................................. 201 Table 3.7 Ordered logit regression (Control variables only). ................................................ 202 Table 3.8 Ordered logit regression. ....................................................................................... 203 Table 3.9 Likelihood ratio test between ordered logit regressions. ....................................... 204 Table 3.10 Testing parallel lines assumption for ordered logit regression using Brant test. . 205 Table 3.11 Results of proportional odds model. .................................................................... 209 Table 3.12 Likelihood ratio test: ordered logit model vs. partial proportional odds model. . 211 Table 4.1 Weights of four kinds of information sources in ai’s trust-updating...................... 218 Table 4.2 Trust-updating directions. ...................................................................................... 225 Table 4.3 Parameter values. .................................................................................................. 229

ix
Acknowledgements
First of all, I wish to express my sincere gratitude to my supervisor, Prof. Dr. Wolfram Elsner, who provided me with a guest Ph.D. student position in his chair in the Faculty of Business Studies and Economics of the University of Bremen, gave me advice on my Ph.D. study and promotion, brought me to EAEPE and ASSA conference several times, and made comments on the manuscripts of my thesis and reviewed through it.
I wish to express my deepest gratitude and strongest love to my parents, Gao Wenfu and Gao Yingchun, who always give me their most unselfish love, and always support and encourage me.
I am extremely grateful to Prof. Dr. Christian Cordes who gave me comments when I presented my work in IINO Seminar and IERP seminar in the Faculty, agreed to be my second supervisor, and reviewed through my thesis.
I wish to express my sincere gratitude to Dr. Torsten Heinrich for his seminar “Simulation Models” in the University of Bremen where I learnt the implementation techniques of agent-based modeling with programming language Python and for his comments on the premilitary version of one chapter of this thesis. I am also indebted to Dr. Georg Schwesinger, Dr. Tong-Yaa Su and Dr. Rebecca Schmitt for comments on the premilitary draft of one to two chapters of this thesis.
I want to thank all my defense commission members, Prof. Dr. Wolfram Elsner, Prof. Dr. Christian Cordes, Prof. Dr. Shuanping Dai, Prof. Dr. Torben Klarl, Joshua Henkel and Mariia Shkolnykova, who spared time for my defense, from the bottom of my heart. I also would like to thank Dr. Mahmood Shubbak who attended my defense to support me. I wish to express my sincere gratitude to Prof. Dr. Shuanping Dai who gave me advice on my thesis after my defense.
I also would like to thank IINO and IERP Seminar in the Faculty every Wednesday afternoon, very good platforms for Ph.D. students to give presentations, share ideas and collect comments.
I wish to express my sincere gratitude to the China Scholarship Council (CSC) for financial support in the first three years of my Ph.D. study.
Gao, Lin
Bremen, Germany
September, 2019


Chapter 0: Introduction
0.1 Issues under study
The impact of non-economic factors on economic development/performance obtains more and more attention. This thesis unfolds tightly around “trust” which comes into the views of economists especially in the recent two decades (e.g., Knack and Keefer, 1997).
A country’s economic development and prosperity benefit its people. – This is one of the reasons why the achievements of a country in economy are so desirable. However, as we see, the imbalance of economic development worldwide seems normal. One of the issues that economists continuously inquire and explore is from where economic growth comes and why socio-economic performance is different among countries. So far, many factors, including both hard and relatively soft ones, or in another criterion, both economic and non-economic ones, have been proposed and proved to influence economic performance, directly and/or indirectly. Traditionally, hard factors are more emphasized. Here, we just roughly refer to factors like geographical location, land, traffic conditions (like rivers, estuaries, etc.), climate, natural resources, capital, labor force and so on as “hard factors”. – They are all important and play a crucial role in a country’s economic growth or recovery. Let’s take natural resources as an example. Oil-gas industry is the mainstay industry in countries like Saudi Arabia, Russia and Norway. Incomes from the export of oil and gas account for a substantial proportion of their GDP and government fiscal revenues. The high-grade iron ore and rich forest resources in Sweden ever helped it get rid of poverty in the 17th – 18th century. The discovery of diamond in South Africa in the second half of the 19th century boosts its transition to an industrialized country. It is no exaggeration to say that rich natural resources can often provide “the first pot of gold” for a country especially at the early stage of economic soar. Other conditions being equal, rich natural resources are always a natural advantage for a country. However, a noticeable, and somewhat abnormal, phenomenon – “curse of resources” or “Dutch disease” – reveals other non-negligible factors.
Relatively soft factors involve those based on knowledge and skills (such as human capital, technology, innovation and the like), institutions, historical events and so on. Why does diversity of economic performance continue even when nowadays materials and capital flow so fast around? – This is not only one of the motivations for North (1990, pp. 6-7) to dig into how institutions impact economic performance, but also one for other scholars from institutional economics, cultural economics, social economics and so on who attempt to search for answers from factors like institutions, culture, social environment etc. For example, what was along with the colonial activities of the Britain and Spain was the “exports” of their institutional arrangements. North, Summerhill and Weingast (2000) argue that it was the differences in shared belief system and institutional arrangements inherited from the British colonist and the Spanish that led to the different paths of political order and economic performance between North America and Latin America after their independence. Atlantic slave trade between the 15th and 19th century hurt the Africans both physically and psychologically, disrupted the normal course of African history, and has an extremely

Trust and Development: The Deep Structure of Institutions-Building and Socio-Economic Performance
2
negative impact on the economic development of Africa. The underdevelopment of Africa nowadays may attribute to the slave trade to a large degree. Also, apartheid (racial segregation) ever became an economic obstacle of South Africa. Other factors influencing economic development may also include international relation and geopolitics. Therefore, it can be said that a country’s or a region’s economic success is the result of the comprehensive influence of different factors. However, although there are many factors that may influence economic performance, obviously, different factors have a different effect on different countries, and each country has its own economic strengths and weaknesses.
It is admitted that poverty could be a vicious circle to some extent. It is just like the Matthew Effect that the rich get richer, while the poor get poorer. Without enough wealth, a poor country cannot afford to import necessary materials by international trade, nor is it capable enough to provide its people with sufficient and relatively high-quality education, healthcare, public security, welfare, etc., nor can it develop technology, support innovation or increase the added value of products, nor may it be attractive to foreign investment. – These all have a negative impact on further economic development. In a word, even though materials and capital move fast globally, generally their destinations are less likely poor and backward countries.
In spite of the many factors that affect the speed, quality and efficiency of economic development, as we have talked briefly and selectively above, this thesis more focuses on the social aspect. Economy is part of society. Just as what Granovetter (1985) argues, economic behaviors are embedded in society. Being separated from harmonious social environment, economic development and prosperity could not have been achieved or maintained. – This increasingly becomes a consensus as time passes. What is more, a society consists of humans. A notable phenomenon is that a substantial number of the determinants of economic performance are highly related to inter-personal interactions. There is no doubt that a well-functioning society will be advantageous to economic development; in contrast, an ill-functioning one will definitely encumber it.
Unequivocally speaking, it is trust that is going to be investigated in this thesis. Trust is one of the notable soft factors aforementioned. Usually, both the establishment and the maintenance of interpersonal relationships are not separable from trust. It permeates almost all aspects of human interactions, and affects our socio-economic life through directly influencing the willingness to interact or re-interact and the way of interactions. For example, in social activities, random interactions, business activities (such as, supplier selection), and production activities, consuming activities, and many other social and economic activities, trust all plays a crucial role therein. The benefits of relatively high inter-personal trust are obvious. For instance, it facilitates social and economic exchanges, boosts benign interactions like win-win cooperation, enhances social coherence, is conducive to overcome social dilemmas, saves monitoring cost, and so on and so forth. Trust here means a positive feedback of a trustworthy social environment, is the reflection of perceived trustworthiness, the expectation of not being deceived or not being treated unfairly, the belief of good moral quality of others and the expectation of the benevolence of potential interactors. Thus, trust here is not credulity, it has an experiential and informational foundation.
However, we should not neglect the fact that in interactions, trust can not only be built, but also be damaged. Which outcome will be reached in the end depends on the interactions per se: Benign interactions could increase trust and the possibility of further interactions, while vicious ones could

Chapter 0: Introduction
3
lead trust to decline and decrease the willingness to interact in future.
Trust has been a research topic in psychology and sociology for a long time. However, its impact on economy seems to get noticed and to become a hot point only in the recent two decades. So far, the empirical impact of trust (such as, general trust and inherited trust) on economic performance, either in a direct or indirect way, has been largely discussed (e.g., Algan and Cahuc, 2010; Beugelsdijk et al, 2004; Bjørnskov, 2012; Dearmon and Grier, 2009; Knack and Keefer, 1997; Lim, Morshed and Khun, 2018; Peiró-Palomino and Tortosa-Ausina, 2013; Whiteley, 2000; Zak and Knack, 2001, and so on). In general, most empirical research, as far as I know, tends to hold that interpersonal trust has a significant positive influence on economic performance. Therefore, research on trust and trust-relevant topics gets both more important and more necessary in the areas of study for economics.
Having recognized the importance of trust in socio-economic life, some issues centering on trust should be clarified, explored and explicated. This thesis is going to cover from theory to phenomenon, from empirical analysis to simulation, and is intended to present rich contents of both depth and interest.
Issue 1 is theoretical, is about trust per se and some other social and realistic factors that are not separable from trust. With trust being the research object, we should first of all have a relatively comprehensive and deep understanding of trust. In terms of trust per se, what is its nature? What characteristics does trust have? What are the subtle differences between some common types of trust in economic research? How does trust get generalized from various experiences and transmitted into expectation? How can we measure trust? – These are questions about the basics of trust. How is trust at the individual (micro) level from the perspective of a trustor? How is the relation between trust and trustworthiness? What are the costs of untrustworthiness for individuals and society in general? How is the role as a trustor and a trustee distributed in an interaction relationship? How should we understand the supply and demand of the uncountable, abstract trust and trustworthiness? – These are questions about the two corresponding concepts of trust and trustworthiness. What socio-economic factors or processes are essential for the trust mechanism in socio-economic environment? How do they per se function? How are they connected to trust and trustworthiness to constitute a complex socio-economic system in which individual and social trust evolve? – These are questions about the essential factors pushing the evolution of trust systematically. To disclose here first, the “essential factors” are information, social learning, networks of interpersonal relationships, geographical mobility, institutions, etc. Then, in terms of economic transactions, a specific form of interpersonal interactions, what effects does (dis)trust have on them? – This is a question about the relation between trust and economy from a micro perspective.
Issue 2 is comparison or contrast, is about the differences between China and three Scandinavian countries1 – Denmark, Norway and Sweden – in several socio-economic aspects, besides trust and economic performance. Scandinavian countries like Denmark, Sweden and Norway achieve a relatively balanced development between economy and society, and an outstanding socio-economic performance among the current global economies. They are not only high-income economies; as we
1 In this thesis, we do not distinguish Scandinavian countries from Nordic countries too much since three countries that this thesis mainly focuses on – Denmark, Norway and Sweden – are both Nordic countries and Scandinavian countries.

Trust and Development: The Deep Structure of Institutions-Building and Socio-Economic Performance
4
see, they also rank top in areas, such as, happiness, general trust and innovation.1 Specifically, Norway, Denmark, Finland, Sweden and mainland China rank the first, the second, the fifth, the tenth and the seventy-ninth respectively among 155 countries and regions in the World Happiness Report 2017 (Helliwell et al, 2017). Scandinavian countries maintain a high proportion of generally trusting people, despite the decline of social trust in many other countries. According to Stolle and Nishikawa (2011), developed economies, such as the United States, Australia, France and Britain, were actually experiencing a decline of social trust by the end of 1990s. The European Innovation Scoreboard 2017 shows that Sweden, Denmark and Finland, which are all Nordic countries, are the top 3 innovation leaders in the EU-282 (European Commission, 2017a). Given that the comparison or contrast between China and the three Scandinavian countries – Denmark, Norway and Sweden – is of interest here, how do China and the three Scandinavian countries perform in trust and economy? Socio-economic aspects of population, network structures, welfare, equality, geographic mobility and social capital3 are associated, or maybe even have a causal relation, as claimed in some literature, with social trust. What is the possible logic between those aspects and trust? What are the differences between China and the three Scandinavian countries in these aspects? How do China and the three countries perform in real data, if data is available?
Issue 3 is empirical, is about the determinants of general trust. What factors empirically matter for trust, especially for general trust? – This is a question with high value of policy implication. Via empirical analysis, we can draw a conclusion on the relative importance of different determinants of general trust. Obviously, through improving those factors conducive to trust, not only trust per se, but also the whole performance of a society, can be improved to some degree, which contributes to constructing a harmonious society. As to the determinants of general trust, we should first recognize that personal trust after all works on personal psychology and that a change of trust to a large extent attributes to external information received. Put another way, trust is a combination of internal perception and external information. Three aspects – norm-conforming, opinion similarity and geographical mobility – are chosen for empirical analysis using data of China. Then, will the three aspects generate an expected impact on general trust, ceteris paribus, taking China as an example? However, the impact of geographical mobility would probably be absorbed by the former two to some degree, since spatial mobility could work via others’ norm-conforming behavior and the degree of opinion similarity with others. In other words, the former two are nearer to trusting psychology.
Issue 4 is about simulating some socio-economic mechanism between micro trust and trustworthiness and macro socio-economic performance. Trust may influence willingness to interact or re-interact and trustworthiness may affect whether to behave nicely (e.g., cooperate) in an actual interaction. However, trust may be fragile; it can not only be built, but also be destroyed, in interactions, as aforementioned, and usually the latter process is easier. Moreover, an interaction may involve several decisions, like whether to interact, which strategy to use, et cetera, and may also happen between neighbors on the personal social network or non-neighbors. Information plays a considerable role in the change of individual trust, also mentioned before, including that either
1 Of course, as to whether subjective survey questions are comparable is still disputable. However, there are reasons for us to believe that this kind of comparison is not meaningless. 2 EU-28 is short for “the 28 member countries of the European Union”. 3 The relation between trust and social capital will be explicated in corresponding chapter. For now, we just put it aside temporarily.

Chapter 0: Introduction
5
from interactions, personal or non-personal, or from non-interaction channels. Then, given that we would not like to keep the whole process too unrealistically simple, how can we integrate those considerations into that process in simulation? What is more, what is the role of, such as, embeddedness in social network, mutation probability of payoff matrix, mutated payoff matrix, proportion of high trust agents and probabilities of information diffusion within neighborhood and that among non-neighbors in the process from micro trust and trustworthiness to macro performance?
The aim of this thesis is to answer these questions.
0.2 Structure of this thesis
In order to explain and explore the questions above, the main body of this thesis (namely, excluding the introduction and conclusion chapter) is going to be separated into four Chapters, where Chapter 1 is the theoretical part, Chapter 2 the international comparison part, Chapter 3 the empirical part, and Chapter 4 the simulation part.
Chapter 1 “Thinking Trust Systemically in Socio-Economic Environment” aims at Issue 1. It first discusses some basics of trust (Section 1.1 – 1.3), including the nature, characteristics and classification of trust, the distinctions and relations between general trust and particular trust, trust in strangers and group trust, the forming and implemented mechanism of general trust and the two key aspects therein (namely, experiences and expectation), and different measurements of (general) trust. Then, Section 1.4 from two aspects, namely thoughts (Sub-section 1.4.1) and behavior (Sub-section 1.4.2), illustrates a trustor’s mental process of the formation of sense of trust or trust attitude after information containing others’ trustworthiness arrives and his / her corresponding trusting behavior. Note that this is only from the angle of a trustor, rather than a trustee. Section 1.5 illustrates trust and trustworthiness simultaneously (Section 1.5.3 – Section 1.5.4) after explaining the relation between them (Section 1.5.1) and stressing trustworthiness (Section 1.5.2).
Having elaborated on trust and trustworthiness per se, this chapter systematically explains the realistic trust mechanism and dissecting those essential, decisive factors pushing the functioning of the trust mechanism and therefore underpinning the change and coevolution of trust and trustworthiness. Those crucial factors driving the trust mechanism are information (Section 1.6), social learning (Section 1.6), networks (Section 1.6), geographical mobility (Section 1.7) and institutions (Section 1.8). Then, trust is put into a large, complex, dense and realistic system interwoven by the three kinds of networks, namely, institutional networks, causality networks and personal information networks, after they are expounded respectively. (Section 1.9) At last, several effects of (dis)trust on economic transactions are discussed in detail. (Section 1.10)
Chapter 2 “Some Socio-Economic Aspects of China and Scandinavia” aims at Issue 2. It compares or presents some selected aspects of China and three Scandinavian countries (namely, Denmark, Norway and Sweden) with data, including population composition, welfare and taxation policies, general trust and social capital.
Chapter 3 “What Affect General Trust? Perspective from Norm-Conforming, Opinion Similarity and Geographic Mobility: Empirical Evidence from China” aims at Issue 3. It empirically explores

Trust and Development: The Deep Structure of Institutions-Building and Socio-Economic Performance
6
the impact of others’ norm-conforming behavior, others’ opinion and geographical mobility on individual general trust using micro data from Chinese General Social Survey 2013 and the provincial data from the Sixth National Population Census of P.R. China. Ordered logit regression is the first choice for econometric analysis because the dependent variable is an ordinal categorical one. Before regression, simple and partial correlation coefficients and variance inflation factors are calculated to detect the degree of (multi)collinearity between and among the chosen independent variables. Because ordered logit models are based on the parallel odds assumption, Brant test (Brant, 1990) is applied to see whether any independent variable violates the assumption. Then, partial proportional odds model will be turned to after violation of the assumption is found.
Chapter 4 “Between Trust and Performance: An Information-driven Socio-Economic Mechanism on Directed Weighted Regular Ring with Agent-Based Modeling” aims at Issue 4. It explores the evolution of interaction and cooperation supported by individual changing trust and trustworthiness on directed weighted regular ring though agent-based modeling. This agent-based model integrates fragility of trust, interaction decision, strategy decision, payoff matrix decision, interaction density and information diffusion. Marginal rate of exploitation of original payoff matrix and relative exploitation degree between the original and mutated payoff matrices are stressed in trust updating; influence of observing is introduced via imagined strategy; a relationship is maintained through relationship maintenance strength. The impact of degree of embeddedness in social network, mutation probability of payoff matrix, mutated payoff matrix, proportion of high trust agents and probability of information diffusion within neighborhood and that among non-neighbors on the sum of number of actual interactions and cooperation of all agents are probed on the base of a baseline simulation, respectively.
Chapter 5 summarizes the whole thesis.
0.3 Methods applied
0.3.1 Comparison analysis
Comparison analysis is mainly applied in Chapter 2 where population composition, welfare and tax policies, social capital, general trust, etc. between China and Scandinavia (mainly taking Denmark, Norway and Sweden as examples) are compared, or presented. It is the comparison in data concerning some or all of the four countries that is mainly used, besides some comparison in policies.
0.3.2 Empirical analysis
Statistical analysis, including both descriptive statistics and statistical inference, with the latter involving parameter estimation and hypothesis testing, is mainly applied in Chapter 3 in which determinants of general trust are studied empirically. In that chapter, both correlation/association analysis and regression analysis are utilized, and as to regression analysis, an ordered logit model and a partial proportional odds model are adopted for the model fitting.
Ordered logit models can be treated as, actually it is, an extension of binary logistic regression. The former pertains to ordered response models and the latter binary response index models, and both

Chapter 0: Introduction
7
binary and ordered response models belong to discrete response models. Discrete response models are classified into generalized linear models (GLMs). GLMs got this name because they are derived and extended from linear models.
For ordinary linear models, the dependent variable should be continuous. However, the dependent variable of generalized linear models is not limited to continuous variables; it can be categorical. For example, the values of the dependent variable of binary logistic regression models can be either 0 or 1, and that of ordered logit regression models can be more than two ordered categorical values. What they are actually regressed is probability.
The reason why generalized linear models can estimate the parameters of a model with a categorical dependent variable is that they, based on ordinary linear models, transform the conditional mean of the dependent variable using link functions. If we treat ordinary linear models as a particular case of generalized linear models, ordinary linear models are actually generalized linear models with a link of identity function and an error function of normal distribution. Relative to ordinary linear models, generalized linear models generalize the link functions to exponential family, such as binomial distribution, poisson distribution, and so on, rather than being limited to Gaussian distribution. For example, the link function of both binary logistic regression and ordered logit regression is logit and their error function is binominal function.
As we know, under the condition of Gausian-Markov, estimators from Ordinary Least Squares Estimation (OLS) are the best linear unbiased estimators (BLUE). However, as generalized linear models, ordered response models do not apply to OLS to estimate parameters because, obviously, the dependent variable of ordered response models is discontinuous, which violates the OLS hypotheses. Therefore, ordered response models are usually estimated via Maximum Likelihood Estimation (MLE). However, the maximum likelihood estimators of ordered response models do not have a close-form solution. – That is why they require numerical methods, such as Newton-Raphson, to obtain a numerical solution. In addition, more observations are needed for estimating parameters in MLE than OLS, generally speaking. – That is why they require a relatively large sample size.
Ordered logit models are also called proportional odds models because they potentially assume that the explanatory variables have the same impact on each category of the dependent variable. This means that the coefficients of each explanatory variable for each category of the dependent variable are the same and that the fitted lines for each category of the dependent variable are parallel. – This is why this assumption is called proportional odds assumption or parallel-lines assumption. The parallel-lines assumption can be tested via, such as, Brant test (Brant, 1990). However, “the test […] always results in rejection of the proportional odds assumption […] particularly when the number of explanatory variables is large […], the sample size is large […] or there is a continuous explanatory variable in the model […]’” (Strand, Cadwallader and Firth, 2011, Model 5).
Given that the dependent variable is an ordinal categorical variable and that the first regression model coming to our mind is ordered logit regression, when the parallel-lines assumption is proved to have been violated, four options are usually adopted: 1) Sticking to ordered logit regression; 2) Changing to multinomial logit regression; 3) Turning to binary logistic regression; 4) Switching to a partial proportional odds model or non-proportional odds model (see also, e.g., Williams, 2006).

Trust and Development: The Deep Structure of Institutions-Building and Socio-Economic Performance
8
However, they, especially the first three, also have concomitant disadvantages actually (for details, see Section 3.4.3). Therefore, often, we need to analyze and weigh the pros and cons in practice. As aforesaid, a partial proportional odds model will be turned to then.
With the development of the computation capability of computers, there emerge some pieces of statistical software and languages, such as SAS, SPSS, Stata, and R. For example, R-package MASS (Venables and Ripley, 2002), ordinal (Christensen, 2015) and VGAM (Yee, 2017) can estimate ordered response models. This thesis, specifically, Chapter 3, will mainly use VGAM package for regression analysis.
0.3.3 Agent-based modeling
Agent-based modeling will be utilized in Chapter 4 where the mechanism between micro trust and macro socio-economic performance on a directed weighted regular ring is the research topic.
Agent-based modeling (ABM), literally, is based on agents that are on the micro level and their behavior and interactions in order to investigate the behavior on the system level. Thus, it is a kind of micro modeling in essence. The constituent units of the system under investigation are called “agents” that are autonomous. The agents are not definitely individual human; they can even be firms, or other organizations. – The nature of agents depends on what system is under investigation. In a word, the micro- and macro-level are two relative concepts. Classic agent-based models include, but are not limited to, Conway’s Game of Life (Gardner, 1970), the Segregation Model (Schelling, 1971), Computer Tournaments (Axelrod, 1984), the El Farol Problem (Arthur, 1994), Artificial Stock Market (Arthur et al, 1996) and Sugarscape (Epstein and Axtell, 1996).
Agent-based modeling is not only “a powerful simulation modeling technique”, but also a mindset (Bonabeau, 2002, p. 7280). That is true. As aforesaid, ABM via studying the micro individuals studies the system-level phenomena. Thus, this kind of models is able to provide micro-foundations for those macro-level phenomena, which is conducive to understanding the micro-macro link from the bottom up. Hence, ABM is well-suited to the study of emerging phenomena.
An obvious advantage of ABM, relative to homogenous representative agent models, lies in its powerfulness in modeling heterogeneity. In fact, modeling heterogeneity is ABM’s very characteristic. ABM dedicates itself to portraying the different characteristics and their endogenous change of every single agent, the constituent units of the system under investigation of ABM, which can to the largest degree model heterogeneity in principle. Why heterogeneity is stressed? The occurrence of real-world phenomena may not be separable from heterogeneity which may contribute to making non-equilibrium normal. Put another way, many phenomena may not even happen among homogenous agents. – This perhaps should be the very meaning and necessity of the heterogeneity argument for real-world economics.
The causes and mechanisms behind a real-world phenomenon could be intricate. What results in this complexity may be partly due to the interdependence between humans in society, noticeably, in decision-making and behavior. Relational complexity further leads to the vulnerability of the whole system.
As to the design principle of model construction, many people may be indecisive between KISS

Chapter 0: Introduction
9
(Keep it simple, stupid) and KIDS (Keep it descriptive, stupid). According to Bonabeau (2002, p. 7287), “a model has to serve a purpose; a general-purpose model cannot work. The model has to be built at the right level of description, with just the right amount of detail to serve its purpose”. In addition, simulation, relative to deterministic methods, has both advantages and disadvantages. According to Elsner, Heinrich and Schwardt (2015),
The fundamental difference from exhaustive deterministic analysis of the whole system is that simulation does not attempt to investigate any possible state, let alone the possible relations between the states of the system. Rather, for a finite set of valid states, the behavior is traced to establish a general idea of the resulting trends. (p. 228)
Additionally, they also provide the procedure of computer simulation which basically contains 7 steps (Elsner, Heinrich and Schwardt 2015, p. 230).
Agent-based models are often implemented by means of computer simulation. Hence, in terms of techniques, agent-based models are pieces of code in essence. Agent-based simulation can be implemented either via specialized software, like NetLogo, or more general programming language, such as, C and Python (for more platforms for agent-based modeling, see, e.g., Gilbert and Bankes, 2002; Gilbert, 2008; Nikolai and Madey, 2009). For example, the agents in an agent-based model could be instantiated using “class” of object-oriented programming language Python (for examples of ABM using Python class, see, e.g., Elsner, Heinrich and Schwardt, 2015, Chapter 9; Isaac, 2008). What is more, Python will be adopted for agent-based simulation in Chapter 4 of this thesis.
Agent-based modeling is computation-intensive. As to applications to human society, it simulates, such as, the individual characteristics, decision-making, behavior, interactions, social network, et cetera of every single agent in the system under investigation over a period of, say, hundreds of time-steps, and then repeats the whole process for, say, hundreds of times. One can imagine how much the computational and memory requirement increase as the size of the system under investigation increases and the mechanism involved gets more complex. As Bonabeau (2002, p. 7287) figures out, “Although computing power is still increasing at an impressive pace, the high computational requirements of ABM remain a problem when it comes to modeling large systems.” Therefore, given the whole mechanism, we often have to weigh the size of the system under investigation against the time spent and the limited memory. However, according to my personal experience, such problems can be relieved to some, or even a substantial, degree via, such as, adopting a more memory-saving data structure and more time-saving programming design and algorithm, given the hardware condition. Of course, there also exists a trade-off between time complexity and space complexity.
As to specific mechanism design, especially in economics, agent-based models often combine, such as, (evolutionary) game theory and complex network theory. Specifically, network theory can be used to simulate the topological structure which could clearly differentiate neighbors from non-neighbors, and game theory can be adopted to simulate interactions between agents and their results. As well, the mechanism design of the agent-based model in this thesis also involves elements of game theory and network theory.
Moreover, one key point to remember about simulation results is that “one must not make decisions

Trust and Development: The Deep Structure of Institutions-Building and Socio-Economic Performance
10
on the basis of the quantitative outcome of a simulation that should be interpreted purely at the qualitative level” (Bonabeau, 2002, p. 7287).
0.4 Expected contributions to scientific research
First, this thesis, specifically, the first chapter, establishes a comprehensive theoretical system in which trust changes. Specifically, trust, especially its change, is based on the perception of trustworthiness. This applies to different types of trustworthiness and their corresponding types of trust. Information reflecting trustworthiness plays a decisive role in trust changing. Not conforming to institutions is an important embodiment of untrustworthiness, and is therefore a significant factor causing distrust. At the same time, trustworthiness per se is an important institution of which the development follows the general law of that of institutions. Information process and social learning process overlap to a substantial degree. Through social learning, behavior can directly be acquired (such as trustworthy behavior); social learning can also change thoughts (such as change cognition to social environments), and then guides conscious behavior (such as trusting behavior according to trustworthiness). Information functions through personal psychology eventually. Social networks are where information is acquired, social learning is going on, behavior is output and information is diffused subsequently. This thesis, especially Chapter 1, the theoretical part of this thesis, links the series of factors or theories of trust, information, social learning, networks (including social networks and other form of networks), institutions, etc. and covers from individual thoughts and behavior, to interactions, to networks, and to multi-networks, which therefore makes up for the theoretical shortcoming that there is not that considerate and comprehensive theoretical mechanism in the current trust research in the economic field to some degree.
Second, this thesis, especially Chapter 1, dissects and extends beneficially every single theoretical element involved and puts forward my own points of view (maybe innovative or from a perspective different from existing research) when establishing the comprehensive, systematical socio-economic theory of trust. For several examples, when talking about trust, some types of trust are distinguished and discussed in depth and detail; when it comes to social learning, some corresponding pairs of its types are proposed; when taking about interaction networks, the concept of “interaction platforms” (Elsner and Schwardt, 2014) is extended; when talking about the reasons why people would like to conform to institutions, several reasons are added to the currently stressed factors; when talking about institutions, changeability of relatively advantageous role is proposed; when talking about the origin and diffusion of institutions, population continuity in geography is stressed, and so on and so forth. They not only play a role in the realistic trust system restored in this thesis, but also contribute to corresponding independent research. Additionally, the detailed discussion may also inspire other researchers.
Third, Chapter 2 – 4 of this thesis explore different issues using different methods which have their own contribution. Chapter 2 mainly talks about Scandinavia and / or China in aspects of population, network structures, welfare, equality, geographic mobility, social capital, trust and other socio-economic performance. It explains the possible logic between some of those aspects and trust, and presents and / or illustrates rich corresponding, latest available data of each aspect of Denmark, Norway, Sweden and China. As far as I know, there has not been such an all-sided comparison

Chapter 0: Introduction
11
between China and the three Scandinavian countries with relatively new realistic data. This contributes to the comprehensive understanding of the four countries in many socio-economic aspects. Chapter 3 quantitatively, empirically explores the impact of others’ institution-conforming behavior, others’ opinion and geographical mobility on individual general trust using data from China. These aspects, especially the first two, have an essential impact on general trust. Such a perspective of empirical research is different from existing research. Chapter 4 explores the evolution of interaction and cooperation supported by individuals’ changing trust and trustworthiness on directed weighted regular ring though a relatively new method or technique – agent-based modeling – in economic research. This agent-based model integrates many realistic factors elaborated on in Chapter 1, such as, fragility of trust, interaction decision, strategy decision, payoff matrix decision, interaction density and information diffusion, etc. The whole process of designing and implementing the agent-based model requires a lot of time and effort.

Trust and Development: The Deep Structure of Institutions-Building and Socio-Economic Performance
12
Chapter 1: Thinking Trust Systemically in
Socio-Economic Environment
1.1 Trust
1.1.1 Describing trust
According to the Oxford English Dictionary, the word “trust” can be used as a noun, a verb or an adjective (Trust, no date). Taking its noun form as an example, several definitive records from the online Oxford English Dictionary are selectively presented here. As a noun, “trust” can represent: a) “Firm belief in the reliability, truth, or ability of someone or something; confidence or faith in a person or thing, or in an attribute of a person or a thing”; b) “Confident expectation of something; hope”; or c) “Confidence in the intention or ability of a customer to pay at a future time for goods or services supplied without immediate payment” (Trust, n., 2015).
Many scholars have given their understanding of trust. For example, Coleman (1990, Chapter 5) considers trust from the perspective that the trustor gives the right of making a decision to a trustee whose decision will influence not only the trustee himself, but also the trustor. La Porta et al (1997, p. 336) think that Putnam’s (1993) opinion about trust is that “trust is a habit formed during a centuries-long history of ‘horizontal networks of association’ between people, covering both commercial and civic activities.” Sabel (1993, p. 1133) thinks that trust is “the mutual confidence that no party to exchange will exploit the other’s vulnerability”. Yamagishi and Yamagishi (1994, pp. 131-132) regard trust as “expectation of goodwill and benign intent”, and think that it is “based on the inference of the interaction partner’s personal traits and intentions”. Hardin (1996, p. 28) treats trust as “an unmoralized notion”, and thinks that “where there is trust that is justified there are increased possibilities for beneficial experience and action.” Brien (1998, p. 398) thinks that trust “involves a recognition of one’s vulnerability to the actions and choices of the trustee” and “involves importantly retaining this vulnerability by not attempting to erect barriers to protect one’s interests”. Nooteboom (2002, p. 37) thinks that “trust is a disposition towards trusting behaviour”. Uslaner (2005, p. 76) states that trust “is a value expressing the belief that others are part of your moral community.” Delhey and Newton (2005, p. 311) treat trust “as the belief that others will not deliberately or knowingly do us harm, if they can avoid it, and will look after our interests, if this is possible.” Stolle and Nishikawa (2011, p. 283) argues that “trust is one of the most fundamental pro-social attitudes”. Sapienza and Zingales (2012, p.124) think that trust is “the expectation that another person (or institution) will perform actions that are beneficial, or at least not detrimental, to us regardless of our capacity to monitor those actions.” Additionally, Colesca (2009, p. 8) also provides a table of several selected definitions of trust from other scholars.
As we know, rich definitions of trust have been provided by scholars. Lewicki and Bunker (1995, pp. 135-139) notice the three angles (or standpoints) of seeing trust summarized by Worchel (1979):

Chapter 1: Thinking Trust Systemically in Socio-Economic Environment
13
a) personality theorists; b) social psychologists; c) and sociologists and economists. The first group views trust from the perspective of individual personality which is to a large degree shaped by a person’s psychosocial development in his / her early life experience; the second group views trust from the perspective of interpersonal transactions in which trust could be created and destroyed; the third group views trust as an institutional phenomenon which generalizes personal trust (Lewicki and Bunker, 1995, pp. 135-139).
However, as to the nature of trust, it would be better to comprehensively consider all the three perspectives aforementioned. Or put another way, trust is both reflected on individual psychology and embedded in society. An obvious difference of the three perspectives is the size-base involved. More specifically, when personality is stressed, trust is mainly focused on an individual person; when social (or other forms of) interactions are stressed, trust is focused on two or more persons; when institutions are stressed, trust is basically focused on the whole society. What is more, trust is event-related, as suggested by Deutsch (1958, cited in Lewicki and Bunker, 1995, pp. 137-138). Thus, no matter how large the size related to trust involved, a possible way that trust changes is that: the external information flows (acquired both within and beyond personal social network) impacting trust, if these information flows do influence one’s trust, eventually reach the psychological level and are transformed as individual cognition, emotion, attitude, opinion and so on; further, the adjusted individual trust is mapped into other future events of interactions with different (potential) trustees. In a word, trust is inner / psychologically established and destroyed. – This is the aspect of trust from individual psychology.
On the other hand, trust is “an unavoidable dimension of social interaction” (Gambetta, 1988a, p. x). The meaning of trust becomes obvious when embedded in society. One important aspect of understanding trust is its social nature. In this sense, trust is essentially a social phenomenon, “is fundamentally a social process” (Uzzi, 1997, p. 45), and a “systemic social reality” (Lewis and Weigert, 1985, p. 967). If roughly classifying two kinds of relationships – human and nature, and human and human – it can be seen that trust is definitely strongly attributed to relationships between human and human, which is the reason why trust is embedded, generated, changed and destroyed in society. Factors from social environment should not be neglected. Thus, trust is embedded in society, is embedded in networks of various relationships (of different strengths).
In addition, facing the various definitions of trust, Bhattacharya, Devinney and Pillutla (1998) detect a worth-noting problem existing in trust research. They think that “the problem with most definitions of trust is the researcher’s desire to make the concept too precise. This is appropriate when a construct must be measured empirically, but it may unnecessarily strangle the conceptual richness of the fundamental phenomenon” (Bhattacharya, Devinney and Pillutla, 1998, p. 462), which I agree with. Thus, when we are reminded or stressing some notable features by the “definitions” of trust, we should keep in mind that trust is trust itself; it is not anything else.
1.1.2 Characteristics of trust
(i) Conditional on trustworthiness
The precondition of trust here mainly refers to perceived trustworthiness, or at least unperceived untrustworthiness. Just as what Nooteboom (2002, p. 38) argues, “It is very unusual, often a
Trust and Development: The Deep Structure of Institutions-Building and Socio-Economic Performance
14
pathology, to trust or mistrust indiscriminately.” Trustworthiness here can be either particular or overall; which one it is depends on which kind of trust it corresponds to. It is not only the true trustworthiness that conditions trust, but also how a person assesses trustworthiness. As will be explained more later, whether or not a person will trust depends largely on what (s)he thinks about the trustworthiness of others. A little more broadly speaking, one may tend to trust if there is no suspicious indication of untrustworthiness which causes distrust, which also implies that untrustworthiness is perceived by a trusting subject more obviously when (s)he distrusts.
Think in an inverse way. If trust were not conditional, then feedback loop would not exist, and individual trust level would not change and would be constant forever independent of any externally reaching information, happenings, events, etc. This feature of trust reflects the adaptation of human beings to social environmental backgrounds. A person not adjusting his / her attitudes and “strategies” according to surrounding environments would probably get stuck in difficulties, troubles, risks, psychological pains, or even cannot normally live.
(ii) Relying heavily on information
As mentioned above, trust is conditional on trustworthiness. What is more, judgments of trustworthiness heavily rely on external information reflecting others’ trustworthiness, including that from personal interactions and that from interactions of others acquired via, such as, directly observing, word by mouth, watching news reports, etc., either about (a) particular other(s) or about disapproved behavioral phenomena (e.g., telecommunication fraud) existing in society. Information reflecting trustworthiness tends to increase trust, while information indicating untrustworthiness tends to decrease trust, given that information does have acted on the psychological level. Although the interpretation of external information about others’ trustworthiness may be kind of biased, the basic trend of trust and that of trustworthiness usually coincide. People may to different degrees react to (un)trustworthiness.
The process of accumulating information about indications of (un)trustworthiness is one of continuously experiencing and learning. Most of the time, the construction of trust is event-driven. Imagine a situation: a meat-product processing company sells meat products processed with stale meat and then this scandal is exposed by mass media. Another example, when a kind of telecommunication fraud is exposed in social media, people would keep a wary eye on similar things they encounter. These events manifest the untrustworthiness existing in society and make people’s trust decline or make people unwilling to trust. The event-driven explanation applies to not only economic exchanges, but also social interactions.
After external information arrives, people may also further process that information mentally, such as by virtue of association etc. Furthermore, all the information possibly reflecting others’ trustworthiness will be carried into further decisions involved in a future interaction. Put another way, decisions involved in a future interaction have a large bearing on the amount of one’s accumulated and possessed information about trustworthiness (for specific decisions that may be involved in an interaction, see, Section 1.4.2).
(iii) Risk-relevance of ex ante trust in future personal interactions
Many scholars have pointed out or implied that trust is risk-relevant. For example, both Mayer,
Chapter 1: Thinking Trust Systemically in Socio-Economic Environment
15
Davis and Schoorman (1995) and Rousseau et al (1998) figure out that trust causes vulnerability of the trustors to the actions of the trustees. Slovic (1993, pp. 675-676) also thinks that the pervasion of distrust is “strongly linked to risk perception”. Importantly, we should realize that when talking about risk-relevance, it actually implies risk involved in ex ante trust in future personal interactions, rather than in ex post trust or in non-personal interactions in which situations individual trust has probably been adjusted accordingly. First, interactions happened (personally experienced or observed) have already become deterministic, certain and unchangeable facts irrelevant to probabilistic issues or uncertainty. Second, direct risk of trusting behavior only exists and is of realistic meaning in future personal interactions that have not happened yet since not all phenomena involving trusting-trusted relationship would incur actual vulnerability. For example, when a person is watching a (living) judgment on TV in which (s)he has no personal relationship with, and (s)he doesn’t trust the confession of the plaintiff or the defendant. In this situation, the trusting-trusted relationship between the person who is watching TV and the plaintiff or the defendant involves no essential vulnerability.
When it comes to the risk-relevance of trust, it typically involves uncertainty in future, asymmetry of information, and variability and diversity of human thoughts and behavior and so on. Hence, one cannot guarantee that everything, even in a local sense, has gone and will go in the way (s)he expects, nor can one guarantee nothing unexpected will happen. However, whether ex ante trust is risky depends on possessed information or knowledge about others’ trustworthiness and the qualitative coincidence of the perceived trustworthiness and the actual trustworthiness. Specifically, if possessed information to infer the degree of trustworthiness is enough to determine the quality of the trustee, either trustworthy or untrustworthy, and a right judgment is made, trust is almost not risky at all; only when information is not enough or a judgment is wrong is trust risky in essence.
(iv) Slow to establish, fast to decline, and hard to rebuild
As many of us have probably already perceived, it is slow for trust to establish, but fast to decline and hard to rebuild. First, establishing trust needs a successive process of information cumulation of some certain degree. If no unbearable untrustworthiness happens, trust will naturally establish. However, trust tends to swiftly react to trust-damaging behavior. Facing unbearable untrustworthiness, previous positive trusting attitude could quickly change to very negative. No wonder that Slovic (1993, p. 677) ever said that trust is “typically created rather slowly, but it can be destroyed in an instant by a single mishap or mistake.” Even worse, trust rebuilding can be even harder than trust establishing since previous unpleasant experiences etc. of untrustworthiness could have decreased trust to an ice point. It is no exaggeration to say that in the most extreme situation, it is even impossible for trust to rebuild.
Untrustworthiness in interpersonal interactions usually contains trustees’ deliberate deception. Swift reaction to untrustworthiness to a large degree derives from the involved malevolence which people certainly cannot bear and are emotionally resistant, besides the material loss and possible directly corresponding mental loss, making people more averse to untrustworthy behavior. In a word, untrustworthiness per se is repulsive. No doubt that the intention behind others’ behavior has an especially important influence on the psychology of trustors. Trustors will generate corresponding emotions according to others’ intention. – This is also partly, if not completely, explained why there are seemingly irrational choices neglecting possible interests to trust.
Trust and Development: The Deep Structure of Institutions-Building and Socio-Economic Performance
16
Trust-rebuilding is difficult. The term “trust-rebuilding” per se implies that trust has ever been destroyed. That is, there has been negative information about trustworthiness, namely information reflecting untrustworthiness, leading to distrust. Put another way, negative trust making people tend to keep away from the relevant and possible untrustworthy actors. These memories of previous untrustworthiness and the current feeling, attitude and emotion when recollecting them will lead to emotional resistance. The starting point of trust-rebuilding is negative trust, while its aim is positive trust. – This fact per se reflects the difficulty faced trust-rebuilding. An absolutely necessary condition of trust-rebuilding is to substantially improve the corresponding aspects causing distrust. After trust is damaged, trust will not be rebuilt without indications to improve trustworthiness or actual actions or achievements of improving trustworthiness. Not to mention that there are people who would rather not trust the previous untrustworthy actors any more, in spite of the indications of the improvement of their trustworthiness, and not obtain the so-called possible potential interests because they may not treat them as valuable at all and, in addition, whether it will turn out to be interests is not certain yet. This situation per se reduces the number of trusting people. Moreover, after trust is improved, maybe it is not those who are hurt by untrustworthiness who trust, but those who have not or not much been influenced by untrustworthiness. In this sense, trust is not re-built.
1.1.3 Types of trust
According to whether the subject and / or object in a trust relationship is a human / humans, there could be four different situations, namely, both the subject and the object are a human / humans, either the subject or the object is a human / humans, and both the subject and the object are not a human / humans, leaving alone the possible issue whether non-humans do have trust and / or whether some people would treat some behavior of non-humans as trust since it is irrelevant and unimportant to this thesis. In most contexts, if not all, when people are talking about trust, the subject is always a human / humans. Given that the subject in a trust relationship is a human / humans, people may talk about trust in another person / other persons or something (non-human objects). However, I would like to figure it out first that trust talked about in this thesis is always interpersonal trust, unless explicitly specified, which means that both the subject and the object in a trust relationship are human-oriented. It should be noted that some scholars, e.g. Roth (2009), may treat interpersonal trust and general trust (a type / form of trust that will be introduced and discussed later) the same. But obviously I am not using interpersonal trust in that way. As said, I refer to trust among / between humans as interpersonal trust, or just trust. Now, let’s have a look at how other scholars distinguish different types of trust.
Williamson (1993) categorizes trust into calculative trust, meaning that the trustor’s entrusting the trustee depending on an expected utility calculation, and personal trust, meaning that the trustor thinks the decision of trusting the trustee is correct.
Lewis and Weigert (1985) argue that an adequate conceptual analysis of trust requires recognition of its cognitive, emotional and behavioral dimension. Inspired by the first two dimensions of trust proposed by Lewis and Weigert (1985), McAllister (1995, p. 25) stresses two principal forms of interpersonal trust, one is cognition-based trust which is “grounded in individual beliefs about peer reliability and dependability”, and the other is affect-based trust which is “grounded in reciprocated interpersonal care and concern”.

Chapter 1: Thinking Trust Systemically in Socio-Economic Environment
17
Putnam (2000, pp. 136-137) distinguishes two kinds of interpersonal trust, namely thick trust and thin trust. Therein, thick trust is “embedded in personal relations that are strong, frequent, and nested in wider networks” (Putnam, 2000, p. 136), while thin trust, a paraphrase of Rahn and Transue (1998) by Putnam (2000, p. 136), “can be viewed as a ‘standing decision’ to give most people – even those whom one does not know from direct experience – the benefit of the doubt”. In Putnam’s (2000, p. 136) view, thin trust, social trust and generalized trust are synonymous. Thick trust relates more to personal experience, while thin trust does more with social community norms (Putnam, 2000, p. 136). At the same time, he also reminds readers not to confuse social trust with political or institutional trust which are trust to government or other social institutions (Putnam, 2000, p. 137).
Uslaner (2002, Chapter 2) distinguishes between strategic trust and moralistic trust, as well as between particularized trust and generalized trust. He thinks that moralistic trust is “trust in people whom we don’t know and who are likely to be different from ourselves” (Uslaner, 2002, p. 15). We can see that in his view, at least in basis and stability, moralistic trust and strategic trust are different. In terms of basis, moralistic trust is based on shared fundamental moral values, and moreover, one’s own general worldview is more important than how others treat him / her in shaping moral trust; by contrast, strategic trust is based on knowledge, on personal experiences, and it involves personal trust decision presupposing risk (Uslaner, 2002, pp. 16-18). In terms of stability, moralistic trust is quite stable, but is “more difficult to build than to destroy”, while strategic trust is fragile, and develops slowly (Uslaner, 2002, pp. 24-25).
Generalized trust, according to Uslaner (2002, pp. 26, 28), is “the perception that most people are part of your moral community”, while particularized trust is “faith […] in our own kind” and “uses group categories to classify people as members of in-groups or out-groups”. Thus, the criterion for distinguishing generalized trust from particularized trust lies in the inclusiveness of one’s moral community (Uslaner, 2002, pp. 26-27). Besides, generalized trust is based on “both morals and our collective experiences”, namely moralistic trust, while particularized trust relies on trusters’ personal “experiences (strategic trust) or stereotypes” (Uslaner, 2002, pp. 26-27). Even so, generalized trust and moralistic trust are different things (Uslaner, 2002, p. 26).
Leigh (2006, p. 268) also distinguishes two types of trust from the perspective of empirical research, that is, localized trust, which is “trust in those who live in the same neighbourhood”, and generalized trust, which is “trust in those who live in the same country”.
Elsner and Schwardt (2015) distinguish between contextual trust and general trust. The two conceptions in their paper are based on what they call “interaction arenas” and “‘meso’-sized platforms” which are in essence sub-populations and their overlap. (Elsner and Schwardt, 2015) Contingent cooperation in particular interaction arenas provides “foundation for the emergence of contextual trust in that particular arena” (Elsner and Schwardt, 2015, p. 78). Different from contextual trust which is fostered in specific single arenas, “general trust is the transfer of this [contextual trust] to new, unknown arenas” (Elsner and Schwardt, 2015, p.78).
Since generalized trust, as well as its comparison with particularized trust, has caught much attention in both theoretical and empirical research, further discussion about them will be made later sections (see, Section 1.2).

Trust and Development: The Deep Structure of Institutions-Building and Socio-Economic Performance
18
Below provides another three ways of categorizing trust which will play an important role in the formal modeling of a later chapter of this thesis (specifically, Chapter 4). First, according to the sequence of trust and a particular trust-influencing event (e.g., a particular interaction or a particular observation of others’ interaction), trust can be categorized as ex ante trust and ex post trust. Ex ante trust is trust before a particular trust-influencing event happens, and ex post trust is trust adjusted taking into account of the influence of an event. This kind of categorization mainly focuses on the change of trust before and after a trust-influencing event and therefore is from a dynamic perspective. Second, according to the way of acquiring trust-influencing information, trust can be categorized as personal-interaction-driven trust and observation-driven trust. If a change of trust is driven by information about others’ trustworthiness acquired from personal interactions, it is interaction-information-driven trust; if it is driven by information acquired from non-personal interactions of others (such as, direct observation, from mass media, etc.), this is observation-driven trust. This kind of categorization concentrates on the difference of direct and indirect experiences which involves different costs and prices of information acquisition. Third, as always mentioned throughout the thesis, trust is based on information about others’ trustworthiness, which we can call information-based trust. However, it is possible that some people’s trust, for something, some other people or general others, is mainly based on their belief of trustworthiness, which we can call belief-based trust. This kind of trust is relatively firm, and has relatively strong capacity to withstand negative information of trustworthiness. In addition, belief-based trust could also happen in the relatively stable stage of trust. It is not difficult to realize that the first two categorizations are both information-based. Additionally, the general trust talked in the thesis is information-based, rather than belief-based, if not specified (see Figure 1.1).
Figure 1.1 Types of trust.
Trust
Information-based trust
Ex ante trust vs. ex post trust
Interaction-information-driven trust vs.
observation-information-driven trust
Belief-based trust

Chapter 1: Thinking Trust Systemically in Socio-Economic Environment
19
1.2 On generalized trust
1.2.1 Generalized trust and particularized trust, and trust in strangers: a revision of understanding
Generalized trust may be used in different “names” in different research, such as social trust (e.g., Bergh and Bjørnskov, 2011), general trust (e.g., Elsner and Schwardt, 2014), and generalized trust. Basically, this thesis also treats the three terms as interchangeable. Similarly, particularized trust and particular trust are also treated as synonymous in this thesis. If viewed from the perspective of an individual in an interaction context, general trust can be treated as a person’s trust in the next and unspecified person whom (s)he will meet and interact with.
General trust, as a specific type of trust, is often explained in contrast with another type of trust, making their meaning clearer. Besides the viewpoints of Uslaner (2002) mentioned above (see, Section 1.1.3), other scholars also give their understanding and / or explanation of generalized trust. Yamagishi and Yamagishi (1994, p. 139) consider general trust, by contrasting it with knowledge-based trust in their paper, as a positive “cognitive bias in the evaluation of (potential) partners” in the situation of imperfect information and “a belief in the benevolence of human nature in general and […] not limited to particular objects”. Besides, a widely accepted difference between general trust and particular trust is distinguished according to whether involving trust in strangers. For example, Delhey and Newton (2005, p. 324) think that “generalized trust is trust in people we may not know and who may not be like us”, while “particular trust is trust in people we know, or who are like us”. Additionally, some scholars merely limit general trust to trust in strangers. However, this way of distinguishing general trust from particular trust hinged on the attitude towards strangers seems not to touch the essence of these two concepts. Although general trust may involve trust in strangers, trust in strangers is not the criterion of general trust.
Particularized trust vs. generalized trust and trust in familiars vs. trust in strangers are two different perspectives of classification. The key to distinguish generalized trust from particularized trust is whether the object of trust is specified. If the object of trust is specified, it is particularized trust; otherwise, it is generalized trust. The two terms do not together separate a certain scope of population into different sub-sets. By contrast, trust in strangers and trust in non-strangers (including trust in familiars) do. The reason why generalized trust and trust in strangers are often bound together could be attributed to the standard question of generalized trust in surveys (see, Section 1.3.1) and the overwhelming quantity advantage of strangers in real life.
Figure 1.2 presents a possible relation of generalized trust and trust in strangers based on five hypotheses: 1) The underlining scope of consideration is the total population of a society; 2) a person answers “Yes” to the question “Generally speaking, do you think most people can be trusted?”; 3) (s)he belongs to the total population under consideration, such as a country; 4) (s)he only has familiars and strangers, namely no other category other than familiars and strangers; 5) the population size, even not definitely specified, is a lot larger than the size of one’s familiars. In that figure, the dots in the square represent people; within the circle are one’s familiars, and beyond are his / her strangers; the slash separates the total population under consideration into those one trusts and those one does not, with its upper left representing those one trusts and its lower right those one

Trust and Development: The Deep Structure of Institutions-Building and Socio-Economic Performance
20
does not. Actually, there could be four possible situations: 1) the circle is in the trusted area, (the upper-left area of the slash); 2) more than a half circle is in the trusted area; 3) more than half a circle is in the distrusted area (the lower-right area of the slash); 4) the circle is in the distrusted area. It is the second situation that Figure 1.2 shows. In all the first three situations, generalized trust and trust in strangers do not coincide. Only in the fourth situation, they get the same answer. Objects of particular trust vs. general trust and trust in familiars vs. trust in strangers might overlap to some extent. In this sense, both general trust and particular trust may involve strong ties and weak ties. Moreover, when the scope of general trust is not all the people in a country, general trust and trust in strangers are more different. This is only the situation where it is supposed that the trusted most people can be figured out. Actually, the whole impression of general trust always forms without considering every single person in a population. As will be said, it is the overall impression like a process of sampling.
Figure 1.2 A possible relation of generalized trust and trust in strangers.
As said above, the key criterion for distinguishing between generalized trust and particularized trust is whether the object of trust is specified. This is determined by the implication of the two words, “generalized” and “particularized”. When explaining their distinct grammar, Uslaner (2002, pp. 27-28) says that the grammar of generalized trust is “A trusts”, while that of particular trust is “A trusts B”, which I think is a both accurate and straightaway explanation. In this sense, group trust is also particularized trust since the object of trust is specified. Uslaner (2002, p. 28) also holds a similar view that group trust which classifies “people as members of in-groups or out-groups” is particularized trust. A typical characteristic of group trust is that some obvious common traits, such as geographical area, occupation, membership etc., of a certain scope of people have been labeled to those people, and those people are referred to as a whole. A common point of particular trust to a person and that to a group is that they both seem to be influenced by reputation which we can call personal reputation and group reputation, respectively. By contrast, generalized trust does not classify people. It blurs the boundary of possible classifications, the particulars, among people and consider them as a whole. In a word, it is a whole, comprehensive attitude, impression or assessment of the perceived trustworthiness of one’s own society where (s)he and many other people live together, not considering it as a belief.
In addition, whether trust in strangers can be classified into group trust is somehow subtle, given the word “strangers” in the “trust in strangers” is a general reference. On one hand, strangers, in any scope, form a set or group all the people of which one does not know. In this sense, trust in strangers
……………………………………………………………………………………………………………………………………
……………………………………………………………………………………………………………………………………
……………………………………………………………………………………………………………………………………
……………………………………………………………………………………………………………………………………
……………………………………………………………………………………………………………………………………
……………………………………………………………………………………………………………………………………
……………………………………………………………………………………………………………………………………
……………………………………………………………………………………………………………………………………
……………………………………………………………………………………………………………………………………

Chapter 1: Thinking Trust Systemically in Socio-Economic Environment
21
resembles a group, particularized concept more since strangers as the trust object is specified. However, on the other hand, strangers treated as a group is different from what we usually call a group because this “group” does not have an obvious common characteristic, despite the fact that they are all people whom one does not know. It should also be noted that the preconception and the fact that untrustworthy behavior tends to be from strangers greatly affects one’s judgment of trust in strangers.
Trust in strangers and whether generalized trust involves trust in strangers are two different questions. – This is a very important point. Trust in strangers as a type of trust is somehow particularized. But generalized trust almost, if not totally, definitively involves trust in those who are unspecified strangers, which is the connotation that the phrase, generalized trust, conveys to us. The two statements do not contradict and this is how strangers relate to generalized trust. The reason why the two terms are always bound together is that most people in the society are definitely strangers. However, it should be noted that “most people” here and that in the standard survey question of general trust – “Generally speaking, would you say most people can be trusted” – do not refer to the same range of people (as shown in Figure 1.2).
As an overall estimation of trustworthiness of general others, one’s general trust does not have to be based on actually having dealt with most people within some scope. As we can guess, when one tells his / her general trust, it is probably not a judgment after having dealt with exactly most people since general trust refers to a very large scope, such as the population in a country. Thus, samples and the population should be well distinguished. In this sense, a person’s general trust is essentially a rough statistic no matter whether his / her sample (i.e., various pieces of information that one knows in society reflecting trustworthiness, including person-particular ones) is representative in a statistical sense. It could draw a wrong conclusion when statistical results are used to speculate the corresponding individual characteristic. Therefore, particular trustworthiness can contribute to the sample size of the estimation of general trustworthiness and general trust, but cannot be used to speculate particular trustworthiness.
1.2.2 Group trust and generalized trust
As said before, when talking about trust to a particular group, group trust is particular; but given the considered groups are all within the scope about which one would tell his / her general trust, when it comes to trust to a sufficient number of groups in different areas, all these group trust combined in some way may convey information like general trust to some degree since many more people are involved in, and after all, the person who tells different kinds of trust live together in the society with those groups which are parts of the general others. However, extracting information from various particular groups, as well as mass particular individuals, is not indispensable for one to tell his / her generalized trust. Image you are being asked the question about general trust now. You can also immediately choose an answer, probably without having actually dealt with most people in your country. In addition, it is also reasonable to some degree to view trust in a particular group as the general trust of the group. However, it should be noted that usually a group in group trust is a lot smaller in size than the scope of general trust, even when no definite scope (e.g. the country one lives in) is specified for general trust. What is more, usually, group trust does not include the person him / herself who gives a judgment, while general trust does. If a person of a country tells his / her
Trust and Development: The Deep Structure of Institutions-Building and Socio-Economic Performance
22
trust to people of another country, it is also group trust, rather than general trust.
Group trust is closely related to group reputation or group stigma, and, furthermore, negative remarks are always related to stigma. Group stigma can be regarded as a kind of negative group reputation, it is a kind of prejudice, negative remarks, stereotype etc. Goffman ([1963] 1986, p. 3) uses stigma to “refer to an attribute that is deeply discrediting.” Goffman ([1963] 1986, p. 4) stresses three types of stigma, they are respectively “abominations of the body”, “blemishes of individual character”, and “tribal stigma”. However, Goffman ([1963] 1986, p. 3) figures out that only the undesirable attributes “which are incongruous with our stereotype of what a given type of individual should be” at issue. “A stigma, […] is […] a special kind of relationship between attribute and stereotype” (Goffman, [1963] 1986, p. 4). “The issue of stigma” only arises “where there is some expectation on all sides that those in a given category should not only support a particular norm but also realize it” (Goffman, [1963] 1986, p. 6). Obviously, negative impressions or remarks in group trust are related to Goffman’s ([1963] 1986) third type of stigma. Certainly, groups can be to some degree related to interaction platforms which will be discussed in more detail later (for interaction platforms, see Section 1.6.8).
Information of trustworthiness of a specific group1 can be first-hand or non-first-hand information, and first-hand information, good or bad, of a group is acquired through actual interactions with people of that group. Suppose a person who is expressing his / her group trust in some group has his / her own group (say, group A) which is different from the group (say, group B) on which (s)he gives his / her opinions, and interactions are through a face-to-face way, rather than telecommunications. Then, there are three situations in which people of two groups can interact and people in one group can acquire first-hand information of trustworthiness about the other one: First, some people from group A go to group B and bring their impressions back to group A; Second, people of group B go to group A, and people of group A form some view of group B; Third, people of both the two groups go to a third place where they interact and people of group A form their opinions on people of group B.
Then, people from group A who have interacted with people in group B carry the first-hand information about the trustworthiness of group B, and could bring it to other people in their group (group A), via personal interactions or media. The other people in group A who have never interacted with people of group B then get second-hand, more accurately, non-first hand, information from those who have in group A. Since what is going to be elaborated on is group trust of one group in another, diffusion of first-hand information within the information receivers’ own group, rather than in a third group, is focused on. Both how many people in group A have first-hand information about group B and its proportion may affect the views of receivers of second-hand information in group A on group B and the specific process of information diffusion. For an extreme example, suppose there is only one person has interacted with people in group B and his / her genuine impressions,
1 Note that “trustworthiness of a specific group” here does not imply a collective behavior of that group reflecting trustworthiness, as can be seen in the subsequent contents. In fact, collective behavior of a group is not what is considered here, although it may also provide evidence for the evaluation of trustworthiness of that group. Same with general trust, the general impression of the trustworthiness of a specific group can also form by acquiring corresponding information (such as, via personal interactions) of the trustworthiness of not all individual persons in that group, which can be viewed as a sampling process and from which some similarity can be drawn, although the impression formed in this way could be biased. In a word, what is talking about in the section is not collective behavior of a group.
Chapter 1: Thinking Trust Systemically in Socio-Economic Environment
23
which could be a misunderstanding, on group B gets diffused in group A without exaggeration. It is not hard to imagine that all receivers of second-hand information will have the same information, given that there is no information distortion in the course of information diffusion. By contrast, when there are many people in group A who have interacted with people in group B before and therefore many have first-hand information, there could be two common situations: First, when one person with first-hand information is the first to express his / her opinions on group B, others in group A who also have first-hand information and similar opinions may be stimulated to follow-up to tell their similar experiences and views. In this case, receivers of second-hand information in group A may also tend to have a similar preconception. Second, different people express different opinions which usually turn out to be two almost opposite ones. In this case, receivers of second-hand information in group A may get both the two views and decide which one to follow etc.
It should be noted that after first-hand information is brought back from group B to group A, even when there is no intentional distortion, it is still possible that there is misunderstanding of the intentions and purposes of some behavior of the people in group B, especially when there is no sufficient understanding of local language, cultural background and other “tacit” knowledge within group B which cannot be directly inferred from presented behavior.
1.2.3 Formation and implementation of general trust
(i) From particular to general: experiences-oriented formation
What one knows about the past may all affect his / her personal trust level to some extent. An underlined point here is experiences. A person not only has his / her personal practical experiences, but can also know something about others’ experiences; (s)he can not only know some experiences of his / her contemporaries, but also experiences of earlier generations via verbal communication, literal records, videos, etc. which transmit “habits of thought”. As admitted, traditions are transmitted from the distant past. A typical example of shared experiences is collective memory. It is admitted that no two persons have exactly the same life experiences, which leads different human individuals to have different habits of thought, and further, habits of behavior. Denzau and North (1994, p. 14) argue that, “the entire structure of the mental models is derived from the experiences of each individual - experiences that are specific to the local physical environment and the socio-cultural linguistic environment.” Apart from the absolute differences of personal experiences, similar experiences or collective memory may push the generation of similar viewpoints.
Trust is not a specific case of general trust; on the contrary, general trust is a specific case of trust. From an individual perspective, the generalizing process of trust can be treated as an inferred result from a sample of population to the whole population. Elsner and Schwardt (2014) provide a positive explanation of how trust gets generalized. They argue that the semi-conscious habituation of institutionalized cooperative behavior is “a pre-condition for […] a generalized trustworthiness to facilitate elevated levels of general trust” (Elsner and Schwardt, 2014, p. 124). They propose that general trust derives from “repeatedly experienced cooperative behavior” which constructs the foundation for contextual trust “in a habitual cooperative behavior pattern” (Elsner and Schwardt, 2014, p. 124). Also, in a process of habituation, general trust develops from contextual trust in several meso-sized, maybe overlapping, arenas and platforms (Elsner and Schwardt, 2014). From what they analyze, it can also be seen that evidences of trustworthiness are marginally collected,

Trust and Development: The Deep Structure of Institutions-Building and Socio-Economic Performance
24
although general trust in their paper (Elsner and Schwardt, 2014) is not from an individual perspective. The evidences of trustworthiness are considered as representatives of a person’s inferred reality and construct his / her level of general trust.
Therefore, the process of the generalization of trust is to a large extent experience-oriented, or backward-looking. After every trust-related event happens, it is marginally added into our mind. All the trust-related events happened so far, which happen before the current time point, construct the “raw materials” of an individual’s comprehensive assessment on something although we may not remember every detail. In our minds, we may via various mechanisms, such as classifying the events, “tidy” different events. Different events may also have different weights in its final impact on an individual’s trust attitude. Weights could be influenced by when those events happened, memory, what are valued, channels of information acquisition, psychological influences of those events, and so on. However, humans are not mechanically response to outer stimuli. We may have our own additional opinions, some further considerations, profound insights and rich imagination and association.
General trust more or less can be considered as a kind of general and overall attitude toward a concept covering a relatively large range of persons, things, events or phenomena, rather than a particular object. Although the trust-related things probably come one by one, the roles of them like the samples which an individual can use to refer to his / her surroundings and form his / her general trust, maybe within boundaries. Why “maybe within boundaries”? For example, we have an overall impression on the social environment and generate general trust; we may also have general trust about an industry in which situation it is not appropriate to be applied to a single firm; we may also have general trust about a firm in which situation it is not appropriate to be applied to a single staff or whoever in that firm. All in all, general and particular are two relative concepts whose applicability depends on specific situations. Additionally, the attitude finally formed by an individual is not definitely reflects the reality, even in an approximate sense. It can also even be the total opposite to the reality. Different people may make different judgments on general trustworthiness because of different experiences and beliefs on humanity. The key point is the information possessed. Lack of key information could even result in a qualitatively opposite conclusion.
(ii) From general to particular: expectation-oriented implementation
If the process of the generalization of trust is backward-looking, experience-oriented, then the output of general trust is forward-looking, expectation-oriented. This general trust functions in a particular way in future time points. Specifically, as described above, various information outside comes into our brain and get filtered, classified and interpreted in our mind, then we comprehensively construct a general attitude of trust. When an actual action / interaction occurs, this general attitude of trust always manifests on a particular person, or different parties involved in a particular event, etc. For example, a person for particular times before gets information about existing problems about food service industry published via, such as, mass media or the Internet. Similar events happen subsequently. Then (s)he may form an overall impression about the trustworthiness of the whole food service industry. Further, when (s)he currently needs to make a decision on buying food, what his / her general trust affects is actually this future particular interaction. Another example, if one does not trust others in general, (s)he will tend to exude or betray his / her distrust to the particular

Chapter 1: Thinking Trust Systemically in Socio-Economic Environment
25
interactor in particular future interactions.
It should be noticed that it is not comprehensive to consider trust (of all kinds) only to be related to the past or the future. Trust is a string sewing the past, the present and the future alone the time axis. Memory connects the past to the present, and imagination and expectation connect the future to the present.
In summary, trust can be general; however, when really functioning, it is probably reflected in a particular way. That is, one can have a general attitude towards a collective, but his / her attitude is particularly implemented when transferred into specific interactions. Figure 1.3 presents the formation and implementation of general trust.

Trust and Development: The Deep Structure of Institutions-Building and Socio-Economic Performance
26
Figure 1.3 Formation and implementation of general trust.
Particular trust related events Marginally added
(Input particularly)
Trust generalization (Inner generalization)
Particular trust related events Behavior output
(Output particularly)
Different previously happened trust-related events construct the “raw materials” of
trust generalization.
Future event
Future event
Event n at time point t
Event 1 at time point 1
Event 0 at time point 0
… …
Backward-looking Experience-oriented
Forward-looking Expectation-oriented

Chapter 1: Thinking Trust Systemically in Socio-Economic Environment
27
1.2.4 Experience and expectation
Experience and expectation are relative and dynamically change as time goes by. Treating “now” as the separation point, experience is about what is before now, while expectation, on contrast, is about future, about what is after now. An event on some future time point about which some expectation is made becomes the past and experience after that time point passes by. Future has uncertainty. However, after being experienced, uncertainty will turn into established facts and certainty. (See Figure 1.4) In a word, time will eventually change all expectation into experience gradually.
Figure 1.4 Experience and expectation.
It should be noted that consistency of expectation and a later fact is not definitely going to increase trust. The impact of consistency of expectation and a later fact on trust also depends on whether the expected thing is desirable or undesirable. Then, there generate four specific situations: First, when the expected thing is desirable and the later fact confirm the expectation, it is conducive for trust to increase. Second, when the expected thing is desirable but the later fact refutes the expectation, it is disadvantageous for trust. Third, when the expected thing is undesirable and consistent with the later fact, it consolidates distrust. Fourth, when the expected thing is undesirable but in consistent with the later fact, it is beneficial to trust. (See also Table 1.1)
Table 1.1 Impact of expectation and later facts on trust.
In addition, personal experiences could correct the impression from information from non-personal experiences. This correction could be twofold: one is to strengthen previous impression when personal experiences and non-personal experiences coincide, the other is to weaken it when they do not coincide.
(i) Types of experience
(a) Childhood experiences vs. adulthood experiences
Consistency with facts Consistent Inconsistent
Expectations Desirable Increase Decrease Undesirable Decrease Increase
Uncertainty Expectation
Uncertainty
Uncertainty
Expectation
Expectation
Now
Now
Now
Past
Past
Past
Certainty
Certainty
Future
Future
Future
Experience
Experience
Experience

Trust and Development: The Deep Structure of Institutions-Building and Socio-Economic Performance
28
According to the different age stages, experiences can be roughly divided into childhood experiences and adulthood experiences. As we know, experiences in childhood have a large impact on personality and character shaping than those in adulthood. Moreover, negative childhood experiences, especially big ones, may even leave a psychological shadow or psychic trauma in someone.
(b) Personal experience vs. non-personal experience
Personal experience refers to what happen to oneself, while non-personal experience refers to what do not happen to oneself, but to others, of which one can acquire information via various informational channels. Personal experience can provide the most direct feelings, ceteris paribus. By contrast, feelings from non-personal experience could mainly derive from two perspectives: first, one imagines that what happened to others had happened to himself / herself; second, thinking what happened to others as / like a bystander. In addition, non-personal experience has a bearing on what Bandura (1977) called vicarious learning (see Section 1.6.3). Like personal experience, non-personal experience has a big influence on personal attitude (e.g., trust attitude), opinion and behavior (e.g., trusting behavior).
(c) Positive experiences vs. negative experiences
One’s experiences can be positive or negative, not considering those with no obvious effect. If an experience is undesirable, has a negative impact on one’s psychology (e.g., causing a negative emotion) etc., it is negative; otherwise, if an experience is desirable, has a positive effect on one’s psychology etc., it is positive. Take individual trust as an example. Those experiences reflecting the untrustworthiness of others and making people generate a sense of distrust can be categorized into negative experiences. By contrast, the experiences making people form a sense of trust are positive ones.
(ii) Types of expectation
One’s expectation influences his / her current and future attitude and / or strategic behavior. Also, people’s expectation may be mutually influenced. Zucker (1986) distinguishes constitutive expectation and background expectation. Below, three pairs of expectation are classified from different criteria.
(a) Positive expectation vs. negative expectation
If what is expected is expected to develop towards a desirable direction, it can be referred as positive expectation; otherwise, it is negative expectation. Positive and negative expectation have a different impact on human psychology and could probably stimulate different human emotions and behavior. To a considerable degree, positive expectation derives from positive experiences, while negative expectation comes from negative experiences.
(b) Self-based expectation vs. causes-based expectation
According to whether an expectation is made in accordance with the behavioral carrier of a corresponding event, expectation can be categorized as self-based expectation and causes-based expectation. If expectation is made according to the nature of the carrier per se, it is self-based

Chapter 1: Thinking Trust Systemically in Socio-Economic Environment
29
expectation. For example, if you know that someone is untrustworthy about something, you will expect him / her probably not to keep his / her promise when (s)he makes one about that thing. This expectation is based on the characteristics of that person himself / herself. By contrast, if it is because something else happens that something is expected to happen, it is causes-based expectation. For instance, if a big and famous pharmaceutical company is involved into a scandal of the quality of medicine, you may expect the stock price of that company, given that the company is a listed one, or even the whole pharmaceutical industry in some cases, may go down at least in the following days in response to that piece of information. This kind of expectation is based on the impact of external causes on the behavioral carrier of an expected event.
(c) Quantitative expectation vs. qualitative expectation
Quantitative expectation, as literally shown, is expectation calculated through mathematical methods, which requires sufficient knowledge of the possible outcomes of the expected event and their probability distribution. By contrast, qualitative expectation is expectation through judging, intuitively or not, an event or person by and large. For example, does someone look like a good or bad guy? Is it good or bad intention that someone’s behavior betrays? Does someone more likely to behave trustworthily or not in some particular situation? In everyday life, what people much more turn to when they expect is qualitative expectation. This is mainly because qualitative expectation is considerably easy and time- and cost-saving to conduct, but sufficiently effective for daily decision-making. Reversely, quantitative expectation is more frequently used in professional fields where precision is required for, serious decision-making, etc.
1.3 Measures and representation of (general) trust
1.3.1 Measuring general trust at micro level using survey data
“General trust” is individuals’ general trust. It is usually measured by the question, i.e., “generally speaking, would you say most people can be trusted” or some question similar, which can be found in various micro surveys, such as General Social Survey (GSS), World Values Survey (WVS), European Social Survey (ESS), European Values Study (EVS), Chinese General Social Survey (CGSS) and so on. In WVS and EVS, both the standard question and answer options are almost identical. For example, in WVS wave 6, the question is “Generally speaking, would you say that most people can be trusted or that you need to be careful in dealing with people?” with its answer containing two options: “1. Most people can be trusted”; “2. Need to be very careful”. Similarly, in EVS, the question is “Generally speaking, would you say that most people can be trusted or that you need to need to be very careful in dealing with people” with its answer also containing two valid options: “1. Most people can be trusted”; “2. Can’t be too careful”. ESS asks the same question, but with a different answer type. In ESS 7, the question is “[…] generally speaking, would you say that most people can be trusted, or that you can’t be too careful in dealing with people?” The answer is an 11-point scale with 0 denoting “You can’t be too careful” and 10 representing “Most people can be trusted”. A common point of the general-trust questions in WVS, ESS and EVS is that no obvious scope is shown in these questions. As Glaeser et al (2000b, p. 815) point out, one of the interpretation difficulties existing in the standard question is “differences in interpretation of who comprises ‘most
Trust and Development: The Deep Structure of Institutions-Building and Socio-Economic Performance
30
people’”. Making up for this efficiency somehow, the CGSS 2013 question is “Generally speaking, do you agree that most people can be trusted in this society?” “In this society” here provides a scope for respondents. Additionally, its answer adopts a 5-point Likert scale with 1 representing “Strongly disagree”, 2 “Disagree”, 3 “Neither”, 4 “Agree” and 5 “Strongly agree”.
About this standard question of general trust, we may wonder, such as: 1) What on earth the standard survey question of general trust actually measures. trust or trustworthiness. And whose trust and trustworthiness. 2) From which perspectives respondents would understand this question; 3) the scope of general trust. Is the scope widely enough to cover strangers?
About the first issue, Putnam (2000, p. 137), Glaeser et al (2000b) and Alesina and La Ferrara (2002) all think that the standard survey question of general trust actually reflects trustworthiness, however, having different views about whose trustworthiness it is. Putnam (2000, p. 137) and Alesina and La Ferrara (2002) believe that respondents according to the general others’ trustworthiness answer this question, while Glaeser et al (2000b), after conducting an experiment, demonstrates that it is the trustworthiness of respondents themselves that the standard survey question actually measures. On this issue, I hold the same opinion with Putnam (2000) and Alesina and La Ferrara (2002) that respondents in accordance with the trustworthiness of others in the society answer the question. This is also consistent with one of my opinions that trustworthiness provides basis for trust.
As to the second issue, there could be at least two possibilities of which respondents answer the standard survey question of general trust. One is the sample-inference perspective from which respondents at first comprehensively feel the impression that their personal experiences, experiences of others that they have heard of, news reports, etc. leave on them, then infer the trustworthiness of the whole scope of people in their mind, and finally give an overall assessment. The other one is the belief perspective from which respondents just consider whether the statement “most people can be trusted” is probably true, without taking into account personal experiences etc. For example, one may firmly believe that most people can be trusted and will meet kind people in future, although (s)he already has many unpleasant experiences.
For the third issue, both Knack and Keefer (1997) and Uslaner (2002, Chapter 3) think that the scope of the standard survey question of general trust is not limited to familiars. Specifically, Knack and Keefer (1997, p. 1256) argue that “The term ‘people’ is general enough that responses should not merely reflect expectations about the behavior of friends and family.” Uslaner (2002, Chapter 3; 2005) demonstrates that the question does reflect trust in strangers. I agree with them by and large. In my view, given that respondents do consider a scope, rather than have in mind an ingrained preconception that most people in the world are kind, the scope which the question hints at, or which it leads respondents to consider, is definitely not limited to the small circle of familiars, although, rigorously speaking, we do not know exactly the scope and the weight of impact of different experiences etc. on the respondents’ overall assessment in their mind.
Intuitively, the scope of general trust is definitely not too small. But some people may still be entangled in the exact percentage that the word “most” in the standard survey question of general trust presents. However, trying to determinate an exact number for the “most” does not seem to be wise since a word with approximate meaning was not created for exact expression. What we know is that “most” is definitely larger than 50%.

Chapter 1: Thinking Trust Systemically in Socio-Economic Environment
31
Words representing quantity can be categorized into two types. One is for representing a specific number, such as one, two, three, etc. The other is for representing an unspecific number, and therefore a range of numbers, such as “most”, “about”, “approximately”, etc. Words representing specific number can be presented using words representing unspecific number; however, not vice versa. “Most” itself is for representing an unspecific number. Therefore, entangled in whether it is 60% or 80% is neither meaningful nor necessary. In a word, words for presenting an unspecific number were not created for reversely inferring a specific number.
1.3.2 Measuring general trust at macro level using survey data
Generalized trust at macro level in empirical research is always calculated using generalized trust data at micro level in surveys. Specifically, in cross-country empirical analysis or in diachronic change of a particular country, generalized trust at a country level is represented by the share of respondents who answer “Yes” or choose a score above a certain chosen level (such as, the middle score) in a Likert-type option set to that standard survey question of generalized trust “Generally speaking, do you think most people can be trusted” in all the respondents in a country (e.g., Knack and Keefer, 1997). For example, given that there are only two options “Yes” and “No” to that survey question and that all the respondents of a country have given a definite answer, if in all the 1000 respondents, 700 respondents answer “Yes”, then the generalized trust of that country is 70%. Another example, suppose there are five Likert-type options, namely “Strongly disagree”, “Disagree”, “Neither”, “Agree” and “Strongly agree”, to that question, and there are 700 out of 1000 respondents of a country choose the latter two options. Then, the generalized trust of that country is treated as 70%.
This method is easy to understand and operate, and to some degree of reasonability. However, both cross-country and diachronic comparison of general trust in this way may have inherent confusing aspects which cannot be solved, at least so far. As to cross-country comparison, it is possible that the respondents of a country may generally tend to higher report trust level than their true feelings out of some reason, while the respondents of another country may generally endow untrustworthy with events more weights.
As to diachronic comparison, Putnam (2000) gives three possibilities behind changes of macro generalized trust:
If fewer survey respondents nowadays say, ‘Most people can be trusted,’ that might mean any one of three things: 1) the respondents are accurately reporting that honesty is rarer these days; or 2) other people’s behavior hasn’t really changed, but we have become more paranoid; or 3) neither our ethical demands nor other people’s behavior have actually changed, but we now have more information about their treachery, perhaps because of more lurid media reports. (pp. 137-138)
1.3.3 Measuring trust using the investment actions in a trust game
In behavioral experiments, trust is also measured by investment actions in trust games. The prototype of the classic and famous trust game is the investing game proposed by Berg, Dickhaut and McCabe (1995).

Trust and Development: The Deep Structure of Institutions-Building and Socio-Economic Performance
32
The investing game of Berg, Dickhaut and McCabe (1995) is a two-person game implemented among university undergraduates. It requires anonymity and only one interaction because its aim is to investigate the role of trust as a reciprocal mechanism, which makes it necessary to exclude other possible reciprocal mechanisms involving reputations, contractual precommitments and punishment (Berg, Dickhaut and McCabe, 1995). Berg, Dickhaut and McCabe (1995) implement two experimental treatments, one is no history treatment, the other is social history treatment. Therein, the benchmark is the no history treatment (Berg, Dickhaut and McCabe, 1995). The basic process of the no history treatment is like this: each subject is given 10-dollar show-up fee, and all subjects are separated in two rooms (room A and room B). In the first stage, subjects in room A must decide how much of his / her 10 dollars is given to an anonymous partner in room B as an investment. This amount of money will then be tripled when being given to their anonymous partner in room B. In the second stage, subjects in room B decide how much of the money (s)he received (namely his / her partner’s tripled “investment”, not including his / her own 10-dollar show-up fee) to return to his / her partner in room A. The difference between the social history treatment and the no history treatment is that the subjects in the former treatment are informed of the summary results of the latter treatment (Berg, Dickhaut and McCabe, 1995).
In addition, based on this trust game designed by Berg, Dickhaut and McCabe (1995), other scholars also made a meaningful exploration of trusting behavior in games (e.g., Bohnet and Zeckhauser, 2004; Bohnet et al, 2008; Cox, 2009; Fahr and Irlenbusch, 2000; Sapienza, Toldra-Simats and Zingales, 2013).
Many researches have explored trusting behavior based on this trust-game. As we have seen, behavior of giving some amount of one’s own show-up fee to an anonymous partner is treated as trusting behavior in trust-game experiments. However, it should be noted that a potential problem in this kind of trust-game experiments is whether the money-giving behavior, which is treated as trusting behavior, does reflect trust. Specifically, subjects in such an experiment may not treat the show-up fee as payment for participating in the experiment; they may more enjoy the whole process of the experiment and not much care monetary payment; they may not feel sad if no show-up fee is definitely left for their own. So, when they have to give up a proportion of the show-up fee as an investment, they do not think twice. Thus, the money-giving behavior will not reflect trust at all.
1.3.4 Measuring social trust using the cooperation share in evolutionary game theoretical agent-based modeling
In research involving game theoretical models, trust is often defined and measured based on cooperative behavior in a time period in the total population under investigation. For example, Wäckerle, Rengs and Radax (2014, p. 172) use “average share of cooperative actions within the whole population” to represent societal trust. However, it should be noted that trust and cooperation do not always coincide. Relatively speaking, trust places emphasis on psychology, while cooperation on behavior. Trust may drive cooperation, but cooperative behavior can also be out of other purposes or intentions. Thus, this way of measuring social trust is actually under the potential hypothesis that only trust can cause cooperative behavior. In addition, it should be noted in passing that what to use to represent trust in formal models to some degree has a bearing on what method to use.
Chapter 1: Thinking Trust Systemically in Socio-Economic Environment
33
1.3.5 Representing micro trust using probability
In my view, the most fundamental function of individual trust lies in its impact on the willingness to interact. Willingness to interact is the premise of whether to interact. Without willingness to interaction, interactions would not happen, nor would the consequences from interactions, including desirable and undesirable ones. In terms of willingness to interact, there are basically two situations, one is the willingness to interact after knowing the partner’s personal quality; the other is after knowing some disapproved behavior and phenomena existing in society. Unless there are other purposes, people usually are unwilling to interact with those whom they do not trust in or in untrustworthy contexts / situations. Unwilling to interact because of distrust may be out of avoiding detected monetary, time, spiritual or affective losses etc. In normal situations, only when people have not detected danger of being intentionally viciously deceived is it possible for them to place trust.
Based on this idea, we can presume that willingness to interact hinges on trust in formal models which contain human interactions and use probability which is between 0 and 1 to represent individual willingness to interact when individuals face each potential interaction so that (dis)trust, a psychological conception in essence, can be associated with different behavior that it leads to. Chapter 4 of this thesis will just in this way represent trust in an agent-based model.
1.4 Trust at the micro level: both thoughts and behavior
matter
At the individual (micro) level, sense of (dis)trust is formed on the psychological level and through interactions functions on the social level. Thus, we should at the same time pay enough attention to both individual thinking process (namely, psychological or mental activities) related to trust and the possible impact of personal trust on future personal interactions since only emphasizing either psychological or interactional aspect is one-sided, and after all, antecedent personal or observed interactions delivering information of trustworthiness of others cannot have an actual influence on future personal interactions without functioning at individual psychological level.
1.4.1 Thoughts and trust
This aspect stresses the psychological or mental process of how a person in his / her mind processes information of others’ trustworthiness acquired through personal interactions or observed interactions of others. To understand human mind, Cosmides and Tooby (1997) elaborate on five principles applied by evolutionary psychologists inspired by biology. When explaining those five principles, they state that “the function of the brain is information-processing”, or put another way, is “to solve adaptive information-processing problems” (Cosmides and Tooby, 1997, para. 29-30). The circuits in human brain in response to information from environment generate behavior appropriate to one’s environmental circumstances (Cosmides and Tooby, 1997). On psychological level, trust typically presents an inner process consisting of interpreting information, judging one’s trustworthiness, responding emotionally the judgment of trustworthiness, expecting the possible

Trust and Development: The Deep Structure of Institutions-Building and Socio-Economic Performance
34
results of future similar interactions, making decisions involved in future interactions etc.
Sense of trust is established or destroyed based on a process of perception or thinking after the arrival of information containing others’ trustworthiness. After information of that sort is acquired, a person starts to interpret that information and makes a judgment of the quality of trustworthiness. Overwhelmingly most of the time, if not at any time, this process from the arrival of information delivering (un)trustworthiness to the perception or judgment of (un)trustworthiness is quite quick. Imagine the situation that when you see a pickpocket, you will immediately realize that the person is not trustworthy. Despite the very short time for judging, this judgment is crucial for trust. Criteria of judging trustworthiness consist of, but not limited to, traditional cultural values, social norms, moral norms, virtues, laws and so on and so forth which to a large degree are within the institutional sphere. Although people in different places may have different concrete judging criteria, the common point is that others’ (un)trustworthiness always results in one’s (dis)trust.
To which degree a person would react to information delivering trustworthiness of others depends largely on personal preference, opinion, emotional attitude etc. which influence his / her final assessment of a particular trust-related event and people it involves. Thus, the same piece of information would have a different impact on people’s trust. Trust of those who are extremely averse to some kind of untrustworthy behavior would reasonably decrease to a larger degree than those who do not care it that much. Also, different kinds of events could to a different degree influence the trust of the same person. For example, a person who has more tolerance for being told lies may very much hate being picked pocket.
What is more important, humans have the capability of reasoning, inference and association etc. which play a crucial role in a person’s trust in future similar situations and / or in other people with some kind of common and / or similar characteristics. For example, a person knowing the fact of the relatively rampant robbery in a city will expect a higher probability of being robbed when (s)he goes there and therefore will pay much more attention to his / her own belongings. As externally coming pieces of information are (continuously marginally) added through experience, personal or observed, how they are mentally processed, interpreted and integrated in his / her formed structured general idea could also change (such as, relieve or consolidate etc.) one’s opinion on the previously perceived reality.
A person’s basic trust propensity is established and stabilized in his / her early life. The subsequent experiences could cause upward and downward fluctuations around one’s basic propensity. However, it does not mean one’s basic propensity of trust never changes. One possibility is that if one with high trust propensity is exposed for a certain time in a circumstance of low trustworthiness, (s)he would probably get less trusting.
1.4.2 Behavior and trust
This aspect emphasizes the impact of trust on behavioral outputs. Behavior, to a large degree, is an expression of the results of one’s thinking process. What should be noted here is that different thoughts could lead to the same or similar behavior, and likewise, different behavior could also derive from the same or similar thoughts. Therefore, inferring a unique thought or intention from some kind of behavior without any other information about the context is usually unreliable.

Chapter 1: Thinking Trust Systemically in Socio-Economic Environment
35
One way of the accumulated effect of trust comes from the interpretation of indications of trustworthiness and whether or not one has encountered or expects to encounter goodwill or benevolent behavior, or whether or not one has not encountered or expects not to encounter malevolent behavior. Generally, only when trust is transformed into objective trust-based behavior can the behavior causes realistic consequences in society and socially functions.
(i) Forms of trust in two-party interactions
In a specific trusting-trusted relationship involving two parties in real life, a person could basically act as either the trusting or the trusted party, or both at the same time. The situation in which each party acts as either role of the trustor and the trustee is unilateral trust, while the situation in which both parties act as both roles of the trustor and the trustee is bilateral mutual trust.
What is more, a trusting-trusted relationship probably necessitates two steps from an interactive perspective, with a specific event being involved: the first is both parties agree to be involved in the event; the second is the specific implementation process of the particular event after agreement. Shortly put, namely before and during an interaction. (The ex post assessment is covered by the “thoughts” part.) Below, a role-embedded and process-split categorization is presented to understand different forms of trust in a trusting-trusted relationship in an interaction involving an event (see also Table 1.2).
(a) The first form is a kind of unilateral trust in which the trusting and the trusted parties both agree to participate in some event, but only the trusted party is mainly involved in the later implementation and acts as the behavioral party (see, Table 1.2, (a)). An easily associated example of this form is principle-agent relationships. In a principal-agent relationship, the agent deals with what the principal pays him / her to do on behalf of the principal, which also makes the principal vulnerable to moral hazard from the behavioral party – the agent. For example, shareholders employ professional managers to daily manage their company, which forms a trusting-trusted relationship and in which situation the managers, the trusted party, are the main behavioral party in the following work.
(b) The second form is also a kind of unilateral trust in which both the trusting and the trusted parties agree to be involved in an event, but mainly the trusting party takes part in its specific implementation (see Table 1.2, (b)). Imagine a situation that a person asks another person for “help” and the latter person agrees. Then whether the first person asking for “help” is good or not is crucial. If the first person is a good one and does only ask for help, the second person who trusts and acts as the behavioral party is safe and they both would probably have a pleasant experience. But if the first person is actually a fraud and asking for “help” is only an excuse for him / her to approach a target person, then the second person who trusts and acts as the main behavioral party may be exploited.
(c) The third form is bilateral mutual trust in which both the trusting and the trusted parties agree to be involved in some event, take part in its later implementation, and, more importantly, at the same time have a dual identity of a trusting and a trusted party in the whole process of the event (namely including ex ante and during implementation) (see Table 1.2, (c)). For example, in a cooperative relationship based on mutual trust, both parties are behavioral parties in the subsequent cooperative process.

Trust and Development: The Deep Structure of Institutions-Building and Socio-Economic Performance
36
Table 1.2 Forms of trust in two-party interactions and its main behavioral party.
(ii) Several specific decisions involved in trust
Personal interactions are the most important channel through which trustors show their trust attitude. An interaction involves a bunch of decisions, and as a trustor, one can influence and shape an interaction through those different decisions, which can be simply described as “1H+4W”, namely whether, who, how, when and where, where the first two will be incorporated in the simulation model in Chapter 4. Essentially, those decision-making processes are thinking ones, while their results will be in real-actions forms.
(a) Whether Whether to take part in or exit from an interaction are two decisive steps for interactions to be the real ones. For example, if an individual expects the people in a given interaction will consider his / her interests, treat him / her fairly, and not exploit him / her, (s)he maybe would like to join in the interaction, ceteris paribus. In contrast, if one involved in some particular interaction feels being exploited, (s)he would discontinue the interaction and exit.
(b) Who People can choose with whom to interact. Put another way, this is related to from whom one can get the expected behavior, such as trustworthy behavior, although with different probabilities. For example, if one expects the probability that A will lend him / her some money is greater than B, (s)he will ask A prior to B. Also, with whom to interact is related to reputation chain.
(c) How This is related to through what way to guarantee a particular result of an interaction. Taking the lending money example above, the degree of trust may influence whether paying back the money is verbally promised or guaranteed by a formal contract.
(d) When This implies how long an individual will really take an action in a particular interaction after (s)he decides sometime in future that (s)he will definitely join in it. This is something related to time lag. For example, after a new product is launched, person A and B both decide to buy one someday. However, in spite of some other constrains like income, if A has higher trust in the company and its products, or its technology than B who would like to wait until get some feedback from other users, A may buy one prior to B.
(e) Where For example, one may feel safer if an interaction takes place where there are more people than elsewhere there are fewer.
1.5 Trust and trustworthiness
1.5.1 Relation between trust and trustworthiness
The change of one’s trust, from a trustor’s perspective, is not unconditional, as aforementioned; trust is always based on perceived trustworthiness, or at least unperceived untrustworthiness. That
Behavioral party The trustee The trustor Both trustor and the trustee Unilateral trust (a) (b) Bilateral mutual trust (c)

Chapter 1: Thinking Trust Systemically in Socio-Economic Environment
37
means, people incline to recognize the degree of other people’s trustworthiness and trust those who are, or more likely are, trustworthy or who seem not untrustworthy. Hardin (2003, p. 82) argues that “our trust in another is essentially a matter of relevant knowledge about that other- in particular, knowledge of reasons the other has to be trustworthy”. “The best device for creating trust is to establish and support trustworthiness. […] without the latter, there is no value in trust” (Hardin, 1996, p. 29).
Some people may say that we only know the trustworthiness of whom we are relatively familiar with, but cannot make a judgment on that of whom we are not familiar with or even do not know. I do not totally agree with this opinion because it neglects the importance of other ways of information acquisition except relatively frequent personal interactions and human capabilities like observation, speculation, association, and so on. In a word, that remark does not consider human intelligence sufficiently. Actually, people can also make a judgment on the trustworthiness of those whom they do not know via appearance, behavior, environment, context, etc., combining with what they have already known about the society, as long as they don’t know nothing, although the judgment might be erroneous. Of course, one might not be trustworthy in every single thing and all the time, and so for trust. One’s trustworthiness may depend on specific events.
Trustworthiness may come from both personal characteristics and the incentives of the structure of social interactions (Ostrom and Ahn, 2009), such as the incentives provided by formal institutions. Whether, how and to what degree institutions structure individual behavior after all lie in the individual himself / herself. It is widely accepted that external causes function via internal causes. Whether or not an institution emerges is largely determined by the degree to which it is internalized into individual thoughts and behavior, or even by behavior per se.
Experiencing others’ trustworthiness gives a reference of one’s trusting behavior towards some particular person, although the particular person may not certainly be the one with whom (s)he creates the experience. The perception of others’ trustworthiness may not always be entirely consistent with the objective trustworthiness. Even so, trust and trustworthiness usually qualitatively coincide.
In reality, trustworthiness may also react to trust. For example, when the trustworthiness of a trustworthy one is not cherished, (s)he may feel frustrated, which may lead to a decrease of his / her willingness to future interactions. Moreover, given people’s demand on interactions, if actual trustworthiness is always being questioned, there could be two effects: first, some people may keep trustworthy to show that they are indeed trustworthy; second, some people may even turn to untrustworthy behavior out of the thought that after all nobody trusts. However, it should be noted that the possibility that others’ real trustworthiness reacts to one’s trust has no universality. Thus, in a word, trust and trustworthiness may interact, however, with trust a lot more depending on trustworthiness.
1.5.2 Individual and social costs of untrustworthiness
Costs of untrustworthiness talked here is mainly from an interactive perspective. Costs of untrustworthiness can be both individual and social.

Trust and Development: The Deep Structure of Institutions-Building and Socio-Economic Performance
38
As individual costs, they are mainly reflected in three aspects: First, if an interaction happens but the other party, supposing an interaction only containing two parties, turns out to be untrustworthy, it will bring the trustor a direct loss, especially a pecuniary one because the purpose of those who deliberately deceive others is usually to gain monetary interests. Second, facing potential interactions, especially those initiated by the other party, the trustor would not be willing to interact at all or try his / her best to avoid interacting due to suspicion or worry of being deceived. Third, if an interaction is indeed needed or has to be carried on, especially those initiated by the trustor, the trustor could search for a reliable interactor in advance as preparation for the interaction. This process causes a high searching cost, mainly time cost. A monetary cost is also possible. For example, the trustor may via a qualified institution find a reliable interactor, exchanging money for time and information. In addition, what is more important, distrust may have an involution effect. Specifically, because of distrust, individuals tend to turn to personal social network more which is a network of family members, familiars, acquaintances etc. to mobilize their personal social capital. They intend to via personal social networks, including both their own social network and that of the people on their social networks, acquire information of potential trustworthy interactors and restrain untrustworthy behavior of future interactions.
For a society, an untrustworthy social environment, prominently reflected in people’s searching for economic / monetary / pecuniary interests etc. via unacceptable ways such as not obeying various institutions (such as various norms, morals, laws, etc.) or exploit institutional loopholes (such as legal loopholes), is detrimental to the creation of value because people’s interactions in the society are more likely to be “zero-sum games” in which untrustworthy people tend to try their best to exploit others. In addition, Section 1.10 will particularly elaborate on the effect of (dis)trust on economic transactions which is a specific type of interactions.
1.5.3 Correspondence and superposition of the role as a trustor and a trustee
Every person is a combination trust and trustworthiness, although the two may not present in an interaction simultaneously. Let us have a look at the possible presenting combinations of one’s trust and trustworthiness with another person’s trust and trustworthiness. Then, six possible relationships may come to our mind, namely: a) person 1’ trust and person 1’ trustworthiness; b) person 2’ trust and person 2’ trustworthiness; c) person 1’ trust and person 2’ trust; d) person 1’ trust and person 2’ trustworthiness; e) person 1’s trustworthiness and person 2’ trust; f) and person 1’ trustworthiness and person 2’ trustworthiness. Let’s combine a) and b), and combine e) and f), then four relationships of two kinds exist between two persons: first, within a person, the relationship between one person’s trust and his own trustworthiness; second between two persons, a person’ trust and another person’s trust, a person’ trust and another person’s trustworthiness, or a person’s trustworthiness and another person’s trustworthiness.
(i) Correspondence
When embodied on two persons, trusting and being trusted are bound together in a trust relationship, with one not being able to exist without the other. This kind of correspondence leads to their appearance always as a pair. That is, it is of little point to stress one aspect neglecting the other. Correspondence means that the role of the trustor and the trustee are “acted” by different individuals,

Chapter 1: Thinking Trust Systemically in Socio-Economic Environment
39
which means an individual possesses only one of the two roles in a trust relationship. One person pays trust to the other and thus the former is the trustor and, correspondingly, the latter is the trustee. Obviously, in every interaction of 2-preson trust relationships, correspondence exists in unilateral trust relationships.
(ii) Superposition
Superposition means that the role of the trustor and that of the trustee are concentrated on a single individual, which means an individual actually possesses both the two roles. In social life, one is sometimes in an interaction a trusting person, by contrast, sometimes in another interaction is a trusted one, or simultaneously is both the trustor and the trustee in a single interaction. This kind of superposition of roles reflects the fact that others construct the environment of a particular individual and at the same time the particular individual also constructs the environment of others. In 2-preson trust relationships, superposition exists in bilateral trust relationships. Figure 1.5 also presents the correspondence and superposition of the role of trustor and trustee.
a. Correspondence b. Superposition
Figure 1.5 Correspondence and superposition of the role as a trustor and a trustee in an interaction in a 2-person trust relationship.
More importantly, the meaning of the correspondence and superposition of the role as a trustor and a trustee is not only embodied in a single interaction; it is more reflected in multiple interactions. (Specifically, correspondence in different interactions and superposition in both any single interaction and different interactions.) So, the seemingly insignificant description above actually contains an important motivation for one’s sticking to trustworthiness, and therefore implies an important mechanism for the maintenance of social trust in the whole society. That is, one’s identity or role as a trustor and a trustee is changeable. This changeability of identities is reflected via two ways: One is that an interactor has different single identity in different interactions (and accordingly, other people are as the other role); the other is that every interactor has the two identities at the same in an interaction. Just imagine the situation: If the identity as a trustor and trustee could not change in inevitable interactions, those who are always act as a trustee would have enough incentives to behave untrustworthily to exploit others to get more interests, on condition that there is no punishment mechanism, that there are difficulties for punishments to implement, that punishments are relatively costly, and that the trustee does not have enough moral constraints on itself. One extreme example is the defective behavior in one-shot games. In contrast, changeability of identity as a trustor and a trustee is also an important reason for a person to cooperate in repeated games, besides other possible reasons such as good reputation. More broadly speaking, when it comes to institutions that covers a much larger sphere, changeability of people’s relatively advantageous role in various interactions is also an important factor for the generation and maintenance of institutions,
Trustor Trustee Trustor Trustee Trustee Trustor
Single role of each person: Double roles of each person:
Interact Interact

Trust and Development: The Deep Structure of Institutions-Building and Socio-Economic Performance
40
which will be discussed in more detail in Section 1.8.5.
In addition, a relative comprehensive and sufficient understanding of trust necessitates consideration of both the characteristics of the trusting party and that of the trusted party, namely the propensity of trust and the trustworthiness, as what Mayer, Davis and Schoorman (1995) has suggested. In the point of view of Mayer, Davis and Schoorman (1995, p. 716), the characteristics of different trusted parties contribute to the reason why “a given trustor has varied levels of trust for various trustees”. From my point of view, this argument is also suitable for a certain degree of generalization. Put in another way, the trustworthiness of the trusted party not only acts upon particular trust, but also is an important ingredient of the reconstruction of one’s generalized trust. The general willingness of trust ready for the next interaction is constructed by one-by-one added piece of knowledge or information in the previous interaction or non-interaction experiences. In this sense, the past constructs the whole impression mapping into the present reality and speculated, imaginary future. This is an evolutionary way of thinking trust in the feedback loop. This impact gets much more obvious when one interacts with non-familiar persons.
1.5.4 Supply of and demand for trust and trustworthiness
It is not difficult to understand that from the perspective of an individual person, what I call the supply of trust means to trust, and the demand for trust means the demand for being trusted; the supply of trustworthiness means being trustworthiness while behaving, and the demand for trustworthiness means the demand for the trustworthy of others’ behavior. Thus, trustors supply trust and trustees supply trustworthiness; those who need being trusted have a demand for trust and those who require trustworthiness of others have a demand for trustworthiness. (See Figure 1.6)
It should be noted that trust does not have to be reflected on behavior, although trustworthiness does; however, for behavior related to the supply of and demand for trust which has an influence on others, it is necessary to have a qualitative change with trust (i.e., not behave in some way out of distrust, but behave in that way out of trust.) because only in this way do the supply of and demand for trust make a realistic social sense.
Although the two words “supply” and “demand” make economic scholars associate them with those in economics, and may not be able to get out of their economic way of thinking on the supply of and demand for goods, money and labor force in economics, I am not talking the supply of and demand for trust and trustworthiness strictly within the explanations in the economic sense; actually, I purely intend to express the meaning of “supply” and “demand” of daily use. Furthermore, the two words first have their meaning in daily use, then the meaning in economics; they are not bound to economics, although, of course, their meaning in economics are fundamentally based on their daily meaning. However, it should be noted that, if we have to explain the supply of and demand for trust and trustworthiness like in economics, goods, money and labor force are all concrete and countable or have been quantified, while, on contrast, trust and trustworthiness are not. Moreover, as we know, “supply” and “demand” in economics stress willingness and capability. As to trust, the acquisition of capability is relatively easy, even can be ignored. By contrast, “capability” is more important for trustworthiness since after all, sometimes some factors may limit the willingness of being trustworthy, even though people want to be trustworthy.

Chapter 1: Thinking Trust Systemically in Socio-Economic Environment
41
Figure 1.6 The supply and demand of trust and trustworthiness.
Due to their abstract and uncountability, trust and trustworthiness at micro-level obviously cannot directly be added up to a macro-level number in the arithmetical way in the normal sense. However, it does not mean that people cannot feel or judge whether trust and trustworthiness is high or low because after all humans are intelligent and clever enough to deal with this matter. There are two situations that the supply and the demand of trust do not match: one is overall, and the other is structural. So are the supply and demand of trust and trustworthiness in the macro-level.
As aforementioned, people do not have to determine an accountable quantity when comparing something; often, people can feel whether a quantity is high or low without specific numbers are listed in front. If one does want to compare trust or trustworthiness in the form of an exact number, one solution is to turn to interactions out of trust or trustworthiness which are accountable, even though, as we can realize, this method is not perfectly satisfactory. Suppose that an interaction can only be realized when both the two corresponding parties have a willingness to interact out of some reason, assuming there are only two parties involved. Then, the maximum of actual interactions will equal the smaller one of the willingness to interact reflected by trust and trustworthiness in the most ideal case. For example, the melamine event in 2008 in China, a dairy products contamination event, is always taken as an example by many scholars (e.g., Dai and Elsner, 2015) and media when talking about social trust. After the event, the public’s trust in China’s dairy industry plummeted. In this example, we do not quantify trust. Nor do we need to. Yet, we can truly feel an obviously big difference between the supply of trust from the Chinese consumers and the demand for trust from dairy producers after the event.
1.6 Information acquisition and output: social learning and
interactions
1.6.1 Types of behavior
Behavior can not only deliver the information of an actor’s trustworthiness, but also his / her degree of trust, and is the fundamental source of information of trust and trustworthiness. Therefore, it is necessary to discuss, say, the types of behavior to better understand its relation to trustworthiness and trust, especially the former.
(i) Solo behavior vs. interactive behavior
Behavior can be categorized as solo behavior and interactive behavior. Solo behavior here refers to behavior with no interactors, while interactive behavior has interactors. When acting as a way of
Trustors Trustees
Provide trust to Demand trustworthiness from
Provide trustworthiness to Demand trust from
Trust and Development: The Deep Structure of Institutions-Building and Socio-Economic Performance
42
information output of personal trustworthiness, they both can reflect the trustworthiness of the actor himself / herself or of the behavior per se. Note that solo behavior may or may not have a relation with presenting trustworthiness. By contrast, interactive behavior is more likely to deliver information of trustworthiness of either actor. For example, the behavior that one who lives alone does cleaning at home, or that one paints in a park are both solo behavior, but not relevant to presenting trustworthiness. However, the solo behavior that a chemical plant discharges raw sewage into river to reduce costs from treating industrial wastewater, without considering the harmful consequences caused to the residents along the downstream of the river, will definitely cause the dissatisfaction of the residents with the plant, supposing that there is no “game” between the chemical plant and the supervising department. The reason why solo behavior can even cause people’s perception of the trustworthiness of some behavior lies in its externality, and the degree of the externality.
Solo behavior does not have interactors. Then, if solo behavior does influence others, and even make others form a judgment of trustworthiness, its influence has to exceed the actor himself / herself. Put another way, externality is needed. By contrast, from the perspective of an arbitrary single actor, interactive behavior per se has already exceed the actor himself / herself since an interaction, as the term shows, needs at least two persons or two parties. Thus, when there is no obvious externality, interactive behavior only influences the two interacting parties, supposing there are only two parties involved; on contrast, when there is obvious externality, it may make more people form a judgment of trustworthiness, other than the two interacting parties. In a word, humans are behavioral interdependent.
(ii) Internalization-based behavior vs. internalization-lacking behavior
According to whether driven by internalized values, individual behavior can be categorized into internalization-based behavior and internalization-lacking behavior, with the former being values-behavior consistent but the latter being values-behavior inconsistent or irrelevant. According to the online Oxford English Dictionary, values (2011) are “the principles or moral standards held by a person or social group; the generally accepted or personally held judgment of what is valuable and important in life”. Internalization is a process of accepting some values, norms, attitudes etc. and integrating them into one’s own values system so that (s)he can distinguish right from wrong, use them to judge ideas, behavior etc. and guide his / her own behavior. In my view, no matter how the values are acquired, as long as they are accepted and integrated into one’s own values system, they are internalized. Internalization-based behavior, as the term shows, is based on internalized values of behavior or rules of conduct, while internalization-lacking behavior could be purely imitating or material-motivated without recognizing and being guided by directly relevant internalized values. For example, suppose that telling lies is absolutely morally wrong (therefore we do not take into account the possible rightness of the so-called “white” lies). If it is because one disapproves of it and thinks it is not morally right that (s)he does not telling lies, not telling lies is an internalization-based behavior for him / her; however, if (s)he has no moral concept about telling lies in his / her mind, or it is just because (s)he saw those who are telling lies get punished, not telling lies is then an internalization-lacking behavior. In addition, the methods and channels of acquiring or generating moral values, or more broadly speaking, institutions, are highly related to social learning which will be illustrated mainly in section 1.6.3, 1.6.4, 1.6.6 and 1.6.7. For some brief examples

Chapter 1: Thinking Trust Systemically in Socio-Economic Environment
43
here first, moral values can be acquired through personal interactions, others’ (such as parents or teachers) instructions, reading books of past ages or contemporary ones, etc.
Certainly, there is another situation, that is, although one internally admits some values of behavior, (s)he may still betray those internalized values out of some kind of realistic reason or consideration, which also leads to values-behavior inconsistence, or put another way, another value dominates.
Table 1.3 presents a more all-sided picture about from which mechanism different situations of values at the psychological level could generate different kinds of behavior at the behavioral level, assuming that there are only two kinds of internalized values, right or wrong, and two kinds of behavior, proper or improper. Specifically, right values can via internalization generate proper behavior and via considering some realistic reasons generate improper behavior; wrong values can via external reward-punishment mechanism lead to proper behavior and via a distorted internalization process generate improper behavior; in case of no values consideration involved, both proper and improper behavior can be generated via external reward-punishment mechanism.
Table 1.3 Possible mechanisms behind behavior: a perspective from internalized values.
Since in Table 1.3 external reward and punishment have been mentioned, then let us have a closer look at reward and punishment in passing. The reason why reward and punishment are often stressed is its possible impact on changing behavioral probability. Both reward and punishment, as we know, can be categorized as intrinsic and extrinsic. Intrinsic reward or punishment is psychological self-reward, which is a positive psychology, or self-punishment, which is a negative psychology, while extrinsic reward or punishment is imposed from extrinsic factors on individuals. Take punishment as an example. Intrinsic punishment could be guilty and conscience stirs, while extrinsic punishment could be material and monetary punishment. Admitted that it could reduce improper behavior, punishment may also have no effect. For example, some people would like to suffer punishment, rather than changing behavior out of some internalized principle, similar with reward. Thus, only when actors stick to no definite and firm internalized principles could it possible for reward and punishment alter individual behavioral probability.
1.6.2 Types and filtering process of information
Since trust is in general based on information about trustworthiness of others, a change of trust cannot be separated from information about trustworthiness. According to different criteria, information about others’ trustworthiness can be divided into different types. Specifically, (i) according to the types of behavior, it can be categorized as solo-behavior information and interactive-behavior information; (ii) according to whether oneself is involved in the event delivering information of others’ trustworthiness, it can be divided as involvement information and non-involvement information; (iii) according to whether a piece of information affects the particular
Behavioral level
Behave Not behave
Behave properly Behave improperly
Psychological
level
Internalized values Values' right Internalization Realistic reasons ---
Values' wrong External reward and punishment Negative/distorted internalization ---
No values background External reward and punishment External reward and punishment ---

Trust and Development: The Deep Structure of Institutions-Building and Socio-Economic Performance
44
trust to the actor(s) involved or wariness only to the involved behavior per se, it can be sorted as individual-particular information and phenomenon information; (iv) according to the nature of the contents breached, it can be classified as information breaching individual preference and that breaching social preference (such as, of institutional type, like social norms, morals, etc.); (v) according to where people directly get the information, it can be distinguished as natural-person information and media information; (vi) according to the methods of acquiring information, it can be divided as personal-interaction information and observation information in the broad sense (including, such as, direct observation, word of mouth, news reports, etc.); (vii) according to the distance from the original information source, it can be categorized as direct (first hand) information and indirect (non-first hand) information. Figure 1.7 depicts the interaction information feedback between micro- and macro-level in which all kinds of information just mentioned are involved, except solo-behavior information. This figure embodies the meaning of the seemly unnecessary many categorizations of information above and the information filtration process below.
Since trust is after all a psychological feeling and attitude, whether information about others’ trustworthiness will actually affect individual trust depends on whether it can successfully reach an individual and has an influence on individual psychology. Therefore, the filtering process is a crucial link for information to generate actual effects, given that a piece of information does have successfully reached a person. The filtering process here refers to shrugging off or excluding the effects of a reaching piece of information. It at least involves four situations: (i) (almost) no care, in terms of an information receiver’s personal subjective attitude; (ii) (almost) no relevance, in terms of the objective relevance between the situation that the information reflects and the information receiver; (iii) (almost) no importance, in terms of the objective or subjectively evaluated importance of the situation that the information reflects; (iv) (almost) no move, in terms of the information receiver’s psychological resistance to change his / her trust. Additionally, they all can also be regarded as special cases where some piece of information changes individual trust with no margin. Figure 1.7 also involves information filtration.

Chapter 1: Thinking Trust Systemically in Socio-Economic Environment
45
Figure 1.7 Interaction information feedback between micro- and macro-level.
Directly feedback to individual
Directly feedback to individual
Report
Verbally or by media
Interactive individual at the micro-level
Interactive individual at the micro-level
Mac
ro le
vel
Inte
ract
ive
beha
vior
usu
ally
has
insti
tutio
nal r
equi
rem
ents
on o
ther
s. In
tera
ctio
ns c
ould
be
coor
dina
tion,
coo
pera
tion,
co
nflic
t etc
.
Gradually locally spread through social networks
Immediate neighbors
Media
Relatively globally spread
Information filtration (e.g., no care, no relevance, no importance, no move)
Information interpretation (e.g., values, culture, attitude, preference, emotion)
Various specific decisions, such as “1H+4W” introduced in Section 1.4.2 B
ehav
ior o
utpu
t
Information filtration
Information interpretation
Various specific decisions
Beh
avio
r out
put
Info
rmat
ion
inpu
t
Feedback paths
Info
rmat
ion
inpu
t
Obs
erve
d
Verbally or by media
Feedback to the macro level as an event

Trust and Development: The Deep Structure of Institutions-Building and Socio-Economic Performance
46
1.6.3 Bandura (1977): Social learning theory
Bandura, a famous psychologist, made a prominent psychological contribution in research of social learning. Social learning theory is a theory of explaining human behavior. In his Social Learning Theory, Bandura (1977) simultaneously stresses behavior and cognition, which breaks the previous studying tradition of behavior heavily influenced by mechanistic models, and therefore provides “a unified theoretical framework for analyzing human thought and behavior” (p. vi).
Distinct from “the dichotomy of behavior as either learning or innate” (p. 16), Bandura (1977) argues that behavior, except for elementary reflexes, is acquired by learning, rather than being innately equipped with. According to Bandura (1977, pp. vii, 16), both direct experience and observation (put another way, observational experience or “socially mediated experience”) are channels of acquiring new behavioral / response patterns. Therefore, Bandura (1977, Chapter 2) treats learning by response consequences and learning through modeling as two origins of behavior accordingly.
Bandura (1977, Chapter 3-5) categorizes regulatory systems of behavior as antecedent determinants, consequent determinants and cognitive control, with the first two being external influences and the third internal. Bandura (1977, pp. 96, 160) thinks that therein, consequent determinants “largely through their informative and incentive value” affects behavior, and, furthermore, both antecedent and consequent determinants “through intermediary cognitive processes” influence behavior. More importantly, “psychological function is a continuous reciprocal interaction between personal, behavioral and environmental determinants” (Bandura, 1977, p. 194), rather than functioning separately and independently. (See also Figure 1.8)
Figure 1.8 Reciprocal determinism in psychological function of Bandura’s (1977) Social Learning Theory. Source: Author’s own illustration based on Bandura (1977, pp. 10, 194, 204).
One of the most important contributions of Bandura’s social learning theory is that it “emphasizes the prominent roles played by vicarious, symbolic, and self-regulatory processes in psychological functioning” (Bandura, 1977, p. vii). Human thought, affect, and behavior can not only be affected by direct experience, but also by observation. (Bandura, 1977, p. vii) A big and obvious difference between learning by direct experience and learning by observation lies in their acquisition processes and learning costs. Learning through direct experience is a process of trial-and-error which could bring extremely undesirable consequences in some situations; on contrast, observational learning to
Personal determinants
Environmental determinants
Behavioral determinants
Chapter 1: Thinking Trust Systemically in Socio-Economic Environment
47
a large extent can avoid costs of errors, especially some dangerous ones (Bandura, 1977, pp. 12, 22). This view of stressing the impact of both direct and indirect experiences on learning is different from that of, such as, Mantzavinos, North and Shariq (2004, p. 76) who state that “learning is an evolutionary process of trial and error, and failure to solve a problem leads to the trail of a new solution.” In observational learning, information plays a crucial role. The reason why modeling can arouse learning is principally in virtue of informative function (Bandura, 1977, p. 22). Modeled events through observational learning “governed by four component processes”, namely, attentional processes, retention processes, motor reproduction processes and motivational processes, produce matching performances in people (Bandura, 1977, pp. 22-29). Additionally, even though people can acquire and change behavioral patterns through learning, it does not mean that they accept any behavior passively without principle. Bandura (1977, p. 128) states that “people hold firmly to ideological positions rather than undergo compliant behavior reversals.” Moreover, the self-evaluative standards that people hold are not only for evaluating others, but also for themselves (Bandura, 1977, p. 134).
1.6.4 Types of social learning
Bandura (1977) emphasizes both learning through direct experiences and learning through observation, which distinguishes social learning according to different ways of acquiring information. It should be noted that the word “observation” in Bandura (1977) is used in a boarder sense than just seeing by eyes. Besides, social learning can also be categorized as follows according to different criteria.
(i) Learning thought vs. learning behavior
This categorization is according to the contents of learning. Considering the possible inconsistency between thought and behavior (see Section 1.4.2), learning can be categorized as learning thought and learning behavior. If what one person socially learns is not only a way of behaving, but also the directly corresponding thoughts (such as, values, moral principles, etc.) behind it which are internally accepted and internalized by him / her thereafter, this kind of learning is learning thought; if what (s)he learns is only the behavior, it is learning behavior.
(ii) Forward learning vs. reverse learning
According to the consistency of the behavior pattern between what a learner is learned and that of the person being learned, social learning can be categorized as forward learning and reverse learning. If one follows the behavioral pattern (s)he experiences, personally or observationally, it is forward learning; if (s)he behaves in the totally different way after learning, it is reverse learning. For example, if a person sees trustworthy behavior and learns to be trustworthy, it is forward learning. On contrast, if (s)he learns to be untrustworthy although what (s)he experiences is trustworthiness, it is reverse learning. – This somehow resembles psychological inversion in adolescents. Another example, if one sees others smoking and (s)he learns to smoke, this is forward learning; if (s)he conversely starts hating smoking, it is reverse learning.
(iii) Learning from the same standpoint vs. learning from the counter-standpoint
If a person has basically the same standpoint with the models from whom (s)he learns, this kind of

Trust and Development: The Deep Structure of Institutions-Building and Socio-Economic Performance
48
learning is learning from the same standpoint; otherwise, it is learning from the counter-standpoint. For example, if a vendor knows that other vendors give short weight and (s)he also does like that, this is learning from the same standpoint since (s)he and other vendors are engaged in the same kind of occupation and both behave from the standpoint of a seller. If a consumer knows that the phenomenon of short in weight exists among vendors and (s)he takes some measures not to contact with untrustworthy vendors or becomes warier when buying things, this is learning from the counter-standpoint because the consumer learns at the counter-standpoint of the sellers, namely as a consumer.
(iv) Active learning vs. passive learning
According to the activeness of a learner, social learning can be either active or passive. The meaning of the two kinds of social learning is relatively obvious. Active learning means that the learner learns voluntarily out of his / her own will, while, on contrast, passive learning is pushed by other, especially external, factors.
1.6.5 What to learn? – Social learning and trust and trustworthiness
People living in the human society get socialized from birth, in which process social learning plays an irreplaceable role. In the social learning theory, ways / channels of social learning (such as direct experiences, observation, etc.) occupy a very important position. As aforementioned, they are also ways of information acquisition, including information of others’ trustworthiness, as well as trust. All in all, what is of center importance is the acquisition of external information, knowledge, etc., together with possible according changes of thought and behavior under their influences. In my view, two prominent actual consequences of social learning lie in two aspects: One places emphasis on nurturing behavioral habits. First is nurturing relatively social behavioral habits. For example, people are instilled in mind what behavior is socially acceptable so that those behaviors can be gradually nurtured. These behaviors are usually institutional. Second is nurturing relatively personal behavioral habits, such as smoking or tiding stuff, etc. It is noteworthy that behavioral habits that have been nurtured could be inconsistent with, or even opposite to, those that are supposed to be learnt. (See Section 1.6.4, learning from the same standpoint vs. learning from the counter-standpoint) The other places emphasize on providing information. In this case, although people have already received some piece of information, and formed some corresponding psychological or mental reaction such as an opinion, a feeling, etc., they do not nurture some habitual behavior. As to which action will be taken largely depends on their own decisions. It is noteworthy that behavior nurtured for adapting to the actual social environment and those required by institutions like moral norms may not be consistent, or even conflict. This also makes behavior diversify.
Social learning of trust places emphasis on information acquisition and contingent reaction accordingly. It is prominently reflected by the pro-social attitudes of trust and its corresponding behavior premised on that no untrustworthiness is detected and by responding to trustworthiness of different degrees in thoughts and behavior adaptively. Social learning of trustworthiness put stresses on nurturing behavioral habits. It lies in in essence accepting and conforming to traditional values, morals, virtues, scruples and other principles that are approved of, accepted and acceptable in the society. Then, purely imitating behavior comes the second relative to those principles. Internalization of those values etc. means to admit them from the bottom of one’s heart, to

Chapter 1: Thinking Trust Systemically in Socio-Economic Environment
49
voluntarily be regulated and disciplined by them, and to conform to them. Of course, not all people behave under those socially desirable norms etc. Otherwise, no problem would happen in people’s interactions and the society would operate perfectly.
In actuality, people will frequently find themselves in various trusting-trusted relationships in which they sometimes act as a trustor, sometimes as a trustee and sometimes simultaneously as both (see 1.5.3), and in which they often need to decide how to behave. This fact guarantees that socially learning from both standpoints can successfully cause people’s attention, and further that people can learn from both standpoints. Most importantly, this kind of learning is a dual one in both thoughts and behavior. On one hand, people learn whether to be trustworthy or not and in which situations, although, generally speaking, being trustworthy is always morally desirable. Some people firmly conform to the norm of trustworthiness and are reluctant to do anything violating moral scruples. On contrast, out of some sort of reasons and values, some other people would like to and do behave in the opposite way. For instance, those who find from personal experiences or observations that selling fake products can make a quick money and cannot be externally punished may also do that. On the other hand, people also learn when to trust and when not to, especially in order to respond to known or detected (un)trustworthiness. For example, those who know that some merchant sells bad-quality goods will not trust or decreases their trust in that merchant.
Learning essentially is through different events; or put in a different way, learning is essentially events-driven. People do not experience exactly the same events (Denzau and North, 1994), which may result in different interpretation of events and further different reflections. However, individuals could classify similar events and store them in their mind (for more learning models in the economic literature, see, e.g., Brenner, 2006).
A complex loop of feedback between micro and macro is heavily relevant to the common impact of diverse types of individual and social learning of many heterogeneous individuals. The updating and persistence of an individual’s opinions and behaviors reflect the results of his / her accumulative individual and social learning practices and experiences. In social environment, an individual is both a subject and an object of learning. In the process of learning, individuals’ speed of learning varies when being a subject of learning. More specifically, individual willingness and capability of accepting a kind of thoughts/ideas/opinions/values and actions/behaviors are different; the degree of individual insights into what (s)he observes and experiences are different; individual imagination and association from the same event are also different. – These all have an important influence on what on earth information an individual really gets in the end.
Generally, the scope of one’s learning is much larger than his / her interaction network. As we have already known, interactions are usually local, such as geographically local and social-distance local. However, the range of learning exceeds largely that of interactions. It can be geographically distant, socially distant, or even time distant (see, Section 1.6.6). In the process of these distant learning, various media play a crucial role since they are indispensable tools to expand individual horizon.
Below some possible objects and channels of learning will be elaborated on, which may provide some specific research topics for others to study irrespectively or comparatively different influence of different learning objects and channels on trust.

Trust and Development: The Deep Structure of Institutions-Building and Socio-Economic Performance
50
No matter from which source people learn, the ultimate effect may all be reflected in his/her thoughts and behavior about his/her social life and their changes. What people learn is the wisdom of living in society from their angle which can give humans guidance and advice for their future interactions.
1.6.6 Examples of objects of (generalized) social learning: perspective of interpersonal relationships
As aforementioned, the functions of social learning lie in two aspects, one is information acquisition, the other is behavior nurturing. Different objects of learning may delivery different information to individuals and play different roles in constructing personality and different subtypes of trust in different life stages and different situations. Enumerating some objects of learning enlightens us about the forming and changing of individual trust.
(i) Parents
Early stages in life, such as childhood and teenage, are the crucial periods for a person to form personality, personal quality, values, etc. and to learn how to conduct. It can be said that experiences in early life have a great influence on the whole life. The reason why parents play so important a role in one’s early life is not separable from the fact that usually in his / her early life one stays with his / her socialized parents for the longest time and has the closest relationships with his / her parents. This is also the advantage of parents-children relationships from the perspective of social learning because they facilitate parents’ significant influences, both behavioral and linguistic, on their children through direct interactions, direct observation in the narrow sense, edification and instruction, information conveying. Thus, from the perspective of a child, his / her social learning from his / her parents more lie in direct learning (rather than indirect), learning thoughts and behavior, forward learning (rather than reverse), and learning from the same standpoint (rather than from the counter-standpoint). In addition, due to the natural generational relationship between parents and children, social learning from parents is of a nature of generational transmission. What children learn from their parents could also form pre-concepts about the society in children’s mind.
As to trust and trustworthiness, parents’ influences on children are prominently reflected in three aspects due to their close relationship: first, cultivating the quality of trustworthiness; second, delivering information about trustworthiness in society; three, transmitting attitude of trust. (As for the children’s reaction to the information about trustworthiness in society, it is another matter.) Let us have a look at trust. trust accompanies one’s whole life, and is probably initially nurtured in one’s early life. Uslaner (2000), considering trust “as a value sets in early in life” (p. 574), argues that “trust doesn’t come from our social interactions. We learn it early in life from our parents, who impart to us a sense of optimism and a belief that we are the masters of our own fate” (p. 571) and “trusting adults with nurturing parenting styles have trusting children. And trusting young people in turn become trusting adults” (p. 574). Although Uslaner (2000) does not treat parents as objects of social learning, Uslaner (2000) admits that children’s initial trust propensity is established in their interactions with their parents or other people who raise them. Thus, from Uslaner’s point of view, the thought of trust of intergeneration transition can be seen. Furthermore, evidences from empirical researches reveal that there is an intergenerational transfer of trust, which means if parents have a higher individual trust level, their children tend to a have relatively higher individual trust level; and

Chapter 1: Thinking Trust Systemically in Socio-Economic Environment
51
vice versa (e.g., Dohmen, Falk, Huffman and Sunde, 2012; Rotenberg, 1995).
(ii) Neighborhood
The impact of neighbors has been noticed for a long time. Take Mencius, a great thinker and educator in the Warring States Period in ancient China, as an example. According to the records of the Biographies of Exemplary Women (In Chinese: 列女传; Pinyin: Liè Nǚ Zhuàn): When Mencius was a child, he and his mother lived near a cemetery. Then little Mencius learned what people did during a funeral and imitated them when playing. His mother then thought that this place was not suitable for her son to live and moved to somewhere near a marketplace. But little Mencius then learned peddlers’ hawking and imitated them when playing. His mother thought that the marketplace was either not an ideal place for her son to live and moved to somewhere near a school. Little Mencius then learned courtesy etc. His mother thought this is the very place for her son to live and then settled down there. When little Mencius grew up more, he studied the Six Arts, and finally became a great master. (Zhang, 2017, pp. 40-45) Mencius’s mother changed three living places in order to find an ideal neighborhood environment for her son. The reason why Mencius could become a great thinker and educator is largely relevant to his mother’s nurturing way and the good neighborhood environment his mother ever searched for him in his childhood.
The Moving to Opportunity (MTO) is an experiment initiated by the US department of Housing and Urban from 1994 to 1998 to study the distinct various outcomes between individuals living in high-poverty neighborhood and lower-poverty one (Chetty, Hendren and Katz, 2016). Recently, Chetty, Hendren and Katz (2016) use MTO to study the impact of neighborhood on children’s long-term outcomes, such as college attendance, earnings and other outcomes, since these children have reached the age of being able to enter adult labor market. Chetty, Hendren and Katz (2016) find that the children less than 13 when they moved to lower-poverty “are more likely to attend college and have substantially higher incomes as adults” (p. 899), “live in better neighborhoods themselves as adults” (p. 899) and “are less likely to become single parents themselves” (p. 899); however this impact is not embodied in those children who were more than 13 when they moved to lower-poverty neighborhood from high-poverty neighborhood. What is more, moving to lover-poverty neighborhood even has slightly negative influence (Chetty, Hendren and Katz, 2016). This research of Chetty, Hendren and Katz (2016) manifest the children’s exposure effect and disruption effects. Childhood is one’s crucial period for growing up. That is one of the reasons that the environment of one’s childhood has so large an influence.
Neighborhood is a relatively stable local social environment. Usually, what people mean by neighborhood is in a geographical sense. Certainly, in academic research, people or objects with some direct relationship are often abstracted as neighbors. The prominent characteristic of neighborhood is the geographically short distance and / or the relative stability of neighbors. Furthermore, the meeting probability of people geographically near or in the same interaction circle in some other way is obviously higher relative to people geographically distant or in different interaction circles. This also makes possible the repeated interactions between people within some local interpersonal environment and repeated observations of neighbors, and further reinforces the social learning in neighborhood in repetition. Only in terms of information acquisition, neighbors are relatively stable, direct information sources. Usually, information, especially about trustworthiness, about neighbors can be acquired through direct personal interactions, direct

Trust and Development: The Deep Structure of Institutions-Building and Socio-Economic Performance
52
observations (in the narrow sense) and word by mouth. Moreover, information about neighbors is usually particular, which not only reflects one’s local environment, but also makes one know the personal quality of some particular neighbor, including trustworthiness, so that one knows how to deal with that neighbor and whether to approach or to keep far away from him / her. In terms of social learning, neighbors’ experiences provide relatively rich examples based upon which one can carry on both forward and reverse learning, and learning from both the same and the counter standpoint.
(iii) Strangers
In spite of the fact that the degree of strangeness or familiarity is continuous, suppose that people in the world are either familiars or strangers for someone. Then, let us classify strangers into two categories: one contains strangers who can become familiars in the end, while the other contains those who will not. Given a good relationship, strangers in the first category are potential resources of business opportunities, academic cooperation, emotional supports, and so on. The key point to get familiar with somebody is mutual understanding of some degree which is in essence a sufficient amount of information about that person. In terms of interactions, mutual understanding, from no understanding, is relevant to the frequency and time of interactions in general. Given the length of a period of time, mutual understanding increases with the frequency of interactions; likewise, given the frequency of interactions, mutual understanding increases with the length of an interaction period.
What is intended to stress is strangers in the second category. Relatively speaking, people interact with strangers less than familiars in daily life, except those in occupations characterized by interacting with many strangers. However, strangers often relate to important aspects of people’s life. What is more, due to the absolutely large number of strangers, people often find themselves surrounded by strangers. Social learning from strangers can be via personal interactions, direct observations (in the narrow sense), word by mouth, and through different media. Take media as an example. What people hear from media is usually about strangers, usually those they will never have got a chance to interact. The value of those pieces of information more lies in knowing the existing phenomena in society, and in which industry, field, context, group, region, etc. than the personal quality of the exposed person(s), so that people know how to deal with similar events happening to them. Thus, social learning among strangers is often embodied in learning from the counter-standpoint as an opponent.
1.6.7 Learning channels: in and beyond individual immediate interaction network
As aforementioned, learning network is much larger than that of immediate interaction network, and usually it can be said that immediate interaction network is a subset of learning network. Thus, we roughly divide the channels of learning into immediate interaction and other channels. As the development of human civilization, we have already not been limited within geographically local learning. Below some non-interaction channels of generalized social learning which is beyond one’s immediate interaction network and makes learning much faster and much more possible will also be presented.

Chapter 1: Thinking Trust Systemically in Socio-Economic Environment
53
(i) Immediate interaction network
Every individual is an “ego” in his / her / its interaction network. Within every individual’s immediate interaction network (immediate neighborhood), (s)he can both interact and observe his / her neighbors. In particular, when people face to face interact, the process of interaction can also be considered to overlap with the process of observation, for they can observe each other’s expressions, gestures and so forth which may deliver some extra information. For example, usually parents, relatives, friends and colleagues are all in one’s immediate interactive network.
There is also probability that two agents have “interacted” with each other for a long time without having meeting each other. An example is, two geographically distant people for some working reasons need to communicate often with each other. However, they only “interact”, or to say communicate, via e-mails, and the like. In this situation, these people are “dragged” into each other’s immediate neighborhood in spite of with a long geographical distance.
(ii) Temporary interactions
Temporary interaction horizontally exceeds immediate social network.1 Often individuals interact with somebody only once or a few times, or a period which is subjectively not very long from one’s own point of view. This can be called, for example, temporary interactions. In this kind of interactions, an individual may have some preconceptions about his / her temporary partner. The preconceptions may come from some kind of “label” of his / her interactive partner. For example, one classified his / her previous experiences. When (s)he encounters a temporary interaction, (s)he may relate his / her partner in front of him / her to those who (s)he thinks share some kind of common characteristic with his / her present partner. They may also come from immediate perception about his / her partner, say, perception from just before and during communication.
(iii) Observation
Observation (in the narrow sense) can be both in a direct way and in an indirect way, namely direct observation and indirect observation. Direct observation here indicates the situation, say that some event happens nearby and one can witness the whole or part of, or even only have a glance of, the process of what is happening, which may cause, such as, sympathy or other emotions. Indirect observation needs some other intermediary, such as mass media, mobile terminals, internet and so on. As the development of technology and realization of innovative ideas, more and more intermediaries emerge allowing indirect observation at anywhere and at any time. Bandura (1971, p. 10) proposes that “considering the large amount of time that people spend watching televised models, mass media may play an influential role in shaping behavior and social attitudes”.
(iv) Verbal delivered information
Verbal delivered information can both vertical and horizontal. For vertical verbal delivered information, we mainly mean the information about previous generations. Linguistic form that reflects the practices of human ancestors and are verbally transmitted from our previous generations, and always coincide with and guide the decisions we contemporary humans make. For horizontal
1 Same with Seltzer and Smirnov (2015), we do not treat this kind of temporary interaction with, such as, a stranger as the separated degree changing.

Trust and Development: The Deep Structure of Institutions-Building and Socio-Economic Performance
54
verbal delivered information, we mainly mean how information is diffused within social network. Along social network, one can be informed of events both locally happening and even not locally happening. It should be figured out here that the realization of vertical verbal delivered information cannot be separated from the participation of horizontal verbal delivered information. For example, proverbs are a linguistic form that reflects the practices of human ancestors and are transmitted from our previous generations both verbally and via written records, and always coincide with and is of guidance meaning for the decisions we contemporary humans make. This is a vivid example of how later generations learn from earlier generations. Of course, proverbs can also be transmitted by record.
(v) Written records
Written records are also an important channel which thoughts and facts can be delivered by. Its influence prominently reflects on, such as, historical materials which to a large extent is one resource of keeping what construct collective memory.
1.6.8 Distances and interpersonal relationships
As aforementioned, interactions (including the decision of not to interact) is the important channel to deliver information about personal trustworthiness and trust attitude. Furthermore, in general, shorter distance and / or same interaction platform improve the probability of the occurrence of interpersonal interactions and therefore facilitate them. Therein, three types of distances and four types of platforms are distinguished. Below illustrates them respectively.
(i) Distances
(a) Geographical distance, as its literal meaning, refers to the spatial, locational distance between two (groups of) persons, in terms of interpersonal relations. Geographical range can be roughly categorized as local and distant. Geographical nearness provides convenience for frequent physical meetings since physical meetings across long geographical distances need more time and money costs. Furthermore, given the meetings are pleasant ones, frequent (or at least not rare) meetings benefit the establishment and maintenance of a relation, especially for non-consanguinity, ceteris paribus.
(b) As to social distance, different scholars from different perspective to illustrate it (e.g., Park, 1924; Bogardus, 1925, 1947; Bourdier, 1989). Park (1924) defines social distance as “the grades and degrees of understanding and intimacy which characterize personal and social relations generally”, based on which Bogardus (1925) constructs a social distance scale. Bourdieu’s concept of social distance is not separable from his concept of social space, and is important for distinguishing different social classes. According to Bourdieu (1989), social space is an ensemble of “objective relations which are irreducible to […] interactions […]” (p. 16), and is a space of resources distribution. Therein, Bourdieu (1989) stresses four types of resources, namely economic capital, cultural capital, social capital and symbolic capital, and endows social space with two dimensions, that is, the overall volume of capital and the structure of capital. Thus, social distance is the distance between two positions in social space, and therefore is the distance of different social classes, and represents the different resources that different agents etc. possess. “This [social] space is

Chapter 1: Thinking Trust Systemically in Socio-Economic Environment
55
constructed in such a way that the closer the agents, groups or institution which are situated within this space, the more common properties they have; and the more distant, the fewer.” (Bourdieu, 1989, p. 16)
Here in this thesis, social distance means the objective nearness of the social classes, social stratifications, social positions, etc. of two (groups of) persons. So, social distance here is somehow a vertical structure. There could be further stratifications in the same indicator of social distance. A person is more likely to form or to join in a common social circle with those who have a shorter social distance from him / her, ceteris paribus. Usually, people have social activities within their own social circle, and therefore, they are more likely to have an acquaintance with those from their own social circle. In addition, two persons with a shorter social distance are more likely to have the same standpoints and the consequent interest, and to understand each other better than two persons with longer one, ceteris paribus. In reality, different occupations may also be implicitly endowed with different social positions. People engaged in the same occupation are more likely to have an acquaintance with, interact with and know each other. For instance, a scholar is more likely to know more fellow scholars through participating in academic conferences of his scientific research field. Figure 1.9 presents a possible relation of social distances and social classes, with a social class containing several social stratifications, assuming that less people are in higher social classes and social stratifications and that there are three social classes in total in the society and each social class has three social stratifications. In general, people have a shorter social distance with those who are in the same social class and social stratification with them. However, a person in a higher social stratification of a lower social class may also have a short social distance with another person in a lower social stratification of higher social class.

Trust and Development: The Deep Structure of Institutions-Building and Socio-Economic Performance
56
Figure 1.9 Social distance and social class. Notes: Size of the block of different social class represents the population size of each class. The smaller the number of a social class or stratification, the higher the position of the class or stratification in the society.
(c) By psychological distance I mean the subjectively perceived mutual intimacy in the sense of affection based on psychological process and / or the similarity / difference in the way of thinking, especially psychological or mental process involving value judgments, moral principles etc. In a word, psychological distance is premised on psychological activities at the psychological level. A relatively short psychological distance is usually conducive to the establishment and maintenance of a long-term relationship. Of course, not all on the psychological level is good for the maintenance of a relationship. For example, it is usually impossible for a selfish person only caring for his / her own interests, which can be regarded as a kind of values of living, to get well along with another selfish person.
It should be noted in passing that in literature, the boundary between and the range of geographical, social and psychological distance are often ambiguous. On one hand, sociologists may define social distance in a psychological way (e.g., Park, 1924; followed by Bugardus, 1925). On the other hand, in some works of social psychology, social distance is regarded as one of the dimensions of psychological distance. For example, Liberman, Trope and Stephan (2007) distinguish four dimensions of psychological distance, namely, temporal distance, spatial distance, social distance, and hypotheticality. However, this thesis obviously does not use the terms in that way; it insists on using “social distance” to represent social aspects and “psychological distance” psychological aspect because when some meaning is expressed into a term, it is better for the term to be more intuitive, admitting that the three kinds of distances relate to each other in some way. Specifically, geographical distance may relate to psychological distance: Those geographically living in the same region for a long time probably have integrated into local culture, customs etc. Social distance may relate to psychological distance: people in the same, such as, social class may make similar value judgments out of their standpoints. Geographical distance may relate to social distance: The rich
Soci
al d
istan
ce
Stratification 1
Stratification 2
Stratification 3 Stratification 1
Stratification 2
Stratification 3 Stratification 1
Stratification 3
Stratification 2
Class 2
Class 3
Social class
Class 1

Chapter 1: Thinking Trust Systemically in Socio-Economic Environment
57
class and the poor tend to live agglomeratively in different districts of a local area. However, relating in some way is not a reason why a concept should belong to another.
(ii) interaction platforms
The title of this thesis gives special stresses on “‘deep’ network structure”. This concept tightly relates the conception of “meso”-sized interaction platforms and arenas in several papers of Elsner and Elsner et al (e.g. Elsner, 2007; Elsner and Heinrich, 2009; Elsner, 2010; Elsner and Heinrich, 2011; Elsner and Schwardt, 2014; Elsner and Schwardt, 2015). In their papers, Elsner and Elsner et al accentuate the size dimension of the interaction platforms and arenas. Elsner (2007) argues that meso level, i.e. mid-sized groups, is a proper level on which institutional or structural emergence takes place. Elsner and Heinrich (2009) further dig into the co-evolution of an institution and the size of its carrier group by using a supergame of prisoners’ dilemma from a population perspective. However, argue Elsner and Schwardt (2015, p. 81), “it [the size of interaction arenas] is not about absolute size in terms of overall population but the ‘inner’ size structure of interaction arenas”.
The word “structure” usually refers to a kind of spatial or proportional arrangements. How different interaction platforms are arranged generates a structure. Despite the size dimension, it is the interdependent individuals’ micro interaction processes that are carrying on on these interaction platforms. That a particular individual interacts across different platforms means different interaction platforms may contain some (at least one) same individuals; these platforms therefore overlap. Inspired by Elsner and Schwardt (2014), Dai (2015, pp. 100-102) classifies interaction platforms into four types, namely political platforms, economic platforms, social platforms and international platforms. However, I would like to provide another way of considering interaction platforms and, at the same time, the overlapping of interaction platforms. Note that this is not even a roughly exhausted classification of interaction platforms; it just provides different angles of thinking and understanding overlapping interaction platforms. Most importantly, same interaction platforms not only facilitate interactions; the platforms per se are where interactions happen.
(a) Geographical-location-related platforms Geographical propinquity can form an interaction platform and increase the probability of interactions. As an individual moves to different geographical locations, (s)he encounters different interaction partners. Faster mobility enlarges the chance of encountering more strangers.
(b) Organization-based platform People in the same organization have more opportunities to interact with each other. Take colleagues in the same company as an example, especially those in the same department or having direct superior-subordinate relationships. Their offices are usually in the same place or near to each other, and they are often deal with the same project together. Furthermore, working in the same place could also favor the establishment of personal relationships.
(c) Social-roles-related platforms Multiplicity of a person’s social roles also provides possibilities of the overlap of interaction platforms. For example, a female can be both a mother and a teacher at the same time. As a mother, she interacts with her children and other people related to her responsibility as a mother; as a teacher, she interacts with her students, others teachers and other staff in her affiliation.
(d) Events-related platforms Interaction platforms can vary depending on different events that an

Trust and Development: The Deep Structure of Institutions-Building and Socio-Economic Performance
58
individual deals with. When an individual is involved in an event, he enters the platform and interacts with others also involved in the event; when the event finished, the platforms dismisses. Thus, different events offer different interaction platforms.
(e) Technology-based platform This kind of platforms is mainly for distinguishing from realistic social interaction networks. Supported by modern information technology, various on-line social platforms emerge, such as Facebook, Twitter, LinkedIn. In China, there are on-line social networks like Sina Weibo, and instant communication software like Tencent QQ and WeChat. These on-line social platforms overlap with realistic social networks and provide communication at any time anywhere. However, what is remarkable about on-line social platforms is that they supply more opportunities of communicating with and getting information about a lot more strangers.1
(f) Era platform People can only physically interact with those in the same era. Living in the same era therefore provides an interaction platform for people of that age. They are the creators of their “current social situation”, certainly including the overall trust and trustworthiness environment, of their era.
It should be noted in passing that not only one type of distance or interaction platform may relate to another type, but also a type of distance may relate to some type of platform. For example, short geographical distances could form a geographical-location-related platform, and a geographical-location-related platform and an organization-based platform could also overlap. However, although some relation may exist between them, they do stress different aspects and are viewed from different perspectives, which leads to that they are not completely the same. Take geographical-location-related platforms and organization-based platforms as an example. A geographical-location-related platform may be as large as a village, a town, or a city, while an organization may have branches in geographically distant cities.
1.6.9 Networking micro to macro and heterogeneity of networks
“Analysis of social networks is suggested as a tool for linking micro and macro levels of sociological theory.” Granovetter (1973, p. 1360) Broadly and roughly speaking, it is networks that connect micro- to macro-level, no matter what objects the micro-level individuals refer to and in which field they are, and make macro phenomenon more interesting. However, it does not mean that there are links directly connecting micro- and macro-level; it means that the interconnecting micro individuals form various realistic macro-level phenomena. – This is what I mean “networking micro to macro”.
Granovetter (1985, p. 491) argues that it is social network of relationship that produces trust in economic life and sustains order.2 However, Granovetter (1985) also admits that network of social relationships does not guarantee the emergence of trust and the sustenance of order for certain; distrust, opportunism and disorder do exist in social networks, since “networks of social relations
1 By the way, as the development of artificial intelligence, humans get more likely to interact with robots. For example, in March 2016, AlphaGo, an artificial intellectual chess computer program, played a match with Lee Sedol, a professional player in South Korean. It can be predicted that in future there would be more platforms based on technology. 2 Note that Granovetter (1985) considers that institutional arrangements, general morality and social network of relationship function in different situations of economic life.

Chapter 1: Thinking Trust Systemically in Socio-Economic Environment
59
penetrate irregularly and in differing degrees in different sectors of economic life” (p. 491). That is, social networks may “be a necessary condition for trust and trustworthy behavior” (Granovetter, 1985, p. 491), however, they are by no means a sufficient condition for trust and trustworthiness. In other words, trust is both established and destroyed in interactions.
Network is an expression of relationships. Network theory stems from graph theory in mathematics. As we know, nodes and edges / links are the two basic elements of networks after abstraction. But I suggest that three elements there should be, that is nodes, edges or links, and flows (on the edges or links) because flows affect the strength of links. Certainly, those only with nodes but without edges are also treated as a kind of networks, networks with special forms, which are named “edgeless / empty graph” in graph theory. Although it is not impossible for this kind of networks to exist in reality, they often lack realistic interests; their meaning, or their practical values, lie in their representation as a network status. For example, they can be used to represent the status in which all relations are lost in network dynamic, or no relationship has been set up yet. However, strictly speaking, in my view, networks without links should not be called “networks” since they lack the form or pattern of networks. In this sense, edges are relatively important and deterministic for networks, and any connected objects can be abstracted as networks.
All in all, realistic macro phenomena are usually inseparable from networks. Micro-level individuals within a scope are ones of various relationships. Only turning to the feedback between micro- and macro-level is not enough to explain the effects happening between them, even after adding more in-between layers, and the role of networks therein. Therefore, in order to better understand what happens between micro- and macro-level, four steps, or levels, are needed to explain how micro individuals generate macro phenomena under the effect of networks. The reason why networks are important is that they provide basis for interactions and conditions for changes of effect.
Step 1: Endowment / Networking process
Macro phenomena in human society are conditional on human activities, and human activities further depend on or constitute some network of relationships. Suppose that networks investigated are in human societies. Even when the preexist range of study is the same (namely, the same group of people), networks formed can also be different because the relationships represented by edges / links can be different, such as a network of friendships and kinships. Of course, it cannot be excluded the possibility that two different networks in which links are of different meaning might present the same visual pattern. This process combining edges / links with some particular meaning (some relationships investigated) with nodes (some set of individuals investigated) is “endowment process” or “networking process”. It endows links with different attributions onto nodes. This process would directly result in the next consequence – the formation of a network.
Step 2: Micro effects
Elementary effects on micro-level based on networks can be abstracted and simplified as those on arbitrary two nodes and the edge / link between them which determine whether an effect will generate, whether a generated effect is positive or negative / passive for some final macro phenomenon, and how strong is the generated effect. The generated micro effects can be concisely represented by some (in)equations which can be divided into three big categories: the first is 1+1<0,

Trust and Development: The Deep Structure of Institutions-Building and Socio-Economic Performance
60
which represents a negative effect for some final macro phenomenon; the second 1+1=0, which means no actual effect; and the third 1+1>0, which represents a positive effect. Further, in the third category, there are also three situations: the first is 1+1>2, which represents a reinforcement effect; the second is 1+1<2, a weakening effect; the third is 1+1=2, an aggregation effect.
Step 3: Synthesization process
A process is needed for numerous micro effects to form some macro phenomenon. – This is synthesization process. In this process, those micro effects generated in the last step synthesize in a series of ways such as offset (1+1=0), reinforcement (1+1>2), weakening (1+1<2), superposition (1+1=2), etc. Thus, this is also a process of changes of micro effects. Meanwhile, some structure or pattern will also present gradually in this process.
Step 4: macro-level presentation
At least three specific forms of macro phenomena could catch people’s attention: the first is some macro index embodied as a specific number; the second is the distribution of something among some macro scope; the third is some pattern like flow networks.
Heterogeneity is pervasive. As mentioned, heterogeneity is a prominent characteristic of the complexity of the real world, just as what we observe and what our common knowledge describes. The reason why macro network phenomena are rich and constantly changing in reality lies in the driving of heterogeneity. In terms of the network domain, heterogeneity has already been able to from different perspectives be described in different ways.
(a) Heterogeneity of nodes
In terms of human individuals, they are different in cultural backgrounds, values, beliefs, attitudes, preference, education backgrounds, income, and so on. Also, their personal trust levels are not the same. Additionally, human individuals typically have different experiences which shape their mental modes (Denzau and North, 1994). Moreover, the rules and institutions which guide the behaviors are also different. In terms of economic entities, taking firms as an example, firms have distinct routines, governance structures, asset-liability levels, profitability, and so forth.
(b) Heterogeneity of links
Heterogeneity of links embodies in: 1) the nature of objective relations, such as kinships, superior-subordinate relationships, colleague relationships, cooperative relationships and so on; 2) emotional strength of relationships in which the linked human individuals have short psychological distance; 3) frequency of interactions and 4) topics delivered along the links.
(c) Heterogeneity of flows
The heterogeneity of flows includes three aspects: First, the contents of flows. As long as networks exist, various “flows” flow along the networks. “Flows” could be products (i.e. product networks), information, advices, diseases and so on. The nature, the quantity, the quality and the speed about the flows are diversified. Second, volume. The volume of flows is also an important embodiment of the strength of links. Third, direction. Given that each node of an investigated network has a

Chapter 1: Thinking Trust Systemically in Socio-Economic Environment
61
unique, recognizable identity, the role of the direction of flows become more significant because it reveals where the target resources flow, which node gathers how many resources, who is a resource-richer and who is not, etc. Moreover, the direction of flows will finally become a characteristic of nodes.
(d) Diversity of game types / structures
Note that because what is described is interpersonal network, there are interpersonal interactions, such as abstracted as games. Individuals are involved in different interaction or game types, rather than be engaged in a single type. Additionally, different interaction types may have different meanings and importance for the parties involved. If the payoffs acquired from a certain game type can be divided into material payoff and non-material payoff (such as spiritual payoff or emotional values et cetera), then non-material payoff may also play an important role which enters the perception of parties involved.
(e) Heterogeneity of platforms
Different platforms are constituted of individuals of different roles, are engaged in different events, and are supported by different mechanisms. The explanation of interaction platforms has been presented before (see section 1.6.8).
(f) Heterogeneity of network structures
Network structures are for time points. In other words, a network structure is the (observed) structure of some particular time point. Not all network structures change over time. Given a time period, it is possible that some network structures change with time, while some do not. Also, different network structures can lead to different evolutionary processes, if they do change over time, and macro performance, ceteris paribus. In reality, there could be a great variety of network structures. When comparing different network structures, some statistical indicators, such as diameter, degree distribution, cluster coefficient and so on, can be applied to investigate the properties (for detail introduction about various indicators of network structures, see e.g. Costa, Rodrigues, Travieso and Villas Boas, 2007; Jackson, 2008). Also, there are some special cases of types of network structures, such as, small-world networks (Watts and Strogatz, 1998) and scale-free networks (Barabási and Albert, 1999). In reality, measuring network structures often encounter great difficulties because of the huge number of abstracted nodes in human society, which leads to a big challenge for the memory space and computing capability, and computing time. This is also a big obstacle for empirical research of networks.
The main motivation of stressing the heterogeneity results from the huge power of combination. Various combination of heterogeneity generates diversity. It must be admitted that the above categories do not exhaust. However, they provide some meaningful perspectives and theoretical background before further comparison is presented in Chapter 4.
1.7 Spatial mobility and trust, and social mobility
1.7.1 Geographical mobility

Trust and Development: The Deep Structure of Institutions-Building and Socio-Economic Performance
62
This thesis treats spatial mobility and geographic mobility as interchangeable. Usually, geographical mobility implies exceeding a certain local area; it is mobility across different local areas. As to how large the local area is, there is no specific standard, and different research could have different treatments; it depends on what is under investigation. However, it is almost certain that at least one’s familiar neighborhood is local. Therefore, spatial mobility in this thesis refers to leaving one’s local, and often familiar, circumstance to another place for a period of time. There are three perspectives to view geographical mobility: First, from the perspective of a single geographically mobile person, individual geographical mobility refers to his / her change of geographical location. Second, from the perspective of a local area, geographical mobility refers to the process of people’s flowing into and out of the area. Third, from the perspective of a larger area which covers different local areas, geographical mobility may show an interest in the overall pattern of people’s mobility among different places.
Basically, geographical mobility has two dimensions, that is, distance and time. Suppose there are only two situations for the distance dimension, long-distance mobility and short-distance mobility, and only two situations for the time dimension, long-time mobility and short-time mobility. Then, there generates four combinations, that is, long-distance and long-time geographical mobility, long-distance and short-time geographical mobility, short-distance and long-time geographical mobility, and short-distance and short-time geographical mobility. In general, the longer one geographically moves, the more likely he will encounter different culture, social norms, values, etc., ceteris paribus; the longer time one geographically mobiles, the more necessary it may become for him / her to adapt to the new local life, ceteris paribus.
Geographic mobility can be international mobility, internal mobility, inter-province mobility, intra-province mobility, mobility from rural areas to urban areas, and so on and so forth. Therein, given some certain distance of geographical mobility, geographic mobility is more likely to be embodied as international mobility for people in territorially small countries than those in territorially large countries, in spite of possible institutional barriers (such as passports etc.) for entering other countries and a country’s geographical location on the earth; on contrast, for people in territorially large countries, internal mobility of the native born is more likely to be the form of geographic mobility. – This is determined by the natural relation between territorial area and possible domestic geographic distances.
Geographic mobility can be out of different reasons or purposes, and can be of different lengths of time. For example, people may geographically move, long-distantly or short-distantly, for education, work, a travel, or even escaping a war. In terms of mobility of labor force, especially for traditional agricultural nations or regions, reduction of dependence on land, seasonality of agricultural production activities and increment of demand on labor force in other sectors all create conditions for labor force to mobile from rural areas to urban areas.
For an individual person who geographically moves to another place, geographical mobility means a change of local interaction networks. Furthermore, relatively short-time mobility generates different individual interaction networks from relatively long-time mobility. Figure 1.10 presents the general difference between the individual ego-centric interaction network before and after a short-time and long-time geographical mobility. Usually, in a short-time geographical mobility, it is less likely for one to establish a firm relationship with others via occasional interactions, while in a

Chapter 1: Thinking Trust Systemically in Socio-Economic Environment
63
long-time mobility, it is much more likely due to more frequent interactions.
Figure 1.10 Individual geographical mobility: short-time vs. long-time. Notes: Squares in period of the same length represent geographically different local areas. Arrows with a dashed line represent mobility. The two solid circles linked by an arrow across two different local areas is the “self” geographically moving from one area to another. Other solid circles linked with a solid line to the “self” represent relatively stable relationships established via frequent interactions, while the hollow circles linked with a dashed line to the “self” represent temporary relationships established via occasional interactions.
When viewed from the perspective of a particular local area, geographical mobility relates to the size of inflow and outflow population and the (average) length of time of their stay in that place. Generally, the larger the flowing population of a place and the shorter the average time of their stay there, the higher its mobility. When studying the impact of population mobility on some social indicator of the inflow area, which state the inflow place will present is related to the total population of the inflow place, the speed of population mobility, the proportion of the inflow population in the total population, the structure of the inflow population, and so on. Furthermore, when it comes to the possible influences of geographical mobility on people of the local area, two perspectives should be distinguished, that is, the perspective from the local people of the inflow place and that from the inflow people. Thus, how geographic mobility may affect trust can also be viewed from those two perspectives. Local people and inflow people may have different, or even opposite, views and attitudes about the same thing.
1.7.2 Geographical mobility and trust
Some scholars argue that a high rate of population mobility (including immigration and internal migration / urbanization) could cause trust to disrupt (e.g., Zucker, 1986). In much the same vine,
After: Before:
Long
-tim
e:
S
hort-
time:

Trust and Development: The Deep Structure of Institutions-Building and Socio-Economic Performance
64
some scholars also realize that trust in big cities is lower than that in smaller cities or small towns (e.g., Putnam, 2000, pp. 138-139; Glaeser et al, 2000). In general, whether geographic mobility will result in distrust and to what degree could be affected by many factors, such as mobility rate of a place, identity as a local person or an inflow person, percentage, diversity and characteristics of non-local (inflow) people, tolerant / embracing attitude to diversity (traditionally or not) and inclusiveness, perceived changes from a relatively low mobility rate to a relatively high one, internationalization degree of a country (if the place under investigation is a country), personal experience, sufficiency and availability of various resources and public services, public security, strength of fighting to crimes, police force, and so on and so forth. Below summarize three deep reasons for geographical mobility’s leading to distrust.
According to the nature of trust problems, there could be three kinds of trust decline that geographic mobility may cause. One is distrust from different background mindsets, values, cultures, approved behavior etc., given that people conform to their own social norms etc., the relief of which requires resocialization in the new local life or construction of a modified / new local culture in order to have a harmonious common life, otherwise segregation may happen. According to the online Oxford English Dictionary, socialization (2009) is “the process of forming associations with others; spec. the process by which a person learns to function within a particular society or group by internalizing its values and norms”. Therein, values (2011), also according to the online Oxford English Dictionary, are “the principles or moral standards held by a person or social group; the generally accepted or personally held judgment of what is valuable and important in life”. (Re)Socialization requires some amount of time and effort; put another way, it requires learning costs, admitting that individual learning willingness and speed are different. When a person goes to a distant, culturally different place, given there are enough interactions with the local people and (s)he has enough willingness to learn how the local people behave, his / her behavior will more or less be influenced by the local people. Resocialization is thus a process from consciously behaving following the local people to habitually behaving, and further to taking it for granted. Of course, it is also possible that similar people tend to live in relatively small concentrated communities. As said, in general, a long geographic distance often relates to a large cultural distance. Heterogeneity, differences or dissimilarities in local cultural environments, cultural backgrounds, mindsets, values or standards of justification of behavior could cause dissatisfaction, debates, conflicts, etc. accompanying distrust. Zucker (1986) argues that it is because population mobility violates background expectation on which “a world known in common” and creating common expectations is based. Furthermore, according to the length of time staying in inflow place, the necessity of adapting to the new local life is different. For example, usually, mobility for work is relatively long-time while mobility for travel is short-time. Specifically, living for a relatively long time in the inflow place requires more integration in the local culture, approved behavior, etc., otherwise inflow population may feel like a fish out of water. On contrast, temporary stay in the inflow place much more likely requires adjustments neither in one’s mindset nor that in his / her behavior.
However, relative to internal population mobility, the first situation is more likely to happen in international mobility since people of a country, except one with a quite short history, has integrated for a long time, which means that common culture, values, etc. have been established and internalized. Normally, internal mobility relatively to a much less degree involves conflicts of background culture, values, etc.; people’s standpoints may play a relatively prominent role (the

Chapter 1: Thinking Trust Systemically in Socio-Economic Environment
65
second situation). Different standpoints could lead to different opinions. Imagine the different distributions of public resources between local people and inflow people.
The third one is from widely disapproved behavior that the bad intentionally do in places of a large population and high mobility in order to get fraudulent gains since that two factors (namely, large population and high population mobility) seem to create natural conditions for deliberately dishonest behavior and usually to be exploited by the bad. Additionally, another noticeable and considerable point is that big cities or urban areas are also attractive to “bad” people from different places who are intentionally to harm, deceive or defraud others. Although not every stranger could do harm to others, the bad are more likely from strangers. – This is the basic attitude of supporting the idea that do not trust strangers. People tend to avoid potential harm rather than achieving a potential benefit of the same amount. Moreover, in many situations, the possibility of being harmed and that of attaining a potential benefit are different.
1.7.3 A short discussion on geographic mobility and social mobility, and social capital
From an individual perspective, social mobility refers to one’s mobility to a social class or stratification different from his / her current one within a society, and usually involves the change of his / her, and even his / her family’s, social position and financial status. Individual geographic mobility and social mobility are not irrelevant to each other. Increase of social mobility may require geographic mobility in reality. In other words, people may chase an increase in social mobility by virtue of geographic mobility. For instance, geographic mobility from a rural area to an urban area for education or a job is often for achieving a better socio-economic status. In this sense, spatial mobility is an adopted means for social mobility.
The number and strength of relationships are two important aspects of individual social capital.1 Individual geographic mobility could either increase or decrease individual social capital. On one hand, long-time and -distant individual geographic mobility may force previous individual social relationships to fade out, and even to break down. – This is the more common case. On the other hand, on the premise that (s)he takes some measures to maintain various relationships in different places, individual geographic mobility could increase his / her number of social relationships for it connects trans-regional social networks, and therefore increases the possibility of obtaining potential resources from different local ego-centric social networks.
1.8 Institutions
Institutions are for guiding behavior, i.e. behavior-oriented, and behavior conveys information. Whether others conform to institutions is an extremely important factor influencing a person’s judgment on others’ trustworthiness, forming a trusting attitude and implementing trusting behavior. Veblen ([1899] 2005, pp. 143-144) deems that “the institutions are, in substance, prevalent habits of thought with respect to particular relations and particular functions of the individual and of the
1 As to social capital, Chapter 2 will present a far more comprehensive and deeper discussion. So, this chapter will temporarily not go much into it.
Trust and Development: The Deep Structure of Institutions-Building and Socio-Economic Performance
66
community”.1 Bush (1987, p. 1076) thinks that “an ‘institution’ may be defined as a set of socially prescribed patterns of correlated behavior”. Denzau and North (1994) consider institutions as shared mental models. Once some generally approved institution forms, it is like an interpersonal tacit agreement most of the time which is unnecessary to figure out specially before every social interaction. North (1990) distinguished two kinds of institutions, namely formal institutions and informal institutions. Dai (2015, p. 117) categorizes institutions as three levels: fundamental institutions (level 1), constitutional institutions (level 2) and operational institutions (level 3).
1.8.1 Categorization I of institutions: problem-solving, problem-avoiding, influence-controlling and blame-apportioning
When facing interaction problems, or potential interaction problems, people often turn to institutions. Institutions therefore have a “problem” basis. The first approach of categorizing institutions in this chapter is from the perspective of the functions, or the purposes, of institutions, and is problem-oriented essentially. At the same time, they are also the incentives for people to form or create institutions. In short, institutions can be classified as problem-solving institutions, problem-avoiding institutions, influence- / problem-controlling institutions and blame-apportioning institutions. This way of classification is of practical importance because it makes people think about which kind of institutions has been breached and in which aspect trust can be improved.
Problem-solving institutions are for resolving problems after problems happen. Therefore, they are a kind of ex post methods. A problem-solving institution could be temporarily effective, permanently effective, or problem-weakening. However, in many situations, peoples do not want to solve problems after they have already happened; On the contrary, people would like to first take some actions to avoid the occurrence of problems. Institutions for avoiding problems ex ante are problem-avoiding institutions. The key point of problem-avoiding is correctly recognizing what behavior causes problems and what does not. According to the different nature of problems, some problems might be more appropriate to be resolved after happening, while some other are more suited to be prevented in advance. Two important criteria of whether to solve them ex post or to avoid them ex ante are the relative feasibility and the relative costs and prices of the two.
One plausible reason explaining why people are problem-avoiding is human imaginative capability (imagination), associative capability and inferential capability, which are different from predictive capability. These capabilities play an important role in human decision-making and future actions, since people can image and infer how some event is going to unfold and evolve, how some other persons will behave, what problem will arise if (s)he does something in what way, what results will be caused to him, and so on. Also, one may imagine how to prevent some problem from happening even though the happening of something undesired is uncertain or bound to happen. That is to say, human beings tend to construct a future situation in their mind, and will try to avoid problems arising in their imaginatively and mentally constructed scenes.
Influence- / Problem-controlling institutions are for dealing with the influences caused by problems happened. Ex post influences of problems that they are trying to control may include the scope,
1 Although in The Theory of the Leisure Class: An Economic Study of Institutions, Veblen ([1899] 2005) from a negative perspective elaborates on institutions, the quintessence of thoughts of his theory is also applicable to the positive aspect of institutional explanation.

Chapter 1: Thinking Trust Systemically in Socio-Economic Environment
67
degree, time of duration, etc. of influences. The aim of institutions of this kind is to reduce the damage caused before a problem-solving scheme has been devised, before a problem is eventually solved, or when a problem actually cannot be solved at all. It should be noted that whether an expected controlling effect can be achieved or not and to which degree are not guaranteed, although the original intention of those institutions is controlling the influences derived from various problems.
As problem-solving ones, blame-apportioning institutions are also for dealing with problems already happened. This kind of institutions is often relatively concrete. It may cover whether to apportion blame and how to. For example, in which link has a problem been generated, and which of the bad consequences is the worst? Problem-apportioning institutions actually emphasize the aspect of punishment of institutions. However, it should be kept in mind that the actual underlying criterion should still be those desirable, abstract values such as justice, fairness, and so on. For an institution to be a blame-apportioning one, some basic elements may be required: a) the discoverer or whistleblower of a problem; b) directly responsible individual(s); c) investigators; d) responsibility judges; e) (a) punishment-implementing party / parties.
1.8.2 Manifestation of potential problems
As explained before and as what we have admitted and would admit, the emergence of institutions is largely rooted in problem-solving and problem-avoiding. Therefore, an explanation of the manifestation (or exposure) of problems is expected to be of some illuminating meaning.
In many situations, a series of actions can get something recurrent done without explicitly telling the actors right from wrong. The actors involved in doing that thing seem to have unuttered or even unutterable knowledge (“tacit knowledge”) which can guide them to do that thing well and even perfectly well. It seems that the actors currently involved and involved before reach some tacit consensus so that hitherto nothing impeding from reaching satisfactory results happen. Analogous to incomplete contract, it may not always be realized that establishing some kind of relatively explicit and formal “institutions” is necessary until some problems do happen and probably would still happen in future. However, it is not always the same persons that do something and, at the same time, the unrealized potential problems do exist, but it does not mean some problems will not happen forever. One trigger lies in when something involves a marginally added, new person. (s)he may neglect the explicit “consensus” within the previous group and arouses some previously potential problem without preventive measures and causes some unsatisfactory result. The results are unsatisfactory may be because it causes relatively big ex post cost; it may be because it disturbs the normal procedures that get something done and may have a relatively big accumulative risk of a series of small problems; or it may simply be because that the actors involved think the problems have a bad influence on the reflection of their prudent work style, and so on. All in all, the manifestation (or exposure) of problems arouses the demand of some explicit institutions to be established. The explicit institutions may be built via verbal consensus and admission, and be verbally transmitted to the (generalized) marginally added persons (The “marginally added” here does not definitely refer to “added one by one”; thus it means to some degree a generalized “marginal added”.); may via some relatively formal but not absolutely formal channels of being written down, such as written in paper and then passed it to others. It can be said that to some degree

Trust and Development: The Deep Structure of Institutions-Building and Socio-Economic Performance
68
institutions are particular-subject-independent in particular situations, in the sense that it cannot only apply to currently involved persons, but also later coming ones. Hence, the manifestation (or exposure) of some previously potential and unrealized problems is an important link in the generation and emergence of institutions. Without the link, a particular institution may never be perceived as necessary to be established. And further, as the continuous manifestations of new problems, the network of institutions is woven more densely.
However, the continuous manifestations of new problems or continuously happening old problems do not definitely stimulate willingness or perception of necessity to establish some institution. It may also depend on the attitude towards them, the insights caused by them, the nature of the problems, and so forth.
1.8.3 Deepness of institutions
Here three levels of problem-solving and -avoiding are presented. They may be different in timeliness, effect and mechanism. However, it should be figured out that these differences may not be absolute. Different levels of problems-solving and -avoiding may fit different problems at different time in different situations. Which level to choose requires specific, comprehensive consideration. At the same time, enough attention should be paid to the para-function of these methods.
Shallow pre-problems This method “solves” or “avoids” a problem without really touching the problem per se. Hence, this method does not thoroughly settle or avoid (or prevent) the problem, and the problem may just be temporarily inhibited but will recur in future. One advantage of this method is that it probably gets effective in a quite short period and in a direct way. We may in many situations need or actually apply this kind of problem-solving or -avoiding method, such as when the consequents of some problem is not serious, or when we do not have enough time to spent on the problem, when it is not suitable to touch the problem, or when we do not in fact realize the method is relatively too superficial to solve or avoid the problem downright, et cetera.
Just at problems This method “solves” or “avoids” (or “prevents”) directly on the problem itself, which means the problem is touched. This is a usual way we deal with some problem. The time needed for this method to get effective may depend on the nature of the problem. This method, actually, can be said to be “local” since it usually focuses on the problem and does not much care other related things. Therefore, the problems settled via this way may still recur since it is a local method of problem-solving or problem-avoiding (or problem-preventing).
Under problems This method has profound insights into the nature of the problems and their deep causes. Thus, this method pierces the problems. Undoubtedly, this method probably consumes longer time to get effective than the two methods above. However, at the same time, the effects of this method would be more thorough and persist longer. The mechanism of the method is to coordinate factors underpinning the problems.
1.8.4 Categorization II of institutions: value-type institutions and constructed institutions

Chapter 1: Thinking Trust Systemically in Socio-Economic Environment
69
(i) Values-type institutions
Values-type institutions are institutions that are per se values as well. Take fairness, justice, trustworthiness and the like as an example. They are all desirable values, but they are also treated and have been functioning as norms. They are cherished social wisdom and firm collective psychological preference formed in the interpersonal interactions in social life in the long human history, and are also passed from generation to generation. One characteristic of institutions is that they propose requirements, especially behavioral ones, on others. Once institutions are violated, people’s feelings are hurt more or less. Moreover, values-type institutions are ubiquitous in social life and therefore involve behavioral requirements for every other, which shows the large scope of its influences, even though actually we cannot compel others to conform to those interaction principles, and at any time, we do internally hope or require others to. Besides, values-type institutions do not have definite and fixed punishment mechanisms. At the same time, they are also of fundamental guiding importance for constructed institutions which will be introduced latter. This kind of institutions is not the same with what North (1994) calls “informal institutions”. In addition, not all unwritten norms are informal institutions, because they can still be concrete.
Institutions are all established on values, but not all values can become or be treated as institutions. Values can be roughly categorized as individual / personal values and collective / social values. However, not all of the later type of values can directly function as institutions. Institutions require a certain proportion of supporters. But it does not mean some value having many supporters can become values-type institutions. Many people may hold the same individual / personal values, such as health is more important than earning money. However, that kind of values only requires self. One requiring any other not to sacrifice health to earn money is usually not reasonable. Whether a random other earns money on sacrifice of health is not relevant to him / her. It does not have an impact on his / her interactions. Put another way, it has no externality. Of course, that one requires his / her family members not to do like this is another case. Values-type institutions more or less require requirements on others. Take trustworthiness as an example. Even though we actually cannot force others to be trustworthy, and at any time, we do hope or require others to be inside. When we encounter untrustworthy behavior, we may get angry, upset, disappointed, etc.
(ii) Constructed institutions
Institutions hinge on psychological requirements on behavior. Values are formed psychologically and mentally and are a kind of psychological preference. However, not all values supporting institutions are values-type institutions. There are other psychological activities and processes, such as reverence towards nature, praying for the good things to happen etc., which (may be values or not) cannot directly be treated as institutions, but act as underpinning principles for institutions as well. Institutions consciously created based on various thoughts which cannot be directly treated as institutions are constructed institutions. Constructed institutions reflect those abstract principles in mentality, but are presented in concrete forms. They are constructed for concrete situations, functions, etc. and usually have a specific application scope.
1.8.5 On the origin of institutions
As we know, institutions in human society rely on humans as their carries. Their generation,

Trust and Development: The Deep Structure of Institutions-Building and Socio-Economic Performance
70
diffusion and prevalence all are inseparable from human acceptation, at least non-repulsion, and implementation in thought and behavior. Thus, the population base of an institution is not the sole criterion for its existence and degree of prevalence. Of course, a threshold in a population, which is the minimum number in a population, may be required for an institution to exist (e.g. Elsner and Heinrich, 2009; Elsner and Heinrich, 2011). However, it should be noted that, different (types of) institutions may require different population thresholds.
(i) Behavioral requirements on others
Who use behavioral principles, to regulate whom? The answer contributes to the understanding of the nature and origin of institutions to some degree. According to the difference of implementing subjects, self-discipline and other-discipline should be distinguished. Obviously, self-discipline means one uses behavioral principles to guide his / own behavior, while other-discipline means others, rather than himself / herself, use behavioral principles to regulate his / her behavior. Furthermore, according to the objects that behavioral principles point to, disciplining self and disciplining others should be distinguished. Disciplining self, as literally shown, means that behavioral principles are used only to guide and control the behavior of one’s own, while disciplining others means that they are used to regulate others. Concerning disciplining self and disciplining others, different people may present different tendency, as well as different cultural groups. Some people more like to restrain their own behavior first, while some other people always require more on others’ behavior.
Behavior of humans in society usually has externality, which means that normally, people’s behavior influences others (see also Section 1.6.1). In my view, the most essential cause of the origin of institutions could be attributed to behavioral requirements on others, although people often cannot force others to behave following institutions ex ante actually. Put another way, disciplining others actually essentially drives the generation of various institutions. However, it should be noted in passing that behavioral requirements on others is of course not the repertoire of institutions; but it is their core, indispensable part.
About how to treat others, Confucius advocates putting oneself in others’ shoes by stating that “己
所不欲,勿施于人” (Pinyin: jǐ suǒ bú yù, wù shī yú rén) which in English means that “What you do not wish others to do unto you, do not do unto them”1 (translated by Ku, 1898, p. 138). Put another way, it means that if you do not want to be treated in some way, do not treat in that way others. It should be noted that “others” here means general others.
(ii) Changeability of the relatively advantageous role in various interactions
The reason why institutions can form spontaneously in equal interactions and be accepted broadly in society is the changeability, or the non-fixity, of the relatively advantageous role in various interaction situations in daily life. More importantly, this changeability or non-fixity is certain and inevitable. One cannot always be in the relatively advantageous position in equal interaction relationships and has opportunities to exploit opponents. This situation thus leads to one’s
1 子贡问曰:“有一言而可以终身行之者乎?”子曰:“其恕乎!己所不欲,勿施于人。”——《论语·卫灵公》 Translated into English is: A disciple of Confucius enquired: “Is there one word which may guide one in practice throughout the whole life?” Confucius answered, “The word ‘charity’ is perhaps the word. What you do not wish others to do unto you, do not do unto them.” (Translated by Ku, 1898, p. 138)

Chapter 1: Thinking Trust Systemically in Socio-Economic Environment
71
behavioral requirements on opponents, especially when (s)he is in the relatively disadvantageous position in interactions, that they ought not to seek inappropriate profits relying on their relatively advantageous position. This requires a just treatment for the same person in different positions of relative advantage and relative disadvantage to prevent oneself from being exploited. What is more, opponents in interactions are also not fixed. In the broadest situation, anyone in society can even become a potential opponent in future. This further requires behavioral requirements even on all the people in society. However, given equal interpersonal relationships and the changeability of relatively advantageous role in interactions, the “double-standard” behavior only requiring others excluding oneself is unfair and impossible for others to accept. Hence, one also has to contribute to the desirable social environment, such as by conforming to some widely accepted institution and giving up opportunities to exploit others. In the end, a principle supported by a sufficient number of people may generate as an institution. Besides, this is also one reason why people would like to follow institutions.
1.8.6 On the diffusion of institutions
(i) Without population mobility
Given a population large enough relative to an institution’s biggest possible influence, when there is no long-distant mobility, communication or correspondence, continuity of geographical distribution of population, meaning that people geographically concentrate, rather than living too spread around by small groups or being separated by large natural barriers like mountains or oceans, which precludes people’s daily local interactions, is a very advantageous condition for an institution to diffuse and prevail and plays a crucial role in the course, ceteris paribus. Local interactions (including verbal communication, instructions, modeling, etc.) and continuity of geographical distribution of population guarantee a gradual diffusion of an institution from a person to another in continuous local areas of short distance.
Suppose there is a population among which an institution generates and can influence throughout. Figure 1.11 presents how an institution gets diffused in an area with continuous and discontinuous geographical distribution of population respectively. In Figure 1.11 a, people in circle 1 can interact with those in circle 2, and those in circle 2 can interact with those in circle 3, and so on. By this logic, the institution gradually diffuses to larger scopes of population through everybody’s local interactions. Without being obstructed by any natural barrier, it can diffuse until its influence fades out in the most ideal case. On contrast, in Figure 1.11 b, the population is separated into two sub-populations by a large mountain which precludes the institution to reach and to be accepted by more people, although it still has enough influence. Additionally, different institutions are likely to generate on the two sides of the natural barrier.

Trust and Development: The Deep Structure of Institutions-Building and Socio-Economic Performance
72
Institution
1 2 3 4 5 6
a. Continuous geographical distribution of population
Mountain
1 2 3 4 2 1
b. Discontinuous geographical distribution of population Figure 1.11 (Dis)Continuous geographical distribution of population in an institution’s diffusion.
(ii) With population mobility
An institution can also get diffused through population mobility. For an institution to diffuse in the inflow place, there are two possible ways. One is naturally gradual diffusion. In this way, it is necessary for the inflow population to reach some certain scale (e.g., size and share) to have an impact. The other is active promotion. It is crucial especially when there is not a sufficiently large scale of inflow population since people after all have initiative and can act consciously and purposefully. What is more, for both approaches, the inflow institutional carriers should stay in the inflow place for an enough long time so that the institution can take effect there.
The strength of an institution’s influence can be different within the scope of the institution’s influence, and there could be different variants of the institution. Just like although Chinese eat tofu pudding (a Chinese food), the Northern Chinese prefer a salty flavor, while the Southern Chinese prefer a sweet one. A key point to understand the possible consequences of population mobility on some institution within the area of the institution’s influence is the strength difference of the institution between the outflow and inflow local areas. Given that there are strength differences of some institution in some dimension and that population mobility happens between two places where institutional strength differences exist in a relatively obvious way, there could be two possible kinds of consequences: First, the institutional difference between the mobile population and the local people of the inflow place get narrow, by one group’s institutional characteristics approaching the other. Second, both the mobile population and the local people of the inflow place keep their own institutional characteristics, without being affected by each other.
Population mobility does not definitely bring horizontal diffusion, which is different from passing from generation to generation, of some institution the population are carrying into their inflow area where other people reside. Suppose the institution(s) that the inflow population is going to bring are different from those of the people living in the inflow place, and that the institutions of the two
Institution A Institution B

Chapter 1: Thinking Trust Systemically in Socio-Economic Environment
73
parties are holding are not totally incompatible as fire and water. Then, in general, there are three big categories including four specific situations. First, co-existence. In this situation, each group (namely the inflow population and the local people of the inflow area) keeps their own institutional characteristics without being influenced by each other. Second, unilateral influence. This category contains two situations. One is that some inflow institution gets diffused in the inflow place, the other is that the inflow population gradually abandons some institutional characteristic. Third, mutual influence and integration. In this situation, both groups learn from each other and integrate what the learn into their own previous institution system, driving the new institution system of the inflow area to evolve. In general, the first situation in the second category and the third category are relatively conducive to institutional horizontal diffusion and evolution.
An institution’s prevalence could at least present three kinds of patterns in terms of its spatial structure from generation to diffusion. First, single-point radiation. It refers to the pattern that an institution generates merely in one area, but gradually expands from the center to its close surrounding areas. Although the institution comes into existence only in one place, as long as its influence and radiation effect are large enough, it can still expand to as more people as possible based on local interactions in population of continuous geographical distribution even without long-distant population mobility.
Second, multi-points outburst. It refers to the pattern that an institution generates in different places independently. This is also a way for an institution to prevail, even with no continuous distribution of population, no great influence, or no population mobility. The reason why the same or similar institutions can generate in different places separately may be that those places all face the same or similar problems, which reflects the fact that those problems are easily-happening ones and hence quite common in human society.
Third, diffusion in virtue of population mobility. This pattern depends on those people who move from a place with some institution to another without it carrying characteristics of that institution. An institution can also prevail via population mobility even with discontinuous geographical distribution of the population in the headstream of the institution or not very strong influence. Given that an institution is diffused in the inflow place, population mobility combines the two effects mentioned above. That is, it can either gradually diffuse in the inflow place, if there is only one inflow place, or it can be brought into different places, which benefits a multi-points outburst of the institution and further diffusion in each place. (See Figure 1.12)

Trust and Development: The Deep Structure of Institutions-Building and Socio-Economic Performance
74
Figure 1.12 Institutional diffusion with population mobility. Notes: The solid circle in each set of concentric circles represents the center of an institution. A set of concentric circles represents the scope of the influence of an institution. The outer the circle, the weaker the influences of its institution. – That is why the relatively outer circles are gradually dashed more or less in the figure. The more circles a set of concentric circles has, the larger the influence of an institution. The larger the overlapping area of two sets of concentric circles, the larger the influences of their institutions on each other in that area. The direction of arrows represents the direction of population mobility. Small solid circles at the tips of arrows represent people that move to where the small solid circles are.
Not influence each other
Influence each other

Chapter 1: Thinking Trust Systemically in Socio-Economic Environment
75
1.8.7 Reasons of conforming to institutions
Axelrod (1986) summarizes eight mechanisms of supporting norms, that is respectively metanorms, dominance, internalization, deterrence, social proof, membership, law and reputation. Posner (1997) summarizes four incentives for obeying social norms: a) “Some norms are self-enforcing” (p. 365); b) “Some norms are enforced by the emotions” (p. 365); c) “Norms are also enforced by expressions of disapproval, by ridicule, and in extreme cases, by ostracism” (p. 366); d) “Norms that are internalized are obeyed out of a sense of guilt or shame” (p. 366). I would say that Axelrod (1986) and Posner (1997) have already enumerated most possible reasons for conforming to norms, or all kinds of institutions in a more general sense. Besides, four extra possible reasons for obeying norms are going to be added here.
First, in normal situations, complying with norms is easier and more convenient to carry out. Norms, the guiding principles of behavior, have already nurtured via a long-time training, and the required behavior of norms is the first reaction coming into mind when facing various particular situations. In normal cases, what a person intentionally breaching norms first realizes before conducting wrong is what is normally / morally right. (s)he then could take that right behavior as a reference and conceive a wrong way. In this sense, conforming to norms avoids extra thinking processes such as how to benefit from breaching rules, what the concrete implementing steps of it are, etc. Actually, as we know, conforming to rules will achieve a win-win consequence which not only benefits self, but also others because given behavioral rules of a particular situation, it saves time for considering how to behave in every single situation every time.
Second, obeying norms makes one the right party all the time undoubtedly and is conducive to formally safeguarding rights and interests in normal cases. Out of this consideration, those encountering others’ bad behavior would prefer sticking to the normally right principles, and even not implement private punishment or revenge like tit-for-tat, except keeping far away from the bad guys. By doing so, even when they will face public opinion or resort to law, they will still be the morally right and supported party. On contrast, those breaching norms will be morally unsupported, or be sanctioned by law and / or suffer pressure from public opinion.
Third, obeying norms also kind of implies exchange for others’ norm-obeying behavior. One’s conforming to norms shows his / her sincerity that (s)he cares for the interest of others, such as with whom (s)he interacts, expecting others to treat him / her in the same way out of principles and goodwill of fairness and reciprocity.
Fourth, changeability of relatively advantageous role in interactions pushes people to obey norms. This point has also been mentioned in Section 1.8.5.
Reputation
Now, let us talk about reputation as a reason for conforming to institutions, as well as establishing and maintaining interpersonal trust. Suppose that the subject of owning some reputation and that of trusting are different. That is, what is going to talk about is the influence of somebody or something’s reputation on his / her / its future interactions and on the trust of some other people to him / her / it. In general, conforming to institutions brings good reputation of corresponding aspects and among

Trust and Development: The Deep Structure of Institutions-Building and Socio-Economic Performance
76
corresponding people accepting the institutions; good reputation further brings more beneficial and profitable interaction opportunities. Therefore, establishing and maintaining good reputation is one of the significant reasons for restraining one self’s behavior within some institutional requirements. Good reputation represents trustworthiness of some aspect. In other words, trustworthiness is positive reputation. No doubt that good reputation benefits the establishment and maintenance of trust relationships, while bad reputation does not because people may even have no willingness to interact with those with bad reputation of some aspect, especially when people can choose interaction partner.
The impact of information about trustworthiness on trust is emphasized throughout this thesis. In fact, reputation works through information mechanism. In other words, reputation forms, either good or bad, in the course of information spreading, admitting that everybody’s judgment may not be totally the same since the amount of information faced, the standpoints, etc. are different. Thus, understanding reputation benefits from understanding information. Reputation chain is different in length and radiation range for different reputation-spreading ways. Specifically, mouth-by-mouth-spread reputation has a smaller radiation range and longer chain, while media-spread reputation has a much larger radiation range and shorter chain since the length of a reputation chain and the radiation range of the first link of reputation diffusion are to some degree substitutional. In this sense, media-spread reputation flattens reputation spreading to a large degree.
Reputation forms under the impact of both the reputation-owner and spreaders. Figure 1.13 presents the formation of reputation and Figure 1.14 shows reputation diffusors except the reputation owner. Reputation owner can either depend on diffusors (excluding the reputation owner) to spread reputation, or actively self-publicizing or self-marketing via some way to build reputation of some aspect, such as, as a promise or a signal. Self-publicizing / -marketing is usually adopted when intended to consolidate the size of direct interactors and to attract, or at least not to frighten away, those who have not ever interacted with the reputation owner. In the course of the formation of some reputation, what is spread may be faithful to or distort the facts. The formation of reputation depends on direct interactors as the initial main force of reputation spreading at first. However, the influence of reputation involves potential and new, in-depth interactors and non-interactors, rather than only among direct and long-term interactors, which is the very importance of reputation.
Figure 1.13 Formation of reputation.
Subjects
Reputation owner
Behave
Faithfully diffused
Distortedly diffused
Overpraised
Defamed
Not behave Distortedly diffused
Overpraised
DefamedSelf-
publicize
Diffusors (except
reputation owner)
Faithfully diffuse
Distortedly diffuse
Overpraise
Defame

Chapter 1: Thinking Trust Systemically in Socio-Economic Environment
77
Figure 1.14 Reputation diffusors.
1.8.8 Trustworthiness as an institution and institutionalized trust
Mayer, Davis and Schoorman (1995) summarize different antecedent factors of trust from different scholars with a table and stress three main characteristics (or three factors) for perception and evaluation trustworthiness of the trusted party, namely ability, benevolence and integrity. It can be found that trustworthiness actually has a thick institutional foundation, both formal and informal institution and especially the informal ones. One’s trustworthiness to a large extent reflects the degree of solidification of some kind of behavioral principle that guides the thinking and actual behavioral ways. Whether the values of the trusting party and the trusted party coincide matters a lot in the evaluation of trustworthiness. For example, if the trusted party complies with the universally proved values, such as “fairness”, it will have a large effect on trustworthiness perception of the trusting party. Of course, as facing other abstract values and human emotions, different persons have varied evaluations of “fairness”. The requirement of fairness may vary with different standpoints, which is actually a complicated coordination issue. However, many specific situations do exist that people find not very tough to make a coincident or similar fairness judgment across the involved parties or for other parties to make a fairness judgment about the involved parties on a particular event.
Since trust is so important, what is the basis of trust? After all unconditional trust is rare and trust needs to rest on something. As the opposite face of trust, trustworthiness plays an important supporting role. Trust and trustworthiness are relative. We may find that the real source sustaining trust comes from the mechanisms supporting trustworthiness, even though it is always subjectively perceived trustworthiness.
The mechanism supporting trustworthiness can be roughly classified as internal mechanism and external mechanism. When a human individual can bound himself within trustworthiness, it indicates that he approves the opinion that human should be trustworthy; when a human individual approves that human should be trustworthy from the point of his values, he will tend to behave trustworthily.
It can be said that trustworthiness, the same with honest et cetera, is a kind of informal institutions. Trustworthiness acquired pervasive social approval at the level of values. One of the evidences is that people usually averse to persons who, for example, always cheat, do not keep their promise, do not have serious and responsible attitude for their work, and so on, since these are all manifestations of untrustworthiness. It should be figured out here that nobody would be all the time trustworthy in all situations. If a person is a trustworthy one is a qualitative assessment. At the same time, it is accepted that generally everybody has the discretion to choose what to do and what not to do, which
Reputation diffusors (except reputation owner)
Direct interactorsAcquire direct,
first-hand information
Non-interactors Acquire second-hand information

Trust and Development: The Deep Structure of Institutions-Building and Socio-Economic Performance
78
is not necessary to influence his received personality evaluation from his interacting partners. What is more, the complexity of humanity also does not allow us to make an either-or evaluation of good of bad.
If it can be said that institutions are the habit of thoughts and behaviors (Veblen, [1899] 2005, pp. 143-144), institutionalized trust makes trust, both from thoughts and behaviors, somewhat a habit which implies the propensity to trust. Apart from the innate propensity of trust, if it does exist, distinguished between different individuals, “institutionalized trust” can be enhanced by trustworthiness which is essentially an informal institution and often reinforced by means of formal institutions. In a society in which trustworthiness is carried out to a high level, trust is accordingly conducted since there is no reason for an individual not trust in a trustworthy and orderly operating social environment. Gradually as time passes by and the frequency of trustworthiness stabilized, an individual’s trust level also gets stabilized since there is no extra risk in terms of his current trust level or he does not even perceive or predict any risk that he cannot be to tolerant to. Furthermore, he would integrate trust into his habit, or put another way, he would get habituated to trust, which can be said that trust is institutionalized for him.
Emphasizing trust without trustworthiness guaranteeing or stressing trust without its change according to the change or difference of trustworthiness is actually neglecting the human abilities of processing information and social learning and the nature of human adaptation. What is more, giving a prominent role of unconditional trust and, at the same time, underlining the changeability of trust according to information or signals of trustworthiness will to a large degree lead to logic contradiction.
Hence, institutionalized trust never simply unilateral trust; it implies contains two aspects, namely trust and trustworthiness, and has profound foundation in institutions (specifically in informal institutions) and the interaction of trust and trustworthiness. Thus, for a high level of trust to maintain, individuals, as the carrier of behavioral subject of both trust and trustworthiness, should be mutually trust when involved in the same interaction.
It should also be pointed out here that trust is not only a passive response; it also acts as an active incentive. Similarly, trustworthiness, which is a relative aspect of trust, is not merely a stimuli; it at the same time plays as a response. The specific sequence depends of which of trust and trustworthiness needs to be the first-movers, or maybe they almost simultaneously happen. For an example, when an individual who need to trust ex ante, he in his mind may know deeply that trust can arouse reliable response.
As aforementioned, most of time, voluntarily implemented institutions always require approve in one’s values and their almost corresponding reflection on one’s behaviors; on contrast, relatively non-voluntarily implemented institutions may only regulate behaviors, which does not stress much on behavioral subjects approve on the layer of values. Thus, to what degree an informal institution is internalized largely depends on the degree to which the related values are inner approved and, further, to which one would like to voluntarily implement that institution and let that institution govern his/ her behavior.

Chapter 1: Thinking Trust Systemically in Socio-Economic Environment
79
1.9 Three networks: Institutional networks, causality
networks and information networks
1.9.1 Institutional networks1
An institutional network is a network on which various institutions are as nodes and relations between institutions are as links. The crux of understanding institutional networks is how institutions are linked with each other since it is pretty straightforward concerning what are the nodes on an institutional network.
The generation of institutions benefits from supports from psychological factors. As analyzed before, psychological factors underpinning constructed institutions can roughly be categorized into two kinds, one is values which are also institutions, and the other is those that brace constructed institutions without being institutions themselves. What is more, values-type institutions and constructed institutions together make up the institutional level. Therefore, there are two typical connecting methods on the institutional level, one is between values-type institutions and constructed institutions, the other is between constructed institutions.2 Values-type institutions and constructed institutions are connected via various values. Take fairness and laws as an example. Fairness is always treated as an important value orientation, as well as a norm in life, and laws, according to my categorization, are constructed institutions and are normally established based on the principle of fairness. In this case, fairness as an abstract value links itself as a value-type institution and laws as constructed institutions. Constructed institutions are connected via the scopes in life they are regulating. For instance, regulations of stocks offering and exchanges are linked with those of futures exchanges because stocks and futures are all financial products and the regulations of stocks and futures exchanges are all regulations in the financial field. Furthermore, laws of securities, which involve stocks, bonds, etc., and laws of company are also connected because they all belong to economic laws.
Figure 1.15 presents an institutional network and its supporting psychological factors. It should be noted that the links between factors at psychological level and constructed institutions and those between constructed institutions are of different forming mechanisms. The links between psychological-level factors and constructed institutions are of a causal nature, which means that a psychological-level factor comes first, the causal link starting from the psychological-level factor the second, and a consequent constructed institution the third. By contrast, the links between constructed institutions are of equal nature, which means that given two constructed institutions, if their pointed objects are related, a link between them exists.
1 Dai (2015) also wrote a monograph on networks of institutions. 2 Note that the possible relations, if exist, between values-type institutions are not considered here.

Trust and Development: The Deep Structure of Institutions-Building and Socio-Economic Performance
80
Figure 1.15 An institutional network and its supporting psychological factors.
Different from the understanding of an institutional network in which links between institutions are emphasized, the crux of understanding of evolution of an institutional network lies in the generation, change and disappearance of the nodes, namely the institutions, on an institutional network. For values-type institutions, their generation, change and disappearance depend on themselves as values. However, it does not mean that the values can change without reason. Their changes also require stimuli of external information.
By contrast, for constructed institutions, there are two types of evolutionary drivers. One is from changes of those psychological factors supporting constructed institutions (including those values which can directly be treated as institutions and other psychological factors bracing institutions). When those psychological factors have substantial changes, they will contradict existing constructed institutions based on the previous them. If the undesirable influences that the contradiction arouses are big enough, the changes of the underlying psychological factors will push the constructed institutions based on the previous them to make corresponding adjustments and changes. The other is from changes of reality, given that psychological factors supporting constructed institutions have no obvious changes. For example, with the rise and flourish of the Internet, not only laws specific to the Internet have been promulgated; other laws, which are constructed institutions, have also made corresponding adjustments in order to adapt to the new reality.
However, the temporarily effective method is imperfect and incomplete and new problems may still happen, which leads further demand for more problem-solving methods and the network of
Institutional level
Constructed institutions
Psychological level
Values-type institutions Some other psychological factors supporting constructed institutions
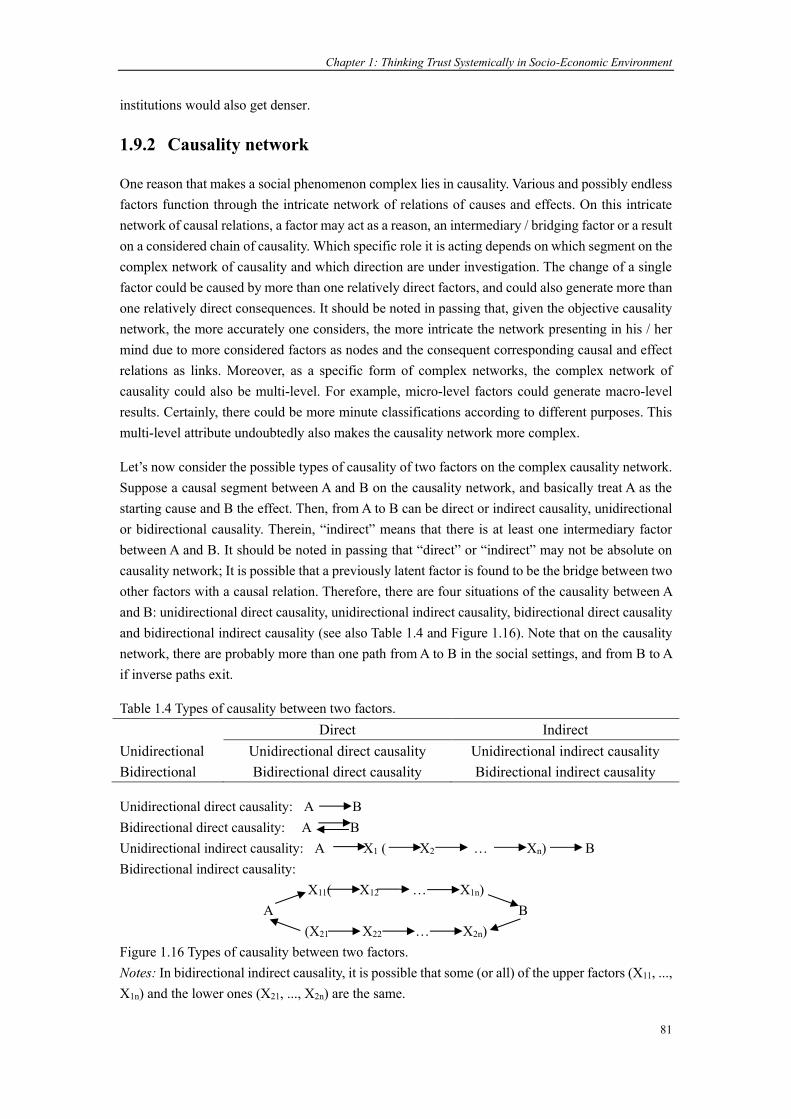
Chapter 1: Thinking Trust Systemically in Socio-Economic Environment
81
institutions would also get denser.
1.9.2 Causality network
One reason that makes a social phenomenon complex lies in causality. Various and possibly endless factors function through the intricate network of relations of causes and effects. On this intricate network of causal relations, a factor may act as a reason, an intermediary / bridging factor or a result on a considered chain of causality. Which specific role it is acting depends on which segment on the complex network of causality and which direction are under investigation. The change of a single factor could be caused by more than one relatively direct factors, and could also generate more than one relatively direct consequences. It should be noted in passing that, given the objective causality network, the more accurately one considers, the more intricate the network presenting in his / her mind due to more considered factors as nodes and the consequent corresponding causal and effect relations as links. Moreover, as a specific form of complex networks, the complex network of causality could also be multi-level. For example, micro-level factors could generate macro-level results. Certainly, there could be more minute classifications according to different purposes. This multi-level attribute undoubtedly also makes the causality network more complex.
Let’s now consider the possible types of causality of two factors on the complex causality network. Suppose a causal segment between A and B on the causality network, and basically treat A as the starting cause and B the effect. Then, from A to B can be direct or indirect causality, unidirectional or bidirectional causality. Therein, “indirect” means that there is at least one intermediary factor between A and B. It should be noted in passing that “direct” or “indirect” may not be absolute on causality network; It is possible that a previously latent factor is found to be the bridge between two other factors with a causal relation. Therefore, there are four situations of the causality between A and B: unidirectional direct causality, unidirectional indirect causality, bidirectional direct causality and bidirectional indirect causality (see also Table 1.4 and Figure 1.16). Note that on the causality network, there are probably more than one path from A to B in the social settings, and from B to A if inverse paths exit.
Table 1.4 Types of causality between two factors. Direct Indirect Unidirectional Unidirectional direct causality Unidirectional indirect causality Bidirectional Bidirectional direct causality Bidirectional indirect causality
Unidirectional direct causality: A B Bidirectional direct causality: A B Unidirectional indirect causality: A X1 ( X2 … Xn) B Bidirectional indirect causality:
X11( X12 … X1n) A B
(X21 X22 … X2n) Figure 1.16 Types of causality between two factors. Notes: In bidirectional indirect causality, it is possible that some (or all) of the upper factors (X11, ..., X1n) and the lower ones (X21, ..., X2n) are the same.

Trust and Development: The Deep Structure of Institutions-Building and Socio-Economic Performance
82
Now, let’s have a close look at trust on the complex network of causality. When investigated as a psychological result on a segment of a causal link, trust is certainly not caused by only one specific direct reason; on the contrary, it can be directly affected by many different factors, although what influence trust can be uniformly called “information about others’ trustworthiness”. It is the variety of external information about others’ trustworthiness that makes a person know what trust is and causes his / her trust to change at the psychological level. For example, when others do not fairly treat you, you distrust; when others do not keep their promises, you distrust; when others tell lies, you distrust; when others have a substantial divergence of opinion with you, you distrust, and so on. – These are all specific reasons from which people can perceive others’ trustworthiness from a personal perspective.
Likewise, trust as a cause can also generate more than one specific, relatively direct consequences which we can uniformly call “willingness to interact” from a personal perspective. For example, from a personal perspective, a person’s distrust in some product could probably depress his / her willingness to buy it, ceteris paribus (for the impact of trust in economic transactions, see Section 1.10); his / her distrust in the voting process of political system could also decrease his / her willingness to vote, ceteris paribus, etc. Moreover, given a specific final factor influenced by trust and an intermediary factor between them, both direct impact of trust on the final factor and the indirect impact via the intermediary factor could exist at the same time. Take economic growth and consumption as an example. General trust may influence economic growth directly bypassing consumption, and at the same time indirectly via influencing consumption which has an impact on economic growth as well. Furthermore, a factor influenced by trust may also affect trust. For example, general trust affects economy and economy may also affect general trust in some way. Therefore, it is hard to figure out which particular causal path dominates since all paths are functioning together.
Trust can also play an intermediary role in a specific causal link. In this case, deeper causes – put another way, a longer causal link – are needed for explanation. Thus, factors that influence trust should also be integrated into the explanation. Recall what the thesis is always stressing. Various external information about others’ trustworthiness underpins the changes of a person’s trust which subsequently across other factors affect macro socio-economic performance.
In a word, complex causality is an important embodiment of the complexity of the real world, which should get noticed, although it is impossible that the complex network of causality is exhausted. However, causality is undoubtedly an eternal theme for human to understand the world.
1.9.3 Personal information networks
A personal information network refers to a network made up by channels of a person’s acquiring information. On a personal information network, two kinds of nodes should be distinguished, one is non-media type including individual persons and the other is media type, and links represents the existence of information flows. Channels of acquiring information can be categorized as three types, one is personal interactions, the second one is direct observations in the broad sense (here verbally delivered information is included), and the third is indirectly required information via media.
When there is no spatial mobility, except the spatial mobility of people working for media,

Chapter 1: Thinking Trust Systemically in Socio-Economic Environment
83
individual persons can only via media require information of other areas. When spatial mobility exists, people from a place to another can not only directly acquire information of their current local area, but can also be as information sources which can deliver information of their previous local areas to the people in the new one.
Using ellipses to represent local areas, quadrates to represent medias, arrows and straight lines to stand for information flows, circles filled with black, grey and white to respectively stand for an example person, people whom (s)he can interact with (and therefore can also directly observe, be instructed by, etc., of course) and people whom (s)he can only directly observe (which means (s)he do not interact with them), and dashed circles to represent other people in his / her local area whom (s)he even hardly observe, Figure 1.17 presents a personal information network without personal spatial mobility and Figure 1.18 shows one with personal spatial mobility, assuming that a person of a local area cannot directly acquire information of another local area if he / he has never been there before and there is only one person who spatially mobiles. In Figure 1.17, when the example person stays in his / her local area, (s)he can acquire information from people around him / her and media (global or local ones). In Figure 1.18, when (s)he moves from his / her local area to another place, (s)he can not only acquire information from people and local media in his / her new local area and global media, but also from people or local media in his / her previous local area.
In addition, direct personal information sources can also be either temporary or long-term. (For types of information, see Section 1.6.2) For instance, if one gets some piece of information from a person whom (s)he has only met once and will almost not meet again, that person is a temporary direct information source for him / her; by contrast, if (s)he always watches some news program which has been and will broadcast for a long-time to acquire information, the program is then his / her long-term direct information source.

Trust and Development: The Deep Structure of Institutions-Building and Socio-Economic Performance
84
Figure 1.17 Personal information networks without spatial mobility.
Global media
Local
media 3
Local area 1
Local area 2
Local area 3

Chapter 1: Thinking Trust Systemically in Socio-Economic Environment
85
Figure 1.18 Personal information networks with spatial mobility.
Global media
Local
media 3
Local
media 2
Local area 1
Local area 2
Local area 3 Move from local area 3 to local area 2

Trust and Development: The Deep Structure of Institutions-Building and Socio-Economic Performance
86
1.9.4 Trust in the three networks
Actually, the basic ideas and many details about the relationship between trust and the three networks have been consciously elaborated on in the former parts. Normally, trust is in essence based on trustworthiness. Before further elaboration, it should be noted in passing that the often-mentioned trustworthiness has two “identities”: one is as an institution; the other is as a personal quality.
Trustworthiness per se is an institution, and therefore exists in the institutional network. People generally have requirements for others’ trustworthiness. It has transcended purely personal preferences and becomes a social norm, an institution. According to the aforementioned classification of the institutions, trustworthiness is a value-type institution and provides basis and guiding principle for many constructed institutions. For example, many law provisions are for guaranteeing the trustworthiness of people involved in corresponding events, avoiding untrustworthy behavior beforehand or punishing untrustworthy behavior. People’s requirements for others’ trustworthiness are therefore reflected on those of various institutions for trustworthiness. In the institutional network, given that trustworthiness is always desirable, not only directly disobeying trustworthiness per se as a value-type institution, but also breaching other value-type institutions and constructed institutions based on trustworthiness will finally result in a psychological sense of distrust. On contrast, following institutions can generate trust. Directly disobeying trustworthiness is embodied on those various specific situations which have not been covered by constructed institutions and can be made a judgment by the people involved themselves. In a word, breaking institutions leads to distrust.
Then, information reflecting others’ trustworthiness via the various information channels in the aforementioned personal information network reaches individuals. These pieces of information will finally take effect on the psychological layer. People tend to trust those who they think are trustworthy, or at least not those who they think are not. People would according to perceived trustworthiness of others take different actions. As mentioned before, there are numerous specific reasons resulting in (dis)trust, and (dis)trust can also lead to different concrete behavior or consequences. Personal behavior (including no behavior) further is passed on as information containing the actor’s own trust attitude and trustworthiness. – These all exist in the causality network. Therein, trust can act as both a cause and an effect. However, a very noteworthy and serious point is that those factors that happen to be characteristics of (dis)trustors cannot be causes of (dis)trust. Imagine a society which discriminates those who are tall. Tall people get discriminated because of their height, and become distrusting. Then, discrimination, as an unfair treatment, is the true cause of distrust, rather than height. It is even absurd to treat height as a cause of distrust in this case. In addition, Figure 1.19 presents trust in the three networks.

Chapter 1: Thinking Trust Systemically in Socio-Economic Environment
87
Figure 1.19 Trust and institutional network, personal information network and causality network
In
stitu
tiona
l net
wor
k
Pers
onal
info
rmat
ion
netw
ork
Trus
t at p
sych
olog
ical
laye
r
Result 1
Result 2
Result n
Causality network (trust as a cause)
Causality network (trust as a result)
.
.
.
.
.
.
.
.
.
No causality with trust
Event 1
Event n
Event 2
Information 1
Information 2
Information n
Trust and Development: The Deep Structure of Institutions-Building and Socio-Economic Performance
88
1.10 (Dis)Trust and economic transactions
Indeed, just as what we can feel, and as mentioned throughout this thesis, trust has a nonnegligible impact on every aspect of social life in the broad sense, such as economic life, political life, social life in the narrow sense, etc. Yes, other forms of human life can all be treated as part of social life because they are all specific lives in human society. One of the effects of (dis)trust on economic life and the whole consequent economic performance lies in economic transactions which is going to be focused on below.
As we know, the term “economics” was first used by Xenophon ([Approx. 362 BC] 1897), an ancient Greek historian, who endowed its meaning with household management. In modern world, economy is mainly reflected in the division of labor, the production for the purpose of exchanges and the exchanges per se in society. Mass division of labor requires purchase (namely, exchanges), rather than producing for self-use, since after all limited time and energy make it impossible for one to master all the knowledge and skills of producing all of what (s)he needs and desires in the modern life. (Certainly, not only demand can create supply, but also supply can also create demand.) Further, the division of labor gets more and more elaborate in the modern market economy. What is bound to result in is the increase of economic transactions, ceteris paribus. Previous sections of this chapter have already talked about the impact of individual trust on interpersonal interactions, and economic transactions are one type of human interactions. However, although the impact of trust on economic transactions can be acquired from that on general interactions, it is not targeted for economic area. Below is going to specifically elaborate on the impact of trust on economic transactions. Note that what is going to be discussed is all on the hypothesis that (dis)trust results from perceived (un)trustworthiness of others. For example, general (dis)trust is caused by perceived general (un)trustworthiness; some particular (dis)trust is caused by some perceived particular (un)trustworthiness. Put another way, (dis)trust is basically qualitatively well-founded, has (un)trustworthiness as the basis. Certainly, perceived (un)trustworthiness could be different from actual (un)trustworthiness, even qualitatively.
Economic prosperity is to a considerable degree embodied in the prosperity of economic transactions. For example, many people are engaged in transaction activities; there is a rich variety of merchandise; there are a great number of transactions, etc. In commodity economy, honesty and trustworthiness are the basic and fundamental principles for maintaining exchanges, ceteris paribus. Only having perceived suppliers’ honesty and trustworthiness or at least having not perceived their dishonesty or untrustworthiness can demanders always trust. In a word, trust based on honesty and trustworthiness facilitates economic exchanges. As Arrow (1974, p. 23) says, “trust has a very important pragmatic value […]. Trust is an important lubricant of a social system. It is extremely efficient; it saves a lot of trouble to have a fair reliance on other people’s word.” Without trustworthiness of suppliers and trust of demanders based on trustworthiness, products and services cannot be successfully and smoothly sold, excluding the situation in which consumers are not trustworthy, such as paying with counterfeit money. However, untrustworthy behavior in economic transactions, for example, suppliers of goods or services, for short-term interests, do not provide goods and services of good quality, leads to that goods and services do not meet the use value or

Chapter 1: Thinking Trust Systemically in Socio-Economic Environment
89
standard supposed to have, and violate the principle of fair trade, and may even threaten the health and life security of consumers. – This makes consumers perceive malevolence, and generate distrust. Marx says, “The leap taken by value from the body of the commodity, into the body of the gold, is, as I have elsewhere called it, the salto mortale of the commodity. If it falls short, then, although the commodity itself is not harmed, its owner decidedly is.” (Marx, [1867] 2011, p. 119) Therefore, interpersonal trust based on trustworthiness is the basis for the long-term prosperity of economy. From the perspective of consumers of goods and services, especially individual consumers of final commodities and services, the impact of trust crisis on transactions are mainly embodied on 7 aspects. (Certainly, even not for final commodities and services, the below aspects can also be involved.) These 7 aspects could be related to each other, and even are inseparable. In fact, in one word, distrust to a large degree leads the transactions’ recession to individual consumers’ self-supply, or to concentrate to fewer suppliers in essence.
(a) Compression effect
Distrust could lead to a decrease of willingness to transact, which is reflected in the decrease of transaction frequency of the distrusted commodities and services. For example, if one knows that the processing course of (semi-)finished noodles are not hygeian, (s)he would reduce his / her consumption; If one knows that some fruit not easy to preserve is spayed on some harmful chemical to keep it fresh, (s)he would reduce its consumption; if one knows that usually the cooking process in restaurants is not hygeian, food materials are not fresh, (s)he would try his / her best to reduce going to restaurants for meals. It is noticeable that actually the compression effect of economic transactions may be inseparable from the vertical and cross substitution in the substitution effect which are going to be introduced later.
(b) Substitution effect
The substitution effect of economic transactions is in essence transaction transfer, meaning that the object of a transaction changes from a commodity or service to another. Substitution effect of economic transactions caused by distrust can be categorized as horizontal substitution, vertical substitution and cross substitution. Horizontal substitution refers to changing from the consumption of a commodity or service to another on the same consumption link. For example, strawberries and apples can both be directly eaten, and suppose that there are only these two kinds of fruit. A consumer at first wants to buy some strawberries. But it is said that strawberry vendors use harmful chemicals to make strawberries stay fresh longer, and that this behavior is quite common. On contrast, there is no similar negative information about apples. Then, the consumer may harbour misgivings about the consumption of strawberries, and would reduce its consumption and turn to apples. Vertical substitution refers to changing from the consumption of some commodity or service to that of some other commodity which individual final consumers can use to make what they want by themselves. This type of substitution is somewhat analogous to the relationship of upstream and downstream on a supply chain. Vertical substitution would result in a decrease in a series of some future transactions, which is also the consequences distrusting individual consumers attempt to achieve. For example, one buys a little noodle machine, instead of finished noodles, in order to make noodles at home because the processing course of finished noodles may not be hygeian. Cross substitution refers to changing from the consumption of some commodity or service to that of some other commodity which individual final consumers can use to make a horizontal substitution of

Trust and Development: The Deep Structure of Institutions-Building and Socio-Economic Performance
90
what they previously want by themselves. For example, a person at first wants to eat noodles, but finally (s)he buys a little baozi (Chinese food) machine, if there is, instead of finished noodles. Substitution effect of economic transactions could result in a decrease of the substituted goods or services, although it could lead to an increase of the substitutes to some degree. Therein, the latter two, namely vertical substitution and cross substitution, are both means of internalizing transactions. Note that the precondition of substitution effect is that the substitutes can be trusted in some sense.
(c) Brand-reliance effect
General distrust could result a concentration of consumption to brand products. This effect is based on the belief that firms with an established brand would provide and continue to provide good commodities and services for their own established reputation and long-term interests. Thus, under the condition that individual financial status allows, consumers would choose brand products to avoid encountering untrustworthy transactions. Of course, choosing brand products does not definitely mean that other non-brand products are of ill-quality, although brand products are thought to be better in some sense by consumers. However, if it is because of general distrust that one turns to brand products, it is a case of another nature. Hence, distrust is one reason that consumers may concentrate in brand products, but it is not the only one. This is different from brand loyalty. However, if even previously trusted brand products are exposed to scandals, the whole industry which the brand products belong to would get notorious.
(d) Searching effect
Searching effect means that consumers would spend time, efforts and / or even money into searching for trustworthy sellers before purchasing in order to buy commodities or services with normal quality and use value. When sellers are generally untrustworthy, randomly selecting a seller cannot guarantee meeting a trustworthy one to a large degree. Then, searching for evidences of which seller can be trusted becomes necessary. After meeting a trustworthy seller, consumers would probably replace general trust with particular trust in future. In this sense, the brand-reliance effect mentioned above can be a kind of time-saving searching effect to some degree.
(e) “Experts” effect
“Experts” effect is mainly embodied in two aspects: one is that one becomes an “expert” himself / herself, the other is to turn to a real expert. Therein, the first situation is of special meaning and importance here. “One becomes an ‘expert’ himself / herself” means that to accumulate corresponding knowledge by oneself in order to find commodities or services of well-quality among numerous commodities and services. There are two situations of becoming an “expert” by oneself: One is accumulating corresponding knowledge of making something by oneself; the other is accumulating corresponding knowledge of discerning the false from the genuine or the bad from the good for directly buying something. When people know there exists much untrustworthy behavior in economic transactions, they would consciously learn various relatively professional knowledge in order to via more sufficient knowledge and information reduce the possibility of encountering untrustworthy behavior in economic transactions and increase that of encountering trustworthy behavior accordingly. Hence, the essence of “experts” effect is to increase knowledge and information concerning corresponding products and services per se.

Chapter 1: Thinking Trust Systemically in Socio-Economic Environment
91
(f) Self-provision effect
Self-provision effect is mainly reflected in transacted services of which the rate cannot be further separated. It refers to that a consumer, out of distrust, would rather use something of his / her own to replace or assist part of a package service. Take staying in a hotel as an example. If people know, from such as news reports, that some hotels, even high star ones, cannot guarantee changing a clean bed sheet, quilt cover and pillowcases for every customer, they may take some measure by themselves, such as taking a bed sheet etc. of their own. If people know that some customers do some disgusting things with the kettle, such as boiling underwear or urinating inside it, provided by hotels for each room, they would rather take a kettle, maybe a collapsible one, by themselves. If people know that hotels do not even disinfect the bath in each room for each customer, they may take some disposable plastic covers especially for a bath, given that they do want to use the bath, rather than the shower, in hotels. Therein, the first two examples are replacement effect, and the third one is assistance effect. Self-provision effect may and may not bring new transactions. Follow the three examples just mentioned. If the bed sheet etc. a hotel customer takes are not bought especially for staying in hotels, self-provision effect does not bring new transactions. By contrast, if the collapsible kettle or plastic covers are bought especially for travelling and staying in hotels, then it does incur new transactions. Anyway, distrust incurs what is unnecessary.
(g) Mismatch effect
Mismatch effect is also usually associated with transacted services of which the rate cannot be further separated. It refers to that a consumer would rather use a package service as less as possible, even when needed, out of distrust, which results in a mismatch of the rate paid for a service and the service actually being able to use. Still take staying in a hotel as an example. As we know, hotels usually equip every room with a kettle. The rate of staying a hotel room for one night covers the use of the kettle, and the hotel would not reduce the rate for anyone who does not use the kettle in the room since the rate is not further separable. However, a customer may decide not to use it to boil some drinking water, although (s)he needs to, because (s)he may worry that other previous costumers may have done some disgusting things with the kettle, such as boiling underwear or urinating inside it, as one may learn from news. The mismatch effect is somewhat like compression effect. The difference between them is that the former is compressing within a single inseparable transaction, while the latter is compressing the frequency of transactions.
1.11 Interim conclusion
This chapter systematically considers trust in the realistic socio-economic environment where many factors, such as information, social learning, networks of interpersonal relationships, geographical mobility, institutions, etc., function on trust through some way, underpin the change of trust and the co-evolution of trust and trustworthiness, and further are reflected on corresponding economic performance.
First, some basics of trust (Section 1.1 – 1.3) are illustrated. Individual trust is an attitude based on one’s perception of trustworthiness of other people or things. Trust has some characteristics: it is conditional on trustworthiness; it relies on information; ex ante trust in future interactions is risk-

Trust and Development: The Deep Structure of Institutions-Building and Socio-Economic Performance
92
relevant; and it is slow to establish, fast to decline and hard to rebuild. Individual general trust is one’s overall assessment of the trustworthiness of unspecified others in the society. From the perspective of an individual person, the difference between general trust and particular trust lies in whether the trust object(s) is / are specified; The difference between general trust and group trust lies in whether there is a definitive or clear characteristic or criterion to define a certain group; and the most subtle difference between general trust and trust in strangers lies in whether there is the explicit distinction of the distance of personal relationships. The generalizing process of trust can be treated as a subjective referring result from a sample of population to the whole population. The generalization process of trust is to a large extent experience-oriented, or backward-looking, while its output is expectation-oriented, or forward-looking. Trust can be general; however, when functioning, it is probably reflected in a particular way. After being experienced, uncertainty will turn into established facts and certainty. The impact of the consistency of expectation and a later fact on trust also depends on whether the expected thing is desirable or undesirable. Experience can be categorized as childhood and adulthood experience, personal and non-personal experience, and positive and negative experience. Expectation can be positive or negative, self-based or cause-based, and quantitative or qualitative. Existing measures of (general) trust include measuring general trust using micro-level or aggregate macro-level survey data, measuring trust using the investment actions in trust games, measuring social trust using the cooperation share in evolutionary game theoretical agent-based modeling, and representing micro trust using probability.
Then, it discusses trust from the perspective of an individual trustor (Section 1.4) and considers trust and trustworthiness simultaneously (Section 1.5). From the perspective of a trustor, thoughts stress the mental process of processing information of others’ trustworthiness. Personal preference, opinion, emotional attitude etc. to a large degree influence one’s reaction to the information reflecting trustworthiness. Moreover, human capabilities of reasoning, inference and association etc. also play a crucial role in a trustor’s trust in future similar situations and / or in other people with common or similar characteristics. Besides, behavior, also from the perspective of a trustor, emphasizes the behavioral expression or output after processing the information of others’ trustworthiness in mind. Every interaction, as the most important channel for a trustor to display trust attitude, involves a bunch of decisions. Not only others’ trustworthiness is the basis of one’s trust, but also one reacts to others’ trustworthiness. Moreover, it is also possible that one may adjust his / her trustworthiness according to others’ trustworthiness. Untrustworthiness not only causes individual costs for others, but also social costs. In a 2-person trusting-trusted relationship, the role of a trustor and that of a trustee represent either correspondence or superposition, which contains an important motivation for one’s sticking to trustworthiness, and therefore implies an important mechanism for the maintenance of social trust in the whole society. When it comes to trust and trustworthiness in a society, the concepts of the supply of trust and trustworthiness and the demand for trust and trustworthiness are needed. Although trust and trustworthiness are unaccountable and abstract, it does not mean that the supply of and the demand for trust and trustworthiness cannot be compared.
Then, this chapter pays the most attention to information (Section 1.6), social learning (Section 1.6), networks of interpersonal relationships (Section 1.6), geographical mobility (Section 1.7) and institutions (Section 1.9), which are several essential, decisive factors pushing the functioning of the trust mechanism and underpinning the change and coevolution of trust and trustworthiness.
Chapter 1: Thinking Trust Systemically in Socio-Economic Environment
93
One’s behavior delivers information of his / her trust and trustworthiness. Behavior can be either solo or interactive, or either internalization-based or internalization-lacking. Interactive behavior much more easily delivers information of trustworthiness of either actor than solo behavior. Whether solo behavior will present trustworthiness lies in its externality, and the degree of the externality. Moreover, the key to distinguish internalization-based and internalization-lacking behavior is the consistency of one’s values and behavior. Information reflecting others’ trustworthiness is crucial for one’s trust. Information can be categorized as solo behavior or interactive behavior information, personal interaction or non-personal interaction information, individual-particular or phenomenon-particular information, natural-personal or media information, or personal interaction and observation information, and direct and indirect information. Social learning is an important channel for acquiring both thoughts and behavior, including trust and trustworthiness. Social learning can be direct or indirect learning, forward or reverse learning, learning from the same standpoint or from the counter standpoint, and active or passive learning. It can be from parents, neighbors or even strangers. Immediate interaction networks, temporary interactions, observation, verbal delivered information, written records can all become channels for social learning. A shorter distance – geographical, social or psychological – facilitates interactions. So does being involved in the same interaction platform. Interaction platforms can be formed based on geographical locations, organizations, social roles, events, technology, or era. Flows should also be treated as a basic element of networks, besides nodes and links. For micro individuals generate macro phenomena, four steps, namely endowment / networking process, micro effects, synthetization process and macro-level presentation, may be experienced. The reason why macro network phenomena are rich and constantly changing in reality lies in the driving of heterogeneity. The heterogeneity of networks may be embodied on nodes, links, flows, game types / structures, interaction platforms, and network structures. Geographical mobility changes individual local interaction network, and has a time and distance dimension. Three kinds of trust decline may be caused by geographical mobility: different background mindsets, different standpoints, and the coexistence of large population and high mobility creating conditions for untrustworthy behavior. In addition, geographical mobility may also accompany social mobility.
Others’ not conforming to institutions is a non-negligible cause for one’s distrust. First, institutions can be established for problem-solving, problem-avoiding, influence- / problem-controlling and blame-apportioning institutions, which is from the perspective of the purpose of institutions and is of practical importance for trust (re)building. Problems are the prime target of institutions usually, which requires the manifestation of problems. Institutions centering on problems may be generated at different depths of problems. Besides, institutions can also be classified as values-type institutions and constructed institutions. Trustworthiness per se is a values-type institution. In terms of the origin of institutions, behavioral requirements on others and the changeability of the relatively advantageous role in various interactions play an important role. In terms of the diffusion of institutions, continuous geographical distribution of population and population mobility favor the diffusion of institutions. An institution’s prevalence from generation to diffusion presents three patterns of special structure at least, that is, single-point radiation, multi-points outburst and diffusion in virtue of population mobility. Besides the reasons stressed by Axelrod (1986) and Posner (1997), people may also conform to institutions because complying with institutions is easier and more convenient, makes one the right party in normal cases, implies an exchange for others’ institution-obeying behavior, or is motivated by the changeability of the relatively advantageous

Trust and Development: The Deep Structure of Institutions-Building and Socio-Economic Performance
94
role in various interactions. Among all the reasons, reputation outstands for its strong dependence on information process. It can be said that trust and its change are in an interwoven system composed of institutional networks, causality networks and personal information networks.
Economic transactions are a specific form of interpersonal interactions. In economic transactions, individual (dis)trust may cause a series of effects through which trust influences economy. These effects are respectively compression effect, substitution effect, brand-reliance effect, search effect, “experts” effect, self-provision effect and mismatch effect. Therein, substitution effect can be horizontal, vertical or cross.

Chapter 2: Some Socio-Economic Aspects
of China and Scandinavia
2.1 Introduction
Obviously, China and the three Scandinavian countries, Denmark, Norway and Sweden, are different in many aspects. They are different in population size: By 2017, the Chinese population is approximately 1.4 billion, the Danish population is about 5.75 million, Norwegian 5.3 million and Swedish 10 million. They are different in ethnic composition and ethnic diversity: China is a multiethnic nation, with 56 ethnic groups in total out of which 55 are ethnic minorities, except foreign immigrants; By contrast, the three Scandinavian countries are a lot less ethnically diverse than China. They are different in religious belief: Most Chinese do not have religious faith, while most people in the three Scandinavian countries belong to Protestantism. They are different in ideology: China is a socialist country with Chinese characteristics, while the three Scandinavian countries are capitalist countries. They are different in the stage of economic development: China is currently an economically developing country, with a rapid economic growth, while the three Scandinavian countries are already economically developed countries. They are different in the balance of regional development within country: China presents large gaps in regional economic development, with the eastern and coastal regions being more economically developed than the middle ones and the middle areas more developed than the western ones, and with the urban areas being more developed than the rural ones. By contrast, the regional development in the three Scandinavian countries is much more balanced and even. They are different in territorial area, geographical location and climate; They are different in cultural tradition, history, value system and life style…
Although there are many different aspects between China and Scandinavia, this chapter is not intended to cover all of them. Instead, it will focus on several social and economic aspects that relate to trust and reflect the characteristics of China and Scandinavia, besides trust itself. Moreover, rich corresponding data mainly about China, Denmark, Norway and Sweden will be presented throughout this chapter. However, it should be noted that this chapter is not going to examine any data relation possibly existing between or among trust and socio-economic performance and other related factors; what it aims to is to introduce or discuss some possible realistic factors and mechanisms among them first and then further present or compare directly, closely relevant real data of both Scandinavia and China where relevant data is available.
This chapter contains 8 sections, except the chapter introduction: Section 2.2 is about population, network structures and memberships. This section firstly discusses several points of what population possibly means to social trust and presents data of population size and population composition (mainly about religion, immigration and ethnic groups) of China and Scandinavia. Following this, it compares social structures (here similar with “network structures”) between China and the West. Thirdly, it compares family structure and voluntary membership between China and Scandinavia.

Trust and Development: The Deep Structure of Institutions-Building and Socio-Economic Performance
96
Last, it introduces in brief the Huji system in China and presents data about floating population in China. Section 2.3 is about welfare, equality, change, expectations, and certainty. Scandinavia is the main role of this part. This section introduces briefly the Nordic model, its possible socio-economic results, etc. in general. It also introduces some specific welfare policies in Denmark, as well as in China. Besides, equality, which involves equality / equity in values, wealth or income equality resulted from welfare and taxation policies, and gender equality are also included. Section 2.4 is about social mobility and geographic mobility in China, which also involves the Huji system of China. Section 2.5 is about social capital. This section discusses the definition, forms, dimensions, elements, etc. of social capital. Besides, it also presents different possible measures of social capital of China and Scandinavia which could reflect social capital in various aspects. Section 2.6 is about trust building. This section shows possible ways of building trust and data of both general trust and trust in people of different closeness and / or occupations; Section 2.7 is about socio-economic performance. This section includes unemployment rate and relevant data of GDP and public security of China, Denmark, Norway and Sweden. Section 2.8 is interim conclusions.
What are going to be presented in this chapter are usually of theoretical and / or empirical interest in terms of their possible impact on social (general) trust and / or economic performance in academic research. However, it should be noted that due to complex interactions among various and rich social factors, on the path to trust, some factors may be closer to trust than other factors. Thus, it may turn out that the ever claimed effect of some of them on social trust is refuted in some empirical research. But it may be still of much interest to have a look at them and discuss possible paths from them to social trust and / or economic performance, especially when we take Scandinavia and China as main cases in particular. Additionally, it should be noted that there may be other factors or mechanisms (as have been and will be discussed in other chapters) that play a more essential role than these ones. Anyway, let us have a look at and discuss them first taking Scandinavia and China as main cases.
2.2 Population and network structures
2.2.1 Meaning of population to trust
Humans are the subjects of interactions in human society. In interpersonal interactions, trust can not only be generated, but also be destroyed. Having a look at the total population at a certain level and its composition or structure is valuable for at least three reasons:
First of all, taking a society as the level of consideration, the more people a society has, the more possibly interpersonal interactions happen, ceteris paribus. Information of trustworthiness of others from direct (personal) interactions or interactions of others is an essential source for one’s trust in others to change (i.e., increase or decrease). Thus, more people usually mean more of that kind of information. This is sort of like sampling; each piece of information which can be used to infer the trustworthiness of others of a certain scope is like an observation. Certainly, whether one’s trust will finally increase or decrease after receiving that kind of information depends on the nature of an interaction, or put another way, on whether the interaction is trust-reinforcing or trust-damaging. Nowadays, a lot more information about others’ trustworthiness can be obtained through various media, and those pieces of information further influence people’s social trust.
Chapter 2: Some Socio-Economic Aspects of China and Scandinavia
97
Second, the impact of racial, ethnic or linguistic heterogeneity or dissimilarity on social trust is often a topic in academic research. Therein, many works conclude that racial, ethnic or linguistic heterogeneity has a negative association with social trust. For example, Alesina and La Ferrara (2002) explore the determinants of general trust using data of the United States. Their empirical research reveals that “both individual experiences and community characteristics” (p. 207) affect general trust, and, what is more, that those living in more racially heterogeneous communities tend to have lower general trust (Alesina and La Ferrara, 2002). Leigh (2006) explores “the determinants of localised trust and generalised trust” (p. 278) using data of Australia on individual, neighborhood and regional level. He concludes that in Australia, both localized trust and generalized trust are negatively affected by linguistic and ethnical heterogeneity, with linguistic heterogeneity having a negative impact on localized trust for both natives and immigrants, and on generalized trust only for immigrants (Leigh, 2006). However, You (2012) holds another opinion about whether heterogeneity per se does matter that much for social trust as shown in previous empirical research. You (2012, p. 702) argues that “fairness of political and legal institutions affects people’s incentives for trust and trustworthiness and that individuals’ perceptions of fairness of the society directly affects their trust in other people”. You (2012) considers fairness in three aspects, namely distributive, procedural and formal justice, respectively taking income distribution, democracy and corruption as a proxy. You (2012) examines the impact of fairness and heterogeneity (in terms of, such as, income, ethnic and cultural diversity) on social trust in virtue of a multi-level hierarchical logit model (individual person level and country level) across 80 countries and concludes that the three indicators of fairness are significantly positively associated with social trust and matters more than homogeneity or heterogeneity per se for social trust. In addition, in empirical research, heterogeneity is usually calculated like Herfindahl index.
The embodied distrust related to heterogeneity is in fact the so-called group trust, which is a kind of generalized particular trust in essence, because it distinguishes people into different big categories.1 The reason for heterogeneity to damage trust could be different between “during interactions” and “with no previous interactions”. During interactions, it may be different acceptable values and behavior in different culture that result in distrust. Without any interaction before, it may be the stereotype of heterogeneous others that results in distrust. Moreover, if no trust-damaging things are done according to heterogeneity, distrust reflecting heterogeneity will also diminish, or even not present.
Therefore, it is possible that racial, ethnic or linguistic heterogeneity is not going to damage trust. There are so many factors in human society that could find their way to influence social trust. However, many therein may not be relatively substantial ones, and other factors could be closer and have a more direct and certain influence. A key fact to remember is that whether heterogeneity (such as, ethnic or linguistic) within a country has an impact on trust and to which degree are determined by the degree of integration of an investigated area and the attitude that people there have to diversity. Where people relatively embrace diversity, or have more tolerance to heterogeneity, and live in harmony with dissimilar others, heterogeneity would not have a significant effect on interpersonal trust. People living in countries traditionally composited with different ethnic groups may not care much about different ethnics since different ethnic groups have integrated well along history and
1 For the discussion of group trust, see Chapter 1.

Trust and Development: The Deep Structure of Institutions-Building and Socio-Economic Performance
98
ethnic differences have become quite ordinary in life. The reason why linguistic heterogeneity could negatively affect trust is not difficult to understand. Besides any possible implicit differences in cultural habits and mindsets behind linguistic heterogeneity, difficulties in understanding other languages could result in a substantial reduction in possible information received. When people cannot infer others’ intention and are swayed by negative stereotypes, trust would be low without doubt. Anyway, in a word, fairly treating others is always an effective way for heterogeneity not to damage interpersonal trust.
Third, there is a perception that social trust in big cities seems to be lower than that in smaller towns or villages in rural areas. For example, Putnam (2000, pp. 138-139) notices that inhabitants in big cities express less social trust than those living in small towns. Glaeser, Henderson and Inman (2000) find that the social trust, as well as fairness perception, in big cities of the U.S. with population more than 1 million is far lower than that in cities below that size. What big cities face in many aspects are like what large population countries do. Relative to small towns or villages in rural areas, big cities obviously have a much larger and denser population. Therefore, an ordinary person relatively has a much lower percentage of people (s)he knows well in big cities and a higher percentage of strangers around. Besides, population in big cities is always more diverse, in terms of, such as, wealth, occupations, identities, social classes, etc., which is in the same vein as countries with a larger population. More importantly, big cities, which are always of economic, political and / or traffic importance, always attract more resources and more people from different places to concentrate there and display relatively high mobility. Additionally, continued high speed development and a larger population create further stresses for the provision of public services, which may result in severe competition for resources like public education and health care. The course and consequences of competing for limited, insufficient resources may result in distributive unfairness.
One may have such an experience that when going to a big city, especially a strange one, (s)he often keeps a warier eye on the behavior of others nearby and becomes more suspicious when dealing with others. But this worry is not out of no reason since economically developed and population-dense big cities are also attractive to the bad. They prefer big cities since, often, big cities are more likely to create naturally good conditions and opportunities for them to intentionally and deliberately conduct trust-damaging behavior, such as, pickpockets, robs, frauds, etc., partly due to the higher density and mobility of population in big cities. In economics, scholars would explain this as one-shot games and lacking of reputation chains. However, it does not mean that information cannot work. For example, personal or told experiences or news reports could all spread the dark side of society. This involves how people get familiar with and recognize particular untrustworthy behavior, rather than particular untrustworthy persons, which may result in adverse consequences. Moreover, with the development of media and the Internet, it gets more convenient for people to acquire information, of both good and bad phenomena existing in society. Strengthening public security and fighting to crimes are necessary measures. However, the police force is also usually much stronger in big cities within a country.
In addition, in countries with some religious tradition, religion has ever played a crucial role in shaping their people’s mind and values. Certainly, it cannot be excluded the possibility that at the beginning of the formation of new religious branches, some pioneers explain some religious classic

Chapter 2: Some Socio-Economic Aspects of China and Scandinavia
99
or propose some claims out of some appeals in order to rationalize some aspects that are disapproved of by the mainstream religious branch. It can be said that ideas formed under the influence of religion before have already been integrated into and become an inseparable part of their culture, and reflect some aspects of their national character and ethos. In addition, even within the same religion, people embracing different branches could present dissimilar characters. In his disputable monograph, Weber ([1930] 2005) elaborates on the influence of the religious ideas of Luther’s conception of the calling and worldly asceticism of Protestantism after the Reformation, especially embodied in Calvinism, on the development of capitalism spirits. More recent scholars also have noticed the different influences of different religions or religious branches. For example, inspired by Putnam, Leonardi and Nanetti (1993), La Porta et al (1997) consider Catholic, Eastern Orthodox and Muslim as hierarchical religions and empirically demonstrate that hierarchical religions are significantly negatively associated with general trust. However, You (2012) finds that the previous significantly positive association of Protestants with social trust relative to no-religion people becomes insignificantly negative after adding into model variables such as “ethnic minority status, political trust, voluntary organizational membership, and two variables that reflect perceptions of fairness” (p. 714), which indicates no advantage of Protestants in social trust. In addition, You (2012) also shows that Catholics has a significant negative association with social trust, and Orthodox has an insignificant negative association with social trust after adding those variables aforementioned.
2.2.2 Population size and composition of China and Scandinavia
Denmark, Norway and Sweden are not only geographically close, but also culturally similar. All the three countries belong to both Scandinavian and Nordic countries.1 Therein, Denmark and Sweden are also members of the European Union, but not members of the Euro Area, while Norway is neither a member of the European Union nor the Eurozone. Additionally, they all have Protestant tradition.
Danish population in data
Denmark has 43,560 square kilometers excluding Greenland and the Faroe Islands, and it adopts constitutional monarchy with parliamentary democracy as its form of government. (Denmark.dk, no date b) From January 1st, 2000 to January 1st, 2017, Denmark saw a continuous increase in its population size from about 5.33 million to about 5.75 million (see Table 2.1). At the beginning of the third quarter of 2017, the population size of Denmark reaches 5,760,696, which is about 15 thousand more than the beginning of the fourth quarter of 20162 (Statistics Denmark, 2017b; see also Table 2.2). Therein, at the beginning of the third quarter of 2017, about 13.06% of the Danish population are immigrants or descendants from other countries (see Table 2.2). The contemporary religion in Denmark got influenced by the Protestant Reformation between the 16th and 17th century when the Evangelical Lutheran Church became the National Church of Denmark. Nowadays, Protestants remain the predominant religious group in Denmark with a proportion more than 75% in the Danish population, despite the proportion of members of the National Church has seen a fall from 80.37% in 2011 to 75.87% in 2017 (See also Table 2.3).
1 “The Nordic Region consists of Denmark, Norway, Sweden, Finland, and Iceland, as well as the Faroe Islands, Greenland, and Åland.” (Nordic Co-operation, no date a, para. 1) 2 Population at the first day of the quarter.

Trust and Development: The Deep Structure of Institutions-Building and Socio-Economic Performance
100
Table 2.1 Population size of Denmark, Norway and Sweden from 2000 to 2017. Denmark Norway Sweden
2000 5,330,020 4,478,497 8,861,426 2001 5,349,212 4,503,436 8,882,792 2002 5,368,354 4,524,066 8,909,128 2003 5,383,507 4,552,252 8,940,788 2004 5,397,640 4,577,457 8,975,670 2005 5,411,405 4,606,363 9,011,392 2006 5,427,459 4,640,219 9,047,752 2007 5,447,084 4,681,134 9,113,257 2008 5,475,791 4,737,171 9,182,927 2009 5,511,451 4,799,252 9,256,347 2010 5,534,738 4,858,199 9,340,682 2011 5,560,628 4,920,305 9,415,570 2012 5,580,516 4,985,870 9,482,855 2013 5,602,628 5,051,275 9,555,893 2014 5,627,235 5,107,970 9,644,864 2015 5,659,715 5,166,493 9,747,355 2016 5,707,251 5,213,985 9,851,017 2017 5,748,769 5,258,317 9,995,153
Note: Population on January 1st of each year. Data source: Eurostat.
Table 2.2 Population composition of Denmark.1 2016 Q4 2017 Q1 2017 Q2 2017 Q3 Persons of Danish origin 5,007,524 5,007,197 5,005,623 5,008,076 Immigrants from western countries 238,564 237,707 241,289 239,528 Immigrants from non-western countries 330,388 332,874 336,351 338,214 Descendants from western countries 26,670 27,138 27,618 28,078 Descendants from non-western countries 142,380 143,843 145,289 146,798 Total 5,745,526 5,748,769 5,756,170 5,760,694
Note: Population at the first day of each quarter. Data source: Statistics Denmark (2017a; 2017b).
Table 2.3 Membership of the National Church of Denmark from 2011 to 2017. 2011 2012 2013 2014 2015 2016 2017
Member of National Church 4469109 4454466 4430643 4413825 4400754 4387571 4361518
Total population 5560628 5580516 5602628 5627235 5659715 5707251 5748769
% protestants 80.3706 79.8218 79.0815 78.4368 77.7558 76.8771 75.8687
Notes: Data of member of national church and total population is the number on January 1st of each year. Row “% protestants” is author’s own calculation.
1 The data of the total number of the Danish population can be found at “Population and Population Projections” on Statistics Denmark (2017b). The data of Denmark’s immigrants can be found at “Immigrants and Their Descendants” on Statistics Denmark (2017a). The data of Danish origin can also be calculated via the two links in the two references via customizing data.

Chapter 2: Some Socio-Economic Aspects of China and Scandinavia
101
Data source: Statistics Denmark.
Norwegian population in data
Norway is a typical county with a relatively large territory and a relatively small population size. It has 324,000 square kilometers (Statistics Norway, 2016, p. 42). According to data from Eurostat, its population has grown steadily from 4,478,497 on January 1st, 2000 to 5,258,317 to January 1st, 2017, increasing about 17.41% (see Table 2.1). This figure has increased to 5,277,762 at the end of the 2nd quarter of 2017 (Statistics Norway, 2017f). Most people in Norway lived in urban settlements as of January 1st, 2016, representing as high as nearly 81% of the total population of Norway (Statistics Norway, ©no date). In addition, nearly 1/3 of the inhabitants of Norway concentrate in Oslo, Bergen, Stavanger/Sandnes, Trondheim and Drammen which are the five largest urban settlements in Norway (Statistics Norway, ©no date). There are a total of 883,751 immigrants and Norwegian-born to immigrants parents as of January 1st, 2017, accounting for 16.8% of the total population of Norway (Statistics Norway, 2017c). Therein, 724,987 are immigrants and 158,764 are Norwegian-born to immigrant parents (Statistics Norway, 2017c). As of January 1st, 2017, 217,241 persons of the Norwegian population are with refugee background, accounting for 30.0% of all immigrants to Norway and 4.1% of the whole Norwegian population (Statistics Norway, 2017e). The scale of internal migration between counties is 145,232 as of 2016, the internal migration within counties is 118,563, and internal migration between municipalities is 241,362 (Statistics Norway, 2017d). A total of 3,758,070 people are members of the Church of Norway in 2016 excluding emigrated members (Statistics Norway, 2017b), decreasing 1.09% compared with 2015 and 6.19% compared with 2011 respectively, accounting for 72.08% of the total population of Norway on January 1st, 2016. At the beginning of 2016, the second biggest religion in Norway is Christianity, representing 349,083 people and about 6.70% of its whole population (Statistics Norway, 2017g). The third biggest religion is Islam, accounting for about 2.84% of the Norwegian population at the beginning of 2016 (Statistics Norway, 2017g).
Swedish population in data
From January 1st, 2000 to January 1st, 2017, the Swedish population increases from 8,861,426 to 9,995,153 (see Table 2.1). In July 2017, the Swedish population has increased to 10,065,389 (Statistics Sweden, ©2017). From 2011 to 2016, more and more people immigrated in Sweden. (See Table 2.4) Between January 1st, 2015 and January 1st, 2016, 163,005 people immigrated into Sweden and 45,878 people emigrated from Sweden (Statistics Sweden, 2017b; see also Table 2.4) As to January 1st, 2016, the domestic migration within Sweden is 1,405,594 (Statistics Sweden, 2017a), accounting for 14.27% of the total Swedish population at that time.
Table 2.4 Immigrations and emigration of Sweden, 2011-2016. 2011 2012 2013 2014 2015 2016 Immigrations 96 467 103 059 115 845 126 966 134 240 163 005 Emigrations 51 179 51 747 50 715 51 237 55 830 45 878
Note: Data is that on the first day of a year. Source: Statistics Sweden.
Chinese population in data

Trust and Development: The Deep Structure of Institutions-Building and Socio-Economic Performance
102
Table 2.5 presents data of the population of the Chinese mainland, including composition by gender and by residence, from which we can see that by the end of 2016, Chinese population reaches about 1.38271 billion. The proportion of male in the total population decreases annually from 51.27% in 2010 to 51.21% in 2016. The proportion of urban residences in the total population increases to 57.35% in 2016 from 49.95% in 2010.
China is a unified multi-ethnic country with 56 ethnic groups, with Han people being the ethnic majority and the other groups being ethnic minorities. According to the Sixth National Population Census of China in 2010, Han people accounts for 91.51% of the total population of the mainland China (National Bureau of Statistics of the People’s Republic of China, 2011a). The largest five ethnic minorities in the 2010 Census are Zhuang, Hui, Manchu, Uyghur and Miao, respectively.
In addition, most Chinese do not have religious faith. According to the Chinese General Social Survey (CGSS) 2015, 87.88% of the 10,968 Chinese respondents say that they have no religious faith, and only 12.12% claim they have.

Chapter 2: Some Socio-Economic Aspects of China and Scandinavia
103
Table 2.5 Chinese population and its composition, 2010 – 2016.
(10000 persons)
Year Total
population (year-end)
Male % Male Female % Female Urban % Urban Rural % Rural
2010 134091 68748 51.27 65343 48.73 66978 49.95 67113 50.05 2011 134735 69068 51.26 65667 48.74 69079 51.27 65656 48.73 2012 135404 69395 51.25 66009 48.75 71182 52.57 64222 47.43 2013 136072 69728 51.24 66344 48.76 73111 53.73 62961 46.27 2014 136782 70079 51.23 66703 48.77 74916 54.77 61866 45.23 2015 137462 70414 51.22 67048 48.78 77116 56.10 60346 43.90 2016 138271 70815 51.21 67456 48.79 79298 57.35 58973 42.65
Notes: Population at year-end refers to population at 24 o’clock on December 31th of each year. In addition, the total population of each year in this table does not cover the population of Hong Kong Special Administrative Region, Macau Special Administration Region and Taiwan province and overseas Chinese. In addition, “for the year […] 2000 is the census year estimates; the rest of the data covered in” this table has “been estimated on the basis of the annual national sample surveys of population. […] Total population and population by sex include the military personnel of the Chinese People’s Liberation Army, the military personnel are classified as urban population in the item of population by residence” (National Bureau of Statistics of the People’s Republic of China, 2017, p. 31). Source: China Statistical Yearbook – 2017 (National Bureau of Statistics of the People’s Republic of China, 2017, p. 31)

Trust and Development: The Deep Structure of Institutions-Building and Socio-Economic Performance
104
2.2.3 Social structure: China vs. the West
(i) Liang Shuming1 (1949): No group life in China vs. prevalent group life in the West
Liang ([1949] 2005, p. 43) compares the social structure of a society to the skeleton of its whole culture and believes that two regions with similar social structures in a period tend to have similar cultures. He shares his insight into the contrasts between the West and China in the aspect of social structure: An obvious distinction between the two is that the former relatively pays more attention to group life and individual persons, while the latter attaches more importance on families (Liang, [1949] 2005, Chapter 3-5). In addition, he also gives a figure which compares this difference in the social life between the West and China, which is presented in Figure 2.1 after being translated from Chinese into English (Liang, [1949] 2005, p. 71). In fact, China is lack of group life, which is in sharp contrast to the prevalent group life in the Western societies (Liang, [1949] 2005, Chapter 3-4).
Issues centering on the relation between groups and individual persons has been a recurrent theme in the debates for a long time in the Western history, as well as in every aspect of their modern social and economic life (e.g., Liang, [1949] 2005, pp. 43, 59). It can be concluded from the research of Liang ([1949] 2005) that the long existence of debates or struggles on these kinds of issues in the Western societies actually has its causes in history and social structure. To a large extent, it can be said that the life of the Westerners is not separable from various groups. In terms of group size, Liang ([1949] 2005, p. 49) says that religion may have ever played a remarkable role in the transition of small groups to large ones that transcend families in the West, in spite of other factors. – That is why Liang ([1949] 2005, pp. 46-48) regards religion as the watershed of Chinese culture and Western culture. It is the different influences of the religious tradition of the West and the Confucian tradition which is not religious of China that make the West and China diverge in group life (Liang, [1949] 2005, pp. 46-48). Most, if not all, groups in the West have clear and well-defined boundaries, with in-group members enjoying in-group rights over those outside the group – that is why a group is a group – which is quite distinct from China where group life, in the sense of the West, does not play a role as important as families (e.g., Liang, [1949] 2005, p. 51).
1 Chinese tradition of human names puts family name / surname first, ahead of given names, which is totally different from most western countries where the surname is put last. Since both Liang Shuming (i.e., 梁漱溟 in Chinese) and Fei Xiaotong (i.e., 费孝通 in Chinese) below are Chinese, Liang and Fei are their family name respectively, rather than Shuming and Xiaotong. Their names are temporarily written following Chinese tradition in this section, and will change to English style in the references.

Chapter 2: Some Socio-Economic Aspects of China and Scandinavia
105
Figure 2.1 One of the differences between the social life of the West and China. Notes: Author’s own translation from Chinese into English, including the original notes: “1. Font size indicates relative importance; 2. Arrows indicate direct inter-relationship; 3. Dotted lines indicate that a relationship is not very clear.” Source: Liang ([1949] 2005, p. 71).
(ii) Fei Xiaotong (1947): Cha xu ge ju of Chinese society vs. tuan ti ge ju of the Western societies
Fei ([1947] 2017) also insightfully notices the distinction between the social structure of China and that of the West which shows the different forms of social organizations between them. Similar to Liang, the pattern which is composed of groups presented in the Western societies, which is in stark contrast to that of China, catches Fei’s attention. In his famous book 乡土中国 (pinyin: xiāng tǔ zhōng guó), which was published as a book based on his publication of a series of essays and of which the book title was translated from Chinese into English as From the Soil: The Foundations of Chinese Society by Hamilton and Wang (Fei, [1947] 1992), Fei ([1947] 2017) depicts the social structure of China as 差序格局 (pinyin: chā xù gé jú), while describing that of the West as 团体格
局 (pinyin: tuán tǐ gé jú). 格局 (pinyin: gé jú) means “pattern”; in 差序 (pinyin: chā xù), the first character, 差 (pinyin: chā), emphasizes difference and the second, 序 (pinyin: xù), order/sequence; 团体 (pinyin: tuán tǐ) means “groups” (see also, Fei, [1947] 1992, p. 19). In that book, Fei ([1947] 2017) uses two metaphors to explain the two concepts, 差序格局 (cha xu ge ju) and 团体格局 (tuan ti ge ju), vividly. When explains tuan ti ge ju in the West, he says:
Western societies are somewhat like the way we collect rice straw to use to cook our food. After harvest, the rice straw is bound into small bundles; several bundles are bound into larger bundles; and these are then stacked together so that they can be carried on shoulder poles. Each piece of straw belongs in a small bundle, which in turn belongs in a larger bundle, which in (turn) makes up a stack. The separate straws, the separate bundles, and finally the separate stacks all fit together to make up the whole haystack. In this way, the separately bound bundles can be stacked in an orderly way. (Fei, [1947] 1992, p. 61)1
In western society, these separate units are organizations. By making an analogy between organizations in Western societies and the composition of haystacks, I want to indicate that in Western society individuals form organizations. Each organization has its own boundaries, which clearly define those people who are members and whose
1 For the original Chinese, see, Fei ([1947] 2017, pp. 26-27).
The West China
Group
Individual person Individual person
Group
Family Family

Trust and Development: The Deep Structure of Institutions-Building and Socio-Economic Performance
106
who are not. (Fei, [1947] 1992, pp. 61-62)1
In one respect, my analogy is not too appropriate. An individual may join several organizations, but it is impossible for a straw to be in several bundles at the same time. That is the difference between people and straws. (Fei, [1947] 1992, p. 62)2
When talking about cha xu ge ju in Chinese society, he says:
[...] In my opinion, the ambiguity indicates the difference between our (Chinese) social structure and that of the West. Our pattern is not like distinct bundles of straws. Rather, it is like the circles that appear on the surface of a lake when a rock is thrown into it. Every one stands at the center of the circles produced by his or her own social influence. Everyone’s circles are interrelated. One touches different circles at different times and places. (Fei, [1947] 1992, pp. 62-63)3
Social relationships in China possess a self-centered quality. Like the ripples formed form a stone thrown into a lake, each circle spreading out from the center becomes more distant and at the same time more insignificant. With this pattern, we are faced with the basic characteristic of Chinese social structure […]. (Fei, [1947] 1992, p. 65)4
According to Fei ([1947] 1992, p. 70), cha xu ge ju, which is the fundamental and basic structure of Chinese rural society, is “a network composed of each individual’s personal connections” where individual social relationships are “an accumulation of personal connections”. On contrast, in the Western tuan ti ge ju, “personal relationships depend on a common structure. People attach themselves to a preexisting structure and then, through that structure, form personal relationships.” (Fei, [1947] 1992, p. 71) Note that Hamilton and Wang translated Fei’s (1947) concept of cha xu ge ju as “the differential mode of association” and tuan ti ge ju as “the organizational mode of association” (Fei, [1947] 1992).
Although the work of Liang (1949) and Fei (1947) were done about 70 years ago, they still have significant referential value and provide enlightenment nowadays, and help us understand better the Chinese society and the Western ones. Many differences between modern China and the modern West are probably due to their distinct fundamental structures, development paths and culture that diverged a long ago, rather than simply being attributed to “developed” or “undeveloped”, or “fast progress” or “slowly progress” (see also, Liang, [1921] 1999, pp. 71-72). The Westerners attach themselves to preexisting groups, while Chinese attach to preexisting relationships; In the West, the boundary of various groups that one belongs to is clearly defined, while in China, each “ripple” of one’s relationship network is elastic. – These are both what Liang (1949) and Fei (1947) convey to us. In consideration of the quite different social structure presented in China and the West, it becomes obvious that using the thinking way of Western groups to explain some Chinese phenomenon is not appropriate.
We can understand Fei’s (1947) “ripples” metaphor for cha xu ge ju like this, although it is rather
1 For the original Chinese, see, Fei ([1947] 2017, p. 27). 2 For the original Chinese, see, Fei ([1947] 2017, p. 27). 3 For the original Chinese, see, Fei ([1947] 2017, p. 28). 4 For the original Chinese, see, Fei ([1947] 2017, p. 30).

Chapter 2: Some Socio-Economic Aspects of China and Scandinavia
107
intuitive already: each person attaches different degrees of importance on his/her personal relationships with others. The importance that a person subjectively attaches to others gradually descents along his/her ego centric network from the innermost circle to the outermost. In other words, any radius at the same time presents depth or thickness of a relationship. The smallest circle shrinks to a point of a person in the West, while most of the time, it at least contains a couple of people for Chinese. Usually, in the eyes of Chinese, the innermost circle is family. By the way, as what Fei ([1947] 2017, pp. 27-28) figured out, the character “family” in Chinese has elasticity to some extent.
(iii) Attachment of appropriate emotions, attitudes and behavioral styles to preexisting relationships
A certain type of interpersonal relationships contains not only the relationship itself, but also involves some kind of appropriate emotions, attitudes or behavioral styles that should (admittedly to a large degree and further willingly) be associated with it. I call this phenomenon existing in interpersonal interactions the emotional and behavioral attachment of interpersonal relationships. People may say that Chinese behave according to preexisting relationships. This is because Chinese attach certain emotion, attitude or behavioral style to certain relationship, and preexisting relationships to a large degree determine how to treat the person on the other end of a relationship and how to behave or react in some concrete situation or context where that person is involved. This kind of emotion, attitude or behavior is somehow morally compulsive, but not in an absolute sense for outsiders. Take how we should treat our parents and our friends as two concrete examples. In the former relationship, one should have filial piety or filial respect to his / her parents. In the latter relationship, if two persons are good friends, most of the time one would like to try his / her best to help the other, although it may cause him / her trouble or harm his / her own benefits. Put another way, in relatively close relationships, one would be more willing to sacrifice for the other. Someone would say that it is because one expects that his / her friend will do something reciprocally in future that (s)he helps his / her friend. Indeed, people often reciprocate, as a way of conforming to this informal institution of interpersonal interactions. However, the norm of reciprocity should not be intentionally utilized for taking advantage of others afterwards. Intentionally giving or providing something to a certain person in order to make that person not able to refuse subsequent requirements is not approved by people. Obviously, this is not a real friendship and this fake “friendship” cannot be maintained long, nor can it be turned into a real one.
2.2.4 Family structure: Denmark vs. China
Families are basic and important social units. Families are the first place where new-born babies get socialized. Thus, family structure reflects the most intimate and closest social network of individuals. Moreover, family members are an important source of individual social capital. What we focus on here about family structure is mainly number of siblings. The more siblings one has, the more social capital (s)he may occupy, ceteris paribus.
Table 2.6 provides data of number of 0-to-17-year-old children in Denmark with different number of siblings from 2008 to 2017. It can be seen that most Danish children have at least one sibling. The percentage of Danish children with at least 1 sibling in total is between 78.97% and 79.55% from January 1st, 2008 to January 1st, 2017, and with at least 2 siblings, the percentage accounts for between 30.18% and 30.98% (see Table 2.6). Table 2.7 presents comparison data in 2017 and 2008 0-to-17-year-old Danish children with different number of siblings from different type of family. In

Trust and Development: The Deep Structure of Institutions-Building and Socio-Economic Performance
108
both years (namely, 2017 and 2008), children with 1 sibling and both parents constitute the largest proportion, reaching about 37.44% in 2017 and 37.25% in 2008, respectively.

Chapter 2: Some Socio-Economic Aspects of China and Scandinavia
109
Table 2.6 Number of children 0-17 years old with siblings of Denmark, 2008-2017. 2008 2009 2010 2011 2012 2013 2014 2015 2016 2017 No Siblings 248616 249594 251160 250309 249392 247135 245226 244486 245466 247116 1 sibling 590653 590569 589511 587880 584907 579828 574085 570931 569632 569041 2 siblings 281543 283272 283403 283625 280896 278318 274879 272411 270831 271156 3 siblings 69680 69520 68024 66496 65288 63679 62513 61416 60851 60388 4 siblings 17007 16414 16109 15905 15006 14644 14158 13856 13982 13825 5 siblings 5211 5046 4761 4408 4452 4501 4247 4387 4145 4185 6 siblings 1684 1818 1589 1604 1610 1442 1541 1521 1541 1495 7 siblings or more 1090 972 953 805 738 754 775 886 1012 1016 total 1215484 1217205 1215510 1211032 1202289 1190301 1177424 1169894 1167460 1168222 siblings >= 1 966868 967611 964350 960723 952897 943166 932198 925408 921994 921106 % siblings >= 1 79.55 79.49 79.34 79.33 79.26 79.24 79.17 79.10 78.97 78.85 siblings >= 2 376215 377042 374839 372843 367990 363338 358113 354477 352362 352065 % siblings >= 2 30.95 30.98 30.84 30.79 30.61 30.52 30.41 30.30 30.18 30.14
Note: Data is that on January 1st of each year. Source: Statistics Denmark.
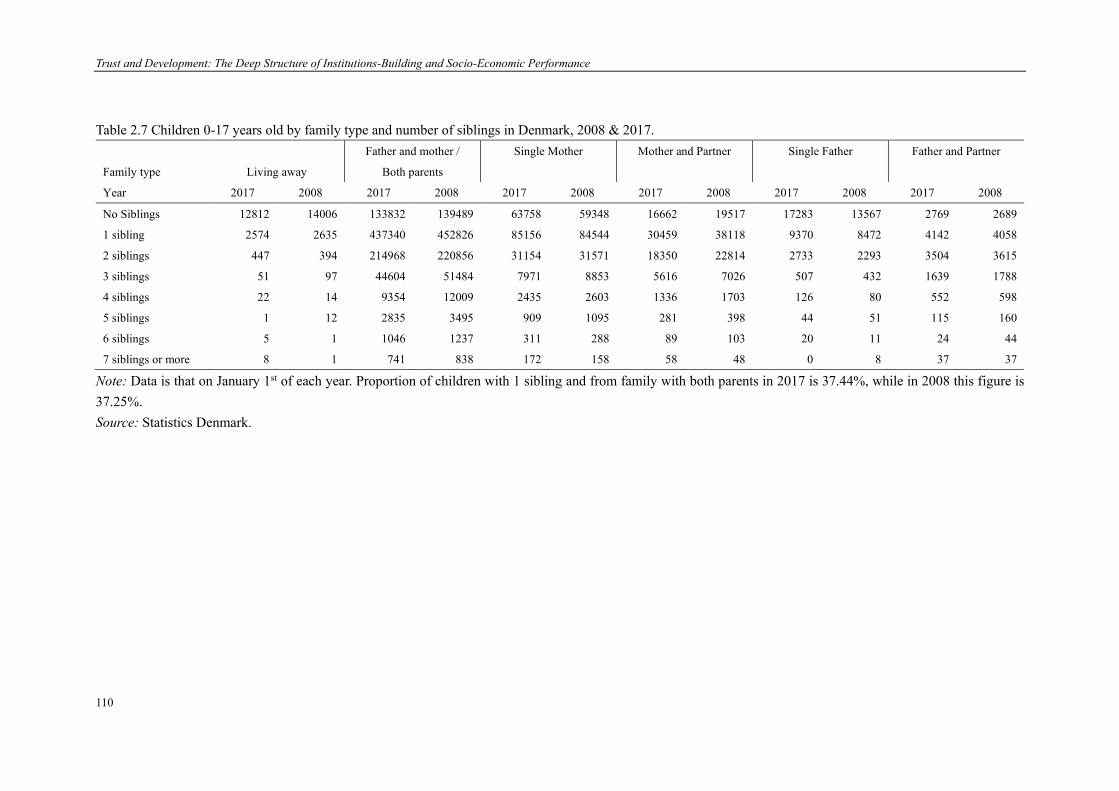
Trust and Development: The Deep Structure of Institutions-Building and Socio-Economic Performance
110
Table 2.7 Children 0-17 years old by family type and number of siblings in Denmark, 2008 & 2017.
Family type Living away
Father and mother /
Both parents
Single Mother
Mother and Partner
Single Father
Father and Partner
Year 2017 2008 2017 2008 2017 2008 2017 2008 2017 2008 2017 2008
No Siblings 12812 14006 133832 139489 63758 59348 16662 19517 17283 13567 2769 2689
1 sibling 2574 2635 437340 452826 85156 84544 30459 38118 9370 8472 4142 4058
2 siblings 447 394 214968 220856 31154 31571 18350 22814 2733 2293 3504 3615
3 siblings 51 97 44604 51484 7971 8853 5616 7026 507 432 1639 1788
4 siblings 22 14 9354 12009 2435 2603 1336 1703 126 80 552 598
5 siblings 1 12 2835 3495 909 1095 281 398 44 51 115 160
6 siblings 5 1 1046 1237 311 288 89 103 20 11 24 44
7 siblings or more 8 1 741 838 172 158 58 48 0 8 37 37
Note: Data is that on January 1st of each year. Proportion of children with 1 sibling and from family with both parents in 2017 is 37.44%, while in 2008 this figure is 37.25%. Source: Statistics Denmark.

Chapter 2: Some Socio-Economic Aspects of China and Scandinavia
111
Contemporary China has a different family structure from Denmark. Besides some exempt special situations (such as many ethnic minorities or remarriage), generally, those who are born in 1980s and 1990s probably have no sibling. This is because of the gradual implementation of family planning, mainly in the form of one-child policy, in China since 1970s which is intended to ease the pressure on the economic situation at that time and the economic growth from high population growth rate, and to coordinate the development of population and socio-economic resources. Below introduces the general change of family planning in China in brief without specifying much about formally allowed special situations.
On July 8th, 1971, late marriage and family planning were highly advocated in a report on family planning (see, People’s Republic of China. State Council, 1971). In 1978, family planning was written into the 1978 Constitution (People.cn, 2015). On September 25th, 1980, one-child policy, which advocates that a couple gives birth to only one child, was formally issued and implemented (People.cn, 2015). In September, 1982, family planning was issued as a basic state policy (People.cn, 2015). On December 29th, 2001, the Law of Population and Family Planning of P.R. China was issued (People’s Republic of China. Standing Committee of the National People’s Congress, 2001). However, as China steps into an aged society and the population dividends in China decrease, family planning has gradually shifted from one-child policy to universal two-child policy from 2002 on. From 2002, two-child fertility policy was gradually implemented for couples where both the husband and the wife are from a single-child family. In 2013, two-child fertility policy was further relaxed for couples where either the husband or the wife is from a single-child family. In 2015, universal two-child policy came into effect.
In 1990, when the fourth National Population Census was conducted, the average number of family members of households was 3.96 (National Bureau of Statistics of the People’s Republic of China, 2001a). In 2000, when the fifth National Population Census was carried out, that number decreased to 3.44 (National Bureau of Statistics of the People’s Republic of China, 2001b). When the sixth National Population Census was performed in 2010, that number further fell to 3.10 (National Bureau of Statistics of the People’s Republic of China, 2011b). That series of numbers roughly reflects the change in the family structure in China under the family planning for several decades in profile.
However, although the current family planning policy (universal two-child policy) advocates giving birth to two children, the willingness of many married childbearing women, especially of ordinary financial situation (namely, not very rich), to give birth to a second child is not strong, quite reluctant, or even resistant. Several realistic considerations are behind this kind of attitude. Note that these considerations may be not only behind the negative attitude to a second child, but also to the first one:
Raising costs of a child In China, especially in big cities, costs of raising a child could be quite high, for which a couple may feel that their current and / or visible future’s financial condition of family may not be able to support another child. The first financial pressure for this may come from daily costs. Besides other daily costs, infant milk powder that young couples believe of good quality is probably expensive. Additionally, some families may feel necessary to employ an experienced maternity servant, which is not cheap, either. The second may be from education. High-quality education resources in China are relatively scare, and their distribution is quite unbalanced

Trust and Development: The Deep Structure of Institutions-Building and Socio-Economic Performance
112
nationwide. In order for a child not to be left behind by or to be more excellent than peers (put another way, to be more competitive) and further to have a good future, a lot of money needs to put into support for a child’s education, such as engaging excellent tutors or participating courses of private educational companies, attending various interest-oriented classes and buying reference books of all subjects and all equipment that may facilitate learning, which an ordinary family could probably not afford all.
Caring for aged parents In China, traditionally, parents and children are mutually supported and assisted during their lifetime. When a child is young, parents raise him / her; and when parents get old, adult children care for them. Caring for aged parents is out of both love and filial piety, and is traditionally considered as a virtue and humanity in China. What is more, adult children are quite willing to care for their aged parents in general. The Chinese General Social Survey (CGSS) 2015 asks a question about caring for aged parents that “Who do you think should be mainly responsible for caring for aged people who have son(s) and / or daughter(s)?”1 with four options, 1) the government, 2) the son(s) and / or daughter(s), 3) the aged people themselves, and 4) the government, son(s)/daughter(s) and the aged people themselves should be equally responsible (see, CGSS 2015, Question A41). Therein, 49.36% of the 10,968 Chinese respondents, the largest proportion, choose “son(s) and /daughter(s)”, 33.93% think that the three parties should be equally responsible, 9.51% say that “the government” should, and 6.32% choose “the aged people themselves”, besides 0.88% did not give an answer. The traditional idea of caring for aged parents means that the costs for this are mainly digested within family. However, the family planning policy during the recent decades objectively puts more pressures on adult children to care for their aging or aged parents. As said before, people born in 1980s and 1990s have no sibling in general (special regulations excluded). This means that a childbearing couple born during that two decades have 5 people to support, 4 aged parents (two of the husband and the other two of the wife) and a child, which would probably discourage young couples of an ordinary, not rich family from raising a second child.
Employment discrimination Many private companies may not want to employ females who plan to get married or pregnant at the early stage of the first term of labor contact (say, three years), although the types of work and jobs are not naturally unsuited to females, since otherwise, it would impose the so-called extra labor costs or possible interrupts on the daily operation of the companies due to female employees’ various leaves, such as the maternity leave. In extremely cases, some companies may even take some measures to compel pregnant female employees to “voluntarily” resign because they would not actually work in a period and may not have much passion in work after giving birth or have to spend more energy and time in caring for their babies. Thus, as the implementation of the universal two-child policy in China, employers have shifted to prefer female job-seekers who already have two children or who have claimed not to give birth to a child within one or two years, only in terms of female job-seekers, having further improved their “standard” or doorsill in employing females. Therefore, the physiological structure of females for giving birth unfortunately becomes a disadvantage in job-searching and has a negative impact on their career development. Fortunately, China has realized the seriousness of this problem and taken action to protest the rights of female job-seekers in job-searching.
Therefore, in terms of policy-making, it may not be able to achieve the expected effect of protecting
1 Author’s own translation from Chinese to English.

Chapter 2: Some Socio-Economic Aspects of China and Scandinavia
113
the rights and interests of females in job-searching if measures are taken only from the female side; it would be more effective if something can be done from the male side as well, because even though more welfare is provided to female employees, female employees could not actually benefit from it if they are excluded from the consideration of companies or if they compromise themselves not to have a baby in order to get a job, which would lead to the welfare for female employees in vain. Those welfare policies supplied from the female side are in an absolute sense to caring about females, while those from the male side could relatively reduce the difference caused by gender. So, the key point is to level off the supposed relative advantage of male employees relative to female ones. For example, a possible way could be to somehow equalize the marriage leave and maternity / paternity leave between male and female employees, and to establish more child-care centers. This could expectedly reduce gender discrimination in job-searching. However, when taken into reality, the interest of different parties, such as, employees, companies and the country, should be considered, coordinated and balanced comprehensively. But the basic idea of that train of thought could be effective.
It is not hard to discover that those issues aforementioned mainly worry those who have pressure from money, career, time or energy; the rich much more would like to and actually give birth to more children. In order to improve the current situation, much could be done from the level of policy supply, based on economic development.
2.2.5 Membership: China vs. Scandinavia
Membership reflects relatively formal individual social network. Moreover, civil participation, such as voluntary membership, is also treated as a measure of social capital of a society (e.g., Putnam, 2000). Scholars draw different conclusions about whether membership has an impact on trust. For example, Knack and Keefer (1997, p. 1251) show that formal memberships “is not associated with trust or with improved economic performance”. On contrast, You (2012) shows that voluntary membership is significantly positively associated with general trust, although it is not the main purpose of his paper.
Table 2.8, Table 2.9 and Table 2.10 present the membership of China, Denmark, Norway and Sweden in surveys. They may reflect the group life, and further, the social structure to some extent, of these four countries. Therein, the first two tables are about membership, while, to be more specific, the third table is about active or inactive membership. The data is from the European Values Study (EVS) and the World Values Survey (WVS).
I will not elaborate on these tables. (Just note that, for the correspondence relation between EVS waves and WVS waves, see Table 2.24.) However, by simply observing these tables (Table 2.8, Table 2.9 and Table 2.10), it is not difficult to discover that, by and large, the Chinese interviewees are less apt to participate in those various groups compared with the other three countries. Moreover, it can also be inferred from these three tables that the Danish, Norwegian and Swedish interviewees are more apt to take part in more than one group relative to the Chinese ones. This inference is not groundless. The reason is that, as we can see, on the one hand, most proportions of membership in Denmark, Norway and Sweden in these tables (Table 2.8, Table 2.9 and Table 2.10) are larger than those of China to a substantial degree; on the other hand, just with a rough estimation, the value that the sum of the percentages of any column of membership of Denmark, Norway and Sweden in

Trust and Development: The Deep Structure of Institutions-Building and Socio-Economic Performance
114
excess of the percentage of those who belong to no organizations subtracted from 100% is much larger than that of China. This also provides evidence for the phenomenon and the opinions of Liang (1949) and Fei ([1947] 1992) to some extend that the Western societies have social structures of tuan ti ge ju and pay more attention to group life.

Chapter 2: Some Socio-Economic Aspects of China and Scandinavia
115
Table 2.8 Membership in Denmark, Norway and Sweden. Do you belong to:…? Waves Denmark Norway Sweden
social welfare service EVS 1 47/1182=3.98% 138/1051=13.13% 68/954=7.13% EVS 2 57/1030=5.53% 135/1239=10.90% 80/1047=7.64% EVS 3 67/1023=6.55% no observations 214/1015=21.08% EVS 4 180/1499=12.01% 94/1090=8.62% 101/1187=8.51%
religious organization EVS 1 43/1182=3.64% 94/1051=8.94% 84/954=8.81% EVS 2 69/1030=6.70% 139/1239=11.22% 107/1047=10.22% EVS 3 122/1023=11.93% no observations 717/1015=70.64% EVS 4 926/1499=61.77% 135/1090=12.39% 134/1187=11.29%
cultural activities EVS 1 73/1182=6.18% 69/1051=6.57% 124/954=13.00% EVS 2 129/1030=12.52% 167/1239=13.48% 133/1047=12.70% EVS 3 170/1023=16.62% no observations 271/1015=26.70% EVS 4 334/1499=22.95% 132/1090=12.11% 153/1187=12.89%
labour unions EVS 1 496/1182=41.96% 368/1051=35.01% 419/954=43.92% EVS 2 505/1030=49.03% 517/1239=41.73% 613/1047=58.55% EVS 3 556/1023=54.35 no observations 633/1015=62.36% EVS 4 833/1499=55.57% 436/1090=40.00% 294/1187=24.77%
political parties EVS 1 77/1182=6.51% 150/1051=14.27% 129/954=13.52% EVS 2 67/1030=6.50% 172/1239=13.88% 106/1047=10.12% EVS 3 68/1023=6.65% no observations 105/1015=10.34% EVS 4 103/1499=6.87% 85/1090=7.8% 60/1187=5.05%
local community actions EVS 1 no observations no observations no observations EVS 2 51/1030=4.95% 33/1239=2.66% 23/1047=2.2% EVS 3 63/1023=6.16% no observations 95/1015=9.36% EVS 4 113/1499=7.54% 23/1090=2.11% 23/1187=1.94%
third world development
or human rights
EVS 1 40/1182=3.38% 37/1051=3.52% 33/954=3.46%
EVS 2 29/1030=2.82% 63/1176=5.08% 97/1047=9.26%
EVS 3 42/1023=4.11% no observations 159/1015=15.67%
EVS 4 133/1499=8.87% 124/1090=11.38% 100/1187=8.42%
environment, animal rights EVS 1 64/1182=5.41% 46/1051=4.38% 32/954=3.35% EVS 2 no observations no observations no observations EVS 3 134/1023=13.10% no observations 119/1015=11.72%
EVS 4 234/1499=15.61% 60/1090=5.50% 97/1187=8.17%
professional associations EVS 1 163/1182=13.79% 152/1051=14.46% 69/954=7.23% EVS 2 125.1030=12.14% 202/1239=16.30% 125/1047=11.94% EVS 3 113/1023=11.05% no observations 149/1015=14.68% EVS 4 198/1499=13.21% 138/1090=12.66% 83/1187=6.99%
youth work EVS 1 116/1182=9.81% 85/1051=8.09% 55/954=5.77% EVS 2 48/1030=4.66% 73/1239=5.89% 97/1047=9.26% EVS 3 68/1023=6.65% no observations 71/1015=7.00%
EVS 4 119/1499=7.94% 32/1090=2.94% 32/1187=2.70%
sports/recreation EVS 1 no observations no observations no observations EVS 2 345/1030=33.50% 407/1239=32.85% 336/1047=32.09%
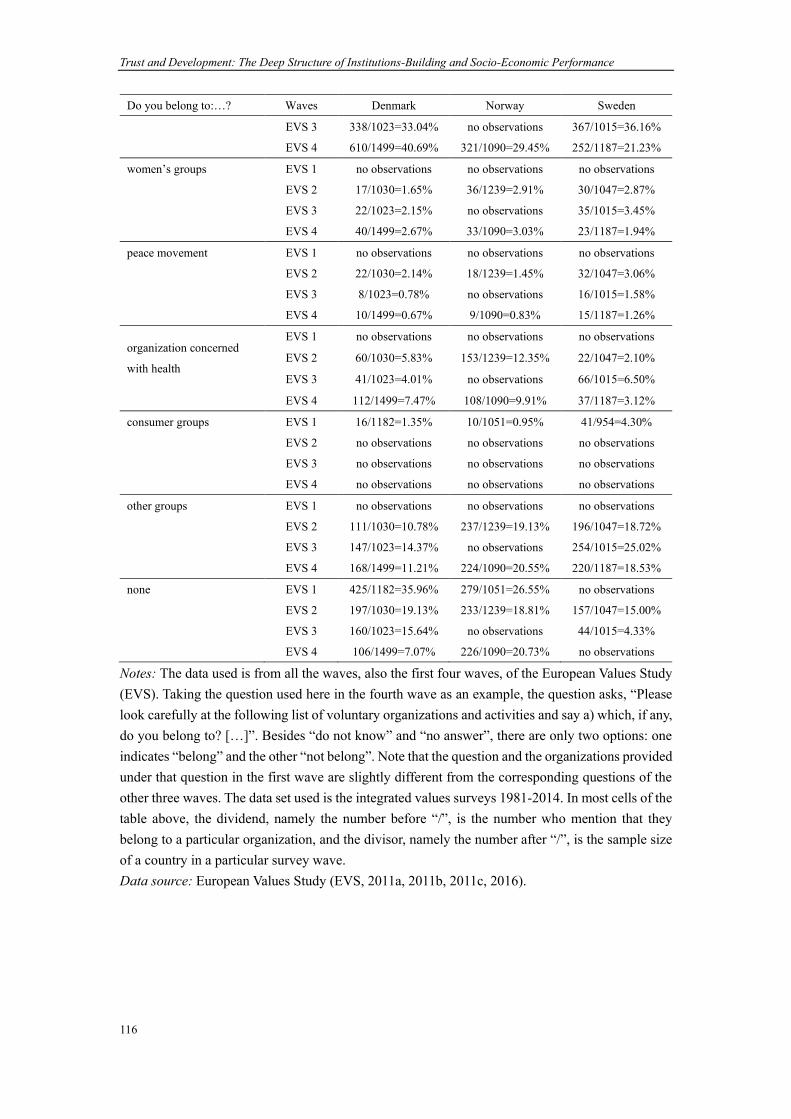
Trust and Development: The Deep Structure of Institutions-Building and Socio-Economic Performance
116
Do you belong to:…? Waves Denmark Norway Sweden EVS 3 338/1023=33.04% no observations 367/1015=36.16% EVS 4 610/1499=40.69% 321/1090=29.45% 252/1187=21.23%
women’s groups EVS 1 no observations no observations no observations EVS 2 17/1030=1.65% 36/1239=2.91% 30/1047=2.87% EVS 3 22/1023=2.15% no observations 35/1015=3.45%
EVS 4 40/1499=2.67% 33/1090=3.03% 23/1187=1.94%
peace movement EVS 1 no observations no observations no observations EVS 2 22/1030=2.14% 18/1239=1.45% 32/1047=3.06% EVS 3 8/1023=0.78% no observations 16/1015=1.58% EVS 4 10/1499=0.67% 9/1090=0.83% 15/1187=1.26%
organization concerned
with health
EVS 1 no observations no observations no observations
EVS 2 60/1030=5.83% 153/1239=12.35% 22/1047=2.10%
EVS 3 41/1023=4.01% no observations 66/1015=6.50%
EVS 4 112/1499=7.47% 108/1090=9.91% 37/1187=3.12%
consumer groups EVS 1 16/1182=1.35% 10/1051=0.95% 41/954=4.30% EVS 2 no observations no observations no observations EVS 3 no observations no observations no observations EVS 4 no observations no observations no observations
other groups EVS 1 no observations no observations no observations EVS 2 111/1030=10.78% 237/1239=19.13% 196/1047=18.72% EVS 3 147/1023=14.37% no observations 254/1015=25.02% EVS 4 168/1499=11.21% 224/1090=20.55% 220/1187=18.53%
none EVS 1 425/1182=35.96% 279/1051=26.55% no observations EVS 2 197/1030=19.13% 233/1239=18.81% 157/1047=15.00% EVS 3 160/1023=15.64% no observations 44/1015=4.33%
EVS 4 106/1499=7.07% 226/1090=20.73% no observations
Notes: The data used is from all the waves, also the first four waves, of the European Values Study (EVS). Taking the question used here in the fourth wave as an example, the question asks, “Please look carefully at the following list of voluntary organizations and activities and say a) which, if any, do you belong to? […]”. Besides “do not know” and “no answer”, there are only two options: one indicates “belong” and the other “not belong”. Note that the question and the organizations provided under that question in the first wave are slightly different from the corresponding questions of the other three waves. The data set used is the integrated values surveys 1981-2014. In most cells of the table above, the dividend, namely the number before “/”, is the number who mention that they belong to a particular organization, and the divisor, namely the number after “/”, is the sample size of a country in a particular survey wave. Data source: European Values Study (EVS, 2011a, 2011b, 2011c, 2016).

Chapter 2: Some Socio-Economic Aspects of China and Scandinavia
117
Table 2.9 Membership in China. Do you belong to: …? Waves China social welfare services WVS 2 37/1000=3.7% WVS 4 29/1000=2.90% religious or church organizations WVS 2 14/1000=1.40% WVS 4 36/1000=3.60% education, arts, music or cultural activities WVS 2 73/1000=7.30% WVS 4 22/1000=2.20% labour unions WVS 2 17/1000=1.70% WVS 4 69/1000=6.90% political parties or groups WVS 2 351/1000=35.10% WVS 4 83/1000=8.30% local community action WVS 2 6/1000=0.60% WVS 4 15/1000=1.50% third world development or human rights WVS 2 6/1000=0.60% WVS 4 4/1000=0.40% conservation, environment, animal rights groups WVS 4 12/1000=1.20% professional associations WVS 2 257/1000=25.70% WVS 4 12/1000=1.20% youth work WVS 2 92/1000=9.20% WVS 4 11/1000=1.10% sports or recreation WVS 2 44/1000=4.40% WVS 4 32/1000=3.20% women's groups WVS 2 31/1000=3.10% WVS 4 33/1000=3.30% peace movement WVS 2 5/1000=0.50% WVS 4 9/1000=0.90% voluntary organizations concerned with health WVS 2 16/1000=1.60% WVS 4 27/1000=2.90% other groups WVS 2 20/1000=2.00% WVS 4 0/1000=0.00% none WVS 2 330/1000=33.00%
Notes: The data set used is the longitudinal date set of the World Values Survey which contains all the six waves at present of WVS from 1981 to 2014. China is in wave 2 to wave 6. However, in terms of the question about membership, wave 2 and wave 4 adopts different way of answering from wave 3, wave 5 and wave 6, besides different target organizations. To be specific, the question about membership in wave 2 and wave 4 contains two options, while that in wave 3, wave 5 and wave 6 contains three, except “do not know” and “no answer”. Here in this table, we current only present what wave 2 and wave 4 ask. For example, in wave 4, it asks, “Please look carefully at the following list of voluntary organizations and activities and say which, if any, do you belong to?” Except “do not know” and “no answer”, there are two options: one indicates “belong” and the other “not belong”. Note that the organizations contained in the question about membership in wave 2 and wave 4 are also slightly different. In the third column of the table above, the dividend, namely the number before “/”, is the number who mention that they belong to a particular organization, and

Trust and Development: The Deep Structure of Institutions-Building and Socio-Economic Performance
118
the divisor, namely the number after “/”, is the sample size of a country in a particular survey wave. Additionally, this table does not contain waves with no observations of China or sub-questions that are not asked in a particular survey. Data source: World Values Survey (Inglehart et al, 2014b, 2014d)

Chapter 2: Some Socio-Economic Aspects of China and Scandinavia
119
Table 2.10 Active or inactive membership in China, Denmark, Norway and Sweden. Are you a …? Wave China Norway Sweden
Active member Inactive member Not a member Active member Inactive member Not a member Active member Inactive member Not a member
Church or religious
organization
WVS 3 Not asked in survey Not asked in survey Not asked in survey 94/1127=8.34% 267/1127=23.67% 765/1127=67.88% 78/1009=7.73% 211/1009=20.91% 700/1009=69.38%
WVS 5 55/1991=2.76% 144/1991=7.23% 1767/1991=88.75% 85/1025=8.29% 303/1025=29.56% 637/1025=62.15% 67/1003=6.68% 476/1003=47.46% 454/100345.26%
WVS 6 24/2300=1.04% 93/2300=4.04% 2161/2300=93.96% no observations no observations no observations 66/1206=5.47% 450/1206=37.31% 681/1206=56.47%
Sport or recreational
organization
WVS 3 151/1500=10.07% 91/1500=6.07% 1258/1500=83.87% 263/1127=23.34% 180/1127=15.97% 683/1127=60.60% 267/1009=26.46% 179/1009=17.74% 544/1009=53.91%
WVS 5 126/1991=6.33% 204/1991=10.25% 1645/1991=82.62% 278/1025=27.12% 154/1025=15.02% 593/1025=57.85% 294/1003=29.31% 144/1003=14.26% 562/1003=56.03%
WVS 6 55/2300=2.39% 179/2300=7.78 2066/2300=89.83% no observations no observations no observations 290/1206=24.05% 143/1206=11.86% 770/1206=63.85%
Art, music or
educational
organization
WVS 3 86/1500=5.73% 90/1500=6.00% 1324/1500=88.27% 168/1127=14.91% 77/1127=6.83% 881/1127=78.17% 126/1009=12.49% 97/1009=9.61% 765/1009=75.82%
WVS 5 117/1991=5.88% 165/1991=8.29 1689/1991=84.83 129/1025=12.59% 79/1025=7.71 817/1025=79.71% 128/1003=12.76% 120/1003=11.96% 752/1003=74.98%
WVS 6 34/2300=1.48% 150/2300=6.52% 2113/2300=91.87% no observations no observations no observations 170/1206=14.10% 121/1206=10.03% 910/1206=75.46%
Labor Union WVS 3 88/1500=5.87% 229/1500=15.27% 1183/1500=78.87% 175/1127=15.53% 355/1127=31.50% 596/1127=52.88% 129/1009=12.78% 499/1009=49.45% 362/1009=35.88%
WVS 5 89/1991=4.47% 161/1991=8.09% 1720/1991=86.39% 139/1025=13.56% 365/1025=35.61% 520/1025=50.73% 97/1003=9.67% 488/1003=48.65% 415/1003=41.38%
WVS 6 21/2300=0.91% 154/2300=6.70% 2123/2300=92.30% no observations no observations no observations 141/1206=11.69% 408/1206=33.83% 635/1206=52.65%
Political party WVS 3 96/1500=6.40% 117/1500=7.80% 1287/1500=85.80% 36/1127=3.19% 138/1127=12.24% 952/1127=84.47% 47/1009=4.66% 102/1009=10.11% 840/1009=83.25%
WVS 5 117/1991=5.88% 130/1991=6.53% 1729/1991=86.84% 44/1025=4.29% 131/1025=12.78% 850/1025=82.93% 29/1003=2.89% 80/1003=7.98% 888/1003=88.53%
WVS 6 43/2300=1.87% 146/2300=6.35% 2108/2300=91.65% no observations no observations no observations 39/1206=3.23% 109/1206=9.04% 1052/1206=87.23%
Environmental
organization
WVS 3 36/1500=2.40% 39/1500=2.60% 1425/1500=95.00% 10/1127=0.89% 65/1127=5.77% 1051/1127=93.26% 22/1009=2.18% 106/1009=10.51% 860/1009=85.23%
WVS 5 87/1991=4.37% 113/1991=5.68% 1769/1991=88.85% 13/1025=1.27% 61/1025=5.95% 951/1025=92.78% 9/1003=0.90% 93/1003=9.27% 894/1003=89.13%
WVS 6 12/2300=0.52% 49/2300=2.13% 2238/2300=97.30% no observations no observations no observations 20/1206=1.66% 115/1206=9.54% 1064/1206=88.23%
Professional
association
WVS 3 34/1500=2.27% 56/1500=3.73% 1410/1500=94.00% 101/1127=8.96% 189/1127=16.77% 836/1127=74.18% 52/1009=5.15% 109/1009=10.80% 828/1009=82.06%
WVS 5 36/1991=1.81% 97/1991=4.87% 1832/1991=92.01% 77/1025=7.51% 181/1025=17.66% 764/1025=74.54% 62/1003=6.18% 137/1003=13.66% 796/1003=79.36%
WVS 6 9/2300=0.39% 44/2300=1.91% 2244/2300=97.57% no observations no observations no observations 67/1206=5.56% 138/1206=11.44% 974/1206=80.76%
WVS 3 43/1500=2.87% 48/1500=3.20% 1409/1500=93.93 102/1127=9.05% 216/1127=19.17% 808/1127=71.69% 66/1009=6.54% 156/1009=15.46% 766/1009=75.92%

Trust and Development: The Deep Structure of Institutions-Building and Socio-Economic Performance
120
Are you a …? Wave China Norway Sweden
Active member Inactive member Not a member Active member Inactive member Not a member Active member Inactive member Not a member
Humanitarian or
charitable
organization
WVS 5 69/1991=3.47% 86/1991=4.32% 1810/1991=90.91% 126/1025=12.29% 198/1025=19.32% 700/1025=68.29% 98/1003=9.77% 229/1003=22.83% 672/1003=67.00%
WVS 6 10/2300=0.43% 37/2300=1.61% 2251/2300=97.87% no observations no observations no observations 133/1206=11.03% 226/1206=18.74% 840/1206=69.65%
Consumer
organization
WVS 3 Not asked in survey Not asked in survey Not asked in survey Not asked in survey Not asked in survey Not asked in survey Not asked in survey Not asked in survey Not asked in survey
WVS 5 Not asked in survey Not asked in survey Not asked in survey Not asked in survey Not asked in survey Not asked in survey Not asked in survey Not asked in survey Not asked in survey
WVS 6 9/2300=0.39% 47/2300=2.04% 2243/2300=97.52% no observations no observations no observations 67/1206=5.56% 282/1206=23.38% 847/1206=70.23%
Self-help groups,
mutual aid groups
WVS 3 Not asked in survey Not asked in survey Not asked in survey Not asked in survey Not asked in survey Not asked in survey Not asked in survey Not asked in survey Not asked in survey
WVS 5 Not asked in survey Not asked in survey Not asked in survey Not asked in survey Not asked in survey Not asked in survey Not asked in survey Not asked in survey Not asked in survey
WVS 6 16/2300=0.70% 64/2300=2.78% 2217/2300=96.39% no observations no observations no observations 46/1206=3.81% 50/1206=4.15% 1100/1206=91.21%
Any other WVS 3 32/1500=2.13% 190/1500=12.67% 1278/1500=85.20% 165/1127=14/64% 182/1127=16.15% 779/1127=69.12% 186/1009=18.43% 162/1009=16.06% 637/1009=63.13%
WVS 5 1/1991=0.05% 1/1991=0.05% 1987/1991=99.80% 128/1025=12.49% 144/1025=14.05% 752/1025=73.37% 202/1003=20.14% 164/1003=16.25% 538/1003=53.64%
WVS 6 2/2300=0.09% 16/2300=0.70% 2118/2300=92.09% no observations no observations no observations 190/1206=15.75% 119/1206=9.87% 869/1206=72.06%
Notes: The data set used is the longitudinal date set of the World Values Survey which contains all the six waves at present of WVS from 1981 to 2014. Denmark is not in any of the six waves of the WVS. In wave 3, wave 5 and wave 6 of the World Values Survey (WVS), the answering of the set of membership questions contain three options, namely “Active member”, “Inactive member” or “Don’t belong”, except “Do not know” and “No answer”. Take wave 6 as an example. In terms of the membership question, it asks, “Now I am going to read off a list of voluntary organizations. For each organization, could you tell me whether you are an active member =, an inactive member or not a member of that type of organization?” In most cells of the table above, the dividend, namely the number before “/”, is the number who mention that they belong to a particular organization, and the divisor, namely the number after “/”, is the sample size of a country in a particular survey wave. Source: World Values Survey (Inglehart et al, 2014c, 2014e, 2014f).

Chapter 2: Some Socio-Economic Aspects of China and Scandinavia
121
Take China and Sweden as two examples. Figure 2.2 and Figure 2.3 present the distribution of how many voluntary organizations the respondents of these two countries are in respectively as an active member, an inactive member and not as a member using data from WVS 6, which provides more intuitive and solid evidence for the inference above that Swedish are more apt to take part in more groups and to be active in groups than Chinese. In fact, obviously, similarly strong constructs would generate between China and Denmark or Norway in the pattern of membership when compared using comparable data.
Figure 2.2 Number of memberships in China. Notes: Author’s own calculation and illustration based on WVS 6. There are 2300 observations from China in total in WVS 6. Data source: World Values Survey 6 (Inglehart et al, 2014f).
Figure 2.3 Number of memberships in Sweden. Notes: Author’s own calculation and illustration based on WVS 6. There are 1206 observations from
0
500
1000
1500
2000
2500
0 1 2 3 4 5 6 7 8 9 10 11
Num
ber o
f res
pond
ents
Number of organizations
Active member
Inactive member
Not a member
0
100
200
300
400
500
600
0 1 2 3 4 5 6 7 8 9 10 11
Num
ber o
f res
pond
ents
Number of organizations
Active member
Inactive member
Not a member

Trust and Development: The Deep Structure of Institutions-Building and Socio-Economic Performance
122
Sweden in total in WVS 6. Data source: World Values Survey 6 (Inglehart et al, 2014f).
Table 2.11 presents the average active membership, average inactive membership, average membership and average non-membership of China and Sweden based on WVS 6. Swedish respondents on average take part in about 2.81 voluntary organizations, while this number for Chinese respondents is only 0.53. Therein, Swedish respondents in about 1.02 organization on average act as an active member. On contrast, Chinese respondents only in about 0.11 organization on average play an active role.
Table 2.11 Average membership, China and Sweden. China Sweden Average active membership 0.1022 1.0191 Average inactive membership 0.4257 1.7919 Average membership 0.5278 2.8109 Average non-membership 10.3835 8.0779
Notes: Author’s own calculation based on WVS 6. The number of observations of China is 2300, and that of Sweden is 1206. For the original survey question, see the questionnaire of WVS 6, questions V25 – V 35. Data source: World Values Survey 6 (Inglehart et al, 2014f).
Two reasons may explain why Chinese respondents participate fewer voluntary organizations than the Scandinavian countries. One is that the voluntary organizations appearing in the questionnaires are not quite common ones in China. The second is that Chinese are not as keen as people in the other countries in participating in formal organizations. They like more making friends freely in informal interactions, rather than intentionally joining in various groups.
Why people would like to join in various groups? Besides, such as, possible interests, cultural habits or inclination, and curiosity, people joining in the same groups are likely to have similarities in views or standpoints. What is more, often, it is for finding more people sharing similar opinions that many people decide to become a member of a certain group. Surely, it cannot be excluded that some people may pretend to have similar opinions or standpoints with other group members or accommodate other group members’ general opinions or standpoints so as to successfully join in a certain group on account of finding himself / herself some affiliation / belonging more rapidly. Yet, whether it is due to same standpoints or because of joining in order to joining in, it is no doubt that groups bring people sense of belonging which makes them feel or appear not too much unique since they are not the only person who has some particular view. Moreover, when expressing standpoints or opinions, they then seem to have strong emotional support behind. Certainly, this kind of emotional support from belonging to groups may not be needed by everyone, since, after all, there are still many people who do not mind or feel worried having or expressing their somehow uncommon, unique and challenging views or inclination without opinion-sharing people.
2.3 Welfare, equality, change, expectations, and certainty
2.3.1 The Nordic welfare model: an overview

Chapter 2: Some Socio-Economic Aspects of China and Scandinavia
123
It is not exaggerated to say that the three Scandinavian countries, Denmark, Norway and Sweden, as well as other Nordic countries, are outstanding representatives of modern welfare states. The term “the Nordic/Northern countries” which is used to refer to the five countries of Denmark, Finland, Iceland, Norway and Sweden, was invented in the 1930s to replace the term “Scandinavia” after the independence of Finland and Iceland on account of the similarities of the five countries in history, culture and economy (Pedersen and Kuhnle, 2017). In addition, “the term ‘welfare state’ […] probably derives from the German” “Wohlfahrtsstaat” (Hayek, [1960] 2011, p. 373). In fact, the initial construction of welfare states in Scandinavia was influenced by Germany to a large degree. The emergence of the phenomenon, not the concept, of the Nordic model dates back to the 1930s, although it first appeared as a “model” in a book title as late as 1987 (Pedersen and Kuhnle, 2017). By the way, there is another opinion on the emerging time of the Nordic model, that is it emerged “in the wake of World War II” (Nordic Co-operation, no date b, para. 2) and “is based on need and circumstances” (Nordic Co-operation, no date b, para. 3). In welfare states, the well-being of their citizens is ensured and maintained by the states in some way to a large extent. A prominent and distinguishable characteristic of the Nordic Model is universality which tries to take into account every citizen in the country. What is more, besides universalism, Pedersen and Kuhnle (2017) think that there are another three characteristics or components of the Nordic model, namely stateness, equality and forms of democratic governance. It should be noted that the specific policies implemented by different countries within the Nordic Europe are also not the same. Therefore, Andersen (2015, p.15) reminds that “the model is defined in terms of overall objectives and not in terms of specific policies”.
Is a welfare state an encumbrance or a boost for economic performance? This question involves the actual or potential trade-off between efficiency and fairness. People who are against the welfare states, such as scholars or politicians with neoclassical tradition, may argue that the Nordic model is not sustainable in the long-run. Indeed, the disadvantages of the extended welfare states are obvious. For example, they may encourage free-riding behavior of sluggards who benefit from the universal welfare policies but do not work. – This is harmful to labour force participation rate. In this case, more burdens will be imposed on the fiscal revenues of governments at each level within a country, which will threaten the implementation of those universal welfare policies. If the proportion of free-riders is high enough, the governments will not be able to make ends meet or have a too big financial deficit. Then, it will definitely have an adverse effect on the sustainability of the whole working of welfare policies.
However, this worry has not been proved to be quite true at least in the Scandinavian countries. People often compare Scandinavian countries to bumblebees because the contrast between their generosity in welfare provision and excellent economic achievements just resembles bumblebees that can fly quite well with even disproportionate body weight and wing size (e.g., Svendsen and Svendsen, 2016, p.1). Moreover, these “bumblebees” (except Iceland) successfully survived the 2008 global financial crisis.
The co-existence of universal welfare and good economic performance may pertain to the structures of tax revenues and expenditures. From the revenue side, for example, the Nordic countries levy relatively high personal income tax, while their corporate tax is relatively low, which is good for firms. From the expenditure side, Andersen (2015, p. 17) decomposes public expenditures and their

Trust and Development: The Deep Structure of Institutions-Building and Socio-Economic Performance
124
financing, and terms, for simplicity, some therein “active” and others “passive”. For example, he regards “labour market relevant education” as active (Andersen, 2015, p. 17). The active expenditures, “if financed by the least distortionary modes of taxation”, are conducive to economic performance, while the passive ones are not (Andersen, 2015, p. 17). Andersen (2015, p. 17) suggests subsequently that when discussing the role of welfare states in economic performance, structure of public expenditures should be taken into account. He points out that it is because “the Nordic countries […] have a stronger orientation of their expenditures towards active spending” that they present good economic performance (Andersen, 2015, p. 18).
It should be noted that the Nordic model has not been never challenged, and that the Nordic welfare model itself is also changing (e.g., Kuhnle, 2000; Andersen, 2015, p. 15). It also ever encountered difficult times in economy during 1970s – 1990s to different degrees, and had to implement adjustments and reforms of welfare policies during that period accordingly. For example, negatively influenced by the first oil crisis in the 1970s (specifically, 1973 – 1974), the unemployment rate in Denmark ever soared, which put much pressure on Denmark to reform public finance and welfare in 1980s (Kuhnle, 2000). Norway also “experienced an economic setback around 1990” (Kuhnle, 2000, p. 212). However, benefits from its oil and gas sector made Norway relatively economically solid, which put less pressure on Norwegian welfare reform (Kuhnle, 2000). By contrast, Sweden experienced a relatively severe economic recession in the early 1990s, with unemployment rate increasing rapidly and GDP decreasing, which pushed up the proportion of social expenditure in GDP (Kuhnle, 2000). – These constructed the economic background of the welfare reforms in the Nordic countries. By and large, the general trend of the welfare reforms in Nordic countries in the 1990s is cuts and retrenchment. In this sense, good economic performance ensures the implementation of comprehensive and generous welfare policies, while economic depression cannot persistently afford generous welfare.
As mentioned before, a deadly defect of comprehensive and generous welfare of the Nordic model could be its vulnerability to lazy people or free riders. Accordingly, some policy adjustments pointing to this weakness were carried on in the 1990s’ Nordic welfare reforms. For example, in terms of employment, it is stipulated that only those who are active in job searching or activation programs can be covered by some certain welfare, unless they are unable to support themselves (Andersen, 2015, p. 19). In this sense, those welfare policies have a positive effect on economic growth. That arrangement guaranteeing labor market participation and employment rates is conducive to the solution of the threaten from unemployment to the maintenance of the Nordic model, and to the co-existence of economic growth and generous welfare in the Nordic countries. Then, it is clear that potential welfare crisis can be alleviated by relatively low unemployment rate which is an important source of tax revenues, given the relatively normal operation of economy. In addition, training programs during a temporary unemployment period can not only help the unemployed finding a job and accumulate human capital for individual persons at an aggregate level, but can also be used as opportunities for industrial reconstruction when necessary.
High welfare needs sufficient government revenues to support, and tax is usually the biggest source of government revenues in general. When it comes to sustainability of welfare states, revenues and expenditures are always two cut-in points to consider. The maintenance of universal welfare policies calls for sufficient tax revenues. Sufficient tax revenues are not separable from high labour force

Chapter 2: Some Socio-Economic Aspects of China and Scandinavia
125
participation, especially for the Nordic countries where governments levy a relatively low proportion of cooperate tax. Welfare policies just in turn encourage participation in the labour market. – This generates a virtuous cycle conducive to welfare sustainability in turn.
Despite, there are still some backwards in efficiency in the welfare states, including the Nordic welfare countries. One example is health care, although fees for treatment and medicine can be covered to a large degree. Specifically, an appointment for seeing a doctor may not be arranged very in time, such as several weeks or months later when a patient could either self-cure or miss the best time for treatment. Certainly, this case may partly relate to the insufficiency of medical staff and the system of medical care.
The large public section and universal welfare provided in the Nordic countries often make people relate these countries to socialism. However, even people originally from the Nordic countries do not agree (e.g., Andersen, 2015, p. 42). First of all, socialism is associated with a substantial position of state ownership / public ownership / government ownership of the means of production in some measure. In this sense, the Nordic countries are not socialist countries since private ownership accounts for an absolutely large proportion and is the mainstay of their economies. Additionally, the Nordic countries have relatively high economic freedom worldwide. Andersen (2015) also expresses a similar opinion with the statement that:
Given the large public sector and the organized labour markets, it is often claimed that Nordic countries are semi-socialist countries adopting “policies against markets”. This is not an accurate description of the private sector and therefore of what in economics jargon may be termed product markets. Fairly liberal policies have been pursued, and state intervention in the form of state-owned companies and the like has not played a large role in comparative perspective. The Nordic countries are better characterized as following a social-liberal model with a liberal private sector and extensive social objectives catered for through market institutions and the public sector. (p. 42)
The Scandinavian countries are all countries with a population of small size which is also homogenous to a large degree. A homogenous society usually shares similar historical and cultural tradition, and has similar thinking way or mindset, social norms and values which result in behaviors that are more socially acceptable and inhibit conflicts. These create conditions for social trust and social harmony since others behave in ways which one thinks morally right or acceptable.
The reasons why the institution of comprehensive and generous welfare state can be implemented and maintained in the Nordic countries at least lie in four aspects. First, historical reason. The absolutist regimes ever existing in Scandinavia in the seventeenth century was rather weak compared with the rest of Europe (Bergh and Bjørnskov, 2011). Second, values basis. Values, such as “compassion, tolerance and the conviction that all humans are of equal worth” (Nordic Co-operation, no date b, para. 4), provide values basis for the Nordic welfare model. Third, economic basis. Economic growth provides material basis for the implementation of high welfare. Forth, ruling party. Social democratic party, which is the advocates of extended welfare state, has either been the ruling party or formed a coalition government with other parties for a long time since 1930s

Trust and Development: The Deep Structure of Institutions-Building and Socio-Economic Performance
126
in the Nordic countries.1 For example, the cumulative time that Swedish social democratic party is not the ruling party in Sweden from its establishment in 1889 to 2018 is only as short as 22 years. In addition, economic growth provides material strength for it.
The generous welfare in the Scandinavian countries is attractive and enviable, especially for middle class citizens and residents or below. However, it is not suitable that the whole model is rashly introduced by other countries. First, different countries have different specific realistic situations. Implementing generous welfare blindly without considering the facts of a country is risky. Second, the model itself is also not perfect; the Nordic countries also adjust in the course of discovering and solving various problems, such as the aging of the population. As said, the model requires sufficient economic development as material support, besides possible values basis. Thus, the key point for a country is to have a clear understanding about its current situation when making or reforming welfare policies, which means there is a trade-off between policy choices. For example, borrowing debts to maintain high level welfare without adjustments according to specific situations while economy is sluggish is not sustainable to a large degree. However, it should be noted that such statements do not imply that other countries cannot learn experience from the Nordic model.
Table 2.12 shows the percentage of expenditure of social protection in GDP of Denmark, Norway and Sweden from 2004 to 2015. In general, Denmark spends the largest proportion of its GDP on social protection, followed by Sweden. By contrast, that percentage of Norway is the lowest among the three countries. In 2015, Denmark, Norway and Sweden respectively spent 32.3%, 27.9% and 29.2 of their GDP on social protection.
Table 2.12 Percentage of expenditure on social protection in GDP geo\time 2004 2005 2006 2007 2008 2009 2010 2011 2012 2013 2014 2015
Denmark 29.9 29.5 28.4 29.1 28.9 32.7 32.4 32.1 32 32.5 32.8 32.3
Norway 25.4 23.4 22.1 22.1 21.8 25.5 25.2 24.8 24.5 25.1 26 27.9
Sweden 29.8 29.5 28.6 27.4 27.7 30.1 28.6 28.2 29.3 30 29.5 29.2
Data source: Eurostat.
Table 2.13 presents the percentage of total expenditure on social benefits in total expenditure on social protection in Denmark, Norway and Sweden from 2004 to 2015. It can be seen that in all these three countries expenditure on social benefits almost accounts for the whole total expenditure on social protection and that the percentage is larger in Norway and Sweden than in Denmark. In 2015, 98.13% of the total expenditure on social protection went to total expenditure on social benefits in Norway, 98% in Sweden and 96.33% in Denmark.
Table 2.13 Percentage of total expenditure on social benefits in total expenditure on social protection. geo\time 2004 2005 2006 2007 2008 2009 2010 2011 2012 2013 2014 2015
1 The general election is held every four years in Denmark, Sweden and Norway. Specifically, according to Article 32 in Part IV of the Constitutional Act of Denmark, “The Members of the Folketing shall be elected for a period of four years” (Denmark. Folketinget, 2013, p. 14). According to the Constitution of Sweden, “Ordinary elections to the Riksdag are held every four years (IG 3.3) in September (RA 2:1)” (Sweden. Sveriges Riksdag, 2016, p. 51). Similarly, according to Article 54 of the Constitution of Norway, “Elections shall be held every fourth year. They shall be concluded by the end of September.” (Norway. Stortinget, 2018, no page) In addition, the current ruling party in Denmark is the coalition government consisted with the Liberal Party (Venstre), Liberal Alliance and Conservative People’s Party (Denmark.dk). The current ruling party in Sweden since its general election in 2014 is the Social Democratic Party, and Sweden will hold the general election in September, 2018.

Chapter 2: Some Socio-Economic Aspects of China and Scandinavia
127
Denmark 97.12 97.2 97.31 96.56 96.87 96.69 96.66 96.66 96.44 96.22 96.24 96.33
Norway 98.37 98.06 98.07 97.81 97.7 97.86 97.91 97.98 97.96 97.96 98.07 98.13
Sweden 98.06 98.05 98.05 97.95 98.01 98.17 98.11 98.11 98.07 98.13 98.07 98.00
Data source: Eurostat.
Social benefits contain 8 functions, namely benefits for sickness / health care, disability, old age, survivors, family / children, unemployment, housing and social exclusion n.e.c., respectively. Table 2.14 presents the fraction of each of these functions in total social benefits in Denmark, Norway and Sweden from 2004 to 2015. For all the three countries, expenditure on old age and sickness / health care act as the largest two functions of social benefits, with expenditure on old age being the largest for Denmark and Sweden through 2004 to 2015 and old age taking place for sickness / health care to be the largest part in Norway in 2011. Then, disability and family / children account for the third and fourth largest part in total social benefits. Benefits for unemployment and survivors respectively take the fifth and sixth place for Norway and Sweden. However, in 5 out of 12 years from 2004 to 2015, expenditure on survivors in Denmark exceeds that on unemployment.
Table 2.14 Social benefits by function, % of total benefits. geo\time 2004 2005 2006 2007 2008 2009 2010 2011 2012 2013 2014 2015
Sickness/Health care
Denmark 20.58 20.72 21.58 21.53 22.21 21.89 21.34 21.19 21.12 20.33 19.98 20.19
Norway 32.79 31.91 32.42 32.47 32.47 32.41 31.29 30.57 30.19 30.04 30.13 30.01
Sweden 26.81 26.15 26.3 26.34 26.18 25.35 25.06 25.68 25.54 25.38 26.06 26.24
Disability
Denmark 13.88 14.42 14.91 13.66 13.71 13.34 13.53 13.3 13.44 13.18 12.87 13.04
Norway 18.59 19.01 18.79 18.65 17.61 17.15 17.36 17.28 17.03 16.61 16.06 16.41
Sweden 14.79 15.15 15.01 15.23 14.9 14.2 13.6 13.07 12.54 12.17 11.97 11.67
Old age
Denmark 37.17 37.51 37.87 36.28 36.98 35.78 35.49 36.23 36.78 36.8 37.28 37.18
Norway 28.41 29.38 29.82 30.3 30.74 30.17 30.59 31.9 33.13 34.04 34.79 34.78
Sweden 36.56 37.1 37.28 38.5 39.64 40.38 40.56 41.19 41.82 42.34 42.02 41.92
Survivors
Denmark 0.03 0.03 0.03 6.12 5.29 5.89 4.72 4.69 4.26 5.8 6.99 6.57
Norway 1.31 1.3 1.26 1.24 1.25 1.18 1.16 1.19 1.12 1.04 1.01 0.97
Sweden 2.2 2.13 2.08 2.03 1.95 1.86 1.74 1.61 1.52 1.41 1.29 1.17
Family/Children
Denmark 13.03 12.93 13.14 13.34 13.57 13.31 12.9 12.36 12 11.63 11.22 11.17
Norway 12.44 12.43 12.72 12.93 12.81 12.73 12.76 12.78 12.65 12.56 12.38 11.91
Sweden 9.54 9.62 10.08 10.31 10.52 10.24 10.49 10.62 10.55 10.5 10.59 10.46
Unemployment
Denmark 9.47 8.58 7.21 4.27 3.57 5.01 6.2 6.11 6.17 5.87 5.2 4.88
Norway 3.12 2.67 1.76 1.29 1.87 2.81 3.22 2.73 2.46 2.26 2.26 2.43
Sweden 6.23 6.09 5.51 3.84 3.04 4.18 4.61 3.93 4.12 4.25 3.84 3.67
Housing
Denmark 2.39 2.4 2.3 2.28 2.24 2.14 2.15 2.22 2.25 2.2 2.21 2.26
Norway 0.59 0.57 0.58 0.59 0.57 0.56 0.6 0.61 0.55 0.52 0.49 0.46

Trust and Development: The Deep Structure of Institutions-Building and Socio-Economic Performance
128
geo\time 2004 2005 2006 2007 2008 2009 2010 2011 2012 2013 2014 2015
Sweden 1.78 1.76 1.73 1.66 1.6 1.52 1.55 1.53 1.59 1.56 1.61 1.55
Social exclusion n.e.c.
Denmark 3.45 3.4 2.96 2.51 2.43 2.63 3.67 3.91 3.99 4.19 4.25 4.71
Norway 2.75 2.73 2.64 2.54 2.68 3 3.02 2.94 2.86 2.92 2.88 3.03
Sweden 2.1 2 2.01 2.08 2.16 2.27 2.4 2.35 2.32 2.39 2.62 3.32
Data source: Eurostat.
Table 2.15 shows how many Euro EU-28, Euro area – 19, Euro area – 18, Denmark, Norway and Sweden are spent on social protection of each person of population from 2004 to 2015. All the three Scandinavian countries spend a lot more than EU-28 or Euro area – 19/18 average, especially, Norway, about more than a half higher. Sweden spent least among the three countries, however, still about 3000 or 4000 euro higher than EU-28, or Euro area – 19/18.
Table 2.15 Total expenditure on social protection per head of population, ECU/EUR.
geo\ time
EU (28 countries)
Euro area (19
countries)
Euro area (18
countries) Denmark Norway Sweden 2004 --- 7363.52 7425.24 12694.41 14393.76 10969.69 2005 --- 7431.7 7491.75 12902.19 14488.04 11059.91 2006 --- 7513.87 7572.8 12854.68 14736.56 11161.31 2007 --- 7600.01 7657.13 13294.34 15200.71 11043.68 2008 6764.55 7738.13 7795.63 13225.55 15703.54 11027.58 2009 7219.4 8243.12 8304.28 13955.23 16452.44 11337.47 2010 7279.66 8303.39 8364.75 14219.88 16685.69 11238.12 2011 7264.52 8289.42 8350.33 14074.45 17119.84 11226.33 2012 7279.72 8295.2 8355.45 14062.68 17455.52 11513.78 2013 7331.34 8355.21 8415.73 14417.54 17766.62 11804.34 2014 7391.24 8451.96 8512.32 14806.24 18138.1 11805.74 2015 --- --- --- 14710.01 18562.4 12132.27
Data source: Eurostat.
2.3.2 Welfare policies in Scandinavia and China
Since the three Scandinavian countries are quite known for their Nordic model and are envied by many other countries, this section will take the welfare system of Denmark as an example and introduce its family / children policy, health care policy and pension in brief.
i) Denmark
Family / Children1
The welfare for family / children contains, such as, children and youth benefit (namely, family allowance), children care and maternity benefit. Let’s only have a slightly close look at children and
1 This part is referred to the Your Social Security Rights in Denmark (European Commission, 2017b, pp. 6-16).

Chapter 2: Some Socio-Economic Aspects of China and Scandinavia
129
youth benefit and maternity benefit.
In general, those who have any children under 18 years old and live in Denmark or is a citizen of an EU/EEA (namely, the European Union and the European Economic Area) country but work in Denmark are entitled to children and youth benefit, besides other possible requirements. The amount of child and youth benefit, which is tax-free, depends on the age of the target child and the income of its parents (its custodian and his/her spouse). For example, given that the income of the parents of a child is under DKK 749,000, a child under 2 years old is entitled to DKK 4,491 every quarter in 2017; a child between 3 and 6 years old can receive DEE 3,555 each quarter; 7-14 years old, DKK 2,796; 15-17 years old, DKK 932 (see also Table 2.16). However, “[…] you and your spouse’s child and youth benefit is reduced by 2% of the amount of your incomes in excess of DDK 749,000 (in 2017).” (European Commission, 2017b, p.8)
Table 2.16 The amount of children and youth benefit in 2017. Your child's age Child benefit (tax-free) 0-2 years DKK 4,491 per quarter (in 2017) 3-6 years DKK 3,555 per quarter (in 2017) 7-14 years DKK 2,796 per quarter (in 2017) 15-17 years DKK 932 per quarter (in 2017)
Source: European Commission (2017b, p. 8).
Maternity benefit is in essence maternity / paternity leave with financial support, which resembles paid leave but is of course not limited to wage / salary earners. Both parents with their own child or an adopted child are entitled to this benefit before their child reaches 9 years old. In the former case, a mother is entitled to a total of a 50-week leave with “a maximum of DKK 4,245 per week before tax” in 2017, and a father a total 48-week leave (European Commission, 2017b, pp. 14-15).
Old age pension
The Danish pension system can be divided into three types, that is, the statutory pensions, occupational pensions and individual pensions, respectively (Borger.dk, no date a). Therein, the mandatory pensions cover the National pension scheme and ATP lifelong pension (namely, the Danish Labour Market Supplementary Pension), a mandatory occupational pension, with the former including public basic pension and supplementary pension benefit (Borger.dk, no date a; OECD, 2017). Or put another way, the Danish pension system in 2016 contains four parts, that is, public basic pension, supplementary pension benefit, mandatory occupational pension – ATP and compulsory occupational pension schemes, respectively (OECD, 2017).
The National pension is provided by the public finance. In terms of coverage, the public basic pension is more universal than supplementary pension benefit. Danish nationals reaching the public retirement age and non-Danish citizens meeting certain required conditions can all apply for public basic pension (see, European Commission, 2017b, p. 39). On contrast, supplementary pension benefit is means tested, and is provided to pensioners who have financial difficulties in life (OECD, 2017). ATP contributions are compulsory for the employees in both public and private labor market, but voluntary for the self-employed (European Commission, 2017b, pp. 39-40). For employees, the contributions to ATP lifelong pension are shared by both the employer (or the state for employees

Trust and Development: The Deep Structure of Institutions-Building and Socio-Economic Performance
130
in the public market) and the employee (Border.dk, no date b; European Commission, 2017b, p. 39). Note that it is according to how long employees work that the ATP contributions are paid for, rather than how much they earn. Additionally, ATP lifelong pension is also given to pensioners when they reach retirement age (Border.dk, no date b). Different from the three types of pensions aforementioned, individual pension schemes are provided by companies or banks (Border.dk, no date a).
Health care
The healthcare in Denmark covers public healthcare, sickness benefit, home care service and care of close relatives (for detail information, see, e.g., European Commission, 2017b, pp. 17-29). Take public health care as an example. Those who are residents of Denmark, work in Denmark but are from EU/EEA/Switzerland, or stay temporarily in Denmark are all entitled to public healthcare in Denmark, in spite of holding different kinds of health insurance cards (European Commission, 2017b, p. 18). Expenditure reimbursements, cover a wide range of treatments and medicines (e.g., European Commission, 2017b, pp. 18, 20). For example, according to the 2016 rate, as long as dedication in a year is equal to or more than DKK 935, it is possible to get reimbursement; 60% of the annual expenditure on medicines for children under 18 years old can get reimbursed (European Commission, 2017b, pp. 19-20). The reimbursement system of medicines contains general reimbursement and individual reimbursement (Danish Ministry of Health, 2017, p. 44). How much a patient will be reimbursed hinges on his / her annual consumption of medicine (Danish Ministry of Health, 2017, p. 44). The healthcare system runs on the national, regional and municipal level (Danish Ministry of Health, 2017, p. 4). Denmark consists of 5 regions covering 98 municipalities (see, Danish Ministry of Health, 2017, p. 5). The regions and the municipalities are governed by councils at the corresponding levels and of which the members are elected every four years (Danish Ministry of Health, 2017, pp. 4-5). Denmark from two aspects supports its health and social services: first, general taxes provide financial support; at the same time, a system of central government block grants, reimbursements and equalization schemes also provides support (Danish Ministry of Health, 2017, p. 5). Figure 2.4 presents the financial structure of the Danish healthcare system.

Chapter 2: Some Socio-Economic Aspects of China and Scandinavia
131
Figure 2.4 Organisational chart of the financial structure of the Danish healthcare system. Source: Danish Ministry of Health (2017, p. 50).
ii) Social Security in China
Chinese social security system includes social insurance, social assistance, social welfare, social special care, philanthropy and so on, with social insurance being the main body. It should be noted that in China, the term “social security” has a broader meaning than the term “social welfare”, which is different from the Scandinavian countries where “social welfare” seems a broader term. According to the current Social Insurance Law of P.R. China1, the social insurance system of China covers five types of insurances, they are basic old-age insurance, basic health care insurance, occupational injury insurance, unemployment insurance and maternity insurance, respectively (People’s Republic of China. Standing Committee of the National People’s Congress, 2010).
Let us have a look at the evolution of the old-age insurance briefly. In 1951, the Labor Insurance Regulation2 was issued, which indicates the establishment of the labor insurance system with the social insurance and employee benefit being the main part (Ministry of Human Resources and Social Security of the People’s Republic of China, 2012; see also, People’s Republic of China. Government Administration Council of the Central People’s Government, 1953). However, in 1960s, social pooling was ever cancelled, and employees’ insurance gradually became totally provided by employers (Ministry of Human Resources and Social Security of the People’s Republic of China, 2012). Since the second half of 1980s, various regions made reforms of the old-age insurance mainly characterized by the social pooling for retirement expenses (Ministry of Human Resources and Social Security of the People’s Republic of China, 2012). In 1995, the old-age insurance model of combining social pooling accounts and personal accounts was put forward in the Notice on Deepening the Reform of the Endowment Insurance System for Enterprise Employees3 (Ministry of Human Resources and Social Security of the People’s Republic of China, 2012). In 1997, the Decision on Establishing a Unified Basic Endowment Insurance System for Enterprise Employees4 was issued (Ministry of Human Resources and Social Security of the People’s Republic of China, 2012). In 2005, the Decision on Improving the Basic Endowment Insurance System for Enterprise
1 The name of the law is author’s own translation. 2 Author’s own translation. 3 In Chinese: 《关于深化企业职工养老保险制度改革的通知》. 4 In Chinese: 《关于建立统一的企业职工基本养老保险制度的决定》.
The government
The regions The municipalities Co-financing
Activity based
subsidy Block grant Block grant
Direct tax
collection

Trust and Development: The Deep Structure of Institutions-Building and Socio-Economic Performance
132
Employees1 was issued putting forward broadening the pilot programs of personal accounts, further extending the coverage of old-age insurance, etc. (Ministry of Human Resources and Social Security of the People’s Republic of China, 2012). Currently, the Chinese old-age insurance has both social pooling accounts and personal accounts (People’s Republic of China. Standing Committee of the National People’s Congress, 2010). Recently, the basic old-age insurance system is still being reformed. From July 1st, 2018 on, the central system for enterprise employees’ basic old-age pension funds to be used inter-provincially is formally implemented in order to ensure the pension to be paid on time and in full.
In addition, it is a remarkable characteristic that in China, pilot programs always go first before a policy is nationwide implemented. For example, a province is selected by the central government as a pilot province for implementing some policy for a period. After summing up some experience, several other selected provinces are added into the pilot program. Likewise, experience is reviewed and / or advices are solicited from the public afterwards. Then, a final adjusted policy will be nationwide implemented. – This is wise, prudent and necessary for a policy to be a good one, and to avoid problems in a wider scope in the course of implementation.
According to the Annual Report of the Development of Chinese Social Insurance 20162, the number of people who participate old-age insurance reaches 887.77 million, who participate basic health care insurance reaches 743.92 million, occupational injury insurance 218.89 million, unemployment insurance 180.89 million, and maternity insurance 184.51 million (Ministry of Human Resources and Social Security of the People’s Republic of China, November 24th, 2017). Economic development is always the base of welfare provision. As the development of Chinese economy, more generous and higher standard welfare policies will be provided gradually in future.
iii) Melbourne Mercer Global Pension Index
The Melbourne Mercer Global Pension Index (MMGPI) compares the retirement income systems of an increasing number of countries annually since 2009. The MMGPI 2017 compares 30 countries and is constructed by 3 sub-indices, respectively adequacy, sustainability and integrity, further calculated using more than 40 indicators (Mercer, 2017, p. 5). Index values which range between 0 and 100 are divided, unequally, into 7 categories, represented by A, B+, B, C+, C, D and E. According to the MMGPI 2017, the pension systems of all the Nordic countries perform outstandingly, especially Denmark of which the retirement income system ranks highest out of 30 estimated countries, with an overall index grade of B+ and an overall index value of 78.9 (see, Mercer, 2017, pp. 6-7). Norway and Sweden follow Denmark not far away, ranking the top 3 of grade B with close values, while China falls into grade D (see, Mercer, 2017, p. 6). Table 2.17 presents more detail information of the pension indices of these selected countries from the MMGPI 2017 report.
Table 2.17 Pension Index of China, Denmark, Norway and Sweden, 2017 Country Overall Index Grade (Value) Sub-Index Grades (Values)
Adequacy Sustainability Integrity
1 In Chinese: 《关于完善企业职工基本养老保险制度的决定》. 2 The name of this report is author’s own translation.

Chapter 2: Some Socio-Economic Aspects of China and Scandinavia
133
Denmark B+ (78.9) B+ (76.5) B+ (79.8) A (81.3) Norway B (74.7) B+ (77.0) C+ (61.0) A (90.3) Sweden B (72.0) B (67.7) B (71.0) A (80.3) China D (46.5) C (54.2) D (38.2) D (46.0) Note: The range of the values is between 0 and 100 with which desirability increases and which is divided into 7 grades with grade A representing values >80, B+ representing 75~80, B (65~75), C+ (60~65), C (50~60), D (35~50) and E (<35) (see, Mercer, 2017, pp. 6-7). Source: Melbourne Mercer Global Pension Index 2017 (Mercer, 2017, pp. 5-9).
2.3.3 Equality
The “Denmark Canon” asked the question “Which social values, traditions or movements that have shaped us in Denmark will you carry through to tomorrow’s society?” to the Danish people about, such as, the values shaping the Danish society (Denmarkskanon, no date). The answers were collected through Facebook, Instagram and Twitter. After 2,425 people had given their answer, a list of 20 values was made out of these answers and 326,298 voted on this list. 10 values won out finally, they are respectively welfare society, freedom, trust, equality for the law, gender equality, the Danish language, associations and voluntary work, liberality/tolerance, hygge1, and the Christian heritage. As we see, equality was voted as one of the 10 values of Denmark, although it is not known which groups (such as, age groups or education groups) were more likely to vote.
Rothstein and Uslaner (2005) think that there is a circular relation between social trust, equality and welfare. They argue that social trust is caused by economic equality and equality of opportunity which can both be promoted by universal welfare like in the Scandinavian countries. However, the establishment and implementation of public policies also rely on both social trust and trust in government (Rothstein and Uslaner, 2005). Therefore, it is not easy for a country with low social trust to improve social trust by public policies, which results in a social trap (Rothstein and Uslaner, 2005). Bergh and Bjørnskov (2011) and Bjørnskov and Svendsen (2013) claim that they hold the opposite view to Rothstein et al who argue that universal welfare could cause generalized trust. Bjørnskov et al (Bergh and Bjørnskov, 2011; Bjørnskov and Svendsen, 2013) argue that the causal direction is from trust to universal welfare, rather than the other way around since “trusting populations are more likely to create and sustain large, universal welfare states” (Bergh and Bjørnskov, 2011, p. 1). Moreover, there is no lack of scholars who argue that the high social trust in the Scandinavian countries actually predates the formation of the extended welfare states. For example, Svendsen and Svendsen (2016, p. 198) also argue that the accumulation of social trust could be dated back to the Viking age when “social sanctioning by word of mouth” forming in the “long-distance trade practices” contributes to the “social trust accumulation” in Scandinavian welfare states.
Although Bergh and Bjørnskov (2011) and Bjørnskov and Svendsen (2013) argue that their view on the causal relation between high social trust and high welfare is opposite to that of Rothstein and Uslaner (2005), their opinions do not really contradict each other. Obviously, they are viewing from different perspectives and stressing different stages. What Bergh and Bjørnskov (2011) and
1 For what hygge is, see, Denmark.dk (no date c).

Trust and Development: The Deep Structure of Institutions-Building and Socio-Economic Performance
134
Bjørnskov and Svendsen (2013) stress is how high social trust facilitates the emergence of high welfare, namely the impact of high social trust before the establishment of generous welfare policies, while what Rothstein and Uslaner (2005) emphasizes is the possible relation of social trust and high welfare after the already implemented high welfare. It is not quite reasonable that social trust and welfare cannot have both the relations of opposite directions simultaneously. Social trust and welfare can benefit from each other. For example, a high trust society can possibly more easily pass high welfare policies, and established high welfare policies may maintain high social trust in some way to some extent. The fact, if it is, that high social trust predates high welfare in Scandinavia does not prohibit the possibility of their mutual improvement.
The relation between equality and extended welfare states could be mutually promoted. Equality contributes to the final establishment of extended welfare states, and extended welfare states in turn create equality. However, it should be noted that the former equality and the latter do not mean the same kind. Thus, the relation between equality and extended welfare states just stated is not as pointless as it is seen at the first glance. The equality that facilitates the initiation of extended welfare states may be attributed to general approval of something with similar nature of citizenship among all the nationals, while the equality that extended welfare states result in may go more to wealth or income distribution and / or social status.
When an agreement of a majority of nationals is needed, a necessary condition of the implementation of high welfare is probably the justification of equality among nationals. Equality here is that reflecting some basic and not differential characteristic of nationals, such as equality from basic citizenship, rather than being measured by economic or social status. Only if equality in citizenship is admitted and accepted in nationals’ values, can universal welfare policies be smoothly passed in democratic societies. Otherwise, for example, if equality in citizenship is not realized or equality is focused on other differential aspects, welfare could not be that universal.
What people, especially those who are not affluent enough, generally worry about is how to support themselves when getting old, ill and unemployed which threats the basic and normal life of people. Without a certain degree of universal and comprehensive welfare, people have to pay and save for these situations. Possible welfare polarization and market price-setting could result in a substance number of people who are struggling for subsistence, cannot afford housing, treatment and food due to some objective reasons. Relatively universal, comprehensive and generous welfare policies, together with their implementations, to a large degree alleviate or eliminate people’s worries about these problems and protect people from getting poorer and even further into a vicious circle of poverty and illness. Put another way, it is a sense of safety that is behind comprehensive, universal and generous welfare.
Only when compared with inequality can the advantages of equality become more prominent. Equality here mainly refers to that in material wealth. In an equal society, it is possible that the whole population is not affluent, while in an unequal society, there is probably, if not must, a proportion of population in poverty or encounters economic difficulties in life. In a society with a rather unequal distribution of wealth or income, the bad attempt to be predators, while the good fear being exploited and are prudent when dealing with others. Everybody familiar with his / her circumstance keeps a wary eye on others. The whole society is carrying on a zero-sum game. On contrast, in a more equal circumstance, no one has a lot more than others and no one has a lot less

Chapter 2: Some Socio-Economic Aspects of China and Scandinavia
135
than others; everybody is in almost the same economic status, which provides no obvious reasons to harbor hostility to, to take advantage of or to be wary of others.
Alesina and Rodrik (1994) implement a cross-country empirical analysis about the relationship between distributive politics and economic growth. In their model, Alesina and Rodrik (1994) hypothesize the “the distribution of income is monotonically related to the distribution of capital” (p. 466) and that “the distribution of assets is predetermined and remains constant” (p. 485). They conclude that inequality in income and wealth (measured by land ownership) distribution are inversely related to subsequent per capita growth rate (Alesina and Rodrik, 1994).
Table 2.18 and Table 2.19 respectively represent the Gini coefficients of market income and disposable income of China, Denmark, Norway and Sweden in selective years from OECD data. China has higher Gini coefficients of both market income and disposable income than the three Scandinavian countries. Comparing these two tables, it is quite obvious that the three Scandinavian countries also have high Gini coefficients before taxes and transfers, while their income inequality is reduced a lot by taxes and transfers. This is normal for the three Scandinavian countries since their taxation policies are intended to reduce income inequality, and they manage to do that in terms of the data of Gini coefficients. In addition, Table 2.20 shows the Gini coefficient of equivalised disposable income of Denmark, Norway and Sweden from Eurostat data, which also indicates the equality of disposable income in Scandinavia.
Table 2.18 Gini coefficients of market income (before taxes and transfers) of China, Denmark, Norway and Sweden.
Year China Denmark Norway Sweden 2004 -- -- 0.437 - 2008 -- -- 0.401 -- 2009 -- -- 0.401 -- 2010 -- -- 0.409 -- 2011 0.548 0.433 0.409 -- 2012 -- 0.436 0.41 -- 2013 -- 0.442 0.412 0.427 2014 -- 0.444 0.416 0.429 2015 -- -- 0.432 0.432
Notes: All Gini coefficients of market income above are from income before taxes and transfers, except that of China which is from income after taxes but before transfers. Gini coefficients are between 0 and 1, with smaller number representing relative equality. According to OECD.Stat, the definition of income after 2012 is different from that before 2012. The table above only keeps Gini coefficients calculated using income definition after 2012 and years when at least one country of China, Denmark, Norway and Sweden has data. Data source: OECD.Stat.
Table 2.19 Gini coefficients of disposable income (post taxes and transfers) of China, Denmark, Norway and Sweden.
Year China Denmark Norway Sweden 2004 -- -- 0.285 -- 2008 -- -- 0.25 --

Trust and Development: The Deep Structure of Institutions-Building and Socio-Economic Performance
136
2009 -- -- 0.245 -- 2010 -- -- 0.249 -- 2011 0.514 0.251 0.25 -- 2012 -- 0.249 0.253 -- 2013 -- 0.254 0.252 0.268 2014 -- 0.256 0.257 0.274 2015 -- -- 0.272 0.278
Notes: Gini coefficients of disposable income are calculated using income after taxes and transfers. Gini coefficients are between 0 and 1 with smaller number representing relative equality. According to OECD.Stat, the income definition after 2012 is different from that before 2012. The table above only keeps Gini coefficients calculated using income definition after 2012 and years when at least one country of China, Denmark, Norway and Sweden has data. Data source: OECD.Stat.
Table 2.20 Gini coefficient of equivalised disposable income of Denmark, Norway and Sweden 2009 2010 2011 2012 2013 2014 2015 2016 Denmark 26.9 26.9 26.6 26.5 26.8 27.7 27.4 27.7 Norway 24.8 24.1 24.4 24.8 24.9 25.4 25.2 27.6 Sweden 24.1 23.6 22.9 22.5 22.7 23.5 23.9 25.0
Note: Scale from 0 to 100. Source: Eurostat.
However, in terms of on which aspects the Nordic countries are exceptionally equal, Fochesato and Bowles (2015) have another opinion. Fochesato and Bowles (2015) take into account there three types of wealth, namely somatic wealth, relational wealth and material wealth. They construct a model from a world historical perspective that reveals “four causal mechanisms that could contribute to a relatively equal long-term stationary distribution of living standards” (p. 31) and apply “archaeological, ethnographic, and historical data” (p. 30) (including data of the Nordic countries and other advanced economies) to it (Fochesato and Bowles, 2015). They find that the Nordic economies do not show exceptionalism in terms of equality in material wealth or human capital (measured by years of schooling) (Fochesato and Bowles, 2015). However, the Nordic countries are more exceptionally egalitarian in terms of mobility in economic and social status, and inherited wealth from parents has a less impact on the living standards of offspring in those countries (Fochesato and Bowles, 2015).
Cho (2016) empirically proves that gender equality promotes social trust. The World Economic Forum has launched the Global Gender Gap Index since 2006 which is constructed by four sub-indices, namely economic participation and opportunity, educational attainment, health and survival, and political empowerment, respectively, and is in range of 0 to 1, with 0 representing imparity and 1 parity. Table 2.21 shows the index score of China, Denmark, Norway and Sweden from 2006 to 2017 and their rank in all countries included. In general, all the three Scandinavian countries rank high for gender equity, especially Norway and Sweden, while China most of the time ranks the second half of all countries included. In more detail, Norway consistently ranks the top three throughout these 12 years, with once ranking the first, six times the second and five times the third. Sweden never dropped out of the top five in the lists, with twice ranking the first, once the third,

Chapter 2: Some Socio-Economic Aspects of China and Scandinavia
137
eight times the fourth and once the fifth. On contrast, Denmark does not perform as excellent as its peer Scandinavian countries. In the first eight years, Denmark wanders between the seventh and the eighth. In 2014, namely the ninth year, Denmark jumped to the fifth, however, following by a drop to the 14th in 2015, further to the 19th in 2016 and then back to the 14th again in 2017. The ranks of China change relatively strongly. What is more, China ranks much lower than those three Scandinavian countries, with the best rank being the 57th in 2008 and the worst even being the 100th in 2017. Especially in recently years, the rank of China obviously and consistently decreases.
Table 2.21 Gender gap index of China, Denmark, Norway and Sweden, 2006 – 2017 Year Global index China Denmark Norway Sweden 2006 Score 0.6561 0.7462 0.7994 0.8133
Rank 63 / 115 8 / 115 2 / 115 1 / 115 2007 Score 0.6643 0.7519 0.8059 0.8146
Rank 73 / 128 8 / 128 2 / 128 1 / 128 2008 Score 0.6878 0.7538 0.8239 0.8139
Rank 57 / 130 7 / 130 1 / 130 3 / 130 2009 Score 0.6907 0.7628 0.8227 0.8139
Rank 60 / 134 7 / 134 3 / 134 4 / 134 2010 Score 0.6881 0.7719 0.8404 0.8024
Rank 61 / 134 7 / 134 2 / 134 4 / 134 2011 Score 0.6866 0.7778 0.8404 0.8044
Rank 61 / 135 7 / 135 2 / 135 4 / 135 2012 Score 0.6853 0.7777 0.8403 0.8159
Rank 69 / 135 7 / 135 3 / 135 4 / 135 2013 Score 0.6908 0.7779 0.8417 0.8129
Rank 69 / 136 8 / 136 3 / 136 4 / 136 2014 Score 0.6830 0.8025 0.8374 0.8165
Rank 87 / 142 5 / 142 3 / 142 4 / 142 2015 Score 0.682 0.767 0.850 0.823
Rank 91 / 145 14 / 145 2 / 145 4 / 145 2016 Score 0.676 0.754 0.842 0.815
Rank 99 / 144 19 / 144 3 / 144 4 / 144 2017 Score 0.674 0.776 0.830 0.816
Rank 100 / 144 14 / 144 2 / 144 5 / 144 Notes: Score is in range of 0 to 1, with 0 representing imparity and 1 parity. In the cells for ranks, the number before the sign “/” is the rank and the number after it is the total number of countries considered in the report in the corresponding year. Source: Global Gender Gap Index 2006 – 2017 (World Economic Forum, 2006, 2007, 2009, 2010, 2011a, 2011b, 2012, 2013, 2014, 2015, 2016, 2017).

Trust and Development: The Deep Structure of Institutions-Building and Socio-Economic Performance
138
2.3.4 Uncertainty
“Uncertainty” is nowadays often used in not only academic works but also daily life to describe unpredictability of future events. It basically has two elements, one is uncertainty of events, the other is uncertainty of future time. Thus, in reality, there are two types of uncertainty, one is that both events and future time are uncertain, the other is that some event is almost certain, while the relatively particular time of that event is not quite certain. Generally, there are two categories of uncertain things by which people get influenced: one is uncertainty of policies, which is a top-down type; the other is uncertainty of things like when to get sick, etc. 朝令夕改 (Pinyin: zhāo lìng xī gǎi), an idiom in China, literally meaning to issue an order in the morning but to change it in the evening, is a metaphor for often changing an order, a policy, etc. and is used to express one’s disapproval of this kind of behavior. For the latter case, in order to defend against uncertainty, the most common and effective way is to save money, especially where general welfare is not provided, although, certainly, saving is not only for uncertainty.
Various social protection policies play a big role in people’s life because they not only protect people from uncertain things but also certain ones. For example, that everyone will get old is a certain thing, while when to get sick is not quite certain. However, the distinction seems not quite meaningful here, although it is true, since they both usually are considered undesirable. Or we can think from another perspective. Namely, the biggest problem that people could encounter is that they may not be able to afford expenditures on old age, sickness, etc. in future by themselves, or get badly off because of those unpleasant things. Hence, (getting into) poverty becomes the major uncertainty in life. Various social protection policies can reduce the possibility of getting into poverty resulting from different sources, while poverty could induce many social problems. In a word, social protection policies to a large degree provide certainty for people’s life. Then another natural question is what guarantee the certainty of the implementation of social protection policies.
Changes are either to a good or a bad direction. From the perspective of personal feelings, changes of something or some situation to a good direction are always pleasant, while those to a bad one are not and often unacceptable. This is a normal and common mentality. Take welfare states as an example of people’s reaction to changes. As aforementioned, high welfare requires good economic operation as a precondition in essence. Economic prosperity creates jobs, which makes tax revenues get guaranteed. Issuing national debts is also adopted as a means by which a country can obtain government revenues and use them to support domestic affairs such as welfare expenditures. However, supporting high welfare using national debts is not a permanent solution and could be risky. A sluggish economy would make it more difficult for a country to borrow money from other countries and the interest rate of debts would increase since it becomes riskier for the debtor nation to pay interests and the principal. In addition, the implementation of high welfare also depends on the political aims of the ruling party / parties. In a welfare state, one may find that reducing welfare is often opposed by nationals of that country, even when it is rational to do so for the whole country in some situations such as during an economic recession, since people there have already be accustomed to high welfare and therefore are not satisfied with a reduction in it. The dependence on high welfare may be based on at least four mentalities: 1) the long period of “high tax, high welfare” has changed the consumption idea and saving habits and people do not have many savings for uncertainty; 2) some people do not want to put up with a reduction in their current living standard;

Chapter 2: Some Socio-Economic Aspects of China and Scandinavia
139
3) people who have already contributed much to taxes for a long time but not benefited from high welfare much yet may feel unfair; 4) some people may have an opportunism tendency and do not want to work, given that they are capable, in exchange for better life.
Changing back and forth usually harms others’ trust. In daily interpersonal interactions, a person always changing his / her mind could cause others trouble and is not reliable for others. Similarly, on the level of policy making, continuity of policies could provide certainty and a stable expectation for the public, while changing a policy about the same issue back and forth would cause uncertainty and could also damage people’s trust to politicians and people who support that policy. In reality, left-wing parties are the main ruling parties in the West for a long time. However, after the 2008 financial crisis, especially in recent years, the situation has changed in some Western countries with right-wing parties getting in power, which brings policy changes in those countries and feelings of uncertainty for many people. Additionally, there are western scholars who criticize interest groups existing in the contemporary Western democratic countries for lobbying which has led and / or would lead the forthcoming policies to represent benefits of interest groups, rather than the wider public.
It should be noted that (policy) changes per se do not definitely result in direct distrust in policy-makers or possible indirect distrust to other people in society. It depends on whether (the general trend of) a change is good or bad, or put another way, is trust-increasing or trust-decreasing. As long as a policy change (or reform) is fundamentally for problem-solving, for the interest of all the people, and right, it will increase trust to policy-makers and improve people’s welfare and standard of life.
In terms of the Western societies, one advantage of the Scandinavian countries could be their incorruption, in spite of the problems existing there. Uslaner (2005, p. 76) defines corruption as “illegal (or barely legal) behavior by political elites, to manipulate the affairs of state for private gain”. It is a common view that corruption could be detrimental to social (generalized) trust and economic performance. Although trust is required between corrupt persons during their corrupt transactions, trust in this situation is particularized, rather than generalized (Uslaner, 2005, 2013; You, 2012). Moreover, much research also provides empirical evidence for the negative relation between corruption and social trust. For example, La Porta et al (1997) demonstrate that general trust is significantly negatively associated with corruption. Uslaner (2005) shows that corruption and (general) trust are reciprocal, while change in trust leads to less change in corruption, but not the other way around. The empirical research of You (2012) shows that both macro-level corruption and individual perceived corruption are significantly negatively associated with individual general (social) trust across countries. Uslaner (2013) demonstrates that generalized trust and corruption have a reciprocal negative relation, and shape each other. What is more, Uslaner (2013) shows that many institutions supposed to improve general trust and restrain corruption turn out to have no impact on either corruption or trust:
Note the absence of institutional effects for either corruption or trust: Neither democracy, centralization, parliamentary system, the form of the electoral list, the type of executive freedom of the press, the efficiency or the independence of the courts, the quality of the bureaucracy or how much public servants are paid, nor a summary measure of governmental effectiveness from survey of elites by the World Economic Forum affects corruption. No institutional factor – not even democracy – leads to more

Trust and Development: The Deep Structure of Institutions-Building and Socio-Economic Performance
140
trust. The omly [only] institutional variable that matters Is the fairness of the legal system, the perception (of elites from the Economist Intelligence Unit) that the rich and the poor receive equal treatment under the law. (pp. 3605-3606)
Every year since 1995, the Transparency International, a non-governmental organization, releases the Corruption Perceptions Index (CPI) which is a composite index drawing on 13 data sources of experts’ and business people’s perceptions of corrupt behaviors in the public sector of different countries and territories (Transparency International, 2017). “During the past 20 years, both the sources used to compile the Index and the methodology have been adjusted and refined. In 2012, important changes were made to the methodology to allow for score comparison across time, which is not possible prior to 2012” (Transparency International, 2017, p. 1). However, it should be noted that the CPI also has shortcomings (Lin and Yu, 2014). For example, it only considers the opinions of foreign experts and business people, but not takes into account that of the local people (Lin and Yu, 2014). However, “global expert assessments have their particular predispositions and idiosyncrasies” (Lin and Yu, 2014, p. 153). But it does not mean that local perceptions have no shortcomings (see, Lin and Yu, 2014). Anyway, Table 2.22 shows the scores of the CPI of China, Denmark, Norway and Sweden from 2012 to 2017. The index is scored from 0 to 100 with 0 representing most corrupt and 100 cleanest. In 2017, 180 countries and territories are incorporated in this index in total. From Table 2.22, it is clear that the overall trend of the CPI of each country is rather steady. More specifically, the three Scandinavian countries rank in the top 10 cleanest countries or territories in 2017, while China ranks 77, which indicates that in general, there is a big gap between the corruption perceptions of China and the other three countries.
Table 2.22 Corruption perceptions indices of China, Denmark, Norway, and Sweden, 2012-2017. 2017 Rank
Country 2017 Score
2016 Score
2015 Score
2014 Score
2013 Score
2012 Score
77 China 41 40 37 36 40 39 2 Denmark 88 90 91 92 91 90 3 Norway 85 85 88 86 86 85 6 Sweden 84 88 89 87 89 88
Notes: The score of corruption perceptions index is in range 0 to 100, with 0 representing most corrupt and 100 cleanest. Source: Transparency International1.
Where there is difference in power / authority, there is possibility of corruption. A lack of some authority / power may stimulate people to exchange materials, such as money, etc. for access. However, a well-functioning accountability system could probably be a relatively essential and effective method of preventing corruption.
2.4 Social mobility and geographic mobility in China
2.4.1 Social mobility
1 For complete data of all countries, see, Transparency International (2017).

Chapter 2: Some Socio-Economic Aspects of China and Scandinavia
141
Social mobility refers to individual person’s mobility between different social strata within a society. Several questions in Chinese General Social Survey (CGSS) 2015 are informative for the social mobility in the Chinese society. Specifically, it asks “In our society, some are on upper strata of the society, while some are on lower ones. […] The highest score ‘10’ represents the highest stratum, and the lowest score ‘1’ represents the lowest stratum. 1. Which stratum do you think you are currently / now on? […] 4. Which stratum do you think your family was on when you were at 14 years old ?” 1 Chinese General Social Survey (CGSS) 2015 asks two questions about socio-economic status to interviewees. Therein, one is “Compared with peers, what do you think about your socio-economic status?”, with three options, “relatively high”, “almost the same” and “relatively low”2; The other is “Compared with three years ago, what do you think about your socio-economic status”, also with three options, “increase”, “almost the same” and “decrease”3. CGSS 2015 contains 10968 observations totally. Figure 2.5 compares the distribution of the interviewees’ subjective social stratum at their 14 years old and currently. Obviously, the interviewees’ distribution of subjective social stratum currently is much less right-skewed than that at 14 years old, which indicates that many people therein have moved upward, rather than being locked in the social stratum of their family. It should be noted that, currently interviewees have different age. In addition, the improvement of the overall living standard of China may also play some role in respondents’ perceived socio-economic status. Figure 2.6 presents subjective socio-economic status compared with peers. Most interviewees’ think that they have almost the same socio-economic status or even lower compared with peers, while only a small proportion consider that they have higher status. Figure 2.7 shows subjective socio-economic status compared with three years ago. A substantial proportion of the interviewees think their socio-economic status have increased, while there are also many people fall into the opposite situation.
Figure 2.5 Subjective social stratum at 14 years old and currently.
1 See question A43 in the questionnaire of CGSS 2015 (National Survey Research Center at Renmin University of China, 2015a). 2 See question B1 in the questionnaire of CGSS 2015 (National Survey Research Center at Renmin University of China, 2015a). 3 See question B2 in the questionnaire of CGSS 2015 (National Survey Research Center at Renmin University of China, 2015a).
2280
2312
2187
1519
1589
466
209
118
60 37 191
845
711
1472
2047
3800
1267
482
158
27 53 106
0
500
1000
1500
2000
2500
3000
3500
4000
Num
ber o
f int
ervi
ewee
s
Subjective social stratum
14 years old
Now

Trust and Development: The Deep Structure of Institutions-Building and Socio-Economic Performance
142
Data source: Chinese General Social Survey 2015 (National Survey Research Center at Renmin University of China, 2015a, 2015b).
Figure 2.6 Subjective socio-economic status compared with peers Data source: Chinese General Social Survey 2015 (National Survey Research Center at Renmin University of China, 2015a, 2015b).
Figure 2.7 Subjective socio-economic status compared with 3 years ago Data source: Chinese General Social Survey 2015 (National Survey Research Center at Renmin University of China, 2015a, 2015b).
When talking about social mobility in China, the national higher education entrance examination of China is worthy of mention, that is, 高考 (pinyin: gāo kǎo), written as gaokao in English. Gaokao has a high degree of fairness for examinees, although it has defects also. In general, gaokao provides examinees with equal opportunities for competition to enter different universities and majors according to their examination results regardless of family background, which objectively results in that those from families of higher socio-economic conditions are prevented from crowding out others because of their family advantages to some degree and that those from relatively poor families and the rural areas have an opportunity to improve socio-economic status via education rather than being firmly locked in the relatively worse conditions from generation to generation. In a word, gaokao, to a remarkable degree, has played and is playing an irreplaceable role in social mobility in China.
Chinese people generally think highly of achieving a higher socio-economic position by personal effort and labor. However, due to the uneven distribution of educational resources, the inadequacy of educational resources of high quality, the highly positive influences of better financial condition
525
6714
3664
650
2000
4000
6000
8000
Relativelyhigh
Almost thesame
Relativelylow
No answer
Num
ber o
fin
terv
iew
ees
Socio-economic status compared with peers
3768
6022
112058
02000400060008000
Haveincreased
Almost thesame
Havedecreased
No answer
Num
ber o
f in
terv
iew
ees
Socio-economic status compared with 3 years ago

Chapter 2: Some Socio-Economic Aspects of China and Scandinavia
143
and higher educational background of family on children’s education, the severe competition in China, etc., those from not affluent or financially normal families and / or areas have to make much more effort and / or devote more time to improve their socio-economic position.
2.4.2 Geographic mobility
(i) China’s Huji system and Hukous
Huji (in Chinese: 户籍) system is Chinese system of household registration and management. The dual huji institution classifies hukous (in Chinese: 户口) into two types: agricultural hukous and non-agricultural hukous. Literally, hu (in Chinese: 户) means household, and kou (in Chinese: 口) means mouth and refers to every individual person. Every person in a hu is registered in a same hukou booklet.
At first, hukous were made only for urban residents. On July 16th, 1951, the Provisional Ordinance of Urban Hukou Management1 was enacted by the Ministry of Public Security of the People’s Republic of China and was enforced from that day on. As the name shows, this ordinance has not yet regulated those who live in the countryside. This first item of this ordinance also states the freedom of migration.
In November, 1953, the Government Administration Council of the Central People’s Government of P.R. China2 issued Order of the Government Administration Council of the Central People’s Government about the Planned Purchasing and Planned Provision of Grain which stipulates peasants who produce grain should sell surplus grain to the nation’s corresponding departments according to planned purchasing kinds of grain, purchasing price and quantity, and then urban residents can buy grain planned to provide from the nation’s corresponding departments (People’s Republic of China. Government Administration Council of the Central People’s Government, 1953).
On January 9th, 1958, Hukou Registration Ordinance of the People’s Republic of China3 was enacted of which Article 6 stipulates that citizens should register as a permanent resident where they often live, and each citizen can only at one place register as a permanent resident (People’s Republic of China. National People’s Congress, 1958).
In 1963, the Ministry of Public Security of P.R. China classified hukous into agricultural hukous and non-agricultural hukous according to whether a household had access to community grain of the nation’s planned provision.
In 1997, the State Council released the Circular of the State Council on the Pilot Reform Plan of the Ministry of Public Security for the Household Residential Registration System in Small Cities and Towns and the Proposals on Improving the Household Residential Registration System in Rural Areas (People’s Republic of China. State Council, 1997). The Pilot Reform Plan for the Household Residential Registration System in Small Cities and Towns, approved and circulated in June, 1997, allowed those from rural areas to register permanent urban hukou conditionally in small cities and
1 Author’s own translation. In Chinese: 《城市户口管理暂行条例》. 2 The Government Administration Council of the Central People’s Government of P.R. China was established in October, 1949 and was dissolved in September, 1954. 3 Author’s own translation.

Trust and Development: The Deep Structure of Institutions-Building and Socio-Economic Performance
144
towns, however not including large or medium-sized cities, especially megacities like Beijing, Tianjin, Shanghai etc. (General Office of the State Council of the People’s Republic of China, 1997b, pp. 869-870). The Proposals on Improving the Household Residential Registration System in Rural Areas, which was approved at the same time with the Pilot Reform Plan in June, 1997, aimed to unify the Huji registration system between rural areas and urban areas (General Office of the State Council of the People’s Republic of China, 1997c, pp. 872-873). Additionally, in the Decision on Abolishing Some Departmental Rules1 , which was issued on September 3rd, 2004, Provisional Ordinance of Urban Hukou Management issued in 1951 was abolished (People’s Republic of China. Ministry of Public Security, 2004).
On July 30th, 2014, the Guideline of the State Council on Further Accelerating Huji System Reform2 was issued, which cancelled the classification of agricultural and non-agricultural hukous, and unifies hukou registration system. (People’s Republic of China. State Council, 2014)
In December, 2009, Zhongshan city in Guangdong province of China became the first to implement a point-based household registration system for floating population. After that, some other cities also followed up, including Beijing, Shanghai and Tianjin. For example, the Administrative Measures of the Point-based Household Registration of Beijing (For Trial Implementation)3 was issued on August 11th, 2016, and will be valid from January 1st, 2017 to December 31st, 2019 (People’s Government of Beijing Municipality, 2016).
In recent years, some cities make a “war of competing for population / talents” (In Chinese, “抢人
大战”), and the “war” is now ongoing. In this “war”, cities involved all provide various preferential measures, including looser hukou-settling policy, to attract people to stay or to come. Many cities have “joined” and perform actively in this “war”, especially new first-tier and second-tier cities such as Chengdu, Wuhan, Nanjing, Xi’an, Zhengzhou, etc. Zhongshan, the first city to implement a point-based household registration system, has abolished that system and further implements an easier hukou-settling policy. Behind this “war” could be the transformation and upgrading of local industry and the adjustment of its economic structure supported by the human capital of inflow population and the demand stimulation for local real estate market supported by inflow population. Even megacities like Beijing, China’s national capital, and Shanghai, one of China’s financial centers, have also provides more preferential conditions in their point-based hukou-settling system, although they have not totally given it up.
(ii) Floating population
The term floating population is actually based on the ever dual Huji system of China. Floating population refers to,
[…] the population of residence-registration inconsistency excluding those intra-city ones. Population of intra-city residence-registration inconsistency refer to those whose residing streets or towns and registered ones are inconsistent but still in the same municipality or prefecture city either the two are in the same district or different ones”
1 Author’s own translation. 2 Author’s own translation. 3 Author’s own translation.

Chapter 2: Some Socio-Economic Aspects of China and Scandinavia
145
and population of residence-registration inconsistency refers to “those who have been residing in places other than the registered streets or towns and been away from their registration areas for over half a year. (China Statistical Yearbook – 2017, p. 51)
Table 2.23 presents the size and annual growth rate of floating population and population of residence-registration inconsistency in China from 2000 to 2016. Within 17 years, the size of population of residence-registration inconsistency has increased from 144 million to 292 million, and that of floating population from 121 million to 245 million. The annual growth rate of both population of residence-registration inconsistency and floating population present a negative growth rate in 2015 and 2016.
Table 2.23 Population of residence-registration inconsistency and floating population in China, 2000 – 2016.
Year Population of Residence-Registration
Inconsistency Floating Population
Size (100 million) Annual growth rate Size (100 million) Annual growth rate
2000 1.44 --- 1.21 --- 2005 --- --- 1.47 21.49% 2010 2.61 --- 2.21 50.34% 2011 2.71 3.83% 2.3 4.07% 2012 2.79 2.95% 2.36 2.61% 2013 2.89 3.58% 2.45 3.81% 2014 2.98 3.11% 2.53 3.27% 2015 2.94 -1.34% 2.47 -2.37% 2016 2.92 -0.68% 2.45 -0.81%
Notes: “Data of 2000 and 2010 are based on the National Population Census and the rest are estimates based on annual national sample surveys of population.” (China Statistical Yearbook – 2017, p. 32) Annual growth rates of population residence-registration inconsistency and floating population are author’s own calculation. Data source: China Statistical Yearbook – 2017 (National Bureau of Statistics of the People’s Republic of China, 2017, p. 32).
(iii) Hukou and rights attached
Not only does Hukou act as the way of household registration, but also many rights are attached to it, such as employment, children’s education, social security, public services and so on, although at first Hukou is not definitely associated with various welfare, public services, etc. (Ge, 2016) However, with economic development and the corresponding accelerated internal migration (including migrant workers), the association of Hukou and public services etc. gets more and more unsuited to that situation. The migrant workers are an example. As economy develops, the demand for migrant workers increases. They contribute a lot to urban construction and development. However, corresponding institutional adjustments do not follow up. Rural Hukou limits their access to various local public services etc. in relation to local people. Now, with the gradual Huji reform, situations like this have improved and are improving. Migrant workers now can get several kinds of subsidies, namely children’s education subsidy, high-temperature subsidies, house-purchasing subsidy, start-ups subsidy; migrant students can participate Gaokao in his / her current living

Trust and Development: The Deep Structure of Institutions-Building and Socio-Economic Performance
146
province, if the corresponding requirements of that province are met, not having to return to where their Huji is any more. In a word, gradually reducing limiting conditions on hukou-change, or even weakening limits from Huji has become a trend.
2.5 Social capital
2.5.1 What is social capital?
Bourdieu (1986) thinks that:
Social capital is the aggregate of the actual or potential resources which are linked to possession of a durable network of more or less institutionalized relationships of mutual acquaintance and recognition – or in other words, to membership in a group – which provides each of its members with the backing of the collectivity-owned capital, a ‘credential’ which entitles them to credit, in the various senses of the word. (pp. 248-249)
An obvious view that Bourdieu (1986) holds is that social capital is related to a group with a clearly defined boundary. Coleman (1988) thinks that the definition of social capital is function-based. He considers social capital as a concept capturing different entities which “consist of some aspect of social structures” and “facilitate certain actions of actors” (Coleman, 1988, p. S98), and proposes three forms of social capital, namely “obligations and expectations, information channels, and social norms” (Coleman, 1988, p. S95). According to Putnam et al (1993, p.167), “Social capital […] refers to features of social organization, such as trust, norms, and networks, that can improve the efficiency of society by facilitating coordinated actions.” In terms of networks, Putnam et al (1993, p.176) emphasize the positive role of horizontal networks of civic engagement in political and economic performance, compared with vertical networks. Nahapiet and Ghoshal (1998, p. 243), scholars in management, “define social capital as the sum of the actual and potential resources embedded within, available through, and derived from the network of relationships possessed by an individual or social unit” and divide social capital into three (interrelated) dimensions, i.e., “the structural, the relational, and the cognitive” dimension. Furthermore, they classify trust, trustworthiness and norms etc. into the relational dimension of social capital (Nahapiet and Ghoshal, 1998, p. 244). Ostrom (1999, p. 176) defines social capital as “the shared knowledge, understandings, norms, rules, and expectations about patterns of interactions that groups of individual bring to a recurrent activity”. Lin (2002) thinks that social capital is a kind of capital that is captured through social relations (p.19) and that social capital is rooted in “individual interactions and networking” (p.26). He views social capital as a relational asset, rather than a collective asset like culture, trust and norms, which is different from Coleman and Putnam (Lin, 2002, p. 26). The differences between the opinions on social capital of Putnam (1993) and Lin (2002) are that: 1) The perspective of Putnam et al (1993) is more oriented to collectivity, while that of Lin (2002) is more oriented to individuals; 2) The perspective of Putnam et at (1993) is backward, is a perspective of input; he emphasizes more what bolsters social capital. Relative to Putnam et al (1993), the perspective of Lin (2002) is forward, is a perspective of output; he stresses more what social capital can bring. Burt (2000) pays more attention to the network structure of social capital. He states that
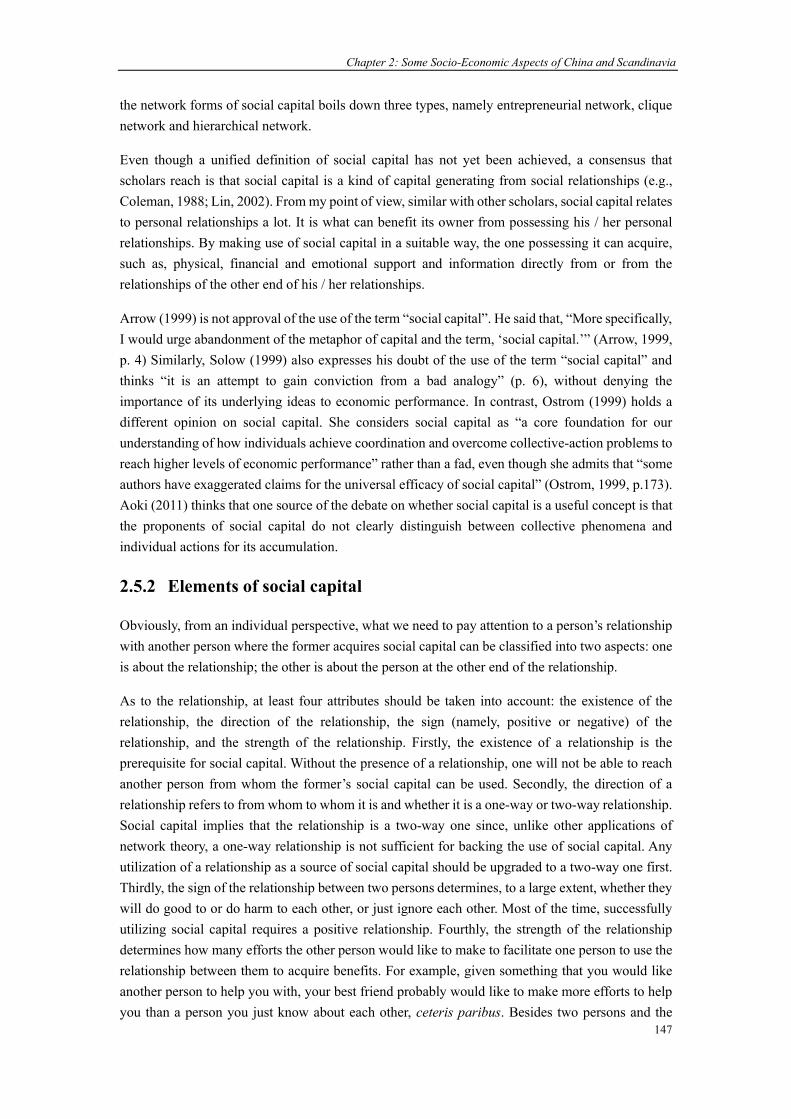
Chapter 2: Some Socio-Economic Aspects of China and Scandinavia
147
the network forms of social capital boils down three types, namely entrepreneurial network, clique network and hierarchical network.
Even though a unified definition of social capital has not yet been achieved, a consensus that scholars reach is that social capital is a kind of capital generating from social relationships (e.g., Coleman, 1988; Lin, 2002). From my point of view, similar with other scholars, social capital relates to personal relationships a lot. It is what can benefit its owner from possessing his / her personal relationships. By making use of social capital in a suitable way, the one possessing it can acquire, such as, physical, financial and emotional support and information directly from or from the relationships of the other end of his / her relationships.
Arrow (1999) is not approval of the use of the term “social capital”. He said that, “More specifically, I would urge abandonment of the metaphor of capital and the term, ‘social capital.’” (Arrow, 1999, p. 4) Similarly, Solow (1999) also expresses his doubt of the use of the term “social capital” and thinks “it is an attempt to gain conviction from a bad analogy” (p. 6), without denying the importance of its underlying ideas to economic performance. In contrast, Ostrom (1999) holds a different opinion on social capital. She considers social capital as “a core foundation for our understanding of how individuals achieve coordination and overcome collective-action problems to reach higher levels of economic performance” rather than a fad, even though she admits that “some authors have exaggerated claims for the universal efficacy of social capital” (Ostrom, 1999, p.173). Aoki (2011) thinks that one source of the debate on whether social capital is a useful concept is that the proponents of social capital do not clearly distinguish between collective phenomena and individual actions for its accumulation.
2.5.2 Elements of social capital
Obviously, from an individual perspective, what we need to pay attention to a person’s relationship with another person where the former acquires social capital can be classified into two aspects: one is about the relationship; the other is about the person at the other end of the relationship.
As to the relationship, at least four attributes should be taken into account: the existence of the relationship, the direction of the relationship, the sign (namely, positive or negative) of the relationship, and the strength of the relationship. Firstly, the existence of a relationship is the prerequisite for social capital. Without the presence of a relationship, one will not be able to reach another person from whom the former’s social capital can be used. Secondly, the direction of a relationship refers to from whom to whom it is and whether it is a one-way or two-way relationship. Social capital implies that the relationship is a two-way one since, unlike other applications of network theory, a one-way relationship is not sufficient for backing the use of social capital. Any utilization of a relationship as a source of social capital should be upgraded to a two-way one first. Thirdly, the sign of the relationship between two persons determines, to a large extent, whether they will do good to or do harm to each other, or just ignore each other. Most of the time, successfully utilizing social capital requires a positive relationship. Fourthly, the strength of the relationship determines how many efforts the other person would like to make to facilitate one person to use the relationship between them to acquire benefits. For example, given something that you would like another person to help you with, your best friend probably would like to make more efforts to help you than a person you just know about each other, ceteris paribus. Besides two persons and the

Trust and Development: The Deep Structure of Institutions-Building and Socio-Economic Performance
148
relationship between them, other characteristics of a relationship should also be considered, such as, what is maintaining a relationship and the nature of a relationship. Some kinds of relationships are relatively natural, objective and a matter of fact, while others are not that objective and more emotional. Examples in the former case are classmates, memberships of the same group, from the same birthplace, and so on; the latter refers to relationships of trust, friendship, and so on. Of course, in many cases, objective relationships and subjective emotions are bound together. Additionally, we should know that trust is a sufficient but not necessary condition of social capital. In a word, the total social capital one possesses hinges on both the quantity and quality of the relationships in his / her egocentric network.
Granovetter (1973) discovered a phenomenon that heterogeneous information in weak ties of one’s social network plays a crucial role in job searching. This case is more proper to be attributed to the other person at the other end of a relationship, rather than to the relationship per se. The impact of the person at the other end of a relationship (the requested person) on the use of the social capital of a person at one end (the requesting person) is at least threefold. The first is from the former person (the requested person) himself / herself, such as his / her own physical or financial power, human capital (such as professional knowledge), or information advantage etc. The second is from the vertical position of the former person in his / her circle. A typical example is his / her discourse power acquired from a vertical position and its derived influence. The third is from the social capital of the requested person. For example, suppose you ask your friend for help, but, unfortunately, (s)he is not capable of solving the problem himself / herself. However, (s)he asks another person whom (s)he knows and who can probably successfully deal with it. This is how the requested person mobilizes his / her social capital to fulfill the use of the social capital of the requesting person.
Many scholars would emphasize the possibly crucial heterogeneous information existing in weak ties like Granovetter (1973). It is true and a fact. But we should also realize that the reason why information in strong ties gets homogeneous is that frequent contacts, communication and information sharing with those in strong ties have already accelerated information flow among them. Put another way, information in strong ties also experiences a process from heterogeneity to homogeneity, but just in a much quicker way.
2.5.3 People and channels of acquiring social capital
Individual social capital generates among the people they know. Put another way, social capital is contained in the network of one’s social relationships. As said in the last chapter, several characteristics of one’s network of social relationships can influence the social capital (s)he can mobilize, such as, how many people (s)he knows, heterogeneity of those people, how many people are in each category of heterogeneity, and the thickness of each relationship. Thus, the establishment of a relationship and its sustainment are the precondition for a relationship to become social capital.
In order to visually present individual social capital in China and Scandinavia in an aggregated form with data, some survey questions that involve the generation of, contain or reflect social capital to some degree and may be attractive to scholars whose research area lies in social capital are selected out to show here, besides data about family structure and membership presented in a previous section in this chapter (see, Section 2.2.4 and 2.2.5). Note that they may be hybrid, and thus not perfect or direct indicators of social capital for some reasons.

Chapter 2: Some Socio-Economic Aspects of China and Scandinavia
149
In the data presented in this part, some only contain the three Scandinavian countries, while some only contain China. This is because the four countries are not always in the same datasets where related questions are in. This would weaken the meaning of comparison to some degree. In spite of this fact, respective data are illustrated since they are still informative in terms of social capital.
(i) Number of siblings
Coleman (1988) distinguishes two sources of social capital: social capital in the family and that outside the family. Family is most of the time the first, strongest and most selfless source where one can and does acquire social capital. We can get not just physical, financial, emotional and informational support from our family members. What is more, usually and normally, the strength of family affection does not seem to dilute due to separation of a long distance or time. Therefore, attempts to isolate family ties from social capital research are not reasonable since they do function in an important way.
From an individual perspective, ceteris paribus, the more (not an unlimited many) relations a person has, the higher social capital he possesses. In terms of social capital from family, the more family members a person has, the more social capital he can usually get, ceteris paribus. Coleman (1988, p. S111), as many of us can perceive, thinks that “The number of siblings represents, in this interpretation, a dilution of adult attention to the child.” This fact does not influence that a tie with a sibling is probably much stronger than a non-sibling outside family (see Section 2.2.4 for family structure in Denmark and China).
(ii) Membership
Membership of voluntary organizations is treated as a measure of social capital (e.g., Putnam, 2000). In societies with a tradition of participating in various formal organizations, it could be more appropriate to measure social capital and compare it with each other. However, as said before, Chinese are not as keen as westerners on participating in various organizations; Chinese usually strengthen relationships during informal interactions. Thus, using membership as a cross-country measure of social capital is scope-limited (see Section 2.2.5 for a comparison of membership between Scandinavia and China).
(iii) Frequency of meeting people – Scandinavia
Granovetter (1973) treats frequency of meeting people as a measure of tie strength. Figure 2.8 depicts the responses from Denmark, Norway and Sweden about the question of “How often do you meet socially with friends, relatives or work colleagues?” in ESS (e.g., ESS 2014, Question C2). In general, it can be judged basically from that figure that Norway presents the highest frequency of meeting people, followed by Sweden and then by Denmark.
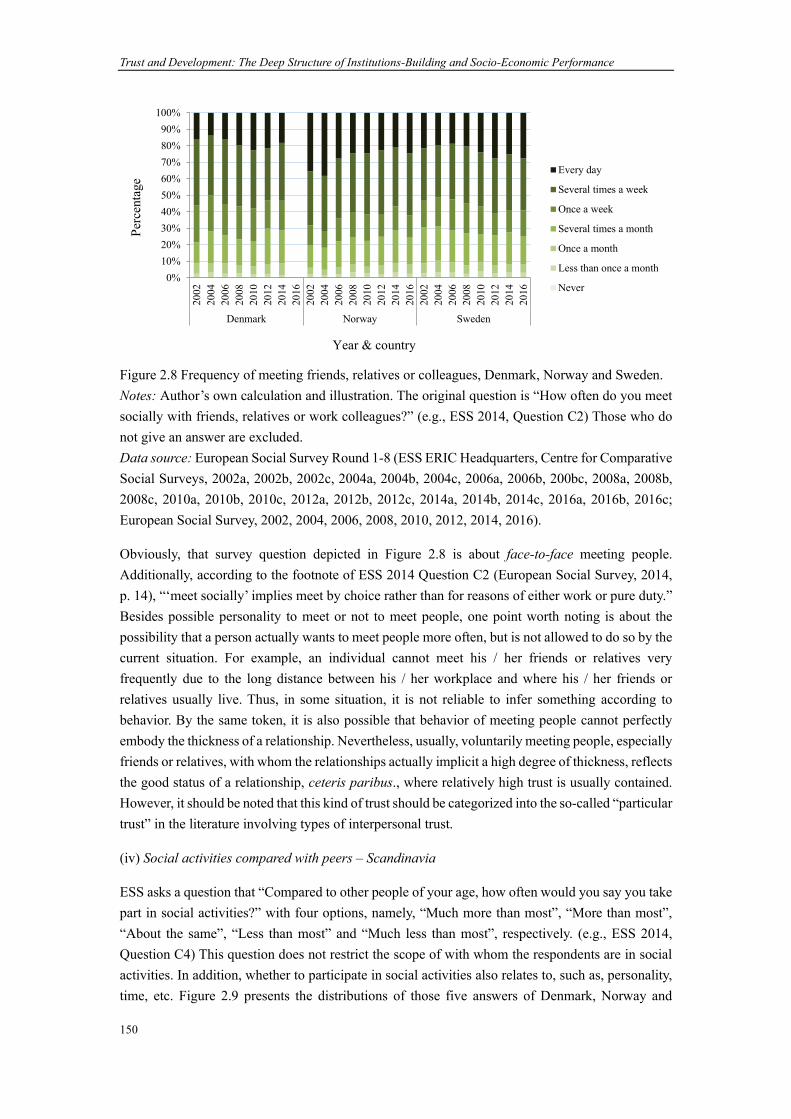
Trust and Development: The Deep Structure of Institutions-Building and Socio-Economic Performance
150
Figure 2.8 Frequency of meeting friends, relatives or colleagues, Denmark, Norway and Sweden. Notes: Author’s own calculation and illustration. The original question is “How often do you meet socially with friends, relatives or work colleagues?” (e.g., ESS 2014, Question C2) Those who do not give an answer are excluded. Data source: European Social Survey Round 1-8 (ESS ERIC Headquarters, Centre for Comparative Social Surveys, 2002a, 2002b, 2002c, 2004a, 2004b, 2004c, 2006a, 2006b, 200bc, 2008a, 2008b, 2008c, 2010a, 2010b, 2010c, 2012a, 2012b, 2012c, 2014a, 2014b, 2014c, 2016a, 2016b, 2016c; European Social Survey, 2002, 2004, 2006, 2008, 2010, 2012, 2014, 2016).
Obviously, that survey question depicted in Figure 2.8 is about face-to-face meeting people. Additionally, according to the footnote of ESS 2014 Question C2 (European Social Survey, 2014, p. 14), “‘meet socially’ implies meet by choice rather than for reasons of either work or pure duty.” Besides possible personality to meet or not to meet people, one point worth noting is about the possibility that a person actually wants to meet people more often, but is not allowed to do so by the current situation. For example, an individual cannot meet his / her friends or relatives very frequently due to the long distance between his / her workplace and where his / her friends or relatives usually live. Thus, in some situation, it is not reliable to infer something according to behavior. By the same token, it is also possible that behavior of meeting people cannot perfectly embody the thickness of a relationship. Nevertheless, usually, voluntarily meeting people, especially friends or relatives, with whom the relationships actually implicit a high degree of thickness, reflects the good status of a relationship, ceteris paribus., where relatively high trust is usually contained. However, it should be noted that this kind of trust should be categorized into the so-called “particular trust” in the literature involving types of interpersonal trust.
(iv) Social activities compared with peers – Scandinavia
ESS asks a question that “Compared to other people of your age, how often would you say you take part in social activities?” with four options, namely, “Much more than most”, “More than most”, “About the same”, “Less than most” and “Much less than most”, respectively. (e.g., ESS 2014, Question C4) This question does not restrict the scope of with whom the respondents are in social activities. In addition, whether to participate in social activities also relates to, such as, personality, time, etc. Figure 2.9 presents the distributions of those five answers of Denmark, Norway and
0%10%20%30%40%50%60%70%80%90%
100%
2002
2004
2006
2008
2010
2012
2014
2016
2002
2004
2006
2008
2010
2012
2014
2016
2002
2004
2006
2008
2010
2012
2014
2016
Denmark Norway Sweden
Perc
enta
ge
Year & country
Every day
Several times a week
Once a week
Several times a month
Once a month
Less than once a month
Never

Chapter 2: Some Socio-Economic Aspects of China and Scandinavia
151
Sweden from 8 waves of ESS. In general, the percentage of respondents who answer “Much more than most” and “More than most” is higher in Denmark and Sweden than that in Norway.
Figure 2.9 Frequency of taking part in social activities compared to peers. Notes: Author’s own calculation and illustration. The original question is “Compared to other people of your age, how often would you say you take part in social activities?” (e.g., ESS 2014, Question C4) Those who give no answer are excluded. In addition, Denmark is not in ESS 8 (namely ESS 2016). Data source: European Social Survey Round 1-8 (ESS ERIC Headquarters, Centre for Comparative Social Surveys, 2002a, 2002b, 2002c, 2004a, 2004b, 2004c, 2006a, 2006b, 200bc, 2008a, 2008b, 2008c, 2010a, 2010b, 2010c, 2012a, 2012b, 2012c, 2014a, 2014b, 2014c, 2016a, 2016b, 2016c; European Social Survey, 2002, 2004, 2006, 2008, 2010, 2012, 2014, 2016).
(v) Discussing intimate matters – Scandinavia
Those with whom one would like to discuss personal / intimate matters are usually those who are reliable and whom (s)he has a quite good relationship with, trusts in, turns to for help when needed, etc. ESS asks a question that “How many people, if any, are there with whom you can discuss intimate and personal matters?” with 7 options, namely “None”, “1” “2” “3” “4-6” “7-9” and “10 or more”, respectively (e.g., European Social Survey, 2016, Question C3). This question is often used in empirical research and to measure social capital. When asked this question, one would certainly only consider the people (s)he knows and has a rapport with, such as family members and intimate friends; no one would think of those (s)he does not know, although it is possible and often happen that one confides in somebody whom (s)he is not quite familiar with or who is actually far away from his / her life. For example, a young man who has frustrated by something and does not talking about it among his familiar fellows may tell his experience, sorrows and corresponding feelings to an old man living in a distant village where he travels to. However, this situation is obviously not the intention of this question, and not what is in the mind of overwhelmingly most respondents (if not all) when being asked this question.
Figure 2.10 presents how the respondents from Denmark, Norway and Sweden answer this ESS question. In Sweden, the percentage of respondents who choose “10 or more” is highest among the three countries, followed Denmark, and Norway. Sweden also has the largest proportion of interviewees who claim to have more than 7 persons to discuss personal matters (namely, including
0%10%20%30%40%50%60%70%80%90%
100%
2002
2004
2006
2008
2010
2012
2014
2016
2002
2004
2006
2008
2010
2012
2014
2016
2002
2004
2006
2008
2010
2012
2014
2016
Denmark Norway Sweden
Perc
enta
ge
Year & country
Much more than most
More than most
About the same
Less than most
Much less than most

Trust and Development: The Deep Structure of Institutions-Building and Socio-Economic Performance
152
who choose “7-9” and who choose “10 or more”). The same for Sweden for the percentage of respondents who choose more than 4 (namely, option “4-6”, “7-9” and “10 or more”). On contrast, Norway has the lowest average number of persons to whom one can talk personal matters. As we can see in Figure 2.10, its part of choosing less than 1 (including category “None” and “1”. Hereafter similarly), less than 2 and less than 3 are all largest among the three countries.
Figure 2.10 Number of persons to whom one can discuss intimate or personal matters. Notes: Author’s own calculation and illustration. Those who do not give an answer are excluded. In addition, Denmark is not in ESS 8. Data source: European Social Survey Round 6-8 (ESS ERIC Headquarters, Centre for Comparative Social Surveys, 2012a, 2012b, 2012c, 2014a, 2014b, 2014c, 2016a, 2016b, 2016c; European Social Survey, 2012, 2014, 2016).
(vi) Social activities in leisure time – China
Figure 2.11 depicts the frequency of having social activities in leisure time in China using data of CGSS 2010 – 2013 and 2015. In general, the self-reported frequency of participating in social activities in China has increased to some degree during those 6 years. However, more than 70% of the Chinese respondents sometimes or even less frequently take part in social activities in leisure time, with roughly 10% never participating in and 40% seldom.
0%
20%
40%
60%
80%
100%
2012 2014 2016 2012 2014 2016 2012 2014 2016
Denmark Norway Sweden
Perc
enta
ge
Year & country
10 or more
7 - 9
4 - 6
3
2
1
None

Chapter 2: Some Socio-Economic Aspects of China and Scandinavia
153
Figure 2.11 Social activities in leisure time, China. Notes: Author’s own calculation and illustration. Those who give no answer are excluded. Data source: Chinese General Social Survey (National Survey Research Center at Renmin University of China, 2010a, 2010b, 2011a, 2011b, 2012a, 2012b, 2012c, 2013a, 2013b, 2013c, 2015a, 2015b).
(vii) Diversity of occupations in social networks – China
Being linked to people of different occupations makes it possible getting support and help from people from different industries or areas. One question in CGSS 2012 Questionnaire A is “Is there anyone who belongs to the occupations below among your relatives, friends or the people with whom you have ever dealt?” with 10 different occupations, namely, “University lectures”, “Lawyers”, “Nurses”, “Programmers”, “Middle school teachers”, “HR managers”, “Peasants”, “Hairdressers”, “Receptionists” and “Policemen / Policewomen”, respectively 1 (CGSS 2012, Questionnaire A, Question N4). Figure 2.12 plots the respective proportion of each occupation which the respondents’ social network involves. From that figure, the largest proportion of respondents have relatives or friends of or have ever dealt with “Peasants”, followed by a gradually reducing proportion of “Middle school teachers”, “Nurses”, “Policemen / Policewomen”, “Hairdressers”, “University lectures”, “HR managers”, “Programmers”, “Receptionists”, “Lawyers”, respectively.
1 Author’s own translation from Chinese into English.
0%
20%
40%
60%
80%
100%
Perc
enta
ge
Year
Always
Often
Sometimes
Seldom
Never

Trust and Development: The Deep Structure of Institutions-Building and Socio-Economic Performance
154
Figure 2.12 Occupations in social networks, China. Notes: Author’s own calculation and illustration. CGSS 2012 has two questionnaires, namely questionnaire A and B. The question used is from questionnaire A. The total number of the respondents in questionnaire A is 5819. This figure excludes those who do not give an answer. Data source: Chinese General Social Survey (National Survey Research Center at Renmin University of China, 2012a, 2012c).
1256 8112017
1024
2709
1139
4874
1606844
1652
4554 49933737
4769
3097
4654
937
41944957
4153
0%
20%
40%
60%
80%
100%
Universitylecturers
Lawyers Nurses Programmers Middle schoolteachers
HR managers Peasants Hairdressers Receptionists Policemen/Policewomen
Perc
enta
ge
Occupation
No
Yes

Chapter 2: Some Socio-Economic Aspects of China and Scandinavia
155
Figure 2.13 summarizes how many different occupations are in the respondents’ social networks (namely, relatives, friends and those with whom they have ever dealt) with the same survey question with Figure 2.12. As expected, more respondents have less diversity of occupations in their social network, besides those who have nobody of the ten occupations listed in that survey question in their social network. The number of respondents who know people from more occupations reduces with a gradually increasing rate as the number of the kinds of occupations in social networks increase. As we can see in Figure 2.13, 1577 out of 5819 respondents claim that people in their social network are all from one kind of occupation. On contrast, only 91 respondents have a social network as diverse as 10 occupations. However, it should be noted that there are more than 10 occupations in reality.
Figure 2.13 Diversity of occupations in social networks, China Notes: Author’s own calculation and illustration. Those who are not give an answer are excluded. Data source: Chinese General Social Survey (National Survey Research Center at Renmin University of China, 2012a, 2012c).
2.6 Interpersonal trust
As aforementioned, and will be mentioned repeatedly in later chapters, information about others’ trustworthiness, honesty, goodwill, benevolence, etc. delivered through interactions and perceived is an important source that influences individual social trust. In terms of trust building, the most effective way is that everyone acts kindly, fairly, justly, rightly, and conforms to public virtues, morality, etc. Take economic exchanges as an example. Sellers should not sell shoddy goods with a price for good-quality goods. Fruit sellers should not use harmful substances on fruit only in order for fruit to look fresh and attractive. However, some factors in reality may stimulate people to achieve non-justified interest without taking others into account. Thus, law enforcement should be strengthened. Since poverty could cause many social problems, economic development and various welfare policies could therefore prevent some social problems to a large degree. There is a famous statement in the Guan Zi, “仓廪实,而知礼节;衣食足,而知荣辱” (Pinyin: cāng lǐn shí ér zhī lǐ
295
1577
1110
832
572454
356270
159 103 91
0
400
800
1200
1600
2000
0 1 2 3 4 5 6 7 8 9 10
Freq
uenc
y
Number of occupations

Trust and Development: The Deep Structure of Institutions-Building and Socio-Economic Performance
156
jié, yī shí zú ér zhī róng rǔ), meaning that only when people’s granaries are full and people have enough clothes and food can people pay attention to manners, honors and shames1. This sentence reflects the relation between individuals’ financial status and how to act acceptably in interpersonal interactions.
2.6.1 General trust
“Generally speaking, do you think most people can be trusted?” or similar questions have become the standard question of general trust in various surveys, just with different options. The general trust question in WVS and EVS has two valid options equivalent to “Yes” and “No”. Table 2.24 shows whether the general-trust data of China, Denmark, Norway and Sweden is in a particular wave of WVS or EVS with an “X” mark. Data of general trust of China only exists in WVS waves, while that of Denmark only exists in EVS waves. Norway’s and Sweden’s data is included in either WVS wave or EVS wave (excluding waves not covering their data), except that both WVS 4 and EVS 3 contain Sweden’s data and both WVS 5 and EVS 4 contain both Norway’s and Sweden’s data. When data for a particular country exists in both WVS and EVS of the same period, EVS data will be used later for graph.
Table 2.24 Data existence of general trust in WVS and EVS for China, Denmark, Norway and Sweden.
CN DK NO SE WVS-wave EVS-wave WVS EVS WVS EVS WVS EVS 1981-1984 1981-1984 X X X 1989-1993 1990-1993 X X X X 1994-1998 -- X X X 1999-2004 1999-2001 X X X X 2005-2009 2008-2009 X X X X X X 2010-2014 -- X X
Notes: CN is for China, DK for Denmark, NO for Norway, and SE for Sweden. If the general-trust data of a particular country exists in a particular wave of WVS or EVS, corresponding cell is marked with an “X”. Data source: World Values Survey (Inglehart et al, 2014a, 2014b, 2014c, 2014d, 2014e, 2014f), European Values Study (EVS, 2011a, 2011b, 2011c, 2016).
Figure 2.14 depicts the percentage of respondents in the four countries answering “Most people can be trusted” in each wave period. Generally, all the four countries have relatively high general trust level in the world (although other countries are not shown here). In the first two periods, Denmark actually has the lowest general trust level among the countries having data in those periods. However, in the fourth and fifth period, its general trust level rises to the highest with a percentage of 66.53% and 76.04% respectively. On contrast, Norway’s general trust level stays consistently high among the countries compared, with the lowest level being 60.86% in the first period and the highest being 75.09% in the fifth period, although it has only four data points in the figure. Sweden is the only country having data points in all the six periods. Its general trust level reaches 63.02% in the last
1 Author’s own translation from Chinese into English.

Chapter 2: Some Socio-Economic Aspects of China and Scandinavia
157
period, experiencing its lowest level of 56.59% in the third period and highest level of 70.69% in the fifth period. Except in the second period, China presents the lowest general trust level among the countries compared and having data points in corresponding periods. Its general trust level reaches 61.52% in the six period, experiencing its lowest level of 48.67% in the fifth period.
Figure 2.14 General trust in China, Denmark, Norway and Sweden. Data source: World Values Survey (Inglehart et al, 2014a, 2014b, 2014c, 2014d, 2014e, 2014f), European Values Study (EVS, 2011a, 2011b, 2011c, 2016).
Figure 2.15 presents the general trust of China from CGSS. The data is from the question “generally speaking, do you agree that most people in this society can be trusted?” in Chinese General Social Survey (CGSS) respectively in the year of 2010, 2011, 2012 and 2013. The options are a 5-point Likert item with 1 representing “Strongly disagree” and 5 “Strongly agree”. In 2010, the proportion answering “Strongly disagree”, “Disagree” or “Neither” is 34.68%. In 2011, this percentage is 37.33%. In 2012, 35.57%. In 2013, 44.29%. In 2015, 36.61%.
30.00%
40.00%
50.00%
60.00%
70.00%
80.00%
WVS 1981-1984
EVS 1981-1983
WVS 1989-1993
EVS 1989-1993
WVS 1994-1998
WVS 1999-2004
EVS 1999-2001
WVS 2005-2009
EVS 2008-2010
WVS 2010-2014
Perc
enta
ge
Wave
China
Denmark
Norway
Sweden
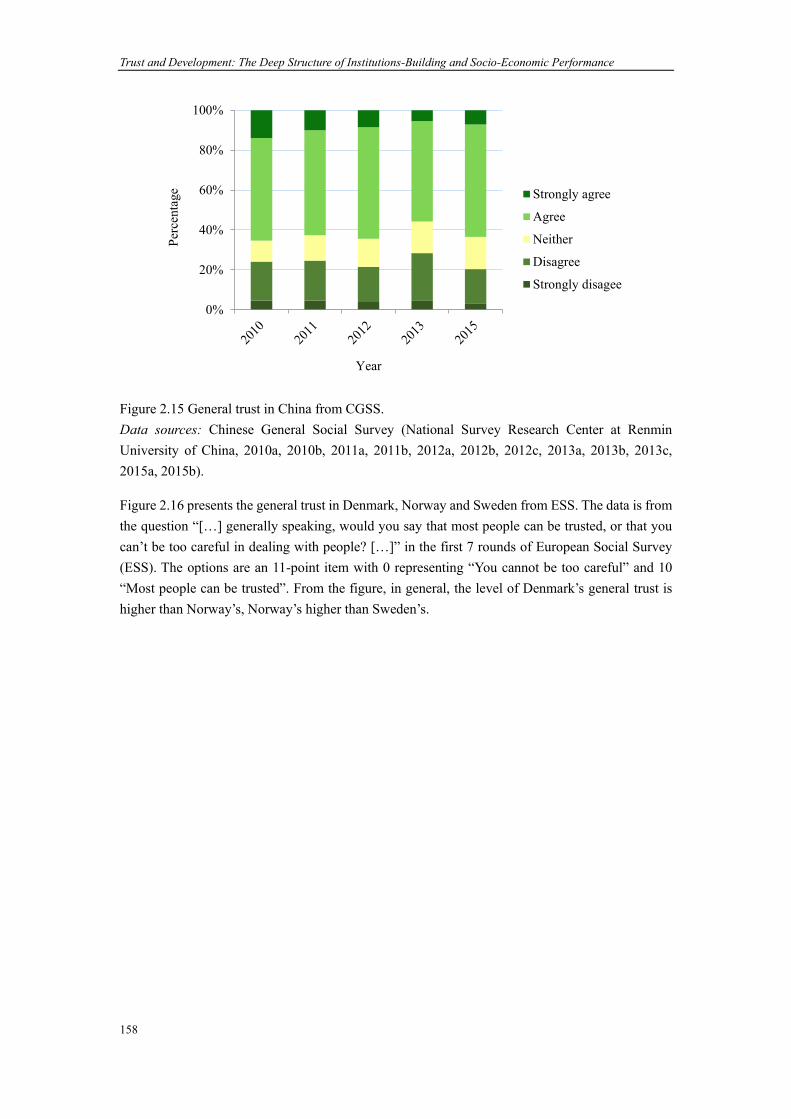
Trust and Development: The Deep Structure of Institutions-Building and Socio-Economic Performance
158
Figure 2.15 General trust in China from CGSS. Data sources: Chinese General Social Survey (National Survey Research Center at Renmin University of China, 2010a, 2010b, 2011a, 2011b, 2012a, 2012b, 2012c, 2013a, 2013b, 2013c, 2015a, 2015b).
Figure 2.16 presents the general trust in Denmark, Norway and Sweden from ESS. The data is from the question “[…] generally speaking, would you say that most people can be trusted, or that you can’t be too careful in dealing with people? […]” in the first 7 rounds of European Social Survey (ESS). The options are an 11-point item with 0 representing “You cannot be too careful” and 10 “Most people can be trusted”. From the figure, in general, the level of Denmark’s general trust is higher than Norway’s, Norway’s higher than Sweden’s.
0%
20%
40%
60%
80%
100%
Perc
enta
ge
Year
Strongly agree
Agree
Neither
Disagree
Strongly disagee

Chapter 2: Some Socio-Economic Aspects of China and Scandinavia
159
Figure 2.16 General trust of Denmark, Norway and Sweden, 2002 – 2016. Notes: Author’s own illustration. In addition, Denmark is not in ESS 2016. Data source: European Social Survey (ESS ERIC Headquarters, Centre for Comparative Social Surveys, 2002a, 2002b, 2002c, 2004a, 2004b, 2004c, 2006a, 2006b, 200bc, 2008a, 2008b, 2008c, 2010a, 2010b, 2010c, 2012a, 2012b, 2012c, 2014a, 2014b, 2014c, 2016a, 2016b, 2016c; European Social Survey, 2002, 2004, 2006, 2008, 2010, 2012, 2014, 2016).
0%
10%
20%
30%
40%
50%
60%
70%
80%
90%
100%
2002
2004
2006
2008
2010
2012
2014
2016
2002
2004
2006
2008
2010
2012
2014
2016
2002
2004
2006
2008
2010
2012
2014
2016
Denmark Norway Sweden
Perc
enta
ge
Year & country
Most people can be trusted
9
8
7
6
5
4
3
2
1
You cannot be too careful
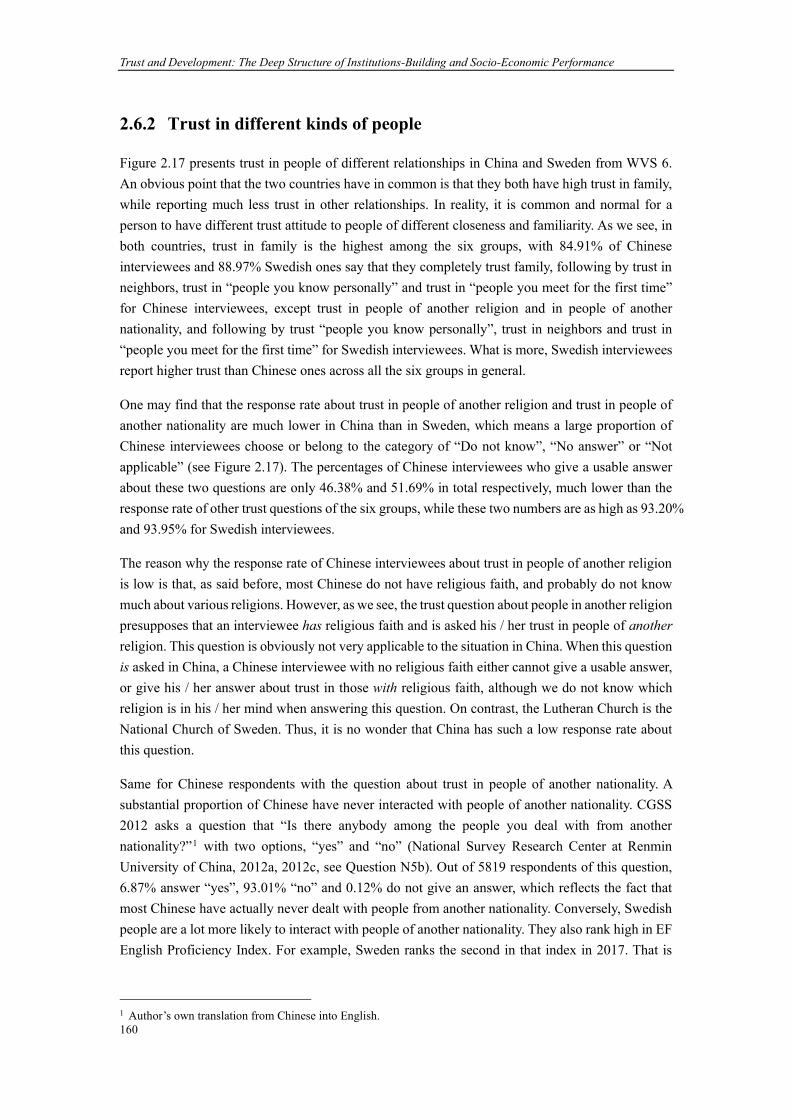
Trust and Development: The Deep Structure of Institutions-Building and Socio-Economic Performance
160
2.6.2 Trust in different kinds of people
Figure 2.17 presents trust in people of different relationships in China and Sweden from WVS 6. An obvious point that the two countries have in common is that they both have high trust in family, while reporting much less trust in other relationships. In reality, it is common and normal for a person to have different trust attitude to people of different closeness and familiarity. As we see, in both countries, trust in family is the highest among the six groups, with 84.91% of Chinese interviewees and 88.97% Swedish ones say that they completely trust family, following by trust in neighbors, trust in “people you know personally” and trust in “people you meet for the first time” for Chinese interviewees, except trust in people of another religion and in people of another nationality, and following by trust “people you know personally”, trust in neighbors and trust in “people you meet for the first time” for Swedish interviewees. What is more, Swedish interviewees report higher trust than Chinese ones across all the six groups in general.
One may find that the response rate about trust in people of another religion and trust in people of another nationality are much lower in China than in Sweden, which means a large proportion of Chinese interviewees choose or belong to the category of “Do not know”, “No answer” or “Not applicable” (see Figure 2.17). The percentages of Chinese interviewees who give a usable answer about these two questions are only 46.38% and 51.69% in total respectively, much lower than the response rate of other trust questions of the six groups, while these two numbers are as high as 93.20% and 93.95% for Swedish interviewees.
The reason why the response rate of Chinese interviewees about trust in people of another religion is low is that, as said before, most Chinese do not have religious faith, and probably do not know much about various religions. However, as we see, the trust question about people in another religion presupposes that an interviewee has religious faith and is asked his / her trust in people of another religion. This question is obviously not very applicable to the situation in China. When this question is asked in China, a Chinese interviewee with no religious faith either cannot give a usable answer, or give his / her answer about trust in those with religious faith, although we do not know which religion is in his / her mind when answering this question. On contrast, the Lutheran Church is the National Church of Sweden. Thus, it is no wonder that China has such a low response rate about this question.
Same for Chinese respondents with the question about trust in people of another nationality. A substantial proportion of Chinese have never interacted with people of another nationality. CGSS 2012 asks a question that “Is there anybody among the people you deal with from another nationality?”1 with two options, “yes” and “no” (National Survey Research Center at Renmin University of China, 2012a, 2012c, see Question N5b). Out of 5819 respondents of this question, 6.87% answer “yes”, 93.01% “no” and 0.12% do not give an answer, which reflects the fact that most Chinese have actually never dealt with people from another nationality. Conversely, Swedish people are a lot more likely to interact with people of another nationality. They also rank high in EF English Proficiency Index. For example, Sweden ranks the second in that index in 2017. That is
1 Author’s own translation from Chinese into English.

Chapter 2: Some Socio-Economic Aspects of China and Scandinavia
161
why the response rate of this question is also not high among Chinese respondents.
Figure 2.18 presents respondents’ trust in 13 kinds of people in social interactions without pecuniary benefits from data of CGSS 2015. Those among all respondents answering that the vast majority of their relatives can be trusted account for the largest proportion with a percentage of 42.53%, followed by those who said that the vast majority of their (near) neighbors, colleagues and old classmates and people with the same family name in their village can be trusted with 24.77%, 14.63%, 13.88% and13.53%, respectively. 84.96%, 74.15%, 56.15%, 54.10%, and 53.48% of all the respondents said that the vast majority or most of their relatives, (near) neighbors, old classmates, colleagues and (urban) distant neighbors / block neighbors or (rural) inhabitants in their village besides neighbors can be trusted. Not surprisingly, 40.40%, the largest proportion, of the respondents thought that the vast majority of strangers cannot be trusted. On contrast, with much less percentages, 6.24%, 3.96%, 3.36%, and 2.86% of the respondents claimed that the vast majority of their non-close friends / acquaintances, people from the same place with them but met in other places (not within their city or county), people joining the same religious activities with them and people joining the same free-time activities with them, such as entertainment, fitness, further studies, etc. cannot be trusted. In addition, 70.85%, 30.57%, 21.69%, 16.08% and 14.09% of the respondents thought that the vast majority or most of strangers, non-close friends / acquaintances, people from the same place with them but met in other places (not within their city or county), people joining the same religious activities with them and people joining the same free-time activities with them, such as entertainment, fitness, further studies, etc., and their (urban) distant neighbors / block neighbors or (rural) inhabitants in their village besides neighbors cannot be trusted.
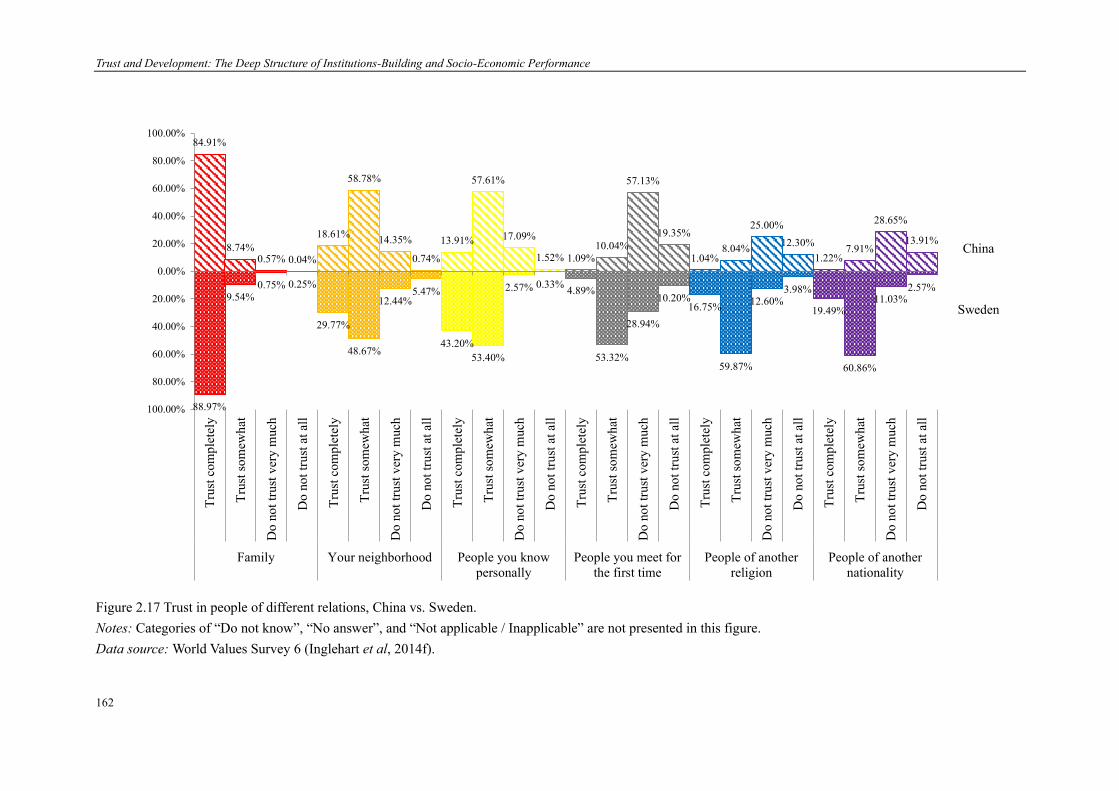
Trust and Development: The Deep Structure of Institutions-Building and Socio-Economic Performance
162
Figure 2.17 Trust in people of different relations, China vs. Sweden. Notes: Categories of “Do not know”, “No answer”, and “Not applicable / Inapplicable” are not presented in this figure. Data source: World Values Survey 6 (Inglehart et al, 2014f).
84.91%
8.74%0.57% 0.04%
18.61%
58.78%
14.35%
0.74%
13.91%
57.61%
17.09%
1.52% 1.09%10.04%
57.13%
19.35%
1.04%8.04%
25.00%12.30%
1.22%7.91%
28.65%
13.91%
88.97%
9.54%0.75% 0.25%
29.77%
48.67%
12.44%5.47%
43.20%53.40%
2.57% 0.33% 4.89%
53.32%
28.94%
10.20%16.75%
59.87%
12.60%3.98%
19.49%
60.86%
11.03%2.57%
100.00%
80.00%
60.00%
40.00%
20.00%
0.00%
20.00%
40.00%
60.00%
80.00%
100.00%
Trus
t com
plet
ely
Trus
t som
ewha
t
Do
not t
rust
ver
y m
uch
Do
not t
rust
at a
ll
Trus
t com
plet
ely
Trus
t som
ewha
t
Do
not t
rust
ver
y m
uch
Do
not t
rust
at a
ll
Trus
t com
plet
ely
Trus
t som
ewha
t
Do
not t
rust
ver
y m
uch
Do
not t
rust
at a
ll
Trus
t com
plet
ely
Trus
t som
ewha
t
Do
not t
rust
ver
y m
uch
Do
not t
rust
at a
ll
Trus
t com
plet
ely
Trus
t som
ewha
t
Do
not t
rust
ver
y m
uch
Do
not t
rust
at a
ll
Trus
t com
plet
ely
Trus
t som
ewha
t
Do
not t
rust
ver
y m
uch
Do
not t
rust
at a
ll
Family Your neighborhood People you knowpersonally
People you meet forthe first time
People of anotherreligion
People of anothernationality
China
Sweden

Chapter 2: Some Socio-Economic Aspects of China and Scandinavia
163
Figure 2.18 Trust in different kinds of people in social interactions without pecuniary benefits. Notes: The survey question is “In ordinary social interactions not directly involving pecuniary benefit, how much do you think people below can be trusted?”. (CGSS 2015, Question B10) A: (Near) Neighbors; B: (Urban) Distant neighbors / block neighbors or (rural) inhabitants in your village besides neighbors; C: People in your village with the same family name with you; D: People in your village with a different family name with you; E: Relatives; F: Colleagues; G: Non-close Friends / Acquaintances; H: Old classmates; I: People from the same place with you but met in other places (not within your city or county); J: People joining the same free-time activities with you, such as entertainment, fitness, further studies, etc.; K: People joining the same religious activities with you;
1.40
% 6.11
%17
.34%
49.3
8%24
.77%
2.40
%11
.69%
29.5
7%41
.37%
12.1
1%1.
50% 8.
22%
25.1
1%38
.89%
13.5
3%2.
28% 10
.86%
30.2
0%33
.98%
9.80
%0.
50%
2.78
% 11.1
7%42
.43%
42.5
3%1.
14% 6.06
%24
.45%
39.4
7%14
.63%
6.24
%24
.33%
41.1
7%21
.50%
3.95
%1.
22% 5.92
%24
.12%
42.2
7%13
.88%
3.96
%17
.73%
38.0
9%28
.30%
6.01
%2.
86%
13.2
2%33
.90%
22.5
9%5.
08%
3.36
% 10.5
9%20
.89%
11.5
7%3.
86%
2.46
% 10.6
9%27
.63%
22.6
2%5.
75%
40.4
0%30
.45%
20.2
5%5.
61%
1.34
%
0.00%
10.00%
20.00%
30.00%
40.00%
50.00%
60.00%
1 2 3 4 5 1 2 3 4 5 1 2 3 4 5 1 2 3 4 5 1 2 3 4 5 1 2 3 4 5 1 2 3 4 5 1 2 3 4 5 1 2 3 4 5 1 2 3 4 5 1 2 3 4 5 1 2 3 4 5 1 2 3 4 5
A B C D E F G H I J K L M

Trust and Development: The Deep Structure of Institutions-Building and Socio-Economic Performance
164
L: People joining the same social activities / public benefit activities with you; M: Strangers. 1: The vast majority are untrustworthy; 2: Most are untrustworthy; 3: The quantity of the trustworthy and untrustworthy are equal; 4: Most are trustworthy; 5: The vast majority are trustworthy. The survey question and the corresponding options are author’s own translation from Chinese into English. In addition, the figure does not present those who do not give an answer. Data source: Chinese General Social Survey 2015 (National Survey Research Center at Renmin University of China, 2015a, 2015b).

Chapter 2: Some Socio-Economic Aspects of China and Scandinavia
165
2.7 Other socio-economic performance
2.7.1 Performance of macro-economy
Unemployment rate, economic growth rate, price index (including consumer price index and producer price index) and balance of international payment are four important indicators of macro-economic performance. In this part, relevant data about employment situation and GDP of China, Denmark, Norway and Sweden will be presented.
i) Labor market
The employed tend to report higher general trust than the unemployed. Additionally, high employment rate also contributes to higher degree of public security and lower crime rate of a society. Of course, criminal records also have a negative effect on employment access (e.g. Agan and Starr, 2017). At the same time, unemployment rate also reflects the degree of economic prosperity.
At first, let us briefly review the classification of total population for labor market. Total population can be divided into working-age population and non-working age population. Working-age population can be further divided into labor force and non-labor force. Even further, labor force can be divided into employed population and unemployed population (see Figure 2.19). Labor force participation rate, employment rate (i.e., employment-to-population ratio) and unemployment rate are three indicators in measuring employment. Labor force participation is calculated as the ratio of labor force to working-age population. Unemployment rate is the ratio of unemployed population to labor force, namely the sum of employed population and unemployed population. However, employment rate is not the ratio of employed population to labor force; usually, it actually refers to the so-called “employment-to-population ratio”, which is the ratio of employed population to working-age population.

Trust and Development: The Deep Structure of Institutions-Building and Socio-Economic Performance
166
Figure 2.19 Classification of working-age population.
(a) China
Registered urban unemployment rate The officially released unemployment rate of China has been registered urban unemployment rate since 1990s (Zeng, 2018). As the term shows, registered urban unemployment rate only takes into account the unemployed who have registered their unemployment status in relevant governmental organizations. Figure 2.20 displays the annual registered urban unemployment rate of China from 1997 to 2016. The figure indicates that the registered urban unemployment rate stayed stably at around 3% from 1997 to 2000, followed by a rise in the subsequent 3 years, and then settled at around 4% from 2003.
Figure 2.20 Registered urban unemployment rate of China, 1997-2016. Data source: National Bureau of Statistics of the People’s Republic of China (no date).
Surveyed urban unemployment rate On April 17th, 2018, the National Bureau of Statistics of the
Total population
Working-age population
Labor force
Employedpopulation
Unemployed population
Non-labor force
Non-working age
population
2.00%
3.00%
4.00%
5.00%
Reg
iste
red
urba
n un
empl
oym
ent r
ate
Year
Chapter 2: Some Socio-Economic Aspects of China and Scandinavia
167
People’s Republic of China (hereafter, the NBS of China) released surveyed urban unemployment rate (National Bureau of Statistics of the People’s Republic of China, 2018a). This is the first time that China have ever released surveyed unemployment rate. Moreover, the NBS of China will regularly release nationwide surveyed urban unemployment rate and that of 31 capital cities every month from April, 2018 on. (National Bureau of Statistics of the People’s Republic of China, 2018b) It is noteworthy that the definition of employed population and unemployed population is identical to that of the International Labor Organization (hereafter, ILO), which guarantees the international comparability of this surveyed unemployment rate of China (National Bureau of Statistics of the People’s Republic of China, 2018b).
According to the NBS of China, the nationwide surveyed urban unemployment rates of China of the first three months of 2018 are respectively 5.0%, 5.0% and 5.1%, having reduced 0.2, 0.4 and 0.1 percentage points relative to the corresponding months of last year (National Bureau of Statistics of the People’s Republic of China, 2018a). Those rates of 31 capital cities of the first three months of 2018 are respectively 4.9%, 4.8% and 4.9%, having decreased 0.1, 0.2 and 0.1 percentage points respectively relative to last year’s corresponding months (National Bureau of Statistics of the People’s Republic of China, 2018a).
(b) Denmark, Norway and Sweden
Figure 2.21 depicts the unemployment rate above 15 age old of Denmark, Norway and Sweden from 2000 to 2017 from data of the ILO. In most years, Sweden has the highest unemployment rate among the three countries, followed by Denmark and Norway. In 2017, the unemployment rate of Sweden is 6.7%, that of Denmark is 5.7%, and that of Norway is 4.2%.
Figure 2.21 Unemployment rate of Denmark, Norway and Sweden, 2000 – 2017. Note: author’s own illustration. Data source: International Labor Organization.
ii) Economic growth
(a) Economic aggregate Figure 2.22 depicts the economic aggregate of China, Denmark, Norway and Sweden from 1960 to 2016. It can be seen that throughout those years, China performed better
0.01.02.03.04.05.06.07.08.09.0
10.0
2000
2001
2002
2003
2004
2005
2006
2007
2008
2009
2010
2011
2012
2013
2014
2015
2016
2017
Une
mpl
oym
ent r
ate
(15+
, %)
Year
Denmark
Norway
Sweden

Trust and Development: The Deep Structure of Institutions-Building and Socio-Economic Performance
168
than the other three countries in terms of economic aggregate, especially from 1980s and 1990s when the gap between China and the other three was getting larger. Sweden also led Norway and Denmark from 1960 throughout 2016. In most years from 1960 to 1999, Denmark performed better than Norway. However, from 2000 this situation changed with Norway exceeding Denmark.
(b) Growth rate Figure 2.23 shows the GDP annual growth rate of the four countries from 1961 to 2016. From 1976 on, the GDP growth rate of China leads the other three countries.
(c) GDP per capita Figure 2.24 presents GDP per capita of the four countries from 1990 to 2016. Norway performed the best among the four countries. Furthermore, from 1992 on, Norway started to lead Denmark and Sweden in terms of GDP per capita and its GDP per capita reached about 58790$ in 2016. The gap between Denmark and Sweden is quite small with almost the same annual GDP per capita throughout these years. In 2016, the GDP per capita of Denmark is about 49029$ and that of Sweden is about 48905$. By contrast, that figure of China is much lower than that of the other three countries, although from 1990 to 2016, the GDP per capita of China has increased steadily from 987$ to 15529$.

Chapter 2: Some Socio-Economic Aspects of China and Scandinavia
169
Figure 2.22 GDP (current US$) of China, Denmark, Norway and Sweden, 1960 – 2016. Data source: World Bank.
0
2,000,000,000,000
4,000,000,000,000
6,000,000,000,000
8,000,000,000,000
10,000,000,000,000
12,000,000,000,000G
DP
(cur
rent
US$
)
Year
China
Denmark
Norway
Sweden

Trust and Development: The Deep Structure of Institutions-Building and Socio-Economic Performance
170
Figure 2.23 GDP annual growth of China, Denmark, Norway and Sweden, 1961 – 2016. Data source: World Bank.
-30
-25
-20
-15
-10
-5
0
5
10
15
20
1961
1963
1965
1967
1969
1971
1973
1975
1977
1979
1981
1983
1985
1987
1989
1991
1993
1995
1997
1999
2001
2003
2005
2007
2009
2011
2013
2015
Gro
wth
(ann
ual %
)
Year
China
Denmark
Norway
Sweden

Chapter 2: Some Socio-Economic Aspects of China and Scandinavia
171
Figure 2.24 GDP per capital, PPP (current international $) of China, Denmark, Norway and Sweden, 1990 – 2016. Data source: World Bank.
0
10000
20000
30000
40000
50000
60000
70000
1990
1991
1992
1993
1994
1995
1996
1997
1998
1999
2000
2001
2002
2003
2004
2005
2006
2007
2008
2009
2010
2011
2012
2013
2014
2015
2016
GD
P pe
r cap
ita, P
PP (c
urre
nt in
tern
atio
nal $
)
Year
China
Denmark
Norway
Sweden

Trust and Development: The Deep Structure of Institutions-Building and Socio-Economic Performance
172
2.7.2 Public security
World Values Survey 6 (WVS 6) asks two questions about crime which in my view can reflect the public security of a society: 1) “Have you been the victim of a crime during the past years” (see, WVS 6, Question V179) “And what about your immediate family – has someone in your family been the victim of a crime during the last year?” (see, WVS 6, Question V180) Figure 2.25 – Figure 2.28 shows the answers from Chinese and Swedish respondents to these two questions. 1996 out of 2300, namely 86.78% of, Chinese respondents answer “No” and 89, namely 3.87%, answer “Yes” to the first question (see Figure 2.25). 1957 out of 2300, 85.09% of, Chinese respondents answer “No” and 97, namely 4.22% answer “Yes” to the second question (see Figure 2.26). Similarly, 1058 out of 1206, about 87.73%, Swedish respondents answer “No” and 143, about 11.86%, answer “Ye” to the first question (see Figure 2.27). 1023 out of 1206, namely 84.83% of, Swedish respondents answer “No” and 174, namely about 14.43% of, Swedish respondents answer “Yes” to the second question (see Figure 2.28). These data reflect the fact that both China and Sweden have relatively high public security within the country.
Figure 2.25 Have you been the victim of a crime during the past year? – China. Data source: World Values Survey 6 (Inglehart et al, 2014f).
Figure 2.26 And what about your immediate family – has someone in your family been the victim of a crime during the last year? – China. Data source: World Values Survey 6 (Inglehart et al, 2014f).
89
1996
215
0
500
1000
1500
2000
2500
Yes No Noanswer
Freq
uenc
y
3.87%
86.78%
9.35%
Yes
No
No answer
97
1957
246
0
500
1000
1500
2000
2500
Yes No Noanswer
Freq
uenc
y
4.22%
85.09%
10.70%
Yes
No
No answer

Chapter 2: Some Socio-Economic Aspects of China and Scandinavia
173
Figure 2.27 Have you been the victim of a crime during the past year? – Sweden. Data source: World Values Survey 6 (Inglehart et al, 2014f).
Figure 2.28 And what about your immediate family – has someone in your family been the victim of a crime during the last year? – Sweden. Data source: World Values Survey 6 (Inglehart et al, 2014f).
2.8 Interim conclusions
This chapter mainly talks about Scandinavia and / or China in aspects of population, network structures, welfare, equality, geographical mobility, social capital, trust, public security, performance of labor market and economic growth. It explains the possible logic between some of those aspects and trust, and presents and / or illustrates rich corresponding data of each aspect of Denmark, Norway, Sweden and China.
As stressed throughout this thesis, information of trustworthiness has a decisive impact on trust. In terms of population, no matter which level is considered (e.g., country level, city level, etc.), a larger and denser population means more pieces of interaction information of others’ trustworthiness, ceteris paribus. This is also the most important meaning of population on trust. The larger the population size, the more the strangers within the population for an individual, given that the population size exceeds one’s cognitive range or cognitive willingness because human cognitive capacity and time are limited. Besides, relatively high heterogeneity also often accompanies a large
174
1023
1 5 30
200
400
600
800
1000
1200
Freq
uenc
y
14.43%
84.83%
0.08%
0.41%0.25%
Yes
No
No answer
Don't know
Inapplicable
143
1058
3 20
200
400
600
800
1000
1200
Yes No Noanswer
Don'tknow
11.86%
87.73%
0.25%0.17%
Yes
No
No answer
Don't know

Trust and Development: The Deep Structure of Institutions-Building and Socio-Economic Performance
174
population. However, heterogeneity in population characteristics is not an essential cause of distrust. There are deeper, more essential causes. China is a population-large country, while all of Denmark, Norway and Sweden are population-small countries, which determines that there are probably more information reflecting others’ trustworthiness in China than Denmark, Norway or Sweden.
China and the West have different social network structures. The West has prevalent group life, while China does not (Liang, [1949] 2005). Chinese society is cha xu ge ju, while the Western societies are tuan ti ge ju (Fei, [1947] 1992; Fei, [1947] 2017). Families reflect individual closest social network and are an important source of individual social capital. Danish children have more siblings than Chinese ones. This is partly because Denmark encourages childbearing and has corresponding supporting (welfare) policies. Many contemporary young Chinese would not like to give birth to more children because of pressure from money, career, time or energy, although the family planning policy in China has been relaxed gradually to some degree. Memberships reflect individual relatively formal social networks. Scandinavians participate in more groups, and are more active in the groups than Chinese.
The three Scandinavian countries, Denmark, Norway and Sweden, are all outstanding representatives of modern welfare states. Whether a welfare state is an encumbrance or a boost for economic development involves the actual or potential trade-off between efficiency and fairness. The co-existence of universal welfare and good economic performance may pertain to the structures of tax revenues and expenditures. Good economic performance also underpins the implementation of comprehensive and generous welfare policies. Universal welfare has advantages, as well as disadvantages, such as its weakness in efficiency. Given the relatively normal operation of economy, the co-existence of universal welfare and good economic performance benefits from corresponding polices encouraging employment in the labor market. It should be noted that the three Nordic countries are capitalist, rather than socialist, although they have a large public section and universal welfare. Denmark, Norway and Sweden are all countries with a relatively small and homogenous population. Historical reason, values basis, economic basis and the policy views of the ruling party all contribute to the implementation and maintenance of the institution of a comprehensive and generous welfare state in the Nordic countries. Since different countries have their specific situation, other countries should consider their own situation thoroughly before learning experience from the Nordic Model. Take Denmark as an example. The welfare policies in Denmark are comprehensive and systematic, and relatively perfect. China also has been improving its social security. From data we can see that, also as we know, the total welfare expenditure and welfare expenditure per capita of Denmark, Norway and Sweden are relatively high.
Social trust and welfare can benefit from each other. Also, equality and extended welfare states can be mutually promoted. However, the equality that facilitates the initiation of an extended welfare state and that an extended welfare state results in are not of the same kind. The former equality may be attributed to general approval of something with similar nature of citizenship among all the nationals, while the latter equality may go more to wealth or income distribution and / or social status. Comprehensive, universal and generous welfare give people a sense of safety. On condition that equality is basically one of the values of a society, equally rich would consolidate interpersonal trust, while equally poor would still generate various social problems since poverty per se is a source of social problems. A rather unequal wealth or income distribution could lead to zero-sum games in
Chapter 2: Some Socio-Economic Aspects of China and Scandinavia
175
a society. Taxes and transfers in Denmark, Norway and Sweden play a significant role in reducing the gap of disposable income among people in each of the three countries.
In reality, there are two types of uncertainty, one is that both an event and its future occurring time are uncertain, the other is that some event is almost certain, while the relatively specific time of that event is not quite certain. One function, and also one aim, of various welfare polices is to protect people from uncertainty in life. Continuity of policies provides certainty and a stable expectation for the public. Uncertainty would cause people not to trust who “make” the uncertainty since in the view of others, those who “make” uncertainty are not reliable for disturbing others’ expectation and plans made according to their expectation. However, changes do not mean uncertainty. (Policy) Changes per se do not definitely result in direct distrust in policy-makers or possible indirect distrust to other people in society. It depends on whether (the general trend of) the change is good or bad. According to the corresponding data, Denmark, Norway and Sweden have relatively little corruption around the world, which is an advantage for them to serve the people better.
Social mobility reflects social fairness to a large degree. So, it is conducive to social trust. It can be seen from CGSS 2015 that the general trend of Chinese respondents’ subjective social stratum increases relative to when they were 14 years old. Most interviewees think that they have almost the same socio-economic status or even a lower one compared with peers, while only a small proportion consider that they have a higher status. A substantial proportion of the interviewees think that their socio-economic status has increased, while there are also many people fall into the opposite situation. The perception of the improvement of social mobility may benefit from the improvement of the living conditions brought by economic development and by personal accumulation and achievements with age to some degree. When it comes to social mobility in China, gaokao plays an important and positive role in social mobility. Geographical migrants meeting some definitive conditions are called “floating population” in China. Floating population is defined based on the Huji system of China. Not only does Hukou act as the way of household registration, but also many rights are attached to it, such as employment, children’s education, social security, public services. China has been reforming its Huji system. Besides, a number of local governments also made a looser hukou-settling policy as one of the measures of attracting people to stay or to come. It should be noted that in order to retain people ever attracted there, those cities should also increase the supply and improve the quality of, such as, education, healthcare and infrastructure accordingly.
From an individual perspective, social capital relates to personal relationships a lot and generates benefits for its owner from possessing his / her personal relationships. One can acquire physical, financial and emotional support and information directly from or from the social capital of the other end of his / her relationships. As to the necessity of the term “social capital”, there are two opposite opinions among scholars. Some scholars do not think the term is necessary. (e.g., Arrow, 1999; Solow, 1999) From an individual perspective, social capital implies that a relationship is a two-way one. Additionally, trust is a sufficient but not necessary condition of social capital. The total social capital one possesses hinges on both the quantity and the quality of the relationships in his / her egocentric network. The capacity, vertical position and social capital of the other person on the other end of a relationship play a decisive role of the quality of a person’s social capital.
In order to reflect individual social capital in China, Denmark, Norway and Sweden using data, several survey questions embodying social capital in different aspects are selected to visualize. In

Trust and Development: The Deep Structure of Institutions-Building and Socio-Economic Performance
176
terms of the number of siblings, Danish children have more siblings than Chinese ones in average. In terms of memberships, Danish, Norwegian and Swedish have more formal memberships than Chinese, and are more active in groups. In terms of the frequency of meeting people, Norway presents the highest frequency of meeting people among the three Scandinavian countries, followed by Sweden and then by Denmark. In terms of social activities compared with peers, Norwegian take part in social activities compared to peers less often than Swedish, and Swedish less often than Danish. In terms of discussing intimate matters, Norway has the lowest average number of persons to whom one can talk personal matters among the three Scandinavian countries, while Sweden has the largest. In terms of social activities in leisure time, the self-reported frequency of participating social activities in China has increased to some degree during those 6 years. In terms of diversity of occupations in personal social network, “Peasants” among the given options of occupations accounts for the largest proportion of whom the Chinese respondents have dealt with, followed by a gradually reducing proportion of “Middle school teachers”, “Nurses”, “Policemen / Policewomen”, “Hairdressers”, “University lectures”, “HR managers”, “Programmers”, “Receptionists”, “Lawyers”, respectively. Generally, more Chinese respondents have less diversity of occupations in their social networks, and the number of respondents who know people from more occupations reduces with a gradually increasing rate as the number of the kinds of occupations in social networks increase.
All of China, Denmark, Norway and Sweden present high general trust around the world. By and large, Denmark shows the highest general trust among the four countries, followed by Norway and Sweden, while China the lowest. Chinese and Swedish trust in “Family”, “Your neighborhood”, “People you know personally”, “People you meet for the first time”, “People of another religion”, “People of another nationality” are also compared. In general, Swedish trust more in each kind above than Chinese. Moreover, both Swedish and Chinese trust “Family” most. Swedish trust “People you know personally” more than “Your neighborhood”, while Chinese trust “Your neighborhood” more than “People you know personally”. “Family”, “Your neighborhood” and “People you know personally” are the three kinds of people that both Swedish and Chinese trust most among the 6 kinds of people above. Chinese trust in 13 kinds of people in social interactions without pecuniary benefits in another dataset is also presented. The 13 kinds of people are respectively “(Near) neighbors”, “(Urban) distant neighbors / block neighbors or (rural) inhabitants in their village besides neighbors”, “People in your village with the same family name with you”, “People in your village with a different family name with you”, “Relatives”, “Colleagues”, “Non-close friends / acquaintances”, “Old classmates”, “People from the same place with you but met in other places (not within your city or county)”, “People joining the same free-time activities with you, such as entertainment, fitness, further studies, etc.”, “People joining the same religious activities with you”, “People joining the same social activities / public benefit activities with you” and “Strangers”. “Relatives”, “(Near) neighbors”, “Colleagues” and “Old classmate” are the four kinds of people that Chinese trust most. “Strangers” “Non-close friends / acquaintances”, “People from the same place with them but met in other places (not within their city or county)” and “People joining the same religious activities with them” are the four kinds of people that Chinese do not trust most.
The registered urban unemployment rate of China stayed stably at around 3% from 1997 to 2000, followed by a rise in the subsequent 3 years, and then settled at around 4% from 2003.The

Chapter 2: Some Socio-Economic Aspects of China and Scandinavia
177
nationwide surveyed urban unemployment rates of China of the first three months of 2018 are respectively 5.0%, 5.0% and 5.1%, having reduced 0.2, 0.4 and 0.1 percentage points relative to the corresponding months of last year. (National Bureau of Statistics of the People’s Republic of China, 2018a) In most years, Sweden has the highest unemployment rate among the three Scandinavian countries, followed by Denmark and Norway. In 2017, the unemployment rate of Sweden is 6.7%, that of Denmark is 5.7%, and that of Norway is 4.2%.
It can be seen that throughout those years, China performed better than the other three countries in terms of economic aggregate, especially from 1980s and 1990s when the gap between China and Denmark, Norway and Sweden in general was getting larger. From 1976 on, the GDP growth rate of China leads the other three countries. However, the GDP per capita of China is much lower than that of Denmark, Norway and Sweden.

Chapter 3: What Affect General Trust?
Perspective from Norm-Conforming,
Opinion Similarity and Geographic
Mobility: Empirical Evidence from China
3.1 Introduction
An issue that economists concern is whence economic growth comes. More and more scholars realize that economy is part of society. For example, Granovetter (1985) argues that economic behaviors are embedded in society. So far, the impact of trust (such as, general trust and inherited trust) on economic performance, either in a direct or indirect way, has been largely discussed (e.g., Algan and Cahuc, 2010; Beugelsdijk et al, 2004; Bjørnskov, 2012; Dearmon and Grier, 2009; Knack and Keefer, 1997; Lim, Morshed and Khun, 2018; Peiró-Palomino and Tortosa-Ausina, 2013;Whiteley, 2000; Zak and Knack, 2001). In general, most empirical research tends to draw the conclusion that trust has a significant positive influence on economic performance. Trust is an indispensable ingredient in socio-economic life. It is hard to imagine how tough life would be without basic interpersonal trust.
Given the importance of trust, exploring what affect trust then becomes attractive. This is not only the requirement for, and the important links in, understanding trust in its causality network illustrated in Section 1.9.2, but also the center piece of the policy implication for trust (re)building and the accumulation of social capital, both individual and social,1 since trust itself is not an operable concept. So far, as Delhey and Newton (2003) summarize, there already exist six theories of the origin of social trust. Empirical research on determinants or associating factors of different types of trust involves both interpersonal trust and institutional trust, such as general / generalized trust (e.g., Alesina and La Ferrara, 2002; Bjørnskov, 2006; Brown et al, 2014), trust in government (e.g., Zhao and Hu, 2017), trust in judicial institutions (e.g., Roussey and Deffains, 2012), trust in supplier relations (e.g., Sako and Helper, 1998), on-line trust (e.g., Grabner-Kräuter and Kaluscha, 2003) and so on and so forth.
In terms of general trust, its influencing factors discussed in empirical research involve different levels, such as micro level (e.g., Alesina and La Ferrara, 2002; Blanco and Ruiz, 2013; Brown et al, 2014), community or regional level (e.g., Alesina and La Ferrara, 2002; Brown et al, 2014) and macro / national level (e.g., Bjørnskov, 2006). For example, the research of Alesina and La Ferrara (2002) reveals that individual experiences and community characteristics affect general trust. They find that those who have recent traumatic experiences, belong to a historically discriminated group
1 Section 2.5 of this thesis elaborates on social capital.

Chapter 3: What Affect General Trust? Perspective from Norm-Conforming, Opinion Similarity and Geographic Mobility: Empirical Evidence from China
179
(such as the blacks and women), have lower income and education, or live in a racially mixed or large-income-difference community trust less (Alesina and La Ferrara, 2002). When exploring the determinants of localized and generalized trust using Australian data on the individual, neighborhood and regional level, Leigh (2006) finds that both localized trust and generalized trust is negatively affected by linguistic and ethnical heterogeneity, with linguistic heterogeneity having a negative impact on localized trust for both natives and immigrants, but on generalized trust only for immigrants. However, You (2012) examines the impact of fairness of income distribution, democracy and corruption (three proxies of distributive, procedural and formal justice respectively) and heterogeneity (in terms of, such as, income, ethnic and cultural diversity) on social trust using a multi-level hierarchical logit model with data across 80 countries, and concludes that the three indicators of fairness are significantly positively associated with social trust and matter more than homogeneity / heterogeneity per se for social trust. Blanco and Ruiz (2013) provide empirical evidence that insecurity has a significant negative effect on trust in others in Colombia. Brown et al (2014) reveal that community participation is positively associated with general trust and that membership of community sport organizations is favor to generating general trust by using path analysis. Banerjee (2016) confirms that a violation of social norms has a significant negative effect on trust using lab experiment data.
A noteworthy deficiency existing in some research is the inconsistency between their explanation of general trust in the theoretical part and the empirical measurement they take. Specifically, some research adopts general trust as trust in strangers at the beginning, while using the standard survey question of general trust in, such as WVSs (Inglehart et al, 2014a, 2014b, 2014c, 2014d, 2014e, 2014f), that “generally speaking, would you say that most people can be trusted” as its empirical measurement, without questioning the definition or testing the correlation between general trust measured by its standard question and trust in strangers in data. In fact, the two kinds of trust may present great difference in data (e.g., in distribution) among the people in a society.
Many factors could be found influencing general trust. As reviewed above, different scholars have focused on different factors. Empirical analysis should be guided by theory. Hilmer and Hilmer (2014, p. 443) say that “there are two good starting points for determining the appropriate economic theory to guide our analysis: (1) our personal economic intuition and (2) the existing literature which demonstrates the intuition and empirical evidence of other researchers”. This chapter provides a perspective to consider and classify the determinants of general trust which is different from existing literature as far as I know. In more detail, this chapter, besides personal characteristics, mainly from three aspects analyzes the causes of general trust, namely the impact of norm-conforming, opinion similarity, and geographic mobility, respectively, using micro data from the Chinese General Social Survey 2013 (abbr. CGSS 2013) and the provincial data from the Sixth National Population Census of China in 2010.
The rest of this chapter contains four sections: Section 3.2 elaborates on the three aforementioned aspects of considering the determinants of general trust; Section 3.3 introduces the data sets and presents the statistical description of selected variables; Section 3.4 presents the econometric models and regression results; Section 3.5 concludes.

Trust and Development: The Deep Structure of Institutions-Building and Socio-Economic Performance
180
3.2 Determinants of general trust: a new perspective
General trust cannot change without reason; it comes from the perception of others’ trustworthiness in general. Moreover, its change may derive from information reflecting the trustworthiness or, put another way, from the perceived goodwill and benign of others in the society.1 This kind of information can be either about others’ thought or behavior that has different manifestations. Information about others’ behavior provides evidence of the existence and prevalence of some kind of behavior; information about others’ thought indicates not only its existence and prevalence, but also potential occurrences of related or consequent behavior. Hence, information about others’ trustworthiness is, to a large degree, decisive. Actually, many determinants of general trust explored in the existing literature may function via these two factors.
3.2.1 Impact of others’ behavior: breaching norms
As to information about others’ behavior in the society, the most possible factor damaging general trust may come from behaviors breaching norms, which is also paid special attention to in this chapter. Popper (2013, p. 451) also argues that norms, including moral norms, social norms and legal norms, all “have a role to play in enhancing social trust”. The difference between the information about others’ behavior and that about others’ opinion is that the former is mainly behavior-based expressions, while the latter is mainly language-based expressions.2 The reason why breaching norms and opinion divergence may influence general trust is that values are underlying them. What is more, the inner feelings about others’ untrustworthy behavior, such as aversions, disappointment, depression, anger, fear and so forth, may contribute a great deal to the actual influence of information about others’ behavior and opinion on general trust, which constructs, if it can be said like this, the emotional foundation of general trust.
The impact of others’ violating norms may find its explanation from institutional economics. Humans are biological and, at the same time, social beings – this is why Kapp (2011, p. 66) prefers to call humans homo institutionalis, rather than homo oeconomicus. Thus, a society is a society of individuals with institutional traits, and the interactions of individuals are embedded in interweaved institutions. We humans acquire (learn) institutional traits from our ancestors, sages, and early generations, and pass them to our later generations. In a word briefly, intergenerational transition of institutional traits is a precondition of institutional consecution and persistence. Veblen ([1899] 2005, pp. 143-144) deems that “the institutions are, in substance, prevalent habits of thought with respect to particular relations and particular functions of the individual and of the community”3 These habits of thought not merely guide individual behavior, but also direct in which way individuals think others should behave. Veblen ([1899] 2005, p. 145) ever states that “the evolution of society is substantially a process of mental adaptation on the part of individuals under the stress of circumstances which will no longer tolerate habits of thought formed under and conforming to a
1 When trustworthiness guides individual behavior, it is a norm. Here, trustworthiness refers to the perception about the behaving person. 2 Here we do not regard language-based communication as a special case of behavior. 3 Although in The Theory of the Leisure Class: An Economic Study of Institutions, Veblen ([1899] 2005) from a negative perspective elaborates on institutions, the quintessence of thoughts of his theory is also applicable to the positive aspect of institutional explanation.

Chapter 3: What Affect General Trust? Perspective from Norm-Conforming, Opinion Similarity and Geographic Mobility: Empirical Evidence from China
181
different set of circumstances in the past”. Similarly, Denzau and North (1994) also relate institutions to something mental. They consider institutions as shared mental models (Denzau and North, 1994). It is reasonable that others’ breaching habits of thought or norms of behavior leads to one’s mental inadaptation, and at the same time causes him / her aversion and damages his / her general trust. What it boils down to is the interdependence of human behavior. Over an accumulation, sedimentation and evolution of millions of years, various norms of behavior have already permeated our daily life. Among those that people highly praise are what we call fairness, truthfulness, keeping one’s promise, morals and so on and so forth, although there may be overlapping among them. As to the relation between general trust and different norms, Alesina and La Ferrara (2002) and You (2012) find that fairness significantly impacts trust; Uslaner (2002) argues that generalized trust has moral foundations; Leigh (2006, p. 269) also thinks that “trust may be driven by morals and culture, which are likely to be correlated with individual characteristics such as income, education, employment and age”.
In view of data availability, this chapter chooses three sub-aspects for the impact of others’ disobeying norms, or broadly, to institutions, on general trust, that is, morality, fairness and being taken advantage. They three have different contexts of using usually.
(a) Morality
The criticism of original institutional economics on neoclassical economics always involves the philosophical foundation of economics. Kapp (2011, pp. 19-20) criticizes neoclassical economics based on utilitarianism from Jeremy Bentham of being “without explicit normative or moral values premises” (p. 21). Humans are not pleasure machines (Hodgson, 2013); we have “moralische Gesetz in mir” 1 (Kant, [1788] 1968, p. 161). Original institutional economics (namely evolutionary institutional economics) inherits its philosophical foundation from American pragmatic philosophy which is founded and developed by Charles Peirce, William James and John Dewey. Dewey (1922) argues that “morals […] is ineradicably empirical” (p. 295) and that “morals means growth of conduct in meaning” (p. 280).
People in different countries could generally have different understanding about what behaviors are morally right and what not. Morality talked in this chapter is based on the understanding of Chinese since this chapter is an empirical study of China. “China is a society of ethics standard.”2 (Liang, [1949] 2005, p. 70) Morality, translated into Chinese, is 道德 (Pinyin: dào dé). 道德, as we see, consists of two Chinese words, 道 (Pinyin: dào) and 德 (Pinyin: dé), with each also having its own meaning, besides the meaning of the whole phrase when combined. Morality measures the justification of behavior. It per se is a scope. Or put another way, it is a set of norms, rather than a single norm. China has a long history of Confucian tradition of which the morality covers, such as, 忠(Pinyin: zhōng), 孝(Pinyin: xiào), 仁(Pinyin: rén), 义(Pinyin: yì), 礼(Pinyin: lǐ), 智(Pinyin:
1 In one of his insightful and far-reaching three critiques, Kritik der praktischen Vernunft (i.e. Critique of Practical Reason), Kant (1788) wrote in German that “Zwei Dinge erfüllen das Gemüt mit immer neuer und zunehmender Bewunderung und Ehrfurcht, je öfter und anhaltender sich das Nachdenken damit beschäftigt: Der bestirnte Himmel über mir, und das moralische Gesetz in mir.” (Kant, [1788] 1968, p. 161) Translated into English is “Two thins fill the mind with ever new and increasing admiration and reverence, the more frequently and persistently one’s meditation deals with them: the starry sky above me and the moral law within me.” (Translated by Pluhar, 2002, p. 203) It should be noted that Kant and Dewey hold quite different views on morals (see, Kant, [1785] 2002; Kant, [1788] 2002; Dewey, 1922). However, I will not elaborate on them here. 2 Author’s own translation. The original text in Chinese is “中国是伦理本位的社会” (Liang, [1949] 2005, p. 70).

Trust and Development: The Deep Structure of Institutions-Building and Socio-Economic Performance
182
zhì), 信(Pinyin: xìn).1 Trustworthiness, truthfulness and other associated qualities as a moral norm appear in as early as Confucian classics of pre-Qin2 philosophy in China, i.e. Lun Yu (namely The Confucian Analects) of Confucius and his disciples. For several examples, “Confucius remarked, ‘I do not know how men get along without good faith. A cart without a yoke and a carriage without harness, - how could they go?’ ”3 (Confucius and his disciples, translated by Ku, 1898, p. 12) “[…] ‘My aim,’ replied Confucius, ‘would be to be a comfort to my old folk at home; to be sincere, and to be found trustworthy by my friends; and to love and care for my young people at home.’”4 (Confucius and his disciples, translated by Ku, 1898, p. 37) “Confucius through his life and teaching taught only four thins: a knowledge of literature and the arts, conduct, conscientiousness and truthfulness.”5 (Confucius and his disciples, translated by Ku, 1898, p. 54)
Some people might tend to distinguish morality and public morality arguing that morality of daily use actually refers to privative morality, which I do not agree. In my view, morality in daily use actually covers public morality. In daily life, conforming to morality usually means not to do what run counter to conscience, even when punishments, formal or informal, can be circumvented, to seek inappropriate benefits via harming others, such as behavior threatening others’ life and health security. On contrast, immoral behaviors are always those that disregard bad influences on others, and could even be criminal offences. Specifically, for example, smoking in indoor public places is immoral; marital infidelity is immoral; selling unqualified products is immoral; leasing rooms where formaldehyde exceeds the standard to tenants is immoral; selling food processed unhygienically is immoral; selling fruits applied harmful chemicals to look good is immoral; spitting in subway stations is immoral; damaging public facilities is immoral; jumping queues is immoral, and so on and so forth. In these situations, people are more likely to use “immoral” to criticize misconduct, rather than using “unfair”, or saying that “those misconducting people are taking advantage of us”.
(b) Fairness
Translated from Chinese into English, 公平 (Pinyin: gōng píng) is fairness. According to the Oxford English Dictionary, one of the meanings of fairness (2013) is “impartiality, equitableness, justness”, which is basically the meaning in this chapter. Fairness per se is a value-type institution6 and has different manifestations. Perception of fairness also has different scopes. What is related to individual perception of general trust is social fairness. In other words, in order to explore the influences of fairness on general trust on the micro level, social fairness should be a closer and more direct factor because they, i.e., general trust and social fairness, are consistent in terms of level. (Un)Fairness always relates to return-investment ratio and / or distribution. Investment and return are in terms of single persons / groups, while distribution involves more than one person / group. Therein, distribution involves issues like to which (group of) person(s) something should be distributed, and how much each direct distributee should get, given what is going to be distributed. The distributed objects can be opportunities, incomes, rights, punishment, responsibility, interests,
1 Here is not going to explain what these Chinese words mean, which does not influence the understanding of the whole chapter, and even the whole book. For those who are interested, please google them on the Internet by yourself. 2 Qin (秦) (221BCE ~207BCE) is a dynasty in Chinese history. 3 The original text in Chinese is “子曰:‘人而无信,不知其可也。大车无輗,小车无軏,其何以行之哉?’” ——《论语》 4 The original text in Chinese is “子曰:‘老者安之,朋友信之,少者怀之。’”——《论语》 5 The original text in Chinese is “子以四教:文、行、忠、信。”——《论语》 6 For value-type institutions, see section 1.8.4.

Chapter 3: What Affect General Trust? Perspective from Norm-Conforming, Opinion Similarity and Geographic Mobility: Empirical Evidence from China
183
honors, resources, applied standards, qualifications, and so on and so forth. Sources of fairness problems can be attributed to the mismatch of personal investment and return on particular things and the horizontal comparison of the return-investment ratio of, supposing that there is investment, and what is distributed to distributees. This also reflects the relativeness of fairness. Unfairness often exists in the situations which are relevant to oneself or his / her group, but those who have, dominate or have seized the distributing right are not himself / herself or his / her group, but a non-distributee / non-distributees or another distributee / other distributees, which lands him / her or his / her group in passiveness and disadvantage in the process and results of the distribution. Of course, knowing information about unfair things not directly relevant to oneself could also cause sense of unfairness. Additionally, when talking about (un)fairness, what come into mind is usually relatively important, big-influencing things, even for personal life trajectory (e.g., career trajectory), rather than small, tiny, trivial matters in life. There are many examples of social unfairness: that wages do not match personal working capability and workload is unfair; gender discrimination in job-searching is unfair; encountering double-standards when competing for something is unfair; some people have not been punished as they deserve while others have is unfair, and so on and so forth.
(c) Being taken advantage
“Being taken advantage” is used to represent “被占便宜” in Chinese. When used in daily life, the most common situations could be that what belong to, and are often still useful to, somebody, usually something material, or money and time, are taken by some other person. It should be noted that it is different from helping others by providing something when they need or when they ask for and from being stolen something. Also, what relate to being taken advantage are usually not very big things in life, but big enough to cause dissatisfaction and unpleasure to the person who is taken advantage, although the behaviors do not physically harm him / her or influence his / her life trajectory. Behavior of taking advantage at least involves two parties, one is who takes advantage, the other is who is taken advantage. Taking advantage can be either from those who one knows or those who one does not know very well. Examples of being taking advantage that one could encounter in life could be that: someone always borrows things, even not vary valuable or expensive, from others, but never gives them back; somebody borrows 102 yuan from others, but only giving back 100 yuan;1 someone never treats others back when having meals with fellows, while every other does at different time, given that it is common to treat others in a society when eating outside together, and so on. These behaviors are all not very big matters. However, encountering these behaviors, especially often encountering a person who is always taking advantage of others, could be unpleasant. However, in addition, people usually do not use “immoral” or “unfair” to describe these situations or the people who tend to take advantage.
As said before, what is important for trust to change is the information that derives from interactions about whether others are conforming to norms of conduct. This information reveals whether some particular behavior exists in the society, in which situation it is opt to occur, and how likely. More deeply, it is the nature of events (namely, trust-increasing or trust decreasing) that decides the direction of the change of general trust. In general, also as aforementioned, there are two ways of acquiring others’ information about whether or not they are conforming to norms of conduct: one is via personal interactions, the other is via non-interaction methods, such as observing, word by mouth,
1 Yuan is a unit of money in China.

Trust and Development: The Deep Structure of Institutions-Building and Socio-Economic Performance
184
media using and so on. Contrast to experiences of direct interactions, feelings from acquiring others’ interaction information via non-interaction methods relate to what Smith ([1759] 1966) calls sympathy in his The Theory of Moral Sentiments. We image what we would feel if we were one of the interacting parties.
3.2.2 Impact of others’ opinion
It is a noteworthy phenomenon that a piece of social news often arouses netizens’ wide and furious debate in social media nowadays. What they actually focus on is more than the social affair itself. More precisely, a piece of news reported merely provides an opportunity time-point when people can express their own opinion on all similar events, speak for themselves actually from their own point of view, try to make themselves to be understood better, or attempt to leave a certain impression on others. Further deeply, they are expressing their own value views orientation, and attempt to persuade others by their own arguments more or less, although they often cannot successfully persuade others actually.
Personal values highly relate to cultural background (here, just call it common values), but they do not perfectly coincide since, for example, personal growing-up environment and personal experiences are different. What is more, due to different angles and depth of commenting on an event, people may accentuate different criteria of value judgment while at the same time it is hard to tell any criteria involved is essentially and admittedly wrong in every possible sense since it may be reasonable to some extent. Expressing opinions is a process of manifesting values through language or communication. People compare others’ opinions with those of themselves. The reason why difference in opinions may decrease one’s general trust is that those who hold different opinions may have behaved or behave in a way that (s)he does not approve of or that may cause damage for his / her (potential) interest. Dewey (1922, p. 52) ever states that “diversity does not of itself imply conflict, but it implies the possibility of conflict, and this possibility is realized in fact”.
In reality, it does not rarely happen that difference in values or opinion divergence results in a breakdown of a relationship or collapse of cooperation. For instance, a severe divergence of values or opinions may lead a couple to divorce; a sharp divergence of business philosophy may lead partners running a company together not to cooperate any more, etc. This also applies to a wider social environment. When somehow incompatible opinions exist in the society and each opinion has a substantial number of supporters, general trust may be negatively influenced.
3.2.3 Geographical mobility
Zucker (1986) argues that geographical mobility tends to decrease trust. However, Alesina and La Ferrara (2002) find that geographical mobility has an insignificant negative impact on general trust. The first chapter of this thesis has elaborated on geographical mobility. As mentioned there, geographical mobility can be viewed from different angles. At the micro level, this chapter is going to from the angle of the geographically moving individuals explore the impact of geographical mobility on individual general trust. It is supposed that individual geographical mobility tends to decrease general trust. What is more, geographical mobility at provincial level is also taken into account.

Chapter 3: What Affect General Trust? Perspective from Norm-Conforming, Opinion Similarity and Geographic Mobility: Empirical Evidence from China
185
3.2.4 Other factors
Besides the aforementioned factors, other micro-level factors (such as personal demographic characteristics) and somehow meso-level factors (such as spatial mobility) may also be associated with general trust. At the micro-level, in terms of demographic characteristics, their impact on general trust does not display a consistent influence in empirical research. For example, the research of Alesina and La Ferrara (2002) reveals that general trust increases with age at a declining rate, while Leigh (2006) finds no significant association between age or age square and generalized trust. Alesina and La Ferrara (2002) find that females significantly trust less than males in the US. On contrast, Leigh (2006) does not find statistically significant association between gender and either localized trust or generalized trust in Australia. In spite of these differences in empirical findings, Alesina and La Ferrara (2002) and Leigh (2006) both demonstrate that education is positively associated with trust. At the meso-level, Leigh (2006) at first finds that linguistic fractionalization at neighborhood-level is negatively associated with localized trust for both natives and non-natives, but negatively associated with generalized trust only for non-natives. However, this impact seems not to be consistent and stable (Leigh, 2006). What is more, it should be noted that language proficiency probably heavily relates to education, ceteris paribus. Consider the natives of a country which has different languages and accents. People with a higher level of education tend to master a more general language and / or a more standard accent in this country, given that there is a dominant language and accent.
Putnam (2000, pp. 138-139) notices that inhabitants in big cities express less social trust than those living in small towns. Glaeser et al (2000) find that the social trust in big cities of the U.S. with a population more than 1 million is much lower than that in cities below that size. The difference of general trust between rural and urban inhabitants is in the same vein. Rural settlements are usually small in population size. Population there are relatively stable and interpersonal relationships there are more systematic and closer. These make rural settlements societies of familiars. In many rural settlements, the population size is so small that it forms a full-connected network with everyone knowing every other. Disobeying norms in rural settlements, one would have to bear more pressure from the network of interpersonal relationships like exclusion, which makes the networks of interpersonal relationships a strong constraint on untrustworthy behavior. On contrast, urban settlements are usually larger in population size. They have a denser population and a more rapid population mobility. Urban settlements are societies of strangers, and are more likely for untrustworthy things to happen. More importantly, the degree of trustworthiness of a person’s local social circumstance probably has a significant weight in his / her expression of general trust. Therefore, whether an interviewee is interviewed in a rural or urban area is taken into account, and it is expected that rural inhabitants express higher general trust than urban ones on average.
Besides, different family origins create different life conditions and local social environments. Childhood also plays an important role in shaping personal characteristics. Thus, family origin may also affect general trust in some way.
In addition, individual judgment ability about which principle should be used in which concrete situation may also influence general trust. One of the main interested factors in this chapter good for general trust is others’ norm-conforming behavior. Institutions, broadly, to a large degree involve issues of accepted principles. If one is not clear about which principle should be the criterion of

Trust and Development: The Deep Structure of Institutions-Building and Socio-Economic Performance
186
judging the justification of behavior and from which perspective to judge, (s)he would have a different scope of reasonable, proper behavior in his / her mind given his / her other characteristics, which could lead to a changed scope of what (s)he thinks is untrustworthy.
3.3 Data, variables and descriptive statistics
3.3.1 Data set overview
Data used in this chapter is mainly from the Chinese General Social Survey (abbr. CGSS) in the year of 2013 (abbr. CGSS 2013). CGSS has been conducted in China since 2003 and it “is the earliest national representative continuous survey project run by academic institution in China mainland”1 (National Survey Research Center at Renmin University of China, ©2019). CGSS 2013 contains two questionnaires, Questionnaire A and Questionnaire B, which comprise not all the same questions (National Survey Research Center at Renmin University of China, 2013a, 2013b). Questionnaire A contains four sections, section A, B, C and Z, while Questionnaire B contains section A, B, D and Z (National Survey Research Center at Renmin University of China, 2013a, 2013b). What is used in this chapter is mainly CGSS 2013 Questionnaire B since one variable of interest is from section D of Questionnaire B but is not included in Questionnaire A. The two questionnaires of CGSS 2013 are in the same dataset. 2 CGSS 2013 dataset contains 11438 observations in total, within 5772 observations for Questionnaire A and 5666 observations for Questionnaire B (National Survey Research Center at Renmin University of China, 2013a, 2013b, 2013c). Different data formats of CGSS 2013 data set are provided on the official website of CGSS. What is used in this chapter is for Stata below version Stata 14. In addition, provincial level data of resident population and inter-provincial immigration from the Sixth National Population Census of P.R. China is also used (Office of the Sixth National Population Census of the State Council of the People’s Republic of China, Department of Population and Employment Statistics of the National Bureau of Statistics, 2011) (see, Appendix B).
3.3.2 Variable selection and construction
From CGSS 2013 Questionnaire B, some variables are chosen for empirical analysis. After deleting observations with invalid values, namely those recorded as “Refuse to answer”, “Don’t know” or “Not applicable” for all variables from CGSS 2013, 5356 out of 5666, about 94.53%, observations, are left for further analysis. Appendix A presents the translation from Chinese into English of the original survey questions and their corresponding options of the variables used from CGSS 2013 except highest education. Moreover, the percentage of inter-provincial immigration of each province is calculated through dividing inter-provincial immigration by resident population whose data is from the Sixth National Population Census of P.R. China (see, Appendix B). In summary first, the dependent variable is general trust; the core explanatory variables are being taken advantage, social fairness, moral satisfaction, opinion similarity, non-local and percentage of interprovincial
1 For more information about the Chinese General Social Survey, visit the official website of the Chinese General Social Survey, see also, e.g., Bian and Li (2012). 2 The dataset is provided as three versions: one version is for Stata version earlier than Stata 14.0, one version is for Stata 14.0, and one version is for SPSS. The dataset version used in this chapter is below Stata 14.0.

Chapter 3: What Affect General Trust? Perspective from Norm-Conforming, Opinion Similarity and Geographic Mobility: Empirical Evidence from China
187
immigration; and the control variables are gender, age group, highest education, rural, precept and social class at 14 years old.
Table 3.1 shows variables chosen or constructed from CGSS 2013 data. Variable general trust refers to the survey question that “generally speaking, do you agree that most people can be trusted in this society?”, and is the dependent variable which is a 5-point Likert type item with 1 representing “Strongly disagree”, 2 “Disagree”, 3 “Neither”, 4 “Agree” and 5 “Strongly agree” (CGSS 2013, Questionnaire B, Question A33). Variable being taken advantage, fairness and moral satisfaction are chosen or constructed for the impact of violating norms which can be classified into impact from others’ behavior. Therein, being taken advantage is a 5-point Likert type item with 1 representing “Strongly disagree” and 5 “Strongly agree”. Social fairness is a 5-point Likert type item with 1 indicating “Completely unfairness” and 5 “Completely fair”. Moral satisfaction is a 5-point Likert type item with 1 indicating “Very dissatisfied” and 5 “Very satisfied”. Opinion similarity, which is also a 5-point Likert type item with 1 representing “Very rarely” and 5 “Very frequently”, is chosen for the impact of others’ expressed opinions, viewpoints, etc. Non-local and percentage of inter-provincial immigration are for the impact of geographical mobility at the micro and provincial level, respectively. At the micro level, variable non-local is a dummy with 0 representing that a respondent has been living where (s)he is interviewed since born and 1 representing that a respondent moved there and therefore is a non-local person. At the provincial level, the percentage of inter-provincial resident immigration in the total resident population of each provincial-level administrative unit1 is employed to search for some empirical evidence of the impact of spatial mobility on general trust on a province level. According to the Office of the Sixth National Population Census of the State Council of the People’s Republic of China and the Department of Population and Employment Statistics of the National Bureau of Statistics (2011),
Resident population of a given town/street include: people living in the current town/street where their household registration is located or with their household registration to be settled; people living in the current town/street and leaving the town/street of their household registration for over 6 months; people leaving the town/street of their household registration for less than 6 months or working or studying overseas, with their household registration located in the current town/street. (p. 49)
Similar definition applies to resident population of a province-level administrative division. Inter-provincial resident immigration refers to those who live in the current province for more than 6 months with a hukou of another province. The corresponding data about resident population and inter-provincial resident immigration of provincial-level administrative divisions are provided in Appendix B.
Three demographic variables are included, namely age group, gender and current highest education. Therein, age group is a single ordinal variable constructed by calculating age first by subtracting 2013, the survey year, from the birth year of all respondents, then dividing age into 10 almost equal
1 P.R. China has 34 provincial-level administrative units, including 23 provinces, 5 autonomous regions, 4 municipalities directly administrated by the central government, and 2 special administrative regions. More information about the administrative divisions of P.R. China can be found at the official website of the Central People’s Government of the People’s Republic of China (in Chinese): http://www.gov.cn/guoqing/2005-09/13/content_5043917.htm, accessed on 27th Oct., 2017.
Trust and Development: The Deep Structure of Institutions-Building and Socio-Economic Performance
188
intervals1 and finally valuing the ascendingly sorted intervals from 1 to 10, respectively. Gender is a dummy variable with 1 representing “female” and 0 representing “male”. Originally in the questionnaire, current highest education contains 14 optional categories with the 14th category being “other”. These 14 categories are combined into 5 categories in this chapter with category “other” having been omitted. The 5 categories are “less than elementary education”, “elementary education”, “secondary education – middle”, “secondary education – high” and “tertiary education” respectively. 4 dummies are generated from the 5 categories with 1 representing each of the last four categories and 0 otherwise. Rural is a dummy variable with 1 representing “rural area” indicating whether a respondent is living in the rural areas when being interviewed and 0 otherwise. The variables mentioned above are all from the micro (personal) level. In addition, the empirical analysis of this chapter also takes into account the spatial mobility at both the micro (personal) level and the province level. Subjective social class at 14 years old is treated as a proxy of family origin and is integers in range [1, 10]. Precept is selected for controlling for individual judgment about which principle should be used in different situations, and is a 5-point Likert type item with 1 representing “Strongly disagree” and 5 “Strongly agree”. What is more, Table 3.2 presents descriptive statistics for all variables used in the empirical analyses in this chapter from CGSS 2013.
It should be noted that not all variables (including control and core explanatory variables) appearing in the research of other scholars and having an influence on general trust as the dependent variable are suitable for being controlled in this chapter; selection of control variables needs to take into consideration the core explanatory variables to be tested, and is constrained by the availability of corresponding data. By the way, the core explanatory variables, especially those reflecting norm-conforming and opinion-similarity, in this chapter are all relatively close and essential factors for general trust. What is more, Ray (2003, pp. 4,6,13,15,20) summarizes five guidelines about the selection of control variables: (a) “Do not control for intervening variables”; (b) “Distinguish between complementary and competing explanatory factors”; (c) “Do not introduce factors as control variables merely on the grounds that they have an impact on the dependent variable”; (d) “Do not control for variables that are related to each other or the key explanatory factor by definition”; (e) “Control for possible differences between across space and over time relationships”. (For details, see, Ray, 2003) In addition, it is possible that different empirical research turns out to draw different conclusions because different data sets have their own characteristics, and different variables are chosen for different purposes, given a dependent variable.
1 Because the range of age is not divisible by 10.

Chapter 3: What Affect General Trust? Perspective from Norm-Conforming, Opinion Similarity and Geographic Mobility: Empirical Evidence from China
189
Table 3.1 Variable selection and construction from CGSS 2013. Type Variables Question number;
Variables name
How variables are constructed from CGSS 2013 variables
Dependent variable General trust A33; a33 Same with the options and coding of corresponding question in CGSS 2013.
Core explanatory variable Being taken advantage A34; a34 Ditto.
Social fairness A35; a35 Ditto.
Moral satisfaction D1; d1 Reverse the original scores. Namely, 5 = Very satisfied; 4 = Satisfied; 3 = Neither; 2 = Dissatisfied; 1 = Very dissatisfied
Opinion similarity B4; b4 Same with the options and coding of corresponding question in CGSS 2013.
Non-local A25; a25 0 = "I have been living here since I was born"; 1 = otherwise.
Control variables Gender A2; a2 1 = Female; 0 = Male
Age group A3; a3 Age = 2013 – birthyear. Age group = 1 if age in [18, 25). Similarly, 2 = [25, 33), 3 = [33, 41), 4 = [41, 49), 5= [49, 57),
6 = [57, 65), 7 = [65, 73), 8 = [73, 81), 9 = [81, 89), 10 = [89, 96].
Current highest education A7a; a7a Classify highest education into five categories first: less than elementary education, elementary, secondary middle,
secondary high and tertiary. Then, 4 dummies are constructed. Reference: less than elementary. 1 = elementary; 0 =
otherwise. 1 = Secondary middle; 0 = otherwise. 1 = Secondary high; 0 = otherwise. 1 = tertiary; 0 = otherwise.
Living locality - rural 5a; s5a 1 = the living locality is rural; 0 = otherwise.
Social class at 14 years old A43d; a43d Same with the options and coding of corresponding question in CGSS 2013.
Precept B3; b3 Ditto.
Notes: In the third column, what is before the semicolon is the question number in the CGSS 2013 Questionnaire B; what is after the semicolon is the corresponding variable name in the CGSS 2013 dataset which is or is used to constructed the micro variable in the second column. In addition, for the translation from Chinese into English of almost all original questions from CGSS 2013 Questionnaire B used in this chapter, see Appendix A. Source: CGSS 2013 (National Survey Research Center at Renmin University of China, 2013b, 2013c).

Trust and Development: The Deep Structure of Institutions-Building and Socio-Economic Performance
190
Table 3.2 Descriptive statistics of micro variables from CGSS 2013. Var. Freq. (N=5356) Min. 1st qu. Median Mean 3rd qu. Max. S.d. 0 1 General trust 1.000 2.000 4.000 3.276 4.000 5.000 1.0198 Being taken advantage 1.000 2.000 3.000 3.055 4.000 5.000 1.0096 Social fairness 1.000 2.000 3.000 2.994 4.000 5.000 1.0386 Moral satisfaction 1.000 3.000 3.000 3.104 4.000 5.000 0.8638 Opinion similarity 1.000 3.000 4.000 3.458 4.000 5.000 0.7660 Non-local 1386 3970 0.4380 Gender 2706 2650
Age group 1.000 3.000 4.000 4.432 6.000 10.000 2.0375 Highest education - less than elementary 4656 700
Highest education - elementary 4241 1115
Highest education - secondary middle 3781 1575
Highest education - secondary high 4300 1056
Highest education - tertiary 4446 910
Rural 3339 2017
Precept 1.000 2.000 3.000 2.844 3.000 5.000 0.8412 Social class at 14 years old 1.000 2.000 3.000 3.094 4.000 10.000 1.7855
Notes: Author’s own calculation using R (R Core Team, 2017). R-package foreign (R Core Team, 2016) and reshape (Wickham, 2007) are also used. Data source: CGSS 2013 (National Survey Research Center at Renmin University of China, 2013b, 2013c).

Chapter 3: What Affect General Trust? Perspective from Norm-Conforming, Opinion Similarity and Geographic Mobility: Empirical Evidence from China
191
3.4 Econometric models and results
3.4.1 Ordered logit model
According to the characteristic of the data used that the dependent variable general trust is an ordinal, categorical variable with more than two levels, ordered logit regression, also known as proportional odds model which is proposed by McCullagh (1980), becomes the first choice for the econometric analysis in this chapter.1 The ordered logit model is set as below:
logit [P(𝐺𝑒𝑛𝑒𝑟𝑎𝑙𝑇𝑟𝑢𝑠𝑡𝑖𝑝 ≤ 𝑗)| 𝐱]
= −(𝛽0𝑗 + 𝛽1𝐵𝑒𝑖𝑛𝑔𝑇𝑎𝑘𝑒𝑛𝐴𝑑𝑣𝑎𝑛𝑡𝑎𝑔𝑒𝑖𝑝 + 𝛽2𝑆𝑜𝑐𝑖𝑎𝑙𝐹𝑎𝑖𝑟𝑛𝑒𝑠𝑠𝑖𝑝
+ 𝛽3𝑀𝑜𝑟𝑎𝑙𝑆𝑎𝑡𝑖𝑠𝑓𝑎𝑐𝑡𝑖𝑜𝑛𝑖𝑝 + 𝛽4𝑂𝑝𝑖𝑛𝑖𝑜𝑛𝑆𝑖𝑚𝑖𝑙𝑎𝑟𝑖𝑡𝑦𝑖𝑝 + 𝛽5𝑁𝑜𝑛𝑙𝑜𝑐𝑎𝑙𝑖𝑝
+ 𝛽6𝑝𝑐𝑡𝐼𝑛𝑡𝑒𝑟𝑝𝑟𝑜𝑣𝑖𝑛𝑐𝑖𝑎𝑙𝐼𝑚𝑚𝑖𝑔𝑟𝑎𝑛𝑡𝑠𝑝 + 𝛽7𝐺𝑒𝑛𝑑𝑒𝑟𝐹𝑒𝑚𝑎𝑙𝑒𝑖𝑝
+ 𝛽8𝐴𝑔𝑒𝐺𝑟𝑜𝑢𝑝𝑖𝑝 + 𝛽9𝑅𝑢𝑟𝑎𝑙𝑖𝑝 + 𝛽10𝑆𝑜𝑐𝑖𝑎𝑙𝐶𝑙𝑎𝑠𝑠14𝑖𝑝
+ 𝛽11𝐻𝑖𝑔ℎ𝑒𝑠𝑡𝐸𝑑𝑢𝑐𝑎𝑡𝑖𝑜𝑛𝐸𝑙𝑒𝑚𝑒𝑛𝑡𝑎𝑟𝑦𝑖𝑝
+ 𝛽12𝐻𝑖𝑔ℎ𝑒𝑠𝑡𝐸𝑑𝑢𝑐𝑎𝑡𝑖𝑜𝑛𝑆𝑒𝑐𝑜𝑛𝑑𝑎𝑟𝑦𝑀𝑖𝑑𝑑𝑙𝑒𝑖𝑝
+ 𝛽13𝐻𝑖𝑔ℎ𝑒𝑠𝑡𝐸𝑑𝑢𝑐𝑎𝑡𝑖𝑜𝑛𝑆𝑒𝑐𝑜𝑛𝑑𝑎𝑟𝑦𝐻𝑖𝑔ℎ𝑖𝑝
+ 𝛽14𝐻𝑖𝑔ℎ𝑒𝑠𝑡𝐸𝑑𝑢𝑐𝑎𝑡𝑖𝑜𝑛𝑇𝑒𝑟𝑡𝑖𝑎𝑟𝑦𝑖𝑝 + 𝛽15𝑃𝑟𝑒𝑐𝑒𝑝𝑡𝑖𝑝) (𝑗 = 1,2,3,4) 2
Or written like this:
logit [P(𝐺𝑒𝑛𝑒𝑟𝑎𝑙𝑇𝑟𝑢𝑠𝑡𝑖𝑝 ≥ 𝑗)| 𝐱]
= 𝛽0𝑗 + 𝛽1𝐵𝑒𝑖𝑛𝑔𝑇𝑎𝑘𝑒𝑛𝐴𝑑𝑣𝑎𝑛𝑡𝑎𝑔𝑒𝑖𝑝 + 𝛽2𝑆𝑜𝑐𝑖𝑎𝑙𝐹𝑎𝑖𝑟𝑛𝑒𝑠𝑠𝑖𝑝
+ 𝛽3𝑀𝑜𝑟𝑎𝑙𝑆𝑎𝑡𝑖𝑠𝑓𝑎𝑐𝑡𝑖𝑜𝑛𝑖𝑝 + 𝛽4𝑂𝑝𝑖𝑛𝑖𝑜𝑛𝑆𝑖𝑚𝑖𝑙𝑎𝑟𝑖𝑡𝑦𝑖𝑝 + 𝛽5𝑁𝑜𝑛𝑙𝑜𝑐𝑎𝑙𝑖𝑝
+ 𝛽6𝑝𝑐𝑡𝐼𝑛𝑡𝑒𝑟𝑝𝑟𝑜𝑣𝑖𝑛𝑐𝑖𝑎𝑙𝐼𝑚𝑚𝑖𝑔𝑟𝑎𝑛𝑡𝑠𝑝 + 𝛽7𝐺𝑒𝑛𝑑𝑒𝑟𝐹𝑒𝑚𝑎𝑙𝑒𝑖𝑝
+ 𝛽8𝐴𝑔𝑒𝐺𝑟𝑜𝑢𝑝𝑖𝑝 + 𝛽9𝑅𝑢𝑟𝑎𝑙𝑖𝑝 + 𝛽10𝑆𝑜𝑐𝑖𝑎𝑙𝐶𝑙𝑎𝑠𝑠14𝑖𝑝
+ 𝛽11𝐻𝑖𝑔ℎ𝑒𝑠𝑡𝐸𝑑𝑢𝑐𝑎𝑡𝑖𝑜𝑛𝐸𝑙𝑒𝑚𝑒𝑛𝑡𝑎𝑟𝑦𝑖𝑝
+ 𝛽12𝐻𝑖𝑔ℎ𝑒𝑠𝑡𝐸𝑑𝑢𝑐𝑎𝑡𝑖𝑜𝑛𝑆𝑒𝑐𝑜𝑛𝑑𝑎𝑟𝑦𝑀𝑖𝑑𝑑𝑙𝑒𝑖𝑝
+ 𝛽13𝐻𝑖𝑔ℎ𝑒𝑠𝑡𝐸𝑑𝑢𝑐𝑎𝑡𝑖𝑜𝑛𝑆𝑒𝑐𝑜𝑛𝑑𝑎𝑟𝑦𝐻𝑖𝑔ℎ𝑖𝑝
+ 𝛽14𝐻𝑖𝑔ℎ𝑒𝑠𝑡𝐸𝑑𝑢𝑐𝑎𝑡𝑖𝑜𝑛𝑇𝑒𝑟𝑡𝑖𝑎𝑟𝑦𝑖𝑝 + 𝛽15𝑃𝑟𝑒𝑐𝑒𝑝𝑡𝑖𝑝 (𝑗 = 2,3,4,5) 3
In the formula above, x represents the set constructed by all independent variables (including both core explanatory variables and control variables). Subscript i indicates individual persons, and subscript p provinces. 𝛽0𝑗 (j = 1,2,3,4 in the first formula or j= 2,3,4,5 in the second formula) are the intercepts, 𝛽1 ~ 𝛽6 are the coefficients of core explanatory variables, and 𝛽7 ~ 𝛽15 are the coefficients of control variables. j indicates the categories of the dependent variable general trust. On the right hand side of the equation, the 6 core explanatory variables are respectively being taken advantage (a 5-point Likert type item), social fairness (a 5-point Likert type item), moral
1 Note that ordered logit regression takes proportional odds as its assumption, which means that the analysis using ordered logit regression unfolds under that assumption. In addition, for more knowledge about analysis of ordinal categorical data, see e.g., Agresti (2010). For more knowledge about discrete response models, see, e.g., Wooldridge (2002). 2 The signs on the righthand side of the model are adapted according to the latent model estimated latter using the R-package VGAM (Yee, 2017), a package which is used for economic analysis in this chapter, in order for my model and the results outputted by VGAM to be consistent in explanation. 3 Ditto.
Trust and Development: The Deep Structure of Institutions-Building and Socio-Economic Performance
192
satisfaction (a 5-point Likert type item), opinion similarity (a 5-point Likert type item), non-local (a dummy) and percentage of inter-provincial immigrants (provincial level data); the 9 control variables are respectively gender female (a dummy), age group (a 10-point variable), highest education elementary (a dummy), highest education secondary middle (a dummy), highest education secondary high (a dummy), highest education tertiary (a dummy), social class at 14 years old (a 10-point Likert type item), precepts (a 5-point Likert type item), rural (a dummy). As seen, being independent variables (either core explanatory variables or control variables), all five-point Likert type items are treated as single predictors, rather than separate dummies.1
3.4.2 (Multi)Correlation between explanatory variables
Socio-economic variables are unavoidably correlated to or associated with each other to some degree. As in linear regression, logit regressions, including binary logistic regression, multinomial logit regression and ordered logit regression, which are non-linear regressions developed based on linear regression and are also classified as generalized linear models, also suffer from (multi)collinearity2 (e.g., Allison, 2012; Midi, Sarkar and Rana, 2010). (Multi)collinearity would result in biased coefficient estimates and inflated variances and standard errors of individual parameter, especially for small and moderate samples, and cause overfit, without reducing the explanatory power of the whole model (e.g., Midi, Sarkar and Rana, 2010). High degree of (multi)collinearity could change the statistical significance of individual parameter from significant to insignificant and even the sign to the opposite. In order to have a look at which explanatory variables have (multi)collinearity and the degree of (multi)collinearity, and to dispel misgivings about this issue of some readers, pairwise and partial correlations between explanatory variables and the VIF of each explanatory variable are presented respectively. In addition, no linear relations does not mean no non-linear relations.
(i) Pairwise simple correlations
Before econometric analysis is implemented, pairwise Pearson correlation coefficients between all independent variables and their corresponding p-values are presented in Table 3.3 in order to detect the pairwise linear relations between them.3 For convenience, use X1 ~ X15 to represent all the independent variables, respectively. Specifically, X1 represents being taken advantage, X2 social fairness, X3 moral satisfaction, X4 opinion similarity, X5 non-local, X6 percentage of interprovincial immigration, X7 female, X8 age group, X9 rural, X10 social class at 14 years old, X11 highest education – elementary, X12 highest education – secondary middle, X13 highest education – secondary high, X14 highest education – tertiary, and X15 precept. From Table 3.3, the variable pairs of which the absolute values of the correlation coefficients are in range [0.3, 0.4) are X2 and X3 (p = 0.0000), X6 and X9 (p = 0.0000), X8 and X14 (p = 0.0000), X11 and X12 (p =
1 For more discussion about whether parametric statistics can be used with Likert type items, see, e.g., Norman (2010). Norman (2010, p. 631) argues that “parametric statistics can be used with Likert data, with small sample sizes, with unequal variances, and with non-normal distributions”. In the area of economics, Likert type item is also treated as a single independent variable in top journals. For example, Blanco and Ruiz (2013) use insecurity which is a 4-point scale type item as a single explanatory variable. Another example, Cornwell et al (2008) treat self-reported health which is a 5-point Likert type item as a single independent variable. 2 Wooldridge (2002, Chapter 15) classifies the three models of binary logistic model, multinomial logit model, and ordered logit model, into what he calls discrete response models. 3 Since Pearson’s r is robust to non-normality and ordinal data (Norman, 2010), it is adopted to measure the relationship between these variables, rather than using Spearman’s rho or Kendall’s tau b.

Chapter 3: What Affect General Trust? Perspective from Norm-Conforming, Opinion Similarity and Geographic Mobility: Empirical Evidence from China
193
0.0000), and X12 and X13 (p = 0.0000); the variable pairs of which the absolute values of correlation coefficients in range [0.2, 0.3) are that of X5 and X9 (p = 0.0000), X6 and X10 (p = 0.0000), X6 and X14 (p = 0.0000), X9 and X10 (p = 0.0000), X9 and X11 (p = 0.0000), X9 and X13 (p = 0.0000), X9 and X14 (p = 0.0000), and X10 and X14 (p = 0.0000); and the variable pairs of which the absolute values of correlation coefficients in range [0.1, 0.2) are X1 and X2 (p = 0.0000), X1 and X3 (p = 0.0000), X2 and X8 (p = 0.0000), X2 and X9 (p = 0.0000), X3 and X8 (p = 0.0000), X3 and X9 (p = 0.0000), X3 and X14 (p = 0.0000), X5 and X6 (p = 0.0000), X5 and X10 (p = 0.0000), X5 and X14 (p = 0.0000), X6 and X11 (p = 0.0000), X6 and X13 (p = 0.0000), X10 and X11 (p = 0.0000), and X10 and X13 (p = 0.0000). It can be seen that the simple correlation coefficients between the dummy variables of education are high. However, it should not be a problem.
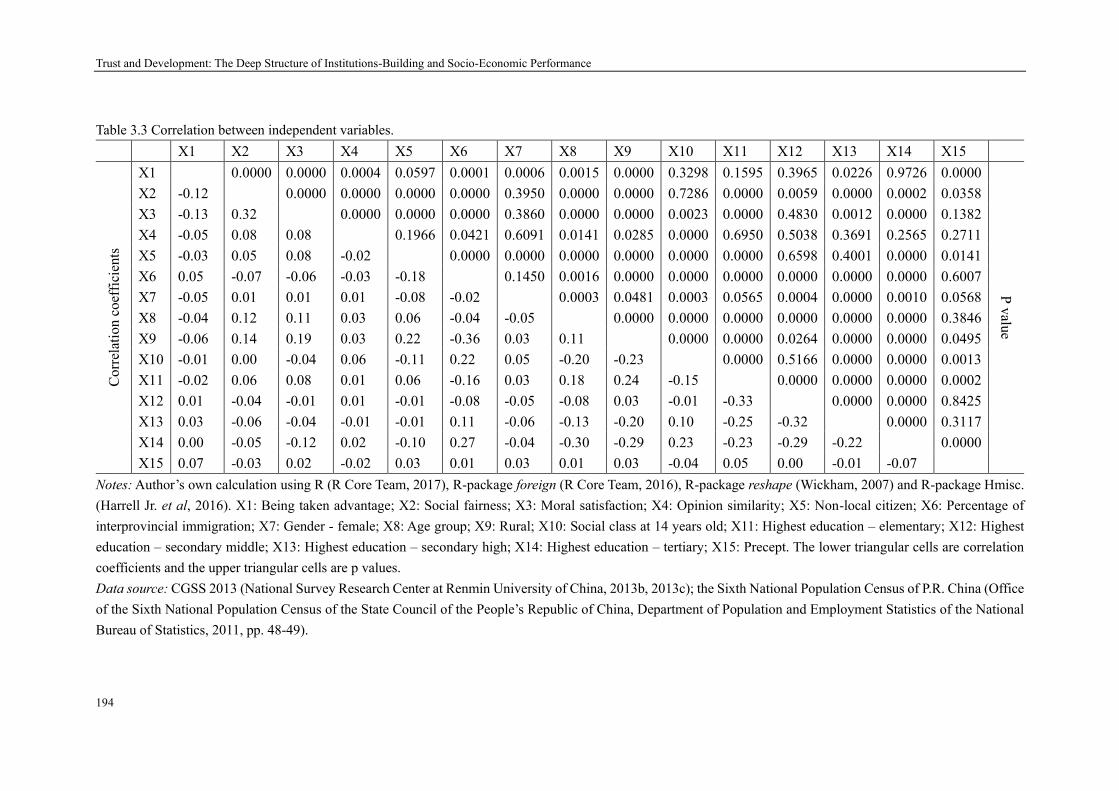
Trust and Development: The Deep Structure of Institutions-Building and Socio-Economic Performance
194
Table 3.3 Correlation between independent variables. X1 X2 X3 X4 X5 X6 X7 X8 X9 X10 X11 X12 X13 X14 X15
Cor
rela
tion
coef
ficie
nts
X1 0.0000 0.0000 0.0004 0.0597 0.0001 0.0006 0.0015 0.0000 0.3298 0.1595 0.3965 0.0226 0.9726 0.0000
P value
X2 -0.12 0.0000 0.0000 0.0000 0.0000 0.3950 0.0000 0.0000 0.7286 0.0000 0.0059 0.0000 0.0002 0.0358 X3 -0.13 0.32 0.0000 0.0000 0.0000 0.3860 0.0000 0.0000 0.0023 0.0000 0.4830 0.0012 0.0000 0.1382 X4 -0.05 0.08 0.08 0.1966 0.0421 0.6091 0.0141 0.0285 0.0000 0.6950 0.5038 0.3691 0.2565 0.2711 X5 -0.03 0.05 0.08 -0.02 0.0000 0.0000 0.0000 0.0000 0.0000 0.0000 0.6598 0.4001 0.0000 0.0141 X6 0.05 -0.07 -0.06 -0.03 -0.18 0.1450 0.0016 0.0000 0.0000 0.0000 0.0000 0.0000 0.0000 0.6007 X7 -0.05 0.01 0.01 0.01 -0.08 -0.02 0.0003 0.0481 0.0003 0.0565 0.0004 0.0000 0.0010 0.0568 X8 -0.04 0.12 0.11 0.03 0.06 -0.04 -0.05 0.0000 0.0000 0.0000 0.0000 0.0000 0.0000 0.3846 X9 -0.06 0.14 0.19 0.03 0.22 -0.36 0.03 0.11 0.0000 0.0000 0.0264 0.0000 0.0000 0.0495 X10 -0.01 0.00 -0.04 0.06 -0.11 0.22 0.05 -0.20 -0.23 0.0000 0.5166 0.0000 0.0000 0.0013 X11 -0.02 0.06 0.08 0.01 0.06 -0.16 0.03 0.18 0.24 -0.15 0.0000 0.0000 0.0000 0.0002 X12 0.01 -0.04 -0.01 0.01 -0.01 -0.08 -0.05 -0.08 0.03 -0.01 -0.33 0.0000 0.0000 0.8425 X13 0.03 -0.06 -0.04 -0.01 -0.01 0.11 -0.06 -0.13 -0.20 0.10 -0.25 -0.32 0.0000 0.3117 X14 0.00 -0.05 -0.12 0.02 -0.10 0.27 -0.04 -0.30 -0.29 0.23 -0.23 -0.29 -0.22 0.0000 X15 0.07 -0.03 0.02 -0.02 0.03 0.01 0.03 0.01 0.03 -0.04 0.05 0.00 -0.01 -0.07
Notes: Author’s own calculation using R (R Core Team, 2017), R-package foreign (R Core Team, 2016), R-package reshape (Wickham, 2007) and R-package Hmisc. (Harrell Jr. et al, 2016). X1: Being taken advantage; X2: Social fairness; X3: Moral satisfaction; X4: Opinion similarity; X5: Non-local citizen; X6: Percentage of interprovincial immigration; X7: Gender - female; X8: Age group; X9: Rural; X10: Social class at 14 years old; X11: Highest education – elementary; X12: Highest education – secondary middle; X13: Highest education – secondary high; X14: Highest education – tertiary; X15: Precept. The lower triangular cells are correlation coefficients and the upper triangular cells are p values. Data source: CGSS 2013 (National Survey Research Center at Renmin University of China, 2013b, 2013c); the Sixth National Population Census of P.R. China (Office of the Sixth National Population Census of the State Council of the People’s Republic of China, Department of Population and Employment Statistics of the National Bureau of Statistics, 2011, pp. 48-49).

Chapter 3: What Affect General Trust? Perspective from Norm-Conforming, Opinion Similarity and Geographic Mobility: Empirical Evidence from China
195
(ii) Partial correlations
Moreover, because there are more than two explanatory variables in the model in this chapter, pairwise simple correlation coefficients are not as suitable as partial correlation coefficients which take into consideration the influences of other variables. Therefore, partial correlations are also going to be given.
Still, for convenience, use X1 ~ X15 to represent all the independent variables like in the simple correlation coefficients above. Table 3.4 presents Pearson partial correlation coefficients between all independent variables and their corresponding p-values. From Table 3.4, the absolute values of the partial correlation coefficients between X11~X14 are the largest, all in range [0.5845, 0.7226] with p = 0.0000. The partial correlation coefficient between X8 and X14 is -0.4629 (p = 0.0000), between X8 and X13 is -0.3915 (p = 0.0000), and between X8 and X12 is -0.3736 (p = 0.0000). The variable pairs of which the absolute values of the partial correlation coefficients are in range [0.2, 0.3) are X2 and X3 (p = 0.0000), X6 and X9 (p = 0.0000), X7 and X12 (p = 0.0000), X7 and X13 (p = 0.0000), X7 and X14 (p = 0.0000), X9 and X13 (p = 0.0000), X9 and X14 (p = 0.0000); the variable pairs of which the absolute values of the partial correlation coefficients are in range [0.1, 0.2) are X5 and X6 (p = 0.0000), X5 and X9 (p = 0.0000), X6 and X8 (p = 0.0000), X6 and X10 (p = 0.0000), X6 and X13 (p = 0.0000), X6 and X14 (p = 0.0000), X7 and X8 (p = 0.0000), X7 and X11 (p = 0.0000), X8 and X9 (p = 0.0000), X10 and X13 (p = 0.0000), X10 and X14 (p = 0.0000). Still, the partial correlation coefficients between the dummy variables of education are high, which should not be a problem.
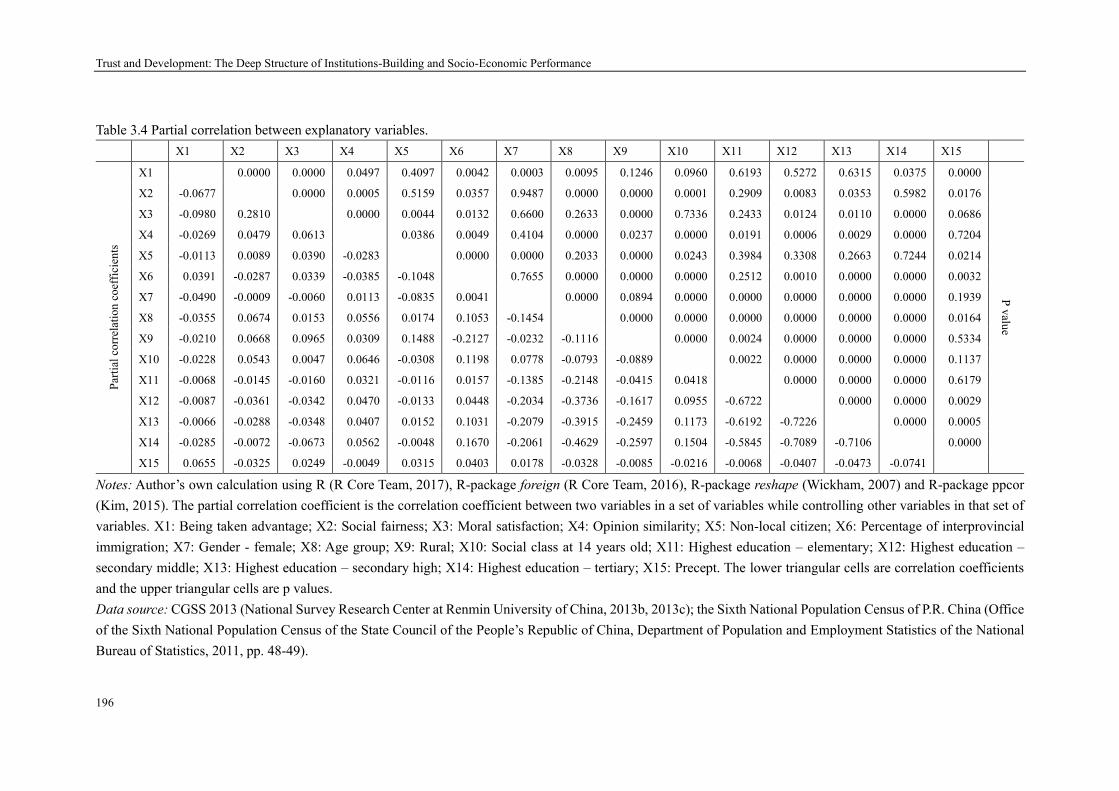
Trust and Development: The Deep Structure of Institutions-Building and Socio-Economic Performance
196
Table 3.4 Partial correlation between explanatory variables. X1 X2 X3 X4 X5 X6 X7 X8 X9 X10 X11 X12 X13 X14 X15
Parti
al c
orre
latio
n co
effic
ient
s
X1 0.0000 0.0000 0.0497 0.4097 0.0042 0.0003 0.0095 0.1246 0.0960 0.6193 0.5272 0.6315 0.0375 0.0000
P value
X2 -0.0677 0.0000 0.0005 0.5159 0.0357 0.9487 0.0000 0.0000 0.0001 0.2909 0.0083 0.0353 0.5982 0.0176
X3 -0.0980 0.2810 0.0000 0.0044 0.0132 0.6600 0.2633 0.0000 0.7336 0.2433 0.0124 0.0110 0.0000 0.0686
X4 -0.0269 0.0479 0.0613 0.0386 0.0049 0.4104 0.0000 0.0237 0.0000 0.0191 0.0006 0.0029 0.0000 0.7204
X5 -0.0113 0.0089 0.0390 -0.0283 0.0000 0.0000 0.2033 0.0000 0.0243 0.3984 0.3308 0.2663 0.7244 0.0214
X6 0.0391 -0.0287 0.0339 -0.0385 -0.1048 0.7655 0.0000 0.0000 0.0000 0.2512 0.0010 0.0000 0.0000 0.0032
X7 -0.0490 -0.0009 -0.0060 0.0113 -0.0835 0.0041 0.0000 0.0894 0.0000 0.0000 0.0000 0.0000 0.0000 0.1939
X8 -0.0355 0.0674 0.0153 0.0556 0.0174 0.1053 -0.1454 0.0000 0.0000 0.0000 0.0000 0.0000 0.0000 0.0164
X9 -0.0210 0.0668 0.0965 0.0309 0.1488 -0.2127 -0.0232 -0.1116 0.0000 0.0024 0.0000 0.0000 0.0000 0.5334
X10 -0.0228 0.0543 0.0047 0.0646 -0.0308 0.1198 0.0778 -0.0793 -0.0889 0.0022 0.0000 0.0000 0.0000 0.1137
X11 -0.0068 -0.0145 -0.0160 0.0321 -0.0116 0.0157 -0.1385 -0.2148 -0.0415 0.0418 0.0000 0.0000 0.0000 0.6179
X12 -0.0087 -0.0361 -0.0342 0.0470 -0.0133 0.0448 -0.2034 -0.3736 -0.1617 0.0955 -0.6722 0.0000 0.0000 0.0029
X13 -0.0066 -0.0288 -0.0348 0.0407 0.0152 0.1031 -0.2079 -0.3915 -0.2459 0.1173 -0.6192 -0.7226 0.0000 0.0005
X14 -0.0285 -0.0072 -0.0673 0.0562 -0.0048 0.1670 -0.2061 -0.4629 -0.2597 0.1504 -0.5845 -0.7089 -0.7106 0.0000
X15 0.0655 -0.0325 0.0249 -0.0049 0.0315 0.0403 0.0178 -0.0328 -0.0085 -0.0216 -0.0068 -0.0407 -0.0473 -0.0741
Notes: Author’s own calculation using R (R Core Team, 2017), R-package foreign (R Core Team, 2016), R-package reshape (Wickham, 2007) and R-package ppcor (Kim, 2015). The partial correlation coefficient is the correlation coefficient between two variables in a set of variables while controlling other variables in that set of variables. X1: Being taken advantage; X2: Social fairness; X3: Moral satisfaction; X4: Opinion similarity; X5: Non-local citizen; X6: Percentage of interprovincial immigration; X7: Gender - female; X8: Age group; X9: Rural; X10: Social class at 14 years old; X11: Highest education – elementary; X12: Highest education – secondary middle; X13: Highest education – secondary high; X14: Highest education – tertiary; X15: Precept. The lower triangular cells are correlation coefficients and the upper triangular cells are p values. Data source: CGSS 2013 (National Survey Research Center at Renmin University of China, 2013b, 2013c); the Sixth National Population Census of P.R. China (Office of the Sixth National Population Census of the State Council of the People’s Republic of China, Department of Population and Employment Statistics of the National Bureau of Statistics, 2011, pp. 48-49).
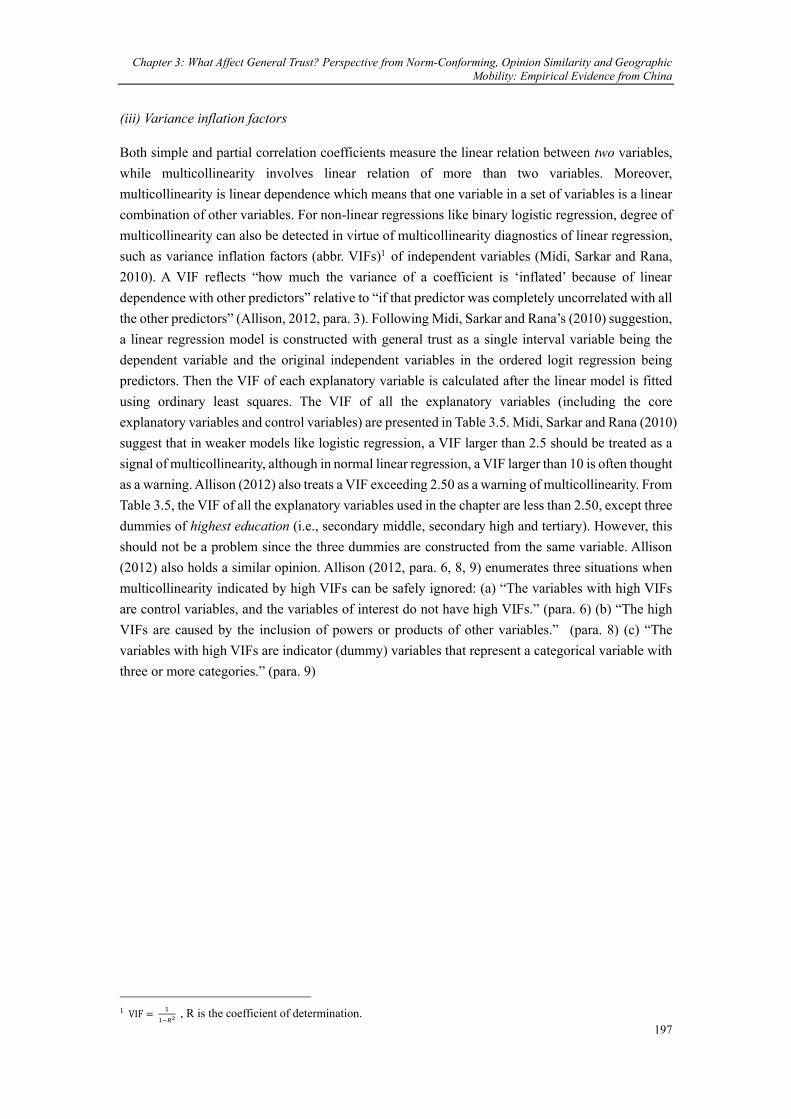
Chapter 3: What Affect General Trust? Perspective from Norm-Conforming, Opinion Similarity and Geographic Mobility: Empirical Evidence from China
197
(iii) Variance inflation factors
Both simple and partial correlation coefficients measure the linear relation between two variables, while multicollinearity involves linear relation of more than two variables. Moreover, multicollinearity is linear dependence which means that one variable in a set of variables is a linear combination of other variables. For non-linear regressions like binary logistic regression, degree of multicollinearity can also be detected in virtue of multicollinearity diagnostics of linear regression, such as variance inflation factors (abbr. VIFs)1 of independent variables (Midi, Sarkar and Rana, 2010). A VIF reflects “how much the variance of a coefficient is ‘inflated’ because of linear dependence with other predictors” relative to “if that predictor was completely uncorrelated with all the other predictors” (Allison, 2012, para. 3). Following Midi, Sarkar and Rana’s (2010) suggestion, a linear regression model is constructed with general trust as a single interval variable being the dependent variable and the original independent variables in the ordered logit regression being predictors. Then the VIF of each explanatory variable is calculated after the linear model is fitted using ordinary least squares. The VIF of all the explanatory variables (including the core explanatory variables and control variables) are presented in Table 3.5. Midi, Sarkar and Rana (2010) suggest that in weaker models like logistic regression, a VIF larger than 2.5 should be treated as a signal of multicollinearity, although in normal linear regression, a VIF larger than 10 is often thought as a warning. Allison (2012) also treats a VIF exceeding 2.50 as a warning of multicollinearity. From Table 3.5, the VIF of all the explanatory variables used in the chapter are less than 2.50, except three dummies of highest education (i.e., secondary middle, secondary high and tertiary). However, this should not be a problem since the three dummies are constructed from the same variable. Allison (2012) also holds a similar opinion. Allison (2012, para. 6, 8, 9) enumerates three situations when multicollinearity indicated by high VIFs can be safely ignored: (a) “The variables with high VIFs are control variables, and the variables of interest do not have high VIFs.” (para. 6) (b) “The high VIFs are caused by the inclusion of powers or products of other variables.” (para. 8) (c) “The variables with high VIFs are indicator (dummy) variables that represent a categorical variable with three or more categories.” (para. 9)
1 VIF =
1
1−𝑅2 , R is the coefficient of determination.
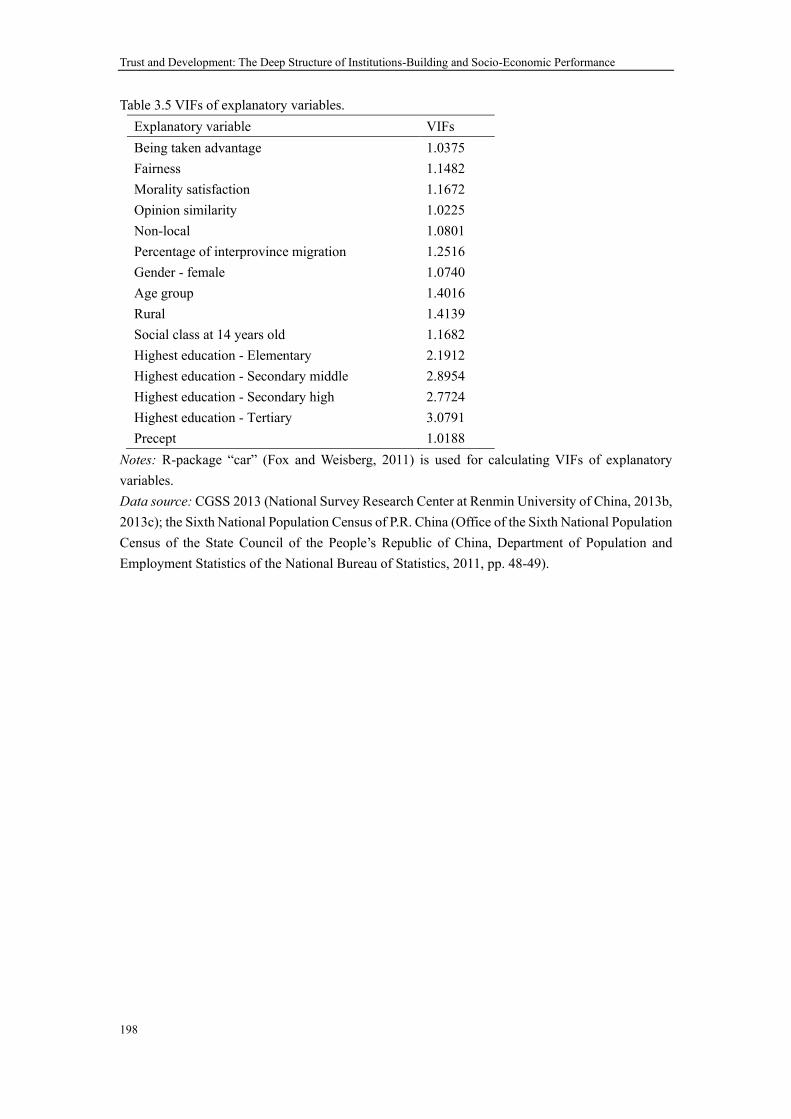
Trust and Development: The Deep Structure of Institutions-Building and Socio-Economic Performance
198
Table 3.5 VIFs of explanatory variables. Explanatory variable VIFs Being taken advantage 1.0375 Fairness 1.1482 Morality satisfaction 1.1672 Opinion similarity 1.0225 Non-local 1.0801 Percentage of interprovince migration 1.2516 Gender - female 1.0740 Age group 1.4016 Rural 1.4139 Social class at 14 years old 1.1682 Highest education - Elementary 2.1912 Highest education - Secondary middle 2.8954 Highest education - Secondary high 2.7724 Highest education - Tertiary 3.0791 Precept 1.0188
Notes: R-package “car” (Fox and Weisberg, 2011) is used for calculating VIFs of explanatory variables. Data source: CGSS 2013 (National Survey Research Center at Renmin University of China, 2013b, 2013c); the Sixth National Population Census of P.R. China (Office of the Sixth National Population Census of the State Council of the People’s Republic of China, Department of Population and Employment Statistics of the National Bureau of Statistics, 2011, pp. 48-49).

Chapter 3: What Affect General Trust? Perspective from Norm-Conforming, Opinion Similarity and Geographic Mobility: Empirical Evidence from China
199
3.4.3 Regression results of ordered logit model
Three regressions directly relevant to the ordered logit model of general trust above are implemented: 1) regression on intercepts and core explanatory variables (for results, see, Table 3.6); 2) regression on intercepts and control variables (for results, see, Table 3.7); 3) regression on intercepts, core explanatory variables and control variables (for results, see, Table 3.8). The results of the third regression (namely, Table 3.8) are going to be elaborated on.
In Table 3.8, in general, all the core explanatory variables and the control variables appeared in other research have the expected signs. Specifically, for the core explanatory variables, being taken advantage has a strongly significant negative impact on general trust (𝛽1≈ -0.29, significant at 0.001 level), social fairness has a strongly significant positive impact on general trust (𝛽2 ≈ 0.57, significant at 0.001 level), moral satisfaction has a strongly significant positive impact on general trust (𝛽3≈ 0.21, significant at 0.001 level), opinion similarity has a strongly significant positive impact on general trust (𝛽4≈ 0.29, significant at 0.001 level), non-local has a strongly significant negative impact of general trust (𝛽5≈ -0.20, significant at 0.01 level), percentage of interprovincial immigration, however, has an insignificant negative impact on general trust (𝛽6≈ -0.37, significant at 0.01 level). Among the 6 core explanatory variables, one unit’s change of social fairness has the biggest positive influence on odds holding other variables constant. Given a particular level of general trust, the log odds of the probability higher than or equal to this particular level against the probability lower than this particular level increases by about 0.78 when social fairness increases one unit (improves one level) (see column “Exp. coef.” in Table 3.8). Opinion similarity and moral satisfaction respectively improve log odds by about 0.34 and 0.23 when they increase by 1 level. In contrast, non-local, being taken advantage and percentage of interprovincial immigration decrease log odds respectively by about 0.18, 0.25 and 0.41 respectively when they increase by 1 unit.
Additionally, still in Table 3.8, for the control variables, female has a significant negative impact on general trust (𝛽7≈ -0.11, significant at 0.05 level) and decreases log odds by about 0.12 compared with males. Age group has a strongly significant positive impact on general trust (𝛽8 ≈ 0.10, significant at 0.001 level) and increases log odds by about 0.10 when increasing 1 unit. Rural has a significant positive impact on general trust (𝛽9≈ 0.31, significant at 0.001 level) and increases log odds by about 0.36 relative to non-rural. Social class at 14 years old has an insignificant negative impact on general trust (𝛽10≈ -0.03, insignificant even at 0.05 level) and decreases log odds by about 0.03 when increasing by 1 level. Compared with highest education – less than elementary education, highest education - elementary, - secondary middle, - secondary high and - tertiary are all have a positive impact on general trust, but with different significance. Highest education – secondary middle and – tertiary are significant respectively at the 0.05 and 0.001 significance level compared to highest education – less than elementary, while highest education – elementary and – secondary middle are not significant even at 0.05 level. Additionally, they respectively increase log odds by about 0.10, 0.19, 0.39 and 0.64 relative to the reference education level. Precept has a significant positive impact on general trust (𝛽15≈ 0.11, insignificant even at 0.001 level) and improves log odds by about 0.12.
Likelihood ratio tests can be used for comparing two nested models. Table 3.9 applies likelihood ratio tests between four pairs of nested regressions: the regression with core explanatory variables

Trust and Development: The Deep Structure of Institutions-Building and Socio-Economic Performance
200
(and intercepts) and with intercepts only; the regression with control variables (and intercepts) and with intercepts only; the regression with all independent variables (and intercepts) and with intercepts only; and the regression with all independent variables (and intercepts) and with control variables (and intercepts). The results show that all more complex models with more variables in each comparison pair hold with high significance at the 0.001 significance level.

Chapter 3: What Affect General Trust? Perspective from Norm-Conforming, Opinion Similarity and Geographic Mobility: Empirical Evidence from China
201
Table 3.6 Ordered logit regression (Core explanatory variables only). Estimate Std. error z value Pr (>|z|) Sign. Exp. coef. Intercept:1 1.0711 0.1978 5.416 0.0000 *** Intercept:2 -1.4311 0.1913 -7.481 0.0000 ***
Intercept:3 -2.2446 0.1928 -11.645 0.0000 ***
Intercept:4 -5.6107 0.2073 -27.061 0.0000 ***
Being taken advantage -0.2914 0.0267 -10.917 0.0000 *** 0.7472 Social fairness 0.5828 0.0276 21.109 0.0000 *** 1.7910 Morality satisfaction 0.2267 0.0324 7.001 0.0000 *** 1.2544 Opinion similarity 0.2955 0.0345 8.561 0.0000 *** 1.3439 Non-local citizen -0.1175 0.0610 -1.925 0.0542 . 0.8892 Percentage of interprovince migration -0.4907 0.2263 -2.169 0.0301 * 0.6122 Deviance 12733.22
Log likelihood -6366.608
AIC 12753.22
Pseudo R2 (McFadden)1 0.0672 Number of observations 5356
Data source: CGSS 2013 (National Survey Research Center at Renmin University of China, 2013b, 2013c); the Sixth National Population Census of P.R. China (Office of the Sixth National Population Census of the State Council of the People’s Republic of China, Department of Population and Employment Statistics of the National Bureau of Statistics, 2011, pp. 48-49). Notes: Significance code: 0~0.001 “***”; 0.001~0.01 “**”; 0.01~0.05 “*”; 0.05~0.1 “.”. Ordered logit regressions are implemented with R package VGAM (Yee, 2017). Name of linear predictor in each model is respectively logit(P[Y≥2]), logit(P[Y≥3]), logit(P[Y≥4]), logit(P[Y≥5]). For more knowledge of using R for econometric analysis, see, e.g., Heiss (2016).
1 𝑅𝑀𝑎𝑐𝐹𝑎𝑑𝑑𝑒𝑛
2 = 1 − ln 𝐿(𝑀𝐹𝑢𝑙𝑙) ln 𝐿(𝑀𝑁𝑢𝑙𝑙)⁄

Trust and Development: The Deep Structure of Institutions-Building and Socio-Economic Performance
202
Table 3.7 Ordered logit regression (Control variables only).
Estimate Std. error z value Pr (>|z|) Sign. Exp. coef.
Intercept:1 2.1571 0.1823 11.835 0.0000 ***
Intercept:2 -0.1688 0.1722 -0.98 0.3270
Intercept:3 -0.8967 0.1726 -5.196 0.0000 ***
Intercept:4 -4.0154 0.1840 -21.82 0.0000 ***
Gender – female -0.0525 0.0529 -0.993 0.3209 0.9488 Age group 0.1288 0.0149 8.656 0.0000 *** 1.1374 Rural 0.5192 0.0604 8.599 0.0000 *** 1.6807 Social class at 14 years old 0.0076 0.0153 0.498 0.6183 1.0077 Highest education – elementary 0.0868 0.0947 0.917 0.3593 1.0907 Highest education – secondary middle 0.0968 0.0963 1.006 0.3145 1.1017 Highest education – secondary high 0.1544 0.1072 1.441 0.1496 1.1670 Highest education – tertiary 0.3987 0.1183 3.37 0.0008 *** 1.4899 Precept 0.0671 0.0307 2.188 0.0286 * 1.0694 Deviance 13479.91
Log likelihood -6739.955
AIC 13505.91
Pseudo R2 (McFadden) 0.0125 Number of observations 5356
Notes: Significance code: 0~0.001 “***”; 0.001~0.01 “**”; 0.01~0.05 “*”; 0.05~0.1 “.”. Ordered logit regressions are implemented with R package VGAM (Yee, 2017). Name of linear predictor in each model is respectively logit(P[Y≥2]), logit(P[Y≥3]), logit(P[Y≥4]), logit(P[Y≥5]). Data source: CGSS 2013 (National Survey Research Center at Renmin University of China, 2013b, 2013c); the Sixth National Population Census of P.R. China (Office of the Sixth National Population Census of the State Council of the People’s Republic of China, Department of Population and Employment Statistics of the National Bureau of Statistics, 2011, pp. 48-49).

Chapter 3: What Affect General Trust? Perspective from Norm-Conforming, Opinion Similarity and Geographic Mobility: Empirical Evidence from China
203
Table 3.8 Ordered logit regression. Estimate Std. error z value Pr (>|z|) Sign. Exp. coef. Intercept:1 0.3311 0.2572 1.288 0.1979
Intercept:2 -2.1872 0.2530 -8.644 0.0000 ***
Intercept:3 -3.0120 0.2546 -11.832 0.0000 ***
Intercept:4 -6.4196 0.2682 -23.937 0.0000 ***
Being taken advantage -0.2940 0.0269 -10.945 0.0000 *** 0.7453 Social fairness 0.5738 0.0279 20.593 0.0000 *** 1.7750 Morality satisfaction 0.2071 0.0329 6.301 0.0000 *** 1.2301 Opinion similarity 0.2890 0.0347 8.318 0.0000 *** 1.3351 Non-local citizen -0.1960 0.0623 -3.148 0.0016 ** 0.8220 Percentage of interprovince migration
-0.3716 0.2485 -1.495 0.1348 0.6897
Gender – female -0.1116 0.0544 -2.052 0.0402 * 0.8944 Age group 0.0993 0.0154 6.458 0.0000 *** 1.1044 Rural 0.3067 0.0648 4.73 0.0000 *** 1.3589 Social class at 14 years old
-0.0296 0.0159 -1.862 0.0626 . 0.9709
Highest education – elementary
0.0914 0.0970 0.942 0.3462 1.0957
Highest education – secondary middle
0.1733 0.0990 1.751 0.0800 . 1.1892
Highest education – secondary high
0.2532 0.1106 2.288 0.022124 * 1.2881
Highest education – tertiary
0.4921 0.1233 3.99 6.61E-05 *** 1.6358
Precept 0.1150 0.0316 3.642 0.000271 *** 1.1219 Deviance 12643.75 Log likelihood -6321.873
AIC 12681.75
Pseudo R2 (McFadden) 0.0737 Number of observations
5356
Notes: Significance code: 0~0.001 “***”; 0.001~0.01 “**”; 0.01~0.05 “*”; 0.05~0.1 “.”. Ordered logit regressions are implemented with R package VGAM (Yee, 2017). Name of linear predictor in each model is respectively logit(P[Y≥2]), logit(P[Y≥3]), logit(P[Y≥4]), logit(P[Y≥5]). Data source: CGSS 2013 (National Survey Research Center at Renmin University of China, 2013b, 2013c); the Sixth National Population Census of P.R. China (Office of the Sixth National Population Census of the State Council of the People’s Republic of China, Department of Population and Employment Statistics of the National Bureau of Statistics, 2011, pp. 48-49).

Trust and Development: The Deep Structure of Institutions-Building and Socio-Economic Performance
204
Table 3.9 Likelihood ratio test between ordered logit regressions. #Df LogLik Df Chisq Pr(>Chisq) Sign. Core explanatory variables only 21414 -6366.6
Intercept only 21420 -6825.1 6 917.06 <2.2e-16 *** Control variables only 21411 -6740
Intercept only 21420 -6825.1 9 170.36 <2.2e-16 *** All independent variables 21405 -6321.9 Intercept only 21420 -6825.1 15 1006.5 <2.2e-16 *** All independent variables 21411 -6740 Control variables only 21405 -6321.9 6 836.17 <2.2e-16 ***
Notes: Significance code: 0~0.001 “***”; 0.001~0.01 “**”; 0.01~0.05 “*”; 0.05~0.1 “.”. Implemented with R-package VGAM (Yee, 2017). Data source: CGSS 2013 (National Survey Research Center at Renmin University of China, 2013b, 2013c); the Sixth National Population Census of P.R. China (Office of the Sixth National Population Census of the State Council of the People’s Republic of China, Department of Population and Employment Statistics of the National Bureau of Statistics, 2011, pp. 48-49).
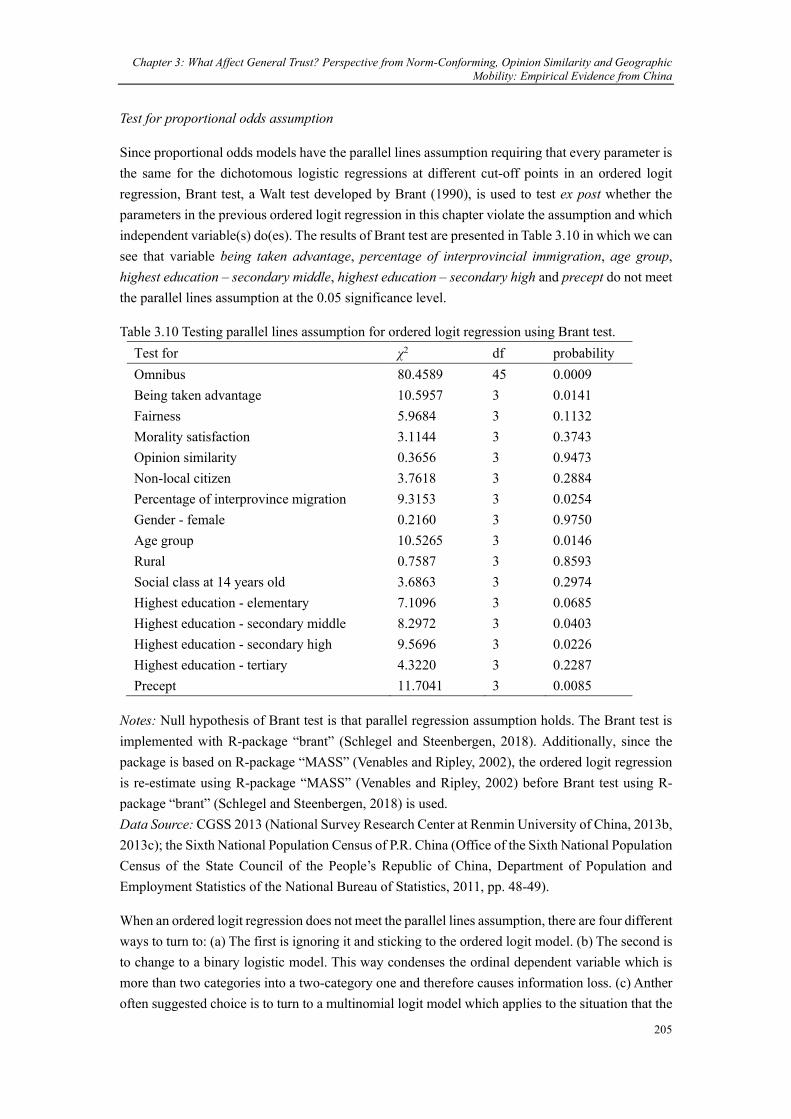
Chapter 3: What Affect General Trust? Perspective from Norm-Conforming, Opinion Similarity and Geographic Mobility: Empirical Evidence from China
205
Test for proportional odds assumption
Since proportional odds models have the parallel lines assumption requiring that every parameter is the same for the dichotomous logistic regressions at different cut-off points in an ordered logit regression, Brant test, a Walt test developed by Brant (1990), is used to test ex post whether the parameters in the previous ordered logit regression in this chapter violate the assumption and which independent variable(s) do(es). The results of Brant test are presented in Table 3.10 in which we can see that variable being taken advantage, percentage of interprovincial immigration, age group, highest education – secondary middle, highest education – secondary high and precept do not meet the parallel lines assumption at the 0.05 significance level.
Table 3.10 Testing parallel lines assumption for ordered logit regression using Brant test. Test for χ2 df probability Omnibus 80.4589 45 0.0009 Being taken advantage 10.5957 3 0.0141 Fairness 5.9684 3 0.1132 Morality satisfaction 3.1144 3 0.3743 Opinion similarity 0.3656 3 0.9473 Non-local citizen 3.7618 3 0.2884 Percentage of interprovince migration 9.3153 3 0.0254 Gender - female 0.2160 3 0.9750 Age group 10.5265 3 0.0146 Rural 0.7587 3 0.8593 Social class at 14 years old 3.6863 3 0.2974 Highest education - elementary 7.1096 3 0.0685 Highest education - secondary middle 8.2972 3 0.0403 Highest education - secondary high 9.5696 3 0.0226 Highest education - tertiary 4.3220 3 0.2287 Precept 11.7041 3 0.0085
Notes: Null hypothesis of Brant test is that parallel regression assumption holds. The Brant test is implemented with R-package “brant” (Schlegel and Steenbergen, 2018). Additionally, since the package is based on R-package “MASS” (Venables and Ripley, 2002), the ordered logit regression is re-estimate using R-package “MASS” (Venables and Ripley, 2002) before Brant test using R-package “brant” (Schlegel and Steenbergen, 2018) is used. Data Source: CGSS 2013 (National Survey Research Center at Renmin University of China, 2013b, 2013c); the Sixth National Population Census of P.R. China (Office of the Sixth National Population Census of the State Council of the People’s Republic of China, Department of Population and Employment Statistics of the National Bureau of Statistics, 2011, pp. 48-49).
When an ordered logit regression does not meet the parallel lines assumption, there are four different ways to turn to: (a) The first is ignoring it and sticking to the ordered logit model. (b) The second is to change to a binary logistic model. This way condenses the ordinal dependent variable which is more than two categories into a two-category one and therefore causes information loss. (c) Anther often suggested choice is to turn to a multinomial logit model which applies to the situation that the

Trust and Development: The Deep Structure of Institutions-Building and Socio-Economic Performance
206
dependent variable is a nominal categorical one. However, it should be noted that a multinomial logit model has the underlying assumption of independence of irrelevant alternatives which “requires the data to possess the characteristic that if one of the possible outcomes of the dependent variable is eliminated, the relative probabilities of the remaining possible outcomes do not change” but an ordinal categorical independent variable does not meet (Hilmer and Hilmer, 2014, pp. 364-365). Therefore, applying a multinomial logit model to where the dependent variable is ordinally categorical will lead to wrong estimators (Hilmer and Hilmer, 2014, p. 365). In addition, applying a multinomial logit model to ordinal categorical dependent variable also causes information loss since the former does not take into account the ordinal nature of the dependent variable, and the parameters to be estimated in the multinomial logit regression will multiply according to the categorical number of the dependent variable. (d) The fourth choice is to turn to a partial proportional odds model proposed by Peterson and Harrell Jr. (1990) or non-proportional odds model, both of which apply to an ordinal categorical dependent variable and allow different estimation at different cut-off points for variables of which the parameter violates the parallel lines assumption. The difference is that the former allows a part of parameters to violate but other parameters to meet the assumption, while the latter treats all parameters as not meeting the assumption. Furthermore, a partial proportional odds model can be either unconstrained or constrained (Peterson and Harrell Jr., 1990). What is going to be used in this chapter is the former one.
Partial proportional odds model
According to the Brant test above, variable being taken advantage, percentage of interprovincial immigration, age group, highest education – secondary middle, highest education – secondary high and precept violate the parallel line assumption. Then, partial proportional odds model is used to re-estimate the previous ordered logit model with their parameters different but other parameters the same across the estimation of different cut-off points of dependent variable general trust. Therefore, the partial proportional odds model is:
logit [P(𝐺𝑒𝑛𝑒𝑟𝑎𝑙𝑇𝑟𝑢𝑠𝑡𝑖𝑝 ≥ 𝑗)| 𝐱]
= 𝛽0,𝑗 + 𝛽1,𝑗𝐵𝑒𝑖𝑛𝑔𝑇𝑎𝑘𝑒𝑛𝐴𝑑𝑣𝑎𝑛𝑡𝑎𝑔𝑒𝑖𝑝 + 𝛽2𝑆𝑜𝑐𝑖𝑎𝑙𝐹𝑎𝑖𝑟𝑛𝑒𝑠𝑠𝑖𝑝
+ 𝛽3𝑀𝑜𝑟𝑎𝑙𝑆𝑎𝑡𝑖𝑠𝑓𝑎𝑐𝑡𝑖𝑜𝑛𝑖𝑝 + 𝛽4𝑂𝑝𝑖𝑛𝑖𝑜𝑛𝑆𝑖𝑚𝑖𝑙𝑎𝑟𝑖𝑡𝑦𝑖𝑝 + 𝛽5𝑁𝑜𝑛𝑙𝑜𝑐𝑎𝑙𝑖𝑝
+ 𝛽6,𝑗𝑝𝑐𝑡𝐼𝑛𝑡𝑒𝑟𝑝𝑟𝑜𝑣𝑖𝑛𝑐𝑖𝑎𝑙𝐼𝑚𝑚𝑖𝑔𝑟𝑎𝑛𝑡𝑠𝑝 + 𝛽7𝐺𝑒𝑛𝑑𝑒𝑟𝐹𝑒𝑚𝑎𝑙𝑒𝑖𝑝
+ 𝛽8,𝑗𝐴𝑔𝑒𝐺𝑟𝑜𝑢𝑝𝑖𝑝 + 𝛽9𝑅𝑢𝑟𝑎𝑙𝑖𝑝 + 𝛽10𝑆𝑜𝑐𝑖𝑎𝑙𝐶𝑙𝑎𝑠𝑠14𝑖𝑝
+ 𝛽11𝐻𝑖𝑔ℎ𝑒𝑠𝑡𝐸𝑑𝑢𝑐𝑎𝑡𝑖𝑜𝑛𝐸𝑙𝑒𝑚𝑒𝑛𝑡𝑎𝑟𝑦𝑖𝑝
+ 𝛽12,𝑗𝐻𝑖𝑔ℎ𝑒𝑠𝑡𝐸𝑑𝑢𝑐𝑎𝑡𝑖𝑜𝑛𝑆𝑒𝑐𝑜𝑛𝑑𝑎𝑟𝑦𝑀𝑖𝑑𝑑𝑙𝑒𝑖𝑝
+ 𝛽13,𝑗𝐻𝑖𝑔ℎ𝑒𝑠𝑡𝐸𝑑𝑢𝑐𝑎𝑡𝑖𝑜𝑛𝑆𝑒𝑐𝑜𝑛𝑑𝑎𝑟𝑦𝐻𝑖𝑔ℎ𝑖𝑝
+ 𝛽14𝐻𝑖𝑔ℎ𝑒𝑠𝑡𝐸𝑑𝑢𝑐𝑎𝑡𝑖𝑜𝑛𝑇𝑒𝑟𝑡𝑖𝑎𝑟𝑦𝑖𝑝 + 𝛽15,𝑗𝑃𝑟𝑒𝑐𝑒𝑝𝑡𝑖𝑝 (𝑗 = 2,3,4,5) 1
Table 3.11 presents the results of using partial proportional model to re-estimate the interested regression model after relaxing the parallel lines assumption for the variables violating the parallel line assumption. Comparing Table 3.8 and Table 3.11, it can be seen that the coefficients and log odds basically almost do not change. The sign, significance and on which significance level is
1 The signs on the righthand side of the model are adapted according to the latent model estimated latter using the R-package VGAM (Yee, 2017), a package which is used for economic analysis in this chapter, in order for my model and the results outputted by VGAM to be consistent in explanation.
Chapter 3: What Affect General Trust? Perspective from Norm-Conforming, Opinion Similarity and Geographic Mobility: Empirical Evidence from China
207
significant of the independent variables meeting the parallel assumption do not change. When j=2, namely when logit[P(GeneralTrust) ≥ 2|x], being taken advantage has a significant negative impact on general trust (𝛽1,2≈ -0.43, significant at 0.001 level), percentage of provincial immigrants has an insignificant negative impact on general trust (𝛽6,2≈ -0.37, insignificant at 0.05 level), age group has an insignificant positive impact on general trust (𝛽8,2≈ 0.01, insignificant at 0.05 level), highest education – secondary middle has an insignificant positive impact on general trust (𝛽12,2≈ 0.15, insignificant at 0.05 level), highest education – secondary high has an insignificant positive impact on general trust (𝛽13,2≈ 0.37, insignificant at 0.05 level), and precept has an insignificant negative impact on general trust (𝛽15,2≈ -0.04, insignificant at 0.05 level) (see, corresponding variables with “:1” after the variable names in Table 3.11).
When j=3, namely when logit[P(GeneralTrust) ≥ 3|x], being taken advantage has a strongly significant negative impact on general trust (𝛽1,3≈ -0.37, significant at 0.001 level), percentage of provincial immigrants has an insignificant negative impact on general trust ( 𝛽6,3 ≈ -0.13, insignificant at 0.05 level), age group has a strongly significant positive impact on general trust (𝛽8,3≈ 0.11, significant at 0.001 level), highest education – secondary middle has an insignificant positive impact on general trust (𝛽12,2 ≈ 0.14, insignificant at 0.05 level), highest education – secondary high has an insignificant positive impact on general trust (𝛽13,2≈ 0.22, insignificant at 0.05 level), and precept has a strongly significant positive impact on general trust (𝛽15,2≈ 0.18, significant at 0.001 level) (see, corresponding variables with “:2” after the variable names in Table 3.11).
When j=4, namely when logit[P(GeneralTrust) ≥ 4|x], being taken advantage has a stronly significant negative impact on general trust (𝛽1,4≈ -0.27, significant at 0.001 level), percentage of provincial immigrants has a strongly significant negative impact on general trust (𝛽6,4 ≈ -0.72, insignificant at 0.01 level), age group has a strongly significant positive impact on general trust (𝛽8,4 ≈ 0.10, significant at 0.001 level), highest education – secondary middle has a significant positive impact on general trust ( 𝛽12,4 ≈ 0.23, significant at 0.05 level), highest education – secondary high has a strongly significant positive impact on general trust (𝛽13,4≈ 0.33, significant at 0.01 level), and precept has a strongly significant positive impact on general trust (𝛽15,4≈ 0.11, insignificant at 0.01 level) (see, corresponding variables with “:3” after the variable names in Table 3.11).
When j=5, namely when logit[P(GeneralTrust) ≥ 5|x], being taken advantage has a strongly significant negative impact on general trust (𝛽1,5≈ -0.17, significant at 0.01 level), percentage of provincial immigrants has an insignificant positive impact on general trust (𝛽6,5≈ 0.46, insignificant at 0.05 level), age group has a strongly significant positive impact on general trust (𝛽8,5≈ 0.11, significant at 0.001 level), highest education – secondary middle has an insignificant positive impact on general trust (𝛽12,5≈ 0.08, insignificant at 0.05 level), highest education – secondary high has an insignificant negative impact on general trust (𝛽13,5≈ -0.04, insignificant at 0.05 level), and precept has an insignificant positive impact on general trust (𝛽15,5≈ 0.04, insignificant at 0.05 level) (see, corresponding variables with “:4” after the variable names in Table 3.11).
Now let us have a look at the goodness of fit of the ordered logit model (abbr. OLM) and the partial proportional odds model (abbr. PPOM). Four indicators of goodness of fit are compared, namely

Trust and Development: The Deep Structure of Institutions-Building and Socio-Economic Performance
208
pseudo R2 (MacFadden), deviation and Akaike information criterion (abbr. AIC)1. The higher the pseudo R2 and the smaller the deviation, AIC and BIC, the better the fit of a regression model. From Table 3.8 and Table 3.11, we can see that the PPOM has smaller deviance and larger pseudo R2, AIC and BIC than the OLM. What is more, since OLMs are PPOMs’ nested models with the former being the sub-model of the latter, the OLM and PPOM are compared with likelihood ration test (see Table 3.12) which indicates that the PPOM is significantly better than the OLM (at the 0.001 significance level).
1 AIC = 2k – 2ln(L), k is number of parameters and L is likelihood function.

Chapter 3: What Affect General Trust? Perspective from Norm-Conforming, Opinion Similarity and Geographic Mobility: Empirical Evidence from China
209
Table 3.11 Results of proportional odds model. Estimate Std. error z value Pr (>|z|) Sign. Exp. coef. Intercept:1 1.6218 0.4528 3.582 0.0003 ***
Intercept:2 -2.2041 0.2716 -8.114 0.0000 ***
Intercept:3 -3.1122 0.2637 -11.803 0.0000 ***
Intercept:4 -6.6149 0.3904 -16.943 0.0000 ***
Being taken advantage:1 -0.4345 0.0754 -5.761 0.0000 *** 0.6476 Being taken advantage:2 -0.3654 0.0331 -11.05 0.0000 *** 0.6939 Being taken advantage:3 -0.2665 0.0301 -8.864 0.0000 *** 0.7661 Being taken advantage:4 -0.1715 0.0612 -2.802 0.0051 ** 0.8424 Social fairness 0.5719 0.0280 20.459 0.0000 *** 1.7716 Moral satisfaction 0.2058 0.0329 6.25 0.0000 *** 1.2286 Opinion similarity 0.2938 0.0348 8.441 0.0000 *** 1.3416 Non-local -0.1997 0.0624 -3.204 0.0014 ** 0.8190 Percentage of interprovince migration:1 -0.3665 0.5830 -0.629 0.5296 0.6932 Percentage of interprovince migration:2 -0.1336 0.2882 -0.463 0.6431 0.8750 Percentage of interprovince migration:3 -0.7199 0.2731 -2.636 0.0084 ** 0.4870 Percentage of interprovince migration:4 0.4602 0.5545 0.83 0.407 1.5843 Gender - female -0.1130 0.0545 -2.073 0.0382 * 0.8931 Age group:1 0.0082 0.0369 0.223 0.8236 1.0083 Age group:2 0.1095 0.0181 6.057 0.0000 *** 1.1157 Age group:3 0.1033 0.0168 6.161 0.0000 *** 1.1088 Age group:4 0.1120 0.0314 3.564 0.0004 *** 1.1185 Rural 0.3104 0.0652 4.763 0.0000 *** 1.3640 Social class at 14 years old -0.0290 0.0159 -1.819 0.0690 . 0.9714 Highest education - elementary 0.0981 0.0968 1.013 0.3109 1.1031

Trust and Development: The Deep Structure of Institutions-Building and Socio-Economic Performance
210
Estimate Std. error z value Pr (>|z|) Sign. Exp. coef. Highest education - secondary middle:1 0.1541 0.1814 0.849 0.3956 1.1666 Highest education - secondary middle:2 0.1385 0.1081 1.281 0.2003 1.1486 Highest education - secondary middle:3 0.2296 0.1038 2.211 0.0270 * 1.2581 Highest education - secondary middle:4 0.0781 0.1634 0.478 0.633 1.0812 Highest education - secondary high:1 0.3685 0.2120 1.739 0.0821 . 1.4456 Highest education - secondary high:2 0.2159 0.1208 1.788 0.0738 . 1.2410 Highest education - secondary high:3 0.3262 0.1164 2.801 0.0051 ** 1.3856 Highest education - secondary high:4 -0.0442 0.2025 -0.218 0.8272 0.9568 Highest education - tertiary 0.4993 0.1234 4.048 0.0001 *** 1.6475 Precept:1 -0.0439 0.0816 -0.538 0.5909 0.9571 Precept:2 0.1836 0.0384 4.782 0.0000 *** 1.2015 Precept:3 0.1131 0.0356 3.18 0.0015 ** 1.1198 Precept:4 0.0423 0.0725 0.583 0.5602 1.0432 Deviance 12587.68 Log likelihood -6293.838
AIC 12661.68
Pseudo R2 (McFadden) 0.0778 Number of observations 5356
Notes: Significance code: 0~0.001 “***”; 0.001~0.01 “**”; 0.01~0.05 “*”; 0.05~0.1 “.”. Ordered logit regressions are implemented with R package VGAM. (Yee, 2017) Name of linear predictor in each model is respectively logit(P[Y≥2]), logit(P[Y≥3]), logit(P[Y≥4]), logit(P[Y≥5]) Data source: CGSS 2013 (National Survey Research Center at Renmin University of China, 2013b, 2013c); the Sixth National Population Census of P.R. China (Office of the Sixth National Population Census of the State Council of the People’s Republic of China, Department of Population and Employment Statistics of the National Bureau of Statistics, 2011, pp. 48-49).

Chapter 3: What Affect General Trust? Perspective from Norm-Conforming, Opinion Similarity and Geographic Mobility: Empirical Evidence from China
211
Table 3.12 Likelihood ratio test: ordered logit model vs. partial proportional odds model. #Df LogLik Df Chisq Pr(>Chisq) Sign. Ordered logit model 21405 -6321.9
Partial proportional odds model 21387 -6293.8 -18 56.069 8.69E-06 *** Notes: Significance code: 0~0.001 “***”; 0.001~0.01 “**”; 0.01~0.05 “*”; 0.05~0.1 “.”. Implemented with R-package VGAM (Yee, 2017). Data source: CGSS 2013 (National Survey Research Center at Renmin University of China, 2013b, 2013c); the Sixth National Population Census of P.R. China (Office of the Sixth National Population Census of the State Council of the People’s Republic of China, Department of Population and Employment Statistics of the National Bureau of Statistics, 2011, pp. 48-49).
3.5 Interim conclusions
This chapter is the empirical part of the whole thesis. The main aim of this chapter is to quantitatively explore the impact of three aspects on general trust: 1) others’ behaviors of conforming to or breaching norms; 2) others’ opinion; 3) geographical mobility. Data from Chinese General Social Survey 2013 and the Sixth National Population Census of P.R. China is used for further empirical analysis. In regression models in this chapter, general trust is the dependent variable; being taken advantage, social fairness, moral satisfaction, opinion similarity, non-local and percentage of interprovincial immigration are the core explanatory variables, with the first three variables for the impact of norm conforming and the last two for that of geographical mobility; and gender, age group, highest education, rural, precept and social class at 14 years old are the control variables.
Since the dependent variable general trust is a 5-point Likert type item which is an ordinal categorical variable type, ordered logit regression is first chosen for econometric analysis. As ordered logit models also suffer from multicollinearity, simple and partial correlation coefficients and variance inflation factors are used respectively to detect the degree of (multi)collinearity between and among those independent variables. Except for some dummies derived from the same variable highest education, which is not a problem, no high degree of multicollinearity among independent variables is found.
In the ordered logit regression, as to the core explanatory variables, it is found that being taken advantage has a strongly significant negative impact on general trust at the 0.001 significance level, social fairness, moral satisfaction and opinion similarity have a strongly significant positive impact on general trust at the 0.001 significance level, non-local has a significant negative impact on general trust at the 0.01 significance level, while percentage of interprovincial immigration has an insignificant negative impact on general trust even at the 0.05 significance level. In addition, proved again, the degree of multicollinearity detected before does not generate serious consequences for the regression. Moreover, likelihood ratio tests show that the model with all independent variables and intercepts significantly holds (at the 0.001 significance level) relative to both the null model with only intercepts and the model with only intercepts and control variables.
However, ordered logit models assume parallel lines across all the cut-points of the dependent variable for all independent variables. In order to detect whether the parallel line assumption is violated by any independent variable, Brant test is used for this purpose, finding that 6 independent

Trust and Development: The Deep Structure of Institutions-Building and Socio-Economic Performance
212
variables (that is, being taken advantage, percentage of interprovincial immigration, age group, highest education – secondary middle, highest education – secondary high, and precept) of which two are core explanatory variables do not meet the assumption, Therefore, a partial proportional odds model is applied to amend the previous ordered logit model by allowing the parameters of those variables violating the assumption to be estimated differently at different cut-points of the dependent variable. With other independent variables which do not violate the assumption not changing in terms of sign, significance and at which significance level is significant in the regression results of the partial proportional odds model, being taken advantage remains to present a strongly significant negative impact on general trust across all cut-points of general trust at least at the 0.01 significance level; percentage of interprovincial immigration has a negative impact on general trust at the first three cut-points of general trust and a positive impact at the fourth cut-point, but only significant (at the 0.01 significance level) at the third cut-point. Moreover, the goodness of fit of the partial proportional odds model improves relative to the ordered logit model in terms of their deviances, pseudo R2s (McFadden) and AICs. Then, a likelihood ratio test is applied to compare the partial proportional odds model and the ordered logit model, finding that the former significantly holds (at the 0.001 significance level).
In summary, what is certain is that others’ conforming to norms and opinion similarity with others have a strongly significant positive impact on micro general trust, while geographical mobility has a significant negative impact on general trust. Moreover, the first two factors, namely norm-conforming and opinion similarity, are actually very essential and direct causes. As to provincial-level geographical mobility, it tends to have an impact of different significances and directions across different cut-points of the categories of general trust, but basically, a negative impact. Therefore, empirical research of general trust in future is suggested to take into account the impact of the three aspects proposed by this chapter. In addition, given the dependent variable is an ordinal multi-categorical variable, whether a corresponding partial proportional odds model is needed and for which independent variables dependent on the specific data characteristics to some degree.
It should be noted that although this chapter from three aspects explores what affect general trust, not every aspect is suitable for policy implication. Actually, only the first aspect, namely violating norms of conduct, is appropriate for policy implication. For example, designing more fair mechanisms, educating people to behave morally more, providing more secure public environment, and strengthening legislation and law-enforcement are among the alternatives to improve general trust.

Chapter 4: Between Trust and
Performance: An Information-driven
Socio-Economic Mechanism on Directed
Weighted Regular Ring with Agent-Based
Modeling
4.1 Introduction
Trust permeates almost every aspect of social and economic life. It typically functions on human individuals and is reflected on their social and economic interactions. From an individual perspective, different personal experiences (including direct interaction experiences and observation experiences) may drive different trust of individuals. At the same time, individual diverse traits may lead to that their trust gets influenced to different degrees by even the same trust-influencing events. Put another way, individuals would not react to the same degree to external information; there exist people who more easily tend to be influenced. Thus, trust is heterogeneous across individuals.
The micro interactions can be and are often modeled by games, such as Prisoners’ Dilemmas or coordination games et cetera. Cooperation in dilemma-like payoff structure is a remarkable research topic in game theory (e.g., Axelrod, 1984). In research of trust by modeling micro interactions as a non-cooperative Prisoners’ Dilemma, diachronic share of cooperation in the whole society (number of cooperation pair over population size) is often adopted as a measure for (social) trust. One possible disadvantage of this method is that given the payoff structure, it cannot distinguish the different degrees of influences on an agent of trust-increasing and trust-decreasing events. It implies trust-decreasing events have an equivalent absolute impact with trust-increasing events (just in the opposite direction). But generally speaking, trust is produced harder but can be destroyed easily. Slovic (1993, p. 677) also states, “It (Trust) typically created rather slowly, but it can be destroyed in an instant by a single mishap or mistake”. However, this characteristic of trust has rarely been considered into formal models.
Trustworthiness, as an inseparable aspect of trust research, can be reflected not only on the chosen strategy, but also on the chosen payoff structure. Given a payoff structure, unilateral defection destroys partners’ trust; when an individual enlarges the payoff difference between a unilateral cooperator and a unilateral defector of the original payoff structure, his / her unilateral defection probably to a larger extent destroys his / her partners’ trust than in the original payoff structure. Imagine a situation that a consumer is going to buy baby formula. The bad situation (s)he has known or (s)he can imagine is that at worst the formula is not worth the price (s)he has paid. However, the consequence turns out to be that the baby of the consumer gets very sick after drinking the formula.

Trust and Development: The Deep Structure of Institutions-Building and Socio-Economic Performance
214
The game is still the same one, namely “buying baby formula”, however the payoff structure is not consistent with the original one. Thus, it can be said that social trustworthiness also mirrors institutional quality: in a society with a relatively perfect institutional system, probably less events destroying public trust happen.
Additionally, people do not definitely participate in a potential interaction. They can make a decision not only on which strategy and payoff structure to use in an interaction, but also on whether or not to be involved in an interaction (Macy and Skvoretz, 1998). Trust, therein, is a crucial factor to enable interactions (Elsner and Schwardt, 2015).
As to interactions, the probability of encountering different persons is not the same, which is an important characteristic of social interactions. The random-pairing mechanism actually implies equal probability of meeting any other in the whole simulated population. Macy and Skvoretz (1998, p. 642) argue that random-pairing and one-shot Prisoners’ Dilemma experiments overlook “the embeddedness of the game in social networks”. High degree of embeddedness, in the paper of Macy and Skvoretz (1998), means high probability to reencounter each other. Thus, players, in their paper, are endowed with two types of relationships, namely neighbors and strangers, and interactions with neighbors are set with a high degree of embeddedness while those with strangers with a low degree of embeddedness (Macy and Skvoretz, 1998). This is a much more realistic pairing mechanism since interactions are locally dense in individual interaction network.
Interaction density exists, both between neighbors and strangers and within neighbors. Hence, even within neighborhood, interactions also always accompany partner selection. Besides that one’s relationships with others are with “to exist or not to exist”, they are also with different link weights (Newman, 2004). Strength of social ties is a significant characteristic of social relationships. When an individual has an opportunity to interact with one of his / her neighbors, (s)he probably would like to interact with those relatively trustworthy.
Interactions are relatively direct experiences while non-interactions (for simplicity, observation1) provide another way to get others’ interaction information. Information both from direct interactions and observations is channels that an individual gets to know about the status of the whole society. An obvious phenomenon about information diffusion in contemporary era is that its channels get more, its coverage gets larger and its speed gets faster. Besides traditional mass media, the technological support of improving information technology and internet access, the popularization of personal computers and mobile terminals, the emergent new media and the diverse on-line social platforms extremely largely improve the probability that an individual acquires information. Information acquired through observations (here means non-interactions) which is about others’ interactions and contains information of others’ trustworthiness in the society shapes the information receivers’ trust.
It has been realized that taking individual heterogeneity into account in economic research coincides with evolutionary thinking. Gowdy et al (2016, p. 327) argue that the average behavior of representative agents is one of the causes that make the modern economics non-evolutionary. Modeling heterogeneity is the very strength of agent-based modeling (ABM) and is also the core
1 For simplicity, “observation” is used here to refer to all non-interactive ways of acquiring others’ interaction information.

Chapter 4: Between Trust and Performance: An Information-driven Socio-Economic Mechanism on Directed Weighted Regular Ring with Agent-Based Modeling
215
difference between ABM and other methodologies, such as systematic dynamics. ABM places “a strong emphasis on heterogeneity and social interactions” (Banisch, Lima and Araújo, 2012, p. 549). So far, ABM, as a methodology (Niazi and Hussain, 2011), gets more and more adopted in research in different fields and topics of social sciences (e.g., Axelrod, 1997; Elsner, Heinrich and Schwardt, 2015, Chapter 9; Epstein, 1999; Gilbert, 2008; Macy and Willer, 2002; Tesfatsion and Judd, 2006, among others). Research on trust with agent-based modeling also emerges (e.g., Kim, 2009; Chen, Chie and Zhang, 2015).
In this chapter, agents’ heterogeneity is reflected on three main aspects below: 1) agents’ trust (namely, their willingness to participate in a potential interaction in this chapter) and their trustworthiness (i.e., their probability to cooperate in an actual interaction in this chapter); 2) agents’ capabilities of acquiring others’ interaction information both from his / her neighbors and non-neighbors, respectively; 3) agents’ trust-updating weights of different acquired interaction information (of mutual neighbors or mutual non-neighbors, and from personal interactions or observations). As to social interactions, an interaction contains (at least) the decision-makings below: 1) whether to initiate (or participate in) a potential interaction; 2) which partner to choose if the potential interaction is within neighborhood; 3) which (pure) strategy to use in the actual interaction; 4) which payoff matrix to apply.
The aim of this chapter is to explore the evolution of interaction and cooperation supported by individual changing trust and trustworthiness on a directed weighted regular ring network under different conditions of environment from the angle of micro scope via designing an agent-based model. Additionally, what is presented in the experimental design in this chapter also provides useful insights in research of the decline of trust.
Section 4.2 enumerates some interested parameters and their concrete meaning in my agent-based model. Section 4.3 describes the experimental design in detail. Section 4.4 presents results. Section 4.5 concludes.
4.2 Interested parameters
Before presenting experimental design, it is necessary to figure out some parameters and their meaning used to explore the socio-economic process underlying trust in our agent-based simulation. In a word, they are all about with whom to interact and how, essentially.
Embeddedness in social network Inspired by Macy and Skvoretz (1998), embeddedness in one’s social network here refers to the probability that a potential interaction will be with an immediate neighbor. What is more meaningful, social embeddedness can also be used to indicate geographical mobility.
Mutated payoff matrix Mutated payoff matrix is a mutated version of the original and popular payoff matrix. Interactions are modeled as symmetric non-cooperative prisoners’ dilemmas in this chapter.1 The original and the mutated payoff matrix have the same payoff values for pure strategies against
1 It is simply not be distinguished so much between utility payoff and monetary payoff in this chapter; they can be distinguished in different actual and concrete situations.

Trust and Development: The Deep Structure of Institutions-Building and Socio-Economic Performance
216
themselves, but have different payoff values for pure strategies against the different pure strategies. The mutated payoff matrix is endowed with a larger interest conflict and is used as an ingredient of indicating relative degree of exploitation of the mutated payoff matrix over the original payoff matrix.
Mutation probability of payoff structure It is the probability that the original payoff matrix is changed to the mutated payoff matrix by the initiator of a potential interaction on condition that the initiator has decided to play “Defection” in the forthcoming actual interaction. This is an indicator for institutional quality in this chapter.
Probability of interaction information diffusing in neighbors It is the probability that the interaction information, including the strategies and payoffs of the interaction parties, gets spread in agents who are neighbors of either of the interaction parties.
Probability of interaction information diffusing in non-neighbors It is the probability that the interaction information, including the strategies and payoffs of the interaction parties, gets spread in agents who are neighbors of neither of the interaction parties.
4.3 Experimental design
4.3.1 Artificial society and network structure
Consider an artificial society with n agents. The set of all agents is denoted by a finite set N = {ai | 1≤ i ≤ n, i ∈ N+} with the subscripts representing the unique identity of a given agent. All agents are arranged on a directed weighted regular ring sequentially with an equal number of neighbors. ai’s neighbors are those who are nearest to him / her on the ring. Let Neigi be ai’s neighborhood, then Neigi
C = N - Neigi - {a} represents ai’s non-neighbor set. All agents can memorize the identity of their neighbors but cannot memorize that of non-neighbors.1
4.3.2 Initialization of agents’ attributes
Some important attributes of agents and their initialization are stressed here, although there exist some other attributes. Their specific usage will be illustrated in 4.3.3 in detail.
(i) Trust and trustworthiness
Both trust and trustworthiness are a float number in range [0, 1].2 If an agent’s trust is equal to or higher than 1/2, (s)he is treated as a high trust agent. An agent with probability pHTr (namely proportion of high trust agents in the whole population) is initialized as a high trust agent. Agents’ trust in ranges [0, 1/2) and [1/2, 1] follows uniform distribution in the corresponding ranges, respectively. That is,
1 The set of agents, every agent’s set of neighbors and every agent’s set of non-neighbors are shuffled at the beginning of each simulation run after being created. 2 A direct relation between an agent’s trust and his / her own trustworthiness is not presupposed. This is also in accordance with an experimental research of Kiyonari et al (2006) which suggests that trust does not beget trustworthiness.

Chapter 4: Between Trust and Performance: An Information-driven Socio-Economic Mechanism on Directed Weighted Regular Ring with Agent-Based Modeling
217
𝑇𝑟𝑖,𝑖𝑛𝑖𝑡 ~ {U (
1
2, 1) if 𝑟𝑖
𝑡𝑟 ∈ [0, 𝑝𝐻𝑇𝑟)
U (0,1
2) if 𝑟𝑖
𝑡𝑟 ∈ [𝑝𝐻𝑇𝑟, 1] (1)
𝑇𝑟𝑖,𝑖𝑛𝑖𝑡 is agent ai’s initial trust. 𝑟𝑖𝑡𝑟 is a pseudo random number following uniform distribution in
range [0, 1]. 𝑝𝐻𝑇𝑟 is proportion of high trust agents in the whole population. Similar with trust, an agent’s trustworthiness is randomly chosen from uniform distribution [0, 1]. Namely,
𝑇𝑟𝑤𝑖,𝑖𝑛𝑖𝑡 ~ U(0, 1) (2)
𝑇𝑟𝑤𝑖,𝑖𝑛𝑖𝑡 is ai’s initial trustworthiness. Trust represents willingness to interact and trustworthiness refers to probability to cooperate in an actual interaction.
(ii) Probability of information acquisition
Information acquisition here means that an agent acquires others’ interaction information by means of non-interaction (e.g., by observing, watching TV news, or surfing the Internet, etc1). An agent’s probability of information acquisition indicates his / her capability to obtain and his / her attention paid to others’ interactions.
Each agent has two probabilities of information acquisition: a) probability of acquiring information from his / her neighbors, 𝑝𝑖
𝐼𝐴𝑁; b) probability of acquiring information from his / her non-neighbors, 𝑝𝑖
𝐼𝐴𝑁𝑛. They are both randomly chosen from uniform distribution in range [0, 1] and do not change across time. That is,
𝑝𝑖𝐼𝐴𝑁 ~ U(0, 1)
𝑝𝑖𝐼𝐴𝑁𝑛 ~ U(0, 1)
Now, let ai be an observing agent temporarily. When a piece of interaction information gets diffused within the neighborhoods of two interaction parties, as long as one of the two interaction parties is the observing agent’s neighbor, the observing agent ai would following 𝑝𝑖
𝐼𝐴𝑁 observe; when the piece of interaction information gets diffused within non-neighborhoods of the interaction parties, if neither of the two interaction parties is the observing agent’s neighbor, the observing agent ai would following 𝑝𝑖
𝐼𝐴𝑁𝑛 observe.
(iii) Weights of four kinds of information sources
It is assumed that there are four kinds of information sources on which an agent can depend to adjust his / her trust: a) interactions with neighbors, b) interactions with non-neighbors, c) observing interactions between two mutual neighbors, and d) observing interactions between two mutual non-neighbors.
Let 𝑤𝑖𝑁𝑒𝑖𝑔𝑠 denote ai’s weight of information about mutual neighbors, let 𝑤𝑖
𝑁𝑛𝑒𝑖𝑔𝑠 be ai’s weight of information about mutual non-neighbors, let 𝑤𝑖
𝐼𝑛𝑡𝑒 represent ai’s weight of information acquired through interactions and let 𝑤𝑖
𝑂𝑏𝑠 indicate ai’s weight of information acquired via observations. All
1 Hereafter, for convenience, I only use “observing” or “observation” to generally refer to ways of acquiring others’ interaction information by means of non-interaction.

Trust and Development: The Deep Structure of Institutions-Building and Socio-Economic Performance
218
of an agent’s four weights are randomly chosen from uniform distribution on range [0, 1] and do not change across time (see Table 4.1). The weights of the four kinds of information sources in trust-updating are four linear combinations of either 𝑤𝑖
𝑁𝑒𝑖𝑔𝑠 or 𝑤𝑖𝑁𝑛𝑒𝑖𝑔𝑠and either 𝑤𝑖
𝐼𝑛𝑡𝑒 or 𝑤𝑖𝑂𝑏𝑠 (see
Table 4.1).1 For example, the weight of interacting with neighbors in ai’s trust-updating is a linear combination of 𝑤𝑖
𝑁𝑒𝑖𝑔𝑠 and 𝑤𝑖𝐼𝑛𝑡𝑒 ; the weight of observing interactions between two mutual
neighbors in ai’s trust-updating is a linear combination of 𝑤𝑖𝑁𝑒𝑖𝑔𝑠 and 𝑤𝑖
𝑂𝑏𝑠. Specifically, we set the weights of the four kinds of information sources as follows (see Table 4.1):
Table 4.1 Weights of four kinds of information sources in ai’s trust-updating.
𝑤𝑖𝐼𝑛𝑡𝑒~ U(0, 1) 𝑤𝑖
𝑂𝑏𝑠~ U(0, 1)
𝑤𝑖𝑁𝑒𝑖𝑔𝑠
~ U(0, 1) 0.5 ∗ (𝑤𝑖𝐼𝑛𝑡𝑒 + 𝑤𝑖
𝑁𝑒𝑖𝑔𝑠) 0.5 ∗ (𝑤𝑖
𝑂𝑏𝑠 + 𝑤𝑖𝑁𝑒𝑖𝑔𝑠
)
𝑤𝑖𝑁𝑛𝑒𝑖𝑔𝑠
~ U(0, 1) 0.5 ∗ (𝑤𝑖𝐼𝑛𝑡𝑒 + 𝑤𝑖
𝑁𝑛𝑒𝑖𝑔𝑠) 0.5 ∗ (𝑤𝑖
𝑂𝑏𝑠 + 𝑤𝑖𝑁𝑛𝑒𝑖𝑔𝑠
)
(iv) Unilateral link weights
Unilateral link weights are what an agent, say ai, depends on to actively choose a neighbor as a potential interaction partner when his / her scope of choosing is within neighborhood, and unilateral link weights do not change within single time periods. A neighbor to whom ai assigns a larger unilateral link weight is with a higher probability to be chosen as a potential interaction partner. All weights that an agent assigns to his / her neighbors sum up to 1. In the first time period, each neighbor of ai is assigned with equal weight by ai and therefore with equal probability to be chosen as a potential interaction partner if ai’s choosing scope is within neighbors.
4.3.3 Micro-level process
Each time period contains 20 sub-time periods. The micro-level process in each time period contains three main tasks: a) in each sub-time period, all agents one by one have an opportunity to actively make an interaction request (described in 4.3.3 (i)) and this rotation repeats for 20 times; b) all agents one by one update trustworthiness for the next time period (described in 4.3.3 (ii)); c) all agents one by one update unilateral link weights for the next time period (described in 4.3.3 (iii)) (see also Figure 4.1).
1 Here an implicit assumption is that 𝑤𝑖
𝑁𝑒𝑖𝑔𝑠, 𝑤𝑖𝑁𝑛𝑒𝑖𝑔𝑠, 𝑤𝑖
𝐼𝑛𝑡𝑒 and 𝑤𝑖𝑂𝑏𝑠 are mutually independent.

Chapter 4: Between Trust and Performance: An Information-driven Socio-Economic Mechanism on Directed Weighted Regular Ring with Agent-Based Modeling
219
Figure 4.1 An overall framework for micro-level process.
(i) Interaction, information diffusion and trust-updating
This part includes 7 steps (see Figure 4.2). As mentioned before, this loop is repeated for 20 times before trustworthiness updating.
(i) Interaction, information diffusion
and trust-updating (Repeated for 20
times)
(ii) To update trustworthenss
(iii)To update unilateral link
weights

Trust and Development: The Deep Structure of Institutions-Building and Socio-Economic Performance
220
Figure 4.2 A flow chart for “Interaction, information diffusion and trust-updating” in each sub-time period.
Before we go further, I would like to talk about potential interactions. A potential interaction is acquired whenever an agent has an opportunity to interact, however has not yet actually interacted. Thus, the number of potential interactions of an agent i in time period t can be calculated in two different ways: a) It equals the number of potential interactions with neighbors 𝑁𝑢𝑚𝑖,𝑡
𝑃𝐼,𝑁 plus the number of potential interactions with non-neighbors 𝑁𝑢𝑚𝑖,𝑡
𝑃𝐼,𝑁𝑛, or b) it equals ai’s active interaction requests 𝑁𝑢𝑚𝑖,𝑡
𝐴𝑃𝐼 plus interaction requests from others (passive interactions) 𝑁𝑢𝑚𝑖,𝑡𝑃𝑃𝐼.
a) Interaction decision for an active potential interaction
For each sub-time period in a time period, every agent in turn in a shuffled order has an opportunity to actively make an interaction request to others. Whether an agent will grasp this opportunity to enter the next step of choosing a potential interaction partner is determined by his / her willingness to interact, namely his / her own trust. That is, ai with a probability equal to his / her trust continues to choose a potential interaction partner.
b) To choose a potential interaction partner
a) Interaction decision for an active potential
interaction
b) To choose a potential
interaction partner
c) Strategy decision
d) Payoff matrix mutation
e) To play the game
f) Diffusion of interaction information
g) To update trust

Chapter 4: Between Trust and Performance: An Information-driven Socio-Economic Mechanism on Directed Weighted Regular Ring with Agent-Based Modeling
221
From neighbors or non-neighbors?
Following Macy and Skvoretz (1998), in this chapter, degree of embeddedness in social network is also assumed. Degree of embededness in social network, as a parameter, is represented by a float number in range [0, 1]. When ai is going to actively propose an interaction request, his / her potential interaction partner will be chosen either from his neighborhood with a probability equal to the degree of embeddedness in social network or from his / her non-neighborhood with a probability equal to 1 minus the degree of embeddedness in social network.1
Which partner to choose to interact?
If ai’s potential interaction partner is definitely going to be chosen from neighborhood, which neighbor on earth will be chosen hinges on ai’s unilateral link weights that ai assigns to his / her neighbors in the current time period. On contrast, if ai’s potential interaction partner is definitely from outside of his / her neighborhood, a non-neighbor will be randomly chosen among ai’s non-neighbors with equal likelihood.
Will the chosen partner agree to interact?
Whether ai’s chosen potential interaction partner aj (either a neighbor or a non-neighbor) would like to participate in the interaction then depends on the chosen partner aj’s willingness to interact which is determined by aj’s own trust. Only if aj agrees to interact, the interaction will actually happen, and ai and aj enter the next step of strategy decision; otherwise, the actual interaction won’t happen, and ai and aj cannot enter the next step.
c) Strategy decision
Each agent uses a mixed strategy for actual interactions. Whether an agent will cooperate or not in the forthcoming actual interaction is determined by the agent’ trustworthiness. An agent cooperates with a probability equal to his / her trustworthiness and defect with a probability equal to 1 minus his / her trustworthiness.
d) Payoff matrix mutation
Marginal rate of exploitation and relative exploitation degree
The actual interaction process is modeled by non-cooperative and symmetric prisoners’ dilemmas.2 Denote matrix Ag as a general form of payoff matrixes of prisoners’ dilemma and set
𝑨𝑔 = [𝑎11 𝑎12
𝑎21 𝑎22] (3)
a11 is an agent’s payoff when both (s)he and his / her partner apply strategy “Cooperation”; a12 is an agent’s payoff when (s)he alone uses strategy “Cooperation” while his / her partner uses strategy “Defect”; a21 is an agent’s payoff when (s)he plays strategy “Defect” and his / her partner plays
1 “Degree of embeddedness in social network” here only represents the probability that an agent encounters a neighbor in a potential interaction; it does not represent an agent’s subjective willingness to interact with a neighbor. 2 Even though a classical game “Prisoners’ dilemma” in game theory is adopted, strategy updating (trustworthiness updating in this chapter) is not directly associated with comparison of utility function in this chapter.

Trust and Development: The Deep Structure of Institutions-Building and Socio-Economic Performance
222
strategy “Cooperation”; a22 is an agent’s payoff when both players apply strategy “Defect”. Then,
the elements of payoff matrix Ag should satisfy 𝑎21 > 𝑎11 > 𝑎22 > 𝑎12 and 𝑎11 > 𝑎21+ 𝑎12
2 for
a game to be a prisoners’ dilemma.
What is more important for trust-updating later in this chapter, we define marginal rate of exploitation (MRE) of a given payoff matrix Ag as
𝑀𝑅𝐸Ag,𝐶/𝐷 =𝑎11 −𝑎12
𝑎21 −𝑎11 (4)
𝑀𝑅𝐸𝐴𝑔,𝐶/𝐷 represents marginal rate of exploitation of pure strategy “Defection” to pure strategy “Cooperation” under payoff matrix Ag. It measures how much a defector can gain from deviating one unit of payoff from pure strategy “Cooperation” on the loss of his / her game partner who is a cooperator. MRE is positive.
Consider two symmetric prisoners’ dilemmas with A and Amut having different numerical payoffs1:
𝑨 = [𝑎11
𝐴 𝑎12𝐴
𝑎21𝐴 𝑎22
𝐴 ] and 𝑨𝑚𝑢𝑡 = [𝑎11
𝐴𝑚𝑢𝑡 𝑎12𝐴𝑚𝑢𝑡
𝑎21𝐴𝑚𝑢𝑡 𝑎22
𝐴𝑚𝑢𝑡] (5)
Therein, Amut is a mutated version of A. Thus, the marginal rate of exploitation of payoff matrix A is:
𝑀𝑅𝐸𝐴,𝐶/𝐷 =𝑎11
𝐴 −𝑎12𝐴
𝑎21𝐴 −𝑎11
𝐴 (6)
Besides the general conditions a prisoners’ dilemma should satisfy, A and Amut in this chapter also satisfy 𝑎11
𝐴𝑚𝑢𝑡 = 𝑎11𝐴 , 𝑎22
𝐴𝑚𝑢𝑡 = 𝑎22𝐴 , 𝑎21
𝐴𝑚𝑢𝑡 > 𝑎21𝐴 and 𝑎12
𝐴𝑚𝑢𝑡 < 𝑎12𝐴 to ensure that the mutated
payoff matrix Amut enlarges the exploitation degree of unilateral defection compared to the original payoff matrix A, and to have comparability as well.
At the same time, we denote relative exploitation degree (RED) of payoff matrix Amut over A as
𝑅𝐸𝐷𝐴𝑚𝑢𝑡/𝐴 = 𝑎21
𝐴𝑚𝑢𝑡−𝑎12𝐴𝑚𝑢𝑡
𝑎21𝐴 −𝑎12
𝐴 (7)
Relative exploitation degree is constructed to measure to which degree a mutated payoff matrix Amut enlarges the interest conflict of the original payoff matrix A.
Numerically, A = [3 14 2
] in this chapter and Amut is a parameter with different candidate values.
For example, when Amut = [3 05 2
], we get
1 It is not specified in this chapter whether the payoffs are utility or monetary payoffs, nor it involves the comparability of cardinal utility or ordinal utility; they become more concrete and meaningful in specific situations more or less. The meaning behind is obvious in real world. However, thanks to Dr. Rebecca Schmitt for pointing this out.

Chapter 4: Between Trust and Performance: An Information-driven Socio-Economic Mechanism on Directed Weighted Regular Ring with Agent-Based Modeling
223
𝑀𝑅𝐸𝐴,𝐶/𝐷 =𝑎11
𝐴 − 𝑎12𝐴
𝑎21𝐴 − 𝑎11
𝐴 =3 − 1
4 − 3= 2
𝑅𝐸𝐷𝐴𝑚𝑢𝑡/𝐴 = 𝑎21
𝐴𝑚𝑢𝑡 − 𝑎12𝐴𝑚𝑢𝑡
𝑎21𝐴 − 𝑎12
𝐴 = 5 − 0
4 − 1=
5
3
Payoff matrix decision
Payoff matrix decision comes after pure strategy decision. The interaction initiator (the active interactive party) of a potential interaction has an exclusive right to unilaterally change payoff matrix from A to Amut with probability pAmut on condition that the interaction initiator has already decided to apply “Defection” for this forthcoming actual interaction.1 As long as no payoff matrix mutation happens, the interaction will carry on with the original payoff matrix A. That is,
𝑃𝑀𝑖,𝑡,𝜏 = {𝐴 if 𝑟𝑃𝑀 ∈ [0, 𝑝𝐴𝑚𝑢𝑡]
𝐴𝑚𝑢𝑡 if 𝑟𝑃𝑀 ∈ (𝑝𝐴𝑚𝑢𝑡, 1) (8)
𝑃𝑀𝑖,𝑡,𝜏 represents ai’s payoff matrix decision for his / her active potential interaction in sub-time period 𝜏 in time period t. 𝑟𝑃𝑀 is a pseudo random number. Due to the specific conditions that A and Amut should satisfy in this chapter, it is assumed that when an active actor chooses Amut: a) the passive actor cannot discover (s)he is under Amut unless the passive actor plays “Cooperation”; b) observers cannot either detect their observed interaction is under Amut unless the observed interaction is unilateral defect.
e) To play the game
After a specific action and payoff matrix for the forthcoming interaction have been decided, the two interaction parties begin to play the game. What each of both interacting parties should record through each actual interaction in the current time period is two aspects: a) counting his / her own actual interactions (including both active ones and passive ones) and “Cooperation” (no matter his / her partner cooperates or not) no matter whether his / her partner is a neighbor or a non-neighbor; b) counting actual interactions happening with each of his / her neighbors and “Cooperation” that each of his neighbors applies to him / her according to his / her neighbors’ identity. All these are reset to zero at the beginning of every time period (not sub-time period). Therein, a) is for trustworthiness updating and b) is for unilateral link weights updating.
f) Diffusion of interaction information (Observed by others)
It is possible that others who are not interacting parties get informed of the situation and result of an interaction. Except the two interaction parties, say ai and aj, other agents in the artificial society are separated into two sets: one is the union-neighbor set UNeigij in which the agents are neighbors of either of the interaction parties; the other is set DNeigij in which agents are neighbors of neither of the interaction parties. Thus, when the interaction parties ai and aj are mutual neighbors,
𝑈𝑁𝑒𝑖𝑔𝑖𝑗 = 𝑁𝑒𝑖𝑔𝑖 ∪ 𝑁𝑒𝑖𝑔𝑗 − {𝑎𝑖 , 𝑎𝑗} (9)
1 Although mutation probability is very small in nature (Seltzer and Smirnov, 2015), it is not set that small in this chapter.

Trust and Development: The Deep Structure of Institutions-Building and Socio-Economic Performance
224
𝐷𝑁𝑒𝑖𝑔𝑖𝑗 = 𝑁 − (𝑁𝑒𝑖𝑔𝑖 ∪ 𝑁𝑒𝑖𝑔𝑗) (10)
When the interaction parties ai and aj are mutual non-neighbors,
𝑈𝑁𝑒𝑖𝑔𝑖𝑗 = 𝑁𝑒𝑖𝑔𝑖 ∪ 𝑁𝑒𝑖𝑔𝑗 (11)
𝐷𝑁𝑒𝑖𝑔𝑖𝑗 = 𝑁 − (𝑁𝑒𝑖𝑔𝑖 ∪ 𝑁𝑒𝑖𝑔𝑗) − {𝑎𝑖 , 𝑎𝑗} (12)
The probability that the interaction information of ai and aj diffuses in these two interacting parties’ neighborhoods UNeigi,j is pIDN, and the probability diffusing in their non-neighborhoods DNeigi,j is pIDNn. Both pIDN
and pIDNn are random numbers following uniform distribution in range [0,1] and act as parameters.
Then, the interaction information of ai and aj starts “diffusing” separately in UNeigi,j and DNeigi,j. Whether an outside agent ak (an agent who is not one of the interacting parties) will get informed of the just happening interaction depends on whether (s)he belongs to UNeigi,j or DNeigi,j, and his / her own probability of information acquisition from neighbors 𝑝𝑘
𝐼𝐴𝑁 and from non-neighbors 𝑝𝑘𝐼𝐴𝑁𝑛.
What an observing agent will get informed about others’ interaction is: a) the strategy combination, that is whether the observed interaction is “mutual cooperation”, “unilateral defection” or “mutual defection”; b) the relationship between the observed interacting parties, namely “mutual neighbors” or “mutual non-neighbors” and c) the specific payoff matrix, that is whether the payoff matrix is a mutated one. Note that Amut can only manifest itself in the situation of unilateral defection because Amut has the same values with A in situations of “mutual cooperation” and “mutual defection” according to the settings in this chapter.
g) To update trust
Trust-updating directions (qualitative trust-updating)
Changes of trust have three directions: increase, decrease and remain unchanged. In order to clarify how trust changes and when, it is necessary for us to at first distinguish trust-increasing events, trust-destroying events and trust-invariant events. This is analyzed from two angles: interacting agents and observing agents.
·Interacting agents
For the two interacting agents, in the situation of mutual cooperation, both agents’ trust increase; in the situation of unilateral defection, the cooperative agent’s trust decreases while the defective agent’s trust remains unchanged; in the situation of mutual defection, both agents’ trust keeps invariant (see Table 4.2).
·Observing agents
For an observing agent, (s)he first images which (pure) strategy (s)he would have applied if (s)he had been in the interaction. An observing agent’s imagined pure strategy with a probability equal to his / her trustworthiness is “Cooperation”. If his / her imagined (pure) strategy is “Cooperation”, his / her trust will increase when (s)he observes mutual cooperation, and his/ her trust will decrease when (s)he observes unilateral defection or mutual defection. If his / her imagined (pure) strategy is “Defection”, his / her trust will not change. (See Table 4.2)

Chapter 4: Between Trust and Performance: An Information-driven Socio-Economic Mechanism on Directed Weighted Regular Ring with Agent-Based Modeling
225
Table 4.2 Trust-updating directions.
Information acquiring method
Strategy Trust-updating direction
Interaction self partner self partner
C C ↑ ↑
C D ↓ ----
D C ---- ↓
D D ---- ----
Observation Observed strategy combination
Observer’s imaged strategy
C D
Mutual cooperation ↑ ----
Unilateral defection ↓ ----
Mutual defection ↓ ----

Trust and Development: The Deep Structure of Institutions-Building and Socio-Economic Performance
226
Quantitative trust-updating
Quantitative trust-updating is based on a certain amount ∆𝑇𝑟𝐵𝑎𝑠𝑒 which equals 0.005. How much exactly an agent will update his / her trust hinges on: a) marginal rate of exploitation of payoff matrix A (namely, 𝑀𝑅𝐸A,𝐶/𝐷 ), b) relative exploitation degree of Amut compared to A (namely, 𝑅𝐸𝐷𝐴𝑚𝑢𝑡/𝐴), and c) ai’s own weights for the four kinds of information sources (the four possible combinations of either 𝑤𝑖
𝑁𝑒𝑖𝑔𝑠or 𝑤𝑖𝑁𝑛𝑒𝑖𝑔𝑠 and either 𝑤𝑖
𝐼𝑛𝑡𝑒or 𝑤𝑖𝑂𝑏𝑠 shown in Table 4.1).
·Interacting agents
Assume ai interacts with his / her neighbor aj. If both ai and aj apply “Cooperation”,
𝑇𝑟𝑖 ← min (𝑇𝑟𝑖 + 0.5 ∗ (𝑤𝑖𝑁𝑒𝑖𝑔𝑠
+ 𝑤𝑖𝐼𝑛𝑡𝑒) ∗ ∆𝑇𝑟𝐵𝑎𝑠𝑒 , 1) (13)
If ai unilaterally uses “Cooperation” under payoff matrix A,
𝑇𝑟𝑖 ← max (𝑇𝑟𝑖 − 0.5 ∗ 𝑀𝑅𝐸𝐴,𝐶/𝐷 ∗ (𝑤𝑖𝑁𝑒𝑖𝑔𝑠
+ 𝑤𝑖𝐼𝑛𝑡𝑒) ∗ ∆𝑇𝑟𝐵𝑎𝑠𝑒 , 0) (14)
If ai unilaterally uses “Cooperation” under payoff matrix Amut,
𝑇𝑟𝑖 ← max (𝑇𝑟𝑖 − 0.5 ∗ 𝑅𝐸𝐷𝐴𝑚𝑢𝑡/𝐴 ∗ 𝑀𝑅𝐸𝐴,𝐶/𝐷 ∗ (𝑤𝑖𝑁𝑒𝑖𝑔𝑠
+ 𝑤𝑖𝐼𝑛𝑡𝑒) ∗ ∆𝑇𝑟𝐵𝑎𝑠𝑒 , 0) (15)
When ai’s interaction partner is a non-neighbor aj, 𝑤𝑖𝑁𝑛𝑒𝑖𝑔𝑠 should replace 𝑤𝑖
𝑁𝑒𝑖𝑔𝑠. At the same time, aj should also update his / her trust according to the same rule.
·Observing agents
Assume ak observes the interaction between two mutual neighbors ai and aj. If both ai and aj apply “Cooperation” and ak’s imaged pure strategy is also “Cooperation”,
𝑇𝑟𝑘 ← min (𝑇𝑟𝑘 + 0.5 ∗ (𝑤𝑘𝑁𝑒𝑖𝑔𝑠
+ 𝑤𝑘𝑂𝑏𝑠) ∗ ∆𝑇𝑟𝐵𝑎𝑠𝑒 , 1) (16)
If not both ai and aj apply “Cooperation”, when ak’s imaged pure strategy is “Cooperation” and the observed payoff matrix is not Amut,
𝑇𝑟𝑘 ← max (𝑇𝑟𝑘 − 0.5 ∗ 𝑀𝑅𝐸𝐴,𝐶/𝐷 ∗ (𝑤𝑘𝑁𝑒𝑖𝑔𝑠
+ 𝑤𝑘𝑂𝑏𝑠) ∗ ∆𝑇𝑟𝐵𝑎𝑠𝑒 , 0) (17)
If not both ai and aj apply “Cooperation”, when ak’s imaged pure strategy is “Cooperation” but the observed payoff matrix is Amut,
𝑇𝑟𝑘 ← max (𝑇𝑟𝑘 − 0.5 ∗ 𝑅𝐸𝐷𝐴𝑚𝑢𝑡/𝐴 ∗ 𝑀𝑅𝐸𝐴,𝐶/𝐷 ∗ (𝑤𝑘𝑁𝑒𝑖𝑔𝑠
+ 𝑤𝑘𝑂𝑏𝑠) ∗ ∆𝑇𝑟𝐵𝑎𝑠𝑒 , 0) (18)
When ak observes an interaction happening between two mutual non-neighbors, 𝑤𝑘𝑁𝑛𝑒𝑖𝑔𝑠 should
replace 𝑤𝑘𝑁𝑒𝑖𝑔𝑠.
(ii) To update trustworthiness
Agents’ updating of their own trustworthiness is considered as a process of strategy learning. We constrain the objects of an agent’s strategy-learning within his / her neighbors. Every agent updates his / her trustworthiness near the end of a time period. What needs to be done for an agent ai is searching out his / her neighbor, say 𝑎𝑗0
, with the highest number of passive potential interactions

Chapter 4: Between Trust and Performance: An Information-driven Socio-Economic Mechanism on Directed Weighted Regular Ring with Agent-Based Modeling
227
from neighbors 𝑁𝑢𝑚𝑗0,𝑡𝑃𝑃𝐼,𝑁 in the current time period. If 𝑁𝑢𝑚𝑗0,𝑡
𝑃𝑃𝐼,𝑁 is larger than ai’s own number
of passive potential interactions 𝑁𝑢𝑚𝑖,𝑡𝑃𝑃𝐼,𝑁 and if j0’s number of actually interaction is not 0, ai
would switch his / her trustworthiness to 𝑎𝑗0’s cooperation rate of 𝑅𝑗0,𝑡
𝐶 = 𝑁𝑢𝑚𝑗0,𝑡
𝐶
𝑁𝑢𝑚𝑗0,𝑡𝐴𝐼 (𝑁𝑢𝑚𝑗0,𝑡
𝐴𝐼 ≠
0) in the current time period t and take it as his / her (mixed) strategy for the next time period; otherwise, ai would maintain his / her current trustworthiness over to the next time period. The reason why the base of strategy learning is set at agents’ cooperation rate of a current time period t rather than agents’ probability of cooperation in an interaction is that it is assumed that an agent’s probability of cooperation in an interaction is not observable for other agents while his / her cooperation rate is, on contrast.
Formally, let Neigi represent the set of ai’s neighbor set in which his / her strategy-learning candidates are in time period t and aj be an arbitrary element in Neigi. The agent aj0 with the highest number of passive potential interactions in the current time step t in Neigi satisfis
𝑗0 = argmax𝑗{ 𝑗 | 𝑁𝑢𝑚𝑗,𝑡𝑃𝑃𝐼,𝑁, 𝑎𝑗 ∈ 𝑁𝑒𝑖𝑔𝑖} (19)
Thus,
𝑇𝑟𝑤𝑖,𝑡+1 = {𝑅𝑗0,𝑡
𝐶 if 𝑁𝑢𝑚𝑗0,𝑡𝑃𝑃𝐼,𝑁 > 𝑁𝑢𝑚𝑖,𝑡
𝑃𝑃𝐼,𝑁
𝑇𝑟𝑤𝑖,𝑡 otherwise (20)
Therein
𝑅𝑗0,𝑡𝐶 =
𝑁𝑢𝑚𝑗0,𝑡𝐶
𝑁𝑢𝑚𝑗0,𝑡𝐴𝐼 (𝑁𝑢𝑚𝑗0,𝑡
𝐴𝐼 ≠ 0) (21)
𝑅𝑗0,𝑡𝐶 represents agent j0’s cooperation rate in time period t, 𝑁𝑢𝑚𝑗0,𝑡
𝐶 represents agent j0’s total times of cooperation in time period t and 𝑁𝑢𝑚𝑗0,𝑡
𝐴𝐼 represents agent j0’s total times of actual (not potential) interactions in time period t.
(iii) To update unilateral link weights
At the end of each time step t, each agent updates his / her unilateral link weights for the next time step t+1. At first, ai evaluates each of his / her neighbors’ cooperation rate only to him / her according to
𝑅𝑖𝑗,𝑡
𝐶𝑗 = {
𝑁𝑢𝑚𝑖𝑗,𝑡
𝐶𝑗
𝑁𝑢𝑚𝑖𝑗,𝑡𝐴𝐼 (𝑁𝑢𝑚𝑖𝑗,𝑡
𝐴𝐼 ≠ 0)
𝛼 (𝑁𝑢𝑚𝑖𝑗,𝑡𝐴𝐼 = 0)
(𝑎𝑗 ∈ 𝑁𝑒𝑖𝑔𝑠𝑖) (22)
𝑅𝑖𝑗,𝑡
𝐶𝑗 represents ai’s evaluation on his / her arbitrary neighbor aj’s cooperation rate to him / her in
the end of time period t. 𝑁𝑢𝑚𝑖𝑗,𝑡
𝐶𝑗 is the times that ai’s neighbor aj applies “Cooperation” to ai in
time period t. 𝑁𝑢𝑚𝑖𝑗,𝑡𝐴𝐼 is the times of ai’s actual interactions with his / her neighbor aj in time period

Trust and Development: The Deep Structure of Institutions-Building and Socio-Economic Performance
228
t. 𝑁𝑢𝑚𝑖𝑁𝑒𝑖𝑔𝑠 is ai’s number of neighbors. α is the default cooperation rate estimation and equals
0.2 which is used as a proxy for 𝑅𝑖𝑗,𝑡
𝐶𝑗 whenever ai has no actual interaction records of his / her
neighbor aj in time period t.
Then ai updates his / her link weights for the next time period t+1 according to the mechanism below:
𝑙𝑤𝑖𝑗,𝑡+1 = 𝑝𝑖𝑗,𝑡+1,𝜏𝐴𝑃𝐼 =
𝑅𝑖𝑗,𝑡
𝐶𝑗+𝛿
∑ (𝑅𝑖𝑗,𝑡
𝐶𝑗+𝛿)
𝑖+𝑁𝑢𝑚
𝑖𝑁𝑒𝑖𝑔𝑠
2
𝑗=𝑖−𝑁𝑢𝑚
𝑖𝑁𝑒𝑖𝑔𝑠
2
=
𝑅𝑖𝑗,𝑡
𝐶𝑗+
1
𝑁𝑢𝑚𝑖𝑁𝑒𝑖𝑔𝑠
∑ (𝑅𝑖𝑗,𝑡
𝐶𝑗+
1
𝑁𝑢𝑚𝑖𝑁𝑒𝑖𝑔𝑠)
𝑖+𝑁𝑢𝑚
𝑖𝑁𝑒𝑖𝑔𝑠
2
𝑗=𝑖−𝑁𝑢𝑚
𝑖𝑁𝑒𝑖𝑔𝑠
2
(23)
(𝑎𝑗 ∈ 𝑁𝑒𝑖𝑔𝑠𝑖 , 0 ≤ 𝜏 ≤ 𝑅𝑒𝑞𝑖,𝑡𝐼𝑛𝑡𝑒 and 𝜏 ∈ N+)
𝑙𝑤𝑖𝑗,𝑡+1 represents the unilateral link weight that ai assigns to his / her neighbor aj for the next time period. 𝑝𝑖𝑗,𝑡+1,𝜏
𝐴𝑃𝐼 represents the probability that ai actively chooses his / her neighbor 𝑎𝑗 as his / her potential interaction partner when ai should choose an potential interaction partner within his / her neighborhood in any sub-time period 𝜏 of time period t+1. What is more, we define 𝛿 as relationship maintenance strength which is a constant and whose direct purpose is matrix completion since the denominator of each element may be zero. It can also be used for: a) controlling to which degree a relationship is maintained over to the next time period even if an agent’s neighbor defects in all actual interactions between them in the current time period; b) and at the same time for an agent to attach enough importance on neighbors’ cooperation rate in the actual interactions between them in the current time period. The link-weights updating rule is created like this because embeddedness in social network is an interested parameter in this chapter and, hence, it is
undesirable to totally delete any relationship forever. In this chapter, we set 𝛿 = 𝑙𝑤𝑖𝑗,𝑡=1 =1
𝑁𝑢𝑚𝑖𝑁𝑒𝑖𝑔𝑠,
namely ai’s initial unilateral link weight to his / her arbitrary neighbor aj, in order to keep consistent with the fact that, generally, a neighbor is with less probability to be chosen in a larger neighborhood. Change of link weights reflects heterogeneity of links.
4.4 Results and analysis
Parameter values are listed in Table 4.3. Numbers or matrices for compared parameters in Table 4.3 with a short horizontal line underneath are the parameter values used in baseline simulation. Comparison of candidate values of each parameter is based on base-line simulation. For every parameter value portfolio under investigation, I am interested in the evolution of: 1) the sum of number of actual interaction of all agents ∑ 𝑁𝑢𝑚𝑖,𝑡
𝐴𝐼100𝑖=1 , 2) the sum of number of cooperation of all
agents ∑ 𝑁𝑢𝑚𝑖,𝑡𝐶100
𝑖=1 and 3) the difference between them. 1 All simulations in this chapter are implemented 800 runs.
1 Since each interaction involves 2 agents and each time period contains 20 sub-time periods, the max values of ∑ 𝑁𝑢𝑚𝑖,𝑡
𝐴𝐼100𝑖=1 and ∑ 𝑁𝑢𝑚𝑖,𝑡
𝐶100𝑖=1 is 4000.
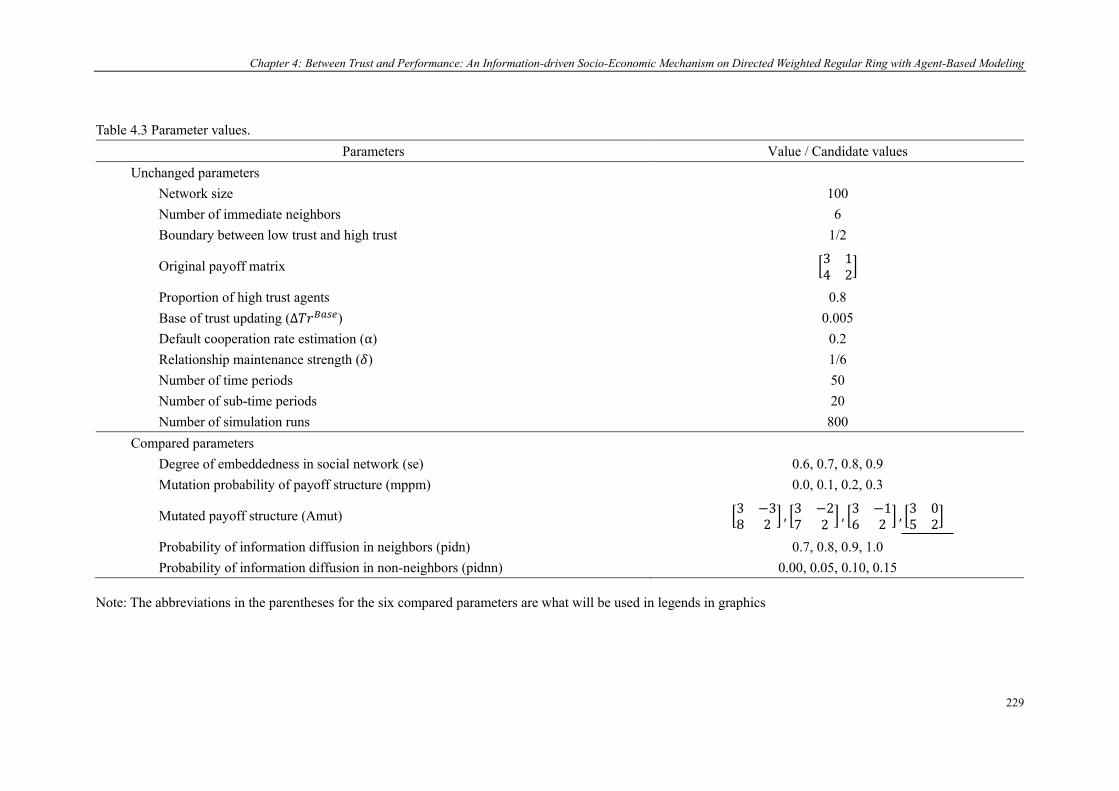
Chapter 4: Between Trust and Performance: An Information-driven Socio-Economic Mechanism on Directed Weighted Regular Ring with Agent-Based Modeling
229
Table 4.3 Parameter values. Parameters Value / Candidate values
Unchanged parameters Network size 100 Number of immediate neighbors 6 Boundary between low trust and high trust 1/2
Original payoff matrix [3 14 2
]
Proportion of high trust agents 0.8 Base of trust updating (∆𝑇𝑟𝐵𝑎𝑠𝑒) 0.005 Default cooperation rate estimation (α) 0.2 Relationship maintenance strength (𝛿) 1/6 Number of time periods 50 Number of sub-time periods 20 Number of simulation runs 800
Compared parameters Degree of embeddedness in social network (se) 0.6, 0.7, 0.8, 0.9 Mutation probability of payoff structure (mppm) 0.0, 0.1, 0.2, 0.3
Mutated payoff structure (Amut) [3 −38 2
] , [3 −27 2
] , [3 −16 2
] , [3 05 2
]
Probability of information diffusion in neighbors (pidn) 0.7, 0.8, 0.9, 1.0 Probability of information diffusion in non-neighbors (pidnn) 0.00, 0.05, 0.10, 0.15
Note: The abbreviations in the parentheses for the six compared parameters are what will be used in legends in graphics

Trust and Development: The Deep Structure of Institutions-Building and Socio-Economic Performance
230
4.4.1 Baseline simulation
Before the comparisons of some groups of parameter values are presented, let us have a quick look at the baseline simulation. Figure 4.3 illustrates the baseline simulation with the min, max, median and mean of 800 simulation runs. In the baseline simulation, median and mean values of both ∑ 𝑁𝑢𝑚𝑖,𝑡
𝐴𝐼100𝑖=1 and ∑ 𝑁𝑢𝑚𝑖,𝑡
𝐶100𝑖=1 of 800 runs decrease first and then soar. The distance of their max
values and min values are gradually spanning the whole range. Median of the differences between ∑ 𝑁𝑢𝑚𝑖,𝑡
𝐴𝐼100𝑖=1 and ∑ 𝑁𝑢𝑚𝑖,𝑡
𝐶100𝑖=1 decreases first then enlarges and then shrinks again, while its mean
is relatively stable.
Figure 4.3 Baseline simulation.
4.4.2 Degree of embeddedness in social network
Four different values are compared for degree of embeddedness in social network, namely se=0.6, 0.7, 0.8 and 0.9 with the other parameters having the same value with those in the baseline simulation. The results of 800 runs are exhibited in Figure 4.4. Under the experimental design in this chapter, ∑ 𝑁𝑢𝑚𝑖,𝑡
𝐴𝐼100𝑖=1 and ∑ 𝑁𝑢𝑚𝑖,𝑡
𝐶100𝑖=1 perform better (have higher values) as degree of
embeddedness in social networks. In the worst situation of se = 0.6, median of both ∑ 𝑁𝑢𝑚𝑖,𝑡𝐴𝐼100
𝑖=1
and ∑ 𝑁𝑢𝑚𝑖,𝑡𝐶100
𝑖=1 of 800 runs even collapse.

Chapter 4: Between Trust and Performance: An Information-driven Socio-Economic Mechanism on Directed Weighted Regular Ring with Agent-Based Modeling
231
Figure 4.4 Comparing degrees of embeddedness in social networks.
When degree of embeddedness in social network is higher, interactions more likely happen within neighborhood, ceteris paribus. Thus, when degree of embeddedness in social network is higher, on the one hand, an agent’s trust-updating relates stronger to his / her fixed neighbors’ trustworthiness; on the other hand, an agent has more samples of the interactions with each neighbor, and more values of cooperation rate estimation for each neighbor, and more chances for him / her to update trustworthiness, which avoid being locked in low trustworthiness trap. Learnt trustworthiness, then, is reflected on interactions. Degree of embeddedness in social network represents an opposite of geographical mobility to some extent. Thus, as geographical mobility accelerates, both trust and trustworthiness decrease and may collapse.
As to the relatively stable gap between the mean of ∑ 𝑁𝑢𝑚𝑖,𝑡𝐴𝐼100
𝑖=1 and ∑ 𝑁𝑢𝑚𝑖,𝑡𝐶100
𝑖=1 of 800 runs, it may be attributed to: 1) Information acquisition capability. Assume an agent whose current trust is low. If his / her information acquisition capability via observing (both neighbors and non-neighbors) is at the same time low, then (s)he has fewer chances to increase trust and will always not participate in actual interactions. 2) Unilateral link weights updating. An agent’s most defective neighbor has less likelihood to be chosen as a potential interaction partner if other neighbors are more cooperative.
4.4.3 Mutation probability of payoff matrix
Four candidates are compared for mutation probability of payoff matrix, namely 0.0, 0.1, 0.2 and 0.3 with the other parameters having the same value with the baseline simulation. The results are shown Figure 4.5. Both ∑ 𝑁𝑢𝑚𝑖,𝑡
𝐴𝐼100𝑖=1 and ∑ 𝑁𝑢𝑚𝑖,𝑡
𝐶100𝑖=1 soar even with different speeds. They
perform better for mppm = 0 and 0.1 than for mppm = 0.2 and 0.3.
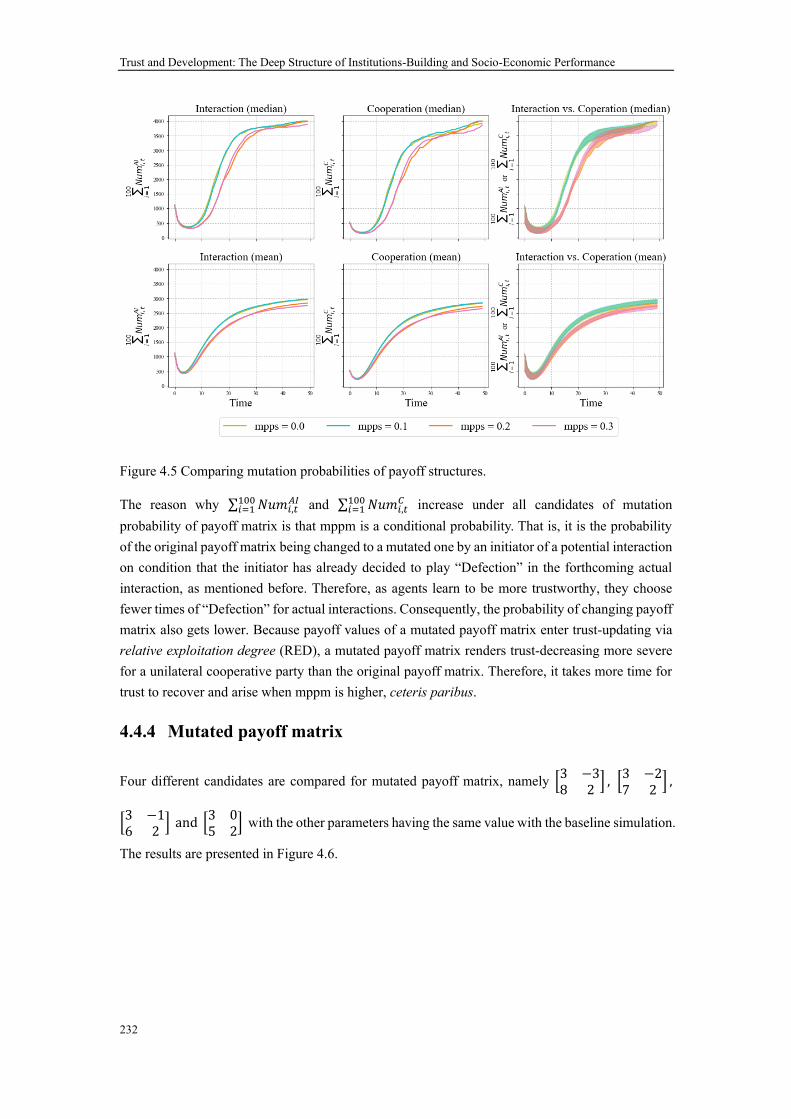
Trust and Development: The Deep Structure of Institutions-Building and Socio-Economic Performance
232
Figure 4.5 Comparing mutation probabilities of payoff structures.
The reason why ∑ 𝑁𝑢𝑚𝑖,𝑡𝐴𝐼100
𝑖=1 and ∑ 𝑁𝑢𝑚𝑖,𝑡𝐶100
𝑖=1 increase under all candidates of mutation probability of payoff matrix is that mppm is a conditional probability. That is, it is the probability of the original payoff matrix being changed to a mutated one by an initiator of a potential interaction on condition that the initiator has already decided to play “Defection” in the forthcoming actual interaction, as mentioned before. Therefore, as agents learn to be more trustworthy, they choose fewer times of “Defection” for actual interactions. Consequently, the probability of changing payoff matrix also gets lower. Because payoff values of a mutated payoff matrix enter trust-updating via relative exploitation degree (RED), a mutated payoff matrix renders trust-decreasing more severe for a unilateral cooperative party than the original payoff matrix. Therefore, it takes more time for trust to recover and arise when mppm is higher, ceteris paribus.
4.4.4 Mutated payoff matrix
Four different candidates are compared for mutated payoff matrix, namely [3 −38 2
] , [3 −27 2
] ,
[3 −16 2
] and [3 05 2
] with the other parameters having the same value with the baseline simulation.
The results are presented in Figure 4.6.

Chapter 4: Between Trust and Performance: An Information-driven Socio-Economic Mechanism on Directed Weighted Regular Ring with Agent-Based Modeling
233
Figure 4.6 Comparing mutated payoff matrices.
As the conflict between a unilateral cooperator and a unilateral defector narrows, both ∑ 𝑁𝑢𝑚𝑖,𝑡𝐴𝐼100
𝑖=1 and ∑ 𝑁𝑢𝑚𝑖,𝑡
𝐶100𝑖=1 soar with a faster speed. It is because relative exploitation degree (RED)
amplifies the degree of trust-decreasing as ex post conflict of mutated payoff matrix gets stronger, which causes trust to decrease more severely for a unilateral cooperator, cetera paribus.
4.4.5 Probability of information diffusion in neighbors
Four candidates are compared for probability of information diffusion in neighbors, namely pidn = 0.7, 0.8, 0.9 and 1.0 with other parameters taking the same value with baseline simulation. Results are shown in Figure 4.7. Roughly, under the experimental design and parameters value selection, as probability of information diffusion in neighbors gets larger, both ∑ 𝑁𝑢𝑚𝑖,𝑡
𝐴𝐼100𝑖=1 and ∑ 𝑁𝑢𝑚𝑖,𝑡
𝐶100𝑖=1
take off faster.

Trust and Development: The Deep Structure of Institutions-Building and Socio-Economic Performance
234
Figure 4.7 Comparing probabilities of information diffusion in neighbors.
As aforementioned, observing is an important channel of acquiring information about others’ interactions and, at the same time, trust-updating. A characteristic of information diffusion within neighborhoods is that information coverage is relatively small but information arrival is relatively frequent. That is, the impact of information diffusion within neighborhoods is mainly local. Therefore, agents are more likely to have heterogeneous information via observing neighbors.
However, it should be mentioned that the impact of information diffusion, both in neighbors and non-neighbors, is a subtle issue. The decisive factor of information diffusion may not be the probability but the nature of the events getting diffused, namely whether the observed event is a trust-increasing one or a trust-decreasing one. As pidn increases, both the chances of observing trust-increasing events and trust-decreasing events rise, while trust-decreasing events have a larger impact on agents’ trust than trust-increasing ones. Thus, the effect of a certain number of trust-decreasing events needs a larger quantity of trust-increasing events to compensate. That is, the impact of pidn on ∑ 𝑁𝑢𝑚𝑖,𝑡
𝐴𝐼100𝑖=1 and ∑ 𝑁𝑢𝑚𝑖,𝑡
𝐶100𝑖=1 may depend on the number contrast between trust-increasing
events and trust-decreasing events. Only when trust-increasing events are observed as many times as enough can the two variables of interest soar. The impact of information diffusion is embodied more obviously for non-neighbors which is analyzed below.
4.4.6 Probability of information diffusion in non-neighbors
Four candidates are compared for probability of information diffusion in non-neighbors, namely pidnn = 0, 0.05, 0.1, 0.15 with other parameters sharing the same value with the baseline simulation. Results are plotted in Figure 4.8. It can be seen that ∑ 𝑁𝑢𝑚𝑖,𝑡
𝐴𝐼100𝑖=1 and ∑ 𝑁𝑢𝑚𝑖,𝑡
𝐶100𝑖=1 are more
sensitive to probability of information diffusion in non-neighbor than in neighbors. As probability of information diffusion in non-neighbors gets larger, ∑ 𝑁𝑢𝑚𝑖,𝑡
𝐴𝐼100𝑖=1 and ∑ 𝑁𝑢𝑚𝑖,𝑡
𝐶100𝑖=1 take off
slower. In the worst situation of pidnn = 0.15, median of ∑ 𝑁𝑢𝑚𝑖,𝑡𝐴𝐼100
𝑖=1 and ∑ 𝑁𝑢𝑚𝑖,𝑡𝐶100
𝑖=1 of 800

Chapter 4: Between Trust and Performance: An Information-driven Socio-Economic Mechanism on Directed Weighted Regular Ring with Agent-Based Modeling
235
runs even collapse.
Figure 4.8 Comparing probabilities of information diffusion in non-neighbors.
As mentioned above, the decisive factor of information diffusion lies in the nature of events getting diffused, namely whether the observed event is a trust-increasing one or a trust-decreasing one. This kind of impact is amplified for information diffusion in non-neighbors.
4.5 Interim conclusions
This chapter explores the evolution of interaction and cooperation, supported by individuals’ changing trust and trustworthiness respectively, on a directed weighted regular ring from the angle of micro scope by using agent-based modeling. This agent-based model takes into account agents’ heterogeneity on: 1) trust and trustworthiness; 2) capabilities of acquiring information from neighbors and non-neighbors; 3) weights of different kinds of information sources. It also integrates several considerations below via relatively delicate experimental design: 1) a characteristic of trust is that trust is destroyed easily and built harder (Slovic, 1993); 2) trustworthiness may be reflected on both strategy decision and payoff structure decision; 3) individuals can decide whether or not to be involved in an interaction; 4) interaction density exists, not only between neighbors and strangers (Macy and Skvoretz, 1998), but also within neighbors; 5) information diffusion.
This agent-based model regard trust as the decisive factor of willingness to interact and trustworthiness as the decisive factor of probability to cooperate, and applies somehow relatively plausible trust-updating, trustworthiness-updating and link-weight-updating mechanism. Marginal rate of exploitation of original payoff matrix and relative exploitation degree between two payoff matrices are stressed in their influence of trust-destroying; influence of observing is introduced via imagined strategy; a relationship is maintained through relationship maintenance strength.

Trust and Development: The Deep Structure of Institutions-Building and Socio-Economic Performance
236
This chapter probes the impact of degree of embeddedness in social network, mutation probability of payoff matrix, mutated payoff matrix, proportion of high trust agents and probabilities of information diffusion within neighborhood and among non-neighbors in socio-economic process on the sum of number of actual interactions and number of cooperation of all agents on the base of a baseline simulation. Under the experimental design and parameter values selection in this chapter, basically as degree of embeddedness in social network, proportion of high trust agents 1 and probability of information diffusion in neighbors increase and as mutation probability of payoff matrix, conflict of mutated payoff matrix and probability of information diffusion in non-neighbors decrease, simulation performs better.
1 There is an exception in the impact of proportion of high trust agents, as mentioned above.

Chapter 5: Summary and Conclusions,
with Some Thoughts on Information,
Education and Formal Institutions
5.1 Summary and conclusions
This thesis tries to establish first a comprehensive and realistic theoretical system in which trust changes, and then explores different interesting issues using different methods like comparison analysis, econometric analysis and agent-based modeling. The theoretical system restored in this thesis integrates a series of realistic factors in socio-economic environment besides trust, like information, social learning, network, institutions, geographical mobility and so on, and covers gradually increasing levels from individual thoughts and behavior, to interactions, to networks, and to multi-networks. The underlying logic of linking those realistic factors is: Trust, especially its change, is subject to the perception of trustworthiness. Information reflecting trustworthiness plays a decisive role in trust changing. Not conforming to institutions is an important embodiment of untrustworthiness, and is therefore a significant factor causing distrust. Moreover, trustworthiness per se is an institution. Information process and social learning process overlap to a substantial degree. Ways of acquiring information coincide with that of social learning. Through social learning, behavior can directly be acquired (such as, trustworthy behavior), which makes social learning play an important role in nurturing institution-conforming behavior. What is more, social learning can also change thoughts (such as, change cognition to social environments), and then guides conscious behavior (such as, to trust according to trustworthiness). Information functions through personal psychology eventually. Social networks are where information is acquired, social learning is going on, behavior is output and information is diffused subsequently. Geographical mobility changes individual local interaction network.
This thesis contains six sections in total: an introduction and 5 chapters. Chapter 1 is the theoretical part; Chapter 2 is basically the comparison part between China and three Scandinavian countries – Denmark, Norway and Sweden; Chapter 3 is the empirical part using survey data from China; and Chapter 4 is the simulation part using the cutting-edge method of agent-based modeling, also involving some knowledge of network theory and game theory.
Chapter 1 is the theoretical part of this thesis. It integrates the factors of trust, information, social learning, network, institutions, geographical mobility, etc. guided by the logic stated above, and basically unfolds along the line of individuals, interactions, networks and multi-networks. It can be viewed as composed of three big plates: first, basics of trust; second, trust and trustworthiness per se; third, other factors mentioned above (namely, information, social learning, network, institutions, geographical mobility) constituting the realistic system where trust changes.
In terms of basics of trust, this chapter first discusses some conceptual aspects of trust, that is, its

Trust and Development: The Deep Structure of Institutions-Building and Socio-Economic Performance
238
connotation, characteristics, types, distinctions between general trust, group trust and trust in strangers, the mechanism of the formation and function of individual general trust, and current measurements of (generalized) trust from different perspectives and in different levels. Individual trust is a corresponding and reactive attitude based on one’s perception of others’ trustworthiness. Trust is conditional on trustworthiness, relies on information, is risk-relevant ex ante, and is slow to establish, fast to decline and hard to rebuild. Individual general trust is his / her overall assessment of the trustworthiness of unspecified others in the society. From an individual perspective, the difference between general trust and particular trust lies in whether the trust object(s) is / are specified; The difference between general trust and group trust lies in whether there is a definitive, clear characteristic or criterion to define a certain group; and the difference between general trust and trust in strangers lies in whether there is the explicit distinction of the distance of personal relationships. The generalization of trust can be treated as a subjective referred result from a sample of population to the whole population. The generalization of trust is to a large extent experience-oriented, or backward-looking, while its output is expectation-oriented, or forward-looking. When functioning, general trust is reflected in a particular way. After being experienced, uncertainty will turn into established facts and certainty. The impact of consistency of expectation and a later fact on trust also depends on whether the expected thing is desirable or undesirable. Experience can be categorized as childhood and adulthood experience, personal and non-personal experience, and positive and negative experience. Expectation can be positive or negative, self-based or cause-based, and quantitative or qualitative. Existing measures of general trust include measuring general trust using micro-level or aggregate macro-level survey data, measuring social trust using the cooperation share in evolutionary game theoretical agent-based models, and representing micro trust using probability.
In terms of trust and trustworthiness, this chapter illustrates trust at individual (micro) level from the two aspects of thoughts and behavior from the perspective of a trustor, the relation between trust and trustworthiness, the costs of trustworthiness, the role as a trustor and a trustee, and explains trust and trustworthiness between 2 persons and how to understand the supply and demand of trust and trustworthiness. Thoughts, from the perspective of an individual trustor, stress the psychological or mental process of how a trustor in his / her mind processes information of others’ trustworthiness. To which degree a person would react to trustworthiness information depends largely on personal preference, opinion, emotional attitude, etc. Human capabilities of reasoning, inference and association etc. also play a crucial role in one’s trust in future similar situations or in other people with common and / or similar characteristics. Behavior is an expression of the results of one’s thinking process to a large extent. An interaction of two parties can either involve unilateral trust or bilateral mutual trust. An interactive trusting-trusted relationship necessitates the consent to an interaction and the specific implementation process afterwards. Interactions are the most important channel that trustors show their trust attitude. An interaction involves a bunch of decisions through which a trustor can influence and shape the interaction. Trustworthiness is not only the basis of trust, but also reacts to it. Costs of untrustworthiness to others can be both individual and social. Individual costs from untrustworthiness of others can be a direct monetary loss, unwillingness to future potential interactions, or searching costs for a reliable interactor. Distrust may also trigger more use of existing individual social network. Social costs of untrustworthiness lie in its detriment to value creation. The roles of a trustor and a trustee in a 2-person trusting-trusted relationship represent either correspondence or superposition. One may also adjust his / her trustworthiness according to

Chapter 5: Summary and Conclusions, with Some Thoughts on Information, Education and Formal Institutions
239
others’ trustworthiness. The supply of trust means to trust, and the demand for trust means the demand for being trusted; the supply of trustworthiness means being trustworthy while behaving, and the demand for trustworthiness means the demand for the trustworthiness of others’ behavior. The supply and demand of trust and trustworthiness can be compared without specific quantity.
In terms of some essential, decisive factors pushing the functioning of trust mechanism and underpinning the change and coevolution of trust and trustworthiness, this chapter pays attention to information, social learning, networks, geographical mobility and institutions. Behavior is the fundamental source of information of one’s own trust and trustworthiness. Behavior can be solo or interactive, and internalization-based or internalization-lacking. Information reflecting others’ trustworthiness is crucial for one’s trust. Information can be categorized as solo behavior or interactive behavior information, personal interaction or non-personal interaction information, individual-particular or phenomenon-particular information, natural-personal or media information, or personal interaction and observation information, or direct and indirect information. Social learning is an important channel for acquiring both thoughts and behavior, including trust and trustworthiness. Social learning can be direct or indirect learning, forward or reverse learning, learning from the same standpoint or from the counter standpoint, and active or passive learning. It can be from parents, neighbors or even strangers. Immediate interaction network, temporary interactions, observation, verbal delivered information, written records could all become channels for social learning. A shorter distance – geographical, social or psychological – facilitates interactions. So does being involved in the same interaction platform. Interaction platforms can form based on geographical locations, organizations, social roles, events, technology, or era. Flows should also be treated as a basic element of networks, besides nodes and links. For micro individuals to generate macro phenomena, four steps, namely endowment / networking process, micro effects, synthetization process and macro-level presentation, may be experienced. The reason why macro network phenomena are rich and constantly changing in reality lies in the driving of heterogeneity. The heterogeneity of networks may be embodied on nodes, links, flows, game types / structures, interaction platforms, and network structures. Geographical mobility changes individual local interaction network, and has a time and distance dimension. Three kinds of trust decline may be caused by geographical mobility: different background mindsets, different standpoints, and the coexistence of a large and dense population in an area and high mobility which creates conditions for untrustworthy behavior. In addition, geographic mobility may also accompany social mobility. Not conforming to institutions is a non-negligible cause for distrust. Institutions can be categorized as problem-solving, problem-avoiding, influence- / problem-controlling and blame-apportioning, or as values-type institutions and constructed institutions, according to different criteria. Trustworthiness per se, as an institution, is values-type. Problems are the prime target of institutions usually, which requires the manifestation of problems as a prerequisite. Institutions centering around problems may touch different depths of problems. Behavioral requirements on others and the changeability of the relatively advantageous role in various interactions push the origin of institutions. Continuous geographical distribution of population and population mobility favor the diffusion of institutions. An institution’s prevalence from generation to diffusion presents three patterns of special structure at least, that is, single-point radiation, multi-points outburst and diffusion in virtue of population mobility. Besides the reasons stressed by Axelrod (1986) and Posner (1997), people may also conform to institutions because complying with institutions is easier and more convenient, makes one the right party in normal cases, implies an exchange for others’

Trust and Development: The Deep Structure of Institutions-Building and Socio-Economic Performance
240
institution-obeying behavior, or is motivated by the changeability of the relatively advantageous role in various interactions. Among all the reasons, reputation outstands for its strong dependence on information process. It can be said that trust and its change are in an interwoven system composed of institutional networks, causality networks and personal information networks.
Economic life is part of social life. In the socio-economic system, economic transactions are a specific, important form of interpersonal interactions. In economic transactions, individual (dis)trust may cause a series of effects of compression effect, substitution effect, brand-reliance effect, search effect, “experts” effect, self-provision effect and mismatch effect. Therein, substitution effect may be horizontal, vertical or cross substitution. Through a series of effects like these, trust shapes economy at the micro-level, which will be reflected on its macro-level performance through a bottom-up process.
Chapter 2 compares or contrasts or presents several socio-economic aspects of China and three Scandinavian countries – Denmark, Norway and Sweden. The selected socio-economic aspects for comparison or presentation include population, network structures, welfare, equality, geographical mobility, social capital, trust, public security, performance of labor market, and economic growth. Not only the possible logic between these aspects and trust (except trust per se) is explained; rich corresponding data of each aspect of Denmark, Norway, Sweden and China is also presented for a relatively comprehensive understanding of the four countries.
The prime reason for stressing population is the volume of information reflecting others’ trustworthiness associated with population size. A larger and denser population means more pieces of interaction information of others’ trustworthiness, ceteris paribus. Also, a larger size of population associates with more strangers and a higher degree of heterogeneity in population characteristics, although heterogeneity in population characteristics is not a deep and essential cause of distrust. China is a population-large country, while all of Denmark, Norway and Sweden are population-small ones, which determines to a large degree that there are probably more pieces of information reflecting trustworthiness of others within China than in Denmark, Norway or Sweden. However, as said in Chapter 1 and Chapter 4, information can be positive or negative, which for trust can be trust-increasing or trust-decreasing. The final effect of information on individual trust attitude lies in the relative strength of the two kinds of information functioning on people.
Network structures reflect interaction structures to a large degree. Individual social network is the source of individual social capital. China and the West present different social network structures. The West has prevalent group life, while China does not (Liang, [1949] 2005). The Chinese society is cha xu ge ju, while the Western societies are tuan ti ge ju (Fei, [1947] 2017). One’s family is usually his / her closest social circle. Taking sibling numbers as a proxy for family structure, Danish children have more siblings than Chinese ones. Denmark encourages childbearing and has corresponding supporting (welfare) policies, while many contemporary young Chinese would not like to give birth to more children because of pressure from money, career, time or energy, although the family planning policy in China has been relaxed gradually. Memberships reflect individual relatively formal social network. Danish, Norwegian and Swedish participate in more formal groups, and are more active in various groups than Chinese. In fact, Chinese more would like to be involved in informal social circles where a rapport with others is established gradually in naturally occurring interactions.

Chapter 5: Summary and Conclusions, with Some Thoughts on Information, Education and Formal Institutions
241
Denmark, Norway and Sweden are outstanding representatives of modern welfare states, and are all countries with a small-size and relatively homogenous population. The subtle balance between efficiency and fairness may influence whether welfare states can benefit economic performance. The structure of tax revenues and expenditures play a role therein. Moreover, good economic performance provides an economic foundation for the implementation of comprehensive and generous welfare policies. Universal welfare has both advantages and disadvantages. Given the relatively normal operation of economy, polices encouraging employment benefit the co-existence of universal welfare and good economic performance. Historical reasons, values basis, economic basis and the ruling party all contribute to the implementation and maintenance of the relatively comprehensive and generous welfare policies in the Nordic countries. From data, we can see that the total welfare expenditure and welfare expenditure per capita of Denmark, Norway and Sweden are relatively high. In addition, China has been improving its social security via reforms.
Social trust and welfare can benefit from each other. Also, equality and extended welfare states can be mutually promoted. However, the equality that facilitates the initiation of an extended welfare state and that an extended welfare state leads to are not of the same kind. Comprehensive, universal and generous welfare gives people a sense of safety. Given that equality is basically one of the values of a society, equally rich and equally poor may have an opposite impact on interpersonal trust. Taxes and transfers in Denmark, Norway and Sweden play a significant role in reducing the gap of disposable income among people in the three countries, and good economic performance makes them avoid the state of being equally poor.
Two types of uncertainty may exist in reality: one is that both an event and its future occurring time are uncertain; the other is that some event is almost certain, while the relatively specific occurring time of that event is not quite certain. Welfare policies are conducive to protecting people from uncertainty in life to some degree. Continuity of policies provides certainty and a stable expectation for the public, while uncertainty causes people to distrust uncertainty-makers. It should be noted that change does not mean uncertainty. (Policy) Changes per se do not definitely result in direct distrust in policy-makers or possible indirect distrust to other people in the society. It depends on whether (the general trend of) the change is good or bad. Additionally, according to corresponding data, Denmark, Norway and Sweden have relatively little corruption around the world, which is an advantage for them to serve the people better.
Social mobility reflects social fairness to a large degree. Social fairness is a value-type institution violating which will harm social trust. In general, Chinese feel that both their subjective social stratum and their subjective socio-economic status increase when compared with past oneself. In contrast, a vast majority of Chinese feel that their subjective socio-economic status is the same with or lower than peers. The perception of upward social mobility may benefit from the improvement of living conditions brought by economic development as time goes on and by personal wealth accumulation and achievement with age to a large degree. Additionally, gaokao plays an important and positive role in social mobility in China. Moreover, geographical mobility often accompanies social mobility and local interaction network, as figured out in Chapter 1, as well as local socio-economic and policy environment. Geographical mobility in China often involves the issue of hukou to which employment, children’s education, social security, public services and so on are attached. China has been reforming its Huji system. A number of local governments have made a looser

Trust and Development: The Deep Structure of Institutions-Building and Socio-Economic Performance
242
hukou-settling policy as one of the measures of attracting people to stay or to come. To retain people ever attracted there, those cities should also increase the supply and improve the quality of education, healthcare, infrastructure, etc. accordingly.
Individual social capital relates to personal relationships and benefits its owner. One can acquire physical, financial and emotional support, information and even more social capital from his / her own social capital. However, there are two opposite opinions among scholars as to the necessity of the term “social capital”. For example, Arrow (1999) and Solow (1999) do not think the term is necessary. Individual social capital implies a two-way relationship. Additionally, trust is a sufficient but not necessary condition of social capital. The total social capital one possesses hinges on both the quantity and the quality of the relationships in his / her egocentric network. The capacity, vertical position and social capital of the other person on the other end of a relationship plays a decisive role of the quality of a person’s social capital. Data of frequency of meeting people, social activities compared with peers, discussing intimate matters, social activities in leisure time, diversity of occupations in personal social network, besides number of siblings and membership, of China, Denmark, Norway and Sweden is selected to reflect the social capital in the four countries. Norwegian present the highest frequency of meeting people among the three Scandinavian countries, followed by Swedish and then by Danish. However, Norwegian take part in social activities compared to peers less often than Swedish, and Swedish less often than Danish. Norwegian have the lowest average number of persons to whom one can talk personal matters among the three Scandinavian countries, while Swedish have the largest. The self-reported frequency of participating social activities in China has increased to some degree during those 6 years. Peasants among the given options of occupations account for the largest proportion of whom people in China have dealt with, followed by a gradually reducing proportion of middle school teachers, nurses, policemen / policewomen, hairdressers, university lectures, HR managers, programmers, receptionists and lawyers, respectively. Generally, more people in China have less diversity of occupations in their social networks, and the number of respondents who know people from more occupations reduces with a gradually increasing rate as the number of the kinds of occupations in social networks increase.
All of China, Denmark, Norway and Sweden present high general trust around the world. Denmark shows the highest general trust among the four countries, followed by Norway and Sweden. Moreover, Swedish also show higher trust of different relationships than Chinese in general. Chinese trust in 13 kinds of people in social interactions without pecuniary benefits in another dataset is also presented. These 13 kinds of people better reflect relationships in Chinese mind. In these 13 kinds of people, “Relatives”, “(Near) neighbors”, “Colleagues” and “Old classmate” are the four kinds of people that Chinese trust most, while “Strangers”, “Non-close friends / acquaintances”, “People from the same place with them but met in other places (not within their city or county)” and “People joining the same religious activities with them” are the four kinds of people that Chinese distrust most. Additionally, it is natural and normal for people to trust more those with whom they have a closer relationship, no matter of which country the people are.
All the four countries of China, Denmark, Norway and Sweden perform well in unemployment rate. China represents a relatively low unemployment rate, either in terms of registered urban unemployment rate or nationwide surveyed urban unemployment rate. Norway among the four

Chapter 5: Summary and Conclusions, with Some Thoughts on Information, Education and Formal Institutions
243
countries has the lowest unemployment rate, while Sweden the highest. China performs better than the other three countries in terms of economic aggregate. However, the GDP per capita of China is much lower than that of Denmark, Norway and Sweden.
Chapter 3 quantitatively, empirically explores the impact of others’ norm-conforming behavior, others’ opinion and geographical mobility on individual general trust using micro data from Chinese General Social Survey 2013 and the provincial data from the Sixth National Population Census of P.R. China. In this chapter, being taken advantage, social fairness, moral satisfaction, opinion similarity, non-local and percentage of interprovincial immigration reflecting the three interested aspects are chosen or constructed as the core explanatory variables, with general trust being the dependent variable, and gender, age group, highest education (split into several dummies), rural, precept and social class at 14 years old the control variables. In the 6 core explanatory variables, the first three variables are for the impact of norm-conforming and the last two for geographical mobility.
Due to the ordinal categorical nature of the dependent variable general trust, ordered logit regression is first chosen for econometric analysis. In order to detect the degree of (multi)collinearity between and among those independent variables beforehand, simple and partial correlation coefficients and variance inflation factors are calculated, finding no serious multicollinearity among independent variables. In the ordered logit regression, almost all core explanatory variables present an expected impact and strength: being taken advantage and non-local have a strongly significant negative impact on general trust, and social fairness, moral satisfaction and opinion similarity have a strongly significant positive impact on general trust; however, percentage of interprovincial immigration’s negative impact on general trust is not significant. Moreover, likelihood ratio tests also show that the model with all independent variables (and intercepts) strongly significantly holds relative to both the null model with only intercepts and the model with only control variables (and intercepts).
Subsequently, Brant test is used to see whether the parallel odds assumption is violated by any independent variable. It is found that some independent variables, of which two are core explanatory variables of interest (that is, being taken advantage and percentage of interprovincial immigration) do not meet the assumption. Therefore, a partial proportional odds model is applied to amend the previous ordered logit model by relaxing the assumption for the parameters of those variables violating the assumption. It is found that being taken advantage remains to present a strongly significant negative impact on general trust across all cut-points of general trust at least; percentage of interprovincial immigration has a negative impact on general trust at the first three cut-points of general trust and a positive impact at the fourth cut-point, but only significant at the third cut-point. More importantly, those independent variables not violating the assumption do not change in terms of sign, significance and at which significance level is significant. Furthermore, the partial proportional odds model has a higher pseudo R2 (McFadden) and a lower deviance and AIC than the ordered logit model, and the likelihood ratio test also shows the partial proportional odds model significantly holds.
In a word, the empirical research of this chapter proves evidence for the significant impact of others’ norm-conforming behavior, similarity degree of opinion with others and individual geographical mobility on general trust.

Trust and Development: The Deep Structure of Institutions-Building and Socio-Economic Performance
244
Chapter 4 explores the evolution of interaction and cooperation, supported by individuals’ changing, information-driven trust and trustworthiness respectively, on a directed weighted regular ring using agent-based modeling. The model takes into account agents’ differences in trust, trustworthiness, capabilities of acquiring information from neighbors and non-neighbors, and weights of different kinds of information sources. It integrates several considerations via delicate experimental design: a) a characteristic of trust is that trust is destroyed easily and built harder (Slovic, 1993); b) trustworthiness may be reflected on both strategy decision and payoff structure decision; c) individuals can decide whether or not to be involved in an interaction; d) interaction density exists, not only between neighbors and strangers (Macy and Skvoretz, 1998), but also within neighbors; e) information diffusion.
This agent-based model regards trust as the decisive factor of willingness to interact and trustworthiness as the decisive factor of probability to cooperate, and applies somehow relatively plausible trust-updating, trustworthiness-updating and link-weight-updating mechanism. Marginal rate of exploitation of original payoff matrix and relative exploitation degree between two payoff matrices are stressed in their influence of trust-destroying; influence of observing is introduced via imagined strategy; a relationship is maintained through relationship maintenance strength.
This chapter probes the impact of degree of embeddedness in social network, mutation probability of payoff matrix, mutated payoff matrix, and probabilities of information diffusion within neighborhood and among non-neighbors in socio-economic process on the sum of number of actual interactions and number of cooperation of all agents on the base of a baseline simulation. Under the experimental design and parameter values selection in this chapter, basically as degree of embeddedness in social network, proportion of high trust agents1 and probability of information diffusion in neighbors increase and as mutation probability of payoff matrix, conflict of mutated payoff matrix and probability of information diffusion in non-neighbors decrease, simulation performs better.
5.2 Some thoughts on information, education and formal
institutions
5.2.1 About information
With the increasing improvement of information technology and the popularity of the Internet, personal computers and mobile devices, what are playing the role of media has not been only limited to the traditional mass media. It is often said that this is an era in which everyone is self-media or we-media. Social media platforms like Twitter, Facebook, Instagram, Weibo, WeChat, etc. have increasingly become important channels for people to post and acquire information quickly. Given that supporting infrastructure and devices are ready, registering an account, people can post messages, including exposing undesirable phenomenon in the society which may involve individual persons, companies / firms, other organizations, events, behavior and so on, freely at any time and place within the permission of laws. At the same time, acquisition of information also has already
1 There is an exception in the impact of proportion of high trust agents, as mentioned above.

Chapter 5: Summary and Conclusions, with Some Thoughts on Information, Education and Formal Institutions
245
transcended the (online) social interactions with people in one’s close social circles, such as parents, relatives, friends and acquaintances.
In view of the characteristics of information’s diffusion on the Internet (especially on social media platforms), the two points below should be better done about posting information on the Internet and the information posted on the Internet: First, information posters should ensure the truth of the posted information, not deliver pseudo information or spread rumors, not deliberately distort facts or posted information, and refute rumors promptly. Illegal behavior or other undesirable phenomenon should be posted out of social justice to reveal problems in the operation of the society. Second, relevant administrative superintending departments should take active actions to duly handle the exposed problems. Laws, regulations, etc. should be enacted or perfected when necessary in order to deal with future similar issues.
Suppose that exposed information is true, or at least the truth is gradually unfolding, and it is exposed out of social justice. Then, as to exploded undesirable phenomenon in society, there could be at least three kinds of exposure effects: First, follow-up exposure effect, which means to timely follow up the unfolding of an exposed, socially undesirable event. Second, similarity exposure effect, which means that an exposed undesirable event causing wide social attention may also cause similar events in society of other subjects to expose, especially intensively in a short-term afterwards and / or intermittently in a relatively long term after the original strong emotion of the public has faded. Third, full exposure effect, which means that once a subject has been exposed to some untrustworthy behavior, other untrustworthy behavior of it may also be exposed subsequently, maybe by other exposers, if there are.
As to information, one point is noteworthy. Incomplete information, especially lack of key detail information, could lead to incorrect inference, even one opposite to actual situation. Likewise, lack of key detail information about trustworthiness could probably lead to a mistaken judgment on trustworthiness, subsequently an unblinded but mistaken trust.
5.2.2 About education
Different people, such as parents, teachers, etc., may have influenced one’s thoughts and behavior, with different degrees, as (s)he grows up. Indeed. Human society has developed for such a long time that there are many things that we do not have to learn lessons through personal experience of failures. Humans have already accumulated a lot of wisdom to guide the contemporary people and to pass on from generation to generation. Undoubtedly, in general, school education (including kindergarten and preschool education here) plays a significant role in shaping one’s values and personal qualities. Normally, formal school education is usually throughout the relatively early stage of one’s life, say, from 4 to 20 plus years old, namely from kindergarten to doctor. Furthermore, individual integrity education is always in the former part of his / her formal school education, such as in the preschool, elementary and junior secondary education. Admittedly, individuals’ opinion, values, etc. may change with later experience, and some people might learn some so-call socially-adapted behavior which actually breaches socially acceptable behavioral norms. However, it does not deny the importance of the early stages of one’s life like childhood, teenage, etc. which are the critical periods for the formation of ones’ values, personality, disposition, and so on.

Trust and Development: The Deep Structure of Institutions-Building and Socio-Economic Performance
246
The contents of school education can be generally categorized as two aspects: one is the knowledge of different disciplines; the other is how to conduct oneself. Thus, in formal school education, especially the relatively early preschool, elementary and junior secondary education, not only knowledge should be taught, but also right values, view of morality, what is wrong and what is right, what behavior is socially acceptable, what behavior is legal and what is not, and so on should be consciously infused so that a child can grow up to be a person with good qualities, say trustworthy, with a larger probability in future.
From an individual perspective, education not only favors individual human capital, but also personal quality. In view of the two important points of the meaning of education, we can increase the penetration rate of education, regulate a lowest length of schooling, and improve the quality of teachers. Although education is a long-term investigation and cannot be accomplished overnight, obviously, it must be paid enough attention all the time.
5.2.3 About formal institutions
In order to achieve better social outcomes, people nowadays often turn to institutions to solve coordinate problems. The scope of institutions’ influence can be geographically very large and cover a large number of people. Policies, as a specific form of institutions, also have the characteristic of not changing with population mobility, within the scope of their influence, to a large degree. That is to say, institutions have resistance to geographic population mobility. Therefore, institutions should be made to play a larger role when geographic population mobility is high. Thus, in order to achieve better social outcomes, some degree of the courage of “creative destruction” of formal institutions is often needed. However, when making a policy, at least two problems should be tried to avoid in order for the policy to be smoothly implemented and to achieve the expected aim. Both the two problems may happen in the implementation process.
First, the premise of a good policy to have the expected effects, given that it does have those effects, is for it to get implemented first. Therefore, precautions should be taken to prevent a good policy from not being actually implemented by some people due to their countermeasures against the policy out of seeking for individual interests in the implementation process. Those rule-breakers with socially disapproved behavior may take some measures which appear obedient to the policy, but actually are ways to circumvent it to avoid loss of, or even increase, their personal interests. This kind of behavior would lead the policy to stay virtually nominal to a considerable degree.
Second, even when a formal rule is implemented as expected and its loopholes, if any, are not deliberately exploited, there could still be problems in the implementation process. For example, some policies could have been made not very thoughtfully only focusing on the problem per se at hand and without giving enough consideration about related supporting measures and / or deeper causes, leading to institutional blanks and causing new coordinate problems due to lack of institutional basis. Therefore, in order to prevent this kind of problems in the implementation process of a policy, more thoughtful should be policy-makers when making a policy, and more than one step should be taken into consideration.

Appendix
247
Appendix A: Selected questions from CGSS 2013
Questionnaire B1
Section A:
A2. Gender Male …… 1 Female …… 2
A3. What is your birth date? ____Year__Month__Day
A24. In which year was your hukou transferred into this locality (this district/county/county-level municipality)? (Please fill in the specific number on the lines below)
Record: [ _ | _ | _ | _ ] year 9997. I have been in this locality since I was born
A25. In which year did you come to live here (this district/county/county-level municipality)? (Please write the specific number on the lines below)
Record: [ _ | _ | _ | _ ] year 9997. Have been living here since born. → Skip to A27
A33. Generally speaking, do you agree that most people can be trusted in this society? Strongly disagree …… 1 Disagree …… 2 Neither …… 3 Agree …… 4 Strongly agree …… 5
A34. In general, do you agree that in this society others would try to take advantage of you if you are not careful enough?
Strongly disagree …… 1 Disagree …… 2 Neither …… 3 Agree …… 4 Strongly agree …… 5
A35. Generally speaking, do you think the current society is fair? Completely unfair …… 1 Unfair …… 2 Neither …. 3 Fair …. 4 Completely fair …… 5
A43. In our society, some people are on upper class of the society while some are on lower class. […] The highest score ‘10’ represents the highest class while the lowest score ‘1’ refers to the lowest class.
1 Author’s own translation from Chinese to English. For the original questionnaires and the dataset of CGSS 2013, see, National Survey Research Center at Renmin University of China (2013a, 2013b, 2013c).

Trust and Development: The Deep Structure of Institutions-Building and Socio-Economic Performance
248
…… A43d. Which class do you think your family was at when you were 14 years old?
A49. How good do you think your mandarin listening? Completely cannot understand …... 1 Poor …… 2 Fair …… 3 Good …… 4 Very good …… 5
A50. How good do you think your mandarin speaking? Completely cannot speak …... 1 Poor …… 2 Fair …… 3 Good …… 4 Very good …… 5
Section B:
B3. Do you agree with the statement that “It is very hard for me to choose what precepts to follow.” Strongly disagree …… 1 Disagree …… 2 Neither …… 3 Agree …… 4 Strongly agree …… 5
B4. According to your general impression, how often do you hold the same opinions and views with the public on some important things?
Very rarely …… 1 Rarely …… 2 Average …… 3 Frequently …… 4 Very frequently …… 5
Section D:
D1. To what degree are you satisfied with the moral status in our country? Very satisfied …… 1 Satisfied …… 2 Neither …… 3 Dissatisfied …… 4 Very dissatisfied …… 5
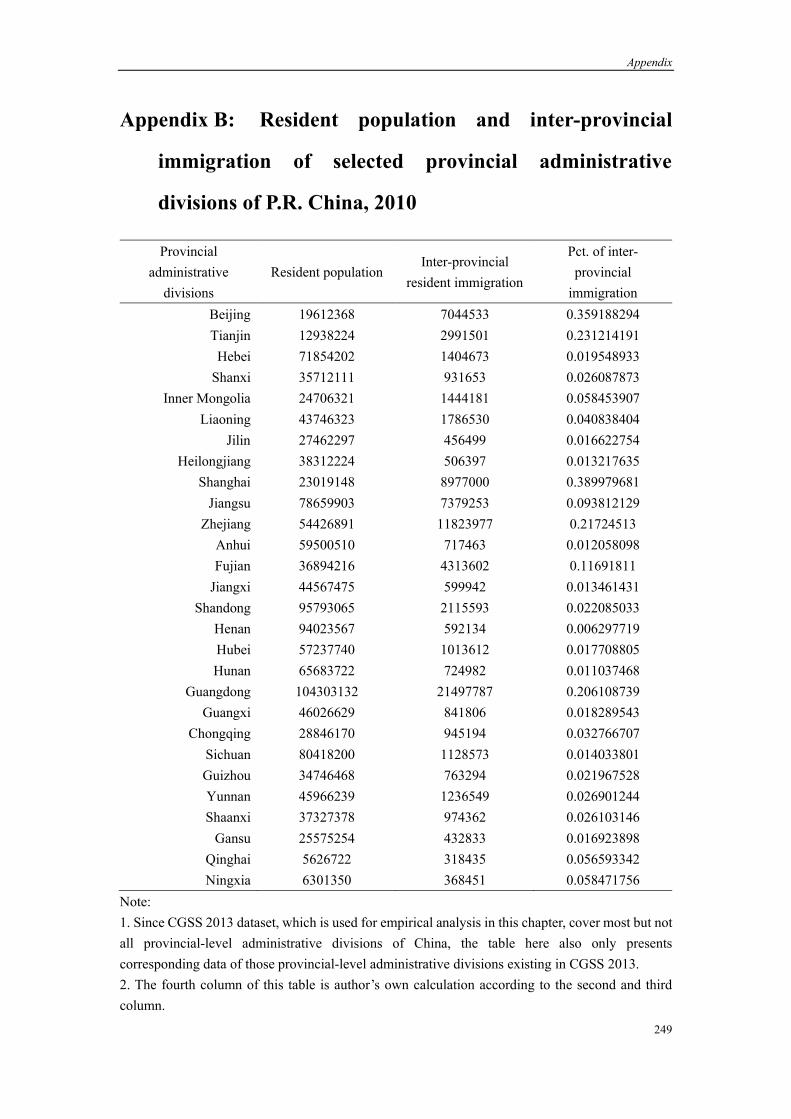
Appendix
249
Appendix B: Resident population and inter-provincial
immigration of selected provincial administrative
divisions of P.R. China, 2010
Provincial administrative
divisions Resident population
Inter-provincial resident immigration
Pct. of inter-provincial
immigration Beijing 19612368 7044533 0.359188294 Tianjin 12938224 2991501 0.231214191 Hebei 71854202 1404673 0.019548933
Shanxi 35712111 931653 0.026087873 Inner Mongolia 24706321 1444181 0.058453907
Liaoning 43746323 1786530 0.040838404 Jilin 27462297 456499 0.016622754
Heilongjiang 38312224 506397 0.013217635 Shanghai 23019148 8977000 0.389979681
Jiangsu 78659903 7379253 0.093812129 Zhejiang 54426891 11823977 0.21724513
Anhui 59500510 717463 0.012058098 Fujian 36894216 4313602 0.11691811
Jiangxi 44567475 599942 0.013461431 Shandong 95793065 2115593 0.022085033
Henan 94023567 592134 0.006297719 Hubei 57237740 1013612 0.017708805 Hunan 65683722 724982 0.011037468
Guangdong 104303132 21497787 0.206108739 Guangxi 46026629 841806 0.018289543
Chongqing 28846170 945194 0.032766707 Sichuan 80418200 1128573 0.014033801 Guizhou 34746468 763294 0.021967528 Yunnan 45966239 1236549 0.026901244 Shaanxi 37327378 974362 0.026103146
Gansu 25575254 432833 0.016923898 Qinghai 5626722 318435 0.056593342 Ningxia 6301350 368451 0.058471756
Note: 1. Since CGSS 2013 dataset, which is used for empirical analysis in this chapter, cover most but not all provincial-level administrative divisions of China, the table here also only presents corresponding data of those provincial-level administrative divisions existing in CGSS 2013. 2. The fourth column of this table is author’s own calculation according to the second and third column.

Trust and Development: The Deep Structure of Institutions-Building and Socio-Economic Performance
250
Source: Office of the Sixth National Population Census of the State Council of the People’s Republic of China, Department of Population and Employment Statistics of the National Bureau of Statistics (2011, pp. 48-49).

Bibliography
251
Bibliography
Agan, A., Starr, S., 2017. The Effect of Criminal Records on Access to Employment. American Economic Review: Papers & Proceedings, Vol. 107, No. 5, pp. 560-564.
Agresti, A., 2010. Analysis of Ordinal Categorical Data. 2nd edition. Hoboken, New Jersey: Wiley.
Alesina, A., La Ferrara, E., 2002. Who Trusts Others? Journal of Public Economics, Vol.85, No. 2, pp.207-234.
Alesina, A., Rodrik, D., 1994. Distributive Politics and Economic Growth. The Quarterly Journal of Economics, Vol. 109, No. 2, pp. 465-490.
Algan, Y., Cahuc, P., 2010. Inherited Trust and Growth. American Economic Review, Vol. 100, No. 5, pp. 2060-2092.
Allison, P., Sep. 10th, 2012. When Can You Safely Ignore Multicollinearity? [online]. Statistical Horizons. [Viewed 9 January 2019]. Available from: https://statisticalhorizons.com/multicollinearity
Andersen, T.M., 2015. The Welfare State and Economic Performance. Bilaga 4, Långtidsutredningen, Sveriges Regering, Statens Offentliga Utredningar, SOU 2015:53.
Aoki, M., 2011, “Individual” Social Capital, “Social” Networks, and Their Linkages to Economic Game. In: Justin Yifu Lin and Boris Pleskovic (Eds.), Annual World Bank Conference on Development Economics – Global 2010: Lessons from East Asia and the Global Financial Crisis. Washington, D.C.: The International Bank for Reconstruction and Development / The World Bank. pp. 157-173.
Arrow, K.J., 1974. The Limits of Organization. New York: Norton.
Arrow, K.J., 1999. Observations on Social Capital. In: Partha Dasgupta and Ismail Serageldin (Eds) Social Capital: A Multifaceted Perspective. Washington, D.C.: The International Bank for Reconstruction and Development / The World Bank. pp. 3-5.
Arthur, W.B., 1994. Inductive Reasoning and Bounded Rationality. The American Economic Review, Vol. 84, No. 2, Papers and Proceedings of the Hundred and Sixth Annual Meeting of the American Economic Association, pp. 406-411.
Arthur, W.B., Holland, J.H., LeBaron, B., Palmer, R., Tayler, P., 1996. Asset Pricing Under Endogenous Expectations in an Artificial Stock Market. Santa Fe Institute Paper No. 96-12-093.
Axelrod, R.M., 1984. The Evolution of Cooperation. New York: Basic Books.
Axelrod, R., 1986. An Evolutionary Approach to Norms. American Political Science Review, Vol. 80, No. 4, pp. 1095-1111.
Axelrod, R.M., 1997. The Complexity of Cooperation: Agent-Based Models of Competition and

Trust and Development: The Deep Structure of Institutions-Building and Socio-Economic Performance
252
Collaboration. Princeton, New Jersey: Princeton University Press.
Bandura, A., 1977. Social Learning Theory. Englewood Cliffs, New Jersey: Prentice-Hall, Inc.
Banerjee, R., 2016. Corruption, Norm Violation and Decay in Social Capital. Journal of Public Economics, Vol. 137, pp. 14-27.
Banisch, S., Lima, R., Araújo, T., 2012. Agent based models and opinion dynamics as Markov chains. Social Networks, Vol.34, pp.549-561.
Barabási, A.-L., Albert, R., 1999. Emergence of Scaling in Random Networks. Science, Vol. 286, No. 5439, pp. 509-512.
Belsley, D.A., Kuh, E., Welsch, R.E., 1980. Regression Diagnostics: Identifying Influential Data and Sources of Collinearity. Hoboken, New Jersey: John Wiley & Sons, Inc.
Berg, J., Dickhaut, J., McCabe,, K., 1995. Trust, Reciprocity, and Social History. Games and Economic Behavior, Vol. 10, No. 1, pp. 122-142.
Bergh, A., Bjørnskov, C., 2011. Historical Trust Levels Predict the Current Size of the Welfare State. KYKLOS, Vol. 64, No. 1, pp. 1-19.
Beugelsdijk, S., de Groot, H.L.F., van Schaik, A.B.T.M., 2004. Trust and Economic Growth: A Robustness Analysis. Oxford Economic Papers, Vol. 56, No. 1, pp. 118-134.
Bhattacharya, R., Devinney, T.M., Pillutla, M.M., 1998. A Formal Model of Trust Based on Outcomes. The Academy of Management Review, Vol. 23, No. 3, pp. 459-472.
Bian, Y., Li, L., 2012. The Chinese General Social Survey (2003-8): Sample Designs and Data Evaluation. Chinese Sociological Review, Vol. 45, No. 1, pp. 70-97.
Bicchieri, C., Xiao, E., Muldoon, R., 2011. Trustworthiness is a Social Norm, but Trusting is Not. Politics, Philosophy & Economics, Vol. 10, No. 2, pp. 170-187.
Bjørnskov, C., 2006. Determinants of Generalized Trust: A Cross-Country Comparison. Public Choice, Vol. 130, No.1-2, pp. 1-21.
Bjørnskov, C., 2012. How Does Social Trust Affect Economic Growth? Southern Economic Journal, Vol. 78, No. 4, pp. 1346-1368.
Bjørnskov, C., Svendsen, G.T., 2013. Does Social Trust Determine the Size of the Welfare State? Evidence Using Historical Identification. Public Choice, Vol. 157, No. 1-2, pp. 269-286.
Blanco, L., Ruiz, I., 2013. The Impact of Crime and Insecurity on Trust in Democracy and Institutions. American Economic Review: Papers & Proceedings, Vol. 103, No. 3, pp. 284-288.
Bogardus, E.S., 1925. Social Distance and Its Origins. Journal of Applied Sociology, Vol. 9, pp. 216-226.
Bogardus, E.S., 1947. Measurement of Personal-Group Relations. Sociometry, Vol. 10, No. 4, pp.

Bibliography
253
306-311.
Bohnet, I., Zeckhauser, R., 2004. Trust, Risk and Betrayal. Journal of Economic Behavior & Organization, Vol. 55, No. 4, pp. 467-484.
Bohnet, I., Greig, F., Herrmann, B., Zeckhauser, R., 2008. Betrayal Aversion: Evidence from Brazil, China, Oman, Switzerland, Turkey, and the United States. American Economic Review, Vol. 98, No. 1, pp. 294-310.
Bonabeau, E., 2002. Agent-Based Modeling: Methods and Techniques for Simulating Human Systems. Proceedings of the National Academy of Sciences of the United States of America, Vol. 99, No. 10, Supplement 3, pp. 7280-7287.
Borger.dk, no date a. Om pension [online]. Borger.dk. [Viewed 18 May 2018]. Available from: https://www.borger.dk/pension-og-efterloen/Pensionssystemet-i-Danmark/Om-pension.
Border.dk, no date b. Om ATP Livslang Pension [online]. Borger.dk. [Viewed 18 May 2018]. Available from: https://www.borger.dk/pension-og-efterloen/ATP-Livslang-pension-oversigt/ATP-Livslang-Pension.
Bourdieu, P., 1986. The Forms of Capital. In: J.G. Richardson (Ed.), Handbook of Theory and Research for the Sociology of Education, New York: Greenwood, pp. 241-258.
Bourdieu, P., 1989. Social Space and Symbolic Power. Sociological Theory, Vol. 7, No. 1, pp. 14-25.
Brant, R., 1990. Accessing Proportionality in the Proportional Odds Model for Ordinal Logistic Regression. Biometrics, Vol. 46, No. 4, pp. 1171 – 1178.
Brenner, T., 2006. Agent Learning Representation: Advice on Modelling Economic Learning. In: Tesfatsion, L. and Judd, K.L. (Eds.), Handbook of Computational Economics Volume 2: Agent-Based Computational Economics. Amsterdam: Elsevier, pp. 895-947.
Brien, A., 1998. Professional Ethics and The Culture of Trust. Journal of Business Ethics, Vol. 17, No. 4, pp. 391-409.
Brown, K.M., Hoye, R., Nicholson, M., 2014. Generating Trust? Sport and Community Participation. Journal of Sociology, Vol. 50, No. 4, pp. 437-457.
Burt, R.S., 2000. The Network Structure of Social Capital. Research in Organizational Behaviour, Vol. 22, pp. 345- 423.
Bush, P.D., 1987. The Theory of Institutional Change. Journal of Economic Issues, Vol. 21, No. 3, Evolutionary Economics I: Foundations of Institutional Thought, pp. 1075-1116.
Chen, S.-H., Chie, B.-T., Zhang, T., 2015. Network-Based Trust Games: An Agent-Based Model. The Journal of Artificial Societies and Social Simulation, 18(3)5, <http://jasss.soc.surrey.ac.uk/18/3/5.html>.
Chetty, R., Hendren, N., Katz, L.F., 2016. The Effects of Exposure to Better Neighborhoods on

Trust and Development: The Deep Structure of Institutions-Building and Socio-Economic Performance
254
Children: New Evidence from the Moving to Opportunity Experiment. American Economic Review, Vol. 106, No. 4, pp. 855-902.
Cho, S.-Y., 2016. Does Gender Equality Promote Social Trust? An Empirical Analysis. World Development, Vol. 88, pp. 175-187.
Christensen, R.H.B., 2015. ordinal - Regression Models for Ordinal Data. R package version 2015.6-28. http://www.cran.r-project.org/package=ordinal/.
Coleman, J.S., 1988. Social Capital in the Creation of Human Capital. American Journal of Sociology, Vol. 94, Supplement: Organizations and Institutions: Sociological and Economic Approaches to the Analysis of Social Structure, pp. S95-S120.
Coleman, J.S., 1990. Foundations of Social Theory. Cambridge, Massachusetts, and London, England: The Belknap Press of Harvard University Press.
Colesca, S.E., 2009. Understanding Trust in e-Government. Engineering Economics, Vol. 63, No. 4, pp. 7-15.
Cornwell, B., Laumann, E.O., Schumm, L.P., 2008. The Social Connectedness of Older Adults: A National Profile. American Sociological Review, Vol. 73, No, 2, pp. 185-203.
Cosmides, L., Tooby, J., 1997. Evolutionary Psychology, A Primer [online]. [Viewed 20 July 2018]. Available from: https://www.cep.ucsb.edu/primer.html.
Costa, L. da F., Rodrigues, F.A., Travieso, G., Villas Boas, P.R., 2007, Characterization of Complex Networks: A Survey of Measurements, Advances in Physics, Vol. 56, No. 1, pp.167-242.
Cox, J.C., 2009. Trust and Reciprocity: Implications of Game Triads and Social Contexts. New Zealand Economic Papers, Vol. 43, No. 2, pp. 89-104.
Dai, S., 2015. Networks of Institutions: Institutional emergence, social structure and national systems of policies. London, UK, New York, NY: Routledge.
Dai, S., Elsner, W., 2015. Declining Trust in Growing China: A Dilemma between Growth and Socio-Economic Damage. Working Papers on East Asian Studies, No. 101/2015, University of Duisburg-Essen, Institute of East Asian Studies (IN-EAST), Duisburg.
Danish Ministry of Health, 2017. Healthcare in Denmark: An Overview [online], Danish Ministry of Health. [Viewed 15 January 2018]. Available from: https://www.sum.dk/English/~/media/Filer%20-%20Publikationer_i_pdf/2016/Healthcare-in-dk-16-dec/Healthcare-english-V16-dec.ashx.
Danish Ministry of Health, © 2018. Danish Ministry of Health. [Viewed 15 January 2018]. Available from: https://www.sum.dk/English.aspx.
Dearmon, J., Grier, L., 2009. Trust and Development. Journal of Economic Behavior & Organization, Vol. 71, No. 2, pp. 210-220.
Delhey, J., Newton, K., 2003. Who Trusts?: The Origins of Social Trust in Seven Societies.

Bibliography
255
European Societies, Vol.5, No.2, pp. 93-137.
Delhey, J., Newton, K., 2005. Predicting Cross-National Levels of Social Trust: Global Pattern or Nordic Exceptionalism? European Sociological Review, Vol. 21, No. 4, pp. 311-327.
Denmark. Folketinget [Parliament], 2013. The Constitutional Act of Denmark of June 5th 1953 [online]. Folketinget. [Viewed 14 January 2018]. Available from: http://www.thedanishparliament.dk/Publications/~/media/PDF/publikationer/English/The_Constitutional_Act_Of_Denmark_2013.pdf.ashx.
Denmarkskanon [Denmark Canon], no date. No Title [The 10 Values]. Denmarkskanon. [Viewed 13 January 2018]. Available from: https://www.danmarkskanon.dk/om-danmarkskanonen/english/.
Denmark.dk, no date a. Facts and Statistics [online]. Denmark.dk. [Viewed 14 January 2018]. Available from: http://denmark.dk/en/quick-facts/facts.
Denmark.dk, no date b. It’s All About Denmark [online]. Denmark.dk. [Viewed 25 March 2019]. Available from: http://serbien.um.dk/en/about-denmark//~/media/Serbien/Documents/DK%20factsheet.pdf.
Denmark.dk, no date c. What do We Mean by “Hygge”? [online]. Denmark.dk. [Viewed 5 March 2019]. Available from: https://denmark.dk/people-and-culture/hygge.
Denzau, A.T., North, D.C., 1994. Shared Mental Models: Ideologies and Institutions. KYKLOS, Vol. 47, No. 1, pp. 3-31.
Dewey, J., 1922. Human Nature and Conduct: An Introduction to Social Psychology. Henry Holt & Co.: New York
Dohmen, T., Falk, A., Huffman, D., Sunde, U., 2012. The Intergenerational Transmission of Risk and Trust Attitudes. Review of Economic Studies, Vol. 2012, No. 79, pp. 645-677.
Elsner, W., 2007. Why Meso? On “aggregation” and “Emergence”, and why and How the Meso Level is Essential in Social Economics. Forum for Social Economics, Vol.36, No.1, pp.1-16.
Elsner, W., 2010. The Process and a Simple Logic of ‘Meso’. Emergence and the Co-evolution of Institutions and Group Size. Journal of Evolutionary Economics, Vol.20, No.3, pp.445-477.
Elsner, W., Heinrich, T, 2009. A Simple Theory of ‘Meso’. On the Co-evolution of Institutions and Platform Size – With an Application to Varieties of Capitalism and ‘Medium-Sized’ Countries. The Journal of Socio-Economics, Vol. 38, No. 5, pp. 843-858.
Elsner, W., Heinrich, T., 2011. Coordination on ‘Meso’-Levels: On the Co-evolution of Institutions, Networks and Platform Size. In S. Mann (Ed.), Sectors matter! Exploring mesoeconomics. Berlin: Springer. pp. 115-163.
Elsner, W., Heinrich, T., Schwardt, H., 2015. The Microeconomics of Complex Economies: Evolutionary, Institutional, Neoclassical, and Complexity Perspectives. Amsterdam: Elsevier.
Elsner, W., Schwardt, H., 2014. Trust and Arena Size: Expectations, Institutions, and General Trust,

Trust and Development: The Deep Structure of Institutions-Building and Socio-Economic Performance
256
and Critical Population and Group Sizes. Journal of Institutional Economics, Vol. 10, No. 1, pp. 107-134.
Elsner, W., Schwardt, H., 2015. From Emergent Cooperation to Contextual Trust, and to General Trust: Overlapping Meso-Sized Interaction Arenas and Cooperation Platforms as a Foundation of Pro-Social Behavior. Forum for Social Economics, Vol. 44, No. 1, pp.69-86.
Epstein, J.M., 1999. Agent-Based Computational Models and Generative Social Science. Complexity, Vol.4, No.5, pp.41-60.
Epstein, J.M., Axtell, R., 1996. Growing Artificial Societies: Social Science from the Bottom Up. Washington, D.C.: Brookings Institution Press.
ESS ERIC Headquarters, Centre for Comparative Social Surveys, 2002a. ESS Round 1, Denmark [data set]. London: Centre for Comparative Social Surveys, City University London. [Viewed 29 November 2016]. Available from: https://www.europeansocialsurvey.org/data/download.html?r=1.
ESS ERIC Headquarters, Centre for Comparative Social Surveys, 2002b. ESS Round 1, Norway [data set]. London: Centre for Comparative Social Surveys, City University London. [Viewed 29 November 2016]. Available from: https://www.europeansocialsurvey.org/data/download.html?r=1.
ESS ERIC Headquarters, Centre for Comparative Social Surveys, 2002c. ESS Round 1, Sweden [data set]. London: Centre for Comparative Social Surveys, City University London. [Viewed 29 November 2016]. Available from: https://www.europeansocialsurvey.org/data/download.html?r=1.
ESS ERIC Headquarters, Centre for Comparative Social Surveys, 2004a. ESS Round 2, Denmark [data set]. London: Centre for Comparative Social Surveys, City University London. [Viewed 30 November 2016]. Available from: https://www.europeansocialsurvey.org/data/download.html?r=2.
ESS ERIC Headquarters, Centre for Comparative Social Surveys, 2004b. ESS Round 2, Norway [data set]. London: Centre for Comparative Social Surveys, City University London. [Viewed 30 November 2016]. Available from: https://www.europeansocialsurvey.org/data/download.html?r=2.
ESS ERIC Headquarters, Centre for Comparative Social Surveys, 2004c. ESS Round 2, Sweden [data set]. London: Centre for Comparative Social Surveys, City University London. [Viewed 30 November 2016]. Available from: https://www.europeansocialsurvey.org/data/download.html?r=2.
ESS ERIC Headquarters, Centre for Comparative Social Surveys, 2006a. ESS Round 3, Denmark [data set]. London: Centre for Comparative Social Surveys, City University London. [Viewed 24 November 2016]. Available from: https://www.europeansocialsurvey.org/data/download.html?r=3.
ESS ERIC Headquarters, Centre for Comparative Social Surveys, 2006b. ESS Round 3, Norway [data set]. London: Centre for Comparative Social Surveys, City University London. [Viewed 24 November 2016]. Available from: https://www.europeansocialsurvey.org/data/download.html?r=3.
ESS ERIC Headquarters, Centre for Comparative Social Surveys, 2006c. ESS Round 3, Sweden [data set]. London: Centre for Comparative Social Surveys, City University London. [Viewed 24 November 2016]. Available from: https://www.europeansocialsurvey.org/data/download.html?r=3.

Bibliography
257
ESS ERIC Headquarters, Centre for Comparative Social Surveys, 2008a. ESS Round 4, Denmark [data set]. London: Centre for Comparative Social Surveys, City University London. [Viewed 24 November 2016]. Available from: https://www.europeansocialsurvey.org/data/download.html?r=4.
ESS ERIC Headquarters, Centre for Comparative Social Surveys, 2008b. ESS Round 4, Norway [data set]. London: Centre for Comparative Social Surveys, City University London. [Viewed 24 November 2016]. Available from: https://www.europeansocialsurvey.org/data/download.html?r=4.
ESS ERIC Headquarters, Centre for Comparative Social Surveys, 2008c. ESS Round 4, Sweden [data set]. London: Centre for Comparative Social Surveys, City University London. [Viewed 24 November 2016]. Available from: https://www.europeansocialsurvey.org/data/download.html?r=4.
ESS ERIC Headquarters, Centre for Comparative Social Surveys, 2010a. ESS Round 5, Denmark [data set]. London: Centre for Comparative Social Surveys, City University London. [Viewed 30 November 2016]. Available from: https://www.europeansocialsurvey.org/data/download.html?r=5.
ESS ERIC Headquarters, Centre for Comparative Social Surveys, 2010b. ESS Round 5, Norway [data set]. London: Centre for Comparative Social Surveys, City University London. [Viewed 30 November 2016]. Available from: https://www.europeansocialsurvey.org/data/download.html?r=5.
ESS ERIC Headquarters, Centre for Comparative Social Surveys, 2010c. ESS Round 5, Sweden [data set]. London: Centre for Comparative Social Surveys, City University London. [Viewed 30 November 2016]. Available from: https://www.europeansocialsurvey.org/data/download.html?r=5.
ESS ERIC Headquarters, Centre for Comparative Social Surveys, 2012a. ESS Round 6, Denmark [data set]. London: Centre for Comparative Social Surveys, City University London. [Viewed 14 November 2016]. Available from: https://www.europeansocialsurvey.org/data/download.html?r=6.
ESS ERIC Headquarters, Centre for Comparative Social Surveys, 2012b. ESS Round 6, Norway [data set]. London: Centre for Comparative Social Surveys, City University London. [Viewed 14 November 2016]. Available from: https://www.europeansocialsurvey.org/data/download.html?r=6.
ESS ERIC Headquarters, Centre for Comparative Social Surveys, 2012c. ESS Round 6, Sweden [data set]. London: Centre for Comparative Social Surveys, City University London. [Viewed 14 November 2016]. Available from: https://www.europeansocialsurvey.org/data/download.html?r=6.
ESS ERIC Headquarters, Centre for Comparative Social Surveys, 2014a. ESS Round 7, Denmark [data set]. London: Centre for Comparative Social Surveys, City University London. [Viewed 30 November 2016]. Available from: https://www.europeansocialsurvey.org/data/download.html?r=7.
ESS ERIC Headquarters, Centre for Comparative Social Surveys, 2014b. ESS Round 7, Norway [data set]. London: Centre for Comparative Social Surveys, City University London. [Viewed 30 November 2016]. Available from: https://www.europeansocialsurvey.org/data/download.html?r=7.
ESS ERIC Headquarters, Centre for Comparative Social Surveys, 2014c. ESS Round 7, Sweden [data set]. London: Centre for Comparative Social Surveys, City University London. [Viewed 30 November 2016]. Available from: https://www.europeansocialsurvey.org/data/download.html?r=7.
ESS ERIC Headquarters, Centre for Comparative Social Surveys, 2016a. ESS Round 8, Denmark
Trust and Development: The Deep Structure of Institutions-Building and Socio-Economic Performance
258
[data set]. London: Centre for Comparative Social Surveys, City University London. [Viewed 3 May 2018]. Available from: https://www.europeansocialsurvey.org/data/download.html?r=8.
ESS ERIC Headquarters, Centre for Comparative Social Surveys, 2016b. ESS Round 8, Norway [data set]. London: Centre for Comparative Social Surveys, City University London. [Viewed 3 May 2018]. Available from: https://www.europeansocialsurvey.org/data/download.html?r=8.
ESS ERIC Headquarters, Centre for Comparative Social Surveys, 2016c. ESS Round 8, Sweden [data set]. London: Centre for Comparative Social Surveys, City University London. [Viewed 3 May 2018]. Available from: https://www.europeansocialsurvey.org/data/download.html?r=8.
European Commission, 2017a. European Innovation Scoreboard [online]. European Commission. [Viewed 9 December 2017]. Available from: http://ec.europa.eu/growth/industry/innovation/facts-figures/scoreboards_en.
European Commission, 2017b. Your Social Security Rights in Denmark [online], European Commission. [Viewed 25 January 2018]. Available from: http://ec.europa.eu/social/main.jsp?catId=1107&langId=en.
European Social Survey, 2002. ESS Round 1 Source Questionnaire. London: Centre for Comparative Social Surveys, City University London.
European Social Survey, 2004. ESS Round 2 Source Questionnaire. London: Centre for Comparative Social Surveys, City University London.
European Social Survey, 2006. ESS Round 3 Source Questionnaire. London: Centre for Comparative Social Surveys, City University London.
European Social Survey, 2008. ESS Round 4 Source Questionnaire. London: Centre for Comparative Social Surveys, City University London.
European Social Survey, 2010. ESS Round 5 Source Questionnaire. London: Centre for Comparative Social Surveys, City University London.
European Social Survey, 2012. ESS Round 6 Source Questionnaire. London: Centre for Comparative Social Surveys, City University London.
European Social Survey, 2014. ESS Round 7 Source Questionnaire. London: ESS ERIC Headquarters, Centre for Comparative Social Surveys, City University London.
European Social Survey, 2016. ESS Round 8 Source Questionnaire. London: ESS ERIC Headquarters c/o City University London.
Eurostat, ©2018. [online]. Eurostat. [Viewed 4 June 2018]. Available from: https://ec.europa.eu/eurostat.
EVS, 2011a. EVS - European Values Study 1981 - Integrated Dataset. GESIS Data Archive, Cologne. ZA4438 Data file Version 3.0.0, doi:10.4232/1.10791
EVS, 2011b. EVS - European Values Study 1990 - Integrated Dataset. GESIS Data Archive,

Bibliography
259
Cologne. ZA4460 Data file Version 3.0.0, doi:10.4232/1.10790
EVS, 2011c. EVS - European Values Study 1999 - Integrated Dataset. GESIS Data Archive, Cologne. ZA3811 Data file Version 3.0.0, doi:10.4232/1.10789
EVS, 2016. European Values Study 2008: Integrated Dataset (EVS 2008). GESIS Data Archive, Cologne. ZA4800 Data file Version 4.0.0, doi:10.4232/1.12458
Fahr, R., Irlenbusch, B., 2000. Fairness as a Constraint on Trust in Reciprocity: Earned Property Rights in a Reciprocal Exchange Experiment. Economics Letters, Vol. 66, No. 3, pp. 275-282.
Fairness, n.6., December 2013. In: OED Online. 3rd edition. Oxford: Oxford University Press. [Viewed 23 December 2018]. Available from: http://www.oed.com/view/Entry/67729?redirectedFrom=fairness#eid.
Fehr, E., Gächter, S., Kirchsteiger, G., 1997. Reciprocity as a Contract Enforcement Device: Experimental Evidence. Econometrica, Vol. 65, No. 4, pp. 833-860.
费孝通 [Fei, X.], [1947] 2017. 乡土中国 [Xiangtu Zhongguo]. Beijing: People’s Publishing House.
Fei, X., [1947] 1992. From the Soil: The Foundations of Chinese Society – A Translation of Fei Xiaotong’s Xiangtu Zhongguo, with an Introduaction and Epilogue by Gary G. Hamilton and Wang Zheng. Translated from Chinese by Gary G. Hamilton, Zheng Wang. Berkeley: University of California Press.
Fochesato, M., Bowles, S., 2015. Nordic Exceptionalism? Social Democratic Egalitarianism in World-Historic Perspective. Journal of Public Economics. Vol. 127, pp. 30-44.
Fox, J., Weisberg, S., 2011. An {R} Companion to Applied Regression, Second Edition. Thousand Oaks CA: Sage. URL: http://socserv.socsci.mcmaster.ca/jfox/Books/Companion.
Gambetta, D., 1988a. Foreword. In: Diego Gambetta, ed. Trust: Making and Breaking Cooperative Relations. Oxford: Basil Blackwell. pp. ix-xii.
Gambetta, D., 1988b. Can We Trust Trust? In: Diego Gambetta, ed. Trust: Making and Breaking Cooperative Relations. Oxford: Basil Blackwell. pp. 213-237.
Gardner, M., October 1970. Mathematical Games: The Fantastic Combinations of John Conway’s New Solitaire Game “Life”. Scientific American, Vol. 223, Issue 4, pp. 120-123.
葛道顺 [Ge, D.], 2016. 落户政策重在公共服务改革 [The Key Point of Hukou-Settling Policy lies in the Reform of Public Services]. People’s Daily. 13 January. p. 5.
General Office of the State Council of the People’s Republic of China, 1997a. Circular of the State Council on the Pilot Reform Plan of the Ministry of Public Security for the Household Residential Registration System in Small Cities and Towns and the Proposals on Improving the Household Residential Registration System in Rural Areas. Gazette of the State Council of the People’s Republic of China, No., 20 (1997), pp. 869.

Trust and Development: The Deep Structure of Institutions-Building and Socio-Economic Performance
260
General Office of the State Council of the People’s Republic of China, 1997b. Pilot Reform Plan for the Household Residential Registration System in Small Cities and Towns. Gazette of the State Council of the People’s Republic of China, No., 20 (1997), pp. 869-872.
General Office of the State Council of the People’s Republic of China, 1997c. Proposals on Improving the Household Residential Registration System in Rural Areas. Gazette of the State Council of the People’s Republic of China, No., 20 (1997), pp. 872-874.
Gilbert, N., 2008. Agent-Based Models. Series: Quantitative Applications in the Social Sciences. SAGE Publications, No.153.
Gilbert, N., Bankes, S., 2002. Platforms and Methods for Agent-Based Modeling. Proceedings of the National Academy of Sciences of the United States of America (PNAS), Vol. 99, No. suppl. 3, pp. 7197-7198.
Glaeser, E.L., Henderson, V., Inman, R.P., 2000a. The Future of Urban Research: Nonmarket Interactions [with Comments]. Brookings-Wharton Papers on Urban Affairs, pp. 101-149.
Glaeser, E.L., Laibson, D.I., Scheinkman, J.A., Soutter, C.L., 2000b. Measuring Trust. The Quarterly Journal of Economics, Vol. 115, No. 3, pp. 811-846.
Goffman, E., [1963] 1986. Stigma: Notes on the Management of Spoiled Identity. New York: Simon & Schuster, Inc.
Gowdy, J., Mazzucato, M., van den Bergh, J.C.J.M., van der Leeuw, S.E., Wilson, D.S., 2016. Shaping the Evolution of Complex Societies. In: Wilson, D.S., Kirman, A. (Eds.), Complexity and Evolution: Toward a New Synthesis for Economics. The MIT Press, Cambridge, Massachusetts/ London, England, pp.327-350.
Grabner-Kräuter, S., Kaluscha, E., 2003. Empirical Research in On-line Trust: A Review and Critical Assessment. International Journal of Human-Computer Studies, Vol. 58, No. 6, pp. 783-812.
Granovetter, M.S., 1973. The Strength of Weak Ties. American Journal of Sociology, Vol. 78, No. 6, pp. 1360-1380.
Granovetter, M., 1985. Economic Action and Social Structure: The Problem of Embeddedness. American Journal of Sociology, Vol. 91, No. 3, pp. 481-510.
Hardin, R., 1996. Trustworthiness. Ethics, Vol. 107, No. 1, pp. 26-42.
Hardin, R., 2003. Gaming Trust. In: Elinor Ostrom and James Walker (Eds), Trust and Reciprocity: Interdisciplinary Lessons for Experimental Research. New York: Russell Sage Foundation, pp. 80-101.
Harrell Jr., F.E., with contributions from Dupont, C. and many others, 2016. Hmisc: Harrell Miscellaneous. R package version 4.0-2. https://CRAN.R-project.org/package=Hmisc.
Hayek, F.A., [1960] 2011. The Constitution of Liberty: The Definitive Edition. In: Ronald Hamowy

Bibliography
261
(Ed.), The Collected Words of F.A. Hayek, Volume XVII. The University of Chicago Press, Chicago.
Heiss, F., 2016. Using R for Introductory Econometrics. CreateSpace. Companion website: http://www.URfIE.net.
Helliwell, J., Layard, R., Sachs, J., (Eds.) De Neve, J.-E., Huang, H., Wang, S., (Associate Eds.) 2017. World Happiness Report 2017 [online]. World Happiness Report. [Viewed 11 March 2019]. Available from: https://s3.amazonaws.com/happiness-report/2017/HR17.pdf.
Hilmer, C.E., Hilmer, M.J., 2014. Practical Econometrics: Data Collection, Analysis, and Application. McGraw-Hill Education, New York.
Hodgson, G.M., 2013. From Pleasure Machines to Moral Communities: An Evolutionary Economics without Homo Economicus. Chicago: The University of Chicago Press.
Inglehart, R., C. Haerpfer, A. Moreno, C. Welzel, K. Kizilova, J. Diez-Medrano, M. Lagos, P. Norris, E. Ponarin & B. Puranen et al. (Eds.). 2014a. World Values Survey: Round One - Country-Pooled Datafile Version: www.worldvaluessurvey.org/WVSDocumentationWV1.jsp. Madrid: JD Systems Institute.
Inglehart, R., C. Haerpfer, A. Moreno, C. Welzel, K. Kizilova, J. Diez-Medrano, M. Lagos, P. Norris, E. Ponarin & B. Puranen et al. (Eds.). 2014b. World Values Survey: Round Two - Country-Pooled Datafile Version: www.worldvaluessurvey.org/WVSDocumentationWV2.jsp. Madrid: JD Systems Institute.
Inglehart, R., C. Haerpfer, A. Moreno, C. Welzel, K. Kizilova, J. Diez-Medrano, M. Lagos, P. Norris, E. Ponarin & B. Puranen et al. (Eds.). 2014c. World Values Survey: Round Three - Country-Pooled Datafile Version: www.worldvaluessurvey.org/WVSDocumentationWV3.jsp. Madrid: JD Systems Institute.
Inglehart, R., C. Haerpfer, A. Moreno, C. Welzel, K. Kizilova, J. Diez-Medrano, M. Lagos, P. Norris, E. Ponarin & B. Puranen et al. (Eds.). 2014d. World Values Survey: Round Four - Country-Pooled Datafile Version: www.worldvaluessurvey.org/WVSDocumentationWV4.jsp. Madrid: JD Systems Institute.
Inglehart, R., C. Haerpfer, A. Moreno, C. Welzel, K. Kizilova, J. Diez-Medrano, M. Lagos, P. Norris, E. Ponarin & B. Puranen et al. (Eds.). 2014e. World Values Survey: Round Five - Country-Pooled Datafile Version: www.worldvaluessurvey.org/WVSDocumentationWV5.jsp. Madrid: JD Systems Institute.
Inglehart, R., C. Haerpfer, A. Moreno, C. Welzel, K. Kizilova, J. Diez-Medrano, M. Lagos, P. Norris, E. Ponarin & B. Puranen et al. (Eds.). 2014f. World Values Survey: Round Six - Country-Pooled Datafile Version: http://www.worldvaluessurvey.org/WVSDocumentationWV6.jsp. Madrid: JD Systems Institute.
International Labour Organization, ©2018. International Labour Organization. [Viewed 13 June 2018]. Available from: https://www.ilo.org/global/lang--en/index.htm.
Isaac, A.G., 2008. Simulating Evolutionary Games: A Python-Based Introduction. Journal of

Trust and Development: The Deep Structure of Institutions-Building and Socio-Economic Performance
262
Artificial Societies and Social Simulation. Vol. 11, No. 3 8 <http://jasss.soc.surrey.ac.uk/11/3/8.html>.
Jackson, M.O., 2008, Social and Economic Networks. Princeton: Princeton University Press.
Kant, I., [1785] 2002, Groundwork for the Metaphysics of Morals. Edited and translated by Allen W. Wood, New Haven and London: Yale University Press.
Kant, I., [1788] 1968. Kritik der praktischen Vernunft. Kants Werke Adakemie Textausgabe V, Berlin: Walter de Gruyter & Co.
Kant, I., [1788] 2002. Critique of Practical Reason. Translated by Werner S. Pluhar. Indianapolis / Cambridge: Hackett Publishing Company, Inc.
Kapp, K.W., 2011. The Foundations of Institutional Economics. Edited by Sebastian Berger and Rolf Steppacher. London and New York: Routledge.
Kim, S., 2015. ppcor: Partial and Semi-Partial (Part) Correlation. R package version 1.1. https://CRAN.R-project.org/package=ppcor.
Kim, W.-S., 2009. Effects of a Trust Mechanism on Complex Adaptive Supply Networks: An Agent-Based Social Simulation Study, The Journal of Artificial Societies and Social Simulation, 12 (3) 4, <http://jasss.soc.surrey.ac.uk/12/3/4.html>.
Kiyonari, T., Yamagishi, T., Cook, K.S., Cheshire, C., 2006. Does Trust Beget Trustworthiness? Trust and Trustworthiness in Two Games and Two Cultures: A Research Note. Social Psychology Quarterly, Vol. 69, No. 3, pp. 270-283.
Knack, S., Keefer, P., 1997. Does Social Capital Have an Economic Payoff? A Cross-Country Investigation. The Quarterly Journal of Economics, Vol.112, No.4, pp. 1251-1288.
Kosfeld, M., Heinrichs, M., Zak, P.J., Fischbacher, U., Fehr, E., 2005. Oxytocin Increases Trust in Humans. Nature, Vol. 435, No. 7042, pp. 673-676.
Ku, H.-M., 1898. Discourses and Sayings of Confucius: A New Special Translation, Illustrated with Quotations from Goethe and Other Writers. Shanghai: Kelly and Walsh Limited.
Kuhnle, S., 2000. The Scandinavian Welfare State in the 1990s: Challenged but Viable. West European Politics, Vol. 23, No. 2, pp. 209-228.
Kumlin, S., Rothstein, B., 2005. Making and Breaking Social Capital: The Impact of Welfare-State Institutions. Comparative Political Studies. 38. pp. 339-365.
La Porta, R., Lopez-de-Silanes, F., Shleifer, A., Vishny, R.W., 1997. Trust in Large Organizations. American Economic Review, Vol. 87, No. 2, pp. 333-338.
Leigh, A., 2006. Trust, Inequality and Ethnic Heterogeneity. The Economic Record, Vol. 82, No. 258, pp. 268-280.
Lewicki, R.J., Bunker, B.B., 1995. Trust in Relationships: A Model of Development and Decline.

Bibliography
263
In: B. B. Bunker, J. Z. Rubin, & Associates (Eds.), Conflict, Cooperation and Justice: Essays Inspired by the Work of Morton Deutsch. San Francisco: Jossey-Bass, pp. 133-173.
Lewis, J.D., Weigert, A., 1985. Trust as a Social Reality. Social Forces, Vol. 63, No. 4, pp. 967-985.
梁漱溟 [Liang, S.], [1921] 1999, 东西文化及其哲学 [The Eastern and Western Culture, and their Philosophy]. Beijing: The Commercial Press.
梁漱溟 [Liang, S.], [1949] 2005. 中国文化要义 [The Essence of Chinese Culture]. Shanghai: People’s Publishing house of Shanghai.
Liberman, N., Trope, Y., Stephan, E., 2008. Psychological Distance. In: Kruglanski, A.W. and Higgins, E.T. (Eds), Social Psychology: Handbook of Basic Principles, Vol. 2. New York, NY: Guilford Press, pp. 353-383.
Lim, S., Morshed, A.M., Khun, C., 2018. Trust and Macroeconomic Performance: A Two-Step Approach. Economic Modelling, Vol. 68, pp. 293-305.
Lin, N., 2002. Social Capital: A theory of Social Structure and Action. Cambridge: Cambridge University Press.
Lin, M.-W., Yu, C., 2014. Can Corruption Be Measured? Comparing Global Versus Local Perceptions of Corruption in East and Southeast Asia. Journal of Comparative Policy Analysis: Research and Practice, Vol. 16, No. 2., pp. 140-157.
Macy, M.W., Skvoretz, J., 1998. The Evolution of Trust and Cooperation between Strangers: A Computational Model. American Sociological Review, Vol.63, No.5, pp. 638-660.
Macy, M.W., Willer, R., 2002. From Factors to Actors: Computational Sociology and Agent-Based Modeling. Annual Review of Sociology, Vol. 28, pp. 143-166.
Mantzavinos, C., North, D.C., Shariq, S., 2004. Learning, Institutions, and Economic Performance. Perspectives on Politics, Vol. 2, No. 1, pp. 75-84.
Marx, K., [1867] 2011. Capital, Volume One: A Critique of Political Economy. Translated by Samuel Moore and Edward Aveling. Edited by Friedrich Engels. Mineola. New York: Dover Publications, Inc.
Mayer, R., Davis, J.H., Schoorman, F.D., 1995. An Integrative Model of Organizational Trust. Academy of Management Review, Vol. 20, No.3, pp. 709-734.
McAllister, D.J.,1995. Affect- and Cognition-Based Trust as Foundations for Interpersonal Cooperation in Organizations. The Academy of Management Journal, Vol. 38, No. 1, pp. 24-59.
McCullagh, P., 1980. Regression Models for Ordinal Data. Journal of the Royal Statistical Society. Series B (Methodological), Vol. 42, No. 2, pp. 109-142.
Mercer, 2017. The Melbourne Mercer Global Pension Index 2017 [online]. Mercer. [Viewed 3 February 2018]. Available from: https://australiancentre.com.au/projects/melbourne-mercer-global-pension-index/.

Trust and Development: The Deep Structure of Institutions-Building and Socio-Economic Performance
264
Midi, H., Sarkar, S.K., Rana, S., 2010. Collinearity Diagnostics of Binary Logistic Regression Model. Journal of Interdisciplinary Mathematics, Vol. 13, No. 3, pp. 253-267.
Ministry of Human Resources and Social Security of the People’s Republic of China, 2012. 中国
的社会保障 [Social Security in China] [online]. Central People’s Government of the People’s Republic of China. [Viewed 8 April 2018]. Available from: http://www.gov.cn/test/2012-04/20/content_2118401.htm#.
Ministry of Human Resources and Social Security of the People’s Republic of China, November 24th, 2017. 《中国社会保险发展年度报告 2016》发布 [China’s Social Security Development Annual Report 2016 Released] [online]. Ministry of Human Resources and Social Security of the People’s Republic of China. [Accessed 7 April 2018]. Available from: http://www.mohrss.gov.cn/SYrlzyhshbzb/dongtaixinwen/buneiyaowen/201711/t20171124_282237.html.
Nahapiet, J., Ghoshal, S., 1998. Social Capital, Intellectual Capital, and the Organizational Advantage. The Academy of Management Review, Nol. 23, No. 2, pp. 242-266.
National Bureau of Statistics of the People’s Republic of China, November 2nd, 2001a. 第四次全
国人口普查公报(第 1 号) [Gazette of the Fourth National Population Census (No. 1)] [online]. National Bureau of Statistics of the People’s Republic of China. [Viewed 10 May 2018]. Available from: http://www.stats.gov.cn/tjsj/tjgb/rkpcgb/qgrkpcgb/200204/t20020404_30320.html.
National Bureau of Statistics of the People’s Republic of China, May 15th, 2001b. 第五次全国人
口普查公报(第 1 号) [Gazette of the Fifth National Population Census (No. 1)] [online], National Bureau of Statistics of the People’s Republic of China. [Viewed 10 May 2018]. Available from: http://www.stats.gov.cn/tjsj/tjgb/rkpcgb/qgrkpcgb/200203/t20020331_30314.html.
National Bureau of Statistics of the People’s Republic of China (Compiled), 2009. China Statistical Yearbook – 2009 [online]. National Bureau of Statistics of the People’s Republic of China. [Viewed 4 June 2018]. Available from: http://www.stats.gov.cn/tjsj/ndsj/2009/indexch.htm.
National Bureau of Statistics of the People’s Republic of China (Compiled), 2010. China Statistical Yearbook – 2010 [online]. National Bureau of Statistics of the People’s Republic of China. [Viewed 4 June 2018]. Available from: http://www.stats.gov.cn/tjsj/ndsj/2010/indexch.htm.
National Bureau of Statistics of the People’s Republic of China, April 28th, 2011a. 2010 年第六次
全国人口普查主要数据公报(第 1 号)[Gazette of the Sixth National Population Census (No. 1)] [online], National Bureau of Statistics of the People’s Republic of China. [Viewed 10 May 2018]. Available from: http://www.stats.gov.cn/tjsj/tjgb/rkpcgb/qgrkpcgb/201104/t20110428_30327.html.
National Bureau of Statistics of the People’s Republic of China (Compiled), 2011b. China Statistical Yearbook – 2011 [online]. National Bureau of Statistics of the People’s Republic of China. [Viewed 4 June 2018]. Available from: http://www.stats.gov.cn/tjsj/ndsj/2011/indexch.htm.
National Bureau of Statistics of the People’s Republic of China (Compiled), 2012. China Statistical Yearbook – 2012 [online]. National Bureau of Statistics of the People’s Republic of China. [Viewed 4 June 2018]. Available from: http://www.stats.gov.cn/tjsj/ndsj/2012/indexch.htm.

Bibliography
265
National Bureau of Statistics of the People’s Republic of China (Compiled), 2013. China Statistical Yearbook – 2013 [online]. National Bureau of Statistics of the People’s Republic of China. [Viewed 4 June 2018]. Available from: http://www.stats.gov.cn/tjsj/ndsj/2013/indexch.htm.
National Bureau of Statistics of the People’s Republic of China (Compiled), 2014. China Statistical Yearbook – 2014 [online]. National Bureau of Statistics of the People’s Republic of China. [Viewed 4 June 2018]. Available from: http://www.stats.gov.cn/tjsj/ndsj/2014/indexch.htm.
National Bureau of Statistics of the People’s Republic of China (Compiled), 2015. China Statistical Yearbook – 2015 [online]. National Bureau of Statistics of the People’s Republic of China. [Viewed 4 June 2018]. Available from: http://www.stats.gov.cn/tjsj/ndsj/2015/indexch.htm.
National Bureau of Statistics of the People’s Republic of China (Compiled), 2016. China Statistical Yearbook – 2016 [online]. National Bureau of Statistics of the People’s Republic of China. [Viewed 4 June 2018]. Available from: http://www.stats.gov.cn/tjsj/ndsj/2016/indexch.htm.
National Bureau of Statistics of the People’s Republic of China (Compiled), 2017. China Statistical Yearbook – 2017. Beijing: China Statistics Press.
National Bureau of Statistics of the People’s Republic of China, April 17th, 2018a. 一季度国民经
济实现良好开局 [A Good Start of the National Economy Achieved in the First Quarter] [online]. National Bureau of Statistics of the People’s Republic of China. [Viewed 22 April 2018]. Available from: http://www.stats.gov.cn/tjsj/zxfb/201804/t20180417_1594310.html.
National Bureau of Statistics of the People’s Republic of China, April 17th, 2018b. 国家发展改革
委副主任、国家统计局局长宁吉喆就发布城镇调查失业率有关问题答记者问 [Ning Jizhe, the Deputy Director of the National Development and Reform Commission and Director General of the National Bureau of Statistics, Answers Questions from Reporters on Releasing the Surveyed Urban Unemployment Rate] [online]. National Bureau of Statistics of the People’s Republic of China. [Viewed 22 April 2018]. Available from: http://www.stats.gov.cn/tjsj/sjjd/201804/t20180417_1594334.html.
National Bureau of Statistics of the People’s Republic of China, no date. National Bureau of Statistics of the People’s Republic of China. [View 22 April 2018]. Available from: http://data.stats.gov.cn/easyquery.htm?cn=C01&zb=A040N&sj=2016.
National Survey Research Center at Renmin University of China, 2010a.中国综合社会调查
(CGSS)2010 年度调查问卷(居民问卷)[Chinese General Social Survey (CGSS) 2010 Annual Questionnaire (Family)] [online]. Chinese National Survey Data Archive. [Viewed 28 February 2019]. Available from: http://cnsda.ruc.edu.cn/index.php?r=projects/view&id=15553986.
National Survey Research Center at Renmin University of China, 2010b. 中国综合社会调查 2010原始数据(stata14.0 以下版本) [Chinese General Social Survey 2010 Original Data (For Stata Version Earlier Than Stata 14.0)] [Data set]. Chinese National Survey Data Archive. [Viewed 18 March 2019]. Available from: http://cnsda.ruc.edu.cn/index.php?r=projects/view&id=15553986.
National Survey Research Center at Renmin University of China, 2011a. 2011 年中国社会调查调
查 B 卷 [Chinese General Social Survey (CGSS) 2011 Annual Questionnaire B] [online]. Chinese National Survey Data Archive. [Viewed 28 February 2019]. Available from:
Trust and Development: The Deep Structure of Institutions-Building and Socio-Economic Performance
266
http://cnsda.ruc.edu.cn/index.php?r=projects/view&id=12791319.
National Survey Research Center at Renmin University of China, 2011b. 中国综合社会调查 2011原始数据(stata14.0 以下版本)[Chinese General Social Survey 2011 Original Data (For Stata Version Earlier Than Stata 14.0)] [Data set]. Chinese National Survey Data Archive. [Viewed 18 March 2019]. Available from: http://cnsda.ruc.edu.cn/index.php?r=projects/view&id=12791319.
National Survey Research Center at Renmin University of China, 2012a.中国综合社会调查
(CGSS)2012 年度调查问卷(居民问卷)A 卷 [Chinese General Social Survey (CGSS) 2012 Annual Questionnaire (Family A)] [online]. Chinese National Survey Data Archive. [Viewed 28 February 2019]. Available from: http://cnsda.ruc.edu.cn/index.php?r=projects/view&id=85111874.
National Survey Research Center at Renmin University of China, 2012b.中国综合社会调查
(CGSS)2012 年度调查问卷(居民问卷)B 卷 [Chinese General Social Survey (CGSS) 2012 Annual Questionnaire (Family B)] [online]. Chinese National Survey Data Archive. [Viewed 28 February 2019]. Available from: http://cnsda.ruc.edu.cn/index.php?r=projects/view&id=85111874.
National Survey Research Center at Renmin University of China, 2012c. 中国综合社会调查 2012原始数据(stata14.0 以下版本) [Chinese General Social Survey 2012 Original Data (For Stata Version Earlier Than Stata 14.0)] [Data set]. Chinese National Survey Data Archive. [Viewed 18 March 2019]. Available from: http://cnsda.ruc.edu.cn/index.php?r=projects/view&id=85111874.
National Survey Research Center at Renmin University of China, 2013a.中国综合社会调查
(CGSS)2013 年度调查问卷(居民问卷)A 卷 [Chinese General Social Survey (CGSS) 2013 Annual Questionnaire (Family A)] [online]. Chinese National Survey Data Archive. [Viewed 28 February 2019]. Available from: http://cnsda.ruc.edu.cn/index.php?r=projects/view&id=93281139.
National Survey Research Center at Renmin University of China, 2013b.中国综合社会调查
(CGSS)2013 年度调查问卷(居民问卷)B 卷 [Chinese General Social Survey (CGSS) 2013 Annual Questionnaire (Family B)] [online]. Chinese National Survey Data Archive. [Viewed 28 February 2019]. Available from: http://cnsda.ruc.edu.cn/index.php?r=projects/view&id=93281139.
National Survey Research Center at Renmin University of China, 2013c. 中国综合社会调查 2013原始数据(stata14.0 以下版本)[Chinese General Social Survey 2013 Original Data (For Stata Version Earlier Than Stata 14.0)] [Data set]. Chinese National Survey Data Archive. [Viewed 28 February 2019]. Available from: http://cnsda.ruc.edu.cn/index.php?r=projects/view&id=93281139.
National Survey Research Center at Renmin University of China, 2015a.中国综合社会调查
(CGSS)2015 年度调查问卷(居民问卷)[Chinese General Social Survey (CGSS) 2015 Annual Questionnaire (Family)] [online]. Chinese National Survey Data Archive. [Viewed 18 March 2019]. Available from:http://cnsda.ruc.edu.cn/index.php?r=projects/view&id=62072446.
National Survey Research Center at Renmin University of China, 2015b. 中国综合社会调查 2015原始数据(stata14.0 以下版本) [Chinese General Social Survey 2015 Original Data (For Stata Version Earlier Than Stata 14.0)] [Data set]. Chinese National Survey Data Archive. [Viewed 18 March 2019]. Available from: http://cnsda.ruc.edu.cn/index.php?r=projects/view&id=62072446.
National Survey Research Center (NSRC) at Renmin University of China, ©2019. Chinese General

Bibliography
267
Social Survey – Digital Chronicle of Chinese Social Change [online]. Chinese General Social Survey. [Viewed 24 March 2019]. Available from: http://cgss.ruc.edu.cn/index.php?r=index/index&hl=en.
Newman, M.E.J., 2004. Analysis of Weighted Networks. Physical Review E 70, 056131.
Niazi, M., Hussain, A., 2011. Agent-based Computing from Multi-agent Systems to Agent-based Models: A Visual Survey. Scientometrics, Vol. 89, No. 2, pp. 479-499.
Nikolai, C., Madey, G., 2009. Tools of the Trade: A Survey of Various Agent Based Modeling Platforms. Journal of Artificial Societies and Social Simulation, Vol. 12, No. 2 2 <http://jasss.soc.surrey.ac.uk/12/2/2.html>.
Nooteboom, B., 2002. Trust: Forms, Foundations, Functions, Failures and Figures. Cheltenham, UK and Northampton, MA, USA: Edward Elgar.
Nordic Co-operation, no date a. Facts about the Nordic Countries [online]. Nordic Co-operation. [Viewed 5 March 2019]. Available from: https://www.norden.org/en/information/facts-about-nordic-countries.
Nordic Co-operation, no date b. Social Policy and Welfare [online]. Nordic Co-operation. [Viewed 5 March 2019]. Available from: https://www.norden.org/en/information/social-policy-and-welfare.
Norman, G., 2010. Likert Scales, Levels of Measurement and the “Laws” of Statistics. Advances in Health Sciences Education, Vol. 15, No. 5, pp. 625-632.
North, D.C., 1990. Institutions, Institutional Change and Economic Performance. Cambridge, UK: Cambridge University Press.
North, D.C., Summerhill, W., Weingast, B.R., 2000. Order, Disorder and Economic Change: Latin America vs. North America. In: Bruce Bueno de Mesquita and Hilton Root (Eds.), Governing for Prosperity. New Haven, CT: Yale University Press. pp. 17-58.
Norway. Stortinget [Parliament], 2018. The Constitution [online]. Stortinget. [Viewed 1 June 2018]. Available from: https://www.stortinget.no/globalassets/pdf/english/constitutionenglish.pdf.
Norwegian Ministry of Labour and Social Affairs, January 2017. The Norwegian Social Insurance Scheme 2017, https://www.regjeringen.no/en/dokumenter/the-norwegian-social-insurance-scheme-2017/id2478621/. Accessed on January 28th, 2018.
OECD, 2017. Pensions at a Glance 2017: Country Profiles – Denmark, http://www.oecd.org/els/public-pensions/PAG2017-country-profile-Denmark.pdf. Accessed on May 17th, 2018.
Office of the Sixth National Population Census of the State Council of the People’s Republic of China, Department of Population and Employment Statistics of the National Bureau of Statistics (Compiled), 2011. Major Figures on 2010 Population Census of China. Beijing: China Statistics Press.

Trust and Development: The Deep Structure of Institutions-Building and Socio-Economic Performance
268
Ostrom, E., 1999.Social Capital: A Fad or a Fundamental Concept? In: Dasgupta, P., Serageldin, I., (Eds) Social Capital: A Multifaceted Perspective. The World Bank, pp. 172-214.
Ostrom, E., 2003. Toward a Behavioral Theory Linking Trust, Reciprocity, and Reputation. In: Elinor Ostrom and James Walker (Eds), Trust and Reciprocity: Interdisciplinary Lessons for Experimental Research. New York: Russell Sage Foundation, pp. 19-79.
Ostrom, E., Ahn, T.K., 2009. The Meaning of Social Capital and Its Link to Collective Action. In: Gert Tinggaard Svendsen and Gunnar Lind Haase Svendsen (Eds), Handbook of Social Capital: The Troika of Sociology, Political Science and Economics. Cheltenham, UK, Northampton, MA, USA: Edward Elgar, pp. 17-35.
Park, R.E., 1924. The Concept of Social Distance as Applied to the Study of Racial Attitudes and Racial Relations, Journal of Applied Sociology. Vol. 8, pp. 339-344. Also available on: https://brocku.ca/MeadProject/Park/Park_1924.html, accessed on December 6th, 2018.
Pedersen, A.W., Kuhnle, S., 2017. The Nordic Welfare State Model. In: Knutsen, Oddbjørn P. (Ed.), The Nordic Models in Political Science: Challenged, but Still Viable? pp. 219-238. Bergen: Fagbokforlaget, 2017. (ISBN 978-82-450-2175-2)
Peiró-Palomino, J., Tortosa-Ausina, E., 2013. Can trust effects on development be generalized? A response by quantile. European Journal of Political Economy. Vol.32, pp. 377-390.
People’s Government of Beijing Municipality, 2016. 北京市积分落户管理办法(试行)[The Administrative Measures of the Point-based Household Registration of Beijing (For Trial Implementation)] [online]. The People’s Government of Beijing Municipality. [Viewed 18 March 2019]. Available from: http://www.beijing.gov.cn/zhengce/wenjian/192/33/50/438650/79206/index.html.
People’s Republic of China. Government Administration Council of the Central People’s Government, 1953. 中央人民政府政务院关于实行粮食的计划收购和计划供应的命令 [Order of the Government Administration Council of the Central People’s Government about the Planned Purchasing and Planned Provision of Grain] [online]. News of the Communist Party of China. [Viewed 5 March 2019]. Available from: http://cpc.people.com.cn/GB/64184/64186/66658/4492870.html#.
People’s Republic of China. Ministry of Public Security, 2004. 关于废止部分部门规章的决定 [Decision on Abolishing Some Departmental Rules] [online]. Ministry of Public Security of the People’s Republic of China. [Viewed 5 March 2019]. Available from: http://www.mps.gov.cn/n2254314/n2254409/n2254443/n2254452/c3708293/content.html.
People’s Republic of China. Government Administration Council of the Central People’s Government, 1953. 中华人民共和国劳动保险条例 [Labor Insurance Regulation of the People’s Republic of China] [online]. Database of Laws and Regulations of the People’s Republic of China. [Viewed 3 June 2018]. Available from: http://search.chinalaw.gov.cn/law/searchTitleDetail?LawID=334760&Query=%E5%8A%B3%E5%8A%A8%E4%BF%9D%E9%99%A9%E6%9D%A1%E4%BE%8B&IsExact=.

Bibliography
269
People’s Republic of China. Standing Committee of the National People’s Congress, 1958. 中华人
民共和国户口登记条例 [Hukou Registration Ordinance of the People’s Republic of China] [online]. National People’s Congress of the People’s Republic of China. [Viewed 20 September 2017]. Available from: http://www.npc.gov.cn/wxzl/gongbao/2000-12/10/content_5004332.htm.
People’s Republic of China. Standing Committee of the National People’s Congress, December 29th, 2001. 中华人民共和国人口与计划生育法 [Law of Population and Family Planning of the People’s Republic of China] [online]. Central People’s Government of the People’s Republic of China. [Viewed 9 May 2018]. Available from: http://www.gov.cn/banshi/2005-08/21/content_25059.htm.
People’s Republic of China. Standing Committee of the National People’s Congress, October 28th, 2010. 中华人民共和国社会保险法 [Social Insurance Law of the People’s Republic of China] [online]. State Council of the People’s Republic of China. [Viewed 30 January 2018]. Available from: http://www.gov.cn/zxft/ft209/content_1748773.htm.
People’s Republic of China. State Council, July 8th, 1971. 国务院转发卫生部军管会、商业部、
燃料化学部“关于做好计划生育工作的报告” [The State Council Forwards the “Report on Doing the Work of Family Planning Well” of the Ministry of Health, the Ministry of Commerce and the Ministry of Fuel and Chemistry] [online]. State Council of the People’s Republic of China. [Viewed 9 May 2018]. Available from: http://www.gov.cn/zhengce/content/2015-11/19/content_10304.htm#.
People’s Republic of China. State Council, 1997. Circular of the State Council on the Pilot Reform Plan of the Ministry of Public Security for the Household Residential Registration System in Small Cities and Towns and the Proposals on Improving the Household Residential Registration System in Rural Areas [online]. In: General Office of the State Council of People’s Republic of China (ed.), Gazette of the State Council of the People’ Republic of China. Issue No. 20. Beijing: General Office of the State Council of the People’s Republic of China. pp. 869-874. [Viewed 5 March 2019]. Available from: http://www.gov.cn/gongbao/shuju/1997/gwyb199720.pdf.
People’s Republic of China. State Council, 2014. 国务院关于进一步推进户籍制度改革的意见[Guideline of the State Council on Further Accelerating Huji System Reform] [online]. State Council of the People’s Republic of China. [Viewed 5 March 2019]. Available from: http://www.gov.cn/zhengce/content/2014-07/30/content_8944.htm.
People.cn, July 29th, 2015. 从人民日报历史数据看我国生育政策演变史 [Looking at the Evolution of the Fertility Policy of Our Country from the Historical Data of the People’s Daily] [online]. People.cn. [Viewed 9 May 2018]. Available from: http://politics.people.com.cn/n/2015/0729/c1001-27375674.html.
Peterson, B., Harrell Jr., F.E., 1990. Partial Proportional Odds Models for Ordinal Response Variables. Journal of the Royal Statistical Society. Series C (Applied Statistics), Vol. 39, No. 2, pp. 205-217.
Popper, M., 2013. Social Trust, Norms and Morality. Human Affairs, Vol. 23, No. 3, pp. 443-457.
Population Census Office under the State Council, Department of Population and Employment Statistics National Bureau of Statistics (Compiled), 2012. Tabulation on the 2010 Population Census

Trust and Development: The Deep Structure of Institutions-Building and Socio-Economic Performance
270
of the People’s Republic of China (Book I, Book II, Book III). China Statistics Press: Beijing.
Posner, R.A., 1997. Social Norms and the Law: An Economic Approach. The American Economic Review, Vol. 87, No. 2, Papers and Proceedings of the Hundred and Fourth Annual Meeting of the American Economic Association, pp. 365-369.
Putnam, R.D., 2000. Bowling Alone: The Collapse and Revival of American Community. New York: Simon & Schuster Paperbacks.
Putnam, R., Leonardi, R., Nanetti, R.Y., 1993. Making Democracy Work: Civic Traditions in Modern Italy. Princeton, New Jersey: Princeton University Press.
R Core Team, 2016. foreign: Read Data Stored by Minitab, S, SAS, SPSS, Stata, Systat, Weka, dBase, …. R package version 0.8-67. https://CRAN.R-project.org/package=foreign.
R Core Team, 2017. R: A Language and Environment for Statistical Computing. R Foundation for Statistical Computing, Vienna, Austria. URL https://www.R-project.org/.
Ray, J.L., 2003. Explaining Interstate Conflict and War: What Should Be Controlled for? Conflict Management and Peace Science, Vol. 20, No. 2, pp. 1-31.
Rotenberg, K.J., 1995. The Socialisation of Trust: Parents’ and Children’s Interpersonal Trust. International Journal of Behavioral Development, Vol. 18, No. 4, pp. 713-726.
Roth, F., 2009. Does Too Much Trust Hamper Economic Growth? KYKLOS, Vol. 62, No. 1, pp. 103-128.
Rothstein, B., Uslaner, E.M., 2005. All for All: Equality, Corruption, and Social Trust. World Politics, Vol. 58, No. 1, pp. 41-72.
Rousseau, D.M., Sitkin, S.B., Burt, R.S., Camerer, C., 1998. Not so Different after All: A Cross-Discipline View of Trust. The Academy of Management Review, Vol. 23, No. 3, pp. 393-404.
Roussey, L., Deffains, B., 2012. Trust in Judicial Institutions: An Empirical Approach. Journal of Institutional Economics, Vol. 8, No. 3, pp. 351-369.
Sabel, C.F., 1993. Studied Trust: Building New Forms of Cooperation in a Volatile Economy. Human Relations, Vol. 46, No. 9, pp. 1133-1170.
Sako, M., Helper, S., 1998. Determinants of Trust in Supplier Relations: Evidence from the Automotive Industry in Japan and the United States. Journal of Economic Behavior & Organization, Vol. 34, No. 3, pp. 387-417.
Sapienza, P., Toldra-Simats, A., Zingales, L., 2013. Understanding trust. The Economic Journal, Vol. 123, No. 573, pp. 1313-1332.
Sapienza, P., Zingales, L., 2012. A Trust Crisis. International Review of Finance, Vol. 12, No. 2, pp. 123-131.
Schelling, T.C., 1971. Dynamic Models of Segregation. The Journal of Mathematical Sociology,

Bibliography
271
Vol.1, No.2, pp. 143-186.
Schlegel, B., Steenbergen, M., 2018. brant: Test for Parallel Regression Assumption. R package version 0.2-0. https://CRAN.R-project.org/package=brant.
Seltzer, N., Smirnov, O., 2015. Degrees of Separation, Social Learning, and the Evolution of Cooperation in a Small-World Network. The Journal of Artificial Societies and Social Simulation, 18(4)12, <http://jasss.soc.surrey.ac.uk/18/4/12.html>.
Slovic, P., 1993. Perceived Risk, Trust, and Democracy. Risk Analysis, Vol.13, No.6, pp.675-682.
Smith, A., [1759] 1966. The Theory of Moral Sentiments. New York: Augustus M. Kelley.
Socialization, n.1., September 2009. In: OED Online. 3rd edition. Oxford: Oxford University Press. [Viewed 29 June 2018]. Available from: http://www.oed.com/view/Entry/183747?redirectedFrom=socialization#eid.
Solow, R.M., 1999. Notes on Social Capital and Economic Performance. In: Dasgupta, P., Serageldin, I., (Eds) Social Capital: A Multifaceted Perspective. The World Bank, pp.6-10.
Strand, S., Cadwallader, S., Firth, D., 2011. Using Statistical Regression Methods in Education Research [online]. ReStore. [Viewed 30 December 2017]. http://www.restore.ac.uk/srme/www/fac/soc/wie/research-new/srme/index.html.
Statistics Denmark, ©2017. Statistics Denmark. [Viewed 14 September 2017]. Available from: https://www.dst.dk/en.
Statistics Denmark, 2017a. Immigrants and Their Descendants [online]. Statistics Denmark. [Viewed 14 September 2017]. Available from: http://www.dst.dk/en/Statistik/emner/befolkning-og-valg/indvandrere-og-efterkommere.
Statistics Denmark, 2017b. Population and Population Projections [online]. Statistics Denmark. [Viewed 14 September 2017]. Available from: http://www.dst.dk/en/Statistik/emner/befolkning-og-valg/befolkning-og-befolkningsfremskrivning.
Statistics Norway, ©2017. Statistics Norway. [Viewed 23 September 2017]. Available from: http://www.ssb.no/en/beftett.
Statistics Norway, 2016. This is Norway 2016: What the Figures Say [online]. Statistics Norway. [Viewed on September 23rd, 2017]. Available from: https://www.ssb.no/en/befolkning/artikler-og-publikasjoner/_attachment/277893?_ts=15709f114e8.
Statistics Norway, 2017a. Attitudes towards Immigrants and Immigration [online]. Statistics Norway. [Viewed 23 September 2017]. Available from: http://www.ssb.no/en/befolkning/statistikker/innvhold.
Statistics Norway, 2017b. Church of Norway [online]. Statistics Norway. [Viewed 24 September 2017]. Available from: http://www.ssb.no/en/kultur-og-fritid/statistikker/kirke_kostra.
Statistics Norway, 2017c. Immigrants and Norwegian-Born to Immigrant Parents [online]. Statistics
Trust and Development: The Deep Structure of Institutions-Building and Socio-Economic Performance
272
Norway. [Viewed 24 September 2017]. Available from: http://www.ssb.no/en/befolkning/statistikker/innvbef.
Statistics Norway, 2017d. Migration [online]. Statistics Norway. [Viewed 24 September 2017]. Available from: http://www.ssb.no/en/befolkning/statistikker/flytting.
Statistics Norway, 2017e. Persons with Refugee Background [online]. Statistics Norway. [Viewed 24 September 2017]. Available from: http://www.ssb.no/en/befolkning/statistikker/flyktninger.
Statistics Norway, 2017f. Population. [online]. Statistics Norway. [Viewed 24 September 2017]. Available from: https://www.ssb.no/en/befolkning/statistikker/folkemengde.
Statistics Norway, 2017g. Religious Communities and Life Stance Communities [online]. Statistics Norway. [Viewed 24 September 2017]. Available from: http://www.ssb.no/en/kultur-og-fritid/statistikker/trosamf.
Statistics Sweden, ©2017. Statistics Sweden. [Viewed 25 September 2017]. Available from: http://www.scb.se/.
Statistics Sweden, 2017a. Domestic Migration by Type, Age and Sex [online]. Statistics Sweden. [Viewed 25 September 2017]. Available from: http://www.statistikdatabasen.scb.se/pxweb/en/ssd/START__BE__BE0101__BE0101J/FlyttningarInrk/table/tableViewLayout1/?rxid=9019098f-3479-4f4b-9667-5b485f8ec03c.
Statistics Sweden, 2017b. Immigrations and Emigrations by Country of Birth and Sex [online]. Statistics Sweden. [Viewed 25 September 2017]. Available from: http://www.statistikdatabasen.scb.se/pxweb/en/ssd/START__BE__BE0101__BE0101J/ImmiEmiFod/table/tableViewLayout1/?rxid=4ed61111-087a-4cfc-8a8d-611153e0403e.
Stolle, D., Nishikawa, L., 2011. Trusting Others – How Parents Shape the Generalized Trust of Their Children. Comparative Sociology, Vol. 10, No. 2, pp. 281-314.
Svendsen, G.L.H., Svendsen, G.T., 2016. How did Trade Norms Evolve in Scandinavia? Long-Distance Trade and Social Trust in the Viking Age. Economic Systems, Vol. 40, No. 2, pp. 198-205.
Sweden. Sveriges Riksdag [Swedish Parliament], 2016. The Constitution of Sweden: The Fundamental Laws and the Riksdag Act 2016 [online]. Sveriges Riksdag. [Viewed 14 January 2018]. Available from: http://www.riksdagen.se/globalassets/07.-dokument--lagar/the-constitution-of-sweden-160628.pdf.
Tesfatsion, L., Judd, K.L. (Eds.), 2006. Handbook of Computational Economics Volume 2: Agent-Based Computational Economics. Amsterdam: Elsevier.
Transparency International, 2017. Corruption Perceptions Index 2017: Technical Methodology Note [online]. Transparency International. [Viewed on April 18th, 2018]. Available from: https://www.transparency.org/news/feature/corruption_perceptions_index_2017.
Trust, no date. In: OED Online. Oxford: Oxford University Press. [Viewed 12 April 2018]. Available from: http://www.oed.com/search?searchType=dictionary&q=trust&_searchBtn=Search.

Bibliography
273
Trust, n., December 2015. In: OED Online. 3rd edition. Oxford: Oxford University Press. [Viewed 12 April 2018]. Available from: http://www.oed.com/view/Entry/207004?rskey=emjAC6&result=1#eid.
Uslaner, E.M., 2000. Producing and Consuming Trust. Political Science Quarterly, Vol. 115, No. 4, pp. 569-590.
Uslaner, E.M., 2002. The Moral Foundations of Trust. Cambridge, United Kingdom: Cambridge University Press.
Uslaner, E.M., 2005. Trust and Corruption. In: Johann Graf Lambsdorff, Markus Taube and Matthias Schramm (Eds.), The New Institutional Economics of Corruption. London: Routledge, pp. 76-92.
Uslaner, E.M., 2013. Trust and Corruption Revisited: How and Why Trust and Corruption Shape Each Other. Quality & Quantity. Vol. 47, No. 6, pp. 3603-3608.
Uzzi, B., 1997. Social Structure and Competition in Interfirm Networks: The Paradox of Embeddedness. Administrative Science Quarterly, Vol. 42, No. 1, pp. 35-67.
Value, n.II.6.d. September 2011. In: OED Online. 3rd edition. Oxford: Oxford University Press. [Viewed 24 June 2018]. Available from: http://www.oed.com/view/Entry/221253?rskey=BJaGF0&result=1#eid.
Veblen, T., 1898. Why is Economics not an Evolutionary Science? The Quarterly Journal of Economics, Vol. 12, No. 4, pp. 373-397.
Veblen, T., [1899] 2005. The Theory of the Leisure Class: An Economic Study of Institutions. Delhi: Aakar Books.
Venables, W.N., Ripley, B.D., 2002. Modern Applied Statistics with S. Fourth Edition. Springer, New York. ISBN 0-387-95457-0.
Watts, D.J., Strogatz, S.H., 1998, Collective Dynamics of ‘Small-World’ Networks. Nature, Vol. 393, pp. 440-442.
Wäckerle, M., Rengs, B., Radax, W., 2014. An Agent-Based Model of Institutional Life-Cycles. Games, Vol.5, No.3, pp.160-187.
Weber, M., [1930] 2005. The Protestant Ethic and the Spirit of Capitalism. London and New York: Routledge, Taylor & Francis Group. Translated by Talcott Parsons. With an introduction by Anthony Giddens.
Whiteley, P.F., 2000. Economic Growth and Social Capital. Political Studies, Vol. 48, No. 3, pp. 443-466.
Wickham, H., 2007. Reshaping Data with the Reshape Package. Journal of Statistical Software, Vol. 21, No. 12.
Williams, R., 2006. Generalized Ordered Logit / Partial Proportional Odds Models for Ordinal Dependent Variables. The Stata Journal. Vol. 6, No. 1, pp. 58-82.

Trust and Development: The Deep Structure of Institutions-Building and Socio-Economic Performance
274
Williamson, O.E., 1993. Calculativeness, Trust, and Economic Organization. The Journal of Law & Economics, Vol. 36, No. 1, Part 2, John M. Olin Centennial Conference in Law and Economics at the University of Chicago, pp. 453-486.
Wooldridge, J.M., 2002. Econometric Analysis of Cross Section and Panel Data. The MIT Press, Cambridge, Massachusetts, London, England.
World Bank Group, ©2018. The World Bank. [Viewed 11 June 2018]. Available from: https://www.worldbank.org/.
World Economic Forum, 23 November, 2006. The Global Gender Gap Report 2006. https://www.weforum.org/reports/global-gender-gap-report-2006. Accessed on March 27th, 2018.
World Economic Forum, 2007. The Global Gender Gap Report 2007. http://www3.weforum.org/docs/WEF_GenderGap_Report_2007.pdf. Accessed on March 27th, 2018.
World Economic Forum, 1 June, 2009. The Global Gender Gap Report 2008. https://www.weforum.org/reports/global-gender-gap-report-2008. Accessed on March 27th, 2018.
World Economic Forum, 23 June, 2011a. The Global Gender Gap Report 2009. https://www.weforum.org/reports/global-gender-gap-report-2009. Accessed on March 27th, 2018.
World Economic Forum, 2011b. The Global Gender Gap Report 2011. http://reports.weforum.org/global-gender-gap-2011/. Accessed on March 27th, 2018.
World Economic Forum, 12 October, 2010. The Global Gender Gap Report 2010. https://www.weforum.org/reports/the-global-gender-gap-report-2010. Accessed on March 27th, 2018.
World Economic Forum, 22 October, 2012. The Global Gender Gap Report 2012. https://www.weforum.org/reports/global-gender-gap-report-2012. Accessed on March 27th, 2018.
World Economic Forum, 20 October, 2013. The Global Gender Gap Report 2013. https://www.weforum.org/reports/global-gender-gap-report-2013. Accessed on March 27th, 2018.
World Economic Forum, 20 October, 2014. The Global Gender Gap Report 2014. https://www.weforum.org/reports/global-gender-gap-report-2014. Accessed on March 27th, 2018.
World Economic Forum, 19 November, 2015. The Global Gender Gap Report 2015. https://www.weforum.org/reports/global-gender-gap-report-2015. Accessed on March 27th, 2018
World Economic Forum, 26 October, 2016. The Global Gender Gap Report 2016. https://www.weforum.org/reports/the-global-gender-gap-report-2016. Accessed on March 27th, 2018.
World Economic Forum, 2 November, 2017. The Global Gender Gap Report 2017. https://www.weforum.org/reports/the-global-gender-gap-report-2017. Accessed on March 25th, 2018.

Bibliography
275
Xenophon, [Approx. 362 BC] 1897. Oeconomicus [The Economist] [online]. Translated by H.G. Dakyns as “The Economist”, in: The Works of Xenophon. London: Macmillan and Co. [Viewed 28 November 2018]. Available from: https://web.archive.org/web/20081007062158/http://etext.library.adelaide.edu.au:80/x/xenophon/x5oe/,
Yamagishi, T., Yamagishi, M., 1994. Trust and Commitment in the United States and Japan. Motivation and Emotion, Vol. 18, No. 2, pp. 129-166.
Yee, T.W., 2017. VGAM: Vector Generalized Linear and Additive Models. R package version 1.0-3. URL https://CRAN.R-project.org/package=VGAM.
You, J.-S., 2012. Social Trust: Fairness Matters More Than Homogeneity. Political Psychology, Vol. 33, No. 5, pp. 701-721.
Zak, P.J., Knack, S., 2001. Trust and Growth. The Economic Journal, Vol. 111, No. 470, pp. 295-321.
曾湘泉 [Zeng, X.], April 17th, 2018. 调查失业率统计是促进更高质量和更充分就业的科学举
措 [Surveyed Unemployment Rate is A Scientific Measure of Promoting Higher-Quality and Fuller Employment] [online]. National Bureau of Statistics of the People’s Republic of China. [Viewed 22 April 2018]. Available from: http://www.stats.gov.cn/tjsj/sjjd/201804/t20180417_1594329.html.
张涛 [Zhang, T.], 2017. 列女传译注 [Translation and Annotation of the Biographies of Exemplary Women]. Beijing: People’s Publishing House.
Zhao, D., Hu, W., 2017. Determinants of Public Trust in Government: Empirical Evidence from Urban China. International Review of Administrative Sciences, Vol. 83, No. 2, pp. 358-377.
Zucker, L.G., 1986. Production of Trust: Institutional Sources of Economics Structure 1840 to 1920. Research in Organizational Behavior, Vol. 8, pp. 53-111.

Declaration
I declare that this thesis is my own work, was conducted without unauthorized assistance.
I declare that this thesis has not been submitted under consideration for any degree or examination in any university.
I declare that only the referenced sources and aids were used.
I declare that direct quotations from the published or unpublished work of another are clearly identified.
I consent that my thesis submitted to the University of Bremen for Doctorate can be checked for plagiarism using appropriate software tools.
Lin Gao
Bremen, Germany
March 25th, 2019