trygg-hansa fÖrsÄkringsaktiebolag (publ) … codan... · shorter payment patterns and lower ......
TRANSCRIPT

TRYGG-HANSA ANNUAL REPORT 2012
TRYGG-HANSA FÖRSÄKRINGSAKTIEBOLAG (publ)
ANNUAL REPORT 2012*
*) This document is an unofficial translation of the Swedish original.

TRYGG-HANSA ANNUAL REPORT 2012
1
TABLE OF CONTENTS
BOARD OF DIRECTORS' REPORT ....................................................................................................................... 2
FIVE-YEAR SUMMARY .................................................................................................................................... 11
PROPOSED DISPOSITION OF PROFIT ............................................................................................................... 12
INCOME STATEMENT ..................................................................................................................................... 13
STATEMENT OF COMPREHENSIVE INCOME .................................................................................................... 13
BALANCE SHEET ............................................................................................................................................. 14
STATEMENT OF CHANGES IN EQUITY ............................................................................................................. 16
CASH FLOW STATEMENT ................................................................................................................................ 16
PERFORMANCE ANALYSIS .............................................................................................................................. 17
NOTES ............................................................................................................................................................ 18
CLASS ANALYSIS ............................................................................................................................................. 63
AUDITORS' REPORT ........................................................................................................................................ 64
GENERAL INFORMATION ................................................................................................................................ 65
TRYGG-HANSA ANNUAL REPORT 2012
2
BOARD OF DIRECTORS' REPORT The Board of Directors and CEO of Trygg-Hansa Försäkringsaktiebolag (publ), reg. no. 516401-7799 ("Trygg-
Hansa"), herewith submit their annual report for the financial year 1 January–31 December 2012.
Operations
In 2012 Trygg-Hansa with subsidiaries conducted general insurance business primarily in Sweden. Operations
are conducted in the Personal and Commercial business areas and mostly involve sales of general insurance to
individuals, companies and public sector entities. Trygg-Hansa offers a comprehensive range of general
insurance, which also covers a broad offering of disability and accident insurance.
In the wholly owned subsidiary Holmia Livförsäkring AB, operations consist of insurance to cover mortality
risks in disability and accident insurance portfolios. This business is conducted in cooperation with Trygg-
Hansa. General insurance business was conducted during the year through the subsidiary Sveland
Sakförsäkringar AB, with sales to private individuals in southern Sweden.
Apart from the subsidiaries Holmia Livförsäkring, Sveland Sakförsäkringar, Brädstapeln Fastighets AB and a
few dormant subsidiaries, Trygg-Hansa has a branch office in the USA and one in Norway. The branch in the
USA is a small run-off operation, which is fully reinsured. The branch in Norway handles some administration
of Codan's Norwegian insurance business.
Group structure Trygg-Hansa is a wholly owned subsidiary of Codan A/S, Copenhagen (Codan), which in turn is a subsidiary of
RSA Insurance Group plc, London (RSA), one of the world's leading insurance groups.
RSA prepares consolidated financial statements, including Trygg-Hansa and its subsidiaries, in accordance with
International Financial Reporting Standards (IFRS) as adopted for application within the European Union (EU).
Trygg-Hansa applies so-called legally limited IFRS in the preparation of its annual report. Since RSA prepares
consolidated financial statements, the Trygg-Hansa Group has not prepared consolidated financial statements of
its own, pursuant to Ch. 7 § 2 of the Swedish Annual Accounts Act.
Profit for the year
Trygg-Hansa reported a profit before tax and appropriations of SEK 2,429 m (3,624). The decrease is mainly
attributable to a lower investment return as a consequence of lower unrealized gains, and also to slightly lower
contribution from the insurance operations. Profit for the year was amounted to SEK 1,622 m (2,737). Profit was
affected by a provision to untaxed reserves of SEK -140 m (0) and by payment of a Group contribution of SEK -
180m (-142 last year which was recognised directly in equity). In 2012, Trygg-Hansa chose to recognise the
Group contribution in the income statement. The choice of method has no impact on total equity. Profit was also
affected by taxes totalling SEK -487 m (-887).
Premiums Gross written premiums grew 5% during the year and amounted to SEK 10,349 m (9,901). Compared with prior
year, written premiums increased for disability and accident business, householders' and homeowners' insurance,
motor insurance and commercial & property insurance, while motor third-party liability premiums decreased
slightly. Net earned premiums decreased by 1% due to the expanded reinsurance programme.
After deducting premiums for ceded reinsurance, totalling SEK -1,307 m (-861), net written premiums amounted
to SEK 9,042 m (9,040). The proportional share of the reinsurance programme has been increased, which led to
an increase in ceded premiums compared with a year ago. Net earned premiums amounted to SEK 8,947 m
(9,068).
Allocated investment return transferred from the non-technical account Part of the investment return is transferred to the general insurance operations; the amount of this transfer is
based on average technical provisions for own account during the year. The allocated investment return for 2012
was SEK 302 m (608). The decrease is mainly due to lower market interest rates.
TRYGG-HANSA ANNUAL REPORT 2012
3
Claims incurred Claims incurred for own account amounted to SEK -6,291 m (-6,175) and consisted of net claims paid, totalling
SEK -6,692 m (-6,787), and of a change in the provision for claims outstanding, totalling SEK 401m, net (612).
The net claims ratio was 70.3% (68.1%).
Discounting of technical provisions decreased, which had a negative effect on claims incurred of SEK -92 m
(-1,149), partly due to a further decrease in interest rates in 2012 and partly due to updated models for payment
patterns. This was mitigated by positive changes in the value of the bond portfolio as a result of falling interest
rates. In disability and accident business, discounting decreased by SEK -251 m (-335), while discounting of
annuities increased by SEK 159 m (-814), mainly on account of higher gross reserves for annuities.
The total run-off result, including annuities, claims handling costs and the change in discounting, decreased to
SEK 167 m (372). Motor third-party liability business made a positive contribution to the run-off result, while
other lines made a negative contribution. The year's run-off profit for motor third-party liability insurance is
mainly attributable to a better outcome for loss-of-income claims compared with previous estimations, entailing
a lowering of the reserve levels for older claim years. Shorter payment patterns and lower interest rates
contributed to lower discounting of reserves for disability and accident insurance, resulting in a run-off loss for
this segment. Run-off losses were also incurred for householders' and homeowners' insurance as a result of an
exceptionally large, individual claim that was incurred in 2011, for which the estimated final cost increased.
The result for 2012 (excluding the run-off result) indicates the strength of continuing business. The current year
claims ratio for 2012 was 72.2%, which is the same level as a year earlier. The claims ratio improved in 2012 for
disability and accident, householders' and homeowners', and commercial lines of insurance. The extent of
weather-related claims was lower than a year ago.
Operating expenses Operating expenses for general insurance amounted to SEK -1,416 m (-1,389), which corresponds to 15.8%
(15.3%) in relation to net earned premiums. During the year, the company incurred higher costs for marketing
and sales initiatives and system improvements. Lower market interest rates also led to an increase in pension
costs for defined benefit plans. Operating expenses were favourably affected by reinsurance commissions
totalling SEK 304 m (132).
Technical result The technical result for general insurance amounted to SEK 1,538 m (2,106). Overall, the combined ratio
increased from 83.4% to 86.1%.
Investment return
The investment return decreased to SEK 1,191 m (2,153), mainly due to lower unrealised changes in value. Total
capital gains were SEK 203 m (1,062), of which SEK 56 m (962) relates to the bond portfolio as a result of
falling interest rates. The equities portfolio also grew in value, by SEK 147 m, compared with unrealised losses
of SEK -313 m a year ago. Investment income, totalling SEK 1,098 m (1,558), consisted largely of interest
income on bonds, which was lower on account of a smaller bond portfolio, but also because of lower interest
rates. The value of land and buildings was unchanged.
See also below under "Asset management" for further comments.
Balance sheet, financial position and cash flow
Total assets decreased to SEK 34,919 m (35,953). Investments, including cash and bank balances, amounted to
SEK 28,514 m (30,467). The company's solvency capital amounts to SEK 6,784 m (5,123), and the requisite
solvency margin amounts to SEK 1,546 m (1,577). The solvency ratio thus continues to be at a secure level.
Cash flow from operating activities amounted to SEK -303 m (-721). Lower tax payments and also lower net
claims payments contributed to the improvement.
TRYGG-HANSA ANNUAL REPORT 2012
4
Dividend for 2012
The Board of Directors proposes that no dividend be paid for 2012. The dividend for 2011 was SEK 2,700 m.
See the comments under "Proposed distribution of profit". The proposal will be taken up for a decision by the
Annual General Meeting on 30 April 2013.
Asset management
The weak economic development both in Europe and the rest of the world had an adverse impact on the Swedish
economy in 2012. The economic trend in the preceding year led to sharp drops in both short- and long-term
interest rates in the latter part of 2011. The decline in interest rates in Sweden continued to some extent in 2012,
although not as sharply as in 2011. During the year, the Swedish 5-year government bond rate fell from 1.22%
on 1 January to 0.96% on 31 December 2012.
Trygg-Hansa continues to have a conservative investment strategy, where bonds account for a large share of total
investments. The majority of bond holdings are Swedish, and the company continues to have a relatively even
distribution between government bonds and other bonds, such as mortgage bonds, other government-backed
bonds and corporate bonds. The share of equities was roughly the same as a year ago.
Falling market interest rates had a slight, positive effect on changes in the value of Trygg-Hansa's bond portfolio,
even though the change was considerably less than in the preceding year. Unrealised gains arose, mainly on
account of the drop in interest rates. In addition, rising share prices resulted in a positive change in the value of
the company's equities portfolio.
TRYGG-HANSA ANNUAL REPORT 2012
5
Total return for Trygg-Hansa: SEK m 2012 2011 Land and buildings 28 29
Shares and participations 93 79
Shares and participations in Group companies 6 264
Bonds 843 1,031
Other -15 - 27
Direct investment income 955 1 376
Land and buildings -4 98
Shares and participations 89 -309
Shares and participations in Group companies 26 -97
Bonds 122 1,074
Other 3 11
Change in value 236 777
Total return 1,191 2,153
The direct yield was 3.2% (4.3%), a decrease that is partly attributable to lower interest income and an
anticipated dividend from subsidiaries totalling SEK 250 m that was included in profit for 2011. The total return
was 4.0% (6.8%), a decrease that is mainly attributable to the fact that the positive changes in the bond portfolio
were lower than the value increase that took place in 2011.
Trygg-Hansa's investments: SEK m 31/12/2012 31/12/2011 Bonds 23,463 25,951
Shares and participations 1,486 1,333
Shares and participations in Group companies 511 820
Land and buildings 1,116 1,116
Other 125 133 Total 26,701 29,353
2012 2011
39%
36%
12%
6%2% 4%1%
Government
Mortgage Bonds
Corporate Bonds
Equity
Shares and participation in Group companiesLand and building
Other
45%
39%
5%
4%3% 4%
0%
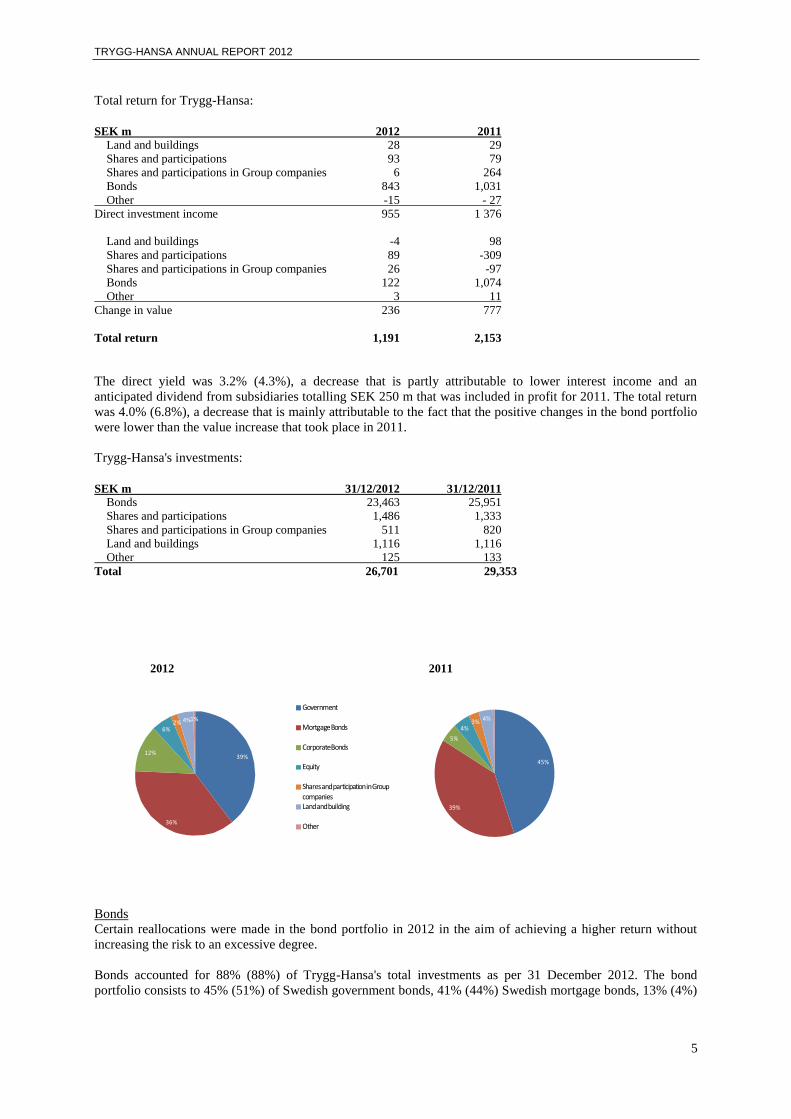
Bonds Certain reallocations were made in the bond portfolio in 2012 in the aim of achieving a higher return without
increasing the risk to an excessive degree.
Bonds accounted for 88% (88%) of Trygg-Hansa's total investments as per 31 December 2012. The bond
portfolio consists to 45% (51%) of Swedish government bonds, 41% (44%) Swedish mortgage bonds, 13% (4%)

TRYGG-HANSA ANNUAL REPORT 2012
6
European credit bonds/corporate bonds and 1% (1%) other. A total of 95% (93%) of the bond portfolio is
invested in triple A–rated bonds.
The bond portfolio generated a return of SEK 965 m (2,105), corresponding to a total return of 3.2% (6.6%)
Payment of the dividend to Codan A/S reduced investments by SEK 2,700 m in 2012. The decrease in the bond
portfolio had an impact on nominal interest income.
Trygg-Hansa matches interest rate risk on assets and liabilities with the help of a conservative bond portfolio and
thereby strives to reduce interest rate and inflation risk. Part of Trygg-Hansa's technical provisions are indexed.
To partially protect itself from direct inflation risk, the company has invested SEK 2,234 m (2,768) in inflation-
indexed bonds, which account for 10% (11%) of the total bond portfolio.
Equities Investments in equities were at roughly the same level as a year ago and amounted to SEK 1,486 m (1,333),
which generated a positive return of SEK 182 m (-230). Equities accounted for 6% (5.0%) of investments. Of
these, SEK 938 m (1,042) was invested in listed European stocks.
A dividend of SEK 0 m (250) was received from the subsidiary Holmia Liv for 2012.
Real estate The real estate portfolio consists primarily of the head-office building on Fleminggatan in Stockholm. Part of the
building is leased out to external tenants at market terms. The real estate portfolio accounted for 4.1% (3.8%) of
total investments as per 31 December 2012.
During the year, the market value of real estate was unchanged at SEK 1,116 m.
Derivatives Most of Trygg-Hansa's investments are in bonds. To mitigate inflation and currency risk, derivatives may be
used, in accordance with the Board's investment policy. In 2012 a foreign exchange hedge was used to hedge
currency risks in SEK/EUR that arose in connection with an investment in euro bonds.
Risks and uncertainties
Trygg-Hansa is exposed to various types of risks, of which insurance risks, financial risks and operational risks
are the most prominent. Insurance risks pertain primarily to underwriting risk and reserve-setting risk. Financial
risks consist primarily of market risks and the impact of changes in interest rates, particularly in the bond
portfolio and technical provisions. Operational risks include defects stemming from insufficient or incorrectly
handled processes, and human or system errors. The company's management of these risks is described below
and in more detail in Note 2.
Risk management at Trygg-Hansa
Trygg-Hansa's overarching strategy and guidelines are set by the company's Board of Directors. The connection
between strategic considerations of risk acceptance and daily decisions on whether to enter into agreements with
customers, partners and suppliers is strengthened through continuous assessment of the company's current risk
profile. This is done through the Risk Management Forum, which is an advisory body for the CEO. The risk
profile is reported on a continuous basis to the company's Board of Directors. For further information on risk
management, see Note 2.
Trygg-Hansa has implemented necessary and relevant measures and controls to optimize risk situations. The
most essential components of the company's risk profile are handled by the Risk & Compliance department,
which focuses on insurance risks, financial risks, operational risks and compliance risk. The most significant
risks for Trygg-Hansa are outlined below:

TRYGG-HANSA ANNUAL REPORT 2012
7
Underwriting risk
Trygg-Hansa's underwriting risk comprises:
Underwriting risk and risk in setting premiums
Counterparty risk
Reserve-setting risk
The level of insurance risk that the company can accept is ultimately steered by the Risk Acceptance Guidelines,
which are set by the Board of Directors. In these guidelines, the Board clearly describes the risk appetite per
insurance class and specifies the maximum acceptable limits that the Board is prepared to allocate to the various
risks that have been evaluated, priced and accepted by the company's underwriters.
The Reinsurance Policy steers how reinsurance protection is to be structured to reduce Trygg-Hansa's insurance
risks to acceptable levels. Reinsurance is purchased to protect the company from major, individual claims and
against disasters that could impact many different lines of insurance. The Reinsurance Policy also stipulates, per
insurance class, clear demands on what credit ratings the reinsurance companies are to have in order for Trygg-
Hansa to enter into contracts with them.
The company's method for setting premiums is defined through an underwriting process that takes into account
various individual risks, which products are to be insured, and in some cases also risk management, in order to
arrive at the right premiums for different customers. In both the Private and Commercial business units, a
majority of the customers are given a premium that is set according to tariffs that are calculated by price
actuaries, while for major commercial customers, premiums are based on the respective companies' operations
and claims history. The authority exercised by the respective underwriters is steered by a personal underwriting
licence.
Technical provisions for future payment of claims that have been incurred are calculated using standard actuarial
methods.
The claims trend and reserve levels are reviewed quarterly by the actuary group and are also addressed in a
process that involves both the claims department and the Portfolio Heads/Product Directors. The Chief Actuary
is responsible for reserves and produces reserve reporting to the Reserving Committee.
The Reserving Committee meets once a quarter and has an advisory role that is designed to provide a more in-
depth look at the Chief Actuary's report. The committee reports to the CEO.
Financial risks
Financial risks consist of market risk, credit risk and liquidity risk. Market risk is the most important of these for
Trygg-Hansa since a significant part of the company’s activities consist of investment activities. Market risk is
the risk that movements in the financial markets affect the value of assets and liabilities, and thereby the
company’s capital base and return.
Most of Trygg-Hansa's investments are in Swedish government bonds and Swedish mortgage bonds. The large
majority of the bonds is considered liquid and can be sold on short notice at close to market price.
Since a large share of Trygg-Hansa's technical provisions are index linked and have a long duration, it is
important that the company manages its financial risks so as not to experience major, undesired fluctuations in
earnings and equity. The company's strategy for managing financial risks is rooted in a conservative investment
portfolio with a large share of high quality bonds with an average duration that broadly match that of the
technical provisions.
Market risks
Interest rate risk
Changes in interest rates are one of the main factors regarding Trygg-Hansa's financial risks. If interest rates
decrease the value of the company's bond portfolio rises. At the same time, technical provisions would rise in
connection with changes in the discount rates. Changes in interest rates thus have an opposite effect on assets
and liabilities. One of the objectives of the investment Guidelines is to ensure an effective matching of risks
across assets and liabilities.
TRYGG-HANSA ANNUAL REPORT 2012
8
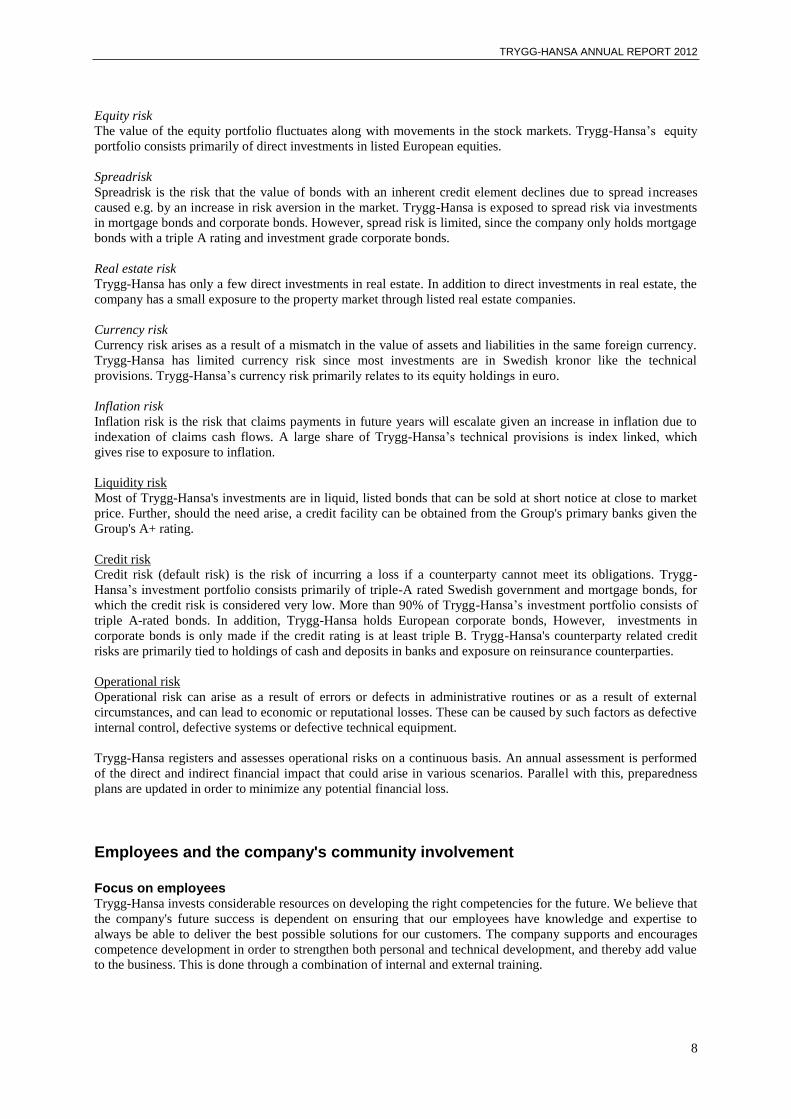
Equity risk
The value of the equity portfolio fluctuates along with movements in the stock markets. Trygg-Hansa’s equity
portfolio consists primarily of direct investments in listed European equities.
Spreadrisk
Spreadrisk is the risk that the value of bonds with an inherent credit element declines due to spread increases
caused e.g. by an increase in risk aversion in the market. Trygg-Hansa is exposed to spread risk via investments
in mortgage bonds and corporate bonds. However, spread risk is limited, since the company only holds mortgage
bonds with a triple A rating and investment grade corporate bonds.
Real estate risk
Trygg-Hansa has only a few direct investments in real estate. In addition to direct investments in real estate, the
company has a small exposure to the property market through listed real estate companies.
Currency risk
Currency risk arises as a result of a mismatch in the value of assets and liabilities in the same foreign currency.
Trygg-Hansa has limited currency risk since most investments are in Swedish kronor like the technical
provisions. Trygg-Hansa’s currency risk primarily relates to its equity holdings in euro.
Inflation risk
Inflation risk is the risk that claims payments in future years will escalate given an increase in inflation due to
indexation of claims cash flows. A large share of Trygg-Hansa’s technical provisions is index linked, which
gives rise to exposure to inflation.
Liquidity risk
Most of Trygg-Hansa's investments are in liquid, listed bonds that can be sold at short notice at close to market
price. Further, should the need arise, a credit facility can be obtained from the Group's primary banks given the
Group's A+ rating.
Credit risk
Credit risk (default risk) is the risk of incurring a loss if a counterparty cannot meet its obligations. Trygg-
Hansa’s investment portfolio consists primarily of triple-A rated Swedish government and mortgage bonds, for
which the credit risk is considered very low. More than 90% of Trygg-Hansa’s investment portfolio consists of
triple A-rated bonds. In addition, Trygg-Hansa holds European corporate bonds, However, investments in
corporate bonds is only made if the credit rating is at least triple B. Trygg-Hansa's counterparty related credit
risks are primarily tied to holdings of cash and deposits in banks and exposure on reinsurance counterparties.
Operational risk
Operational risk can arise as a result of errors or defects in administrative routines or as a result of external
circumstances, and can lead to economic or reputational losses. These can be caused by such factors as defective
internal control, defective systems or defective technical equipment.
Trygg-Hansa registers and assesses operational risks on a continuous basis. An annual assessment is performed
of the direct and indirect financial impact that could arise in various scenarios. Parallel with this, preparedness
plans are updated in order to minimize any potential financial loss.
Employees and the company's community involvement
Focus on employees Trygg-Hansa invests considerable resources on developing the right competencies for the future. We believe that
the company's future success is dependent on ensuring that our employees have knowledge and expertise to
always be able to deliver the best possible solutions for our customers. The company supports and encourages
competence development in order to strengthen both personal and technical development, and thereby add value
to the business. This is done through a combination of internal and external training.

TRYGG-HANSA ANNUAL REPORT 2012
9
The company has a strong focus on employee commitment, which is measured yearly in a commitment survey.
Based on the results of this, focused activities are defined, and the company takes active steps to increase
employee commitment. The "Unlocking your full potential" programme for leaders and employees has been
integrated into the company culture and provides a variety of tools and techniques for working with development
and the company culture throughout the organisation.
Trygg-Hansa's work with corporate social responsibility
Trygg-Hansa has chosen to work strategically with corporate social responsibility (CSR), since corporate
responsibility is a prerequisite for the company's ability to attract top talent, customers, suppliers and other
partners, which in turn creates the conditions for a profitable and sustainable business. Trygg-Hansa has
published a CSR report, which is accessible to the public on the company's website: www.trygghansa.se/csr. The
information provided in the report is reported in accordance with the international GRI standard, level B. The
report describes how the Codan/Trygg-Hansa group adheres to the AA1000 principles (inclusivity, materiality
and responsiveness), and all data has been examined by an independent auditing firm.
The policies for Trygg-Hansa's CSR work that have been approved by the Board of Directors and CEO are
posted on www.trygghansa.se/csr. Trygg-Hansa's CSR policies serve as general guidelines for the responsibility
that the company takes in various areas, including human rights, the environment, donations and volunteer work.
The website also includes information about the company's values and business principles, which strengthen the
work with CSR throughout the organisation.
The Trygg-Hansa/Codan Group has introduced an internal guide to Business Conduct, which all employees must
complete an e-learning course on. The Group also has a whistleblowing policy in place that clearly lays out the
steps employees need to take and who they should contact if they bear suspicions about fraud, corruption,
embezzlement or non-compliance with the Group's own business principles.
Trygg-Hansa/Codan work strategically with three themes that have been determined to be important for society,
the company's customers and the Group's operations: the Climate, Safety and Health.
The Climate The Trygg-Hansa/Codan Group has noted a large rise in weather-related claims in recent years. In the near term,
the Group recognises the need to contribute to preventive work, such as by providing information to customers
in an effort to reduce the risk for losses caused by extreme weather conditions. Over the long term, however, the
Group is working to help reverse the negative trend of the ongoing climate changes and the effects of these.
Toward this end, the company has partnered with WWF in Sweden and Denmark, and supports various projects,
such as the Baltic Sea Project and the Earth Hour campaign. Through this partnership with WWF, Trygg-
Hansa/Codan has set the target of reducing the Group's CO2 emissions by 40% by 2020, compared with 2006
levels.
Safety All accidents, whether they occur in the home, at work, in traffic or on vacation, are unpleasant experiences that
everyone would rather do without. The same applies for us as an insurer. As an insurance company we therefore
view accident prevention with utmost importance.
In Sweden, Trygg-Hansa has a long heritage of providing life buoys to harbours and cities throughout the
country. During the summer, the company carried out a "life buoy hunt" campaign in an effort to replace broken
and worn-out life buoys. As a result of this campaign, during the year Trygg-Hansa replaced 300 life buoys that
were in ill repair. Over the years more than 80,000 Trygg-Hansa life buoys have been placed out at harbours and
beaches throughout Sweden.
Within the Trygg-Hansa/Codan Group, during the year we also focused on reducing the number of burglaries. In
Sweden and Denmark we launched instructional videos showing homeowners how they can prevent break-ins,
and a special report that provides concrete tips was also released.
TRYGG-HANSA ANNUAL REPORT 2012
10
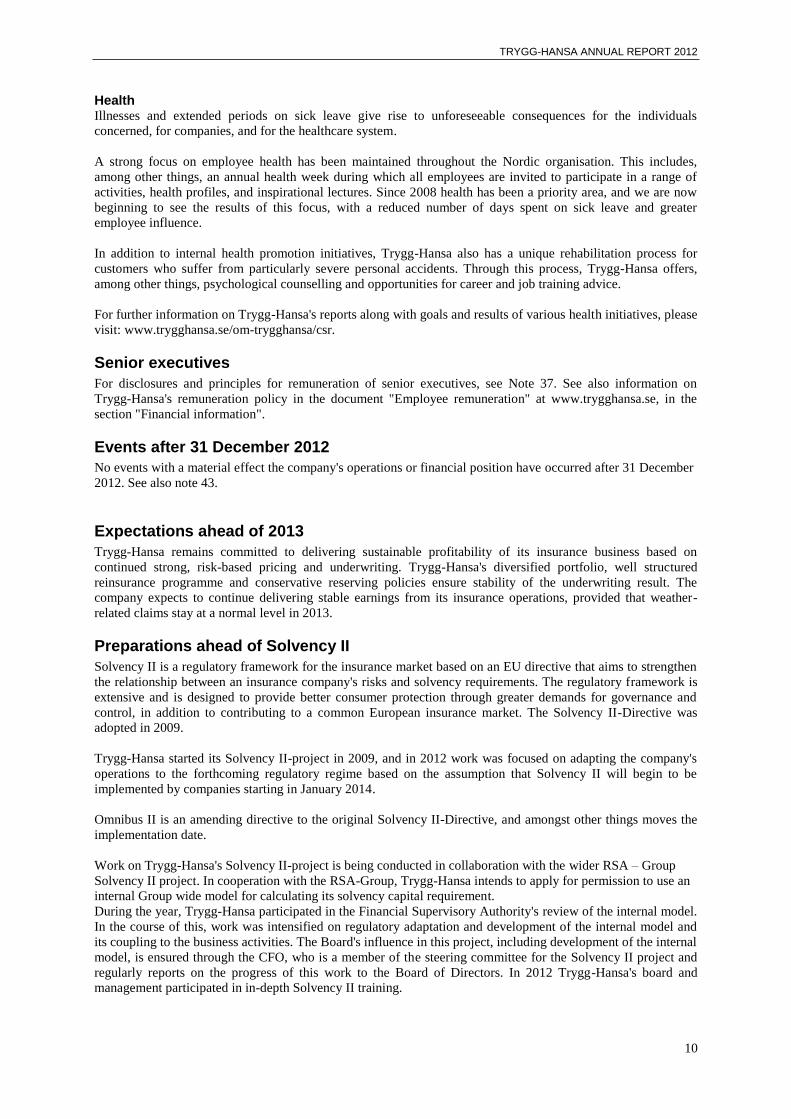
Health Illnesses and extended periods on sick leave give rise to unforeseeable consequences for the individuals
concerned, for companies, and for the healthcare system.
A strong focus on employee health has been maintained throughout the Nordic organisation. This includes,
among other things, an annual health week during which all employees are invited to participate in a range of
activities, health profiles, and inspirational lectures. Since 2008 health has been a priority area, and we are now
beginning to see the results of this focus, with a reduced number of days spent on sick leave and greater
employee influence.
In addition to internal health promotion initiatives, Trygg-Hansa also has a unique rehabilitation process for
customers who suffer from particularly severe personal accidents. Through this process, Trygg-Hansa offers,
among other things, psychological counselling and opportunities for career and job training advice.
For further information on Trygg-Hansa's reports along with goals and results of various health initiatives, please
visit: www.trygghansa.se/om-trygghansa/csr.
Senior executives
For disclosures and principles for remuneration of senior executives, see Note 37. See also information on
Trygg-Hansa's remuneration policy in the document "Employee remuneration" at www.trygghansa.se, in the
section "Financial information".
Events after 31 December 2012 No events with a material effect the company's operations or financial position have occurred after 31 December
2012. See also note 43.
Expectations ahead of 2013
Trygg-Hansa remains committed to delivering sustainable profitability of its insurance business based on
continued strong, risk-based pricing and underwriting. Trygg-Hansa's diversified portfolio, well structured
reinsurance programme and conservative reserving policies ensure stability of the underwriting result. The
company expects to continue delivering stable earnings from its insurance operations, provided that weather-
related claims stay at a normal level in 2013.
Preparations ahead of Solvency II
Solvency II is a regulatory framework for the insurance market based on an EU directive that aims to strengthen
the relationship between an insurance company's risks and solvency requirements. The regulatory framework is
extensive and is designed to provide better consumer protection through greater demands for governance and
control, in addition to contributing to a common European insurance market. The Solvency II-Directive was
adopted in 2009.
Trygg-Hansa started its Solvency II-project in 2009, and in 2012 work was focused on adapting the company's
operations to the forthcoming regulatory regime based on the assumption that Solvency II will begin to be
implemented by companies starting in January 2014.
Omnibus II is an amending directive to the original Solvency II-Directive, and amongst other things moves the
implementation date.
Work on Trygg-Hansa's Solvency II-project is being conducted in collaboration with the wider RSA – Group
Solvency II project. In cooperation with the RSA-Group, Trygg-Hansa intends to apply for permission to use an
internal Group wide model for calculating its solvency capital requirement.
During the year, Trygg-Hansa participated in the Financial Supervisory Authority's review of the internal model.
In the course of this, work was intensified on regulatory adaptation and development of the internal model and
its coupling to the business activities. The Board's influence in this project, including development of the internal
model, is ensured through the CFO, who is a member of the steering committee for the Solvency II project and
regularly reports on the progress of this work to the Board of Directors. In 2012 Trygg-Hansa's board and
management participated in in-depth Solvency II training.

TRYGG-HANSA ANNUAL REPORT 2012
11
FIVE-YEAR SUMMARY
Five-year summary
In five-year summary below financial result and financial position is disclosed.
SEK m 2012 2011 2010 2009*) 2008
Result
Written premiums (gross) 10,349 9,901 9,790 9,667 9,363
Allocated investment return transferred 302 608 645 742 1,061
Claims incurred, net of reinsurance -6,291 -6,175 -5,181 -5,865 -6,158
Operating expenses -1,416 -1,389 -1,404 -1,449 -1,382
Other technical charges 0 -1 3 -22 -12
Balance on the technical account, property&casualty insurance business 1,538 2,106 3,588 3,160 2,847
Profit for the year 1,622 2,737 2,908 2,139 2,352
Financial position
Investment at fair value 26,701 29,353 31,685 33,715 32,922
Technical provisions, net 23,808 24,112 24,754 26,314 26,001
Capital base ***) 6,784 5,123 8,065 8,799 9,882
Solvency requirement 1,546 1,577 1,481 1,710 1,735
Solvencyquota ***) 4.4 3.3 5.4 5.1 5.7
Capital base for insurancegroup **)***) 6,816 5,001 8,079
Solvency requirement for insurancegroup **) 1,714 1,766 1,699
Net asset value ***) 7,642 5,503 8,337 8,992 10,041
-of which the deferred tax asset/liability -350 26 48 13 23
Consolidation ratio, % ***) 85 61 87 95 108
Key ratios property & caualty insurance
Claims ratio, net % 70.3 68.1 54.4 60.1 65.9
Expence ratio, net % 15.8 15.3 14.7 14.9 14.8
Combined ratio, net % 86.1 83.4 69.1 75.0 80.7
Key ratios investments
Direct yield % 3.2 4.3 3.5 3.3 3.9
Total yield % 4.0 6.8 3.0 1.8 8.1
No dividend is proposed for 2012.
*) Figures for 2009 have been affected by the merger of Aktsam as per 2 January 2009.
**) The insurance group consits of Trygg-Hansa Försäkrings AB, Holmia Livförsäkring AB and since 2010 Sveland Sakförsäkringar AB.
For the years 2008 and 2009 the group had a dispensation from consolidated reporting. ***) Figures for 2011 have been adjusted to take into account the dividend of SEK 2,700 m.

TRYGG-HANSA ANNUAL REPORT 2012
12
PROPOSED DISPOSITION OF PROFIT The following amounts are at the disposal of the Annual General Meeting (amounts in SEK):
Profit brought forward 40,966,933
Profit for the year 1,622,460,307
Total 1,663,427,240
The Board of Directors and CEO propose that the amount be disposed of as follows:
To be carried forward 1,663,427,240
Stockholm April 29, 2013
David Weymouth
Chairman of the Board
Anders Ehrling Fabrizio Moscone
Board Board
Vanessa Evans Synnöve Trygg
Board Board
Lena Darin Claes Hansson
Employee representative Employee representative
Mike Holliday-Williams
CEO
Our audit report was submitted on April 29, 2013.
Deloitte AB
Göran Engquist
Authorised Public Accountant
TRYGG-HANSA ANNUAL REPORT 2012
13
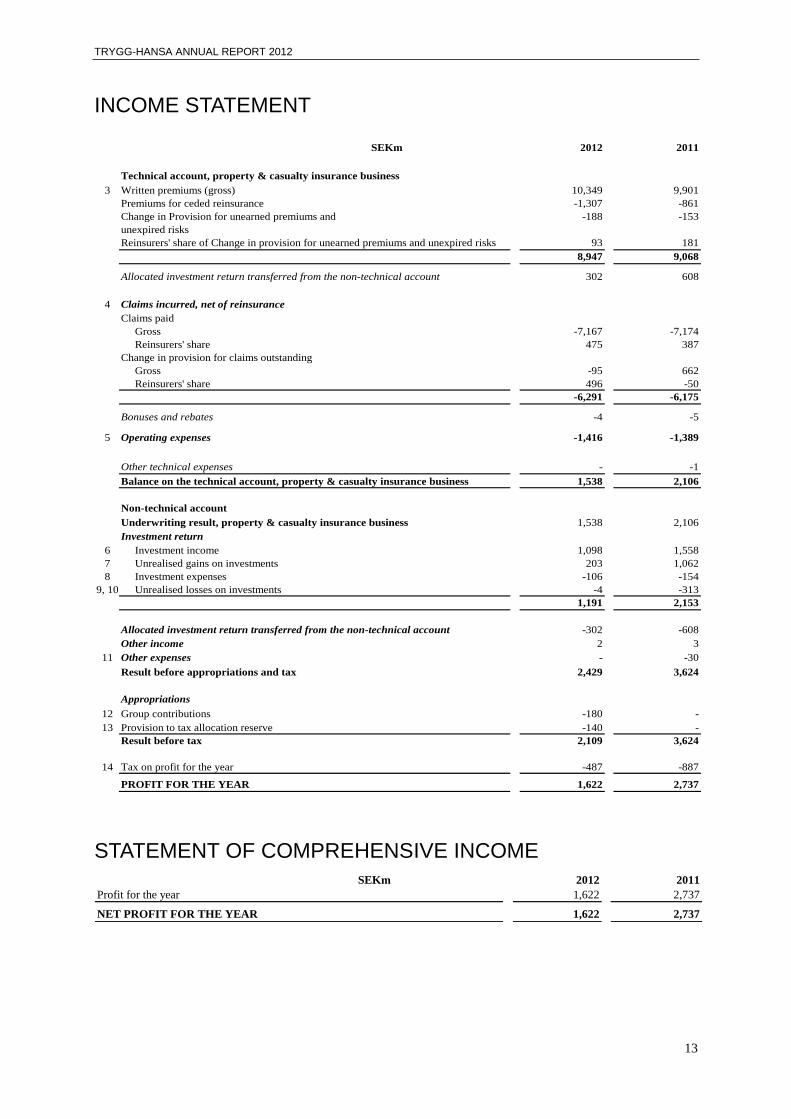
INCOME STATEMENT
SEKm 2012 2011
Technical account, property & casualty insurance business
3 Written premiums (gross) 10,349 9,901
Premiums for ceded reinsurance -1,307 -861
Change in Provision for unearned premiums and -188 -153
unexpired risks
Reinsurers' share of Change in provision for unearned premiums and unexpired risks 93 181
8,947 9,068
Allocated investment return transferred from the non-technical account 302 608
4 Claims incurred, net of reinsurance
Claims paid
Gross -7,167 -7,174
Reinsurers' share 475 387
Change in provision for claims outstanding
Gross -95 662
Reinsurers' share 496 -50
-6,291 -6,175
Bonuses and rebates -4 -5
5 Operating expenses -1,416 -1,389
Other technical expenses - -1
Balance on the technical account, property & casualty insurance business 1,538 2,106
Non-technical account
Underwriting result, property & casualty insurance business 1,538 2,106
Investment return
6 Investment income 1,098 1,558
7 Unrealised gains on investments 203 1,062
8 Investment expenses -106 -154
9, 10 Unrealised losses on investments -4 -313
1,191 2,153
Allocated investment return transferred from the non-technical account -302 -608
Other income 2 3
11 Other expenses - -30
Result before appropriations and tax 2,429 3,624
Appropriations
12 Group contributions -180 -
13 Provision to tax allocation reserve -140 -
Result before tax 2,109 3,624
14 Tax on profit for the year -487 -887
PROFIT FOR THE YEAR 1,622 2,737
STATEMENT OF COMPREHENSIVE INCOME
SEKm 2012 2011
Profit for the year 1,622 2,737
NET PROFIT FOR THE YEAR 1,622 2,737
TRYGG-HANSA ANNUAL REPORT 2012
14
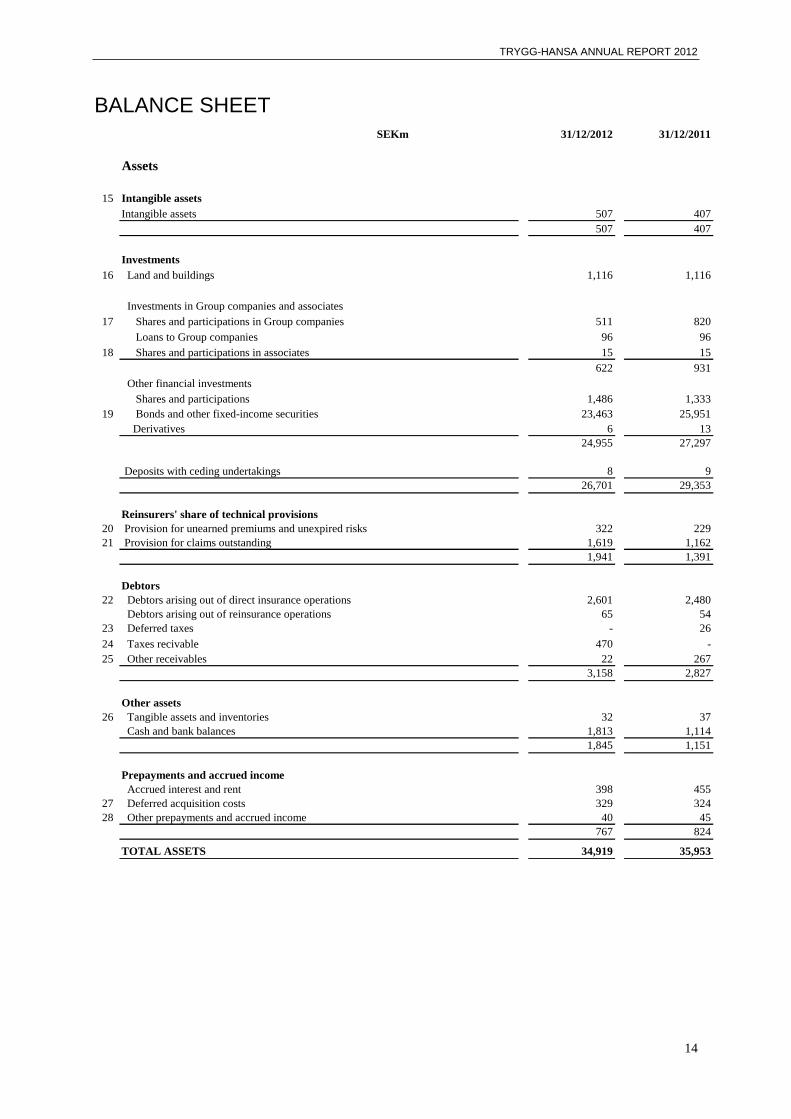
BALANCE SHEET
SEKm 31/12/2012 31/12/2011
Assets
15 Intangible assets
Intangible assets 507 407
507 407
Investments
16 Land and buildings 1,116 1,116
Investments in Group companies and associates
17 Shares and participations in Group companies 511 820
Loans to Group companies 96 96
18 Shares and participations in associates 15 15
622 931
Other financial investments
Shares and participations 1,486 1,333
19 Bonds and other fixed-income securities 23,463 25,951
Derivatives 6 13
24,955 27,297
Deposits with ceding undertakings 8 9
26,701 29,353
Reinsurers' share of technical provisions
20 Provision for unearned premiums and unexpired risks 322 229
21 Provision for claims outstanding 1,619 1,162
1,941 1,391
Debtors
22 Debtors arising out of direct insurance operations 2,601 2,480
Debtors arising out of reinsurance operations 65 54
23 Deferred taxes - 26
24 Taxes recivable 470 -
25 Other receivables 22 267
3,158 2,827
Other assets
26 Tangible assets and inventories 32 37
Cash and bank balances 1,813 1,114
1,845 1,151
Prepayments and accrued income
Accrued interest and rent 398 455
27 Deferred acquisition costs 329 324
28 Other prepayments and accrued income 40 45
767 824
TOTAL ASSETS 34,919 35,953

TRYGG-HANSA ANNUAL REPORT 2012
15
BALANCE SHEET
SEKm 31/12/2012 31/12/2011
Equity, provisions and liabilities
Equity
29 Share capital 170 170
Profit brought forward 41 4
Profit for the year 1,622 2,737
1,833 2,911
Untaxed reserves
13 Tax allocation reserve 140 -
Contingency reserve 5,318 5,318
5,458 5,318
Technical provisions, gross
30 Provision for unearned premiums and
unexpired risks 4,144 3,957
31 Provision for claims outstanding 21,605 21,546
25,749 25,503
Other provisions
32 Pensions and similar obligations 145 176
23 Deferred taxes 350 -
Other provisions 57 2
552 178
Deposits from reinsurers 20 19
Creditors
33 Creditors arising out of direct insurance operations 118 124
Creditors arising out of reinsurance operations 140 120
24 Taxes payable - 524
34 Other liabilities 556 794
814 1,562
Accruals and deferred income
35 Other accruals and deferred income 493 462
493 462
TOTAL EQUITY, PROVISIONS AND LIABILITIES 34,919 35,953
Memorandum items
39 Pledged assets 29,925 31,256
TRYGG-HANSA ANNUAL REPORT 2012
16
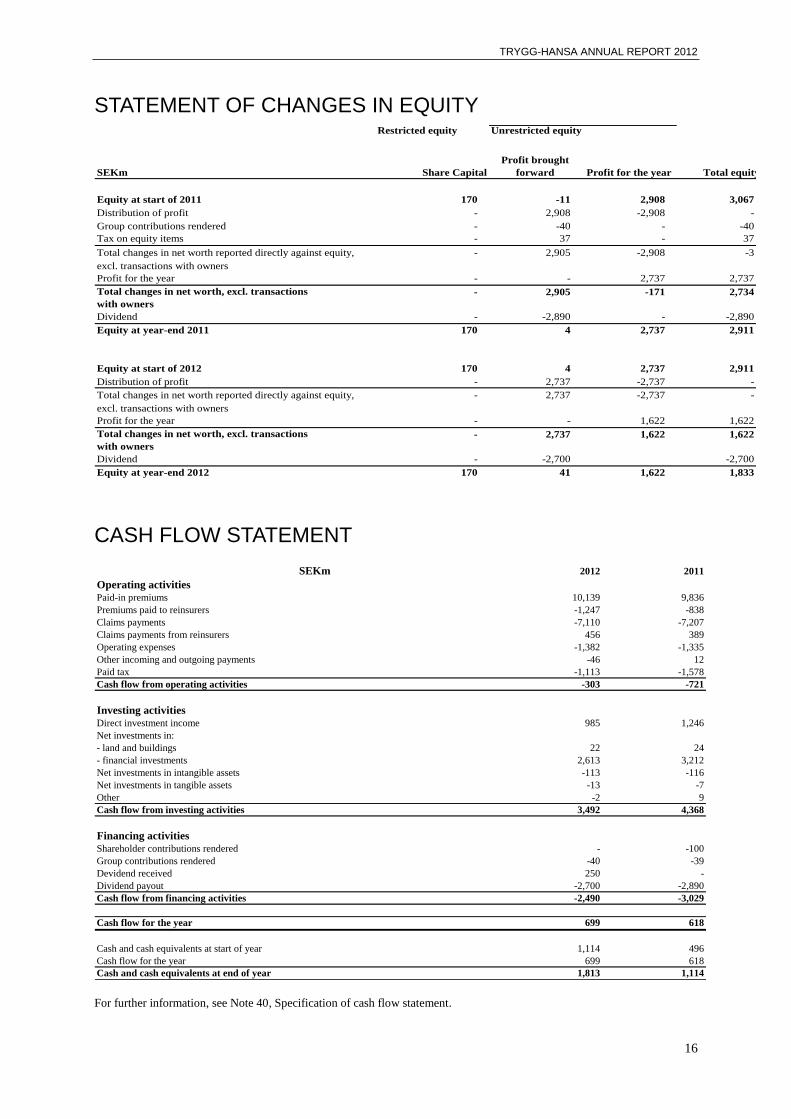
STATEMENT OF CHANGES IN EQUITY Restricted equity
SEKm
Equity at start of 2011 170 -11 2,908 3,067
Distribution of profit - 2,908 -2,908 -
Group contributions rendered - -40 - -40
Tax on equity items - 37 - 37
Total changes in net worth reported directly against equity, - 2,905 -2,908 -3
excl. transactions with owners
Profit for the year - - 2,737 2,737
Total changes in net worth, excl. transactions
with owners
- 2,905 -171 2,734
Dividend - -2,890 - -2,890
Equity at year-end 2011 170 4 2,737 2,911
Equity at start of 2012 170 4 2,737 2,911
Distribution of profit - 2,737 -2,737 -
Total changes in net worth reported directly against equity, - 2,737 -2,737 -
excl. transactions with owners
Profit for the year - - 1,622 1,622
Total changes in net worth, excl. transactions
with owners
- 2,737 1,622 1,622
Dividend - -2,700 -2,700
Equity at year-end 2012 170 41 1,622 1,833
Share Capital
Profit brought
forward Profit for the year Total equity
Unrestricted equity
CASH FLOW STATEMENT
SEKm 2012 2011
Operating activities
Paid-in premiums 10,139 9,836
Premiums paid to reinsurers -1,247 -838
Claims payments -7,110 -7,207
Claims payments from reinsurers 456 389
Operating expenses -1,382 -1,335
Other incoming and outgoing payments -46 12
Paid tax -1,113 -1,578
Cash flow from operating activities -303 -721
Investing activities
Direct investment income 985 1,246
Net investments in:
- land and buildings 22 24
- financial investments 2,613 3,212
Net investments in intangible assets -113 -116
Net investments in tangible assets -13 -7
Other -2 9
Cash flow from investing activities 3,492 4,368
Financing activities
Shareholder contributions rendered - -100
Group contributions rendered -40 -39
Devidend received 250 -
Dividend payout -2,700 -2,890
Cash flow from financing activities -2,490 -3,029
Cash flow for the year 699 618
Cash and cash equivalents at start of year 1,114 496
Cash flow for the year 699 618
Cash and cash equivalents at end of year 1,813 1,114
For further information, see Note 40, Specification of cash flow statement.

TRYGG-HANSA ANNUAL REPORT 2012
17
PERFORMANCE ANALYSIS SEK m Direct insurance in Sweden Direct
Total
Disability
and accident
House and
home
Business
and
property
Motor
third-party
liability
Motor, other
classes
Marine,
aviation
and
transport Total
insurance
foreign
risks
Re-
insurance
accepted
Premiums earned, net of reinsurance
Written premiums, gross…………………………………………………………………..10,349 2,816 1,619 1,776 1,573 2,368 114 10,266 1 82
Premiums for ceded reinsurance………………………………………………………….-1,307 -304 -194 -337 -169 -259 -19 -1,282 0 -25
Change in provision for unearned premiums and unexpired risks…………………….-188 -94 -52 -18 32 -54 -2 -188 0 0
Reinsurers' share of change in provision for unearned premiums
and unexpired risks………………………………………………………………………….93 30 23 7 3 31 0 94 0 -1
Premiums earned……………………………………………………………………….8,947 2,448 1,396 1,428 1,439 2,086 93 8,890 1 56
Allocated investment return transferred from the non-technical account………………302 93 13 30 158 10 -2 302 0 0
Other technical income, net of reinsurance…………………………………………………0 0 0 0 0 0 0 0 0 0
Claims incurred, net of reinsurance
Claims paid, gross…………………………………………………………………………..-7,167 -1,420 -1,363 -1,243 -1,286 -1,647 -86 -7,045 0 -122
Reinsurers' share of claims paid ………………………………………………………….475 39 76 92 97 131 11 446 0 29
Change in provision for claims outstanding
Gross…………………………………………………………………………………………-95 -229 -60 -191 463 -29 18 -28 0 -67
Reinsurers' share……………………………………………………………………………496 91 67 240 27 21 -8 438 0 58
Claims incurred…………………………………………………………………………-6,291 -1,519 -1,102 -699 -1,524 -65 -6,189 0 -102
Operating expenses, net of reinsurance……………………………………………………..-1,416 -377 -162 -350 -195 -294 -20 -1,398 0 -18
Bonuses and rebates…………………………………………………………………………..-4 0 3 -3 -1 -3 0 -4 0 0
Other technical charges, net of reinsurance………………………………………………….0 0 0 0 0 0 0 0 0 0
Balance on the technical account, property & casualty insurance………………………1,538 645 -30 3 702 275 6 1,601 1 -64
Run-off result, in accordance with Ch. 5, § 4, pt. 6 of Annual Act for insurance companies 167 -101 -111 -17 484 -64 -8 183 0 -16
Result, ceded reinsurance…………………………………………………………………….-243 -144 -28 2 -42 -76 -16 -304 0 61
TECHNICAL PROVISIONS
Gross…………………………………………………………………………………….
Provision for unearned premiums and unexpired risks…………………………………….4,144 1,160 712 652 586 968 43 4,121 0 23
Provision for claims outstanding………………………………………………………………21,605 6,643 895 1,787 11,031 391 66 20,813 0 792
25,749 7,803 1,607 2,439 11,617 1,359 109 24,934 0 815
Reinsurers' share……………………………………………………………………….
Provision for unearned premiums and unexpired risks…………………………………….-322 -84 -56 -60 -33 -77 -2 -312 0 -10
Provision for claims outstanding……………………………………………………………….-1,619 -161 -96 -373 -224 -40 -13 -907 0 -712
-1,941 -245 -152 -433 -257 -117 -15 -1,219 0 -722
Net of reinsurance……………………………………………………………………….
Provision for unearned premiums and unexpired risks………………………………………3,822 1,076 656 592 553 891 41 3,809 0 13
Provision for claims outstanding………………………………………………………………19,986 6,482 799 1,414 10,807 351 53 19,906 0 80
23,808 7,558 1,455 2,006 11,360 1,242 94 23,715 0 93
-1,280
TRYGG-HANSA ANNUAL REPORT 2012
18
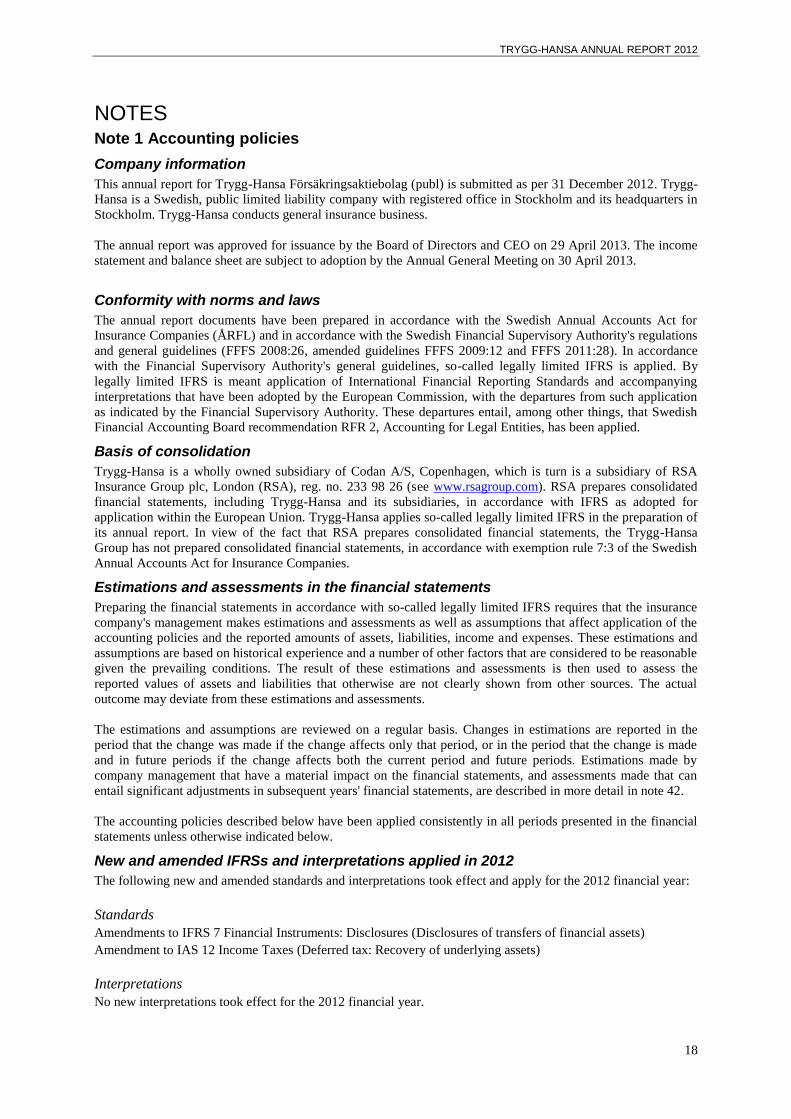
NOTES Note 1 Accounting policies
Company information
This annual report for Trygg-Hansa Försäkringsaktiebolag (publ) is submitted as per 31 December 2012. Trygg-
Hansa is a Swedish, public limited liability company with registered office in Stockholm and its headquarters in
Stockholm. Trygg-Hansa conducts general insurance business.
The annual report was approved for issuance by the Board of Directors and CEO on 29 April 2013. The income
statement and balance sheet are subject to adoption by the Annual General Meeting on 30 April 2013.
Conformity with norms and laws
The annual report documents have been prepared in accordance with the Swedish Annual Accounts Act for
Insurance Companies (ÅRFL) and in accordance with the Swedish Financial Supervisory Authority's regulations
and general guidelines (FFFS 2008:26, amended guidelines FFFS 2009:12 and FFFS 2011:28). In accordance
with the Financial Supervisory Authority's general guidelines, so-called legally limited IFRS is applied. By
legally limited IFRS is meant application of International Financial Reporting Standards and accompanying
interpretations that have been adopted by the European Commission, with the departures from such application
as indicated by the Financial Supervisory Authority. These departures entail, among other things, that Swedish
Financial Accounting Board recommendation RFR 2, Accounting for Legal Entities, has been applied.
Basis of consolidation
Trygg-Hansa is a wholly owned subsidiary of Codan A/S, Copenhagen, which is turn is a subsidiary of RSA
Insurance Group plc, London (RSA), reg. no. 233 98 26 (see www.rsagroup.com). RSA prepares consolidated
financial statements, including Trygg-Hansa and its subsidiaries, in accordance with IFRS as adopted for
application within the European Union. Trygg-Hansa applies so-called legally limited IFRS in the preparation of
its annual report. In view of the fact that RSA prepares consolidated financial statements, the Trygg-Hansa
Group has not prepared consolidated financial statements, in accordance with exemption rule 7:3 of the Swedish
Annual Accounts Act for Insurance Companies.
Estimations and assessments in the financial statements
Preparing the financial statements in accordance with so-called legally limited IFRS requires that the insurance
company's management makes estimations and assessments as well as assumptions that affect application of the
accounting policies and the reported amounts of assets, liabilities, income and expenses. These estimations and
assumptions are based on historical experience and a number of other factors that are considered to be reasonable
given the prevailing conditions. The result of these estimations and assessments is then used to assess the
reported values of assets and liabilities that otherwise are not clearly shown from other sources. The actual
outcome may deviate from these estimations and assessments.
The estimations and assumptions are reviewed on a regular basis. Changes in estimations are reported in the
period that the change was made if the change affects only that period, or in the period that the change is made
and in future periods if the change affects both the current period and future periods. Estimations made by
company management that have a material impact on the financial statements, and assessments made that can
entail significant adjustments in subsequent years' financial statements, are described in more detail in note 42.
The accounting policies described below have been applied consistently in all periods presented in the financial
statements unless otherwise indicated below.
New and amended IFRSs and interpretations applied in 2012
The following new and amended standards and interpretations took effect and apply for the 2012 financial year:
Standards
Amendments to IFRS 7 Financial Instruments: Disclosures (Disclosures of transfers of financial assets)
Amendment to IAS 12 Income Taxes (Deferred tax: Recovery of underlying assets)
Interpretations
No new interpretations took effect for the 2012 financial year.
TRYGG-HANSA ANNUAL REPORT 2012
19
In the opinion of company management, other new and amended IFRSs and interpretations have not had any
effect on the company's financial statements in 2012.
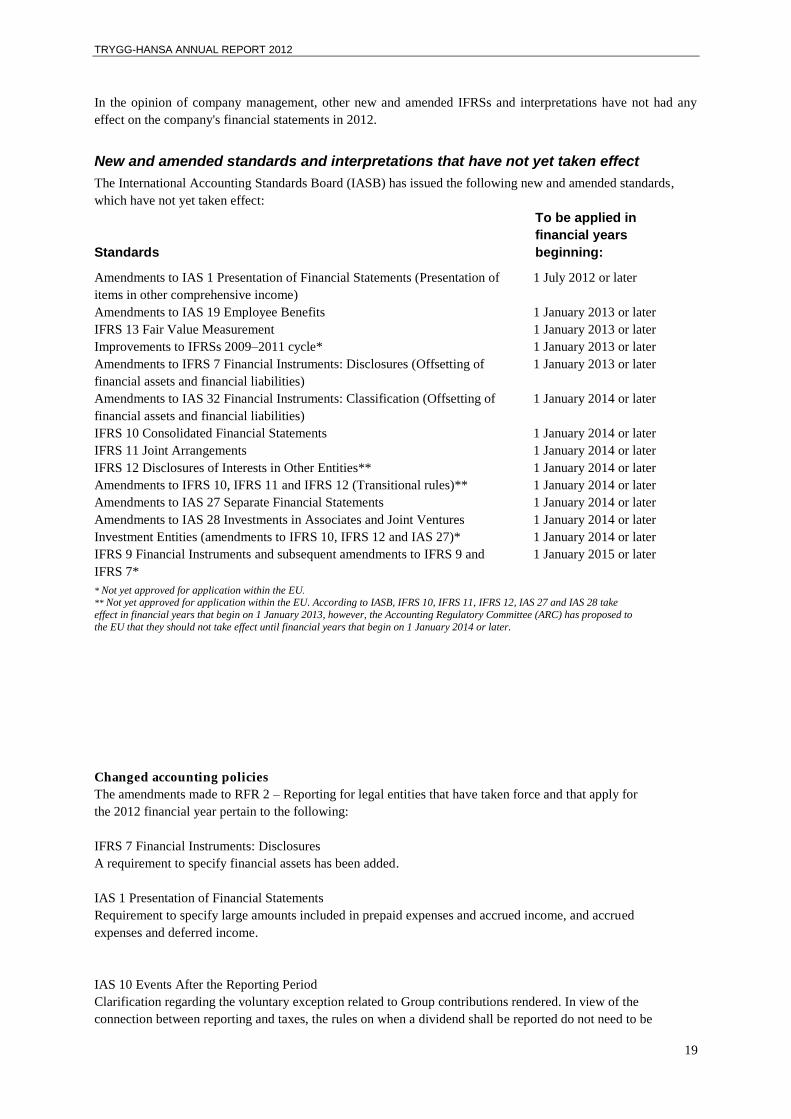
New and amended standards and interpretations that have not yet taken effect
The International Accounting Standards Board (IASB) has issued the following new and amended standards,
which have not yet taken effect:
Standards
To be applied in
financial years
beginning:
Amendments to IAS 1 Presentation of Financial Statements (Presentation of
items in other comprehensive income)
1 July 2012 or later
Amendments to IAS 19 Employee Benefits 1 January 2013 or later
IFRS 13 Fair Value Measurement 1 January 2013 or later
Improvements to IFRSs 2009–2011 cycle* 1 January 2013 or later
Amendments to IFRS 7 Financial Instruments: Disclosures (Offsetting of
financial assets and financial liabilities)
1 January 2013 or later
Amendments to IAS 32 Financial Instruments: Classification (Offsetting of
financial assets and financial liabilities)
1 January 2014 or later
IFRS 10 Consolidated Financial Statements 1 January 2014 or later
IFRS 11 Joint Arrangements 1 January 2014 or later
IFRS 12 Disclosures of Interests in Other Entities** 1 January 2014 or later
Amendments to IFRS 10, IFRS 11 and IFRS 12 (Transitional rules)** 1 January 2014 or later
Amendments to IAS 27 Separate Financial Statements 1 January 2014 or later
Amendments to IAS 28 Investments in Associates and Joint Ventures 1 January 2014 or later
Investment Entities (amendments to IFRS 10, IFRS 12 and IAS 27)* 1 January 2014 or later
IFRS 9 Financial Instruments and subsequent amendments to IFRS 9 and
IFRS 7*
1 January 2015 or later
* Not yet approved for application within the EU.
** Not yet approved for application within the EU. According to IASB, IFRS 10, IFRS 11, IFRS 12, IAS 27 and IAS 28 take
effect in financial years that begin on 1 January 2013, however, the Accounting Regulatory Committee (ARC) has proposed to
the EU that they should not take effect until financial years that begin on 1 January 2014 or later.
Changed accounting policies
The amendments made to RFR 2 – Reporting for legal entities that have taken force and that apply for
the 2012 financial year pertain to the following:
IFRS 7 Financial Instruments: Disclosures
A requirement to specify financial assets has been added.
IAS 1 Presentation of Financial Statements
Requirement to specify large amounts included in prepaid expenses and accrued income, and accrued
expenses and deferred income.
IAS 10 Events After the Reporting Period
Clarification regarding the voluntary exception related to Group contributions rendered. In view of the
connection between reporting and taxes, the rules on when a dividend shall be reported do not need to be
TRYGG-HANSA ANNUAL REPORT 2012
20
applied for a legal entity with respect to Group contributions.
IAS 19 Employee Benefits
The prohibition against recognising actuarial gains and losses in other comprehensive income has been
removed.
The amendments to RFR 2 – Reporting for legal entities that take effect on 1 January 2013 with respect
to the reporting of group contributions, are applied prospectively by Trygg-Hansa. According to the main
rule, group contributions received from subsidiaries are to be reported as financial income. Group
contributions made by a parent company to a subsidiary are reported as an increase in participations in
group companies. Group contributions that a subsidiary makes to a parent company are reported in
equity. Group contributions that are received from a sister company are reported in equity. Group
contributions made to a sister company are also to be reported in equity. Trygg-Hansa has chosen to
report group contributions in accordance with the alternative rule, which entails that group contributions
received and rendered are reported as appropriations in the income statements of the rendering and
receiving entity, respectively.
The effect of amendments to RFR 2 on the company's financial statements are described below under the
heading "Group contributions and shareholder contributions for legal entities".
Other new and amended IFRSs and interpretations have not had any effect on this annual report.
Foreign currency
Transactions in foreign currency
Transactions in foreign currency are translated to the functional currency using the exchange rate in effect on the
transaction date.
Trygg-Hansa's functional currency is Swedish kronor (SEK), and in valuations of assets and liabilities in foreign
currency, the closing rates on the balance sheet date are used. Exchange rate movements are reported net in the
income statement on the line Investment income or Investment charges.
Foreign operations' financial statements
Assets and liabilities in foreign operations (branches), including goodwill, are translated from the functional
currency of the foreign operation to Swedish kronor at the exchange rate in effect on the balance sheet date.
Income and expenses in a foreign operation are translated to Swedish kronor at the average exchange rate, which
is an approximation of the exchange rates that applied on the respective transaction dates.
Insurance contracts
Operations reported as insurance contracts are reported in accordance with IFRS 4. Insurance contracts are
reported and valued in the income statement and balance sheet according to their economic significance and not
according to their legal form, in cases where these differ. Contracts that transfer significant insurance risk from
the policyholder to Trygg-Hansa and where Trygg-Hansa agrees to compensate the policyholder or other
beneficiary are reported as insurance contracts if a predefined, insured event should occur.
Reporting of insurance contracts
Recognition of income/Written premiums
Written premiums refer to total gross premiums for direct insurance and reinsurance accepted that is paid in or
can be credited to Trygg-Hansa for insurance contracts where the insurance period has started prior to the end of
the financial year. Written premiums also include premiums for insurance periods that have not begun until after
the end of the financial year, if by contract they are due for payment during the financial year.
TRYGG-HANSA ANNUAL REPORT 2012
21
By gross premiums is meant the contractual premiums for the entire insurance period less customary customer
rebates.
Renewal premiums that are not confirmed by the policyholder and premiums for newly contracted insurance
contracts are calculated in the amounts at which they are estimated to be received. Surrenders reduce written
premiums as soon as the amount is known. Supplemental premiums are calculated in the amounts at which they
are expected to be received. Written premiums are reported exclusive of taxes and other public charges that are
charged against the insurance premium.
Earned premiums correspond to the portion of written premium that is earned. Unearned premiums are reserved
in the provision for unearned premiums.
Technical provisions
Technical provisions consist of the provision for unearned premiums and unexpired risks and the provision for
claims outstanding. These provisions correspond to the insurance company's obligations under insurance
contracts in force.
Provision for unearned premiums and unexpired risks
This is a balance sheet item that consists of provisions that correspond to Trygg-Hansa's liability for insurance
events, management expenses and other expenses during the remainder of the contract period for insurance
contracts in force. By insurance contracts in force is meant insurance under existing contracts regardless of
whether these entirely or partly pertain to future insurance periods. In this calculation, an estimation is made of
the anticipated cost for claims that may occur during the remaining term of these insurance policies as well as
management expenses during this time. The cost estimates are based on Trygg-Hansa's experience, however,
consideration is also given to the observed as well as forecast trend in relevant costs.
The provision for unearned premiums is reported on an aggregated basis for Trygg-Hansa's total operations. By
unexpired risks is meant the risk that claims for indemnification and expenses for insurance contracts will not be
sufficiently covered by unearned and anticipated premiums after the end of the financial year.
For insurance policies with premiums paid over several years, the provision for unearned premiums is calculated
based on a precise estimation of the insurance company's liability for contracts in force as well as on the
anticipated claims payment pattern. The provision for unearned premiums is estimated with the help of the
unearned portion of the premium for policies in force, i.e., on a pro rata temporis basis.
If the premium level of insurance policies in force is judged to be insufficient, a provision for unexpired risks is
made. The change during the period in the provision for unearned premiums and unexpired risks is reported in
the income statement.
Changes resulting from translation of the provisions at the exchange rate in effect on the balance sheet date are
reported as a foreign exchange gain or foreign exchange loss under the item investment income.
Provision for claims outstanding
The provision for claims outstanding is a balance sheet item consisting of estimated, undiscounted cash flows
pertaining to final costs for satisfying all claims arising from events that have occurred prior to the end of the
financial year less amounts already paid out in claims for indemnification. The amount includes calculated,
undiscounted cash flows pertaining to future operating expenses for settling claims that have been incurred but
not finally settled as per the balance sheet date and bonuses that have fallen due for payment. The item also
includes provisions for property and casualty annuities and disability annuities as well as provisions for future,
special employer's payroll tax on benefits from disability pension insurance during the early retirement period.
These provisions are also based on estimated, undiscounted cash flows.
The provision for claims outstanding is not discounted, with two exceptions. The provision for claims
outstanding for disability and accident insurance, where the duration of the provision is estimated to be more
than four years, has been discounted using the current interest rate curve for the period. Trygg-Hansa discounts
this provision based on a euro swap–based interest curve adjusted for the difference between the interest rate for
Swedish and German government bonds, which is then compared with the lowest of the company's direct yield
during the past year and the yearly average for the last five years (in accordance with FFFS 2008:26).

TRYGG-HANSA ANNUAL REPORT 2012
22
The provision for property and casualty annuities has been discounted using the current interest rate curve for the
period. This calculation is made in accordance with the Financial Supervisory Authority's regulation FFFS
2011:22.
Discounting has been done using generally accepted actuarial methods and is justified by the long amount of
time that passes from when the level of indemnification has been determined to when the claims have been
finally settled.
The provision for incurred but not reported (IBNR) claims covers costs for claims that have been incurred but
are still unknown and the estimated trend in reported claims. The amount is an estimation based on historical
experience and claims experience.
The change in claims outstanding for the period is recognised in the income statement. Changes that are
explained by translation of the provision items to the exchange rate in effect on the balance sheet date are
reported as a foreign exchange gain or foreign exchange loss under the item investment income.
Bonuses and rebates
These consist of provisions for bonuses and rebates to policyholders or other beneficiaries.
Liability adequacy test
The company's applied accounting and valuation policies for the balance sheet items "deferred acquisition costs"
and "provision for unearned premiums and unexpired risks" automatically entail a test to ensure that the
provisions are adequate with respect to anticipated future cash flows.
Deferred acquisition costs for insurance contracts
Acquisition costs that have a clear connection with the purchase of insurance contracts are reported as an asset.
Deferred acquisition costs consist of operating expenses that are directly or indirectly attributable to purchases of
or renewals of insurance contracts, such as commissions, marketing outlays, and salaries and overhead for sales
staff. Acquisition costs are deferred only for insurance contracts or homogenous groups of contracts that can be
monitored and that are judged to generate a margin that as a minimum covers the acquisition costs. Deferred
acquisition costs are amortised over a 12-month period in a way that corresponds to the apportionment of earned
premiums for the insurance in question. The amortisation schedules takes anticipated surrenders into account.
The asset is tested for impairment every year to ensure that the contracts are judged to generate a margin that, as
a minimum, covers the asset. Other costs for insurance contracts are reported as expenses when they arise.
Operating expenses
All operating expenses are distributed in the income statement according to the following functions: acquisition,
claims settlement, administration, commissions and profit participations in ceded reinsurance, investment
charges, and in certain cases other technical charges.
Claims incurred
The change in technical provisions for insurance contracts is recognised through profit or loss under the
respective headings. Payments to policyholders during the financial year as a result of insurance contracts or
insurance claims that have been incurred are reported as claims paid, regardless of when the claim was incurred.
Incentive remuneration
The RSA Group has established an employee option programme, which is settled with shares in RSA Insurance
Group plc. The fair value of the benefit of options or shares is reported as an expense and is distributed over the
vesting period. The total amount including social security charges that is expensed during the vesting period is
determined on the basis of the fair value of options or shares. The fair value is determined on the grant date.
Ceded reinsurance
Amounts paid out during the financial year or amounts recognised as a liability to insurance companies that have
accepted reinsurance business under reinsurance contracts in force are reported as premiums for ceded
reinsurance. The premiums are allocated in such a way that the cost is apportioned to the period that the
insurance cover pertains to.
TRYGG-HANSA ANNUAL REPORT 2012
23
The reinsurers' share of technical provisions corresponds to the reinsurers' liability for technical provisions for
contracts in force. Trygg-Hansa estimates the need to recognise impairment of assets pertaining to reinsurance
contracts each quarter. If the recoverable value is lower than the carrying amount of the asset, the asset is written
down to the recoverable value and the impairment is recognised in the income statement.
Accepted reinsurance For accepted reinsurance, the same rules apply as for ceded reinsurance, except conversely.
Reporting of investment return
Allocated investment return transferred from the non-technical account for property & casualty insurance
Investment income is transferred from non-technical account to the technical account based on average technical
provisions for own account after deducting net receivables in the insurance operations.
The investment return that is transferred is calculated using an interest rate that corresponds to the interest rate
for government bonds with a duration that essentially corresponds to the duration of the technical provisions.
The interest rate for 2012 was 1.21% (2.29%).
Investment income
The item "investment income" pertains to income from investments and includes rents from land and buildings,
dividends from shares and participations (including dividends from shares in Group companies and associates),
interest income, foreign exchange gains (net), reversed impairment charges and capital gains (net).
Investment charges
The item "investment charges" pertains to costs for investments and includes operating expenses for land and
buildings, asset management costs, interest expenses, foreign exchange losses (net), depreciation and impairment
charges, and capital losses (net).
Realised and unrealised changes in value
For investments carried at cost, the capital gain consists of the positive difference between the sales price and
book value. For investments carried at fair value, the capital gain consists of the positive difference between the
sales price and cost. For fixed-income securities, cost consists of amortised cost, while for other investments it
consists of the historic cost. Upon the sale of investments, previously unrealised changes in value are entered as
an adjustment item under unrealised gains on investments and unrealised losses on investments, respectively.
Capital gains on other assets than investments are reported as other income.
Unrealised gains and losses are reported net per asset class. Changes attributable to exchange differences are
reported as a foreign exchange gain or foreign exchange loss under investment income.
Taxes
Income tax
Income taxes consist of current tax and deferred tax. Income taxes are reported in the income statement except
for when the underlying transaction is reported directly against equity, whereby the related tax effect is reported
in equity.
Current tax is tax that is to be paid or received for the current year, with application of the tax rates that have
been set or essentially been set as per the balance sheet date. This also includes adjustments of current tax
pertaining to previous periods.
Deferred tax is calculated according to the balance sheet method based on temporary differences between
reported and tax values of assets and liabilities. Temporary differences are not taken into account for differences
that have arisen upon initial recognition of goodwill, nor for initial reporting of assets and liabilities that are not
business combinations which at the time of the transaction do not affect the reported or taxable profit.
Additionally, nor are temporary differences taken into account that are attributable to shares in subsidiaries and
associates that are not expected to be reversed in the foreseeable future. The valuation of deferred tax is based on
how underlying assets or liabilities are expected to be realised or settled. Deferred tax is calculated using the tax
rates that are set or in practice set as per the balance sheet date.

TRYGG-HANSA ANNUAL REPORT 2012
24
Deferred tax assets pertaining to deductible temporary differences and loss-carryforwards are reported only to
the extent that it is likely that these will be utilised. The value of deferred tax assets is reduced when it is no
longer judged likely that they can be utilised. Any additional income tax that arises in connection with dividends
is reported at the same point in time as when the dividend is reported as a liability. In calculating deferred tax, a
tax rate of 22% has been used for 2012.
Contingency reserve
The contingency reserve is an untaxed reserve. Changes are recognised through profit or loss. The basis for
calculation is based on a directive from the Financial Supervisory Authority on a so-called normal plan for
calculating the contingency reserve (FFFS 2011:9). The directive indicates the maximum amount that may be
allocated to the contingency reserve, based on written premiums and the provision for claims outstanding in
certain lines of insurance. Trygg-Hansa continuously calculates the maximum scope for provisions. At year-end
the company had not utilised the maximum scope.
Group contributions and shareholder contributions for legal entitles
Trygg-Hansa reports shareholder contributions in accordance with pronouncement RFR 2 issued by the Swedish
Financial Accounting Board. Shareholder contributions are recognised directly against equity of the recipient
and are capitalised in shares and participations of the rendering party, to the extent it is not necessary to
recognise impairment. Group contributions are reported in accordance with prospective application of the
alternative rule under RFR 2. Group contributions rendered and received are reported as an appropriation in the
income statements of the rendering and receiving entities, respectively.
During the year, Trygg-Hansa made Group contributions of SEK 115.0 m to Sveland Sakförsäkringar AB, SEK
9.7 m to WLI AB, SEK 0.3 m to Brädstapeln, and SEK 55.0 m to Codan Forsikring A/S, Sweden branch.
Intangible assets
Goodwill and acquired insurance portfolios
Goodwill represents the difference between the cost of a business combination and the fair value of acquired,
identified assets, assumed liabilities and contingent liabilities. Goodwill with an indefinite lifetime is amortised,
in accordance with the Annual Accounts Act. This entails an amortisation schedule of five years for normal
cases.
Intangible assets attributable to acquisitions of insurance portfolios are amortised over a period of 10 years.
IT development
IT development is capitalised as an intangible asset when the project meets all requirements for capitalisation.
The requirements entail, among other things, that there is an adequate degree of certainty that the respective
activity will give rise to economic benefit that exceeds the costs.
Completed development projects are taken up at accrued cost less accumulated amortisation and impairment.
Amortisation is recognised through profit or loss and is calculated on a straight-line basis over the anticipated
utilisation of the project, which normally amounts to 3 years, but can be 5-7 years.
Development projects that are not completed are tested at the accounting date for impairment.
Amortisation principles
Amortisation is recognised through profit or loss on a straight-line basis over the estimated useful life of the
intangible asset. Useful life is reconsidered annually. Eligible intangible assets are amortised from the date that
they are available for use. The periods of calculated useful life are as follows:
Development costs brought forward, ordinarily 3 years, but can be 5-7 years
Acquired insurance portfolios 10 years
Other intangible assets 5 years
TRYGG-HANSA ANNUAL REPORT 2012
25
Land and buildings
Investment properties are properties held for the purpose of generating rental income and/or value appreciation.
Owner-occupied properties are properties held for use in the company's own operations. Investment properties as
well as owner-occupied properties are carried at fair value on the balance sheet. All changes in value are
recognised through profit or loss. Fair value is based on appraisals performed by independent appraisers.
Appraisals are normally performed once a year.
Fair value is determined through a combination of the local price comparison method, which is based on
comparative purchases, and the return method. The return method is based on the present value of discounted
future cash flows and an estimated residual value for each respective property.
Realised as well as unrealised changes in value are recognised through profit or loss. Rents are reported under
Investment income, and property costs are reported under Investment charges.
Shares and participations in Group companies and associates
Participations in subsidiaries and associates are carried at cost. Capital contributions are booked as an increase in
the value of the participation. If the participations have a lower value on the balance sheet date than their cost,
and the decrease in value is judged to be permanent, then the holding is written down to that value.
Financial instruments
Financial instruments reported on the balance sheet include, on the assets side, trade accounts receivable,
equities, loan receivables, fixed-income securities and derivatives. Among liabilities and equity are trade
accounts payable, loan liabilities and derivatives. Acquisitions and sales of financial assets are reported as per
the transaction date, which is the date that Trygg-Hansa commits itself to acquiring or selling the asset.
Classification and valuation
Financial instruments that are not derivatives are initially carried at cost, corresponding to the instrument's fair
value plus transaction costs for all financial instruments except for those that belong to the category financial
assets at fair value through profit or loss, which are carried at fair value excluding transaction costs.
A financial instrument is classified upon initial accounting based on the purpose for which the instrument was
acquired. This classification determines how the financial instrument is valued after the first accounting
occasion, as described below.
Derivatives that are not identified as a hedge are classified as held for trading. These are stated at fair value, and
changes in fair value along with realised gains and losses, and interest income and expenses, are recognised
through profit or loss. Contracts used for hedging purposes but which do not qualify for hedge accounting
according to IAS 39 are treated as derivatives held for trading.
Financial assets at fair value through profit or loss
This category consists of two sub-groups: financial assets held for trading and other financial assets that Trygg-
Hansa has initially opted to place in this category (according to the Fair Value Option). Financial instruments in
this category are continuously measured at fair value with changes in value recognised through profit or loss.
The first sub-group includes derivatives with a positive value, with the exception of derivatives that are
identified as an effective hedge instrument.
As a matter of principle, Trygg-Hansa classifies all investments that are financial instruments and that are not
shares in subsidiaries in the category "financial assets at fair value through profit or loss", since Trygg-Hansa
continuously evaluates the asset management activities on the basis of fair value.
Calculation of fair value
Fair value is the amount for which an asset could be transferred to, or a liability settled, between knowledgeable,
willing parties in an arm's length transaction. Following is a summary of the methods and assumptions that are
primarily used to determine the fair value of financial instruments.
Financial instruments quoted in an active market
For financial instruments that are quoted in an active market, fair value is determined based on the asset's quoted
purchase price on the balance sheet date excluding transaction costs (e.g., brokerage fees) associated with the
TRYGG-HANSA ANNUAL REPORT 2012
26
acquisition. A financial instrument is considered to be quoted in an active market if quoted prices are easily
available on a stock exchange, from a trader, broker, trade organisation, or company that provides current price
information or oversight authority, and these prices represent actual and regularly occurring market transactions
at market terms. Any future transaction costs associated with a sale are not taken into account. For financial
liabilities, fair value is determined based on the quoted selling price. Financial instruments quoted in an active
market are included among the balance sheet items "shares and participations", and "bonds and other fixed-
income securities". The greatest share of Trygg-Hansa's financial instruments are ascribed a fair value based on
prices that are quoted in an active market.
Financial instruments that are not quoted in an active market
If the market for a financial instrument is not active, Trygg-Hansa determines fair value by employing a
valuation technique. The valuation techniques used are based to the greatest extent possible on market data,
while company-specific data is used as little as possible.
Trygg-Hansa calibrates the valuation technique at regular intervals and tests its validity by comparing the
outcome of the valuation technique with prices from observable, current market transactions with the same type
instrument. Valuation techniques are used for the following classes of financial instruments:
Derivatives
Derivative instruments are initially stated at fair value based on the value received from the counterparty. Fair
value in subsequent valuations is calculated using a valuation model that is established in the market for
assessing the value of the type of derivative instrument in question.
Shares and fixed-income securities
The fair value of financial instruments that are not derivatives is calculated based on the future cash flows of
principal and interest discounted to current market interest rates on the balance sheet date. In cases where
discounted cash flows have been used, future cash flows are calculated based on company management's best
estimates. The discount rate that is used is a market-based interest rate for similar instruments on the balance
sheet date. Where other valuation models are used, the input data is based on market-related data on the balance
sheet date.
Other interest-bearing assets and liabilities
Fair value of loan receivables has been calculated by discounting anticipated future cash flows, where the
discount rate has been set based on the current lending rate that is used.
For receivables and liabilities with a remaining lifetime of less than six months, the carrying amount reflects the
fair value. Receivables and liabilities with a lifetime exceeding six months are discounted in connection with the
determination of fair value.
Loans to Group companies
Trade accounts receivable and loan receivables are reported in the amount at which they are expected to be
received.
Loan receivables and trade accounts receivable
Loan receivables and trade accounts receivable are financial assets that are not derivatives, which have fixed or
determinable payments and which are not quoted in an active market. These assets are valued at amortised cost.
Amortised cost is determined according to the effective interest rate that was calculated at the date of acquisition.
Trade accounts receivable and loan receivables are carried at the amounts at which they are expected to be paid-
in, i.e., after deducting for impaired receivables.
Available-for-sale financial assets
The category "available-for-sale financial assets" includes financial assets that are not classified in any other
category or financial assets that the company has initially chosen to classify in this category. Holdings of shares
and participations that are not reported as subsidiaries, associates or joint ventures are reported here. Assets in
this category are valued on a continuous basis at fair value, with changes in value reported against equity, but not

TRYGG-HANSA ANNUAL REPORT 2012
27
changes in value that are attributable to impairment (see accounting policies) or to exchange differences in
monetary items that are recognised through profit or loss. In addition, interest on fixed-income instruments as
well as dividends from stocks are reported in accordance with the effective interest method through profit or
loss. For these instruments, any transaction costs are included in the cost upon initial reporting; thereafter, they
are included in continuous valuations at fair value in a fair value reserve until the instrument falls due or is sold.
In connection with the sale of the asset, the accumulated profit or loss that was previously recognised in equity is
recognised through profit or loss.
Financial liabilities at fair value through profit or loss
This category consists of financial liabilities held for trading. The category includes the insurance company's
derivatives with a negative fair value, with the exception of derivatives that are identified as an effective hedge
instrument. Changes in fair value are reported through profit or loss.
Other financial liabilities
Borrowings and other financial liabilities, such as trade accounts payable, are included in this category. The
liabilities are stated at amortised cost.
Impairment of financial instruments
On each reporting occasion, Trygg-Hansa performs a measurement to determine if there is objective evidence
that indicates a need to recognise impairment for an asset or group of assets as a result of one or more events
(loss events) that have occurred after the asset was initially reported and that these loss events have an impact on
the estimated future cash flows from the asset or group of assets. If there is objective evidence that indicates a
need to recognise impairment, then the assets are to be regarded as impaired. Objective evidence consists in part
of observable conditions that have occurred and which have a negative impact on the ability to recover the asset's
cost and in part of a significant or prolonged decline in the fair value of an investment in a financial instrument
classified as an available-for-sale financial asset.
Upon recognising impairment of an equity instrument that is classified as an available-for-sale financial asset,
the previously reported accumulated profit or loss in equity is re-entered through profit or loss. The carrying
amount after impairment of assets belonging to the categories "held-to-maturity investments", "loan receivables"
and "trade accounts receivable", which are stated at amortised cost, is calculated as the present value of future
cash flows discounted using the effective interest rate that applied upon initial reporting of the asset. Assets with
short durations are not discounted. Impairment charges are reported in profit or loss.
Reversal of impairment losses
An impairment charge is reversed if there is both evidence that the need to recognise impairment no longer exists
and a change has taken place in the assumptions that served as the basis for the calculation of the impaired
amount. Impairment of held-to-maturity investments or loan receivables and trade accounts receivable that are
stated at amortised cost is reversed if a subsequent increase in the recoverable value can objectively be attributed
to an event that has occurred after the impairment charge was made.
Impairment of equity instruments that are classified as available-for-sale financial assets that were previously
recognised through profit or loss is not reversed through profit or loss. The impaired amount is the value from
which subsequent valuations are made and is reported directly against equity. Impairment of fixed-income
instruments classified as available-for-sale financial assets is reversed through profit or loss if the fair value
increases and the increase can be objectively attributed to an event that occurred after the impairment charge was
made.
Tangible assets
Tangible assets are carried as an asset on the balance sheet if it is likely that future economic benefit will be
generated and the cost of the asset can be calculated in a reliable manner.
Tangible assets are carried at cost after deducting accumulated depreciation and any impairment plus any
revaluations.
The carrying amount of property, plant and equipment is eliminated from the balance sheet in connection with
obsolescence or the sale of the asset, or when no economic benefit is expected from use or in connection with the
disposal/sale of the asset. The profit or loss that arises upon the sale or disposal of an asset consists of the
difference between the sales price and the asset's carrying amount less direct selling costs.
TRYGG-HANSA ANNUAL REPORT 2012
28
Depreciation is booked on a straight-line basis over the asset's estimated useful life. The residual value and
useful life of assets are reviewed annually.
Estimated useful life:
Machinery and other technical plant 3-10 years
Equipment, tools and installations 3-10 years
Impairment of tangible and intangible assets
Impairment testing of tangible and intangible assets, and of shares in subsidiaries, associates, etc.
The carrying amounts of assets are tested for impairment at every balance sheet date. If there is an indication of a
need to recognise impairment, the asset's recoverable amount is calculated in accordance with IAS 36 (see
below).
For goodwill and intangible assets that are not ready for use, the recoverable amount is calculated annually. If it
is not possible to determine materially independent cash flows for an individual asset, when testing for
impairment the assets are grouped at the lowest level at which it is possible to identify materially independent
cash flows – in a cash-generating unit.
An impairment loss is recognised when an asset's or cash-generating unit's (group of units) carrying amount
exceeds the recoverable amount. Impairment losses are recognised in profit or loss. Impairment of assets
attributable to a cash-generating unit (group of units) is primarily allocated to goodwill. Thereafter, a
proportional impairment loss is recognised for other assets included in the unit (group of units). The recoverable
amount is the higher of the fair value less selling costs and value in use. When calculating value in use, future
cash flows are discounted using a discounting factor that takes into account risk-free interest and the risk
associated with the specific asset.
Reversal of impairment losses
An impairment loss is reversed if there is both an indication that the need to recognise impairment no longer
exists and a change has taken place in the assumptions that formed the basis for the calculation of the
recoverable amount. However, impairment of goodwill is never reversed. Reversals are only made to the extent
that the asset's carrying amount, after reversal, does not exceed the carrying amount that would have been
recognised, less a deduction for amortisation where applicable, if no impairment loss had been recognised.
Dividends
Dividends are reported as a receivable or liability after the Annual General Meeting has approved the dividend.
Other provisions
A provision differs from other liabilities in that there is uncertainty regarding the date of payment or the amount
required to settle the provision. A provision is recognised on the balance sheet when the insurance company has
an existing legal or constructive obligation as a result of an event that has occurred, if it is probable that an
outflow of economic resources will be required to settle the obligation, and if a reliable estimation of the amount
can be made. When the effect of when in time payment is made is significant, provisions are calculated by
discounting the anticipated future cash flow using an interest rate before tax that reflects current market
assessments of the time value of money and, where applicable, the risks associated with the liability.
Pensions and similar obligations
Pensions secured through insurance
Trygg-Hansa's occupational pension plans under collective bargaining agreements are secured through insurance
contracts. The pension plan for Trygg-Hansa's employees has been judged to be a multi-employer defined
benefit plan. However, Trygg-Hansa is of the opinion that UFR 6 Pension Plans, which covers multi-employer
arrangements, is applicable also for the company's pension plan. Trygg-Hansa lacks adequate information that
would enable reporting in accordance with IAS 19 and therefore classifies these pension plans as defined
contribution plans in accordance with UFR 6.

TRYGG-HANSA ANNUAL REPORT 2012
29
Trygg-Hansa's obligations pertaining to charges for defined contribution plans are reported as an expense in the
income statement in pace with the employees' earnings of such contributions, as the employees perform services
for the company during a given period.
Pensions under own management
In addition to the occupational pension plans secured through insurance contracted under collective bargaining
agreements, Trygg-Hansa has also made special agreements with certain employees. Under such previous
collective agreements, employees who conclude their service from 62 years of age receive benefits from the
company corresponding to a certain percentage of their final salary.
Actuarial gains and losses are reported in accordance with the Pension Obligations Vesting Act
(Tryggandelagen). Actuarial gains and losses are recognised in profit or loss.
Contingent liabilities
A contingent liability is reported when there is a possible obligation that arises from past events and whose
existence is confirmed only by the occurrence or non-occurrence of one or more uncertain future events or when
there is a present obligation that is not recognised as a liability or provision due to the fact that it is not probable
that an outflow of resources will be required.
Cash flow statement
The cash flow statement is prepared in accordance with the direct method. The reported cash flow covers only
transactions that entail incoming or outgoing payments.
TRYGG-HANSA ANNUAL REPORT 2012
30
Note 2 Disclosures of risks
Risk management and control
For Trygg-Hansa as an insurance company and company that accepts risk, it is important that risks are managed
in a controlled manner. This puts demands on structured risk management. Risk management encompasses all
circumstances that could affect the company's future operation and development.
The Board of Directors is responsible for ensuring that the company is financially strong, taking into account the
company's funding needs, liquidity, financial position and generally accepted business practice.
The Board of Directors is ultimately responsible for risk management and internal control, including drawing up
parameters and control documents for risk management and risk control. The company's risk management shall
permeate the organisation, and accountability and transparency is strived for in terms of clear ownership of risks
and the management of these within the Risk Appetite.
For a number of years, Trygg-Hansa has been working with a uniform Nordic process to identify, assess and
monitor risks.
Trygg-Hansa operates a three-layered defense model. The operative activities make up the first line of defense.
Risk & Compliance units make up the second line of defense, and Internal Audit makes up the third line of
defense.
Risk & Compliance ensures that relevant risk information is discussed and challenged by the management of
Trygg-Hansa to analyse the risk exposure. One of the main activities of the function is the capability building,
challenge and control of the of risk assessment from the first line of defense, with input from the Insurance Risk
team that reports to Underwriting & Insurance with a dotted line to the Chief Risk & Compliance Officer. Risk
& Compliance also monitors the risk management system maturity in the organization and develops the
governance in terms of risk i.e. risk strategy and appetite. Furthermore, the Financial Control Framework
embedment on the business is continuously monitored. The Financial Control Framework applies to the most
critical processes leading to the financial reports and is build to ensure that no material misstatements is reported.
In addition, Risk & Compliance serves in a supporting role to ensure that operations are conducted in accordance
with applicable rules and monitors regulatory compliance. With regards to financial risks, Risk Department
within Risk & Compliance presents independent views to relevant committees, which are in turn challenged and
reviewed at the Risk Management Forum.
Internal Audit performs independent assessments of risk management on a regular basis in accordance with the
agreed Internal Audit year plan and verifies that controls are suited for their purpose. Internal Audit reports to the
Board of Directors on a quarterly basis.
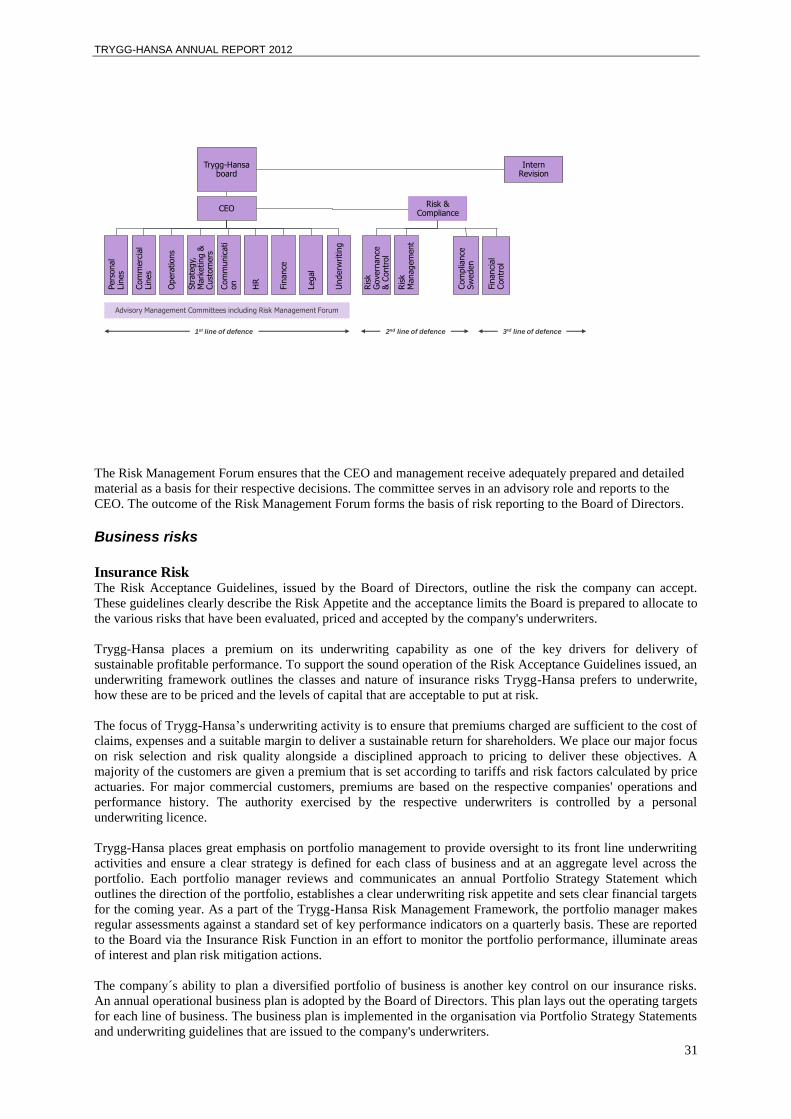
TRYGG-HANSA ANNUAL REPORT 2012
31
CEO
Trygg-Hansaboard
Pers
onal
Lin
es
Com
merc
ial
Lin
es
Opera
tions
Str
ate
gy,
M
ark
eting &
Cust
om
ers
Com
munic
ati
on
Fin
ance
Legal
Underw
riting
1st line of defence
Risk & Compliance
Ris
k
Govern
ance
&
Contr
ol
Ris
k
Managem
ent
2nd line of defence
Intern Revision
3rd line of defence
HR
2
Advisory Management Committees including Risk Management Forum
Fin
anci
al
Contr
ol
Com
plia
nce
Sw
eden
The Risk Management Forum ensures that the CEO and management receive adequately prepared and detailed
material as a basis for their respective decisions. The committee serves in an advisory role and reports to the
CEO. The outcome of the Risk Management Forum forms the basis of risk reporting to the Board of Directors.
Business risks
Insurance Risk The Risk Acceptance Guidelines, issued by the Board of Directors, outline the risk the company can accept.
These guidelines clearly describe the Risk Appetite and the acceptance limits the Board is prepared to allocate to
the various risks that have been evaluated, priced and accepted by the company's underwriters.
Trygg-Hansa places a premium on its underwriting capability as one of the key drivers for delivery of
sustainable profitable performance. To support the sound operation of the Risk Acceptance Guidelines issued, an
underwriting framework outlines the classes and nature of insurance risks Trygg-Hansa prefers to underwrite,
how these are to be priced and the levels of capital that are acceptable to put at risk.
The focus of Trygg-Hansa’s underwriting activity is to ensure that premiums charged are sufficient to the cost of
claims, expenses and a suitable margin to deliver a sustainable return for shareholders. We place our major focus
on risk selection and risk quality alongside a disciplined approach to pricing to deliver these objectives. A
majority of the customers are given a premium that is set according to tariffs and risk factors calculated by price
actuaries. For major commercial customers, premiums are based on the respective companies' operations and
performance history. The authority exercised by the respective underwriters is controlled by a personal
underwriting licence.
Trygg-Hansa places great emphasis on portfolio management to provide oversight to its front line underwriting
activities and ensure a clear strategy is defined for each class of business and at an aggregate level across the
portfolio. Each portfolio manager reviews and communicates an annual Portfolio Strategy Statement which
outlines the direction of the portfolio, establishes a clear underwriting risk appetite and sets clear financial targets
for the coming year. As a part of the Trygg-Hansa Risk Management Framework, the portfolio manager makes
regular assessments against a standard set of key performance indicators on a quarterly basis. These are reported
to the Board via the Insurance Risk Function in an effort to monitor the portfolio performance, illuminate areas
of interest and plan risk mitigation actions.
The company´s ability to plan a diversified portfolio of business is another key control on our insurance risks.
An annual operational business plan is adopted by the Board of Directors. This plan lays out the operating targets
for each line of business. The business plan is implemented in the organisation via Portfolio Strategy Statements
and underwriting guidelines that are issued to the company's underwriters.

TRYGG-HANSA ANNUAL REPORT 2012
32
The Board also stipulates, through the Insurance Technical Guidelines the framework for the actuarial review of
rates and for calculating tariff-based pricing. In order to ensure that tariffs remain up to date our dedicated
personal and commercial pricing teams follow a structured pricing process to ensure our tariffs are positioned to
deliver our the results set in our business plan, dedicated personal and commercial pricing teams follow a
structured pricing process. There is robust challenge and interaction between the pricing and portfolio
management team to ensure that there is a clear link between portfolio strategy and pricing actions. All insurance
contracts are written for specified terms. The ability to alter the terms of a contract is a controlled via the
Delegated Authority Framework. All insurance policies have a built-in right for the insurance company to
decline a renewal or to amend the terms and conditions in connection with renewal. Exceptions are handled
through Executive Licence Extensions or Special High Risk Licences.
Trygg-Hansa reviews its contracted insurance risks on a regular basis and assesses these in relation to the
company's underwriting, reinsurance and capital policies.
Concentration of risks in the insurance operations The Risk Appetite Statement outlines how reinsurance protection is to be purchased to protect the company´s
balance sheet.
Insurance risk is concentrated on Sweden, which accounts for most of Trygg-Hansa's written premium. To
ensure that the company’s exposure to underwriting risk and its capital base remain appropriate, a structured
reinsurance programme is in place to protect the business against individual large losses on risks, as well as
catastrophe events such as weather related events.
Non-catastrophic risks The Trygg-Hansa reinsurance program for 2012 was an excess-of-loss program. All reinsurance contracts are
purchased on a Nordic or Global basis which has lead to substantial cost savings. The net retention for individual
Property risks was SEK 107,5 millions. The net retention was SEK 30 m for Liability risks, SEK 40 m for Motor
third-party liability risks, USD 2 m for Cargo risks and USD 15 m for Renewable Energy risks. Above Net
Retentions were reduced 10% by way of Quota Share cessions to RSA Reinsurance (Ireland) Limited.
Trygg-Hansa is also often requested to provide its customers with Property insurance against acts of terrorism.
Coverage for such events can be provided within the reinsurance purchased by Trygg-Hansa. For a few large
terrorism exposures, specific facultative reinsurance was also purchased during 2012 to minimize exposure to
Trygg-Hansa.
Storm and catastrophic risks In 2012, Trygg-Hansa had a shared reinsurance contract with other companies in the RSA Group to cover for
Property Natural Catastrophe events. This reinsurance was designed to provide protection against natural
catastrophe events with an occurrence probability of up to at least a 1:200 event, which is the equivalent of a
likelihood of once every 200 years or a 0.5% probability. In 2012 Trygg-Hansa had a maximum net retention of
GBP 15 m per event.
For Personal Accident and Life Catastrophe events of a sudden nature, like a ferry accident or a tsunami, Trygg-
Hansa had a shared reinsurance contract with the rest of the Codan Group companies. In 2012 Trygg-Hansa had
a maximum net retention of DKK 25 m per event.
Reinsurance contracts are associated with a certain level of credit risk. This is described in more detail under the
section on financial risks below. Reinsurers' credit worthiness is monitored on a regular basis to ensure that the
contracted reinsurance cover is maintained. This is reported to the Board of Directors on a quarterly basis.
Reserve-setting risk Reserve-setting risk, i.e., the risk that technical provisions will not be sufficient to settle incurred claims, is
managed primarily through developed actuarial methods and through careful, continuous monitoring of reported
claims.
The documentation for determining the level of provisions to cover future risks is based on Trygg-Hansa's
experience from previous and similar claims experience. Trygg-Hansa uses numerous statistical methods and
analyses to determine the likely outcome of future claims payments.
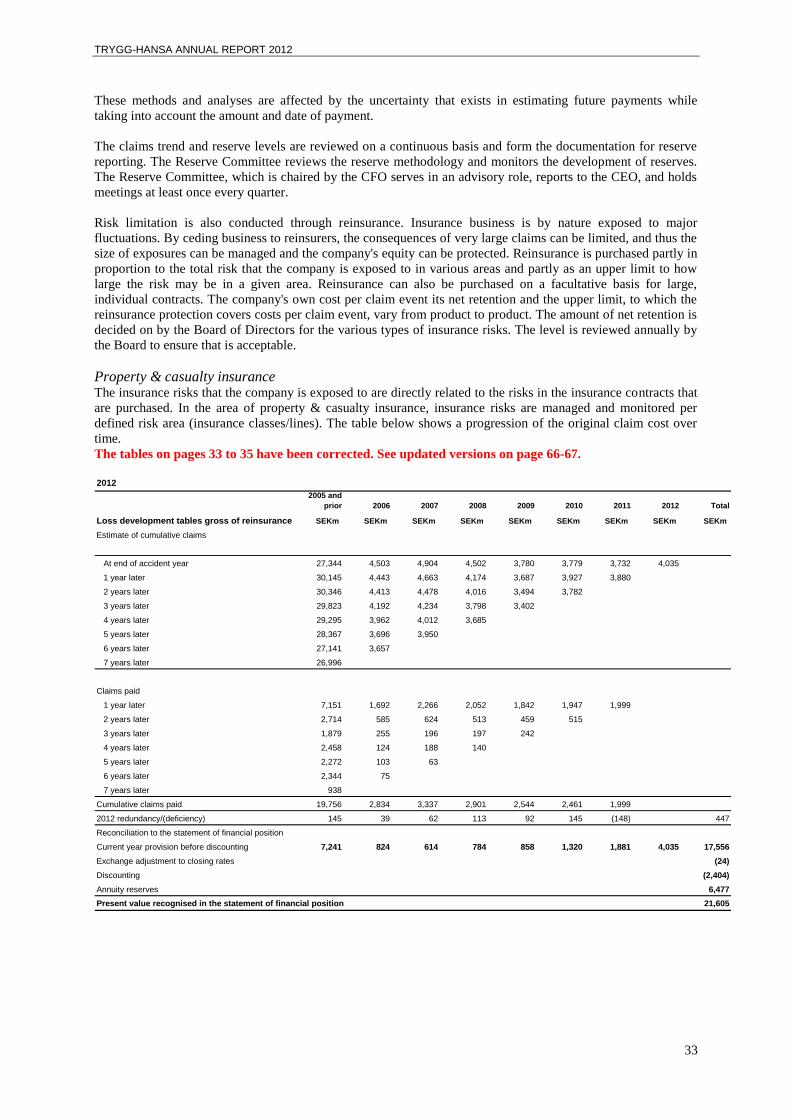
TRYGG-HANSA ANNUAL REPORT 2012
33
These methods and analyses are affected by the uncertainty that exists in estimating future payments while
taking into account the amount and date of payment.
The claims trend and reserve levels are reviewed on a continuous basis and form the documentation for reserve
reporting. The Reserve Committee reviews the reserve methodology and monitors the development of reserves.
The Reserve Committee, which is chaired by the CFO serves in an advisory role, reports to the CEO, and holds
meetings at least once every quarter.
Risk limitation is also conducted through reinsurance. Insurance business is by nature exposed to major
fluctuations. By ceding business to reinsurers, the consequences of very large claims can be limited, and thus the
size of exposures can be managed and the company's equity can be protected. Reinsurance is purchased partly in
proportion to the total risk that the company is exposed to in various areas and partly as an upper limit to how
large the risk may be in a given area. Reinsurance can also be purchased on a facultative basis for large,
individual contracts. The company's own cost per claim event its net retention and the upper limit, to which the
reinsurance protection covers costs per claim event, vary from product to product. The amount of net retention is
decided on by the Board of Directors for the various types of insurance risks. The level is reviewed annually by
the Board to ensure that is acceptable.
Property & casualty insurance The insurance risks that the company is exposed to are directly related to the risks in the insurance contracts that
are purchased. In the area of property & casualty insurance, insurance risks are managed and monitored per
defined risk area (insurance classes/lines). The table below shows a progression of the original claim cost over
time.
The tables on pages 33 to 35 have been corrected. See updated versions on page 66-67.
2012
2005 and
prior 2006 2007 2008 2009 2010 2011 2012 Total
Loss development tables gross of reinsurance SEKm SEKm SEKm SEKm SEKm SEKm SEKm SEKm SEKm
Estimate of cumulative claims
At end of accident year 27,344 4,503 4,904 4,502 3,780 3,779 3,732 4,035
1 year later 30,145 4,443 4,663 4,174 3,687 3,927 3,880
2 years later 30,346 4,413 4,478 4,016 3,494 3,782
3 years later 29,823 4,192 4,234 3,798 3,402
4 years later 29,295 3,962 4,012 3,685
5 years later 28,367 3,696 3,950
6 years later 27,141 3,657
7 years later 26,996
Claims paid
1 year later 7,151 1,692 2,266 2,052 1,842 1,947 1,999
2 years later 2,714 585 624 513 459 515
3 years later 1,879 255 196 197 242
4 years later 2,458 124 188 140
5 years later 2,272 103 63
6 years later 2,344 75
7 years later 938
Cumulative claims paid 19,756 2,834 3,337 2,901 2,544 2,461 1,999
2012 redundancy/(deficiency) 145 39 62 113 92 145 (148) 447
Reconciliation to the statement of financial position
Current year provision before discounting 7,241 824 614 784 858 1,320 1,881 4,035 17,556
Exchange adjustment to closing rates (24)
Discounting (2,404)
Annuity reserves 6,477
Present value recognised in the statement of financial position 21,605
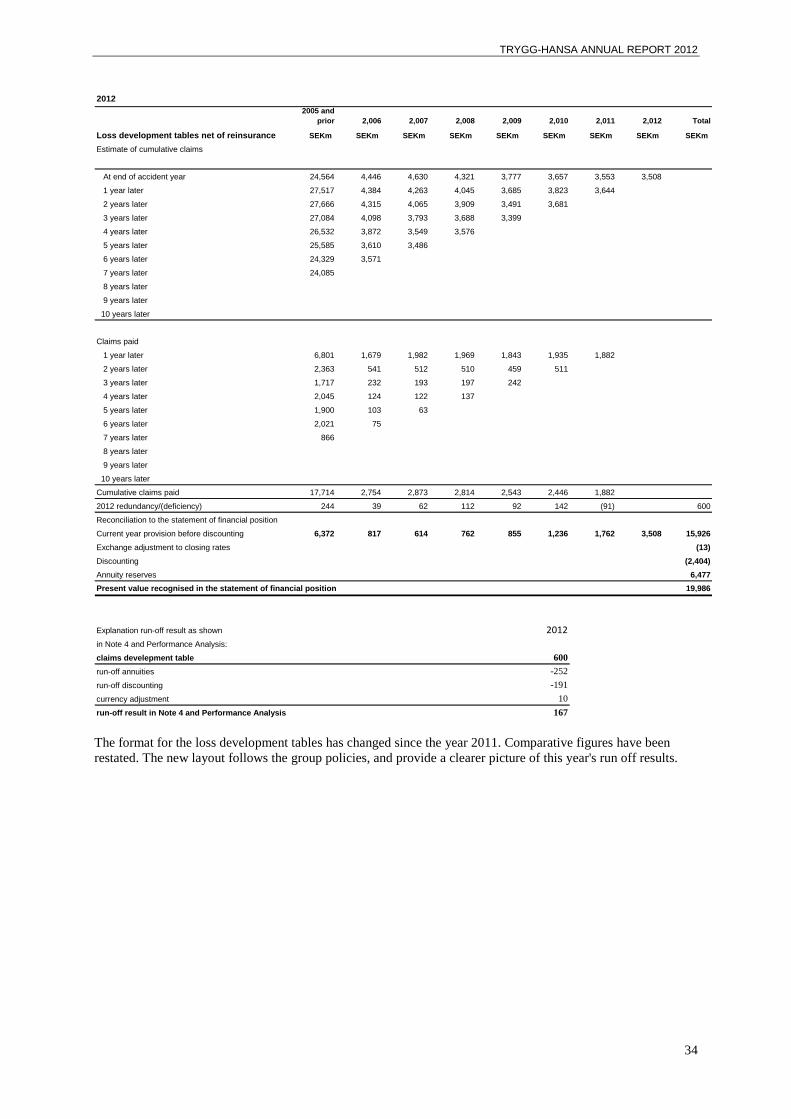
TRYGG-HANSA ANNUAL REPORT 2012
34
2012
2005 and
prior 2,006 2,007 2,008 2,009 2,010 2,011 2,012 Total
Loss development tables net of reinsurance SEKm SEKm SEKm SEKm SEKm SEKm SEKm SEKm SEKm
Estimate of cumulative claims
At end of accident year 24,564 4,446 4,630 4,321 3,777 3,657 3,553 3,508
1 year later 27,517 4,384 4,263 4,045 3,685 3,823 3,644
2 years later 27,666 4,315 4,065 3,909 3,491 3,681
3 years later 27,084 4,098 3,793 3,688 3,399
4 years later 26,532 3,872 3,549 3,576
5 years later 25,585 3,610 3,486
6 years later 24,329 3,571
7 years later 24,085
8 years later
9 years later
10 years later
Claims paid
1 year later 6,801 1,679 1,982 1,969 1,843 1,935 1,882
2 years later 2,363 541 512 510 459 511
3 years later 1,717 232 193 197 242
4 years later 2,045 124 122 137
5 years later 1,900 103 63
6 years later 2,021 75
7 years later 866
8 years later
9 years later
10 years later
Cumulative claims paid 17,714 2,754 2,873 2,814 2,543 2,446 1,882
2012 redundancy/(deficiency) 244 39 62 112 92 142 (91) 600
Reconciliation to the statement of financial position
Current year provision before discounting 6,372 817 614 762 855 1,236 1,762 3,508 15,926
Exchange adjustment to closing rates (13)
Discounting (2,404)
Annuity reserves 6,477
Present value recognised in the statement of financial position 19,986
Explanation run-off result as shown 2012
in Note 4 and Performance Analysis:
claims develepment table 600
run-off annuities -252
run-off discounting -191
currency adjustment 10
run-off result in Note 4 and Performance Analysis 167
The format for the loss development tables has changed since the year 2011. Comparative figures have been
restated. The new layout follows the group policies, and provide a clearer picture of this year's run off results.
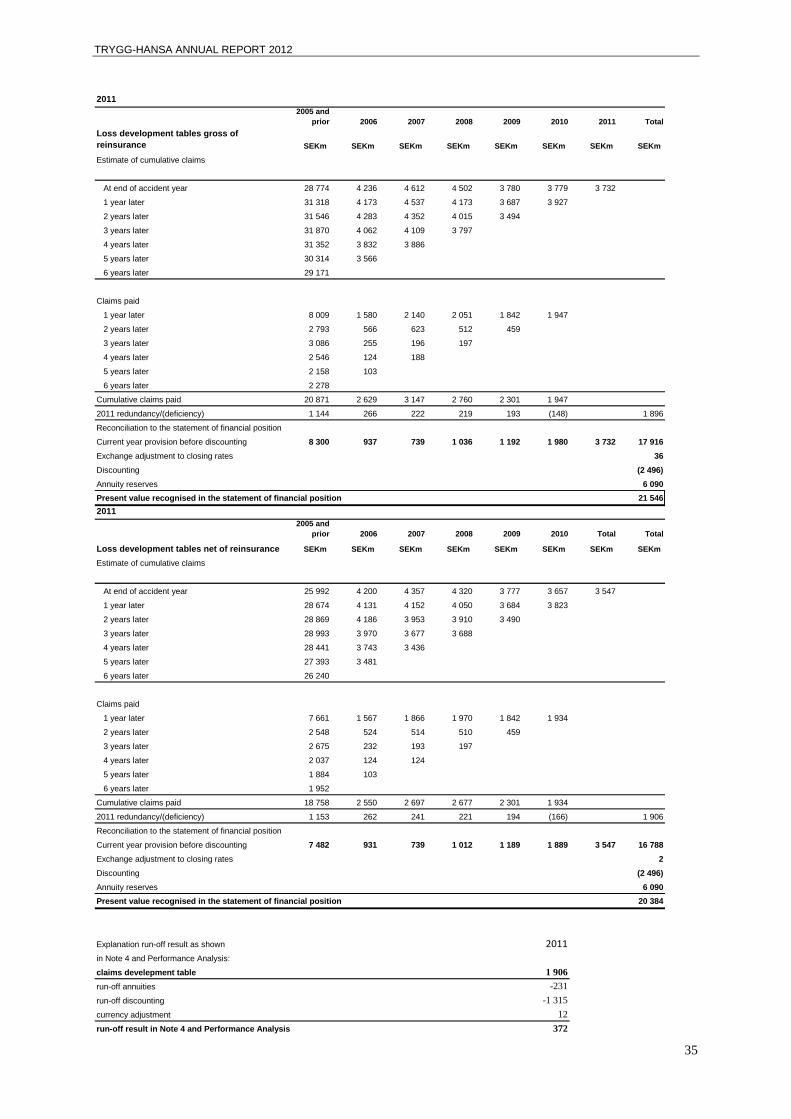
TRYGG-HANSA ANNUAL REPORT 2012
35
2011
2005 and
prior 2006 2007 2008 2009 2010 2011 Total
Loss development tables gross of
reinsurance SEKm SEKm SEKm SEKm SEKm SEKm SEKm SEKm
Estimate of cumulative claims
At end of accident year 28 774 4 236 4 612 4 502 3 780 3 779 3 732
1 year later 31 318 4 173 4 537 4 173 3 687 3 927
2 years later 31 546 4 283 4 352 4 015 3 494
3 years later 31 870 4 062 4 109 3 797
4 years later 31 352 3 832 3 886
5 years later 30 314 3 566
6 years later 29 171
Claims paid
1 year later 8 009 1 580 2 140 2 051 1 842 1 947
2 years later 2 793 566 623 512 459
3 years later 3 086 255 196 197
4 years later 2 546 124 188
5 years later 2 158 103
6 years later 2 278
Cumulative claims paid 20 871 2 629 3 147 2 760 2 301 1 947
2011 redundancy/(deficiency) 1 144 266 222 219 193 (148) 1 896
Reconciliation to the statement of financial position
Current year provision before discounting 8 300 937 739 1 036 1 192 1 980 3 732 17 916
Exchange adjustment to closing rates 36
Discounting (2 496)
Annuity reserves 6 090
Present value recognised in the statement of financial position 21 546
2011
2005 and
prior 2006 2007 2008 2009 2010 Total Total
Loss development tables net of reinsurance SEKm SEKm SEKm SEKm SEKm SEKm SEKm SEKm
Estimate of cumulative claims
At end of accident year 25 992 4 200 4 357 4 320 3 777 3 657 3 547
1 year later 28 674 4 131 4 152 4 050 3 684 3 823
2 years later 28 869 4 186 3 953 3 910 3 490
3 years later 28 993 3 970 3 677 3 688
4 years later 28 441 3 743 3 436
5 years later 27 393 3 481
6 years later 26 240
Claims paid
1 year later 7 661 1 567 1 866 1 970 1 842 1 934
2 years later 2 548 524 514 510 459
3 years later 2 675 232 193 197
4 years later 2 037 124 124
5 years later 1 884 103
6 years later 1 952
Cumulative claims paid 18 758 2 550 2 697 2 677 2 301 1 934
2011 redundancy/(deficiency) 1 153 262 241 221 194 (166) 1 906
Reconciliation to the statement of financial position
Current year provision before discounting 7 482 931 739 1 012 1 189 1 889 3 547 16 788
Exchange adjustment to closing rates 2
Discounting (2 496)
Annuity reserves 6 090
Present value recognised in the statement of financial position 20 384
Explanation run-off result as shown 2011
in Note 4 and Performance Analysis:
claims develepment table 1 906
run-off annuities -231
run-off discounting -1 315
currency adjustment 12
run-off result in Note 4 and Performance Analysis 372

TRYGG-HANSA ANNUAL REPORT 2012
36
Financial risks
Market risks and investment strategy
Trygg-Hansa's investment strategy is balanced in order to achieve several purposes and to ensure compliance
with laws and regulations.
Through close internal and external portfolio management and control, the aim is to maximize the return while at
the same time ensuring:
Legislative and risk compliance
• Ensuring that investments are in compliance with the investment rules set out in legislation
• Ensuring full compliance with the investment Guidelines laid down by the Board of Directors
• Ensuring that the exposure of the investment portfolio is within the limits
Operational efficiency
• Ensuring that liability cash flows affect the structure of the investment portfolio
• Ensuring that an investment management policy has been adopted
• Ensuring cost control
Investment management Trygg-Hansa has chosen an outsourcing strategy for the management of its investments. External portfolio
managers have been approved by the Board of Directors, and their investment authority is subject to the
investment Guidelines of Trygg-Hansa laid down by the Board of Directors. In 2012, the primary part of the
portfolio was managed by SEB.
The investment Guidelines of Trygg-Hansa lay down criteria for limiting and managing risks relating to
individual investments and for concentration of risks. The Investment Committee monitors compliance with the
investment strategy. The committee serves in an advisory role, reports to the CEO, and holds meetings at least
once a quarter and when required by circumstances.
Liquidity and interest rate risk The majority of Trygg-Hansa's investments are in liquid listed bonds. The company maintains conservative
investment guidelines with a large share of the portfolio consisting of government bonds and highly rated
securities. If the need should arise, it is expected that a credit facility can be obtained from the Group’s primary
banks on the basis of the Group’s A+ rating.
The short-term liquidity of Trygg-Hansa is monitored through ongoing cash management supported by monthly
liquidity reports providing an overview of the risk exposure relative to market and credit risks. Long-term cash
management is handled through Asset Liability Management ALM). Changes in interest rates are among the risk
factors regarding Trygg-Hansa's financial risks. A significant aspect of Trygg-Hansa's risk management is to
have a portfolio of fixed-income securities that acceptably balances the opposing P&L effects of interest rate
movements on assets and liabilities.
The company's exposure with respect to fixed income assets and various liabilities is shown in the table below.

TRYGG-HANSA ANNUAL REPORT 2012
37
2012
Terms of fixed interest for assets and liabilities SEKm
Interest exposure Max. 1 yr
Longer than 1
yr but max 5
yrs
Longer than 5
yrs
Without
interest Total
Assets
Shares and participations 1,486 - - - 1,486
Bonds and other fixed-income securities 3,151 8,282 12,030 - 23,463
Other assets - - - 1,116 1,116
4,637 8,282 12,030 1,116 26,065
Creditors
Technical provisions 5,631 7,065 13,053 - 25,749
Other creditors - - - 556 556
5,631 7,065 13,053 556 26,305
2011
Terms of fixed interest for assets and liabilities SEKm
Max. 1 yr
Longer than 1
yr but max 5
yrs
Longer than 5
yrs
Without
interest Total
Shares and participations 1,333 - - - 1,333
Bonds and other fixed-income securities 4,843 11,058 10,050 0 25,951
Other assets - - - 1,116 1,116
6,176 11,058 10,050 1,116 28,400
Creditors
Technical provisions 3,566 8,563 13,374 - 25,503
Tax liability 524 - - - 524
Other creditors - - - 794 794
4,090 8,563 13,374 794 26,821
Currency risk Currency risk arises as a result of a mismatch in the value of assets and liabilities in the same foreign currency. If
currency exposure is outside certain defined limits, it is minimized through currency derivatives. Net liabilities in
foreign currency are essentially matched by bond holdings in the respective currency. Trygg-Hansa's net
currency risk is restricted to certain EUR bonds.
The company's currency risk exposure before any hedging with derivatives is shown in the table below:
2012
Currency exposure SEKm MSEK MDKK MEUR MGBP MNOK MUSD Other
Investments 25,033 - 980 - - 52 -
Receivables 2,377 194 23 14 8 77 3
Other assets 2,421 27 16 - 1 2 -
Total assets 29,831 221 1,019 14 9 131 3
Technical provisions, net -23,806 - -2 - - - -
Other liabilities and provisions -886 -77 -32 -15 -1 -24 -1
Total liabilities and provisions -24,692 -77 -34 -15 -1 -24 -1
Net exposure before financial hedging with derivatives 5,139 144 985 -1 8 107 2
2011
Currency exposure SEKm MSEK MDKK MEUR MGBP MNOK MUSD Other
Investments 25,810 - 1,353 - - 43 -
Receivables 2,145 170 31 17 9 83 3
Other assets 4,349 14 -6 - - 10 -
Total assets 32,304 184 1,378 17 9 136 3
Technical provisions, net -21,625 - -1 0 0 -10 -
Other liabilities and provisions -2,294 34 -23 -23 0 -24 -1
Total liabilities and provisions -23,919 34 -24 -23 - -34 -1
Net exposure before financial hedging with derivatives 8,385 218 1,354 -6 9 102 2
Equity risk Trygg-Hansa has chosen to invest a portion of its other financial assets in equities at a total amount of SEK 1,333
m (1,543) as per 31 December 2012.
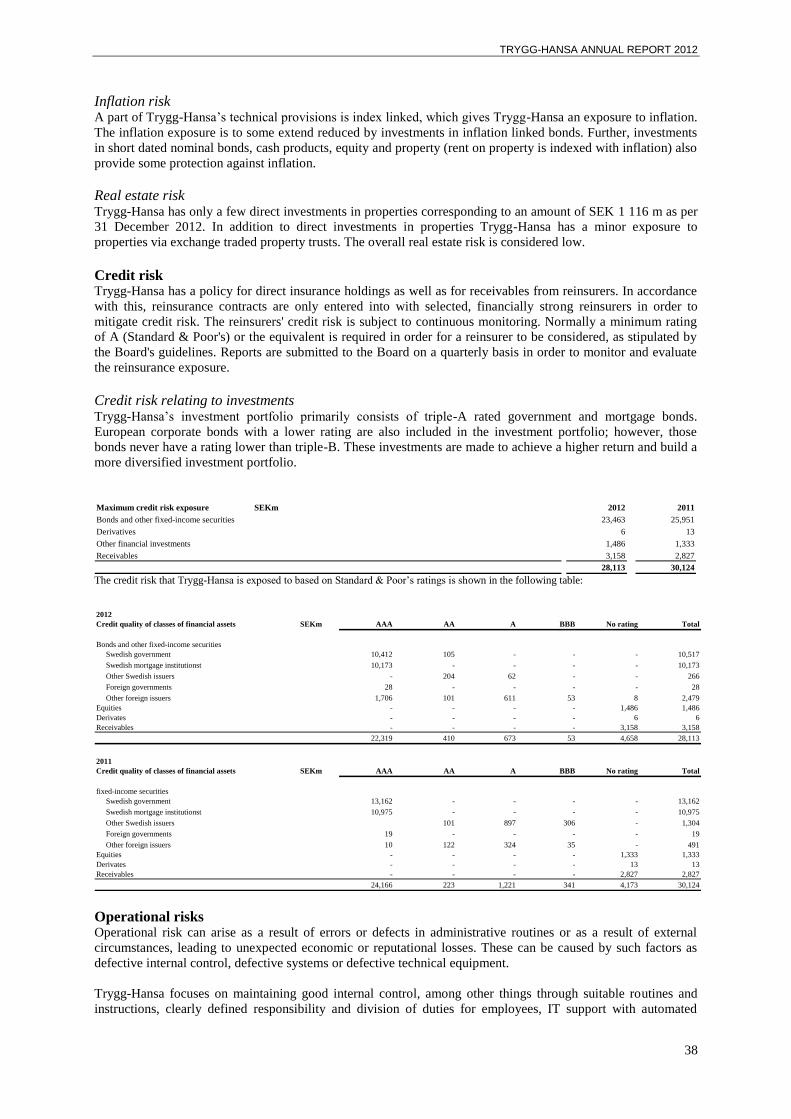
TRYGG-HANSA ANNUAL REPORT 2012
38
Inflation risk A part of Trygg-Hansa’s technical provisions is index linked, which gives Trygg-Hansa an exposure to inflation.
The inflation exposure is to some extend reduced by investments in inflation linked bonds. Further, investments
in short dated nominal bonds, cash products, equity and property (rent on property is indexed with inflation) also
provide some protection against inflation.
Real estate risk Trygg-Hansa has only a few direct investments in properties corresponding to an amount of SEK 1 116 m as per
31 December 2012. In addition to direct investments in properties Trygg-Hansa has a minor exposure to
properties via exchange traded property trusts. The overall real estate risk is considered low.
Credit risk Trygg-Hansa has a policy for direct insurance holdings as well as for receivables from reinsurers. In accordance
with this, reinsurance contracts are only entered into with selected, financially strong reinsurers in order to
mitigate credit risk. The reinsurers' credit risk is subject to continuous monitoring. Normally a minimum rating
of A (Standard & Poor's) or the equivalent is required in order for a reinsurer to be considered, as stipulated by
the Board's guidelines. Reports are submitted to the Board on a quarterly basis in order to monitor and evaluate
the reinsurance exposure.
Credit risk relating to investments Trygg-Hansa’s investment portfolio primarily consists of triple-A rated government and mortgage bonds.
European corporate bonds with a lower rating are also included in the investment portfolio; however, those
bonds never have a rating lower than triple-B. These investments are made to achieve a higher return and build a
more diversified investment portfolio.
Maximum credit risk exposure SEKm 2012 2011
Bonds and other fixed-income securities 23,463 25,951
Derivatives 6 13
Other financial investments 1,486 1,333
Receivables 3,158 2,827
28,113 30,124 The credit risk that Trygg-Hansa is exposed to based on Standard & Poor’s ratings is shown in the following table:
2012
Credit quality of classes of financial assets SEKm AAA AA A BBB No rating Total
Bonds and other fixed-income securities
Swedish government 10,412 105 - - - 10,517
Swedish mortgage institutionst 10,173 - - - - 10,173
Other Swedish issuers - 204 62 - - 266
Foreign governments 28 - - - - 28
Other foreign issuers 1,706 101 611 53 8 2,479
Equities - - - - 1,486 1,486
Derivates - - - - 6 6
Receivables - - - - 3,158 3,158
22,319 410 673 53 4,658 28,113
2011
Credit quality of classes of financial assets SEKm AAA AA A BBB No rating Total
fixed-income securities
Swedish government 13,162 - - - - 13,162
Swedish mortgage institutionst 10,975 - - - - 10,975
Other Swedish issuers 101 897 306 - 1,304
Foreign governments 19 - - - - 19
Other foreign issuers 10 122 324 35 - 491
Equities - - - - 1,333 1,333
Derivates - - - - 13 13
Receivables - - - - 2,827 2,827
24,166 223 1,221 341 4,173 30,124
Operational risks Operational risk can arise as a result of errors or defects in administrative routines or as a result of external
circumstances, leading to unexpected economic or reputational losses. These can be caused by such factors as
defective internal control, defective systems or defective technical equipment.
Trygg-Hansa focuses on maintaining good internal control, among other things through suitable routines and
instructions, clearly defined responsibility and division of duties for employees, IT support with automated
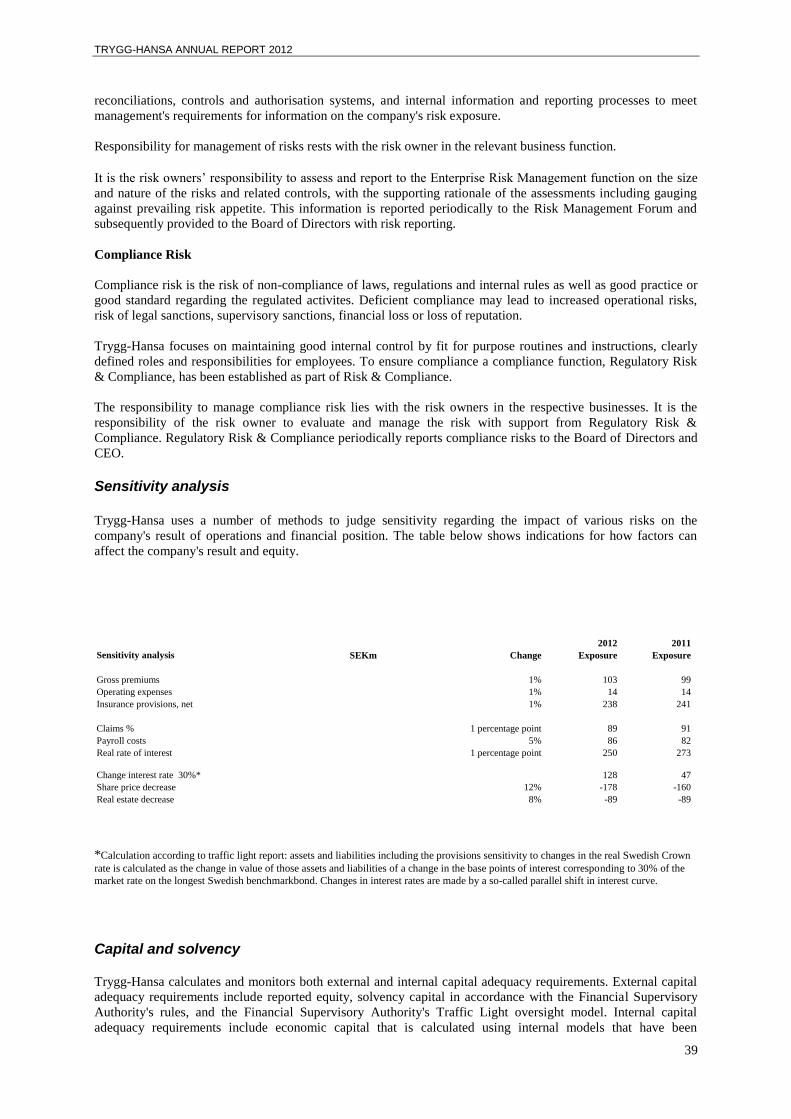
TRYGG-HANSA ANNUAL REPORT 2012
39
reconciliations, controls and authorisation systems, and internal information and reporting processes to meet
management's requirements for information on the company's risk exposure.
Responsibility for management of risks rests with the risk owner in the relevant business function.
It is the risk owners’ responsibility to assess and report to the Enterprise Risk Management function on the size
and nature of the risks and related controls, with the supporting rationale of the assessments including gauging
against prevailing risk appetite. This information is reported periodically to the Risk Management Forum and
subsequently provided to the Board of Directors with risk reporting.
Compliance Risk
Compliance risk is the risk of non-compliance of laws, regulations and internal rules as well as good practice or
good standard regarding the regulated activites. Deficient compliance may lead to increased operational risks,
risk of legal sanctions, supervisory sanctions, financial loss or loss of reputation.
Trygg-Hansa focuses on maintaining good internal control by fit for purpose routines and instructions, clearly
defined roles and responsibilities for employees. To ensure compliance a compliance function, Regulatory Risk
& Compliance, has been established as part of Risk & Compliance.
The responsibility to manage compliance risk lies with the risk owners in the respective businesses. It is the
responsibility of the risk owner to evaluate and manage the risk with support from Regulatory Risk &
Compliance. Regulatory Risk & Compliance periodically reports compliance risks to the Board of Directors and
CEO.
Sensitivity analysis Trygg-Hansa uses a number of methods to judge sensitivity regarding the impact of various risks on the
company's result of operations and financial position. The table below shows indications for how factors can
affect the company's result and equity.
2012 2011
Sensitivity analysis SEKm Change Exposure Exposure
Gross premiums 1% 103 99
Operating expenses 1% 14 14
Insurance provisions, net 1% 238 241
Claims % 1 percentage point 89 91
Payroll costs 5% 86 82
Real rate of interest 1 percentage point 250 273
Change interest rate 30%* 128 47
Share price decrease 12% -178 -160
Real estate decrease 8% -89 -89
*Calculation according to traffic light report: assets and liabilities including the provisions sensitivity to changes in the real Swedish Crown
rate is calculated as the change in value of those assets and liabilities of a change in the base points of interest corresponding to 30% of the
market rate on the longest Swedish benchmarkbond. Changes in interest rates are made by a so-called parallel shift in interest curve.
Capital and solvency Trygg-Hansa calculates and monitors both external and internal capital adequacy requirements. External capital
adequacy requirements include reported equity, solvency capital in accordance with the Financial Supervisory
Authority's rules, and the Financial Supervisory Authority's Traffic Light oversight model. Internal capital
adequacy requirements include economic capital that is calculated using internal models that have been

TRYGG-HANSA ANNUAL REPORT 2012
40
developed in accordance with the RSA Group's own rules and rating agency capital requirements. Currently, the
results of the internal model are monitored in preparation for Solvency II on an informational basis.
Capital is the difference between relevant assets and relevant liabilities. What constitutes a relevant asset and
relevant liability is determined by applicable rules. For solvency capital, it is currently equity and untaxed
reserves. Assessments of economic capital are prospective and take future cash flows into account, without a
coupling to assets and liabilities in the IFRS balance sheet. Rating agency capital requirements is also of
significance, although Trygg-Hansa's credit rating in many respects is dependent on the RSA Group ratings.
The Board has established two different warning triggers for several of the capital adequacy requirements. If the
amber trigger is reached, the Board must immediately be informed, and if the red trigger is reached, measures
must be taken immediately. The red trigger has been determined based on the company's assessment of which
capital strength the Financial Supervisory Authority in its oversight practice has determined that a general
insurance company should have. The amber trigger has been determined based on an aggregate risk assessment
and is to provide scope to manoeuvre so that the red level will never be reached.
The instructions for assets to cover insurance liabilities set by the Board prescribe a desirable minimum liability
coverage margin. In addition, a monthly calculation is performed of a reasonable liability coverage margin
taking into account the risks coupled to the current technical provisions.
Trygg-Hansa has a process for continuously monitoring the capital metrics referred to above and has established
an advisory Capital Management Committee. A Capital Scorecard is used as a tool in this process. The capital
adequacy requirement is currently met by a satisfactory margin for all categories of capital.
The Solvency II rules may lead to changed requirements in the future. The company is preparing for the
upcoming Solvency II rules and is following the development closely.
In 2009 Trygg-Hansa formally started a Solvency II-project. This project is being conducted through a
Scandinavian project organisation that reflects the RSA Group's structure for its work with Solvency II. For a
further description of the Solvency II- project, see page 10.

TRYGG-HANSA ANNUAL REPORT 2012
41
Note 3 Written premiums SEKm Direct Reinsurance Total Total
insurance accepted 2012 2011
Written premiums, gross
Written premiums per geographical area
Direct insurance in Sweden 10,266 - 10,266 9,820
Direct insurance in other countries 1 - 1 1
Reinsurance accepted - 82 82 80
10,267 82 10,349 9,901
Note 4 Claims incurred Claim costs attributable to the year's operations Gross Ceded Net
Claims paid -2,709 277 -2,432
Change in provision for incurred and reported claims -2,545 422 -2,123
Change in provision for incurred but not reported (IBNR) claims -1,391 119 -1,272
Claims handling costs -631 - -631
Total claim costs attributable to the year's operations -7,276 818 -6,458
Claim costs attributable to previous years' operations
Claims paid -3,634 198 -3,436
Change in provision for incurred and reported claims 2,169 -27 2,142
Change in provision for incurred but not reported (IBNR) claims 1,672 -18 1,654
Claims handling costs -193 - -193
Total claim costs attributable to the previous years' operations 14 153 167
Total claims paid
Claims paid -6,343 475 -5,868
Claims handling costs -824 - -824
Total claims paid -7,167 475 -6,692
Change in provision for claims outstanding
Change in provision for incurred and reported claims -376 396 20
Change in provision for incurred but not reported (IBNR) claims 281 100 381
Total change in provision for claims outstanding -95 496 401
2011
Claim costs attributable to the year's operations Gross Ceded Net
Claims paid -2,793 141 -2,652
Change in provision for incurred and reported claims -2,318 123 -2,195
Change in provision for incurred but not reported (IBNR) claims -1,249 63 -1,186
Claims handling costs -514 - -514
Total claim costs attributable to the year's operations -6,874 327 -6,547
Claim costs attributable to previous years' operations
Claims paid -3,674 246 -3,428
Change in provision for incurred and reported claims 1,160 32 1,192
Change in provision for incurred but not reported (IBNR) claims 3,069 -268 2,801
Claims handling costs -193 - -193
Total claim costs attributable to the previous years' operations 362 10 372
Total claims paid
Claims paid -6,467 387 -6,080
Claims handling costs -707 - -707
Total claims paid -7,174 387 -6,787
Change in provision for claims outstanding
Change in provision for incurred and reported claims -1,158 155 -1,003
Change in provision for incurred but not reported (IBNR) claims 1,820 -205 1,615
Total change in provision for claims outstanding 662 -50 612
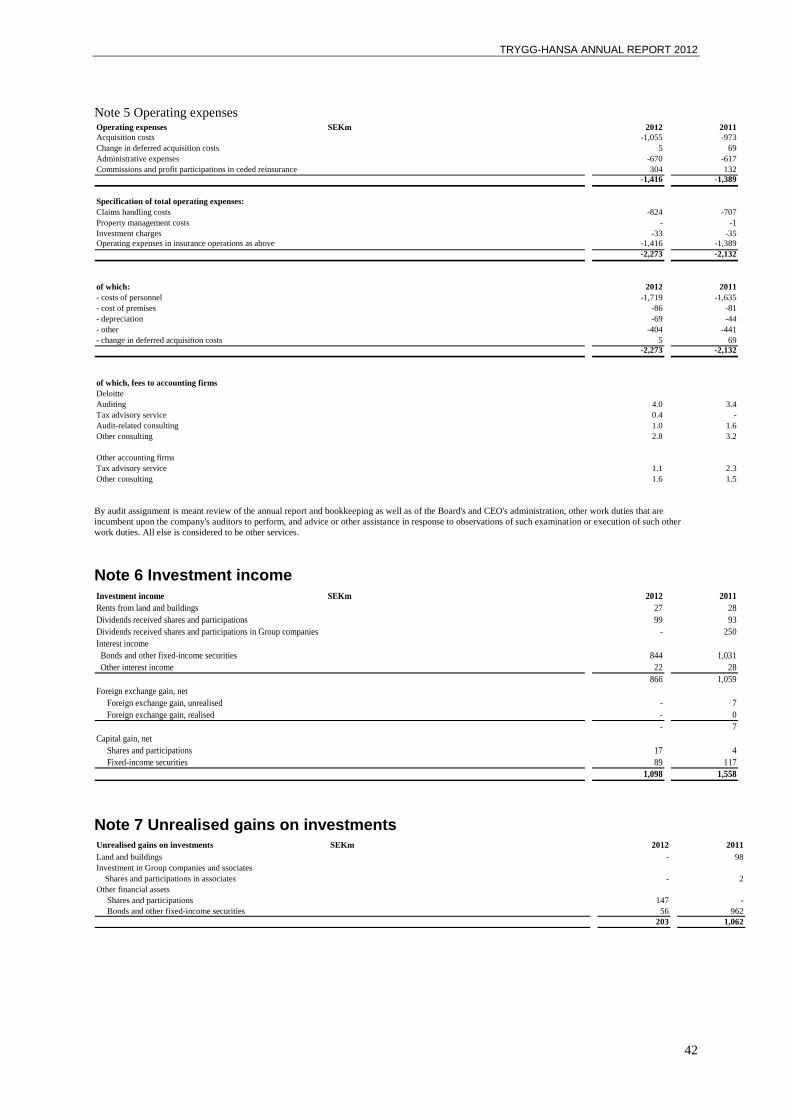
TRYGG-HANSA ANNUAL REPORT 2012
42
Note 5 Operating expenses Operating expenses SEKm 2012 2011
Acquisition costs -1,055 -973
Change in deferred acquisition costs 5 69
Administrative expenses -670 -617
Commissions and profit participations in ceded reinsurance 304 132
-1,416 -1,389
Specification of total operating expenses:
Claims handling costs -824 -707
Property management costs - -1
Investment charges -33 -35
Operating expenses in insurance operations as above -1,416 -1,389
-2,273 -2,132
of which: 2012 2011
- costs of personnel -1,719 -1,635
- cost of premises -86 -81
- depreciation -69 -44
- other -404 -441
- change in deferred acquisition costs 5 69
-2,273 -2,132
of which, fees to accounting firms
Deloitte
Auditing 4.0 3.4
Tax advisory service 0.4 -
Audit-related consulting 1.0 1.6
Other consulting 2.8 3.2
Other accounting firms
Tax advisory service 1.1 2.3
Other consulting 1.6 1.5
By audit assignment is meant review of the annual report and bookkeeping as well as of the Board's and CEO's administration, other work duties that are
incumbent upon the company's auditors to perform, and advice or other assistance in response to observations of such examination or execution of such other
work duties. All else is considered to be other services.
Note 6 Investment income Investment income SEKm 2012 2011
Rents from land and buildings 27 28
Dividends received shares and participations 99 93
Dividends received shares and participations in Group companies - 250
Interest income
Bonds and other fixed-income securities 844 1,031
Other interest income 22 28
866 1,059
Foreign exchange gain, net
Foreign exchange gain, unrealised - 7
Foreign exchange gain, realised - 0
- 7
Capital gain, net
Shares and participations 17 4
Fixed-income securities 89 117
1,098 1,558
Note 7 Unrealised gains on investments Unrealised gains on investments SEKm 2012 2011
Land and buildings - 98
Investment in Group companies and ssociates
Shares and participations in associates - 2
Other financial assets
Shares and participations 147 -
Bonds and other fixed-income securities 56 962
203 1,062
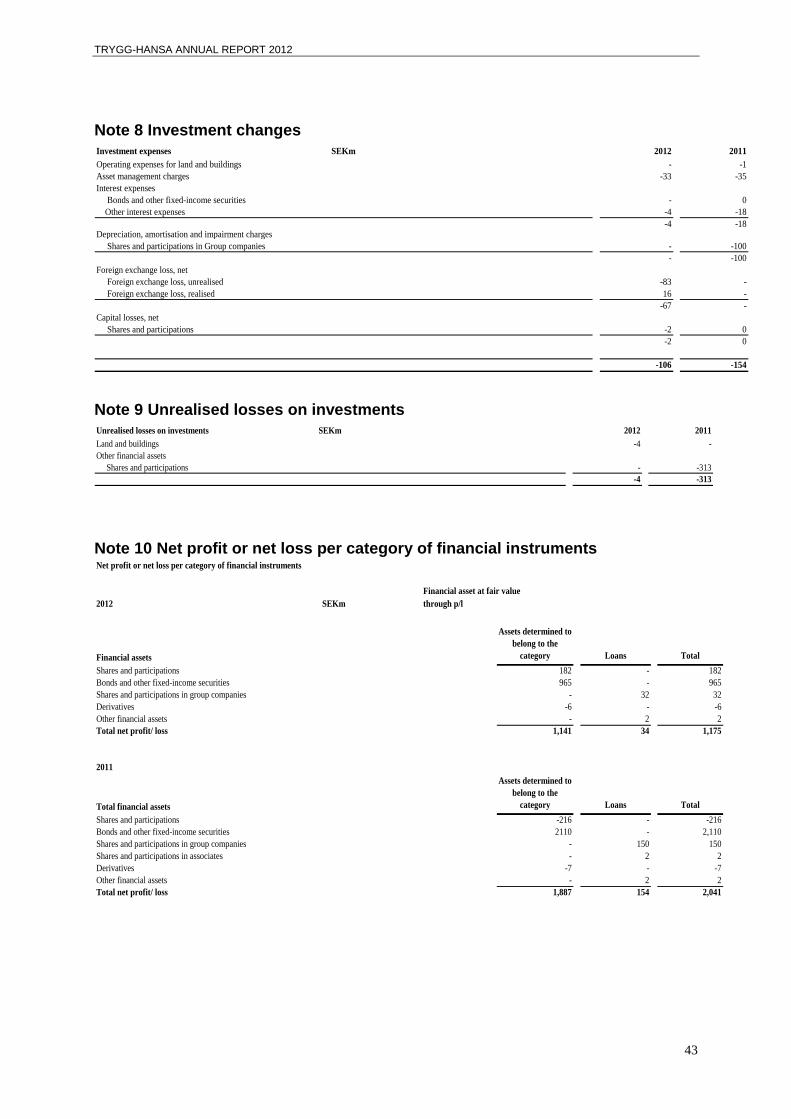
TRYGG-HANSA ANNUAL REPORT 2012
43
Note 8 Investment changes Investment expenses SEKm 2012 2011
Operating expenses for land and buildings - -1
Asset management charges -33 -35
Interest expenses
Bonds and other fixed-income securities - 0
Other interest expenses -4 -18
-4 -18Depreciation, amortisation and impairment charges
Shares and participations in Group companies - -100
- -100
Foreign exchange loss, net
Foreign exchange loss, unrealised -83 -
Foreign exchange loss, realised 16 -
-67 -
Capital losses, net
Shares and participations -2 0
-2 0
-106 -154
Note 9 Unrealised losses on investments Unrealised losses on investments SEKm 2012 2011
Land and buildings -4 -
Other financial assets
Shares and participations - -313
-4 -313
Note 10 Net profit or net loss per category of financial instruments Net profit or net loss per category of financial instruments
2012 SEKm
Financial assets
Assets determined to
belong to the
category Loans Total
Shares and participations 182 - 182
Bonds and other fixed-income securities 965 - 965
Shares and participations in group companies - 32 32
Derivatives -6 - -6
Other financial assets - 2 2
Total net profit/ loss 1,141 34 1,175
2011
Total financial assets
Assets determined to
belong to the
category Loans Total
Shares and participations -216 - -216
Bonds and other fixed-income securities 2110 - 2,110
Shares and participations in group companies - 150 150
Shares and participations in associates - 2 2
Derivatives -7 - -7
Other financial assets - 2 2
Total net profit/ loss 1,887 154 2,041
through p/l
Financial asset at fair value

TRYGG-HANSA ANNUAL REPORT 2012
44
Note 11 Other expenses
Other expenses SEKm 2012 2011
Amortisation of goodwill - -30
Other expenses 0 0
0 -30
Note 12 Group Contribution rendered
Group Contribution rendered SEKm 2012 2011 *
Sveland Sakförsäkringar AB -115 -
Codan Forsikring A/S, filial Sverige -55 -
WLI Insurance AB -10 -
Brädstapeln Fastighets AB 0 -
-180 -
* Group contribution of SEK 142 m were recognised directly against equity previous year.
Note 13 Tax allocation resereve
Tax allocation reserve SEKm 2012 2011
Provision for 2013 tax year -140 -
-140 -
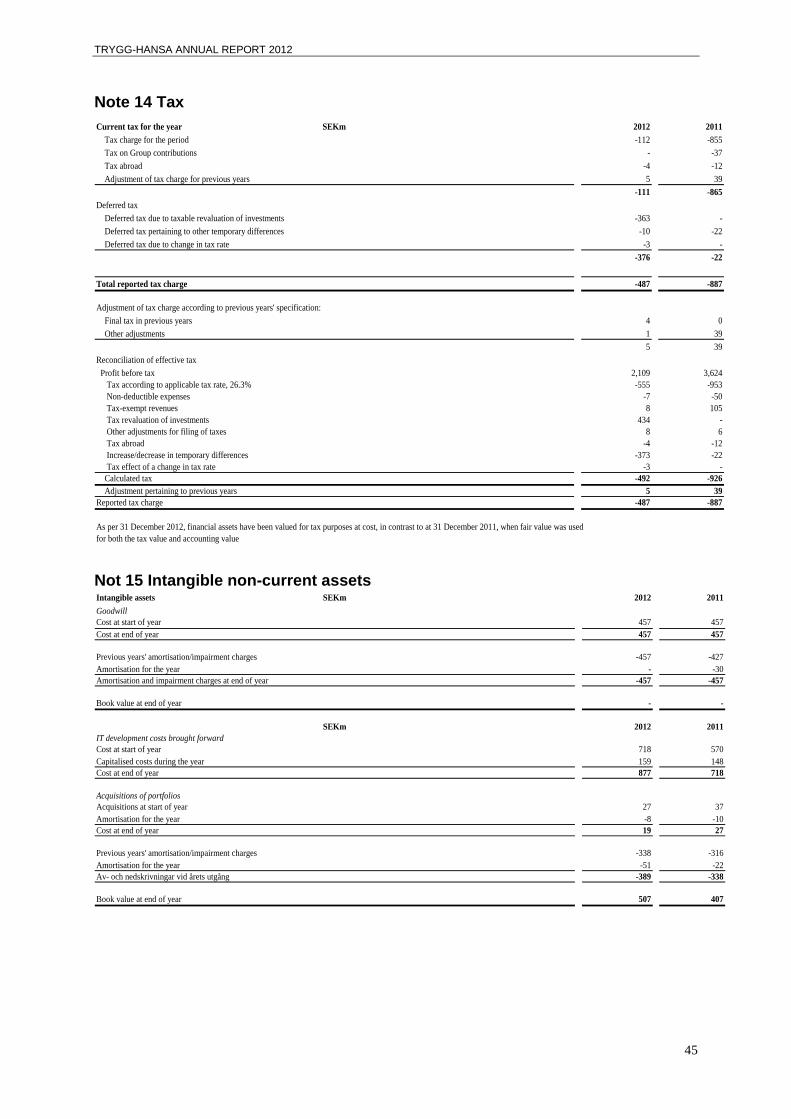
TRYGG-HANSA ANNUAL REPORT 2012
45
Note 14 Tax
Current tax for the year SEKm 2012 2011
Tax charge for the period -112 -855
Tax on Group contributions - -37
Tax abroad -4 -12
Adjustment of tax charge for previous years 5 39
-111 -865
Deferred tax
Deferred tax due to taxable revaluation of investments -363 -
Deferred tax pertaining to other temporary differences -10 -22
Deferred tax due to change in tax rate -3 -
-376 -22
Total reported tax charge -487 -887
Adjustment of tax charge according to previous years' specification:
Final tax in previous years 4 0
Other adjustments 1 39
5 39
Reconciliation of effective tax
Profit before tax 2,109 3,624
Tax according to applicable tax rate, 26.3% -555 -953
Non-deductible expenses -7 -50
Tax-exempt revenues 8 105
Tax revaluation of investments 434 -
Other adjustments for filing of taxes 8 6
Tax abroad -4 -12
Increase/decrease in temporary differences -373 -22
Tax effect of a change in tax rate -3 -
Calculated tax -492 -926
Adjustment pertaining to previous years 5 39
Reported tax charge -487 -887
As per 31 December 2012, financial assets have been valued for tax purposes at cost, in contrast to at 31 December 2011, when fair value was used
for both the tax value and accounting value
Not 15 Intangible non-current assets Intangible assets SEKm 2012 2011
Goodwill
Cost at start of year 457 457
Cost at end of year 457 457
Previous years' amortisation/impairment charges -457 -427
Amortisation for the year - -30
Amortisation and impairment charges at end of year -457 -457
Book value at end of year - -
SEKm 2012 2011
IT development costs brought forward
Cost at start of year 718 570
Capitalised costs during the year 159 148
Cost at end of year 877 718
Acquisitions of portfolios
Acquisitions at start of year 27 37
Amortisation for the year -8 -10
Cost at end of year 19 27
Previous years' amortisation/impairment charges -338 -316
Amortisation for the year -51 -22
Av- och nedskrivningar vid årets utgång -389 -338
Book value at end of year 507 407
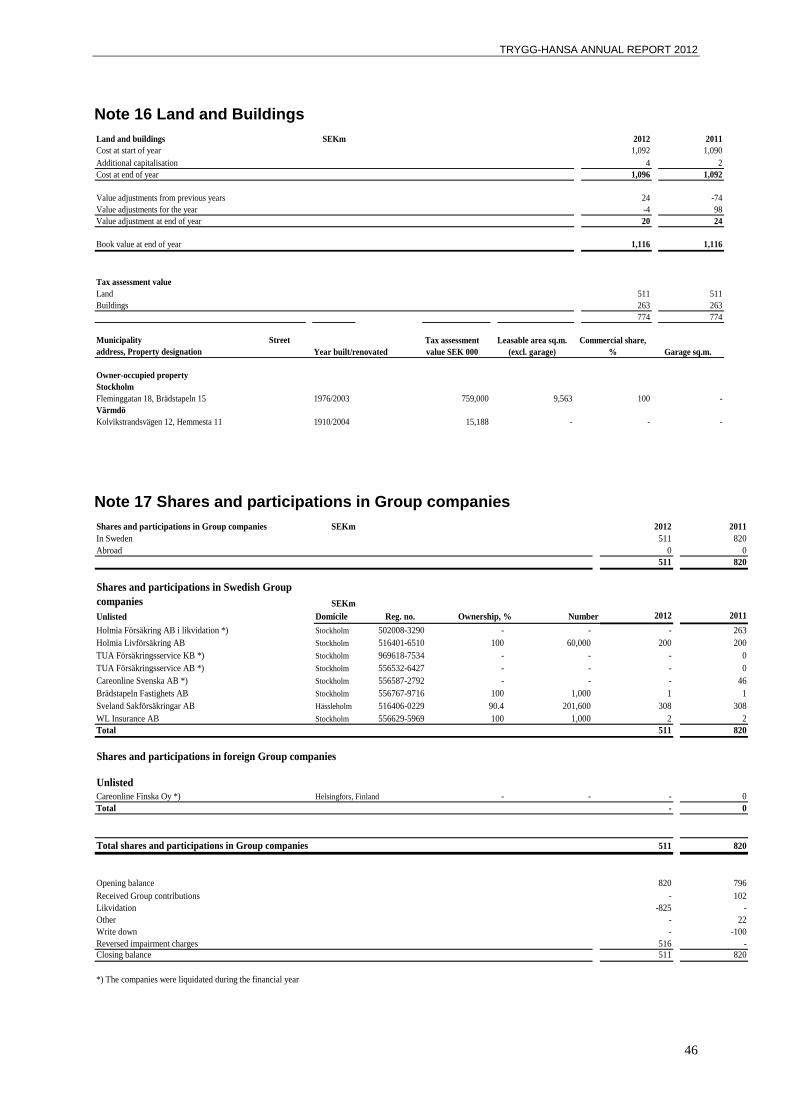
TRYGG-HANSA ANNUAL REPORT 2012
46
Note 16 Land and Buildings
Land and buildings SEKm 2012 2011
Cost at start of year 1,092 1,090
Additional capitalisation 4 2
Cost at end of year 1,096 1,092
Value adjustments from previous years 24 -74
Value adjustments for the year -4 98
Value adjustment at end of year 20 24
Book value at end of year 1,116 1,116
Tax assessment value
Land 511 511
Buildings 263 263
774 774
Municipality Street
address, Property designation
Owner-occupied property
Stockholm
Fleminggatan 18, Brädstapeln 15 1976/2003 759,000 9,563 100 -
Värmdö
Kolvikstrandsvägen 12, Hemmesta 11 1910/2004 15,188 - - -
Year built/renovated
Tax assessment
value SEK 000
Leasable area sq.m.
(excl. garage)
Commercial share,
% Garage sq.m.
Note 17 Shares and participations in Group companies
Shares and participations in Group companies SEKm 2012 2011
In Sweden 511 820
Abroad 0 0
511 820
Shares and participations in Swedish Group
companies SEKm
Unlisted 2012 2011
Holmia Försäkring AB i likvidation *) Stockholm 502008-3290 - - - 263
Holmia Livförsäkring AB Stockholm 516401-6510 100 60,000 200 200
TUA Försäkringsservice KB *) Stockholm 969618-7534 - - - 0
TUA Försäkringsservice AB *) Stockholm 556532-6427 - - - 0
Careonline Svenska AB *) Stockholm 556587-2792 - - - 46
Brädstapeln Fastighets AB Stockholm 556767-9716 100 1,000 1 1
Sveland Sakförsäkringar AB Hässleholm 516406-0229 90.4 201,600 308 308
WL Insurance AB Stockholm 556629-5969 100 1,000 2 2
Total 511 820
Shares and participations in foreign Group companies
Unlisted
Careonline Finska Oy *) Helsingfors, Finland - - - 0
Total - 0
Total shares and participations in Group companies 511 820
Opening balance 820 796
Received Group contributions - 102
Likvidation -825 -
Other - 22
Write down - -100
Reversed impairment charges 516 -
Closing balance 511 820
*) The companies were liquidated during the financial year
Domicile Reg. no. Ownership, % Number
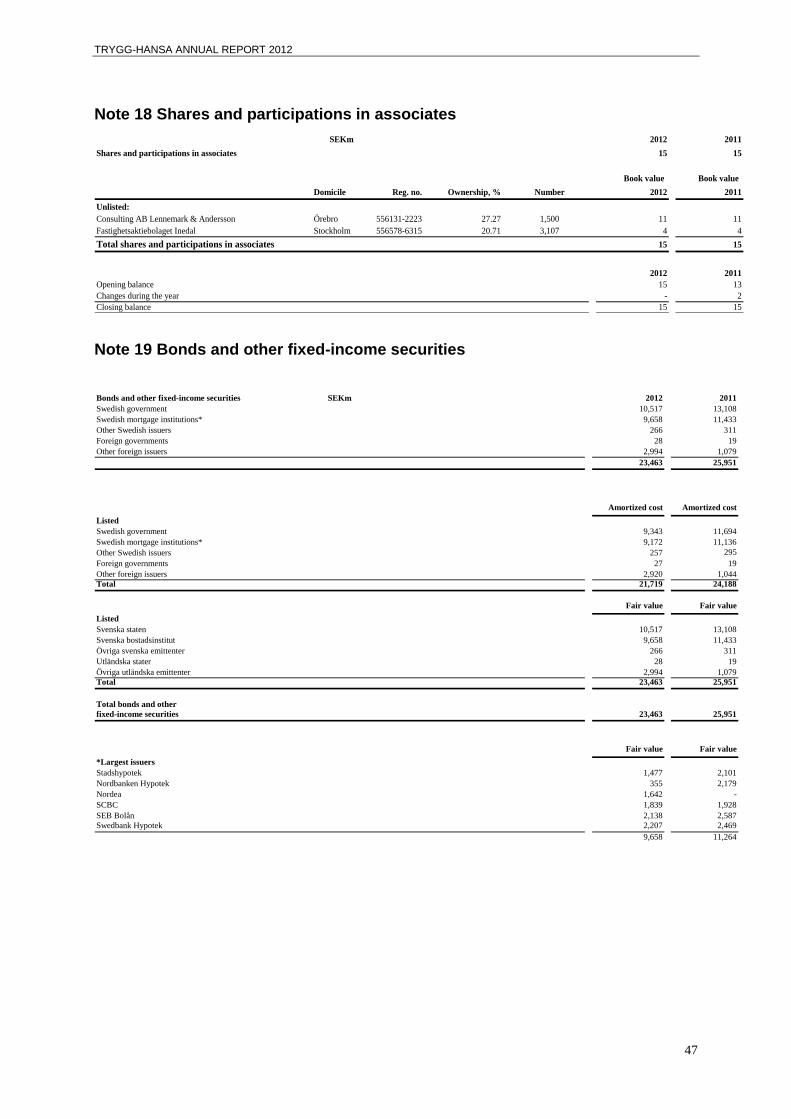
TRYGG-HANSA ANNUAL REPORT 2012
47
Note 18 Shares and participations in associates
SEKm 2012 2011
Shares and participations in associates 15 15
Book value Book value
Domicile Reg. no. Ownership, % Number 2012 2011
Unlisted:
Consulting AB Lennemark & Andersson Örebro 556131-2223 27.27 1,500 11 11
Fastighetsaktiebolaget Inedal Stockholm 556578-6315 20.71 3,107 4 4
Total shares and participations in associates 15 15
2012 2011
Opening balance 15 13
Changes during the year - 2
Closing balance 15 15
Note 19 Bonds and other fixed-income securities
Bonds and other fixed-income securities SEKm 2012 2011
Swedish government 10,517 13,108
Swedish mortgage institutions* 9,658 11,433
Other Swedish issuers 266 311
Foreign governments 28 19
Other foreign issuers 2,994 1,079
23,463 25,951
Amortized cost Amortized cost
Listed
Swedish government 9,343 11,694
Swedish mortgage institutions* 9,172 11,136
Other Swedish issuers 257 295
Foreign governments 27 19
Other foreign issuers 2,920 1,044
Total 21,719 24,188
Fair value Fair value
Listed
Svenska staten 10,517 13,108
Svenska bostadsinstitut 9,658 11,433
Övriga svenska emittenter 266 311
Utländska stater 28 19
Övriga utländska emittenter 2,994 1,079
Total 23,463 25,951
Total bonds and other
fixed-income securities 23,463 25,951
Fair value Fair value
*Largest issuers
Stadshypotek 1,477 2,101
Nordbanken Hypotek 355 2,179
Nordea 1,642 -
SCBC 1,839 1,928
SEB Bolån 2,138 2,587
Swedbank Hypotek 2,207 2,469
9,658 11,264
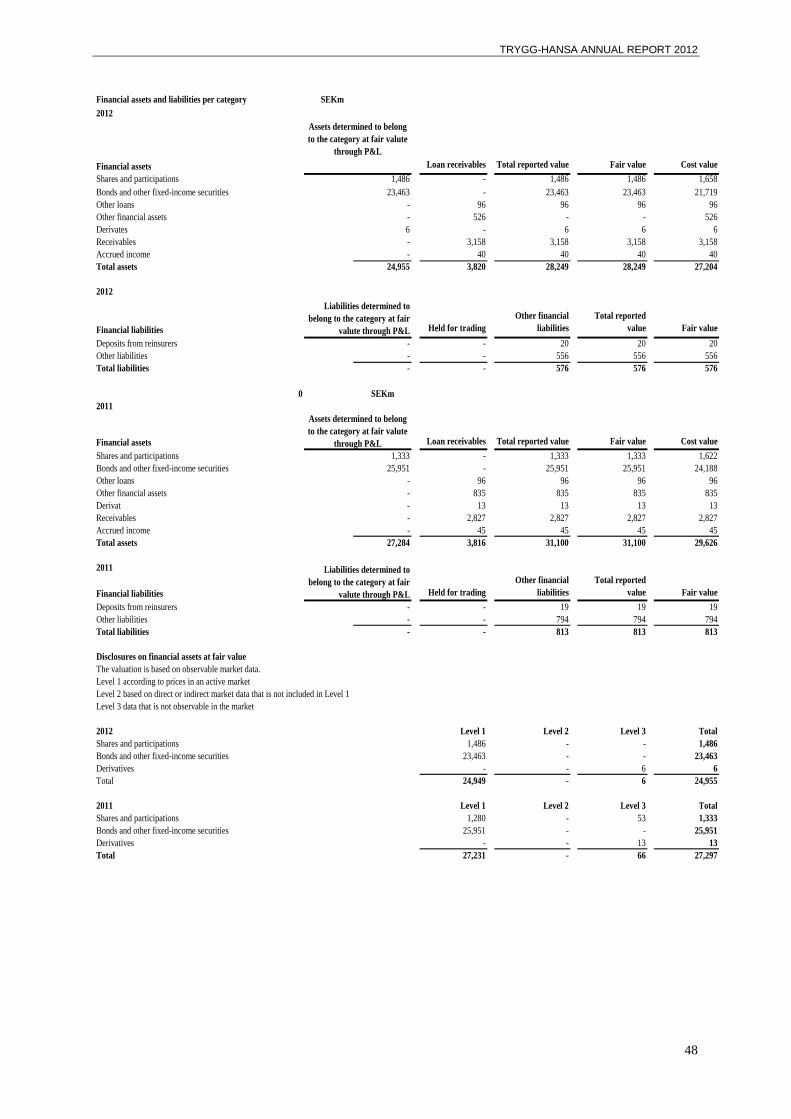
TRYGG-HANSA ANNUAL REPORT 2012
48
Financial assets and liabilities per category SEKm
2012
Financial assets Loan receivables Total reported value Fair value Cost value
Shares and participations 1,486 - 1,486 1,486 1,658
Bonds and other fixed-income securities 23,463 - 23,463 23,463 21,719
Other loans - 96 96 96 96
Other financial assets - 526 - - 526
Derivates 6 - 6 6 6
Receivables - 3,158 3,158 3,158 3,158
Accrued income - 40 40 40 40
Total assets 24,955 3,820 28,249 28,249 27,204
2012
Financial liabilities Held for trading
Other financial
liabilities
Total reported
value Fair value
Deposits from reinsurers - - 20 20 20
Other liabilities - - 556 556 556
Total liabilities - - 576 576 576
0 SEKm
2011
Financial assets Loan receivables Total reported value Fair value Cost value
Shares and participations 1,333 - 1,333 1,333 1,622
Bonds and other fixed-income securities 25,951 - 25,951 25,951 24,188
Other loans - 96 96 96 96
Other financial assets - 835 835 835 835
Derivat - 13 13 13 13
Receivables - 2,827 2,827 2,827 2,827
Accrued income - 45 45 45 45
Total assets 27,284 3,816 31,100 31,100 29,626
2011
Financial liabilities Held for trading
Other financial
liabilities
Total reported
value Fair value
Deposits from reinsurers - - 19 19 19
Other liabilities - - 794 794 794
Total liabilities - - 813 813 813
Disclosures on financial assets at fair value
The valuation is based on observable market data.
Level 1 according to prices in an active market
Level 2 based on direct or indirect market data that is not included in Level 1
Level 3 data that is not observable in the market
2012 Level 1 Level 2 Level 3 Total
Shares and participations 1,486 - - 1,486
Bonds and other fixed-income securities 23,463 - - 23,463
Derivatives - - 6 6
Total 24,949 - 6 24,955
2011 Level 1 Level 2 Level 3 Total
Shares and participations 1,280 - 53 1,333
Bonds and other fixed-income securities 25,951 - - 25,951
Derivatives - - 13 13
Total 27,231 - 66 27,297
Assets determined to belong
to the category at fair valute
through P&L
Liabilities determined to
belong to the category at fair
valute through P&L
Assets determined to belong
to the category at fair valute
through P&L
Liabilities determined to
belong to the category at fair
valute through P&L
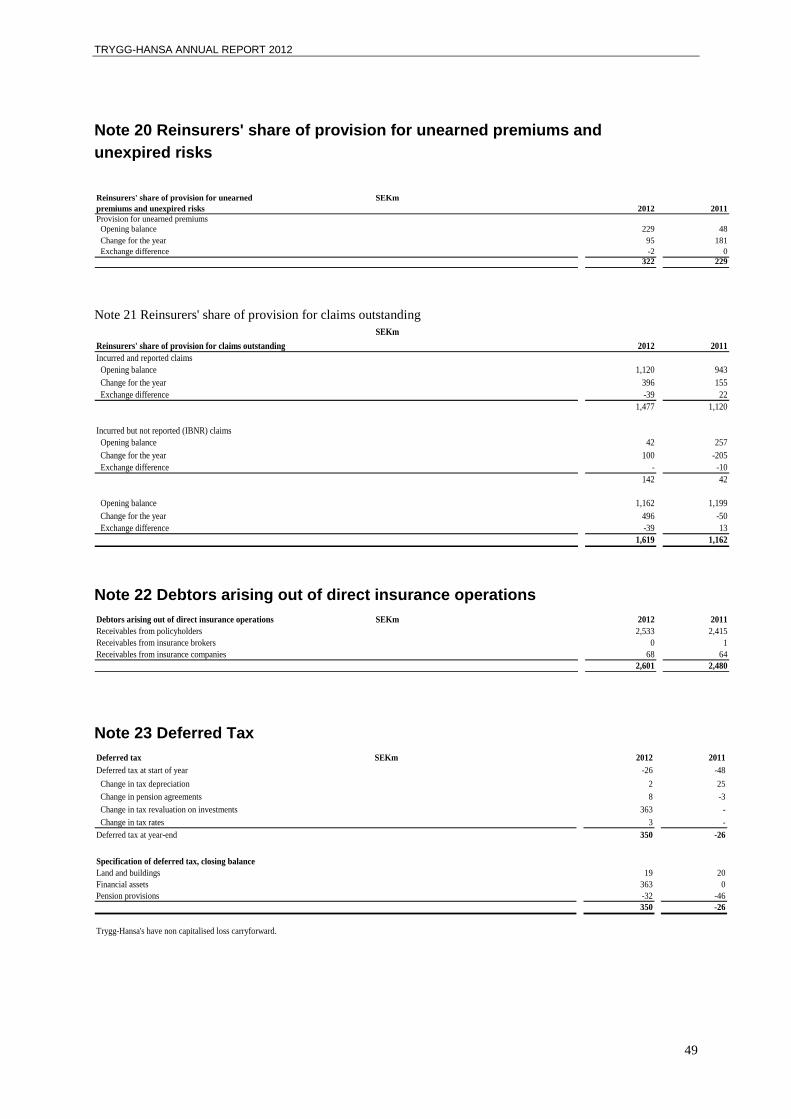
TRYGG-HANSA ANNUAL REPORT 2012
49
Note 20 Reinsurers' share of provision for unearned premiums and
unexpired risks
Reinsurers' share of provision for unearned SEKm
premiums and unexpired risks 2012 2011
Provision for unearned premiums
Opening balance 229 48
Change for the year 95 181
Exchange difference -2 0
322 229
Note 21 Reinsurers' share of provision for claims outstanding SEKm
Reinsurers' share of provision for claims outstanding 2012 2011
Incurred and reported claims
Opening balance 1,120 943
Change for the year 396 155
Exchange difference -39 22
1,477 1,120
Incurred but not reported (IBNR) claims
Opening balance 42 257
Change for the year 100 -205
Exchange difference - -10
142 42
Opening balance 1,162 1,199
Change for the year 496 -50
Exchange difference -39 13
1,619 1,162
Note 22 Debtors arising out of direct insurance operations
Debtors arising out of direct insurance operations SEKm 2012 2011
Receivables from policyholders 2,533 2,415
Receivables from insurance brokers 0 1
Receivables from insurance companies 68 64
2,601 2,480
Note 23 Deferred Tax
Deferred tax SEKm 2012 2011
Deferred tax at start of year -26 -48
Change in tax depreciation 2 25
Change in pension agreements 8 -3
Change in tax revaluation on investments 363 -
Change in tax rates 3 -
Deferred tax at year-end 350 -26
Specification of deferred tax, closing balance
Land and buildings 19 20
Financial assets 363 0
Pension provisions -32 -46
350 -26
Trygg-Hansa's have non capitalised loss carryforward.
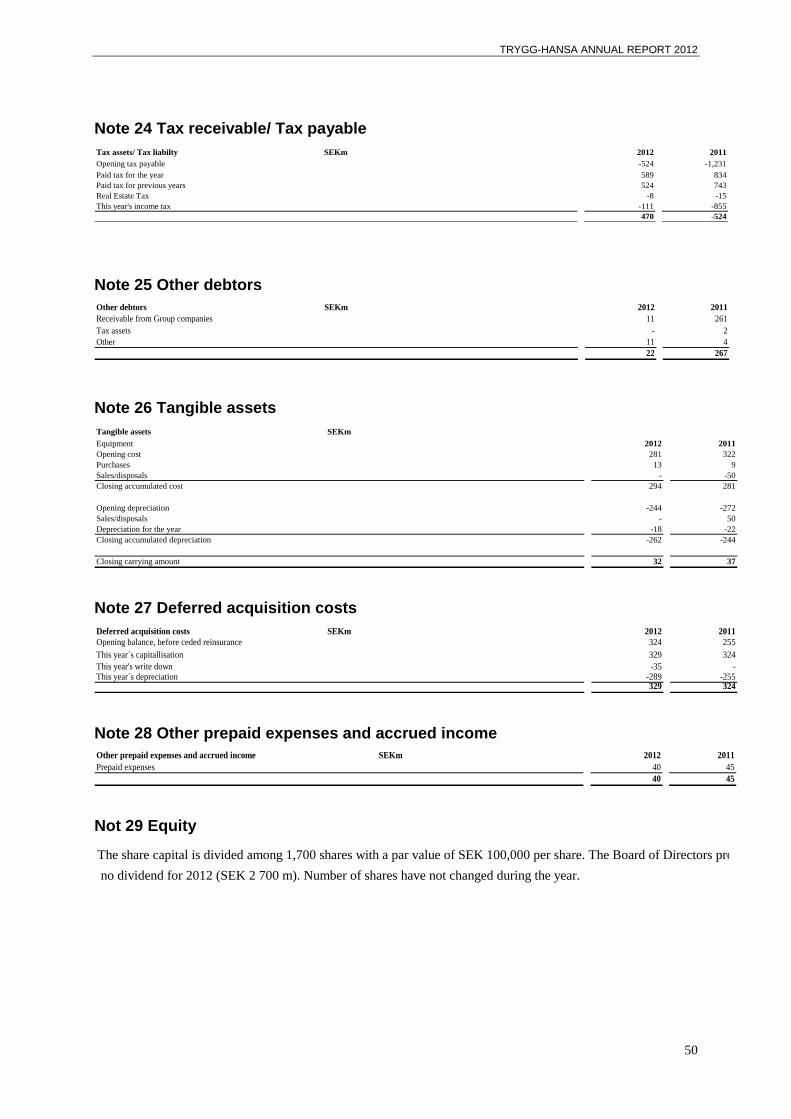
TRYGG-HANSA ANNUAL REPORT 2012
50
Note 24 Tax receivable/ Tax payable
Tax assets/ Tax liabilty SEKm 2012 2011
Opening tax payable -524 -1,231
Paid tax for the year 589 834
Paid tax for previous years 524 743
Real Estate Tax -8 -15
This year's income tax -111 -855
470 -524
Note 25 Other debtors
Other debtors SEKm 2012 2011
Receivable from Group companies 11 261
Tax assets - 2
Other 11 4
22 267
Note 26 Tangible assets
Tangible assets SEKm
Equipment 2012 2011
Opening cost 281 322
Purchases 13 9
Sales/disposals - -50
Closing accumulated cost 294 281
Opening depreciation -244 -272
Sales/disposals - 50
Depreciation for the year -18 -22
Closing accumulated depreciation -262 -244
Closing carrying amount 32 37
Note 27 Deferred acquisition costs
Deferred acquisition costs SEKm 2012 2011
Opening balance, before ceded reinsurance 324 255
This year´s capitallisation 329 324
This year's write down -35 -This year´s depreciation -289 -255
329 324
Note 28 Other prepaid expenses and accrued income
Other prepaid expenses and accrued income SEKm 2012 2011
Prepaid expenses 40 45
40 45
Not 29 Equity
The share capital is divided among 1,700 shares with a par value of SEK 100,000 per share. The Board of Directors proposes
no dividend for 2012 (SEK 2 700 m). Number of shares have not changed during the year.

TRYGG-HANSA ANNUAL REPORT 2012
51
Note 30 Provision for unearned premiums and unexpired risks
Provision for unearned premiums
and unexpired risks SEKm 2012 2011
Provision for unearned premiums
Opening balance 3,957 3,804
Change for the year 188 153
Exchange difference -1 0
4,144 3,957
Note 31 Provision for claims outstanding
The provision for claims outstanding is not discounted, with two exceptions. The provision for claims outstanding for disability and accident
insurance, and also the provision for annuities, has been discounted. Future claims payments have been calculated based on an assumption of general, future claims inflation of 1.75% per year.
An average discount rate of 1.66% (2.13%) has been used to discount disability and accident reserves. Provisions for claims outstanding after discounting of disability and accident claims amount to SEK 16,880 m. The corresponding amount without discounting is SEK 17,532 m.
When discounting provisions for annuities, an average discount rate of 2.08% (2.00%) has been used. Provisions for annuities after discounting amount to SEK 4,725 m. The corresponding amount without discounting is SEK 6,477 m.
Provision for claims outstanding SEKm 2012 2011
Incurred and reported claims
Opening balance 9,353 9,203
Change for the year 184 131
Exchange difference -36 19
9,501 9,353
Incurred but not reported (IBNR) claims
Opening balance 6,996 8,824
Change for the year -282 -1,820
Exchange difference - -8
6,714 6,996
Provision for property & casualty annuities and disability annuities
Opening balance 4,497 3,428
Change for the year 228 1,069
4,725 4,497
Provision for claims handling costs
Opening balance 700 742
Change for the year -35 -42
665 700
Total
Opening balance 21,546 22,197
Change for the year 95 -662
Exchange difference -36 11
21,605 21,546
Change in provision for claims outstanding during the year
Undiscounted provisions for claims outstanding at start of year 24,042 25,842
Currency adjustments 0 0
Undiscounted provisions for claims outstanding at start of year, adjusted 24,042 25,842
Discounting -2,496 -3,645
Provision for claims outstanding at start of year 21,546 22,197
Paid out during the year -7,167 -7,174
Change in obligations
- current year 3,936 3,566
- previous years -3,841 -4,228
Currency adjustments -1 0
Undiscounted provisions for claims outstanding at end of year 24,009 24,042
Discounting -2,404 -2,496
Provision for claims outstanding at end of year 21,605 21,546

TRYGG-HANSA ANNUAL REPORT 2012
52
Note 32 Provision for pensions and similar obligations
Together with other financial companies in Sweden, Trygg-Hansa has entered into a collective agreement for employee pensions. This
pension agreement has been entered into through Försäkringsbranschens Pensionskassa (FPK) and entails that Trygg-Hansa, in cooperation
with other companies, has an obligation to pay the respective employees' pensions in accordance with set rules. The FPK pension plan can be regarded as a defined benefit plan.
Trygg-Hansa does not have access to information that would enable reporting in accordance with IAS 19; therefore, in accordance with UFR 6, these plans are reported as defined contribution plans.
Under collective agreements, the company has also entered into agreements for defined contribution pension plans. For defined contribution plans, the employer is obligated to pay a set contribution (such as a fixed amount or percentage of salary). For such plans, the company bears
no risk with respect to future developments in interest rates, inflation, mortality or invalidity.
This is the opposite of a defined benefit plan, where the employer is obligated to pay a benefit, such as a fixed amount or a percentage of the
employee's final salary.
The company's obligations regarding contributions to defined contribution plans are reported as an expense in the income statement in pace
with the employees' earnings of such contributions, as the employees perform services for the company during a given period.
Premiums paid to FPK in 2012 amounted to SEK 119 m (119). The most recently available disclosures from FPK regarding surplus assets
for all contracted pensions are from the financial statements for the first half of 2012, where solvency amounts to 104% (102% as per 31
December 2011), based on distributable assets in relation to obligations to employers and insureds (guaranteed obligations and allocated bonuses).
Age 62 pensions
Under collective agreements, Trygg-Hansa employees born in 1955 or earlier have the right to retire at 62 years of age. Employees who
choose to exercise this opportunity for the time between the chosen and ordinary age of retirement receive compensation from their employer
in accordance with a calculation from FPK.
Provision for pensions and similar obligations SEKm 2012 2011
Opening balance 176 163
Provision/dissolution for the year -6 3
Interest expense 3 5
Actuarial gain and loss 3 49
Paid out during the year -31 -44
Closing balance 145 176
Amount at which the provision is expected to be paid after more than 12 months 124 154
The calculated provision for pensions is based on the following assumptions:
Discount rate 1.5% 2.0%
Anticipated salary increases 3.0% 3.0%
Assumption of the exploitation 85.0% 85.0%
Note 33 Creditors arising out of direct insurance operations
Creditors arising out of direct insurance operations SEKm 2012 2011
Payable to policyholders 109 116
Payable to insurance brokers 4 6
Payable to insurance companies 5 2
118 124
Note 34 Other creditors
Other creditors SEKm 2012 2011
Payable to Group companies 171 339
VAT payable 40 38
Trade accounts payable 71 71
Other 274 346
556 794
Not 35 Other accrued expenses and deferred income
Other accrued expenses and deferred income SEKm 2012 2011
Accrued personnel related costs 331 292
Other accrued expenses 155 170
Deferred income 7 -
493 462
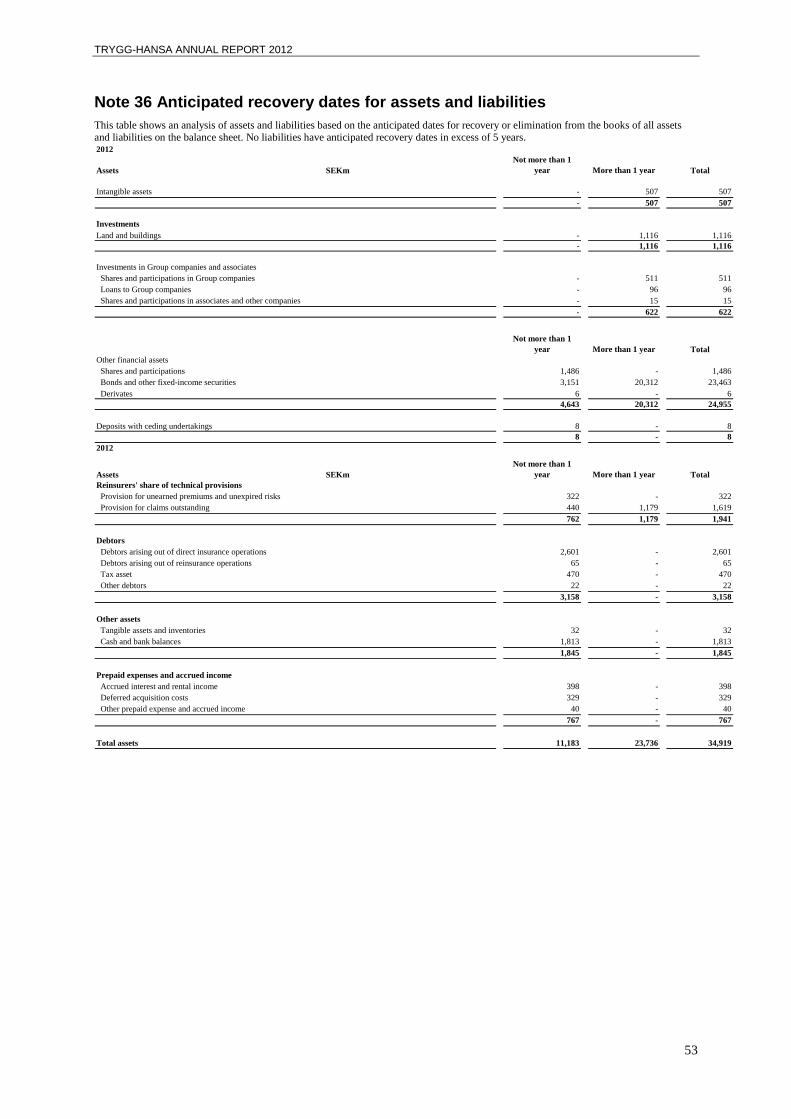
TRYGG-HANSA ANNUAL REPORT 2012
53
Note 36 Anticipated recovery dates for assets and liabilities
This table shows an analysis of assets and liabilities based on the anticipated dates for recovery or elimination from the books of all assets and liabilities on the balance sheet. No liabilities have anticipated recovery dates in excess of 5 years. 2012
Assets SEKm
Not more than 1
year More than 1 year Total
Intangible assets - 507 507
- 507 507
Investments
Land and buildings - 1,116 1,116
- 1,116 1,116
Investments in Group companies and associates
Shares and participations in Group companies - 511 511
Loans to Group companies - 96 96
Shares and participations in associates and other companies - 15 15
- 622 622
Not more than 1
year More than 1 year Total
Other financial assets
Shares and participations 1,486 - 1,486
Bonds and other fixed-income securities 3,151 20,312 23,463
Derivates 6 - 6
4,643 20,312 24,955
Deposits with ceding undertakings 8 - 8
8 - 8
2012
Assets SEKm
Not more than 1
year More than 1 year Total
Reinsurers' share of technical provisions
Provision for unearned premiums and unexpired risks 322 - 322
Provision for claims outstanding 440 1,179 1,619
762 1,179 1,941
Debtors
Debtors arising out of direct insurance operations 2,601 - 2,601
Debtors arising out of reinsurance operations 65 - 65
Tax asset 470 - 470
Other debtors 22 - 22
3,158 - 3,158
Other assets
Tangible assets and inventories 32 - 32
Cash and bank balances 1,813 - 1,813
1,845 - 1,845
Prepaid expenses and accrued income
Accrued interest and rental income 398 - 398
Deferred acquisition costs 329 - 329
Other prepaid expense and accrued income 40 - 40
767 - 767
Total assets 11,183 23,736 34,919

TRYGG-HANSA ANNUAL REPORT 2012
54
2011 SEKm
Assets
Not more than 1
year More than 1 year Total
Intangible assets - 407 407
- 407 407
Investments
Land and buildings - 1,116 1,116
- 1,116 1,116
Investments in Group companies and associates
Shares and participations in Group companies - 820 820
Loans to Group companies - 96 96
Shares and participations in associates and other companies - 15 15
- 931 931
Other financial assets
Shares and participations 1,333 - 1,333
Bonds and other fixed-income securities 4,843 21,108 25,951
Derivates 13 - 13
6,189 21,108 27,297
Depåer hos företag som avgivit återförsäkring 9 - 9
9 - 9
2011
Assets SEKm
Not more than 1
year More than 1 year Total
Reinsurers' share of technical
provisions
Provision for unearned premiums
and unexpired risks 229 - 229
Provision for claims outstanding 192 970 1,162
421 970 1,391
Debtors
Debtors arising out of direct insurance operations 2,480 - 2,480
Debtors arising out of reinsurance operations 54 - 54
Deferred taxes 26 - 26
Other debtors 297 - 297
2,827 48 2,827
Other assets
Tangible assets and inventories 37 - 37
Cash and bank balances 1,114 - 1,114
1,151 - 1,151
Prepaid expenses and accrued income
Accrued interest and rental income 455 - 455
Deferred acquisition costs 324 - 324
Other prepaid expense and accrued income 39 6 45
818 6 824
Total assets 10,082 24,538 35,953

TRYGG-HANSA ANNUAL REPORT 2012
55
2012 SEKm
Liabilities
Not more than 1
year More than 1 year Total
Technical provisions before
ceded reinsurance
Provision for unearned premiums
and unexpired risks 4,144 - 4,144
Provision for claims outstanding 3,378 18,227 21,605
7,522 18,227 25,749
Other provisions
Pensions and similar obligations 21 124 145
Taxes 350 - 350
Other provisions 57 - 57
428 124 552
Deposits from reinsurers 20 - 20
20 - 20
Creditors
Creditors arising out of direct insurance operations 118 - 118
Creditors arising out of reinsurance operations 140 - 140
Other creditors 556 - 556
814 - 814
Accrued expenses and deferred income
Other accrued expenses and deferred income
Other accrued expenses and deferred income 490 3 493
490 3 493
Total provisions and liabilities 9,274 18,354 27,628
2011
Liabilities SEKm
Not more than 1
year More than 1 year Total
Technical provisions before
ceded reinsurance
Provision for unearned premiums
and unexpired risks 3,957 - 3,957
Provision for claims outstanding 3,566 17,980 21,546
7,523 17,980 25,503
Other provisions
Pensions and similar obligations 22 154 176
Other provisions 2 - 2
24 154 178
Deposits from reinsurers 19 - 19
19 - 19
2011 Högst 1 år Längre än 1 år Totalt
Creditors
Creditors arising out of direct insurance operations 124 - 124
Creditors arising out of reinsurance operations 120 - 120
Tax liability 524 - 524
Other creditors 794 - 794
1,562 - 1,562
Accrued expenses and deferred income
Other accrued expenses and deferred income 462 - 462
462 - 462
Total provisions and liabilities 9,590 18,134 27,724

TRYGG-HANSA ANNUAL REPORT 2012
56
Note 37 Average number of employees; wages, salaries and remuneration
Average number of employees 2012 2011
Salaried employees 1,725 1,697
- of whom, men 966 957
Salaries and other remuneration, and social security costs MSEK 2012 2011
Salaried employees, salaries and other remuneration 1,002 959
Salaried employees, social security costs* 607 530
Total 1,609 1,489
*- of which, pension costs 299 246
Total 1,609 1,489
Part-time and special agents, number
Part-time and special agents, number 48 46
Part-time and special agents, remuneration 0 0
NUMBER AND REMUNERATION, SENIOR EXECUTIVES 2012 2011
Number of senior executives
Board* 7 7
CEO and other senior executives** 4 4
Total 11 11
*Of whom, men 4 6
**Of whom, men 4 4
By other senior executives is meant the Group management excluding the CEO.
SEKm
Remuneration of senior executives, 2012
Base salary
and benefits Bonuses***
Other variable
remuneration* Social security costs Other pension costs Total
Board of Directors 0 - - 0 - 0
CEO **) 4 2 2 - - 8
Other senior executives 8 3 2 3 1 17
12 5 4 3 1 25
* Other variable remuneration is vested share-based payment which are presentaded in detailj page 57.
**) The CEO's remuneration is paid out in Denmark and the UK, and is invoiced
and expensed in Sweden.
***) Of the total bonus cost, SEK 1m refers to bonus not yet paid. Previously
not paid bonus amounts to SEK 1m
Remuneration of senior executives, 2011
Base salary
and benefits Bonuses***
Other variable
remuneration* Social security costs Other pension costs Total
Board of Directors 0 - - 0 - 0
CEO 2 - - - 0 2
Other senior executives 8 8 9 6 3 34
10 8 9 6 3 36
The total expensed amount for severance pay in 2012 was SEK 17 m (13) and pertained to 28 (9) persons
The closing reserve for 2012 amounted to SEK 12 m (12), for 22 (13) persons. A total of SEK 6 m (10) in severance pay was paid out in 2012.
Management and Board of Directors
By other senior executives is meant the Group management excluding the CEO. The table above shows only the senior executives who have
their employment with Trygg-Hansa. In addition to these persons, the total Group management also consists of 7 (6) persons employed by
Codan A/S, Codan Forsikring A/S and RSA.
For management and the CEO, each year a proposal for salary adjustment and variable remuneration, including bonuses, is presented to
RSA's Remuneration Committee. A salary comparison is done with corresponding executives at RSA in addition to an external salary comparison. In addition, RSA's Remuneration Committee presents an approved recommendation for changes to the Chairman of the Board,
who decides on execution and payment. The bonus for the CEO may amount to a maximum of 100% of his fixed base salary, and for the
other members of management it may amount to a maximum of 80%.
Board members who are employed within the RSA Group receive no directors' fees. For the other board members, a fee is paid in accordance
with a decision by the Annual General Meeting, which in 2012 amounted to SEK 400 thousand (195). Remuneration for the CEO and other senior executives consists of a base salary, bonus, other variable remuneration, other benefits and pension insurance. By other senior
executives is meant the three persons in the company management who, together with the CEO, are employed by Trygg-Hansa.
Trygg-Hansa is part of the Codan Group, and the organisation is built up according to a Nordic structure. The respective employees'
remuneration is charged to the company in the Group in which the services are performed. The company's CEO has a special employment
agreement with Trygg-Hansa and Codan A/S. The amounts above include only remuneration for employment with Trygg-Hansa.

TRYGG-HANSA ANNUAL REPORT 2012
57
The retirement age for senior executives is 65. In addition to benefits under the insurance industry's pension plan, a supplementary retirement benefit is payable to members of the Group management who are employees of Trygg-Hansa, which is a defined contribution solution. The
CEO's pension plan is entirely a defined contribution plan.
The CEO and members of the Group management have a six-month notice period by their own initiative and a 12-month notice period in the
event the employer serves notice. Salary and benefits are payable during the notice period.
INCENTIVE PROGRAMMES
Trygg-Hansa has a number of incentive programmes that reward employees in both the short and long term. Trygg-Hansa's incentive
programmes are in compliance with the Swedish Financial Supervisory Authority's general guidelines, FFFS 2011:2.
Bonus Programme
Trygg-Hansa employees have been included in a bonus programme since 2006. The Bonus Programme is revised yearly. As a main
principle, all employees of Trygg-Hansa are included in the programme. As from 1 January 2010, employees in control functions are excluded from the Bonus Programme. The aim of the Trygg-Hansa Bonus Programme is to support the company's work with management by
objective, reward good work performance, and attract and retain talented employees.
The bonus outcome for individual employees is dependent on two factors: the company's financial performance (profitable growth) and
individual performance. Individual performance is measured in relation to the achievement of certain targets and the extent to which the
employee works in accordance with the company's values. These factors have different weight, depending on which position the employee has in the organisation. The outcome of bonuses related to the company's financial performance is decided on by the Board with the help of a
risk assessment.
Long Term Incentive Plan
The aim of the Long Term Incentive Plan is to focus and stimulate the employees' interest in the company's long-term objectives. The
programme's design provides opportunities for different types of share grants. Several of these share grants are conditional upon performance criteria. The Group management, managers and specialists at certain levels have the opportunity to be covered by share grants.
Voluntary Deferred Shares are purchased by participants from net bonus payable (limited to a maximum value of 33% of net bonus). For management, RSA's Remuneration Committee may recommend deferment of part of an individual's bonus (limited to 33% of the bonus) into
an award of shares referred to for the purpose of the plan as the Compulsory Deferred Plan. Deferred Shares are held in trust for three years,
and the right to these is normally forfeited when the employee leaves the company.
RSA's Remuneration Committee may recommend an award of shares on a matched basis to Voluntary and Compulsory Deferred Shares
(Matching Shares). Additionally, RSA's Remuneration Committee may recommend a limited award of Performance Shares. Awards of Performance Shares and Matching Shares related to Compulsory Deferred Shares are subject to a performance condition, consisting of a
return on equity target and a total shareholder return target (with performance measured by comparison against other European insurance
companies over a single three-year performance period). Matching Shares related to Voluntary Deferred Shares are subject to performance
conditions.
Other employees in managerial positions or senior specialist roles are eligible to receive grants of Restricted Shares. Restricted Shares are granted on the basis of the individual's performance and potential. Restricted Shares are not tied to performance targets.
Reported earned remuneration for 2012 is based on short-term variable pay earned during 2012 (paid out in during the first half year of 2013), and long-term share incentives earned under the RSA long-term incentive plan which was granted in Q2, 2012. As such, the long-term
incentives earning period offsets the 2012 accounting year, however the period is of a similar length as the accounting year, and reflects the
best possible evidence of the value of long-term incentives earned during the 2012 accounting year.
The allocation date for all grants is three years from the date of grant. Management participation in incentive programmes as per 31 december.
SEK m
Shares Aktier Price Shares Price Shares Price
Options outstanding at 1 January 2,253 - 1,346,464 - 31,642 11
Granted during the financial year - - 284,847 - - -
Exercised during the financial year - - -153,887 - - -
Forfeited during the financial year -2,253 - - - - -
Expired during the financial year - - -381,266 - -6,894 -
Options outstanding at 31 December - - 1,096,158 - 24,748 11
Possible grant of Matching Shares - - 1,213,794 - - -
Options exercisable at year-end - - - - - -
Long Term Incentive
Plan
Executive Share Option
Plan
Share Saving Option
Plan
Additional, detailed information can be found in RSA's Annual Report, which can be obtained from www.rsagroup.com.
Group management and Board of Directors
There are no incentive programmes for the Board of Directors. Group management is covered by the short-term and long-term incentive
programmes described above. Trygg-Hansa's board of directors has adopted a remuneration policy.

TRYGG-HANSA ANNUAL REPORT 2012
58
Disclosure obligation according to the Financial Supervisory Authority's general guideline FFFS 2011:2
A more detailed account of Trygg-Hansa's remuneration is provided in a separate report, which has been published on Trygg-Hansa's website
under "Financial information". See www.trygghansa.se.

TRYGG-HANSA ANNUAL REPORT 2012
59
Note 38 Related party disclosures
Owner
Codan A/S owns 100% of the shares in Trygg-Hansa Försäkringsaktiebolag (publ) and thus has control over the company.
Related parties
The company's related parties consist of members of the Board of Directors, management and related entities, the boards, managements and
senior executives of these companies, and these individuals' family members. Related parties also include companies in which the above-
mentioned individuals have significant interests.
The Board is responsible for identifying and managing the risk for conflicts of interest within Trygg-Hansa and has established guidelines for
dealing with conflicts of interest in the company internally and externally. On 1 February 2010 this responsibility was transferred to a board member who is independent from RSA.
Apart from normal remuneration of management, no transactions, except for those described below, took place during the year with the Board of Directors, management, senior executives, shareholders or other related parties.
Agreements have been entered into regarding the day-to-day operations between companies in the RSA Group. These pertain to the operations of Sveland Sakförsäkring, Holmia Livförsäkring, Codan Forsikring and the parent company RSA. Reinsurance contracts have
been entered into with companies in the Codan Group and with companies in the RSA Group at market terms.
Related party transactions
The company provides complete or partial administration for its Swedish subsidiaries. This pertains to claims settlement, premium handling,
accounting services, legal services, sales, marketing, etc. The company receives market-based compensation for this based on agreements signed by the respective companies' boards.
Trygg-Hansa pays compensation to RSA for certain services that are performed by RSA employees as well as current cost compensation for
e.g., training programmes in which the company's employees participate, share programmes for the company's employees, etc.
Administrative fees payable to and receivable from companies in the Codan Group are settled on a cost-coverage basis. Rents paid between
related operations are settled at market terms. For employees who also perform duties for Codan in Denmark, periodic invoicing is done to
Codan based on the share of the respective person's work time and salary cost. In a similar way, Trygg-Hansa is invoiced for work performed by employees of Codan for Trygg-Hansa.
Under the terms of an outsourcing agreement, Trygg-Hansa conducts all premium handling and claims settlement for Holmia Livförsäkring,
which entails that these transactions are channelled through Trygg-Hansa.
Trygg-Hansa has a loan of SEK 96 m to the subsidiary Brädstapeln Fastighets AB for the purpose of financing property purchases. The loan
carries a market rate of interest. In other respects, dealings between Trygg-Hansa and Group companies and the parent company are of a
continuing character. No other long-term financing exists. Dealings between Trygg-Hansa and the subsidiary Holmia Liv, which lacks its own administration, are settled on a regular basis.
Codan and RSA negotiate and administer parts of the company's reinsurance cover. Settlement is conducted on a regular basis and at market
terms.
Expansion of reinsurance programme
As part of its international capital and asset management strategy, RSA has established a new reinsurance company, RSA Reinsurance Ireland Ltd. Accordingly, the Board of Trygg-Hansa has decided to enter into a reinsurance contract with RSA Reinsurance Ireland Ltd,
which took effect on 1 January 2011.
For information on remuneration of senior executives, see Note 37.
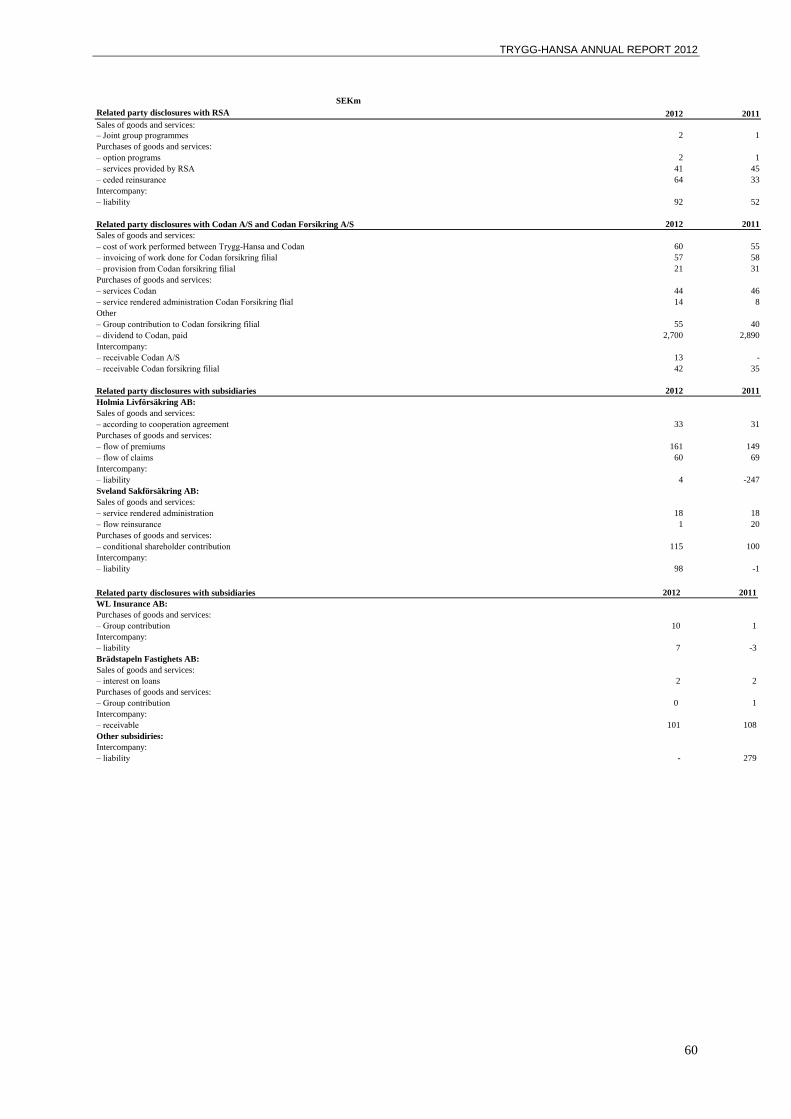
TRYGG-HANSA ANNUAL REPORT 2012
60
SEKm
Related party disclosures with RSA 2012 2011
Sales of goods and services:
– Joint group programmes 2 1
Purchases of goods and services:
– option programs 2 1
– services provided by RSA 41 45
– ceded reinsurance 64 33
Intercompany:
– liability 92 52
Related party disclosures with Codan A/S and Codan Forsikring A/S 2012 2011
Sales of goods and services:
– cost of work performed between Trygg-Hansa and Codan 60 55
– invoicing of work done for Codan forsikring filial 57 58
– provision from Codan forsikring filial 21 31
Purchases of goods and services:
– services Codan 44 46
– service rendered administration Codan Forsikring flial 14 8
Other
– Group contribution to Codan forsikring filial 55 40
– dividend to Codan, paid 2,700 2,890
Intercompany:
– receivable Codan A/S 13 -
– receivable Codan forsikring filial 42 35
Related party disclosures with subsidiaries 2012 2011
Holmia Livförsäkring AB:
Sales of goods and services:
– according to cooperation agreement 33 31
Purchases of goods and services:
– flow of premiums 161 149
– flow of claims 60 69
Intercompany:
– liability 4 -247
Sveland Sakförsäkring AB:
Sales of goods and services:
– service rendered administration 18 18
– flow reinsurance 1 20
Purchases of goods and services:
– conditional shareholder contribution 115 100
Intercompany:
– liability 98 -1
Related party disclosures with subsidiaries 2012 2011
WL Insurance AB:
Purchases of goods and services:
– Group contribution 10 1
Intercompany:
– liability 7 -3
Brädstapeln Fastighets AB:
Sales of goods and services:
– interest on loans 2 2
Purchases of goods and services:
– Group contribution 0 1
Intercompany:
– receivable 101 108
Other subsidiries:
Intercompany:
– liability - 279
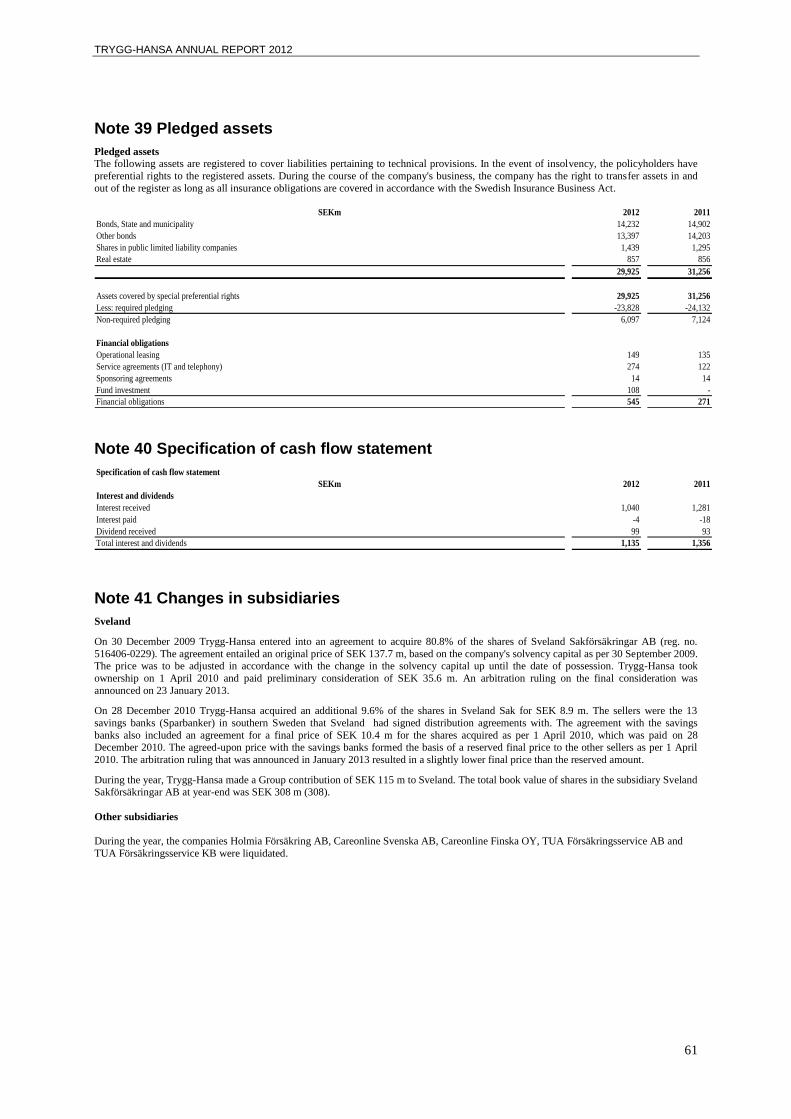
TRYGG-HANSA ANNUAL REPORT 2012
61
Note 39 Pledged assets
Pledged assets
The following assets are registered to cover liabilities pertaining to technical provisions. In the event of insolvency, the policyholders have
preferential rights to the registered assets. During the course of the company's business, the company has the right to transfer assets in and
out of the register as long as all insurance obligations are covered in accordance with the Swedish Insurance Business Act.
SEKm 2012 2011
Bonds, State and municipality 14,232 14,902
Other bonds 13,397 14,203
Shares in public limited liability companies 1,439 1,295
Real estate 857 856
29,925 31,256
Assets covered by special preferential rights 29,925 31,256
Less: required pledging -23,828 -24,132
Non-required pledging 6,097 7,124
Financial obligations
Operational leasing 149 135
Service agreements (IT and telephony) 274 122
Sponsoring agreements 14 14
Fund investment 108 -
Financial obligations 545 271
Note 40 Specification of cash flow statement
Specification of cash flow statement
SEKm 2012 2011
Interest and dividends
Interest received 1,040 1,281
Interest paid -4 -18
Dividend received 99 93
Total interest and dividends 1,135 1,356
Note 41 Changes in subsidiaries
Sveland
On 30 December 2009 Trygg-Hansa entered into an agreement to acquire 80.8% of the shares of Sveland Sakförsäkringar AB (reg. no.
516406-0229). The agreement entailed an original price of SEK 137.7 m, based on the company's solvency capital as per 30 September 2009. The price was to be adjusted in accordance with the change in the solvency capital up until the date of possession. Trygg-Hansa took
ownership on 1 April 2010 and paid preliminary consideration of SEK 35.6 m. An arbitration ruling on the final consideration was
announced on 23 January 2013.
On 28 December 2010 Trygg-Hansa acquired an additional 9.6% of the shares in Sveland Sak for SEK 8.9 m. The sellers were the 13
savings banks (Sparbanker) in southern Sweden that Sveland had signed distribution agreements with. The agreement with the savings
banks also included an agreement for a final price of SEK 10.4 m for the shares acquired as per 1 April 2010, which was paid on 28 December 2010. The agreed-upon price with the savings banks formed the basis of a reserved final price to the other sellers as per 1 April
2010. The arbitration ruling that was announced in January 2013 resulted in a slightly lower final price than the reserved amount.
During the year, Trygg-Hansa made a Group contribution of SEK 115 m to Sveland. The total book value of shares in the subsidiary Sveland Sakförsäkringar AB at year-end was SEK 308 m (308).
Other subsidiaries
During the year, the companies Holmia Försäkring AB, Careonline Svenska AB, Careonline Finska OY, TUA Försäkringsservice AB and
TUA Försäkringsservice KB were liquidated.

TRYGG-HANSA ANNUAL REPORT 2012
62
Note 42 Important estimations and assessments
Important estimations and assessments
Company management has discussed the development, choice and disclosures pertaining to significant accounting policies, estimations and sources of uncertainty, as well as the application of these policies and estimations.
Significant assessments regarding application of the company's accounting policies
Company management is of the opinion that no significant changes are needed in the applied accounting policies. The most important
assessments made during the year pertain to the size of the technical provisions. With respect to valuation of investments, fewer assessments
were made since the majority of investments are based on observable market prices or, as in the case of land and buildings, external appraisals.
Significant sources of uncertainty in estimations
Following is an account of significant sources of uncertainty in estimations:
Technical provisions Technical provisions are based on estimations and assumptions regarding future claim costs, which entails that the estimations always have
some level of uncertainty. The estimations are based on historical statistics on previous claims that are available at the time the annual
financial statements are prepared. The uncertainty concerning estimations is generally greater for estimations of new insurance portfolios or such insurance portfolios in which claims settlement stretches over a long period of years, as complete statistics are still lacking for these.
When estimating technical provisions, consideration is given to – among other things – the amount of unpaid claims, the claims trend,
changes in legislation, judicial rulings, and the general economic trend.
A large part of property & casualty insurance pertains to obligatory accident insurance and motor third-party liability insurance. The largest
uncertainties regarding these lines of business are the assumptions on inflation, mortality, the discount rate, and effects of changed legislation and legal practice.
Determining the fair value of financial instruments For valuations of financial assets and liabilities for which there is no observable market practice, valuation techniques are used that are
described in the accounting policies. This applies primarily for real estate, the value of which is determined with the help of external parties.
For financial instruments with limited liquidity, the observed market price can be objective. Therefore, for such instruments, certain additional assessments may be necessary, depending on the uncertainty of the market situation. The company has a large share of listed
bonds with good liquidity and few cases of uncertain assessments.
Note 43 Events after the balance sheet date
An agreement was reached on 23 January 2013 on a final level of consideration for the purchase of shares in Sveland Sakförsäkringar (reg. no. 516406-0229). The final price was slightly lower than the reserved amount. For further information, see note 41.
On 2 April 2013 Trygg-Hansa acquired 9,6 % of the shares in Sveland Sakförsäkringar AB from the 13 savings banks in southern of Sweden. After the acquisition Trygg-Hansa is the owner of 100 % of the shares.
No other events have occurred after 31 December 2012 that significantly affect the company's operations or financial position.
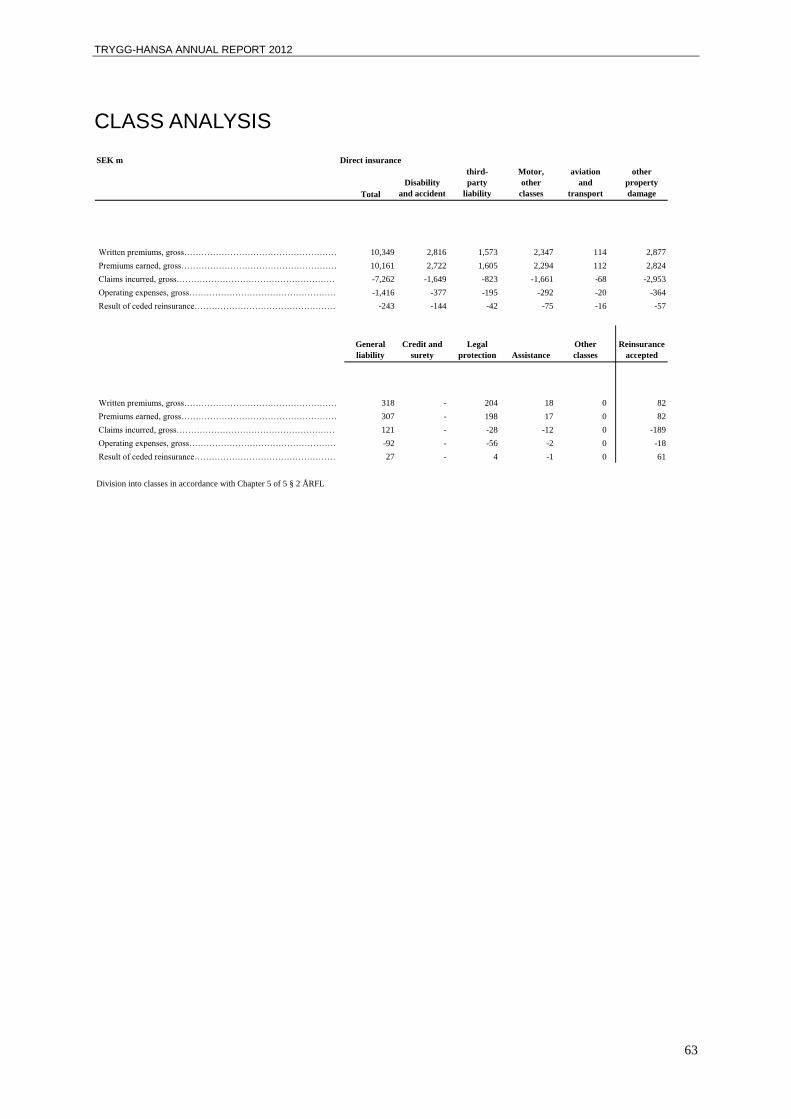
TRYGG-HANSA ANNUAL REPORT 2012
63
CLASS ANALYSIS SEK m Direct insurance
Total
Disability
and accident
Motor
third-
party
liability
Motor,
other
classes
Marine,
aviation
and
transport
Fire and
other
property
damage
Written premiums, gross…………………………………………………………………….10,349 2,816 1,573 2,347 114 2,877
Premiums earned, gross………………………………………………………………………..10,161 2,722 1,605 2,294 112 2,824
Claims incurred, gross………………………………………………………………………….-7,262 -1,649 -823 -1,661 -68 -2,953
Operating expenses, gross…………………………………………………………………………-1,416 -377 -195 -292 -20 -364
Result of ceded reinsurance……………………………………………………………………..-243 -144 -42 -75 -16 -57
General
liability
Credit and
surety
Legal
protection Assistance
Other
classes
Reinsurance
accepted
Written premiums, gross…………………………………………………………………….318 - 204 18 0 82
Premiums earned, gross………………………………………………………………………..307 - 198 17 0 82
Claims incurred, gross………………………………………………………………………….121 - -28 -12 0 -189
Operating expenses, gross……………………………………………………………………………-92 - -56 -2 0 -18
Result of ceded reinsurance……………………………………………………………………..27 - 4 -1 0 61
Division into classes in accordance with Chapter 5 of 5 § 2 ÅRFL
TRYGG-HANSA ANNUAL REPORT 2012
64
AUDITORS' REPORT
To the annual meeting of the shareholders
of Trygg-Hansa Försäkringsaktiebolag (publ)
Corporate identity number 516401-7799 Report on the annual accounts
We have audited the annual accounts of Trygg-Hansa
Försäkringsaktiebolag (publ) for the financial year 2012-01-01 –
2012-12-31.
Responsibilities of the Board of Directors and the Managing
Director for the annual accounts
The Board of Directors and the Managing Director are
responsible for the preparation and fair presentation of these
annual accounts in accordance with the Annual Accounts Act
for insurance companies and for such internal control as the
Board of Directors and the Managing Director determine is
necessary to enable the preparation of annual accounts that are
free from material misstatement, whether due to fraud or error.
Auditor’s responsibility
Our responsibility is to express an opinion on these annual
accounts based on our audit. We conducted our audit in
accordance with International Standards on Auditing and
generally accepted auditing standards in Sweden. Those
standards require that we comply with ethical requirements and
plan and perform the audit to obtain reasonable assurance about
whether the annual accounts are free from material
misstatement.
An audit involves performing procedures to obtain audit
evidence about the amounts and disclosures in the annual
accounts. The procedures selected depend on the auditor’s
judgement, including the assessment of the risks of material
misstatement of the annual accounts, whether due to fraud or
error. In making those risk assessments, the auditor considers
internal control relevant to the company’s preparation and fair
presentation of the annual accounts in order to design audit
procedures that are appropriate in the circumstances, but not for
the purpose of expressing an opinion on the effectiveness of the
company’s internal control. An audit also includes evaluating
the appropriateness of accounting policies used and the
reasonableness of accounting estimates made by the Board of
Directors and the Managing Director, as well as evaluating the
overall presentation of the annual accounts.
We believe that the audit evidence we have obtained is
sufficient and appropriate to provide a basis for our audit
opinion.
Opinions
In our opinion, the annual accounts have been prepared in
accordance with the Annual Accounts Act for insurance
companies and present fairly, in all material respects, the
financial position of Trygg-Hansa Försäkringsaktiebolag (publ)
as of 31 December 2012 and of its financial performance and its
cash flows for the year then ended in accordance with the
Annual Accounts Act for insurance companies. The statutory
administration report is consistent with the other parts of the
annual accounts.
We therefore recommend that the annual meeting of
shareholders adopt the income statement and balance sheets.
Report on other legal and regulatory requirements
In addition to our audit of the annual accounts, we have
examined the proposed appropriations of the company’s profit
or loss and the administration of the Board of Directors and the
Managing Director of Trygg-Hansa Försäkringsaktiebolag
(publ) for the financial year 2012-01-01 – 2012-12-31.
Responsibilities of the Board of Directors and the Managing
Director
The Board of Directors is responsible for the proposal for
appropriations of the company’s profit or loss, and the Board of
Directors and the Managing Director are responsible for
administration under the Companies Act.
Auditor’s responsibility
Our responsibility is to express an opinion with reasonable
assurance on the proposed appropriations of the company’s
profit or loss and on the administration based on our audit. We
conducted the audit in accordance with generally accepted
auditing standards in Sweden.
As a basis for our opinion on the Board of Directors’ proposed
appropriations of the company’s profit or loss, we examined the
Board of Directors’ reasoned statement to assess whether the
proposal is in accordance with the Companies Act and Insurance
Business Act.
As a basis for our opinion concerning discharge from liability,
in addition to our audit of the annual accounts, we examined
significant decisions, actions taken and circumstances of the
company in order to determine whether any member of the
Board of Directors or the Managing Director is liable to the
company. We also examined whether any member of the Board
of Directors or the Managing Director has, in any other way,
acted in contravention of the Companies Act, Insurance
Business Act, the Annual Accounts Act for insurance companies
or the Articles of Association.
We believe that the audit evidence we have obtained is
sufficient and appropriate to provide a basis for our opinion.
Opinions
We recommend to the annual meeting of shareholders that the
profit be appropriated in accordance with the proposal in the
statutory administration report and that the members of the
Board of Directors and the Managing Director be discharged
from liability for the financial year.
Stockholm, 29 April 2013
Deloitte AB
Göran Enguist
Authorized Public Accountant
TRYGG-HANSA ANNUAL REPORT 2012
65
GENERAL INFORMATION
Management Board of Directors
David Weymouth, Chairman
Anders Ehrling, Board
Fabrizio Moscone, Board
Vanessa Evans, Board
Synnöve Trygg, Board
Lena Darin, Employee representative
Claes Hansson, Employee representative
Mike Holliday-Williams, CEO
Auditor Auditor elected by the Annual General Meeting
Deloitte AB
Owner Codan A/S, Copenhagen, owns all of the shares in Trygg-Hansa
Försäkringsaktiebolag (publ). Codan A/S, in turn, is a wholly owned subsidiary of
RSA Insurance Group plc London (RSA).
Company addresses
Trygg-Hansa
SE-106 26 Stockholm
Sverige
Besöksadress Fleminggatan 18
Telefon 075-243 10 00
Org. nr. 516401-7799
www.trygghansa.se
Codan
www.codan.dk
RSA Insurance Group
www.rsagroup.com

TRYGG-HANSA ANNUAL REPORT 2012
66
Updated claims development tables
In the following tables for 2012 and 2011, the claims years 2005 and prior have been corrected compared to the
tables on pages 33-35. Furthermore, the merger of Aktsam as per January 2 2009 is treated consistently in the
tables for 2012 and 2011. Aktsam is now included as of the date of the merger with accumulated amounts. Some
roundings have also been adjusted. 2012
Loss development tables gross of
2005 and
prior 2006 2007 2008 2009 2010 2011 2012 Total
reinsurance SEKm SEKm SEKm SEKm SEKm SEKm SEKm SEKm SEKm
Estimate of cumulative claims
At end of accident year 17 457 4 236 4 612 4 273 4 520 3 779 3 732 4 035
1 year later 19 992 4 175 4 379 3 987 4 285 3 927 3 880
2 years later 20 225 4 136 4 240 3 868 4 050 3 782
3 years later 19 666 3 966 4 030 3 662 3 872
4 years later 19 433 3 769 3 807 3 555
5 years later 18 449 3 503 3 750
6 years later 17 348 3 468
7 years later 17 275
Claims paid
1 year later 2 746 1 582 2 141 1 959 1 892 1 947 1 999
2 years later 1 846 567 598 497 508 515
3 years later 1 540 237 188 197 275
4 years later 1 283 120 185 136
5 years later 987 100 63
6 years later 969 73
7 years later 911
Cumulative claims paid 10 282 2 679 3 175 2 789 2 675 2 462 1 999
2012 redundancy/(deficiency) 73 35 57 107 178 145 (148) 447
Reconciliation to the statement of financial position
Current year provision before discounting 6 993 789 575 766 1 197 1 320 1 881 4 035 17 556
Exchange adjustment to closing rates (24)
Discounting (2 404)
Annuity reserves 6 477
Present value recognised in the statement of financial position 21 605 2012
2005 and
prior 2006 2007 2008 2009 2010 2011 2012 Total
Loss development tables net of reinsurance SEKm SEKm SEKm SEKm SEKm SEKm SEKm SEKm SEKm
Estimate of cumulative claims
At end of accident year 15 628 4 200 4 357 4 110 4 508 3 657 3 553 3 508
1 year later 18 314 4 137 3 996 3 877 4 273 3 823 3 644
2 years later 18 502 4 058 3 845 3 779 4 037 3 681
3 years later 17 887 3 893 3 606 3 571 3 859
4 years later 17 629 3 700 3 361 3 464
5 years later 16 625 3 437 3 304
6 years later 15 494 3 402
7 years later 15 322
Claims paid
1 year later 2 632 1 567 1 856 1 894 1 889 1 934 1 882
2 years later 1 699 523 504 495 508 511
3 years later 1 411 235 186 197 273
4 years later 1 048 120 120 134
5 years later 765 100 63
6 years later 798 73
7 years later 841
Cumulative claims paid 9 194 2 618 2 729 2 720 2 670 2 445 1 882
2012 redundancy/(deficiency) 172 35 57 107 178 142 (91) 600
Reconciliation to the statement of financial position
Current year provision before discounting 6 128 784 575 744 1 189 1 236 1 762 3 508 15 926
Exchange adjustment to closing rates (13)
Discounting (2 404)
Annuity reserves 6 477
Present value recognised in the statement of financial position 19 986
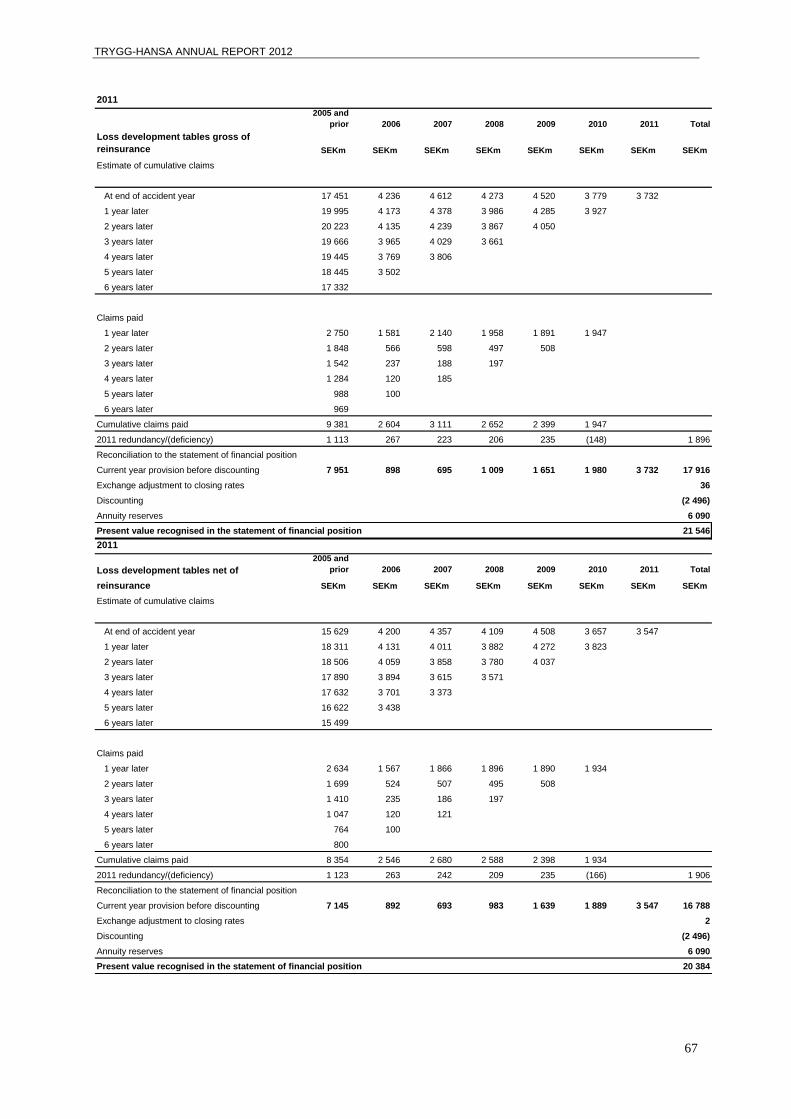
TRYGG-HANSA ANNUAL REPORT 2012
67
2011
2005 and
prior 2006 2007 2008 2009 2010 2011 Total
Loss development tables gross of
reinsurance SEKm SEKm SEKm SEKm SEKm SEKm SEKm SEKm
Estimate of cumulative claims
At end of accident year 17 451 4 236 4 612 4 273 4 520 3 779 3 732
1 year later 19 995 4 173 4 378 3 986 4 285 3 927
2 years later 20 223 4 135 4 239 3 867 4 050
3 years later 19 666 3 965 4 029 3 661
4 years later 19 445 3 769 3 806
5 years later 18 445 3 502
6 years later 17 332
Claims paid
1 year later 2 750 1 581 2 140 1 958 1 891 1 947
2 years later 1 848 566 598 497 508
3 years later 1 542 237 188 197
4 years later 1 284 120 185
5 years later 988 100
6 years later 969
Cumulative claims paid 9 381 2 604 3 111 2 652 2 399 1 947
2011 redundancy/(deficiency) 1 113 267 223 206 235 (148) 1 896
Reconciliation to the statement of financial position
Current year provision before discounting 7 951 898 695 1 009 1 651 1 980 3 732 17 916
Exchange adjustment to closing rates 36
Discounting (2 496)
Annuity reserves 6 090
Present value recognised in the statement of financial position 21 546
2011
Loss development tables net of
2005 and
prior 2006 2007 2008 2009 2010 2011 Total
reinsurance SEKm SEKm SEKm SEKm SEKm SEKm SEKm SEKm
Estimate of cumulative claims
At end of accident year 15 629 4 200 4 357 4 109 4 508 3 657 3 547
1 year later 18 311 4 131 4 011 3 882 4 272 3 823
2 years later 18 506 4 059 3 858 3 780 4 037
3 years later 17 890 3 894 3 615 3 571
4 years later 17 632 3 701 3 373
5 years later 16 622 3 438
6 years later 15 499
Claims paid
1 year later 2 634 1 567 1 866 1 896 1 890 1 934
2 years later 1 699 524 507 495 508
3 years later 1 410 235 186 197
4 years later 1 047 120 121
5 years later 764 100
6 years later 800
Cumulative claims paid 8 354 2 546 2 680 2 588 2 398 1 934
2011 redundancy/(deficiency) 1 123 263 242 209 235 (166) 1 906
Reconciliation to the statement of financial position
Current year provision before discounting 7 145 892 693 983 1 639 1 889 3 547 16 788
Exchange adjustment to closing rates 2
Discounting (2 496)
Annuity reserves 6 090
Present value recognised in the statement of financial position 20 384