trying to give business students what they need for their future bob andrews virginia commonwealth...
TRANSCRIPT

Trying to Give Business Students
What They Need for Their Future
Bob AndrewsVirginia Commonwealth University

Context
My undergraduate experience (never collected any data – only analyzed existing data)
Introductory Courses I teach (2 semester undergraduate or 1 semester graduate)Use Excel and JMP for computational software.
Students conditioned to memorize procedures and reproduce themStudent failure to recognize unreasonable answers
Sources of Data Business Students will encounterData from a fixed population Data observed at a specific timeTime Series Data observed at specified time intervalsProcess Data (data explosion is happening here)
Student performance on problems requiring them to choose which analysis method to use.

I will focus on three areas that I think are important for business students that receive little focus in the typical business statistics textbook
1. Asking the question, “Is my answer reasonable in this situation?”
2. Process data and the importance of checking for the stability of underlying characteristics for data gathered over time before performing an analysis procedure that assumes constant characteristics.
3. Discerning the most appropriate procedure to use for a particular scenario.
4. (Know what to do, Know how to do it, Know how to interpret it)
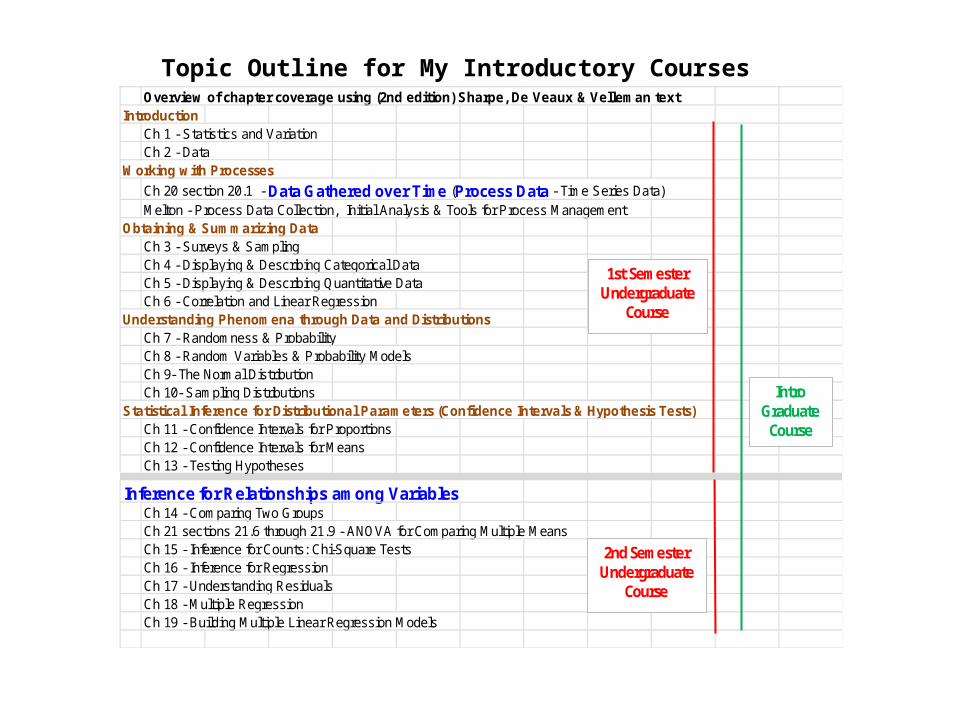
Overview of chapter coverage using (2nd edition) Sharpe, De Veaux & Velleman textIntroduction
Ch 1 - Statistics and VariationCh 2 - Data
Working with Processes
Ch 20 section 20.1 - Data Gathered over Time (Process Data - Time Series Data)Melton - Process Data Collection, Initial Analysis & Tools for Process Management
Obtaining & Summarizing Data Ch 3 - Surveys & SamplingCh 4 - Displaying & Describing Categorical DataCh 5 - Displaying & Describing Quantitative DataCh 6 - Correlation and Linear Regression
Understanding Phenomena through Data and DistributionsCh 7 - Randomness & ProbabilityCh 8 - Random Variables & Probability ModelsCh 9- The Normal Distribution Ch 10- Sampling Distributions
Statistical Inference for Distributional Parameters (Confidence Intervals & Hypothesis Tests)Ch 11 - Confidence Intervals for ProportionsCh 12 - Confidence Intervals for MeansCh 13 - Testing Hypotheses
Inference for Relationships among Variables Ch 14 - Comparing Two GroupsCh 21 sections 21.6 through 21.9 - ANOVA for Comparing Multiple MeansCh 15 - Inference for Counts: Chi-Square TestsCh 16 - Inference for RegressionCh 17 - Understanding ResidualsCh 18 - Multiple RegressionCh 19 - Building Multiple Linear Regression Models
1st Semester Undergraduate
Course
2nd Semester Undergraduate
Course
Intro Graduate
Course
Topic Outline for My Introductory Courses

Project for Process Data
Each student selects an activity that is done on a daily basis in a typical work or calendar week.
Each day for at least 25 days the student records:date day of week time to complete activity (T)a separate categorical variable (C)a separate quantitative variable (Q)
Operational definitions must be supplied for measuring each variable.
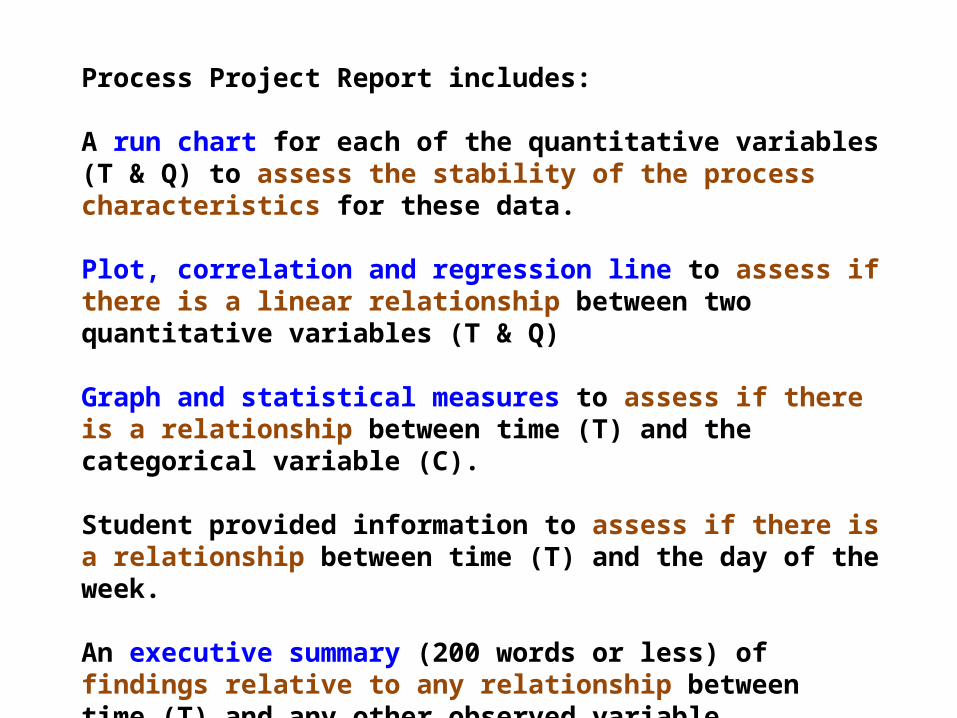
Process Project Report includes:
A run chart for each of the quantitative variables (T & Q) to assess the stability of the process characteristics for these data.
Plot, correlation and regression line to assess if there is a linear relationship between two quantitative variables (T & Q)
Graph and statistical measures to assess if there is a relationship between time (T) and the categorical variable (C).
Student provided information to assess if there is a relationship between time (T) and the day of the week.
An executive summary (200 words or less) of findings relative to any relationship between time (T) and any other observed variable.

JMP dialog box for testing/modeling relationship between two variables

Table for Selecting Testing Procedure Based on Type of Variables Variable Type for X {predictor variable(s)}Variable Type for Y {Response Variable}
Categorical (2 categories)
Categorical (3 or more categories)
Quantitative (1 variable)
Quantitative (2 or more variables)
Quantitative (1 variable)
III. 2 Means (assume = variance)IX. ANOVA
(All Group Means =)(k Independent Samples)
X. Simple Linear Regression
(1 Quantitative vs. 1 Predictor Variable)
XI. Multiple Linear Regression
(1 Quantitative vs. k Predictor Variables)
IV. 2 Means (assume ≠ variances)
V. 2 Means (Paired Sampling)
Categorical (3 or more categories)
VIII. Independence of 2 Categorical Variables
VIII. Independence of 2 Categorical Variables
Multinomial Logistic Regression Not Covered in this Class
Categorical - Dichotomous (2 categories)
VII. 2 Proportions (2 Independent Samples) VIII. Independence of 2
Categorical Variables
XII. Logistic Regression
(1 Dichotomous vs. 1 Predictor Variable)
XII. Logistic Regression(1 Dichotomous vs.
k Predictor Variables)VIII. Independence of 2 Categorical Variables
Green shading denotes that Data consist of Independent Samples for each category Lavender shading denotes that Data consist of a pair/block of values for each case

Hypothesis Testing procedures covered in class from the Sharpe text (second edition)
Section (text section) Parameter(s) (Situation) Excel - Data Analysis (description) [JMP] Distribution
I. (13.1, pg 359) Single Proportion (1-proportion z-test) Z (standard normal)
II. (13.6, pg 368) Single Mean Descriptive Statistics for CI (1-sample t-test) t (df=n-1)
III. (14.5, pg 411) 2 Means (2 Independent Samples n1≈n2 or σ1≈σ2)t-test Two-Sample Assuming Equal Variances
[Fit Y by X; Means/Anova/Pooled t] t
IV. (14.2, pg 403) 2 Means (2 Independent Samples n1≠n2 & σ1≠σ2)t-test Two-Sample Assuming Unequal Variances
[Fit Y by X; t Test] t V. (14.8, pg 419) 2 Means (Paired Sampling) t-test Paired Two Sample for Means [Matched Pairs] t VI. (15.1, pg 451) Probabilities specifying distribution (Goodness-of-Fit test, CHITEST function) χ2
VII. (15.5, pg 464) 2 Proportions (2 Independent Samples) (2 proportion difference or test of independence) Z or χ2
VIII. (15.6, pg 466) Independence of 2 Categorical Variables (test of independence, CHITEST function) [Fit Y by X] χ2
IX. (21.6, pg 729) k Means (k Independent Samples)Anova: Single Factor (1-way ANOVA)
[Fit Y by X; means/anova] F
X. (16.4, pg 499) Slope (1 Quantitative vs. 1 Independent Variable)Regression (Simple Linear Regression)
[Fit Y by X; Fit Line] or [Fit Model] t
XI. (18.4, pg 591) Slopes (1 Quantitative vs. k Independent Variables)
Regression (Multiple Regression) [Fit Model] F & t
XII. (18.6, pg 595) Coeff. (1 Dichotomous vs. k Independent Variables)
(Bivariate Logistic Regression) [Fit Y by X] or {Fit Model] χ2

Project 2 FeaturesData set with 5 variables:C1 Categorical Variable 1 is to have two categories (5 or more per category group) C2 Categorical Variable 2 is to have three categories (5 or more per category group) Q1 Quantitative Variable 1 is to have a quantitative measurement. Q2 Quantitative Variable 2 is to have a different quantitative measurement R Response Variable
Project asks students to give a statement of belief about the relationships between variables before performing any analysis.
The students are to assess using appropriate graphs and testing procedures to determine if the data support the respective belief statements.

http://www.people.vcu.edu/~randrews
Contents of this presentation can be obtained in an Excel file using the circled link above.
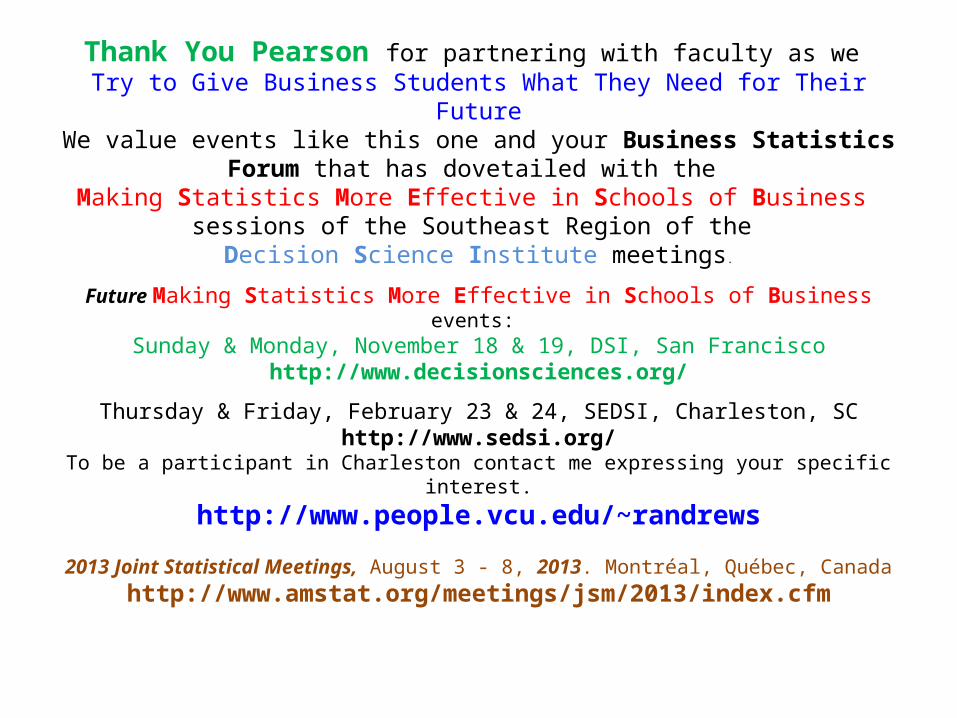
Thank You Pearson for partnering with faculty as we Try to Give Business Students What They Need for Their Future
We value events like this one and your Business Statistics Forum that has dovetailed with the
Making Statistics More Effective in Schools of Business sessions of the Southeast Region of the
Decision Science Institute meetings.
Future Making Statistics More Effective in Schools of Business events: Sunday & Monday, November 18 & 19, DSI, San Francisco
http://www.decisionsciences.org/
Thursday & Friday, February 23 & 24, SEDSI, Charleston, SChttp://www.sedsi.org/
To be a participant in Charleston contact me expressing your specific interest.
http://www.people.vcu.edu/~randrews
2013 Joint Statistical Meetings, August 3 - 8, 2013. Montréal, Québec, Canadahttp://www.amstat.org/meetings/jsm/2013/index.cfm