ts 134 114 - v8.2.0 - digital cellular telecommunications ... mobile telecommunications system...
TRANSCRIPT
ETSI TS 134 114 V8.2.0 (2009-10)
Technical Specification
Digital cellular telecommunications system (Phase 2+);Universal Mobile Telecommunications System (UMTS);
LTE;User Equipment (UE) / Mobile Station (MS) Over The Air (OTA) antenna performance;
Conformance testing (3GPP TS 34.114 version 8.2.0 Release 8)

ETSI
ETSI TS 134 114 V8.2.0 (2009-10)13GPP TS 34.114 version 8.2.0 Release 8
Reference RTS/TSGR-0534114v820
Keywords GSM, LTE, UMTS
ETSI
650 Route des Lucioles F-06921 Sophia Antipolis Cedex - FRANCE
Tel.: +33 4 92 94 42 00 Fax: +33 4 93 65 47 16
Siret N° 348 623 562 00017 - NAF 742 C
Association à but non lucratif enregistrée à la Sous-Préfecture de Grasse (06) N° 7803/88
Important notice
Individual copies of the present document can be downloaded from: http://www.etsi.org
The present document may be made available in more than one electronic version or in print. In any case of existing or perceived difference in contents between such versions, the reference version is the Portable Document Format (PDF).
In case of dispute, the reference shall be the printing on ETSI printers of the PDF version kept on a specific network drive within ETSI Secretariat.
Users of the present document should be aware that the document may be subject to revision or change of status. Information on the current status of this and other ETSI documents is available at
http://portal.etsi.org/tb/status/status.asp
If you find errors in the present document, please send your comment to one of the following services: http://portal.etsi.org/chaircor/ETSI_support.asp
Copyright Notification
No part may be reproduced except as authorized by written permission. The copyright and the foregoing restriction extend to reproduction in all media.
© European Telecommunications Standards Institute 2009.
All rights reserved.
DECTTM, PLUGTESTSTM, UMTSTM, TIPHONTM, the TIPHON logo and the ETSI logo are Trade Marks of ETSI registered for the benefit of its Members.
3GPPTM is a Trade Mark of ETSI registered for the benefit of its Members and of the 3GPP Organizational Partners. LTE™ is a Trade Mark of ETSI currently being registered
for the benefit of its Members and of the 3GPP Organizational Partners. GSM® and the GSM logo are Trade Marks registered and owned by the GSM Association.

ETSI
ETSI TS 134 114 V8.2.0 (2009-10)23GPP TS 34.114 version 8.2.0 Release 8
Intellectual Property Rights IPRs essential or potentially essential to the present document may have been declared to ETSI. The information pertaining to these essential IPRs, if any, is publicly available for ETSI members and non-members, and can be found in ETSI SR 000 314: "Intellectual Property Rights (IPRs); Essential, or potentially Essential, IPRs notified to ETSI in respect of ETSI standards", which is available from the ETSI Secretariat. Latest updates are available on the ETSI Web server (http://webapp.etsi.org/IPR/home.asp).
Pursuant to the ETSI IPR Policy, no investigation, including IPR searches, has been carried out by ETSI. No guarantee can be given as to the existence of other IPRs not referenced in ETSI SR 000 314 (or the updates on the ETSI Web server) which are, or may be, or may become, essential to the present document.
Foreword This Technical Specification (TS) has been produced by ETSI 3rd Generation Partnership Project (3GPP).
The present document may refer to technical specifications or reports using their 3GPP identities, UMTS identities or GSM identities. These should be interpreted as being references to the corresponding ETSI deliverables.
The cross reference between GSM, UMTS, 3GPP and ETSI identities can be found under http://webapp.etsi.org/key/queryform.asp.

ETSI
ETSI TS 134 114 V8.2.0 (2009-10)33GPP TS 34.114 version 8.2.0 Release 8
Contents
Intellectual Property Rights ................................................................................................................................ 2
Foreword ............................................................................................................................................................. 2
Foreword ............................................................................................................................................................. 6
1 Scope ........................................................................................................................................................ 7
2 References ................................................................................................................................................ 7
3 Definitions, symbols, abbreviations and equations .................................................................................. 8
3.1 Symbols .............................................................................................................................................................. 8
3.2 Abbreviations ..................................................................................................................................................... 8
4 General ..................................................................................................................................................... 9
4.1 Measurement frequencies ................................................................................................................................... 9
4.1.1 FDD frequency bands ................................................................................................................................... 9
4.1.2 GSM frequency bands ................................................................................................................................ 10
4.1.3 TDD frequency bands ................................................................................................................................. 11
5 Transmitter Performance ........................................................................................................................ 12
5.1 General ............................................................................................................................................................. 12
5.1.1 DUT positioning ......................................................................................................................................... 12
5.1.2 Sampling grid.............................................................................................................................................. 12
5.2 Total Radiated Power (TRP) for FDD UE ....................................................................................................... 12
5.2.1 Definition and applicability ........................................................................................................................ 12
5.2.2 Minimum Requirements ............................................................................................................................. 12
5.2.3 Test purpose ................................................................................................................................................ 13
5.2.4 Method of test ............................................................................................................................................. 13
5.2.4.1 Initial conditions ................................................................................................................................... 13
5.2.4.2 Procedure .............................................................................................................................................. 14
5.2.5 Test requirements ........................................................................................................................................ 14
5.3 Total Radiated Power (TRP) for GSM MS ...................................................................................................... 15
5.3.1 Definition and applicability ........................................................................................................................ 15
5.3.2 Minimum Requirements ............................................................................................................................. 15
5.3.3 Test purpose ................................................................................................................................................ 16
5.3.4 Method of test ............................................................................................................................................. 16
5.3.4.1 Initial conditions ................................................................................................................................... 16
5.3.4.2 Procedure .............................................................................................................................................. 16
5.3.5 Test requirements ........................................................................................................................................ 17
5.4 Total Radiated Power (TRP) for TDD UE ....................................................................................................... 17
5.4.1 Definition and applicability ........................................................................................................................ 17
5.4.2 Minimum Requirements ............................................................................................................................. 17
5.4.3 Test purpose ................................................................................................................................................ 18
5.4.4 Method of test ............................................................................................................................................. 18
5.4.4.1 Initial conditions ................................................................................................................................... 18
5.4.4.2 Procedure .............................................................................................................................................. 19
5.4.5 Test requirements ........................................................................................................................................ 19
6 Receiver Performance ............................................................................................................................ 20
6.1 General ............................................................................................................................................................. 20
6.1.1 DUT Positioning ......................................................................................................................................... 20
6.1.2 Sampling grid.............................................................................................................................................. 20
6.2 Total Radiated Sensitivity (TRS) for FDD UE................................................................................................. 21
6.2.1 Definition and applicability ........................................................................................................................ 21
6.2.2 Minimum requirements ............................................................................................................................... 21
6.2.3 Test Purpose................................................................................................................................................ 22
6.2.4 Method of test ............................................................................................................................................. 22
6.2.4.1 Initial conditions ................................................................................................................................... 22
6.2.4.2 Test procedure ....................................................................................................................................... 22

ETSI
ETSI TS 134 114 V8.2.0 (2009-10)43GPP TS 34.114 version 8.2.0 Release 8
6.2.5 Test requirements ........................................................................................................................................ 23
6.3 Total Radiated Sensitivity (TRS) for GSM MS ............................................................................................... 24
6.3.1 Definition and applicability ........................................................................................................................ 24
6.3.2 Minimum requirements ............................................................................................................................... 24
6.3.3 Test Purpose................................................................................................................................................ 24
6.3.4 Method of test ............................................................................................................................................. 24
6.3.4.1 Initial conditions ................................................................................................................................... 24
6.3.4.2 Test procedure ....................................................................................................................................... 25
6.3.5 Test requirements ........................................................................................................................................ 25
6.4 Total Radiated Sensitivity (TRS) for TDD UE ................................................................................................ 25
6.4.1 Definition and applicability ........................................................................................................................ 25
6.4.2 Minimum requirements ............................................................................................................................... 26
6.4.3 Test Purpose................................................................................................................................................ 26
6.4.4 Method of test ............................................................................................................................................. 27
6.4.4.1 Initial conditions ................................................................................................................................... 27
6.4.4.2 Test procedure ....................................................................................................................................... 27
6.4.5 Test requirements ........................................................................................................................................ 27
Annex A (normative): Test system characterization ......................................................................... 29
A.1 Phantom specifications ........................................................................................................................... 29
A.1.1 Head Phantom ......................................................................................................................................................... 29
A.2 Anechoic chamber constraints ................................................................................................................... 29
A.2.1 Positioner .......................................................................................................................................................... 29
A.2.2 Measurement Antenna ...................................................................................................................................... 30
A.2.3 Quiet Zone ........................................................................................................................................................ 30
A.2.4 Shielding effectiveness of the chamber ............................................................................................................ 30
Annex B (normative): Calibration ...................................................................................................... 31
B.1 Calibration Procedure ............................................................................................................................. 31
Annex C (normative): Measurement Test Report ............................................................................. 33
Annex D (normative): Maximum uncertainty of Test System and Test Tolerances ...................... 34
D.1 Maximum uncertainty of Test System ................................................................................................... 34
D.2 Test tolerances (informative) .................................................................................................................. 34
D.3 Derivation of Test Requirements (informative) ..................................................................................... 35
Annex E (normative): Estimation of Measurement Uncertainty ..................................................... 36
E.1 Mismatch uncertainty between measurement receiver and the probe antenna ....................................... 39
E.3 Insertion loss of the probe antenna cable ............................................................................................... 39
E.4 Insertion loss of the probe antenna attenuator (if used) ......................................................................... 40
E.5 Insertion loss of the RF relays (if used).................................................................................................. 40
E.6 Influence of the antenna cable ................................................................................................................ 40
E.6.1 Probe antenna cable .......................................................................................................................................... 40
E.6.2 Calibration antenna cable ................................................................................................................................. 40
E.7 Absolute gain of the probe antenna ........................................................................................................ 40
E.8 Measurement Receiver: uncertainty of absolute level ............................................................................ 40
E.9 Measurement distance ............................................................................................................................ 40
E.9.1 Offset of DUT phase centre from axis(es) of rotation ...................................................................................... 41
E.9.2 Mutual coupling ............................................................................................................................................... 41
E.9.3 Phase curvature ................................................................................................................................................ 41
E.10 Quality of quiet zone .............................................................................................................................. 41

ETSI
ETSI TS 134 114 V8.2.0 (2009-10)53GPP TS 34.114 version 8.2.0 Release 8
E.11 Tx-power drift of DUT ........................................................................................................................... 42
E.12 Uncertainty related to the use of SAM phantom .................................................................................... 42
E.12.1 Uncertainty from using different types of SAM phantom ................................................................................ 42
E.12.2 Simulated tissue liquid uncertainty .................................................................................................................. 42
E.12.3 Device Holder .................................................................................................................................................. 42
E.13 Coarse sampling grid .............................................................................................................................. 43
E.14 Random uncertainty ............................................................................................................................... 43
E.15 Uncertainty of network analyzer ............................................................................................................ 44
E.16 Uncertainty of the gain/efficiency of the calibration antenna ................................................................ 44
E.17 Base station simulator: uncertainty of the absolute level ....................................................................... 44
E.18 BER measurement: output level step resolution .................................................................................... 44
E.19 Statistical uncertainty of the BER measurement .................................................................................... 44
E.19.1 WCDMA .......................................................................................................................................................... 45
E.19.2 GSM ................................................................................................................................................................. 45
E.19.3 TD-SCDMA ..................................................................................................................................................... 45
E.20 BER normalization uncertainty .............................................................................................................. 45
E.21 DUT sensitivity drift .............................................................................................................................. 45
E.22 Cable loss measurement uncertainty ...................................................................................................... 46
E.23 Signal generator: uncertainty of the absolute output level ..................................................................... 46
E.24 Signal generator: output level stability ................................................................................................... 46
E.25 Insertion loss: Calibration antenna feed cable ........................................................................................ 46
E.26 Insertion loss: Calibration antenna attenuator (if used) .......................................................................... 47
E.27 Examples of uncertainty budget calculations for TRP(Informative) ...................................................... 48
E.28 Examples of uncertainty budget calculations for TRS(Informative) ...................................................... 50
Annex F (informative): Suggested Recipes of Liquid to be used inside SAM Phantom .................. 52
Annex G (informative): Anechoic Chamber Specifications and Validation Method ....................... 53
G.1 Shielded anechoic chamber specifications ............................................................................................. 53
G.2 Quiet Zone reflectivity level validation .................................................................................................. 53
G.2.1 Description of a practical method for Quiet Zone characterization .................................................................. 53
G.4 Standard deviation of electric field ........................................................................................................ 54
Annex H (informative): Bibliography ................................................................................................... 56
Annex I (informative): Change history ............................................................................................... 58
History .............................................................................................................................................................. 59

ETSI
ETSI TS 134 114 V8.2.0 (2009-10)63GPP TS 34.114 version 8.2.0 Release 8
Foreword This Technical Specification has been produced by the 3rd Generation Partnership Project (3GPP).
The contents of the present document are subject to continuing work within the TSG and may change following formal TSG approval. Should the TSG modify the contents of the present document, it will be re-released by the TSG with an identifying change of release date and an increase in version number as follows:
Version x.y.z
where:
x the first digit:
1 presented to TSG for information;
2 presented to TSG for approval;
3 or greater indicates TSG approved document under change control.
y the second digit is incremented for all changes of substance, i.e. technical enhancements, corrections, updates, etc.
z the third digit is incremented when editorial only changes have been incorporated in the document.

ETSI
ETSI TS 134 114 V8.2.0 (2009-10)73GPP TS 34.114 version 8.2.0 Release 8
1 Scope The present document describes the test procedure for the radiated performances measurements of the 3G/2G user equipment/mobile stations (UE/MS) in active mode in both the up- and the downlink. The FDD UE test procedure is based on the test method developed as a result of COST 273 Sub-Working Group (SWG) 2.2 members’ contributions. Background work has also been made in the former COST259 project. The TDD UE test procedure is based on the test method developed as a result of CCSA TC9 WG1 members’ contributions. Background work has been made in the former CCSA TC9 project.
The measurement procedure explained in this document applies to UE/MS used under the “speech mode” conditions that correspond to predefined positions for voice application when the handset is held close to the user’s head. This method is also applicable to free space measurements and for testing data applications.
The testing methodology applies to any single or multi-mode (GSM / UMTS / TD-SCDMA) terminals.
The radio tests considered here are:
1. The measurement of the Total Radiated Power (TRP)
2. The measurement of the Total Radiated Sensitivity (TRS)
The test procedure described in this document measures the performance of the transmitter and the receiver, including the antenna and also the effects of the user.
The major parts of this test procedure are based on the 3-D pattern measurement method. It has been considered necessary to define some items and components in the test procedure in detail, such as test channels and phantom set-ups, in order to make the testing in different laboratories harmonized. The procedure is, however, not limited to some specific antenna chambers or positioners.
2 References The following documents contain provisions which, through reference in this text, constitute provisions of the present document.
• References are either specific (identified by date of publication, edition number, version number, etc.) or non-specific.
• For a specific reference, subsequent revisions do not apply.
• For a non-specific reference, the latest version applies. In the case of a reference to a 3GPP document (including a GSM document), a non-specific reference implicitly refers to the latest version of that document in the same Release as the present document.
[1] 3GPP TR 25.914 Technical Specification 3rd Generation Partnership Project; Technical Specification Group Radio Access Networks; Measurements of Radio Performances for UMTS Terminals in Speech Mode
[2] 3GPP TS 25.101 Technical Specification 3rd Generation Partnership Project; Technical Specification Group Radio Access Networks; User Equipment (UE) radio transmission and reception (FDD)
[3] 3GPP 34.121, 3rd Generation Partnership Project; Technical Specification Group Terminals; Terminal conformance specification; Radio transmission and reception (FDD)
[4] ETSI TR 100 028, Paragraph D.1.3.6
[5] ETSI TR 102 273-1-2
[6] ETSI TR 102 273-1-1

ETSI
ETSI TS 134 114 V8.2.0 (2009-10)83GPP TS 34.114 version 8.2.0 Release 8
[7] 3GPP TR 21.905 "Vocabulary for 3GPP Specifications"
[8] 3GPP TR 25.990 "Vocabulary"
[9] 3GPP TS 51.010-1 " Mobile Station (MS) conformance specification; Part 1: Conformance specification "
[10] 3GPP TS 34.108 "Common Test Environments for User Equipment (UE) Conformance Testing".
[11] 3GPP TS 34.109 "Terminal logical test interface; Special conformance testing functions
[12] 3GPP TS 25.144 "User Equipment (UE) and Mobile Station (MS) over the air performance requirements"
[13] 3GPP TS 34.122 " Terminal conformance specification; Radio transmission and reception (TDD) "
3 Definitions, symbols, abbreviations and equations For the purposes of the present document, the terms and definitions given in 3GPP TR 21.905 [7], 3GPP TR 25.990 [8] and the following apply:
3.1 Symbols For the purposes of the present document, the following symbols apply:
θ Zenith angle in the spherical co-ordinate system φ Azimuth angle in the spherical co-ordinate system Ω Solid angle defined at the phase centre of the DUT Gψ(θ,φ,f) Antenna gain pattern in the ψ-polarization as function of the spherical co-ordinates and the
carrier frequency F Carrier frequency Ptr Transmitted power Qψ(θ,φ,f) Angular power distribution in the ψ-polarization as function of the spherical co-ordinates
and the carrier frequency dB decibel dBm dB referenced to one milliwatt m meter mm millimeter kbps kilobit per second ms millisecond MHz megahertz
3.2 Abbreviations For the purposes of the present document, the following abbreviations apply:
3G 3rd Generation 3GPP 3G Partnership Project 3-D Three Dimensional AAU Aalborg University APD Angular Power Distribution BS Base Station BT Bluetooth CN Core Network CPICH RSCP Common Pilot Channel Received Signal Code Power CRC Cyclic Redundancy Check DCH Dedicated Channel DL Downlink DPCH Dedicated Physical Channel

ETSI
ETSI TS 134 114 V8.2.0 (2009-10)93GPP TS 34.114 version 8.2.0 Release 8
DPDCH Dedicated Physical Data Channel DPCCH Physical Control Channel DTCH Dedicated Traffic Channel DUT Device Under Test ETSI European Telecommunications Standards Institute GPS Global Positioning System HUT Helsinki University of Technology MS Mobile Station NB Node B NSA Normalised Site Attenuation QoS Quality of Service QPSK Quadrature Phase Shift Keying (modulation) RAB Radio Access Bearer RB Radio Bearer RAN Radio Access Network RF Radio Frequency Rx Receiver SAM Specific Anthropomorphic Mannequin TFCI Transport Format Combination Indicator TRS Total Radiated Sensitivity (also: Total Integrated Sensitivity) Tx Transmitter TRP Total Radiated Power TRS Total Radiated Sensitivity (see also: TRS) XPD Cross-Polar Discrimination of the antenna XPR Cross-Polarization ratio of the channel UL Uplink UE User Equipment UMTS Universal Mobile Telecommunications System
4 General The present document describes test procedure for the radiated performances measurements of the 3G/2G user equipment/mobile stations (UE/MS) in active mode in both the up- and the downlink. The test procedure is based on 3GPP TR 25.914 [1].
4.1 Measurement frequencies The radiation patterns of handset antennas can be expected to be frequency dependent, both in the size and, to smaller extent, in the shape of the pattern. TRP and TRS shall be measured in 3 channels in a frequency band, i.e. low, mid and high channels.
4.1.1 FDD frequency bands
UTRA/FDD is designed to operate in the following paired bands:

ETSI
ETSI TS 134 114 V8.2.0 (2009-10)103GPP TS 34.114 version 8.2.0 Release 8
Table 4.1: UTRA FDD frequency bands
Operating Band
UL Frequencies UE transmit, Node B receive
DL frequencies UE receive, Node B transmit
I 1920 – 1980 MHz 2110 –2170 MHz
II 1850 –1910 MHz 1930 –1990 MHz
III 1710-1785 MHz 1805-1880 MHz
IV 1710-1755 MHz 2110-2155 MHz
V 824 – 849 MHz 869-894 MHz
VI 830-840 MHz 875-885 MHz
VII 2500-2570 MHz 2620-2690 MHz
VIII 880 – 915 MHz 925 – 960 MHz
IX 1749.9-1784.9 MHz 1844.9-1879.9 MHz
X 1710 – 1770 MHz 2110 – 2170 MHz
Table 4.2: UTRA FDD Channels
Operating Band
UL Channels DL Channels
Low Mid High Low Mid High
I 9612 9750 9888 10562 10700 10838
II 9262 9400 9538 9662 9800 9938
III 937 1113 1288 1162 1338 1513
IV 1312 1450 1513 1537 1675 1738
V 4132 4175 4233 4357 4400 4458
VI 4162 4175 4188 4387 4400 4413
VII 2012 2175 2338 2237 2400 2563
VIII 2712 2788 2863 2937 3013 3088 IX 8762 8837 8912 9237 9312 9387 X 2888 3025 3162 3113 3250 3387
NOTE: Deployment in other frequency bands is not precluded.
4.1.2 GSM frequency bands
Table 4.3: GSM frequency bands
Operating Band
UL Frequencies MS transmit, BTS receive
DL frequencies MS receive, BTS transmit
GSM 850 824 – 849 MHz 869-894 MHz
P-GSM 900 890 – 915 MHz 935 – 960 MHz
E-GSM 900 880 – 915 MHz 925 – 960 MHz
DCS 1800 1710-1785 MHz 1805-1880 MHz
PCS 1900 1850 –1910 MHz 1930 –1990 MHz

ETSI
ETSI TS 134 114 V8.2.0 (2009-10)113GPP TS 34.114 version 8.2.0 Release 8
Table 4.4: GSM Channels
Operating Band
Channels
Low Mid High
GSM 850 128 190 251 P-GSM 900 1 62 124 E-GSM 900 975 38 124 DCS 1800 512 699 885 PCS 1900 512 661 810
4.1.3 TDD frequency bands
UTRA/TDD is designed to operate in the following bands:
Table 4.5: UTRA TDD frequency bands
Operating Band Frequencies
a 1900-1920 MHz 2010-2025 MHz
b* 1850-1910 MHz 1930-1990 MHz
c* 1910-1930 MHz
d** 2570-2620 MHz
e 2300-2400 MHz
f 1880-1920 MHz
NOTE: Deployment in other frequency bands is not precluded. * Used in ITU Region 2 ** Used in ITU Region 1
Table 4.6: UTRA TDD Channels
Operating Band Channels
Low Mid High a
1900-1920 MHz 2010-2025 MHz
9504 10054
9550 10087
9596 10121
b 1850-1910 MHz 1930-1990 MHz
9254 9654
9400 9800
9546 9946
c 1910-1930 MHz 9554 9600 9646
d 2570-2620 MHz 12854 12975 13096
e 2300-2400 MHz 11504 11750 11996
f 1880-1920 MHz 9404 9500 9596

ETSI
ETSI TS 134 114 V8.2.0 (2009-10)123GPP TS 34.114 version 8.2.0 Release 8
5 Transmitter Performance
5.1 General This section specifies the test method and test requirements for the radiated power measurement.
5.1.1 DUT positioning
The measurements in this section are performed so that the DUT is placed against a SAM phantom. The characteristics of the SAM phantom are specified in Annex A.1. The DUT is attached to the SAM phantom in “cheek” position as defined in IEEE Std 1528. The DUT performance is measured on left and right side of the head.
5.1.2 Sampling grid
A 15°-sample grid in both azimuth and elevation can be considered sufficient for accurate measurements. Generally it can be said that since the radiating object has a limited size the gain pattern cannot change arbitrarily versus angle, and therefore only a limited number of samples are required to represent the gain pattern to a given accuracy.
Alternatively, different sampling patterns may be used, if they are able to ensure same or greater accuracy. The TRP can be calculated by interpolating the values to points on the regular grid. If an alternative sampling pattern is used number of measurement points should be greater than in the regular sampling grid.
5.2 Total Radiated Power (TRP) for FDD UE
5.2.1 Definition and applicability
The Total Radiated Power (TRP) is a measure of how much power the DUT actually radiates. The TRP is defined as the integral of the power transmitted in different directions over the entire radiation sphere:
( ) ΩΩ+Ω= ∫ dfEIRPfEIRPTRP );();(41
ϕθπ
Where Ω is the solid angle describing the direction, f is frequency. θ and ϕ are the orthogonal polarizations.
θEIRP and ϕEIRP are the actually transmitted power-levels in corresponding polarizations.
Thus
[ ] )sin();,();,(2
1
0
1
0n
N
n
M
mmnmn fEIRPfEIRP
NMTRP θϕθϕθπ
ϕθ∑∑−
=
−
=
+≈
In these formulas N and M are the number of sampling intervals for theta and phi. nθ and mϕ are the measurement
angles. The sampling intervals are discussed further in Section 5.1.2.
The requirements and this test apply to all types of UTRA for the FDD UE for Release 7 and later releases.
5.2.2 Minimum Requirements
The average TRP of low, mid and high channel in beside head position shall be higher than minimum performance requirements for roaming bands shown in Table 5.2.2.1. The averaging shall be done in linear scale for the TRP results of both right and left side of the phantom head.
⎥⎦
⎤⎢⎣
⎡ +++++=6
101010101010log10
10/10/10/10/10/10/ ______ highrightmidrightlowrighthighleftmidleftlowleft PPPPPP
averageTRP

ETSI
ETSI TS 134 114 V8.2.0 (2009-10)133GPP TS 34.114 version 8.2.0 Release 8
In addition the minimum TRP of each measured channel in beside head position shall be higher than minimum performance requirements shown in the columns “Min”.
[ ]highrightmidrightlowrighthighleftmidleftlowleft PPPPPPTRP ______min ,,,,,min=
Table 5.2.1 TRP minimum performance requirement for FDD roaming bands in the speech position and the primary mechanical mode
Operating band
Power Class 1
Power Class 2
Power Class 3 Power Class 3bis Power Class 4
Power (dBm)
Power (dBm)
Power (dBm) Power (dBm) Power (dBm)
Average Min Average Min Average Min
I - - +15 +13 +15 +13 +13 +11 II - - +15 +13 +15 +13 +13 +11 III - - +15 +13 +15 +13 +13 +11 IV - - +15 +13 +15 +13 +13 +11 V - - +11 +9 +11 +9 +9 +7 VI - - +11 +9 +11 +9 +9 +7 VII - - +15 +13 +15 +13 +13 +11 VIII - - +12 +10 +12 +10 +10 +8 IX - - +15 +13 +15 +13 +13 +11
NOTE: Applicable for dual-mode GSM/UMTS.
The normative reference for this clause is TS25.144 section 6.1.1.1.
5.2.3 Test purpose
The purpose of this test is to verify that averageTRP and minTRP of the UE is not below specified values. A lower
averageTRP and minTRP decrease the coverage area.
5.2.4 Method of test
5.2.4.1 Initial conditions
The output power is a measure of the maximum power the UE can transmit in a bandwidth of at least (1+ α) times the chip rate of the radio access mode, for more information see 3GPP TS 34.121 chapter 5.2. The period of measurement shall be at least one timeslot. Also care should be taken that the noise floor of the measurement receiver is not disturbing the power measurement.
Test environment: normal; see TS34.121-1 [3] clause G.2.1.
Frequencies to be tested: low range, mid range, high range; see TS34.121-1 [3] clause G.2.4.
1) Set the SS downlink physical channels according to settings in Table 5.2.2. Set the DPCH power such that there will not be transmission gaps due to too low signal strength thorughout the measurement.
2) Power on the UE.
3) A call is set up according to the Generic call setup procedure. The power control algorithm shall be set to Power Control Algorithm 2. Compressed mode shall be set to OFF.
4) Enter the UE into loopback test mode 2 and start the loopback test.
See TS 34.108 [10] and TS 34.109 [11] for details regarding generic call setup procedure and loopback test.

ETSI
ETSI TS 134 114 V8.2.0 (2009-10)143GPP TS 34.114 version 8.2.0 Release 8
Table 5.2.2: Downlink Physical Channels transmitted during a connection
Physical Channel Power CPICH CPICH_Ec / DPCH_Ec = 7 dB P-CCPCH P-CCPCH_Ec / DPCH_Ec = 5 dB SCH SCH_Ec / DPCH_Ec = 5 dB PICH PICH_Ec / DPCH_Ec = 2 dB DPCH Test dependent power
5.2.4.2 Procedure
1) Send continuously Up power control commands to the UE.
2) As the UE reaches maximum power, start sending PN15 data pattern.
3) Position the UE against the SAM phantom
4) Measure the θEIRP and ϕEIRP with a sample step of 15° in theta (θ) and phi (φ) directions using a test system
having characteristics as described in Annex A.
5) Calculate TRP using equations from chapter 5.2.1
NOTE 1: The measurement procedure is based on the measurement of the spherical radiation pattern of the DUT. The power radiated by the DUT is sampled in far field in a group of points located on a spherical surface enclosing the DUT. The EIRP samples are taken using a constant sample step of 15° both in theta (θ) and phi (φ) directions. In some cases a different sampling grid may be used to speed up the measurements (See Section 5.1.2). All the EIRP samples are taken with two orthogonal polarizations, θ - and ϕ -
polarisations.
NOTE 2: The noise floor of the measurement receiver shall not disturb the power measurement.
NOTE 3: Non Standard settings: To speed up sensitivity measurements, power measurements may be done with non standard modulation. However to obtain TRP result the measured EIRP figures shall be normalized by
( )∑=
−=Δn
iii EIRPnstdEIRPstd
nEIRP
1
1
where iEIRPstd is power measurement done with standard setting. iEIRPnstd is power measurement done with
non standard modulation. n is amount of reference measurement points.
To ensure accuracy of TRP, the amount of reference points measured should be at least 4. It is recommended to spread the reference measurements equally during the measurement time.
5.2.5 Test requirements
The average TRP of low, mid and high channel in beside head position shall be higher than test performance requirements for roaming bands shown in Table 5.2.3. The averaging shall be done in linear scale for the TRP results of both right and left side of the phantom head.
⎥⎦
⎤⎢⎣
⎡ +++++=6
101010101010log10
10/10/10/10/10/10/ ______ highrightmidrightlowrighthighleftmidleftlowleft PPPPPP
averageTRP
In addition the minimum TRP of each measured channel in beside head position shall be higher than minimum performance requirements shown in the columns “Min”.
[ ]highrightmidrightlowrighthighleftmidleftlowleft PPPPPPTRP ______min ,,,,,min=

ETSI
ETSI TS 134 114 V8.2.0 (2009-10)153GPP TS 34.114 version 8.2.0 Release 8
Table 5.2.3 TRP test requirement for FDD roaming bands in the speech position and the primary mechanical mode
Operating band
Power Class 1
Power Class 2
Power Class 3 Power Class 3bis Power Class 4
Power (dBm)
Power (dBm)
Power (dBm) Power (dBm) Power (dBm)
Average Min Average Min Average Min
I - - +14.3 +12.0 +14.3 +12.0 +12.3 +10.0 II - - +14.3 +12.0 +14.3 +12.0 +12.3 +10.0 III - - +14.3 +12.0 +14.3 +12.0 +12.3 +10.0 IV - - +14.3 +12.0 +14.3 +12.0 +12.3 +10.0 V - - +10.3 +8.0 +10.3 +8.0 +8.3 +6 VI - - +10.3 +8.0 +10.3 +8.0 +8.3 +6 VII - - +14.3 +12.0 +14.3 +12.0 +12.3 +10.0 VIII - - +11.3 +9.0 +11.3 +9.0 +9.3 +7 IX - - +14.3 +12.0 +14.3 +12.0 +12.3 +10.0
NOTE: Applicable for dual-mode GSM/UMTS.
NOTE: If the above Test Requirement differs from the Minimum Requirement then the Test Tolerance applied for this test is non-zero. The Test Tolerance for this test is defined and the explanation of how the Minimum Requirement has been relaxed by the Test Tolerance is given in Annex D.
5.3 Total Radiated Power (TRP) for GSM MS
5.3.1 Definition and applicability
The Total Radiated Power (TRP) is a measure of how much power the DUT actually radiates. The TRP is defined as the integral of the power transmitted in different directions over the entire radiation sphere:
( ) ΩΩ+Ω= ∫ dfEIRPfEIRPTRP );();(41
ϕθπ
Where Ω is the solid angle describing the direction, f is frequency. θ and ϕ are the orthogonal polarizations.
θEIRP and ϕEIRP are the actually transmitted power-levels in corresponding polarizations.
Thus
[ ] )sin();,();,(2
1
0
1
0n
N
n
M
mmnmn fEIRPfEIRP
NMTRP θϕθϕθπ
ϕθ∑∑−
=
−
=
+≈
In these formulas N and M are the number of sampling intervals for theta and phi. nθ and mϕ are the measurement
angles. The sampling intervals are discussed further in Section 5.1.2.
The requirements and this test apply to all types of MS that support GSM for Release 7 and later releases.
5.3.2 Minimum Requirements
The minimum requirements are TBD.
Table 5.3.1 TRP minimum requirement for GSM roaming bands in the speech position and the primary mechanical mode
TBD

ETSI
ETSI TS 134 114 V8.2.0 (2009-10)163GPP TS 34.114 version 8.2.0 Release 8
The normative reference for this clause is TS25.144 section 6.1.1.2.
5.3.3 Test purpose
The purpose of this test is to verify that averageTRP and minTRP of the UE is not below specified values. A lower
averageTRP and minTRP decrease the coverage area.
5.3.4 Method of test
5.3.4.1 Initial conditions
A call is set up by the SS according to the generic call set up procedure on a channel with ARFCN in the Mid ARFCN range, power control level set to Max power. MS TXPWR_MAX_CCH is set to the maximum value supported by the Power Class of the Mobile under test.
The SS sends Standard Test Signal C1; see TS51.010-1 [9] Annex A5.2.
The downlink power is set such that there will not be transmission gaps due to too low signal strength throughout the measurement
Test environment: normal condition; see TS51.010-1 [9] Annex A1.2.2.
5.3.4.2 Procedure
1) Position the MS against the SAM phantom
2) Measure the θEIRP and ϕEIRP with a sample step of 15° in theta (θ) and phi (φ) directions using a test system
having characteristics as described in Annex A.
3) Calculate TRP using equations from chapter 5.3.1
4) Test steps 1 to 3 is repeated for ARFCN in the low and high range
NOTE 1: Measurement of normal burst transmitter output power. The SS takes power measurement samples evenly distributed over the duration of one burst with a sampling rate of at least 2/T, where T is the bit duration. The samples are identified in time with respect to the modulation on the burst. The SS identifies the centre of the useful 147 transmitted bits, i.e. the transition from bit 13 to bit 14 of the midamble, as the timing reference
NOTE 2: The measurement procedure is based on the measurement of the spherical radiation pattern of the DUT. The power radiated by the DUT is sampled in far field in a group of points located on a closed surface enclosing the DUT. The EIRP samples are taken using a constant sample step of 15° both in theta (θ) and phi (φ) directions. In some cases a different sampling grid can be used to speed up the measurements (See Section 5.1.2). All the EIRP samples are taken with two orthogonal polarizations, θ - and ϕ -
polarisations.
NOTE 3: The noise floor of the measurement receiver shall not disturb the power measurement.
NOTE 4: Non Standard settings: To speed up sensitivity measurements, power measurements can be done with non standard modulation. However to obtain TRP result the measured EIRP figures shall be normalized by
( )∑=
−=Δn
iii EIRPnstdEIRPstd
nEIRP
1
1
where iEIRPstd is power measurement done with standard setting. iEIRPnstd is power measurement done with
non standard modulation. n is amount of reference measurement points.

ETSI
ETSI TS 134 114 V8.2.0 (2009-10)173GPP TS 34.114 version 8.2.0 Release 8
To ensure accuracy of TRP, the amount of reference points measured should be at least 4. It is recommended to spread the reference measurements equally during the measurement time.
5.3.5 Test requirements
TBD
The average TRP of low, mid and high channel in beside head position shall be higher than test performance requirements for roaming bands shown in Table 5.2.3. The averaging shall be done in linear scale for the TRP results of both right and left side of the phantom head.
⎥⎦
⎤⎢⎣
⎡ +++++=6
101010101010log10
10/10/10/10/10/10/ ______ highrightmidrightlowrighthighleftmidleftlowleft PPPPPP
averageTRP
In addition the minimum TRP of each measured channel in beside head position shall be higher than minimum performance requirements shown in the columns “Min”.
[ ]highrightmidrightlowrighthighleftmidleftlowleft PPPPPPTRP ______min ,,,,,min=
Table 5.2.3: TRP test requirement for GSM roaming bands in the speech position and the primary mechanical mode
TBD
NOTE: If the above Test Requirement differs from the Minimum Requirement then the Test Tolerance applied for this test is non-zero. The Test Tolerance for this test is defined and the explanation of how the Minimum Requirement has been relaxed by the Test Tolerance is given in Annex D.
5.4 Total Radiated Power (TRP) for TDD UE
5.4.1 Definition and applicability
The Total Radiated Power (TRP) is a measure of how much power the DUT actually radiates. The TRP is defined as the integral of the power transmitted in different directions over the entire radiation sphere:
( ) ΩΩ+Ω= ∫ dfEIRPfEIRPTRP );();(41
ϕθπ
Where Ω is the solid angle describing the direction, f is frequency. θ andϕ are the orthogonal polarizations.
θEIRP and ϕEIRP are the actually transmitted power-levels in corresponding polarizations.
Thus
[ ] )sin();,();,(2
1
0
1
0n
N
n
M
mmnmn fEIRPfEIRP
NMTRP θϕθϕθπ
ϕθ∑∑−
=
−
=
+≈
In these formulas N and M are the number of sampling intervals for theta and phi. nθ and mϕ are the measurement
angles. The sampling intervals are discussed further in Section 5.1.2.
The requirements and this test apply to all types of UTRA for the TDD UE for Release 8 and later releases.
5.4.2 Minimum Requirements
The average TRP of low, mid and high channel in beside head position shall be higher than minimum performance requirements for roaming bands shown in Table 5.4.1. The averaging shall be done in linear scale for the TRP results of both right and left side of the phantom head.
ETSI
ETSI TS 134 114 V8.2.0 (2009-10)183GPP TS 34.114 version 8.2.0 Release 8
⎥⎦
⎤⎢⎣
⎡ +++++=6
101010101010log10
10/10/10/10/10/10/ ______ highrightmidrightlowrighthighleftmidleftlowleft PPPPPP
averageTRP
In addition the minimum TRP of each measured channel in beside head position shall be higher than minimum performance requirements shown in the columns “Min”.
[ ]highrightmidrightlowrighthighleftmidleftlowleft PPPPPPTRP ______min ,,,,,min=
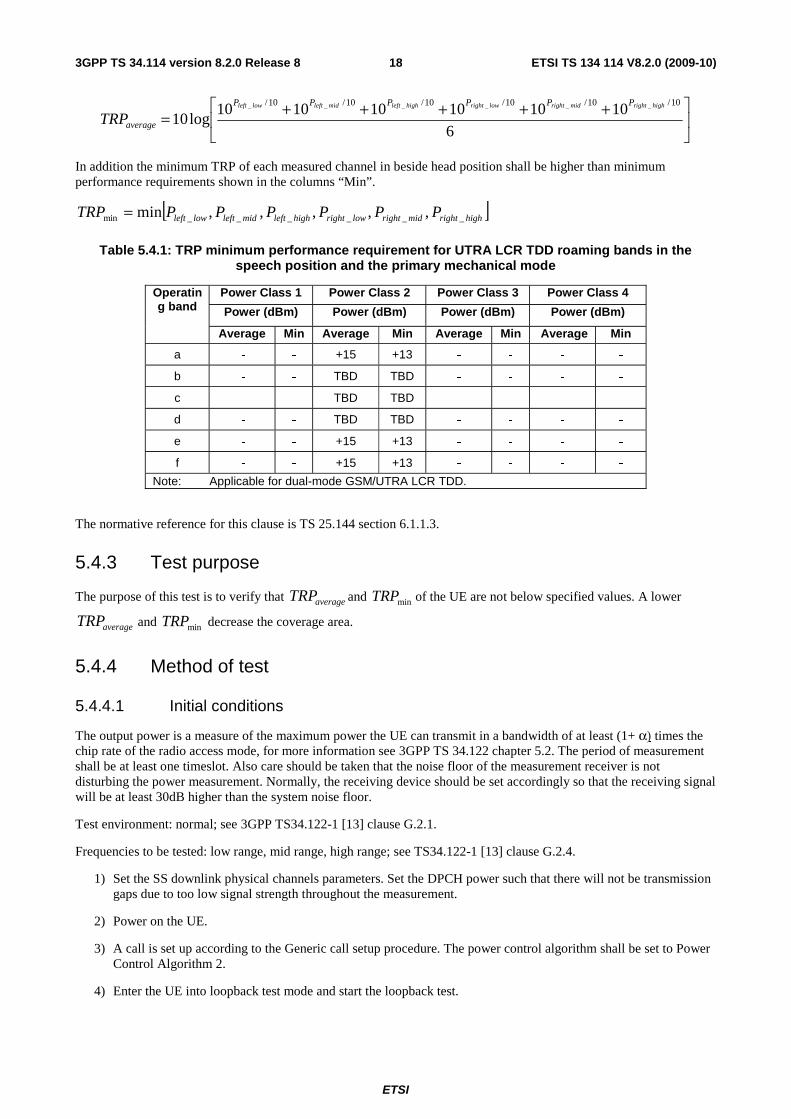
Table 5.4.1: TRP minimum performance requirement for UTRA LCR TDD roaming bands in the speech position and the primary mechanical mode
Operating band
Power Class 1 Power Class 2 Power Class 3 Power Class 4
Power (dBm) Power (dBm) Power (dBm) Power (dBm)
Average Min Average Min Average Min Average Min
a - - +15 +13 - - - -
b - - TBD TBD - - - -
c - - TBD TBD - - - -
d - - TBD TBD - - - -
e - - +15 +13 - - - -
f - - +15 +13 - - - -
Note: Applicable for dual-mode GSM/UTRA LCR TDD.
The normative reference for this clause is TS 25.144 section 6.1.1.3.
5.4.3 Test purpose
The purpose of this test is to verify that averageTRP and minTRP of the UE are not below specified values. A lower
averageTRP and minTRP decrease the coverage area.
5.4.4 Method of test
5.4.4.1 Initial conditions
The output power is a measure of the maximum power the UE can transmit in a bandwidth of at least (1+ α) times the chip rate of the radio access mode, for more information see 3GPP TS 34.122 chapter 5.2. The period of measurement shall be at least one timeslot. Also care should be taken that the noise floor of the measurement receiver is not disturbing the power measurement. Normally, the receiving device should be set accordingly so that the receiving signal will be at least 30dB higher than the system noise floor.
Test environment: normal; see 3GPP TS34.122-1 [13] clause G.2.1.
Frequencies to be tested: low range, mid range, high range; see TS34.122-1 [13] clause G.2.4.
1) Set the SS downlink physical channels parameters. Set the DPCH power such that there will not be transmission gaps due to too low signal strength throughout the measurement.
2) Power on the UE.
3) A call is set up according to the Generic call setup procedure. The power control algorithm shall be set to Power Control Algorithm 2.
4) Enter the UE into loopback test mode and start the loopback test.

ETSI
ETSI TS 134 114 V8.2.0 (2009-10)193GPP TS 34.114 version 8.2.0 Release 8
5) The measurement receiver shall be set to: zero span, video trigger and RMS detector. The RBW shall be at least (1+ α) times the chip rate of the radio access mode and the VBW at least 3 times bigger than the RBW. For 1.28Mcps TDD UE, the RBW shall be set to 3MHz, and VBW shall be set to 10MHz.
See TS 34.108 [10] and TS 34.109 [11] for details regarding generic call setup procedure and loopback test.
5.4.4.2 Procedure
1) Send continuously Up power control commands to the UE.
2) As the UE reaches maximum power, start sending PN15 data pattern.
3) Position the UE against the SAM phantom.
4) Measure the EIRPθ and EIRPφwith a sample step of 15° in theta (θ) and phi (φ) directions using a test system
having characteristics as described in Annex A.
5) Calculate TRP using equations from chapter 5.3.1.
NOTE 1: The measurement procedure is based on the measurement of the spherical radiation pattern of the DUT. The power radiated by the DUT is sampled in far field in a group of points located on a spherical surface
enclosing the DUT. The EIRP samples are taken using a constant sample step of 15° both in theta (θ) and
phi (φ) directions. In some cases a different sampling grid may be used to speed up the measurements
(See Section 5.1.2). All the EIRP samples are taken with two orthogonal polarizations, θ- and φ - polarizations.
NOTE 2: The noise floor of the measurement receiver shall not disturb the power measurement.
NOTE 3: Non Standard settings: To speed up sensitivity measurements, power measurements may be done with non standard modulation. However to obtain TRP result the measured EIRP figures shall be normalized by
( )∑=
−=Δn
iii EIRPnstdEIRPstd
nEIRP
1
1
where i EIRPstd i is power measurement done with standard setting. EIRPnstd i is power measurement done with non standard modulation. n is amount of reference measurement points.
To ensure accuracy of TRP, the amount of reference points measured should be at least 4. It is recommended to spread the reference measurements equally during the measurement time.
5.4.5 Test requirements
The average TRP of low, mid and high channel in beside head position shall be higher than test performance requirements for roaming bands shown in Table 5.4.2. The averaging shall be done in linear scale for the TRP results of both right and left side of the phantom head.
⎥⎦
⎤⎢⎣
⎡ +++++=6
101010101010log10
10/10/10/10/10/10/ ______ highrightmidrightlowrighthighleftmidleftlowleft PPPPPP
averageTRP
In addition the minimum TRP of each measured channel in beside head position shall be higher than minimum performance requirements shown in the columns “Min”.
[ ]highrightmidrightlowrighthighleftmidleftlowleft PPPPPPTRP ______min ,,,,,min=

ETSI
ETSI TS 134 114 V8.2.0 (2009-10)203GPP TS 34.114 version 8.2.0 Release 8
Table 5.4.2: TRP test performance requirement for UTRA LCR TDD roaming bands in the speech position and the primary mechanical mode
Operating band
Power Class 1 Power Class 2 Power Class 3 Power Class 4
Power (dBm) Power (dBm) Power (dBm) Power (dBm)
Average Min Average Min Average Min Average Min
a - - +14.3 +12 - - - -
b - - TBD TBD - - - -
c - - TBD TBD - - - -
d - - TBD TBD - - - -
e - - +14.3 +12 - - - -
f - - +14.3 +12 - - - -
Note: Applicable for dual-mode GSM/UTRA LCR TDD.
NOTE: If the above Test Requirement differs from the Minimum Requirement then the Test Tolerance applied for this test is non-zero. The Test Tolerance for this test is defined and the explanation of how the Minimum Requirement has been relaxed by the Test Tolerance is given in Annex D.
6 Receiver Performance
6.1 General This section describes the specifics of the radiated sensitivity measurement procedure.
The procedure for the measurement of the UE receiver performance is in principle equivalent to the transmitter performance measurement described in Annex A. The basic difference is that now the absolute sensitivity value at a predefined BER level is the parameter of interest in each measurement point. Note that the receiver and transmitter performances measurements may be done in parallel, at each position.
6.1.1 DUT Positioning
The measurements are performed so that the DUT is placed against a SAM phantom. The characteristics of the SAM phantom are specified in Annex A.1. The DUT is attached to the SAM phantom in “cheek” position as defined in IEEE Std 1528. The DUT performance is measured on both left and right side of the head.
6.1.2 Sampling grid
A 15°-sample grid in both azimuth and elevation can be considered sufficient for accurate measurements. Generally it can be said that since the radiating object has a limited size the gain pattern cannot change arbitrarily versus angle, and therefore only a limited number of samples are required to represent the gain pattern to a given accuracy consequently. A 30°-sample grid may be used taking also into account that there is a trade-off between the accuracy of the approximated TRS values and the total measurement time required to obtain a complete 3-D radiation pattern of the antenna.
Alternatively, different sampling patterns may be used, if they are able to ensure same or greater level of accuracy. The TRS can be calculated by interpolating the values to points on the regular grid. If an alternative sampling pattern is used number of measurement points should be greater than in the regular sampling grid.

ETSI
ETSI TS 134 114 V8.2.0 (2009-10)213GPP TS 34.114 version 8.2.0 Release 8
6.2 Total Radiated Sensitivity (TRS) for FDD UE
6.2.1 Definition and applicability
The Total Radiated Sensitivity is defined as:
Ω⎥⎥⎦
⎤
⎢⎢⎣
⎡
Ω+
Ω
=
∫ dfEISfEIS
TRS
);(
1
);(
1
4
ϕθ
π (6.3)
Where the effective isotropic sensitivity (EIS) is defined as the power available at the antenna output such as the sensitivity threshold is achieved for each polarization. Ω is the solid angle describing the direction, f is frequency. θ
and ϕ are the orthogonal polarizations.
( )∑∑−
=
−
= ⎥⎥⎦
⎤
⎢⎢⎣
⎡+
≈1
0
1
0
sin);,(
1);,(
1
2N
n
M
mn
mnmn fEISfEIS
NMTRS
θϕθϕθ
πϕθ
(6.4)
In these formulas N and M are the number of sampling intervals for theta and phi. nθ and mϕ are the measurement
angles. The sampling intervals are discussed further in Section 6.1.2.
The requirements and this test apply to all types of UTRA for the FDD UE for Release 7 and later releases.
6.2.2 Minimum requirements
The average TRS of low, mid and high channel in beside head position for 1% BER with 12.2kbps DL reference channel as defined in Annex C.3 of TS25.101 [2] shall be lower than minimum performance requirements for roaming bands shown in Table 6.2.2.1. The averaging shall be done in linear scale for the TRS results of both right and left side of the phantom head.
⎥⎦
⎤⎢⎣
⎡⎟⎠
⎞⎜⎝
⎛ +++++= 10/10/10/10/10/10/ ______ 10
1
10
1
10
1
10
1
10
1
10
16log10
highrightmidrightlowrighthighleftmidleftlowleft PPPPPPaverageTRS
In addition the minimum TRS of each measured channel in beside head position shall be better than minimum performance requirements for roaming bands shown in the columns “Min”.
( )[ ]10/10/10/10/10/10/min
______ 10,10,10,10,10,10maxlog10 highrightmidrightlowrighthighleftmidleftlowleft PPPPPPTRS =
Table 6.2.1: TRS minimum requirements for FDD roaming bands in the speech position for the primary mechanical mode
Operating Band Unit <REFÎor>
Average Max

ETSI
ETSI TS 134 114 V8.2.0 (2009-10)223GPP TS 34.114 version 8.2.0 Release 8
I dBm/3.84 MHz -101 -98 II dBm/3.84 MHz -99 -96 III dBm/3.84 MHz -98 -95 IV dBm/3.84 MHz -101 -98 V dBm/3.84 MHz -96 -93 VI dBm/3.84 MHz -96 -93 VII dBm/3.84 MHz -99 -96 VIII dBm/3.84 MHz -96 -93 IX dBm/3.84 MHz -100 -97
NOTE 1 For Power Class 3, 3bis and 4 this shall be achieved at the maximum output power. NOTE 2 For the UE which supports both Band III and Band IX operating frequencies, the
reference level of TDB dBm TRS <REFÎor> [average and min] shall apply for Band IX.
NOTE 3: Applicable for dual-mode GSM/UMTS.
The normative reference for this clause is TS25.144 section 7.2.1.
6.2.3 Test Purpose
The purpose of this test is to ensure that AverageTRS and MinTRS of the UE is above specified limit. The lack of the
reception sensitivity decreases the coverage area at the far side from Node B.
6.2.4 Method of test
6.2.4.1 Initial conditions
Test environment: normal; see TS34.121-1 [3] clause G.2.1.
1) Set the SS downlink physical channels according to settings in Table 6.2.2.
2) Power on the UE.
3) A call is set up according to the Generic call setup procedure. The power control algorithm shall be set to Power Control Algorithm 2. Compressed mode shall be set to OFF.
4) Enter the UE into loopback test mode 2 and start the loopback test.
See TS 34.108 [10] and TS 34.109 [11] for details regarding generic call setup procedure and loopback test.
Table 6.2.2: Downlink Physical Channels transmitted during a connection
Physical Channel Power CPICH CPICH_Ec / DPCH_Ec = 7 dB P-CCPCH P-CCPCH_Ec/ DPCH_Ec = 5 dB SCH SCH_Ec / DPCH_Ec = 5 dB PICH PICH_Ec / DPCH_Ec = 2 dB DPCH Test dependent power
6.2.4.2 Test procedure
1) Send continuously Up power control commands to the UE.
2) As the UE reaches maximum power, start sending PN15 data pattern.
3) Position the UE against the SAM phantom
4) Measure EIS from one measurement point. EIS is the power transmitted from one specific direction to the UE causing BER value of 1% ± 0.2% using 20000 or more bits, see Annex E.19.1.
NOTE: To meet BER value target DL power level can be changed using user’s freely selectable algorithm.

ETSI
ETSI TS 134 114 V8.2.0 (2009-10)233GPP TS 34.114 version 8.2.0 Release 8
5) Measure the EIS for every direction of selected sampling gird using two orthogonal polarizations to obtain TRS.
6) Calculate TRS using equations from chapter 6.2.1
NOTE:
To speed up sensitivity measurements non standard setting (i.e. data speed, PCL, BER target) can be used in the measurements. However to obtain TRS result the measured EIS figures shall be normalized by
( )∑=
−=Δn
iii EISnstdEISstd
nEIS
1
1
Where iEISstd is sensitivity measurement done with standard setting. iEISnstd is sensitivity measurement done
with non standard settings. n is amount of reference measurement points.
To ensure accuracy of TRS, the amount of reference points measured should be at least 4. It is recommended to spread the reference measurements equally during the measurement time.
The measurement procedure is based on the measurement of the spherical sensitivity pattern of the DUT. The sensitivity values of the DUT at a predefined BER level are sampled in far field in a group of points located on a spherical surface enclosing the DUT. The EIS samples are taken using a constant sample step of 30° both in theta (θ) and phi (φ) directions. All the EIS samples are taken with two orthogonal polarizations, θ - and ϕ -polarisations. The
Total Radiated Sensitivity is calculated from the measured data by equation in chapter 6.2.1.
6.2.5 Test requirements
The average TRS of low, mid and high channel in beside head position for 1% BER with 12.2kbps DL reference channel as defined in Annex C.3 of [2] shall be lower than test requirements for roaming bands shown in Table 6.2.3. The averaging shall be done in linear scale for the TRS results of both right and left side of the phantom head.
⎥⎦
⎤⎢⎣
⎡⎟⎠
⎞⎜⎝
⎛ +++++= 10/10/10/10/10/10/ ______ 10
1
10
1
10
1
10
1
10
1
10
16log10
highrightmidrightlowrighthighleftmidleftlowleft PPPPPPaverageTRS
In addition the minimum TRS of each measured channel in beside head position shall be better than minimum performance requirements for roaming bands shown in the columns “Min”.
( )[ ]10/10/10/10/10/10/min
______ 10,10,10,10,10,10maxlog10 highrightmidrightlowrighthighleftmidleftlowleft PPPPPPTRS =
Table 6.2.3: TRS test requirements for FDD roaming bands in the speech position for the primary mechanical mode
Operating Band Unit <REFÎor>
Average Max
I dBm/3.84 MHz -100.1 -96.8 II dBm/3.84 MHz -98.1 -94.8 III dBm/3.84 MHz -97.1 -93.8 IV dBm/3.84 MHz -100.1 -96.8 V dBm/3.84 MHz -95.1 -91.8 VI dBm/3.84 MHz -95.1 -91.8 VII dBm/3.84 MHz -98.1 -94.8 VIII dBm/3.84 MHz -95.1 -91.8 IX dBm/3.84 MHz -99.1 -95.8
NOTE 1 For Power Class 3, 3bis and 4 this shall be achieved at the maximum output power. NOTE 2 For the UE which supports both Band III and Band IX operating frequencies, the
reference level of TDB dBm TRS <REFÎor> [average and min] shall apply for Band IX.
NOTE3: Applicable for dual-mode GSM/UMTS.

ETSI
ETSI TS 134 114 V8.2.0 (2009-10)243GPP TS 34.114 version 8.2.0 Release 8
NOTE: If the above Test Requirement differs from the Minimum Requirement then the Test Tolerance applied for this test is non-zero. The Test Tolerance for this test is defined and the explanation of how the Minimum Requirement has been relaxed by the Test Tolerance is given in Annex D.
6.3 Total Radiated Sensitivity (TRS) for GSM MS
6.3.1 Definition and applicability
The Total Radiated Sensitivity is defined as:
Ω⎥⎥⎦
⎤
⎢⎢⎣
⎡
Ω+
Ω
=
∫ dfEISfEIS
TRS
);(
1
);(
1
4
ϕθ
π
Where the effective isotropic sensitivity (EIS) is defined as the power available at the antenna output such as the sensitivity threshold is achieved for each polarization. Ω is the solid angle describing the direction, f is frequency. θ
and ϕ are the orthogonal polarizations.
( )∑∑−
=
−
= ⎥⎥⎦
⎤
⎢⎢⎣
⎡+
≈1
0
1
0
sin);,(
1);,(
1
2N
n
M
mn
mnmn fEISfEIS
NMTRS
θϕθϕθ
πϕθ
In these formulas N and M are the number of sampling intervals for theta and phi. nθ and mϕ are the measurement
angles. The sampling intervals are discussed further in Section 6.1.3.
The requirements and this test apply to all types of MS that support GSM for Release 7 and later releases.
6.3.2 Minimum requirements
TBD
Table 6.3.1: TRS minimum requirements for GSM roaming bands in the speech position for the primary mechanical mode
The normative reference for this clause is TS25.144 section 7.2.2.
6.3.3 Test Purpose
The purpose of this test is to ensure that AverageTRS and MinTRS of the UE is above specified limit. The lack of the
reception sensitivity decreases the coverage area at the far side from Node B.
6.3.4 Method of test
6.3.4.1 Initial conditions
Test environment: normal condition; see TS51.010-1 [9] Annex A1.2.2.
A call is set up according to the generic call set up procedure on a TCH/FS with an ARFCN in the Mid ARFCN range, power control level set to maximum power.
The SS transmits Standard Test Signal C1 on the traffic channel, see TS51.010-1 [9] Annex A5.2.
The SS commands the MS to create traffic channel loop back signalling erased frames, see TS44.014 [34] clause 5.1.2.
ETSI
ETSI TS 134 114 V8.2.0 (2009-10)253GPP TS 34.114 version 8.2.0 Release 8
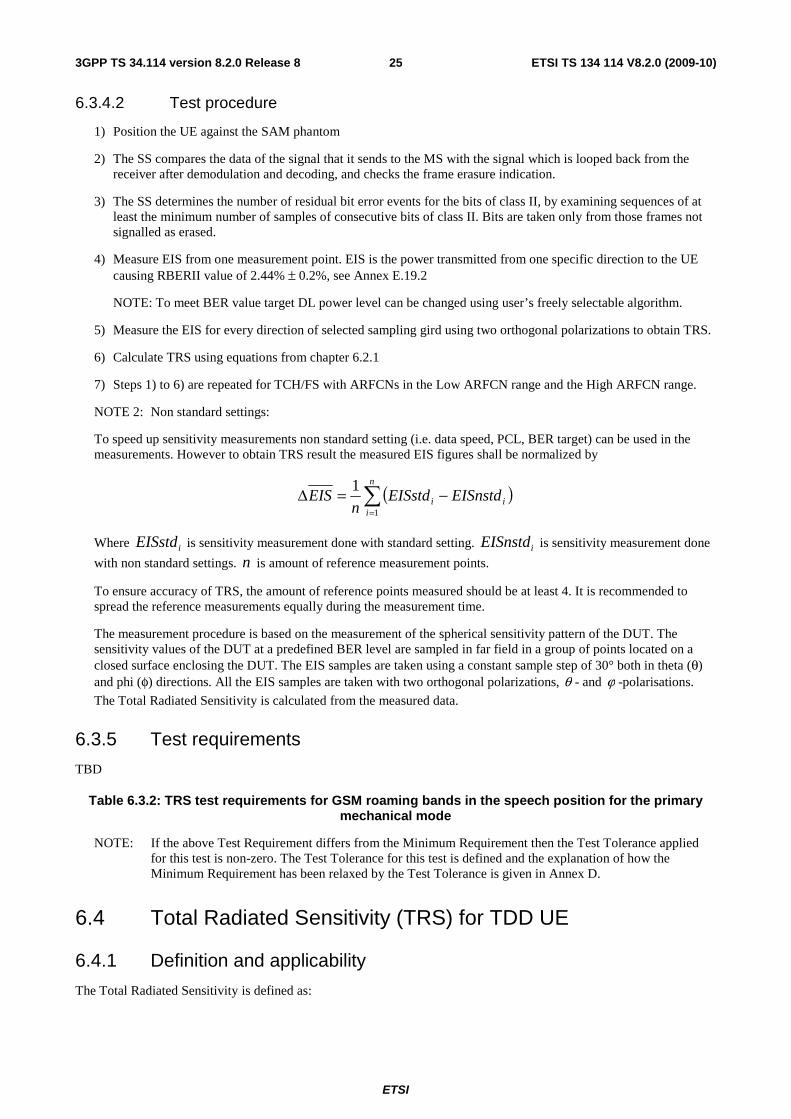
6.3.4.2 Test procedure
1) Position the UE against the SAM phantom
2) The SS compares the data of the signal that it sends to the MS with the signal which is looped back from the receiver after demodulation and decoding, and checks the frame erasure indication.
3) The SS determines the number of residual bit error events for the bits of class II, by examining sequences of at least the minimum number of samples of consecutive bits of class II. Bits are taken only from those frames not signalled as erased.
4) Measure EIS from one measurement point. EIS is the power transmitted from one specific direction to the UE causing RBERII value of 2.44% ± 0.2%, see Annex E.19.2
NOTE: To meet BER value target DL power level can be changed using user’s freely selectable algorithm.
5) Measure the EIS for every direction of selected sampling gird using two orthogonal polarizations to obtain TRS.
6) Calculate TRS using equations from chapter 6.2.1
7) Steps 1) to 6) are repeated for TCH/FS with ARFCNs in the Low ARFCN range and the High ARFCN range.
NOTE 2: Non standard settings:
To speed up sensitivity measurements non standard setting (i.e. data speed, PCL, BER target) can be used in the measurements. However to obtain TRS result the measured EIS figures shall be normalized by
( )∑=
−=Δn
iii EISnstdEISstd
nEIS
1
1
Where iEISstd is sensitivity measurement done with standard setting. iEISnstd is sensitivity measurement done
with non standard settings. n is amount of reference measurement points.
To ensure accuracy of TRS, the amount of reference points measured should be at least 4. It is recommended to spread the reference measurements equally during the measurement time.
The measurement procedure is based on the measurement of the spherical sensitivity pattern of the DUT. The sensitivity values of the DUT at a predefined BER level are sampled in far field in a group of points located on a closed surface enclosing the DUT. The EIS samples are taken using a constant sample step of 30° both in theta (θ) and phi (φ) directions. All the EIS samples are taken with two orthogonal polarizations, θ - and ϕ -polarisations.
The Total Radiated Sensitivity is calculated from the measured data.
6.3.5 Test requirements
TBD
Table 6.3.2: TRS test requirements for GSM roaming bands in the speech position for the primary mechanical mode
NOTE: If the above Test Requirement differs from the Minimum Requirement then the Test Tolerance applied for this test is non-zero. The Test Tolerance for this test is defined and the explanation of how the Minimum Requirement has been relaxed by the Test Tolerance is given in Annex D.
6.4 Total Radiated Sensitivity (TRS) for TDD UE
6.4.1 Definition and applicability
The Total Radiated Sensitivity is defined as:

ETSI
ETSI TS 134 114 V8.2.0 (2009-10)263GPP TS 34.114 version 8.2.0 Release 8
Ω⎥⎥⎦
⎤
⎢⎢⎣
⎡
Ω+
Ω
=
∫ dfEISfEIS
TRS
);(
1
);(
1
4
ϕθ
π
Where the effective isotropic sensitivity (EIS) is defined as the power available at the antenna output such as the sensitivity threshold is achieved for each polarization. Ω is the solid angle describing the direction, f is frequency. θ
and ϕ are the orthogonal polarizations.
( )∑∑−
=
−
= ⎥⎥⎦
⎤
⎢⎢⎣
⎡+
≈1
0
1
0
sin);,(
1);,(
1
2N
n
M
mn
mnmn fEISfEIS
NMTRS
θϕθϕθ
πϕθ
In these formulas N and M are the number of sampling intervals for theta and phi. nθ and mϕ are the measurement
angles. The sampling intervals are discussed further in Section 6.1.2.
The requirements and this test apply to all types of UTRA for the TDD UE for Release 8 and later releases.
6.4.2 Minimum requirements
The average TRS of low, mid and high channel in beside head position for 1% ± 0.2% BER with 12.2kbps DL reference channel as defined in Annex C.3 of TS25.101 [2] shall be lower than minimum performance requirements for roaming bands shown in Table 6.4.1. The averaging shall be done in linear scale for the TRS results of both right and left side of the phantom head.
⎥⎦
⎤⎢⎣
⎡⎟⎠
⎞⎜⎝
⎛ +++++= 10/10/10/10/10/10/ ______ 10
1
10
1
10
1
10
1
10
1
10
16log10
highrightmidrightlowrighthighleftmidleftlowleft PPPPPPaverageTRS
In addition the minimum TRS of each measured channel in beside head position shall be better than minimum performance requirements for roaming bands shown in the columns “Min”.
( )[ ]10/10/10/10/10/10/min
______ 10,10,10,10,10,10maxlog10 highrightmidrightlowrighthighleftmidleftlowleft PPPPPPTRS =
Table 6.4.1: TRS minimum requirement for UTRA LCR TDD roaming bands in the speech position for the primary mechanical mode
Operating Band Unit <REFÎor>
- - Average Max a dBm/1.28 MHz -101 -100 b dBm/1.28 MHz TBD TBD c dBm/1.28 MHz TBD TBD d dBm/1.28 MHz TBD TBD e dBm/1.28 MHz -101 -100 f dBm/1.28 MHz -101 -100
Note: Applicable for dual-mode GSM/UTRA LCR TDD.
The normative reference for this clause is TS 25.144 section 7.2.3.
6.4.3 Test Purpose
The purpose of this test is to ensure that TRS Average and TRS Min of the UE are above specified limit. The lack of the reception sensitivity decreases the coverage area at the far side from Node B.

ETSI
ETSI TS 134 114 V8.2.0 (2009-10)273GPP TS 34.114 version 8.2.0 Release 8
6.4.4 Method of test
6.4.4.1 Initial conditions
Test environment: normal; see TS34.122 [13] clause G.2.1.
1) Set the SS downlink physical channels according to the general procedure. The DL power level should be set to ensure 0% BER at 12.2kbps data rate at the whole 3D initial scan.
2) Power on the UE.
3) A call is set up according to the Generic call setup procedure. The power control algorithm shall be set to Power Control Algorithm 2.
4) Enter the UE into loopback test mode and start the loopback test.
See TS 34.108 [10] and TS 34.109 [11] and Annex C of TS 34.122[13]. For details regarding generic call setup procedure and loopback test.
6.4.4.2 Test procedure
1) Send continuously Up power control commands to the UE.
2) As the UE reaches maximum power, start sending PN15 data pattern.
3) Position the UE against the SAM phantom.
4) Measure EIS from one measurement point. EIS is the power transmitted from one specific direction to the UE causing BER value of 1% ± 0.2% using 40000 or more bits, see Annex E.19.3. The DL power step size shall be no bigger than 0.5dB when the RF level is near the TDD UE sensitivity level.
NOTE: To meet BER value target DL power level can be changed using user’s freely selectable algorithm.
5) Measure the EIS for every direction of selected sampling gird using two orthogonal polarizations to obtain TRS.
6) Calculate TRS using equations from chapter 6.4.1
NOTE: To speed up sensitivity measurements non standard setting (i.e. data speed, PCL, BER target) can be used in the measurements. However to obtain TRS result the measured EIS figures shall be normalized by
( )∑=
−=Δn
iii EISnstdEISstd
nEIS
1
1
Where iEISstd is sensitivity measurement done with standard setting. iEISnstd is sensitivity
measurement done with non standard settings. n is amount of reference measurement points.
To ensure accuracy of TRS, the amount of reference points measured should be at least 4. It is recommended to spread the reference measurements equally during the measurement time.
The measurement procedure is based on the measurement of the spherical sensitivity pattern of the DUT. The sensitivity values of the DUT at a predefined BER level are sampled in far field in a group of points located on a spherical surface enclosing the DUT. The EIS samples are taken using a constant sample step of 30° both in theta (θ) and phi (φ) directions. All the EIS samples are taken with two orthogonal polarizations, θ - and ϕ -polarisations. The
Total Radiated Sensitivity is calculated from the measured data by equation in chapter 6.4.1.
6.4.5 Test requirements
The average TRS of low, mid and high channel in beside head position for 1% ± 0.2% BER with 12.2kbps DL reference channel as defined in Annex C.3 of TS25.101 [2] shall be lower than test requirements for roaming bands shown in Table 6.4.2. The averaging shall be done in linear scale for the TRS results of both right and left side of the phantom head.

ETSI
ETSI TS 134 114 V8.2.0 (2009-10)283GPP TS 34.114 version 8.2.0 Release 8
⎥⎦
⎤⎢⎣
⎡⎟⎠
⎞⎜⎝
⎛ +++++= 10/10/10/10/10/10/ ______ 10
1
10
1
10
1
10
1
10
1
10
16log10
highrightmidrightlowrighthighleftmidleftlowleft PPPPPPaverageTRS
In addition the minimum TRS of each measured channel in beside head position shall be better than minimum performance requirements for roaming bands shown in the columns “Min”.
( )[ ]10/10/10/10/10/10/min
______ 10,10,10,10,10,10maxlog10 highrightmidrightlowrighthighleftmidleftlowleft PPPPPPTRS =
Table 6.4.2: TRS test requirement for UTRA LCR TDD roaming bands in the speech position for the primary mechanical mode
Operating Band Unit <REFÎor>
- - Average Max a dBm/1.28 MHz -100.1 -98.8 b dBm/1.28 MHz TBD TBD c dBm/1.28 MHz TBD TBD d dBm/1.28 MHz TBD TBD e dBm/1.28 MHz -100.1 -98.8 f dBm/1.28 MHz -100.1 -98.8
Note: Applicable for dual-mode GSM/UTRA LCR TDD.
NOTE: If the above Test Requirement differs from the Minimum Requirement then the Test Tolerance applied for this test is non-zero. The Test Tolerance for this test is defined and the explanation of how the Minimum Requirement has been relaxed by the Test Tolerance is given in Annex D.

ETSI
ETSI TS 134 114 V8.2.0 (2009-10)293GPP TS 34.114 version 8.2.0 Release 8
Annex A (normative): Test system characterization The main objective of this section is to define basic parameters of simulated user (phantom) and anechoic chamber.
A.1 Phantom specifications
A.1.1 Head Phantom The Specific Anthropomorphic Mannequin (SAM) is used for radiated performance measurements without the shell thickness requirement in non-critical areas of SAM. The dielectric properties of used material shall be maintained within ±25% of target properties listed in table A.1. For other frequencies within the frequency range, linear interpolation method shall be used to obtain target dielectric properties.
Table A.1
Frequency (MHz)
Relative Dielectric Constant (εr)
Conductivity (σ) (S/m)
450 43,5 0,87
835 41,5 0,90
900 41,5 0,97
1450 40,5 1,20
1800 40,0 1,40
1900 40,0 1,40
1950 40,0 1,40
2000 40,0 1,40
2450 39,2 1,80
3000 38,5 2,40
Example of recipe for tissue simulating liquid is presented in annex F .
A.2 Anechoic chamber constraints Testing shall be performed in an anechoic chamber fulfilling following requirements.
A.2.1 Positioner The chamber should be equipped with a positioner making possible to perform full 3-D measurements for both Tx and Rx radiated performance. The centre of the rotation should be the phase centre of the antenna, in the case it is not possible to evaluate an estimation of the antenna centre should be used. Alternatively centre of the line between right and left ear reference points can be used as a centre of rotation. Theta (θ) and phi (φ) angles are specified in figure A.1.

ETSI
ETSI TS 134 114 V8.2.0 (2009-10)303GPP TS 34.114 version 8.2.0 Release 8
DUT probe antenna
φθ
Figure A.1 The coordinate system used in the measurements
A.2.2 Measurement Antenna The measurement antenna should be able to measure two orthogonal polarizations (typically linear theta (θ) and phi (φ) polarizations). Note that single-polarized linear measurement antenna can also be used by turning it 90 ° for every measurement point.
For far-field measurements, the distance r between the DUT and the measurement antenna should be
⎟⎟⎠
⎞⎜⎜⎝
⎛> λ
λ3,3,
2max
2
DD
r
where λ is the wavelength of the measurement frequency and D the maximum extension of the radiating structure. Then the phase- and amplitude uncertainty limits and the reactive near field limit are not exceeded. The influence of measurement distance is discussed in Appendix A - Estimation of Measurement Uncertainty
A.2.3 Quiet Zone Reflectivity of the quiet zone shall be measured for frequencies used with method described in Appendix F. Measured reflectivity level is used in uncertainty calculations.
A.2.4 Shielding effectiveness of the chamber The recommended level of the shielding effectiveness is -100 dB from 800 MHz to 4 GHz. See Appendix G for more details on shielding effectiveness validation.

ETSI
ETSI TS 134 114 V8.2.0 (2009-10)313GPP TS 34.114 version 8.2.0 Release 8
Annex B (normative): Calibration The relative power values of the measurement points will be transformed to absolute radiated power values (in dBm) by performing a calibration measurement. The calibration measurement is done by using a reference antenna with known efficiency or gain values. In the calibration measurement the reference antenna is measured in the same place as the
DUT, and the attenuation of the complete transmission path ( totalL ) from the DUT to the measurement receiver/NB/BS
simulator is calibrated out.
The gain and/or radiation efficiency of the reference antenna shall be known at the frequency bands in which the calibrations are performed. Recommended calibration antennas are monopole antennas or sleeve dipoles tuned for the each frequency band of interest. Alternatively, other methods may be used if they ensure an equal or greater level of accuracy. A network analyzer is recommended to be used to perform the calibration measurement. Also other devices can be used to measure the attenuation. The calibration is performed individually for the both orthogonal polarizations, all the transmission paths and all frequencies used in the testing.
The principle is based on the use of calibration/substitution antennas presenting an efficiency known with a sufficient accuracy in the measurement bandwidths. Such a calibration antenna is placed on the DUT positioner at the exact MS location used for TRP and TRS measurement. It is possible to use a mechanical piece to place the calibration antenna on the positioner. This mechanical piece should not present any electromagnetic properties, which could influence the frequency response and the radiation properties of the calibration antenna. Find hereafter, an illustration of the substitution configuration in Figure B.1.
B.1 Calibration Procedure
totalL is the attenuation between P and B, see figure B.1.
( )calACABtotal ELLL +−=
Where ACL is cable loss from A to C. The cable AC connecting the substitution antenna should be such that its
influence upon radiation pattern measurements is minimal. ABL is the attenuation between points A and B. In TRP and
TRS measurements point B is connected to the calibrated input/output port of measurement receiver.
calE is the efficiency or gain of the calibration antenna at the frequency of interest.

ETSI
ETSI TS 134 114 V8.2.0 (2009-10)323GPP TS 34.114 version 8.2.0 Release 8
Figure B.1 Calibration/substitution procedures using a vector network analyzer.
If the calibration is based on known efficiency of the calibration antenna, a full spherical scanning is performed to
determine ABL . Unless the otherwise specified in the calibration antenna documentation, TRP sampling grid and
equation for TRP in section 5.2.1 should be used.
This procedure has to be done at each frequency of interest.
To achieve measurements with an uncertainty as low as possible, it is absolutely necessary to exactly keep the same P to B configuration (cables, dual-polarized antenna and cables positions, etc).
Calibration shall be performed yearly or if any equipment in the measurement system is changed.

ETSI
ETSI TS 134 114 V8.2.0 (2009-10)333GPP TS 34.114 version 8.2.0 Release 8
Annex C (normative): Measurement Test Report Operational mode, model and serial number of the DUT shall be documented to the test report. Whether the DUT is positioned against the phantom head with a specific device holder or by other means should be described in the test report. A photograph of the test setup is recommended.
Test equipment list should be included in the test report.
TRP [dBm] and TRS [dBm] values shall be reported for each tested channel and for each side of the head and a frequency band average shall be calculated by using following equations.
⎥⎥
⎦
⎤
⎢⎢
⎣
⎡ +++++=6
101010101010log10
101010101010______ lefthighleftmidleftlowrighthighrightmidrightlow TRPTRPTRPTRPTRPTRP
TRP
⎥⎥
⎦
⎤
⎢⎢
⎣
⎡
+++++= −−−−−−
101010101010______
101010101010
6log10
lefthighleftmidleftlowrighhighrighmidrightlow TRSTRSTRSTRSTRSTRSTRS
The expanded measurement uncertainty, assessed according Annex E, shall be documented next to the corresponding TRP and TRS results. The uncertainty calculation shall be made available.

ETSI
ETSI TS 134 114 V8.2.0 (2009-10)343GPP TS 34.114 version 8.2.0 Release 8
Annex D (normative): Maximum uncertainty of Test System and Test Tolerances
D.1 Maximum uncertainty of Test System The maximum acceptable uncertainty of the Test System is specified below for each test. The Test System shall enable test to be measured with an uncertainty not exceeding the specified values. All uncertainties are absolute values and are valid for a confidence level of 95 %.
The estimation of measurement uncertainty is presented in more detail in Annex E.
Table D.1: Test system uncertainties for OTA tests
Clause Maximum Test System Uncertainty Derivation of Test System Uncertainty
5.2 TRP for FDD UE Bands I,II,III,IV,V,VI,VII,VIII,IX ±1.9 dB for single measurement
Detailed derivations of uncertainty can be found in Annex E
5.3 TRP for GSM MS TBD TBD 5.4 TRP for TDD UE Bands a,e,f
±1.9 dB for single measurement Detailed derivations of uncertainty can be found in Annex E
6.2 TRS for FDD UE Bands I,II,III,IV,V,VI,VII,VIII,IX ±2.3 dB for single measurement
Detailed derivations of uncertainty can be found in Annex E.
6.3 TRS for GSM MS TBD TBD 6.4 TRS for TDD UE Bands a,e,f
±2.3 dB for single measurement Detailed derivations of uncertainty can be found in Annex E
D.2 Test tolerances (informative) Test tolerances below are used to relax the Minimum Requirements in the present document to derive the Test Requirements.
Table D.2:- Test tolerances for OTA tests
Clause Test Tolerance 5.2 TRP for FDD UE Bands I,II,III,IV,V,VI,VII,VIII,IX
1.0 dB for minimum requirement 0.7 dB for average requirement
5.3 TRP for GSM MS TBD 5.4 TRP for TDD UE Bands a,e,f
1.0 dB for minimum requirement 0.7 dB for average requirement
6.2 TRS for FDD UE Bands I,II,III,IV,V,VI,VII,VIII,IX 1.2 dB for maximum requirement 0.9 dB for average requirement
6.3 TRS for GSM MS TBD 6.2 TRS for TDD UE Bands a,e,f
1.2 dB for minimum requirement 0.9 dB for average requirement
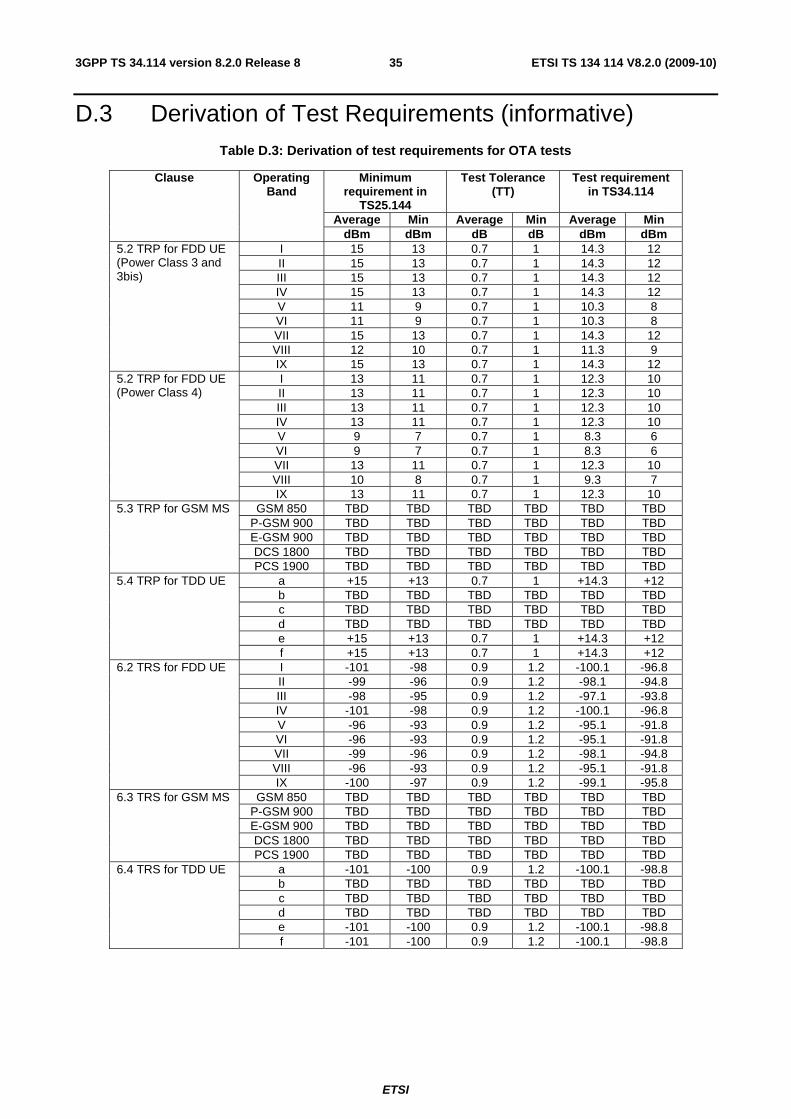
ETSI
ETSI TS 134 114 V8.2.0 (2009-10)353GPP TS 34.114 version 8.2.0 Release 8
D.3 Derivation of Test Requirements (informative) Table D.3: Derivation of test requirements for OTA tests
Clause Operating Band
Minimum requirement in
TS25.144
Test Tolerance (TT)
Test requirement in TS34.114
Average Min Average Min Average Min dBm dBm dB dB dBm dBm
5.2 TRP for FDD UE (Power Class 3 and 3bis)
I 15 13 0.7 1 14.3 12 II 15 13 0.7 1 14.3 12 III 15 13 0.7 1 14.3 12 IV 15 13 0.7 1 14.3 12 V 11 9 0.7 1 10.3 8 VI 11 9 0.7 1 10.3 8 VII 15 13 0.7 1 14.3 12 VIII 12 10 0.7 1 11.3 9 IX 15 13 0.7 1 14.3 12
5.2 TRP for FDD UE (Power Class 4)
I 13 11 0.7 1 12.3 10 II 13 11 0.7 1 12.3 10 III 13 11 0.7 1 12.3 10 IV 13 11 0.7 1 12.3 10 V 9 7 0.7 1 8.3 6 VI 9 7 0.7 1 8.3 6 VII 13 11 0.7 1 12.3 10 VIII 10 8 0.7 1 9.3 7 IX 13 11 0.7 1 12.3 10
5.3 TRP for GSM MS GSM 850 TBD TBD TBD TBD TBD TBD P-GSM 900 TBD TBD TBD TBD TBD TBD E-GSM 900 TBD TBD TBD TBD TBD TBD DCS 1800 TBD TBD TBD TBD TBD TBD PCS 1900 TBD TBD TBD TBD TBD TBD
5.4 TRP for TDD UE a +15 +13 0.7 1 +14.3 +12 b TBD TBD TBD TBD TBD TBD c TBD TBD TBD TBD TBD TBD d TBD TBD TBD TBD TBD TBD e +15 +13 0.7 1 +14.3 +12 f +15 +13 0.7 1 +14.3 +12
6.2 TRS for FDD UE I -101 -98 0.9 1.2 -100.1 -96.8 II -99 -96 0.9 1.2 -98.1 -94.8 III -98 -95 0.9 1.2 -97.1 -93.8 IV -101 -98 0.9 1.2 -100.1 -96.8 V -96 -93 0.9 1.2 -95.1 -91.8 VI -96 -93 0.9 1.2 -95.1 -91.8 VII -99 -96 0.9 1.2 -98.1 -94.8 VIII -96 -93 0.9 1.2 -95.1 -91.8 IX -100 -97 0.9 1.2 -99.1 -95.8
6.3 TRS for GSM MS GSM 850 TBD TBD TBD TBD TBD TBD P-GSM 900 TBD TBD TBD TBD TBD TBD E-GSM 900 TBD TBD TBD TBD TBD TBD DCS 1800 TBD TBD TBD TBD TBD TBD PCS 1900 TBD TBD TBD TBD TBD TBD
6.4 TRS for TDD UE a -101 -100 0.9 1.2 -100.1 -98.8 b TBD TBD TBD TBD TBD TBD c TBD TBD TBD TBD TBD TBD d TBD TBD TBD TBD TBD TBD e -101 -100 0.9 1.2 -100.1 -98.8 f -101 -100 0.9 1.2 -100.1 -98.8

ETSI
ETSI TS 134 114 V8.2.0 (2009-10)363GPP TS 34.114 version 8.2.0 Release 8
Annex E (normative): Estimation of Measurement Uncertainty Individual uncertainty contributions in the TRP and TRS measurements are discussed and evaluated in this Appendix. A technique for calculating the total measurement uncertainty is also presented. More detailed discussion on the uncertainty contributions can be found from [4].
The TRP/TRS measurement procedure can be considered to include two stages. In Stage 1 the actual measurement of the 3-D pattern of the Device Under Test (DUT) is performed. In Stage 2 the calibration of the absolute level of the DUT measurement results is performed by means of using a calibration antenna whose absolute gain/radiation efficiency is known at the frequencies of interest. The uncertainty contributions related to TRP are listed in Table E.1 and the contributions related to TRS are in Table A.2. The uncertainty contributions are analyzed in the following paragraphs.
The calculation of the uncertainty contribution is based on the ISO Guide to the expression of uncertainty in measurement. Each individual uncertainty is expressed by its Standard Deviation (termed here as ‘standard uncertainty’) and represented by symbol U. The uncertainty contributions can be classified to two categories: Type-A uncertainties, which are statistically determined e.g. by repeated measurements, and Type-B uncertainties, which are derived from existing data e.g. data sheets. Several individual uncertainties are common in Stage 1 and Stage 2 and therefore cancel.
The procedure of forming the uncertainty budget in TRP measurement is:
1) Compile lists of individual uncertainty contributions for TRP measurement both in Stage 1 and Stage 2.
2) Determine the standard uncertainty of each contribution by
a) Determining the distribution of the uncertainty (Gaussian, U-shaped, rectangular, etc.)
b) Determining the maximum value of each uncertainty (unless the distributions is Gaussian)
c) Calculating the standard uncertainty by dividing the uncertainty by 2 if the distribution is U-shaped, and
by 3 if the distribution is rectangular.
3) Convert the units into decibel, if necessary.
4) Combine all the standard uncertainties by the Root of the Sum of the Squares (RSS) method.
5) Combine the total uncertainties in Stage 1 and Stage 2 also by the RSS method: 2,
2, entn measuremcalibratiocementDUT measurcc uuu +=
.
6) Multiply the result by an expansion factor of 1.96 to derive expanded uncertainty at 95% confidence level: 1.96
* cu .
Example uncertainty budgets are presented in Tables E.5 and E.6.

ETSI
ETSI TS 134 114 V8.2.0 (2009-10)373GPP TS 34.114 version 8.2.0 Release 8
Table E.1 Uncertainty contributions in TRP measurement.
Description of uncertainty contribution Details in paragraph
Stage 1, DUT measurement 1) Mismatch of receiver chain (i.e. between probe antenna and measurement receiver) E.1-E.2
2) Insertion loss of receiver chain E.3-E.5
3) Influence of the probe antenna cable E.6
4) Uncertainty of the absolute antenna gain of the probe antenna E.7
5) Measurement Receiver: uncertainty of the absolute level E.8
6) Measurement distance: a) offset of DUT phase center from axis(es) of rotation b) mutual coupling between the DUT and the probe antenna c) phase curvature across the DUT
E.9
7) Quality of quiet zone E.10
8) DUT Tx-power drift E.11 9) Uncertainty related to the use of the SAM phantom: a) uncertainty from using different types of SAM phantom b) simulated tissue liquid uncertainty c) effect of the DUT holder
E.12
10) Coarse sampling grid E.13 11) Random uncertainty (repeatability, including positioning uncertainty of the DUT against the SAM phantom) E.14
Stage 2 , Calibration measurement, network analyzer method, figure 7.5
12) Uncertainty of network analyzer E.15
13) Mismatch of receiver chain E.1-E.2
14) Insertion loss of receiver chain E.3-E.5
15) Mismatch in the connection of calibration antenna E.1
16) Influence of the calibration antenna feed cable E.6
17) Influence of the probe antenna cable E.6
18) Uncertainty of the absolute gain of the probe antenna E.7
19) Uncertainty of the absolute gain/ radiation efficiency of the calibration antenna E.16 20) Measurement distance: a) Offset of calibration antenna’s phase center from axis(es) of rotation b) Mutual coupling between the calibration antenna and the probe antenna c) Phase curvature across the calibration antenna
E.9
21) Quality of quiet zone E.10

ETSI
ETSI TS 134 114 V8.2.0 (2009-10)383GPP TS 34.114 version 8.2.0 Release 8
Table E.2 Uncertainty contributions in TRS measurement.
Description of uncertainty contribution Details in paragraph
Stage 1, DUT measurement 1) Mismatch of transmitter chain (i.e. between probe antenna and base station simulator) E.1-E.2
2) Insertion loss of transmitter chain E.3-E.5
3) Influence of the probe antenna cable E.6
4) Uncertainty of the absolute antenna gain of the probe antenna E.7
5) Base station simulator: uncertainty of the absolute output level E.17
6) BER measurement: output level step resolution E.18
7) Statistical uncertainty of BER measurement E.19
8) BER data rate normalization E.20
9) Measurement distance: a) offset of DUT phase center from axis(es) of rotation b) mutual coupling between the DUT and the probe antenna c) phase curvature across the DUT
E.9
10) Quality of quiet zone E.10
11) DUT sensitivity drift E.21
12) Uncertainty related to the use of the SAM phantom: a) uncertainty from using different types of SAM phantom b) simulated tissue liquid uncertainty c) effect of the DUT holder
E.12
13) Coarse sampling grid E.13
14) Random uncertainty (repeatability) - positioning uncertainty of the DUT against the SAM E.14
Stage 2 , Calibration measurement, network analyzer method, figure 7.5
15) Uncertainty of network analyzer E.15
16) Mismatch in the connection of transmitter chain (i.e. between probe antenna and NA) E.1-E.2
17) Insertion loss of transmitter chain E.3-E.5
18) Mismatch in the connection of calibration antenna E.1
19) Influence of the calibration antenna feed cable E.6
20) Influence of the probe antenna cable E.6
21) Uncertainty of the absolute gain of the probe antenna E.7 22) Uncertainty of the absolute gain/radiation efficiency of the calibration antenna
E.16
23) Measurement distance: a) Offset of calibration antenna’s phase center from axis(es) of rotation b) Mutual coupling between the calibration antenna and the probe antenna c) Phase curvature across the calibration antenna
E.9
24) Quality of quiet zone E.10
If a network analyzer is not available for calibration measurement and a spectrum analyzer or a power meter is used, Stage 2 errors in Tables 1 and 2 shall be replaced by Table 3.

ETSI
ETSI TS 134 114 V8.2.0 (2009-10)393GPP TS 34.114 version 8.2.0 Release 8
Table E.3: Uncertainty contributions in Stage 2 (calibration measurement, spectrum analyzer method)
Description of uncertainty contribution Details in paragraph
Stage 2, calibration measurement, spectrum analyser method, figure 7.4 1) Cable loss measurement uncertainty E.22 2) Uncertainty from impedance mismatch between the signal generator and the calibration antenna E.1
3) Impedance mismatch uncertainty between the measurement receiver and the probe antenna E.1
4) Signal generator: uncertainty of the absolute output level E.23 5) Signal generator: output level stability E.24
6) Influence of the calibration antenna feed cable E.6
7) Influence of the probe antenna cable E.6 8) Insertion loss of the calibration antenna feed cable E.25
9) Insertion loss of the probe antenna cable E.3 10) Mismatch uncertainty: between signal generator and calibration antenna (if antenna attenuator is used)
E.1
11) Mismatch uncertainty: between measurement receiver and probe antenna (if antenna attenuator is used) E.1
12) Insertion loss of the calibration antenna attenuator (if used) E.26 13) Insertion loss of the probe antenna attenuator (if used) E.4
14) Uncertainty of the absolute level of the measurement receiver E.8
15) Uncertainty of the absolute gain of the probe antenna E.7 16) Uncertainty of the absolute gain of the calibration antenna E.16
18) Measurement distance: a) Offset of calibration antenna’s phase center from axis(es) of rotation b) Mutual coupling between the calibration antenna and the probe antenna c) Phase curvature across the calibration antenna
E.9
17) Quality of quiet zone E.10
E.1 Mismatch uncertainty between measurement receiver and the probe antenna
If the same chain configuration (including the measurement receiver; the probe antenna and other elements) is used in both stages, the uncertainty is considered systematic and constant � 0.00dB value.
If it is not the case, this uncertainty contribution has to be taken into account and should be measured or determined by the method described in [1].
E.3 Insertion loss of the probe antenna cable If the probe antenna cable does not move between the calibration and the DUT measurement stage, the uncertainty due to the insertion loss of the cable is assumed to be systematic. Moreover, this uncertainty is common and constant in both stages and that is why this leads to 0.00dB value.
If a different cable is used in the calibration measurement and in the DUT measurement, and the difference of the insertion loss is used in the calculations, then the overall combined standard uncertainty of the insertion loss measurement should be used in the uncertainty budget. The distribution of this uncertainty is assumed to be rectangular, in which case the standard uncertainty can be calculated as the maximum value/√3.

ETSI
ETSI TS 134 114 V8.2.0 (2009-10)403GPP TS 34.114 version 8.2.0 Release 8
E.4 Insertion loss of the probe antenna attenuator (if used)
See Insertion loss of the probe antenna cable
If the probe antenna attenuator is used in both stages, the uncertainty is considered systematic and constant � 0.00dB value.
E.5 Insertion loss of the RF relays (if used) See Insertion loss of the probe antenna cable.
If the RF relay is used in both stages, the uncertainty is considered systematic and constant � 0.00dB value.
E.6 Influence of the antenna cable
E.6.1 Probe antenna cable If the probe antenna is directional (i.e. peak gain >+5dBi e.g. horn, LPDA, etc.) and the same probe antenna cable configuration is used for both stages, the uncertainty is considered systematic and constant � 0.00dB value.
In other cases a technical study should be done.
An ETSI technical report [4] gives a discussion on the results obtained by testing a vertically polarized biconical antenna over a ground plane with differing RF cable configurations.
E.6.2 Calibration antenna cable If an efficiency calibration is performed, influence of the calibration antenna feed cable can be assumed to be negligible, due to data averaging.
In the case of gain calibration, the influence of the calibration antenna feed cable shall be assessed by measurements. A gain calibration measurement is repeated with a reasonably differing routing of the feed cable. Largest difference between the results is entered to the uncertainty budget with a rectangular distribution.
E.7 Absolute gain of the probe antenna The uncertainty appears in the both stages and it is thus considered systematic and constant� 0.00dB value.
E.8 Measurement Receiver: uncertainty of absolute level The receiving device is used to measure the received signal level in TRP tests either as an absolute level or as a relative level. Receiving device used is typically a Base Station Simulator (BSS), spectrum analyzer (SA), or power meter (PM). Generally there occurs an uncertainty contribution from limited absolute level accuracy and non-linearity.
E.9 Measurement distance The uncertainty contribution from a finite measurement distance is estimated in three parts.

ETSI
ETSI TS 134 114 V8.2.0 (2009-10)413GPP TS 34.114 version 8.2.0 Release 8
E.9.1 Offset of DUT phase centre from axis(es) of rotation In all the measurements defined in this test procedure the DUT and phantom combination is rotated about the ear reference point of SAM phantom, which is also assumed to be the location of the phase center in both angular directions of the measurements.
For some turntables this may be practically impossible in which case a measurement uncertainty contribution can arise because the phase center will rotate on a non-zero radius about the center of rotation, thereby giving a variable measurement distance. Data averaging process may lead to a partial self-cancel of this uncertainty.
The following formula is used to estimate this uncertainty contribution in stage 1:
Uphase_center_limits (dB) = 22 )log(10)log(10 ddd +Δ±
If a gain calibration is performed in Stage 2, the uncertainty contribution of calibration antenna’s displacement is estimated with the previous formula. Misalignment can be estimated with following formula,
Umisaligment (dB) = ( )θcoslog20 ,
whereθ is the misalignment angle between the calibration antenna and the probe antenna. The contribution shall be added to displacement error:
Ucal (dB) = 22__ tmisaligmencenterphase UU +Δ
For an efficiency calibration with an omnidirectional calibration antenna, the Ucal is calculated similary as for gain calibration but the uncertainty may be divided by factor 2. This is due to correcting impact of data averaging in this type of calibration.
E.9.2 Mutual coupling In measurement of radio performances of UMTS mobile phones in speech mode, the mutual coupling uncertainty for this frequency band is a 0.00dB value (see annex A-2 in [5]).
The 0.00dB value can be extended for the GSM; DCS and PCS band frequencies.
E.9.3 Phase curvature This uncertainty originates from the finite far-field measurement distance, which causes phase curvature across the DUT. If the measurement distance is > 10λ, this error is assumed to be negligible. At 2 GHz λ is 0.15 m, thus 10λ is 1.5 m.
E.10 Quality of quiet zone The uncertainty contribution of the reflectivity level of the anechoic chamber is determined from the average standard deviation of the electric field in the quiet zone. By repeating a free space VSWR measurement in 15-degree grid in elevation and azimuth, 264 standard deviation values in both polarizations are determined. From these values average standard deviation of electric field in the quiet zone can be calculated from the equation:
2
)sin(2
)sin(2 1 1 1
,,1
,,∑ ∑∑∑= = ==
+=
N
n
N
n
M
mnvermn
M
mnhormn
freq
sNM
sNM
Sθπθπ
where
N is number of angular intervals in elevation,

ETSI
ETSI TS 134 114 V8.2.0 (2009-10)423GPP TS 34.114 version 8.2.0 Release 8
M is number of angular intervals in azimuth and
nθ is elevation of single measurement polmns ,, .
If an efficiency calibration with omnidirectional calibration antenna is performed, the effect of reflectivity level
decreases in Stage 2 and freqS may be divided by factor 2. This is due to correcting impact of data averaging in this
type of calibration. Efficiency calibration done with sampling step ≤ 30°, can be considered to have at least four
independent samples. freqS may be divided by factor 2 also in stage 1 for the same reason.
It’s likely that asymmetry of the field probe will have a very small impact on this measurement uncertainty contributor, however, an upper bound to probe symmetry should be considered.
E.11 Tx-power drift of DUT A single point power reference measurement in the beginning and at the end of the measurement procedure is recommended to monitor the power drift of the DUT. Based on TX-power drift measurements for typical 3G UE the determination of this contribution is performed by measuring the Tx-power drift and the value shall be included in the uncertainty budget.
In order to minimize Tx-power drift error it’s recommended to interleave sensitivity and power measurement of multiple channels. This spreads the measurements over a longer period, which helps to average the drift of the TX-power.
E.12 Uncertainty related to the use of SAM phantom
E.12.1 Uncertainty from using different types of SAM phantom This uncertainty contribution originates from the fact that different laboratories may use the two different versions of SAM head: the SAM head phantom or the SAM phantom including the head and the shoulders. The standard SAM head is the specified phantom. However, the use of the other type of SAM is also allowed with the requirement that the resulting uncertainty contribution is taken into account in the uncertainty budget.
E.12.2 Simulated tissue liquid uncertainty This uncertainty will occur, if the laboratory uses a liquid which has dielectric parameters deviating from the target parameters given in chapter Annex A. The relative dielectric constant (εr) and conductivity (σ) of used material shall be maintained within ±25% of target properties listed in Annex A. To convert electrical parameters of the tissue stimulant εr and σ to uncertainty values following equation shall be used:
22
2
arg_
arg_
2
arg_
arg_
%25%255.0
+
⎟⎟
⎠
⎞
⎜⎜
⎝
⎛ −+
⎟⎟
⎠
⎞
⎜⎜
⎝
⎛ −
=ettr
ettrr
ettr
ettrr
electrical dBUσ
σσε
εε
E.12.3 Device Holder This uncertainty contribution originates from interaction of the Device Holder (the supporting structure of low-loss dielectric material that is used to hold the handset under-test in the desired position during measurement, as defined in the IEEE 1528) and the DUT. The Device Holder Uncertainty contribution depends on the different laboratories implementation and on the shape and manufacturing material. The Device Holder has an influence that varies with the relative position with respect to the DUT Antenna. Due to this the Device Holder should be designed to have maximum distance between Device Holder and DUT Antenna. The fixed value 0.2 dB is used to estimate the impact of device

ETSI
ETSI TS 134 114 V8.2.0 (2009-10)433GPP TS 34.114 version 8.2.0 Release 8
holder in uncertainty calculation. The determination of this contribution is performed by measuring the TRP and TRS with and without the holder.
E.13 Coarse sampling grid Degreasing of sampling density to finite amount of samples affects the measurement uncertainty by two different errors. First is due to inadequate number of samples and second is a systematic discrimination approximation error in TRP and TRS equations.
The offset of systematic approximation error can be expressed by using formula
( )⎟⎠
⎞⎜⎝
⎛⋅= ∑−
N
nnN
Offset1
sin2
10log10 θπ.
where
N is number of angular intervals in elevation,
nθ is elevation.
Sampling Grid Error
-0.25
-0.2
-0.15
-0.1
-0.05
0
0 5 10 15 20 25 30 35 40 45
Sample Step [ ° ]
Off
set
of
TR
P/T
RS
[d
B]
Figure E.7. Approximation error of TRP/TRS.
The 10° or 15° sampling grid used in TRP measurements has been shown to introduce only very small differences as compared to the results obtained with denser grids, so with that sampling grid the uncertainty contribution can assumed negligible.
When using sample step size of 15° - 30°, standard uncertainty of 0.15dB can be assumed to cover errors.
E.14 Random uncertainty The random uncertainty characterizes the undefined and miscellaneous effects which cannot be forecasted. One can estimate this type of uncertainty with a repeatability test by making a series of repeated measurement with a reference DUT without changing anything in the measurement set-up.
To estimate this uncertainty, it is suggested to perform at least five evaluations of TRP/TRS for the cheek right position whereby the device shall be dismounted and newly positioned with a fully charged battery before each tests. This

ETSI
ETSI TS 134 114 V8.2.0 (2009-10)443GPP TS 34.114 version 8.2.0 Release 8
measurement set has to be carried out in mid channel of each frequency band, for at least three phones with different type of mechanical design. The values have to be normalized by the mean for each measurement set. As a result the uncertainty contribution entered to uncertainty budget is the difference between the maximum and minimum normalized value.
E.15 Uncertainty of network analyzer This uncertainty includes the all uncertainties involved in the S21 measurement with a network analyzer, and will be calculated from the manufacturer’s data in logs with a rectangular distribution, unless otherwise informed, (see clause 5.1.2 in [6]).
E.16 Uncertainty of the gain/efficiency of the calibration antenna
The calibration antenna only appears in Stage 2. Therefore, the gain/efficiency uncertainty has to be taken into account.
This uncertainty will be calculated from the manufacturer’s data in logs with a rectangular distribution, unless otherwise informed (see clause 5.1.2 in [6]).
If the manufacturer’s data do not give the information, the value has to be checked, see annex A-12 in [5]
E.17 Base station simulator: uncertainty of the absolute level
The transmitter device (typically a BS Simulator) is used to drive a signal to the horn antenna in sensitivity tests either as an absolute level or as a relative level. Receiving device used is typically a UE/MS. Generally there occurs uncertainty contribution from limited absolute level accuracy and non-linearity of the BS Simulator.
For practical reasons, the calibration measurement (Stage 2) should be only performed with the probe antenna as a receiver. Hence, the uncertainty on the absolute level of the transmitter device cannot be assumed as systematic. This uncertainty should be calculated from the manufacturer’s data in logs with a rectangular distribution, unless otherwise informed (see clause 5.1.2 in [6]). Furthermore, the uncertainty of the non-linearity of the device is included in the absolute level uncertainty.
E.18 BER measurement: output level step resolution When output power of the BS simulator is swept to reach the BER target, used power step resolution creates this uncertainty. Output power step used in the BER measurement is divided by factor 2 to obtain the uncertainty with rectangular distribution.
E.19 Statistical uncertainty of the BER measurement To study statistical uncertainty of BER measurement, see ETSI document TR 100 028-1, section 6.6 [4].
For a full TRS measurement with a regular sampling grid, the statistical uncertainty can be approximated by using the following formula:
4N
UU SingleTRS
fullTRS = ,
Where

ETSI
ETSI TS 134 114 V8.2.0 (2009-10)453GPP TS 34.114 version 8.2.0 Release 8
SingleTRSU is the statistical uncertainty of single measurement,
N is the number of measurements.
E.19.1 WCDMA For a BER target of 1%±0.2% using 20000 bits, uncertainty of 0.19 dB for a single measurement can be used. Using a BER target of 10%±2% with 20000 tested bits will lead to uncertainty of 0.46dB for a single measurement. If non standard settings are used to determine EIS the statistical error of the measurement should be estimated according to ETSI document TR 100 028-1.
E.19.2 GSM For a BER target of 2.44%±0.1% using 10000 bits, uncertainty of 0.13 dB for a single measurement can be used. If non standard settings are used to determine EIS the statistical error of the measurement should be estimated according to ETSI document TR 100 028-1.
E.19.3 TD-SCDMA
For a BER target of 1% ± 0.2% using 40000 bits, uncertainty of 0.13 dB for a single measurement can be used. If non standard settings are used to determine EIS the statistical error of the measurement should be estimated according to ETSI document TR 100 028-1.
E.20 BER normalization uncertainty This uncertainty occurs only when non standard settings are used to speed up TRS measurement. It can be calculated using following formula:
ref
astSingleTRSfefSingleTRSr
normN
UU
U
22
22 ⎟⎟⎠
⎞⎜⎜⎝
⎛+⎟⎟
⎠
⎞⎜⎜⎝
⎛
= ,
Where
efSingleTRSrU is the statistical uncertainty of the used reference measurement,
astSingleTRSfU is the statistical uncertainty of the non standard measurement,
refN Is the number of measured reference points.
E.21 DUT sensitivity drift Due to statistical uncertainty of BER measurement, drift in the TRS can not be monitored similary to TRP. An uncertainty value of 0.2dB can be used, or the TRS drift should be measured, with a setup corresponding to the actual TRS measurement.

ETSI
ETSI TS 134 114 V8.2.0 (2009-10)463GPP TS 34.114 version 8.2.0 Release 8
E.22 Cable loss measurement uncertainty Before performing the calibration, cable losses have to be measured. This measurement includes a standard uncertainty, which is composed of the mismatch, and the insertion loss uncertainties. In the calibration measurement, the transmitter part is composed with the calibration antenna, cables, and signal generator. The receiver part is composed with the probe antenna, cables, and measurement device.
The cable loss of transmitter and receiver parts should be measured separately. By this way, the cable losses will be compliant with the cable routing of the calibration stage. On the opposite, if the cable losses were measured together at the same time, the measured values would include errors from miscellaneous mismatch contributions, which do not appear in the cable routing of the calibration stage.
The cable loss measurement uncertainty is the result of the RSS of the uncertainty contributions listed in Table E.4.
Table E.4. Uncertainty contributions in the cable loss measurement.
Description of uncertainty contribution Standard Uncertainty (dB) Mismatch uncertainty of cable(s) receiver part Insertion loss of the cable(s) receiver part Measurement device: absolute level uncertainty Measurement device: linearity Mismatch uncertainty of cable(s) transmitter part Insertion loss of the cable(s) transmitter part Signal generator: absolute output level uncertainty Signal generator: output level stability uncertainty Cable loss measurement uncertainty (RSS)
E.23 Signal generator: uncertainty of the absolute output level
The signal generator is only used at this stage. It substitutes the DUT by feeding the calibration antenna with a known power level. The use of this signal generator introduces an uncertainty on the absolute output level.
This uncertainty will be calculated from the manufacturer’s data in logs with a rectangular distribution (see clause 5.1.2 in [6]).
E.24 Signal generator: output level stability The uncertainty on the output level stability has to be taken into account only when the uncertainty of the absolute level is not considered.
This uncertainty will be calculated from the manufacturer’s data in logs with a rectangular distribution (see clause 5.1.2 in [6]).
E.25 Insertion loss: Calibration antenna feed cable The feed cable of the calibration antenna only appears in Stage 2. As a result, this uncertainty has to be taken into account.
This uncertainty will be measured or calculated from the manufacturer’s data in logs with a rectangular distribution (see clause 5.1.2 in [6]).

ETSI
ETSI TS 134 114 V8.2.0 (2009-10)473GPP TS 34.114 version 8.2.0 Release 8
E.26 Insertion loss: Calibration antenna attenuator (if used)
If a calibration antenna attenuator is used, it only appears in Stage 2. As a result, this uncertainty has to be taken into account.
This uncertainty will be calculated from the manufacturer’s data in logs with a rectangular distribution (see clause 5.1.2 in [6]).

ETSI
ETSI TS 134 114 V8.2.0 (2009-10)483GPP TS 34.114 version 8.2.0 Release 8
E.27 Examples of uncertainty budget calculations for TRP(Informative)
Table E.5: Example of uncertainty budget for TRP measurement
Uncertainty Source Comment Uncertainty Value [dB]
Prob Distr Div ci
Standard Uncertainty
[dB] STAGE 1 (DUT measurement)
1) Mismatch of receiver chain Гpower meter <0.05 Гprobe antenna connection <0.16 0.05 U 2 1 0.04
2) Insertion loss of receiver chain
Systematic with Stage 2 (=> cancels)
0 R 3 1 0
3) Influence of the probe antenna cable
Systematic with Stage 2 (=> cancels) 0 R 3 1 0
4) Absolute antenna gain of the probe antenna
Systematic with Stage 2 (=> cancels) 0 R 3 1 0
5) Measurement Receiver: uncertainty of the absolute level
Power Meter 0.06 R 3 1 0.03
6) Measurement distance a) Offset of DUT phase center
Δd=0.05m 0.14 R 3 1 0.08
7) Quality of quiet zone Standard deviation of E-field in QZ measurement 0.5 N 1 1 0.5
8) DUT Tx-power drift Drift 0.2 R 3 1 0.12
9) a) Uncertainty related to the use of SAM phantom:
Standard SAM head with standard tissue simulant 0 R 3 1 0
b) Simulated tissue liquid uncertainty Maximum allowed error 0.5 R 3 1 0.29
c) Effect of DUT holder Fixed value 0.2 R 3 1 0.12
10) Coarse sampling grid Negligible, used θΔ = 15°
and ϕΔ = 15°. 0 N 1 1 0
11) Repeatability Monoblock, clamshell and slide design used for testing 0.4 R 3 1 0.23
STAGE 2 (Calibration)
12) Uncertainty of network analyzer
Manufacturer’s uncertainty calculator, covers whole NA setup
0.5 R 3 1 0.29
13) Mismatch of receiver chain Taken in to account in NA setup uncertainty 0 U 2 1 0
14) Insertion loss of receiver chain
Systematic with Stage 1 (=> cancels) 0 R 3 1 0
15) Mismatch in the connection of calibration antenna
Taken in to account in NA setup uncertainty 0 U 2 1 0
16) Influence of the feed cable of the calibration antenna Gain calibration with a dipole 0.3 R 3 1 0.17
17) Influence of the probe antenna cable
Systematic with Stage 1 (=> cancels) 0 R 3 1 0
18) Uncertainty of the absolute gain of the probe antenna
Systematic with Stage 1 (=> cancels) 0 R 3 1 0
19) Uncertainty of the absolute gain of the calibration antenna Calibration certificate 0.5 R 3 1 0.29
20) Measurement distance: - Calibration antenna’s d=3m, Δd=0.05m, θ=2° 0.29 R 3 1 0.17

ETSI
ETSI TS 134 114 V8.2.0 (2009-10)493GPP TS 34.114 version 8.2.0 Release 8
displacement and misalignment
21) Quality of quiet zone Standard deviation of e-field in QZ measurement, Gain calibration
0.5 N 1 1 0.5
Combined standard uncertainty ∑
=⋅=
m
iiic ucu
1
22 0.95
Expanded uncertainty (Confidence interval of 95 %) ce uu 96,1=
1.86

ETSI
ETSI TS 134 114 V8.2.0 (2009-10)503GPP TS 34.114 version 8.2.0 Release 8
E.28 Examples of uncertainty budget calculations for TRS(Informative)
Table E.6. Example of uncertainty budget for TRS measurement
Uncertainty Source Comment Uncertainty Value [dB]
Prob Distr Div ci
Standard Uncertainty
[dB] STAGE 1 (DUT measurement)
1) Mismatch of transmitter chain
ГBSS <0.13 Г antenna connection <0.03 0.02 N 1 1 0.02
2) Insertion loss of transmitter chain
Systematic with Stage 1 (=> cancels) 0 R 3 1 0
3) Influence of the probe antenna cable
Systematic with Stage 2 (=> cancels) 0 R 3 1 0
4) Absolute antenna gain of the probe antenna
Systematic with Stage 2 (=> cancels) 0 R 3 1 0
5) Base station simulator: uncertainty of the absolute level
1 R 3 1 0.58
6) BER measurement: output level step resolution Step 0.1dB 0.05 R 3 1 0.03
7) Statistical uncertainty of the BER measurement
BER target 10%±2% , 20000 tested bits , N=60 0.12 N 1 1 0.12
8) TRS data rate normalization 4 reference points measured 0.12 N 1 1 0.12
9) Measurement distance a) Offset of DUT phase center
Δd=0.05m 0.14 R 3 1 0.08
10) Quality of quiet zone Standard deviation of E-field in QZ measurement 0.5 N 1 1 0.5
11) DUT sensitivity drift Drift measurement 0.2 R 3 1 0.12
12) a) Uncertainty related to the use of SAM phantom:
Standard SAM with standard tissue simulant 0 R 3 1 0
b) Simulated tissue liquid uncertainty
Maximum allowed error 0.5 R 3 1 0.29
c) Effect of DUT holder Fixed value 0.2 R 3 1 0.12
13) Coarse sampling grid θΔ = 30° and ϕΔ = 30°. 0.15 N N 1 0.15
14) Repeatability Monoblock, clamshell and slide design used for testing 0.5 R 3 1 0.29
STAGE 2 (Calibration)
15) Uncertainty of network analyzer
Manufacturer’s uncertainty calculator, covers NA setup 0.5 R 3
1 0.29
16) Mismatch of transmitter chain
Taken in to account in NA setup uncertainty 0 U 2 1 0
17) Insertion loss of transmitter chain
Systematic with Stage 1 (=> cancels) 0 R 3 1 0
18) Mismatch in the connection of calibration antenna
Taken in to account in NA setup uncertainty 0 R 3 1 0
19) Influence of the feed cable of the calibration antenna
Gain calibration with dipole 0.3 R 3 1 0.17
20) Influence of the probe antenna cable
Systematic with Stage 1 (=> cancels) 0 R 3 1 0
21) Uncertainty of the absolute gain of the probe antenna
Systematic with Stage 1 (=> cancels) 0 R 3 1 0

ETSI
ETSI TS 134 114 V8.2.0 (2009-10)513GPP TS 34.114 version 8.2.0 Release 8
22) Uncertainty of the absolute gain of the calibration antenna
Calibration certificate 0.5 R 3 1 0.29
23) Measurement distance: Calibration antenna’s displacement and misalignment
d=3m, Δd=0.05m, θ=2° 0.29 R 3 1 0.17
24) Quality of quiet zone Standard deviation of E-field in QZ measurement 0.5 N 1 1 0.5
Combined standard uncertainty ∑
=⋅=
m
iiic ucu
1
22 1.17
Expanded uncertainty (Confidence interval of 95 %)
ce uu 96,1=
2.29

ETSI
ETSI TS 134 114 V8.2.0 (2009-10)523GPP TS 34.114 version 8.2.0 Release 8
Annex F (informative): Suggested Recipes of Liquid to be used inside SAM Phantom In Tables F.1 – F.2 are proposed two different recipes of the liquid to be used inside the SAM phantom.
Table F.1. Liquid recipe .
Component Mass % De-ionized Water 57.12 Tween 20 42.30 NaCl 0.58
Table F.2. Liquid recipe
Component Mass % De-ionized Water 54.9 % Diethylene Glycol Butyl Ether (DGBE) (> 99 % pure)
44.92 %
NaCl 0.18 %

ETSI
ETSI TS 134 114 V8.2.0 (2009-10)533GPP TS 34.114 version 8.2.0 Release 8
Annex G (informative): Anechoic Chamber Specifications and Validation Method This Appendix presents the specifications for the shielded anechoic chamber and the validation methods.
G.1 Shielded anechoic chamber specifications To avoid environmental perturbations the measurements shall be performed in a shielded enclosure, preserved from electromagnetic disturbances coming from electromagnetic environment (Radio and TV broadcast, cellular, ISM equipment, etc…). The shielding effectiveness shut be tested according to the EN 50 147-1 standard in the frequency range of 800 MHz up to 4 GHz.
The recommended level of the shielding effectiveness is -100 dB from 800 MHz to 4 GHz.
Testing of the shielding effectiveness can be performed either before or after the installation of absorbers.
G.2 Quiet Zone reflectivity level validation The performance of anechoic chamber is typically evaluated from reflectivity level levelR in the quiet zone. Reflectivity
level is defined as power ratio of all summed reflected signals rP to direct signal dP from antenna:
d
rlevel P
PR log10= .
To evaluate the quiet zone reflectivity level, the contribution of absorbing materials, the antenna positioning system and other constructions in the anechoic chamber should be measured.
To measure accurately quality of the quite zone in anechoic chamber an omni-directional antenna shall be used. Near omni-directional three axes field-probes are available with fibre optic connection thus minimizing cable effects. Because sensitivity of field probe is limited it shall be carefully checked that the field probe is operated at least 6dB above the noise floor of the probe.
Note: The quiet zone evaluation should be performed with the antenna positioning system in its place, in order to include its effect on the reflectivity level.
G.2.1 Description of a practical method for Quiet Zone characterization
In the following, a practical version of the Free Space VSWR method is presented.
In the Free Space VSWR method the quality of quite zone is measured from amplitude ripple caused by reflections inside the anechoic chamber. Phase variation of the direct signal and the reflected signals is obtained by moving a field-probe in the quiet zone. Amplitude ripple in the quiet zone is caused by this phase variation of reflected signals and the direct signal from antenna. The figure 2 below shows seven measuring positions.

ETSI
ETSI TS 134 114 V8.2.0 (2009-10)543GPP TS 34.114 version 8.2.0 Release 8
Figure G.2: Measurement positions with 150mm separation
In each of the seven-measurement position amplitude of power received by field-probe nmeasP [dBm] is measured
where n is index of measuring position. Variance of measurement distance to the antenna from field-probe in different measurement positions can be compensated by following equation:
)log(20l
dPP n
nmeasn +=
where,
nd is distance to point n from the antenna,
l is distance to centre of quiet zone from the antenna
nmeasP is uncorrected measurement value from point n .
The sample standard deviation of the electric field in the quiet zone can be calculated from these distance corrected values or directly from the measured values with the following equation:
( )∑=
−−
=N
ii PP
Ns
1
2
11
where,
N is number of measurements positions
P is dB average of all nP
iP is nP or nmeasP
G.4 Standard deviation of electric field To obtain more accurate picture of quality of quiet zone, measurement described in previous chapter can be done from multiple directions and polarizations. Doing free space VSWR measurement from different directions in 15-degree
separation for elevation and azimuth we get 264 standard deviation values in both polarizations ( pols ,,Φθ ). From these
values average sample standard deviation in electric field in quiet zone can be calculated from equation:

ETSI
ETSI TS 134 114 V8.2.0 (2009-10)553GPP TS 34.114 version 8.2.0 Release 8
2
)sin(2
)sin(2 1 1 1
,,1
,,∑ ∑∑∑= = ==
Θ+Θ=
I
i
I
i
J
jiverji
J
jihorji
freq
sIJ
sIJ
S
ππ
where,
I is number of angular intervals in elevation,
J is number of angular intervals in azimuth and
iΘ is elevation of measurement poljis ,, .
This quiet zone quality measurement should be done at all the frequencies used in measurements, but can be sufficient on all the centre frequencies in the measurement bands but also in this case the Tx and Rx shall be measured separately.

ETSI
ETSI TS 134 114 V8.2.0 (2009-10)563GPP TS 34.114 version 8.2.0 Release 8
Annex H (informative): Bibliography
• P. Boutou, J. Krogerus, J. Ø. Nielsen, T. Bolin, I. Egorov, K. Sulonen, ”Measurement of Radio Performances for UMTS Mobile in Speech Mode: the First Draft of the Prestandard”, COST 273 TD(03) 140, Paris, France, May 2003, 6 p.
• “Feasibility Study of UE antenna efficiency test methods and performance requirement-final report”, 3GPP TSG-RAN4 document TSGR#19(01)1086, September 2001.
• L. M. Correia (editor), ”Wireless Flexible Personalised Communications – Final Report of COST 259”, ISBN: 0-471-49836-X, Wiley Europe, March 2001, 482 p.
• “Development of Standard Test Procedure for 3G User Equipment Antenna Performance”, 3GPP TSG-RAN Working Group 4 (Radio) meeting #23, R4-020724, Gyeongju, Korea, 13th -17th May, 2002.
• IEEE standard 1528; "Recommended Practice for Determining the Peak Spatial-Average Specific Absorption Rate (SAR) in the Human Head from Wireless Communications Devices: Experimental Techniques", December, 2003.
• M.Y. Kanda, M. Ballen, C.K, Chou. “Formulation and characterization of tissue simulating liquids used for SAR measurement (500-2000 MHz)” Asia-Pacific Radio Science Conference, Tokyo, Japan, August 1-4, 2001, p. 274.
• V. Vigneras, “Elaboration and characterization of biological tissues equivalent liquids in the frequency range 0.9-3 GHz”, Final report, PIOM Laboratory, University of Bordeaux, France, November 2001.
• E. Van Lil, D. Trappeniers, J. Verhaevert, A. Van de Capelle, “On the influence of the size of objects on the number of power pattern samples and harmonics”, COST273 TD(04)051.
• J. Krogerus, T. Jääskö, C. Icheln, ”Comparison Measurements of the COST 273 SWG 2.2 Reference Monopole Antennas”, COST273 TD(03)131.
• L. Foged, A. Gandois et. al. “Reference antennas”, Draft report for COST273 SWG2.2 (unpublished), 12.10.2004.
• H. Shapter, J. Krogerus, “Uncertainty in Total Radiated Power measurements”, Presentation in COST273 SWG2.2 Meeting, Helsinki, May 2002, 9 p. + Appendix 9 p., (unpublished).
• J. Krogerus, A. Kruy, H. Shapter, S. Pannetrat, B. Derat, “Estimation of Measurement Uncertainty in Total Radiated Power Measurements”, COST 273 TD(04) 128, Gothenburg, June 2004, 23 p.
• “Guide to the Expression of Uncertainty in Measurement”, International Organization for Standardization (ISO), Geneva, Switzerland 1995.
• NIST Technical Note 1297: “Guidelines for Evaluating and Expressing the Uncertainty of NIST measurement Results”
• IEC: "Guide to the expression of uncertainty in measurement", Ed 1:1995.
• “American National Standard for Expressing Uncertainty - U.S. Guide to the Expression of Uncertainty in Measurement," ANSI/NCSL Z540-2-1997, American National Standards Institute, New York. NY, 1997.
• J. Krogerus, "On the phantom and tissue simulating liquid to be used in handset antenna performance testing", COST 273 TD(02) 024, Guildford, UK, January 2002.
• J. Krogerus, "Phantoms for Terminal Antenna Performance Testing", COST 273 TD(02) 154, Lisbon, Portugal, September 2002, 14 p.
• H. Knoess, M. Christensen, S. Svendsen, T. Hiegler, A. Friederich, “Investigation of Different Phantom Head Models Including Holder”, COST 273 TD(04) 068, Gothenburg, June 2004, 6 p.

ETSI
ETSI TS 134 114 V8.2.0 (2009-10)573GPP TS 34.114 version 8.2.0 Release 8
• Alayon Glazunov, “Impact of Head Phantom Models on Handset Antenna Efficiency Measurement Accuracy in Terms of Body Loss in Passive Mode”, COST273 TD(02)144.
• K. Sulonen, K. Kalliola, P. Vainikainen, "The effect of angular power distribution in different environments and the angular resolution of radiation pattern measurement on antenna performance", COST 273 TD(02) 028, Guildford, UK, January 2002, 7 p.

ETSI
ETSI TS 134 114 V8.2.0 (2009-10)583GPP TS 34.114 version 8.2.0 Release 8
Annex I (informative): Change history Meeting-1st-Level
Doc-1st-Level
CR Rev Subject Cat Version-
Current
Version-New
Doc-2nd-Level
RP-37 RP-070665 - - TS 34.114 for information - - 1.0.0 R5-072420 RP-41 RP-080612 - - New version of 34.114 - 1.0.0 7.0.0 R5-083817 RP-43 RP-090203 0001 - Update of TS 34.114 from Rel-7 to Rel-8 7.0.0 8.0.0 R5-090761 RP-43 RP-090203 0002 - Addition of Band V,VI and VIII minimum & test
requirements to 34.114 8.0.0 8.1.0 R5-090412
RP-45 RP-090813 0003 - TDD UE over the Air conformance testing methodology
- 8.1.0 8.2.0 R5-094961

ETSI
ETSI TS 134 114 V8.2.0 (2009-10)593GPP TS 34.114 version 8.2.0 Release 8
History
Document history
V8.0.0 January 2009 Publication
V8.1.0 April 2009 Publication
V8.2.0 October 2009 Publication