tsunami source of the 2010 mentawai, indonesia earthquake ... · tsunami source of the 2010...
TRANSCRIPT
Tsunami Source of the 2010 Mentawai, Indonesia Earthquake Inferred from Tsunami
Field Survey and Waveform Modeling
KENJI SATAKE,1 YUICHI NISHIMURA,2 PURNA SULASTYA PUTRA,2,3 ADITYA RIADI GUSMAN,2 HARIS SUNENDAR,2
YUSHIRO FUJII,4 YUICHIRO TANIOKA,2 HAMZAH LATIEF,5 and EKO YULIANTO3
Abstract—The 2010 Mentawai earthquake (magnitude 7.7)
generated a destructive tsunami that caused more than 500 casu-
alties in the Mentawai Islands, west of Sumatra, Indonesia.
Seismological analyses indicate that this earthquake was an unu-
sual ‘‘tsunami earthquake,’’ which produces much larger tsunamis
than expected from the seismic magnitude. We carried out a field
survey to measure tsunami heights and inundation distances, an
inversion of tsunami waveforms to estimate the slip distribution on
the fault, and inundation modeling to compare the measured and
simulated tsunami heights. The measured tsunami heights at eight
locations on the west coasts of North and South Pagai Island ranged
from 2.5 to 9.3 m, but were mostly in the 4–7 m range. At three
villages, the tsunami inundation extended more than 300 m.
Interviews of local residents indicated that the earthquake ground
shaking was less intense than during previous large earthquakes
and did not cause any damage. Inversion of tsunami waveforms
recorded at nine coastal tide gauges, a nearby GPS buoy, and a
DART station indicated a large slip (maximum 6.1 m) on a shal-
lower part of the fault near the trench axis, a distribution similar to
other tsunami earthquakes. The total seismic moment estimated
from tsunami waveform inversion was 1.0 9 1021 Nm, which
corresponded to Mw 7.9. Computed coastal tsunami heights from
this tsunami source model using linear equations are similar to the
measured tsunami heights. The inundation heights computed by
using detailed bathymetry and topography data and nonlinear
equations including inundation were smaller than the measured
ones. This may have been partly due to the limited resolution and
accuracy of publically available bathymetry and topography data.
One-dimensional run-up computations using our surveyed topog-
raphy profiles showed that the computed heights were roughly
similar to the measured ones.
Key words: Tsunami, earthquake, Mentawai earthquake,
Indonesia, Indian ocean.
1. Introduction
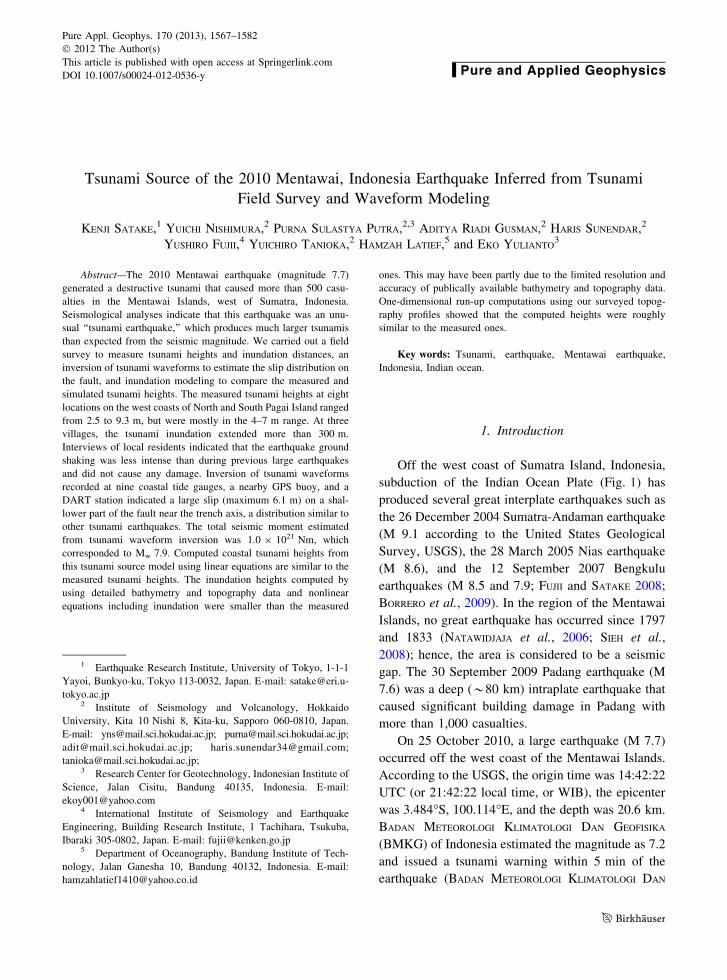
Off the west coast of Sumatra Island, Indonesia,
subduction of the Indian Ocean Plate (Fig. 1) has
produced several great interplate earthquakes such as
the 26 December 2004 Sumatra-Andaman earthquake
(M 9.1 according to the United States Geological
Survey, USGS), the 28 March 2005 Nias earthquake
(M 8.6), and the 12 September 2007 Bengkulu
earthquakes (M 8.5 and 7.9; FUJII and SATAKE 2008;
BORRERO et al., 2009). In the region of the Mentawai
Islands, no great earthquake has occurred since 1797
and 1833 (NATAWIDJAJA et al., 2006; SIEH et al.,
2008); hence, the area is considered to be a seismic
gap. The 30 September 2009 Padang earthquake (M
7.6) was a deep (*80 km) intraplate earthquake that
caused significant building damage in Padang with
more than 1,000 casualties.
On 25 October 2010, a large earthquake (M 7.7)
occurred off the west coast of the Mentawai Islands.
According to the USGS, the origin time was 14:42:22
UTC (or 21:42:22 local time, or WIB), the epicenter
was 3.484�S, 100.114�E, and the depth was 20.6 km.
BADAN METEOROLOGI KLIMATOLOGI DAN GEOFISIKA
(BMKG) of Indonesia estimated the magnitude as 7.2
and issued a tsunami warning within 5 min of the
earthquake (BADAN METEOROLOGI KLIMATOLOGI DAN
1 Earthquake Research Institute, University of Tokyo, 1-1-1
Yayoi, Bunkyo-ku, Tokyo 113-0032, Japan. E-mail: [email protected]
tokyo.ac.jp2 Institute of Seismology and Volcanology, Hokkaido
University, Kita 10 Nishi 8, Kita-ku, Sapporo 060-0810, Japan.
E-mail: [email protected]; [email protected];
[email protected]; [email protected];
[email protected];3 Research Center for Geotechnology, Indonesian Institute of
Science, Jalan Cisitu, Bandung 40135, Indonesia. E-mail:
[email protected] International Institute of Seismology and Earthquake
Engineering, Building Research Institute, 1 Tachihara, Tsukuba,
Ibaraki 305-0802, Japan. E-mail: [email protected] Department of Oceanography, Bandung Institute of Tech-
nology, Jalan Ganesha 10, Bandung 40132, Indonesia. E-mail:
Pure Appl. Geophys. 170 (2013), 1567–1582
� 2012 The Author(s)
This article is published with open access at Springerlink.com
DOI 10.1007/s00024-012-0536-y Pure and Applied Geophysics
GEOFISIKA 2010). Without receiving information of
tsunami damage, they cleared the tsunami warning
52 min after the earthquake.
Seismological analyses indicate that the Menta-
wai earthquake was a ‘‘tsunami earthquake,’’ which
produces much a larger tsunami than expected from
the seismic magnitude. An Indonesian example is the
2006 Java Mw 7.8 earthquake, which triggered a
tsunami with 21-m run-up (FUJII and SATAKE 2006;
FRITZ et al., 2007). As with other tsunami earth-
quakes, the magnitude was larger at longer periods
for the Mentawai earthquake. According to NEWMAN
et al. (2011) and the USGS, the short period body
wave magnitude (mb at *1 s) was 6.5, the high-
frequency energy magnitude (Me-hf at 0.5–2 s) was
6.9, the surface wave (20 s) magnitude (Ms) was 7.3,
the energy magnitude (Me up to 100 s) was 7.3, and
the moment magnitude (Mw) from the Centroid
Moment Tensor inversion using longer waves
(*150 s, Global CMT) or W phase (100–1,000 s)
was 7.8. The tsunami magnitude (Mt) computed from
tsunami amplitudes at 15 tide gauges yielded 8.1. The
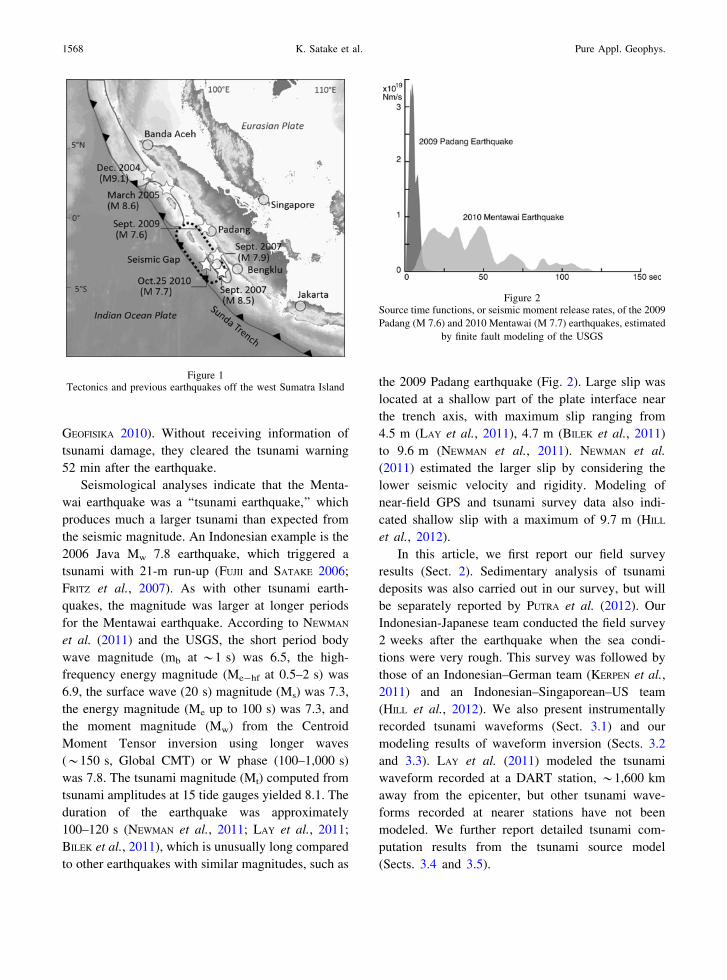
duration of the earthquake was approximately
100–120 s (NEWMAN et al., 2011; LAY et al., 2011;
BILEK et al., 2011), which is unusually long compared
to other earthquakes with similar magnitudes, such as
the 2009 Padang earthquake (Fig. 2). Large slip was
located at a shallow part of the plate interface near
the trench axis, with maximum slip ranging from
4.5 m (LAY et al., 2011), 4.7 m (BILEK et al., 2011)
to 9.6 m (NEWMAN et al., 2011). NEWMAN et al.
(2011) estimated the larger slip by considering the
lower seismic velocity and rigidity. Modeling of
near-field GPS and tsunami survey data also indi-
cated shallow slip with a maximum of 9.7 m (HILL
et al., 2012).
In this article, we first report our field survey
results (Sect. 2). Sedimentary analysis of tsunami
deposits was also carried out in our survey, but will
be separately reported by PUTRA et al. (2012). Our
Indonesian-Japanese team conducted the field survey
2 weeks after the earthquake when the sea condi-
tions were very rough. This survey was followed by
those of an Indonesian–German team (KERPEN et al.,
2011) and an Indonesian–Singaporean–US team
(HILL et al., 2012). We also present instrumentally
recorded tsunami waveforms (Sect. 3.1) and our
modeling results of waveform inversion (Sects. 3.2
and 3.3). LAY et al. (2011) modeled the tsunami
waveform recorded at a DART station, *1,600 km
away from the epicenter, but other tsunami wave-
forms recorded at nearer stations have not been
modeled. We further report detailed tsunami com-
putation results from the tsunami source model
(Sects. 3.4 and 3.5).
Figure 1Tectonics and previous earthquakes off the west Sumatra Island
Figure 2Source time functions, or seismic moment release rates, of the 2009
Padang (M 7.6) and 2010 Mentawai (M 7.7) earthquakes, estimated
by finite fault modeling of the USGS
1568 K. Satake et al. Pure Appl. Geophys.
2. Tsunami Survey and Coastal Tsunami Heights
2.1. Method
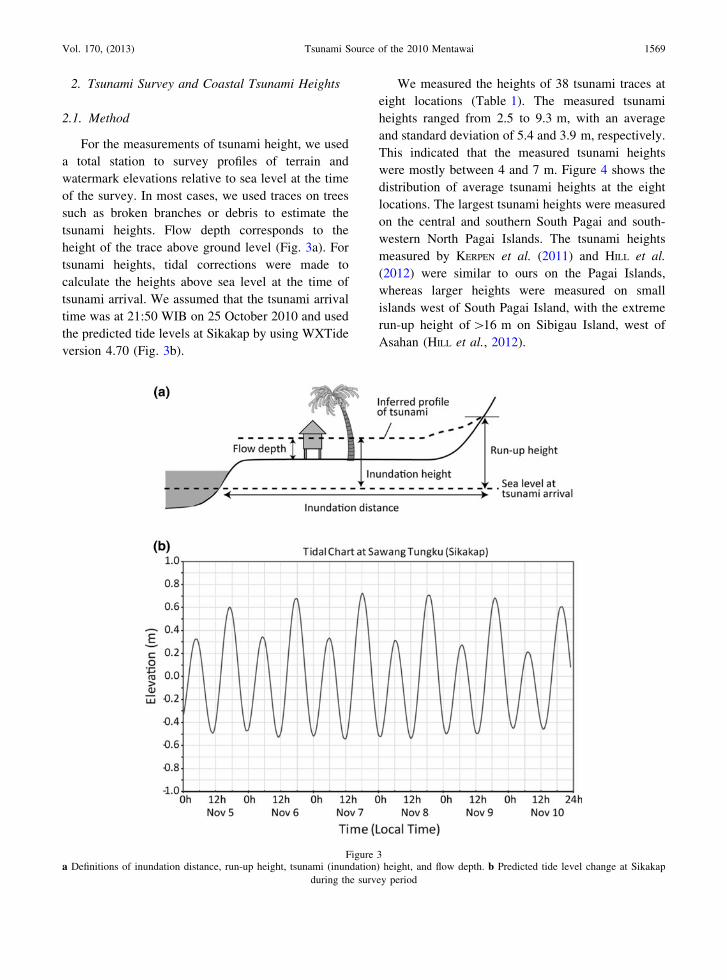
For the measurements of tsunami height, we used
a total station to survey profiles of terrain and
watermark elevations relative to sea level at the time
of the survey. In most cases, we used traces on trees
such as broken branches or debris to estimate the
tsunami heights. Flow depth corresponds to the
height of the trace above ground level (Fig. 3a). For
tsunami heights, tidal corrections were made to
calculate the heights above sea level at the time of
tsunami arrival. We assumed that the tsunami arrival
time was at 21:50 WIB on 25 October 2010 and used
the predicted tide levels at Sikakap by using WXTide
version 4.70 (Fig. 3b).
We measured the heights of 38 tsunami traces at
eight locations (Table 1). The measured tsunami
heights ranged from 2.5 to 9.3 m, with an average
and standard deviation of 5.4 and 3.9 m, respectively.
This indicated that the measured tsunami heights
were mostly between 4 and 7 m. Figure 4 shows the
distribution of average tsunami heights at the eight
locations. The largest tsunami heights were measured
on the central and southern South Pagai and south-
western North Pagai Islands. The tsunami heights
measured by KERPEN et al. (2011) and HILL et al.
(2012) were similar to ours on the Pagai Islands,
whereas larger heights were measured on small
islands west of South Pagai Island, with the extreme
run-up height of [16 m on Sibigau Island, west of
Asahan (HILL et al., 2012).
Figure 3a Definitions of inundation distance, run-up height, tsunami (inundation) height, and flow depth. b Predicted tide level change at Sikakap
during the survey period
Vol. 170, (2013) Tsunami Source of the 2010 Mentawai 1569

3. Tsunami Height Distributions
3.1. Asahan and Purorougat
On the Asahan coast, facing the mouth of a *2-
km-wide bay on the west coast of South Pagai Island,
a large coral boulder (*1 m diameter) was trans-
ported *70 m beyond a beach ridge of *3 m
altitude. Traces on trees indicated tsunami heights
of 6.4–9.3 m, with an average of 7.4 m (Fig. 6a).
These were the largest tsunami heights measured by
our survey. On the contrary, in Asahan village,
located near the head of the bay, no tsunami damage
occurred. At Purorougat, facing a smaller (*0.5 km
wide), U-shaped bay, the tsunami washed away most
houses, and 75 out of 235 residents lost their lives. A
trace on a tree indicated a flow depth of *5.5 m.
Table 1
Tsunami heights measured by the field survey
Site Latitude Longitude Tsunami
height
Run-up
height
Flow
depth
Inundation
distance
Date Local
time
Mark
(m) (m) (m) (m) (hours)
1 Asahan 03�0301800S 100�1401300E 6.4 6.0 41 06-Nov-2010 1424 BB
2 Asahan 03�0301800S 100�1401300E 9.3 38 06-Nov-2010 1424 BB
3 Asahan 03�0301800S 100�1401300E 6.6 6.6 9 06-Nov-2010 1424 BB
4 Purorougat 03�0201200S 100�1305500E 5.5 06-Nov-2010 BB
5 Lopon Lakau 03�1203900S 100�2100200E 2.5 23 07-Nov-2010 0840 BB
6 Maonai 03�1103100S 100�2004100E 6.8 3.9 259 07-Nov-2010 1130 BB
7 Maonai 03�1103300S 100�2003800E 6.9 3.8 182 07-Nov-2010 1130 RD
8 Maonai 03�1103400S 100�2003900E 6.7 3.6 181 07-Nov-2010 1130 BB
9 Maonai 03�1103600S 100�2003900E 6.7 3.5 206 07-Nov-2010 1130 BB
10 Maonai 03�1103000S 100�2004200E 7.3 0.0 315 07-Nov-2010 1130 ER, EW
11 Sabeu Gunggung 02�4805900S 100�0302900E 5.0 3.9 31 08-Nov-2010 0900 BB
12 Sabeu Gunggung 02�4805700S 100�0302800E 5.8 3.9 75 08-Nov-2010 0900 BB
13 Sabeu Gunggung 02�4805700S 100�0302800E 7.0 4.8 75 08-Nov-2010 0900 BB
14 Sabeu Gunggung 02�4805200S 100�0302800E 4.3 4.3 217 08-Nov-2010 0900 BB
15 Muntei 02�4904600S 100�0504600E 5.7 3.8 287 08-Nov-2010 1411 BB
16 Muntei 02�4904600S 100�0504600E 4.6 1.6 241 08-Nov-2010 1411 BB
17 Muntei 02�4905300S 100�0504100E 4.6 3.4 3 08-Nov-2010 1411 BB
18 Muntei 02�4904600S 100�0504600E 7.8 5.7 265 08-Nov-2010 1411 BB
19 Muntei 02�4905300S 100�0504400E 4.6 3.0 76 08-Nov-2010 1411 BB
20 Muntei 02�4905300S 100�0504400E 4.6 3.0 89 08-Nov-2010 1411 RD
21 Muntei 02�4905300S 100�0504700E 5.1 3.6 133 08-Nov-2010 1411 BB
22 Muntei 02�4904200S 100�0504800E 4.8 0.0 423 08-Nov-2010 1411 SD
23 Muntei 02�4905000S 100�0503200E 8.8 08-Nov-2010 1628 BB
24 Muntei 02�4905600S 100�0503000E 6.8 08-Nov-2010 1628 RD
25 Muntei 02�4905700S 100�0502900E 4.5 08-Nov-2010 1628 BB
26 Macaroni 02�4603700S 99�5805900E 4.6 3.0 20 09-Nov-2010 0905 BB
27 Macaroni 00�4603700S 99�5805900E 4.9 3.8 19 09-Nov-2010 0905 BB
28 Macaroni 02�4604000S 99�5805700E 2.9 1.2 70 09-Nov-2010 0905 MO
29 Macaroni 02�4604000S 99�5805700E 2.9 1.2 77 09-Nov-2010 0905 MO
30 Macaroni 02�4604100S 99�5805800E 3.0 1.2 115 09-Nov-2010 0905 MO
31 Macaroni 02�4604100S 99�5900100E 3.8 2.7 177 09-Nov-2010 0905 BB
32 Macaroni 02�4604000S 99�5900000E 4.8 3.3 160 09-Nov-2010 0905 BB
33 Macaroni 02�4604000S 99�5900000E 5.4 4.0 166 09-Nov-2010 0905 BB
34 Tumalei 02�3702700S 99�5804800E 4.0 6 09-Nov-2010 1339 BB
35 Tumalei 02�3702700S 99�5804800E 5.2 9 09-Nov-2010 1339 BB
36 Tumalei 02�3703000S 99�5805000E 4.6 0.0 136 09-Nov-2010 1339 SD, ER
37 Tumalei 02�3702500S 99�5804500E 4.7 46 09-Nov-2010 1425 BB
38 Tumalei 02�3702500S 99�5804500E 5.5 36 09-Nov-2010 1425 BB
39 Tumalei 02�3702600S 99�5804600E 6.1 20 09-Nov-2010 1444 BB
BB broken branch, ER erosion, MO mudline outside, RD rafted debris, SD sediment deposit
1570 K. Satake et al. Pure Appl. Geophys.

3.2. Lopon Lakau
Located in a bay *2 km wide on the southwest
coast of South Pagai Island, Lopon Lakau (a logging
port) was damaged by the tsunami. Numerous coral
boulders were found on the beach, and a trace on a
tree indicated a 2.5-m tsunami height. At Lakau
village, an eyewitness recounted that the ground
shaking was strong enough for him to be awakened.
Having heard an airplane-like loud noise, villagers
escaped inland, and all survived.
3.3. Maonai
Located at the end of a U-shaped bay (*0.5 km
wide) on the southwest coast of South Pagai Island,
this village also suffered significantly from the
tsunami. On both sides of the bay, the tsunami
deposited numerous large (*2 m diameter) coral
boulders. The inundation distance was [470 m. Five
measurements of traces on trees indicated that the
tsunami heights were 6.7–7.3 m, with an average of
6.9 m (Fig. 5a). The flow depth ranged from 3.5 to
3.9 m. The entire village was washed away (Fig. 6b),
and the casualties were 38 out of the original
population of 139.
3.4. Sabeu Gunggung
Located on the end of a U-shaped bay (*3 km
wide) on the southwestern coast of North Pagai Island,
this village suffered significantly from the tsunami. We
surveyed a profile up to *300 m from the coast, but
could not reach the inundation limit because of the
river in the back of the village. The tsunami height was
4.3–7.0 m (average of four measurements was 5.5 m)
measured on a surface *2 m above the sea level
(Fig. 5b). The flow depth ranged from 3.9 to 4.8 m.
There had been 65 houses, but none remained. Of the
original population of 260, 120 people lost their lives
(Fig. 6c). According to a survivor, ground shaking was
not strong, and he escaped after hearing a loud
sound *5 min after the shaking. Some people were
watching TV and saw running text of a tsunami
warning, but the tsunami was arriving at that time.
3.5. Muntei Barubaru
Located *5 km SE of Sabeu Gunggung, this
village faces into a small V-shaped bay approximately
1 km wide. The inundation distance was *420 m,
with a run-up height of 4.8 m: the tsunami heights
ranged from 4.6 to 5.7 m with one exceptional
measurement of 7.8 m (Fig. 5c). The average of the
eight measurements was 5.2 m. Many large (*2 m
diameter) coral boulders were also transported onto
land, and the entire village was washed away (Fig. 6d).
Of the original population of 310, 149 lost their lives.
On the opposite (western) side of the bay, traces on trees
indicate tsunami heights ranging from 3.9 to 8.8 m,
with an average of 6.0 m of the four measurements.
3.6. Macaronis Resort
Located on a *2-km-long peninsula, extending in
the SW direction, at the western tip of North Pagai
Island, this resort consisted of a main hotel tower
(Fig. 6e), several single-story buildings, and beach
cottages. The main tower was damaged on the ground
floor; however, it remained standing while the second
and higher floors provided shelter for approximately 20
Figure 4Map showing the location of survey sites (white squares). The
average tsunami height at each location is shown by gray bars. For
Muntei, two bars (in the village and the outer coasts) are shown.
Locations (according to USGS) of the mainshock (black triangle)
and aftershocks (gray circles), which occurred within 1 day of the
mainshock, are also shown
Vol. 170, (2013) Tsunami Source of the 2010 Mentawai 1571
guests, all of whom survived. The cottages on the beach
were all washed away, and the buildings were also
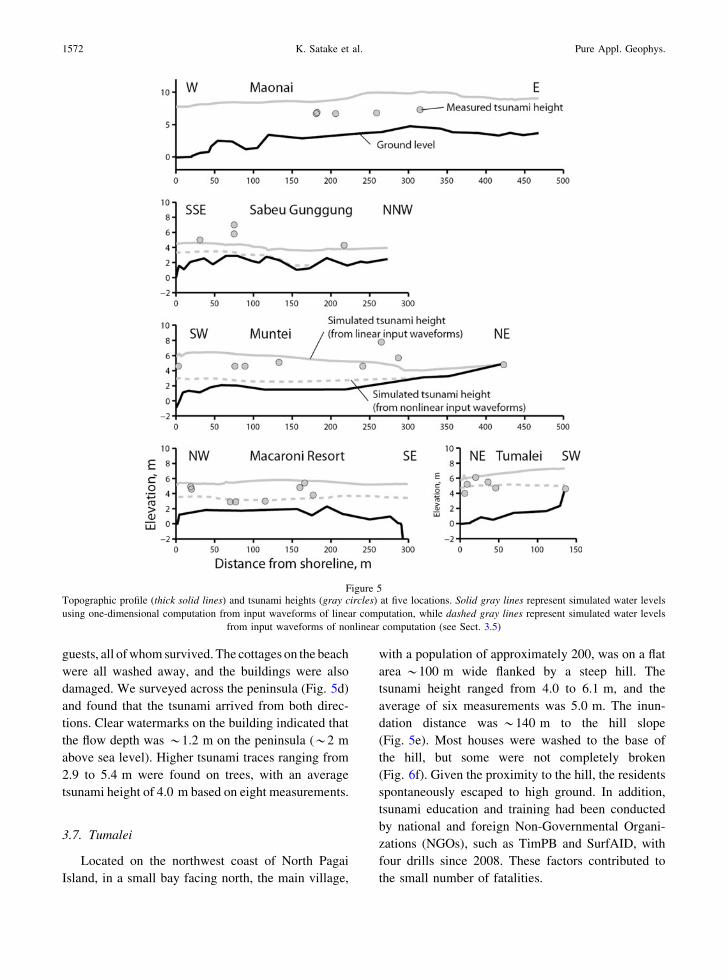
damaged. We surveyed across the peninsula (Fig. 5d)
and found that the tsunami arrived from both direc-
tions. Clear watermarks on the building indicated that
the flow depth was *1.2 m on the peninsula (*2 m
above sea level). Higher tsunami traces ranging from
2.9 to 5.4 m were found on trees, with an average
tsunami height of 4.0 m based on eight measurements.
3.7. Tumalei
Located on the northwest coast of North Pagai
Island, in a small bay facing north, the main village,
with a population of approximately 200, was on a flat
area *100 m wide flanked by a steep hill. The
tsunami height ranged from 4.0 to 6.1 m, and the
average of six measurements was 5.0 m. The inun-
dation distance was *140 m to the hill slope
(Fig. 5e). Most houses were washed to the base of
the hill, but some were not completely broken
(Fig. 6f). Given the proximity to the hill, the residents
spontaneously escaped to high ground. In addition,
tsunami education and training had been conducted
by national and foreign Non-Governmental Organi-
zations (NGOs), such as TimPB and SurfAID, with
four drills since 2008. These factors contributed to
the small number of fatalities.
Figure 5Topographic profile (thick solid lines) and tsunami heights (gray circles) at five locations. Solid gray lines represent simulated water levels
using one-dimensional computation from input waveforms of linear computation, while dashed gray lines represent simulated water levels
from input waveforms of nonlinear computation (see Sect. 3.5)
1572 K. Satake et al. Pure Appl. Geophys.

4. Tsunami Modeling
4.1. Observed Tsunami Waveforms
The tsunami was recorded at more than ten tide
gauge stations around the Indian Ocean, including
four tide gauge stations in Indonesia (Padang, Engg-
ano, Tanahbala, and Telukdalam; Fig. 7). In addition,
the tsunami was recorded on a surface GPS buoy
(GITEWS SUMATRA-03) located off Mentawai just
west of the source area and a DART station
Figure 6Photographs of the effects of the tsunami at: a Asahan, b Maonai, c Sabeu Gunggung, d Muntei, e Macaroni Resort, and f Tumalei
Vol. 170, (2013) Tsunami Source of the 2010 Mentawai 1573
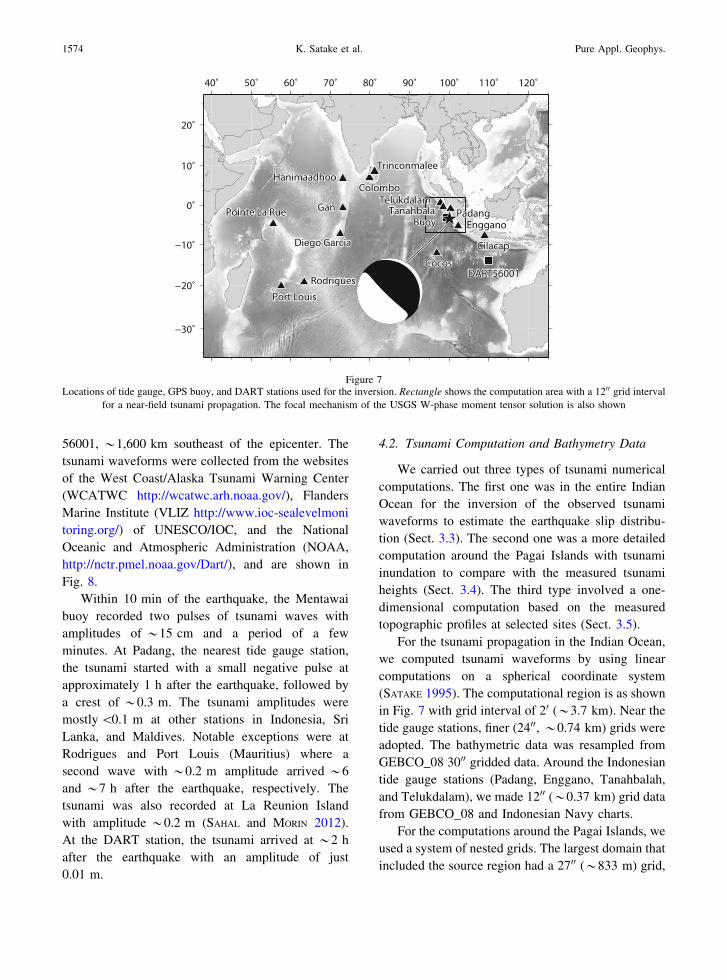
56001, *1,600 km southeast of the epicenter. The
tsunami waveforms were collected from the websites
of the West Coast/Alaska Tsunami Warning Center
(WCATWC http://wcatwc.arh.noaa.gov/), Flanders
Marine Institute (VLIZ http://www.ioc-sealevelmoni
toring.org/) of UNESCO/IOC, and the National
Oceanic and Atmospheric Administration (NOAA,
http://nctr.pmel.noaa.gov/Dart/), and are shown in
Fig. 8.
Within 10 min of the earthquake, the Mentawai
buoy recorded two pulses of tsunami waves with
amplitudes of *15 cm and a period of a few
minutes. At Padang, the nearest tide gauge station,
the tsunami started with a small negative pulse at
approximately 1 h after the earthquake, followed by
a crest of *0.3 m. The tsunami amplitudes were
mostly \0.1 m at other stations in Indonesia, Sri
Lanka, and Maldives. Notable exceptions were at
Rodrigues and Port Louis (Mauritius) where a
second wave with *0.2 m amplitude arrived *6
and *7 h after the earthquake, respectively. The
tsunami was also recorded at La Reunion Island
with amplitude *0.2 m (SAHAL and MORIN 2012).
At the DART station, the tsunami arrived at *2 h
after the earthquake with an amplitude of just
0.01 m.
4.2. Tsunami Computation and Bathymetry Data
We carried out three types of tsunami numerical
computations. The first one was in the entire Indian
Ocean for the inversion of the observed tsunami
waveforms to estimate the earthquake slip distribu-
tion (Sect. 3.3). The second one was a more detailed
computation around the Pagai Islands with tsunami
inundation to compare with the measured tsunami
heights (Sect. 3.4). The third type involved a one-
dimensional computation based on the measured
topographic profiles at selected sites (Sect. 3.5).
For the tsunami propagation in the Indian Ocean,
we computed tsunami waveforms by using linear
computations on a spherical coordinate system
(SATAKE 1995). The computational region is as shown
in Fig. 7 with grid interval of 20 (*3.7 km). Near the
tide gauge stations, finer (2400, *0.74 km) grids were
adopted. The bathymetric data was resampled from
GEBCO_08 3000 gridded data. Around the Indonesian
tide gauge stations (Padang, Enggano, Tanahbalah,
and Telukdalam), we made 1200 (*0.37 km) grid data
from GEBCO_08 and Indonesian Navy charts.
For the computations around the Pagai Islands, we
used a system of nested grids. The largest domain that
included the source region had a 2700 (*833 m) grid,
Figure 7Locations of tide gauge, GPS buoy, and DART stations used for the inversion. Rectangle shows the computation area with a 1200 grid interval
for a near-field tsunami propagation. The focal mechanism of the USGS W-phase moment tensor solution is also shown
1574 K. Satake et al. Pure Appl. Geophys.

Figure 8Tsunami waveforms recorded at the coastal tide gauge, GPS buoy, and DART stations (black solid curves), and computed from our final
model (gray dashed curves). The locations of the gauges are shown in Fig. 7. Thick gray bars above the time axis indicate the time range used
in the inversions to match the observed and synthetic waveforms. The waveforms at stations without bars (Cilacap, Trinconmalee, Rodrigues,
Port Luis and Point La Rue) are not used for inversion
Vol. 170, (2013) Tsunami Source of the 2010 Mentawai 1575
while the finest domain had a 100 (*30 m) grid. For
the coarser domains (2700 and 900), the linear shallow-
water equations were used, while at the finer domains
(300 and 100), both linear computation and nonlinear
computation with inundation were made. For these
detailed computations, we merged ETOPO1 data
with Indonesian Navy chart data at the 200-m contour
depth, and modified the coastline and SRTM data, as
described below.
For the one-dimensional tsunami inundation sim-
ulations along the surveyed transect lines, the
nonlinear shallow-water equations were solved using
a finite difference scheme in the Cartesian coordinate
system (GUSMAN et al., 2012). For this computation,
tsunami waveforms computed in the detailed simu-
lation at points several hundreds meters from the
shoreline at a water depth of *5 m were used as
input waveforms. Tsunami inundation along a sur-
veyed topographic profile was computed with a 1-m
grid size.
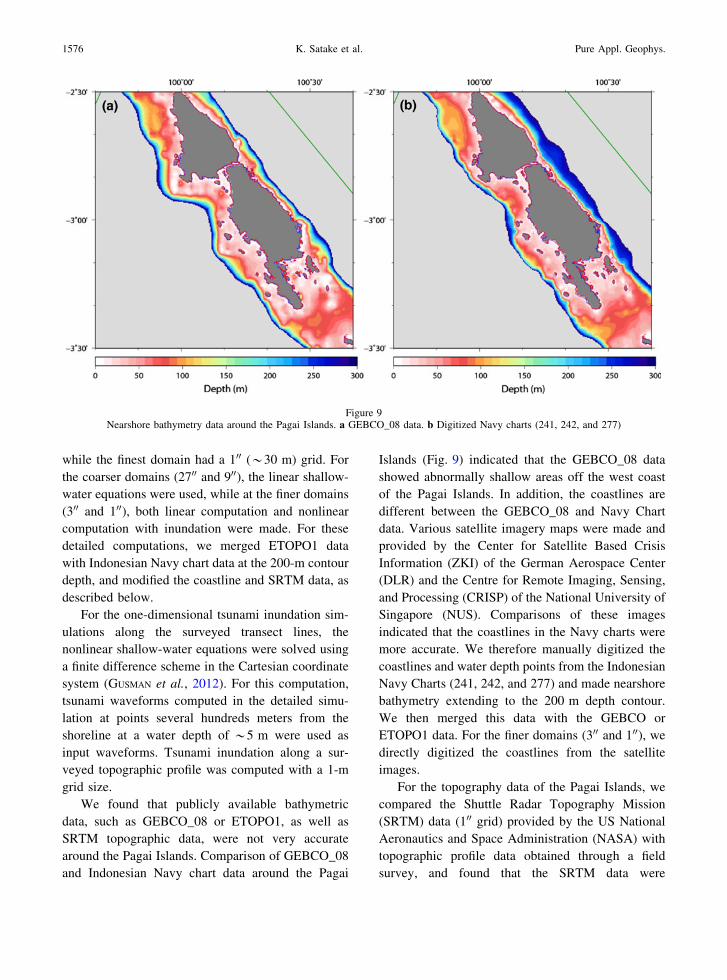
We found that publicly available bathymetric
data, such as GEBCO_08 or ETOPO1, as well as
SRTM topographic data, were not very accurate
around the Pagai Islands. Comparison of GEBCO_08
and Indonesian Navy chart data around the Pagai
Islands (Fig. 9) indicated that the GEBCO_08 data
showed abnormally shallow areas off the west coast
of the Pagai Islands. In addition, the coastlines are
different between the GEBCO_08 and Navy Chart
data. Various satellite imagery maps were made and
provided by the Center for Satellite Based Crisis
Information (ZKI) of the German Aerospace Center
(DLR) and the Centre for Remote Imaging, Sensing,
and Processing (CRISP) of the National University of
Singapore (NUS). Comparisons of these images
indicated that the coastlines in the Navy charts were
more accurate. We therefore manually digitized the
coastlines and water depth points from the Indonesian
Navy Charts (241, 242, and 277) and made nearshore
bathymetry extending to the 200 m depth contour.
We then merged this data with the GEBCO or
ETOPO1 data. For the finer domains (300 and 100), we
directly digitized the coastlines from the satellite
images.
For the topography data of the Pagai Islands, we
compared the Shuttle Radar Topography Mission
(SRTM) data (100 grid) provided by the US National
Aeronautics and Space Administration (NASA) with
topographic profile data obtained through a field
survey, and found that the SRTM data were
Figure 9Nearshore bathymetry data around the Pagai Islands. a GEBCO_08 data. b Digitized Navy charts (241, 242, and 277)
1576 K. Satake et al. Pure Appl. Geophys.

consistently higher by several meters, likely because
of the vegetation effects. Therefore, we reduced 7 m
in elevation from the SRTM data to form the
topography data and then merged this with the
bathymetry data.
4.3. Tsunami Inversion and Slip Distribution
We estimated the slip distribution on the fault
plane through the inversion of tsunami waveforms.
We divided the tsunami source area into 28 subfaults
and located them on the source area. The strike and
rake were estimated from USGS W phase solution
(Fig. 7), while the dip angles were assumed to be 7.5�and 12� for shallower and deeper subfaults, following
the seismic reflection images of SINGH et al., (2011).
The fault parameters are given in Table 2. We
computed the seafloor deformation for a unit slip on
each subfault by using the formula of OKADA (1985).
The effect of horizontal movements for the seafloor
slope (TANIOKA and SATAKE 1996) was also consid-
ered. We used the computed seafloor deformation as
an initial condition to compute the tsunami wave-
forms at tide gauge, GPS buoy, and DART locations.
We used them as Green’s functions for the inversion.
The details of tsunami computations and inversion
are described in (FUJII and SATAKE 2007). We
weighted the DART data ten times, because the
amplitudes were smaller (note that the vertical scale
in Fig. 8 is 10 times smaller). In addition, we
weighted the nearby buoy data and initial part of
the Padang waveforms as twice as large as the other
stations to obtain a better match between the
observed and computed wavefroms (Fig. 8). We did
not use the waveforms at Rodrigues and Port Louis,
because the computed and observed travel times do
not match well, probably because of the large
distance and dispersion effects.
The result of the waveform inversion is shown in
Fig. 10a and Table 2. This shows that most slip
Table 2
Fault parameters and slip amounts of subfaults for the inversion
No. Length (km) Width (km) Depth (km) Strike (deg) Dip (deg) Rake (deg) Slip (m) Lat (deg) Long (deg)
1 30 30 2 326 7.5 101 1.83 -4.34144 100.10976
2 30 30 2 326 7.5 101 0.00 -4.11777 99.95845
3 30 30 2 326 7.5 101 1.16 -3.89410 99.80719
4 30 30 2 326 7.5 101 6.10 -3.67043 99.65597
5 30 30 2 326 7.5 101 0.00 -3.44675 99.50480
6 30 30 2 326 7.5 101 3.81 -3.22308 99.35366
7 30 30 2 326 7.5 101 1.02 -2.99941 99.20255
8 30 30 5.92 326 7.5 101 0.14 -4.19186 100.33215
9 30 30 5.92 326 7.5 101 3.25 -3.96819 100.18078
10 30 30 5.92 326 7.5 101 3.06 -3.74452 100.02946
11 30 30 5.92 326 7.5 101 3.01 -3.52085 99.87819
12 30 30 5.92 326 7.5 101 3.79 -3.29718 99.72696
13 30 30 5.92 326 7.5 101 4.96 -3.07351 99.57577
14 30 30 5.92 326 7.5 101 0.00 -2.84983 99.42461
15 30 30 9.83 326 12 101 0.00 -4.04228 100.55451
16 30 30 9.83 326 12 101 0.00 -3.81861 100.40307
17 30 30 9.83 326 12 101 0.00 -3.59494 100.25170
18 30 30 9.83 326 12 101 0.00 -3.37127 100.10037
19 30 30 9.83 326 12 101 3.34 -3.14760 99.94908
20 30 30 9.83 326 12 101 0.00 -2.92393 99.79784
21 30 30 9.83 326 12 101 0.42 -2.70026 99.64665
22 30 30 16.07 326 12 101 1.97 -3.89471 100.77383
23 30 30 16.07 326 12 101 0.00 -3.67104 100.62234
24 30 30 16.07 326 12 101 0.00 -3.44737 100.47091
25 30 30 16.07 326 12 101 0.12 -3.22370 100.31953
26 30 30 16.07 326 12 101 0.00 -3.00003 100.16820
27 30 30 16.07 326 12 101 0.00 -2.77636 100.01691
28 30 30 16.07 326 12 101 0.00 -2.55268 99.86567
Vol. 170, (2013) Tsunami Source of the 2010 Mentawai 1577
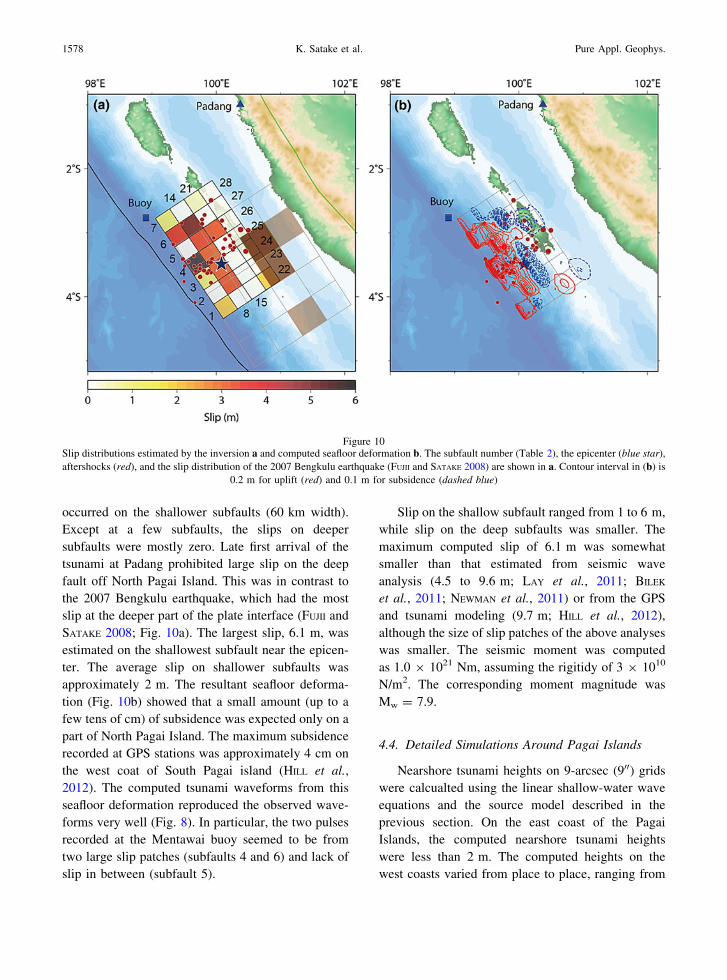
occurred on the shallower subfaults (60 km width).
Except at a few subfaults, the slips on deeper
subfaults were mostly zero. Late first arrival of the
tsunami at Padang prohibited large slip on the deep
fault off North Pagai Island. This was in contrast to
the 2007 Bengkulu earthquake, which had the most
slip at the deeper part of the plate interface (FUJII and
SATAKE 2008; Fig. 10a). The largest slip, 6.1 m, was
estimated on the shallowest subfault near the epicen-
ter. The average slip on shallower subfaults was
approximately 2 m. The resultant seafloor deforma-
tion (Fig. 10b) showed that a small amount (up to a
few tens of cm) of subsidence was expected only on a
part of North Pagai Island. The maximum subsidence
recorded at GPS stations was approximately 4 cm on
the west coat of South Pagai island (HILL et al.,
2012). The computed tsunami waveforms from this
seafloor deformation reproduced the observed wave-
forms very well (Fig. 8). In particular, the two pulses
recorded at the Mentawai buoy seemed to be from
two large slip patches (subfaults 4 and 6) and lack of
slip in between (subfault 5).
Slip on the shallow subfault ranged from 1 to 6 m,
while slip on the deep subfaults was smaller. The
maximum computed slip of 6.1 m was somewhat
smaller than that estimated from seismic wave
analysis (4.5 to 9.6 m; LAY et al., 2011; BILEK
et al., 2011; NEWMAN et al., 2011) or from the GPS
and tsunami modeling (9.7 m; HILL et al., 2012),
although the size of slip patches of the above analyses
was smaller. The seismic moment was computed
as 1.0 9 1021 Nm, assuming the rigitidy of 3 9 1010
N/m2. The corresponding moment magnitude was
Mw = 7.9.
4.4. Detailed Simulations Around Pagai Islands
Nearshore tsunami heights on 9-arcsec (900) grids
were calcualted using the linear shallow-water wave
equations and the source model described in the
previous section. On the east coast of the Pagai
Islands, the computed nearshore tsunami heights
were less than 2 m. The computed heights on the
west coasts varied from place to place, ranging from
Figure 10Slip distributions estimated by the inversion a and computed seafloor deformation b. The subfault number (Table 2), the epicenter (blue star),
aftershocks (red), and the slip distribution of the 2007 Bengkulu earthquake (FUJII and SATAKE 2008) are shown in a. Contour interval in (b) is
0.2 m for uplift (red) and 0.1 m for subsidence (dashed blue)
1578 K. Satake et al. Pure Appl. Geophys.
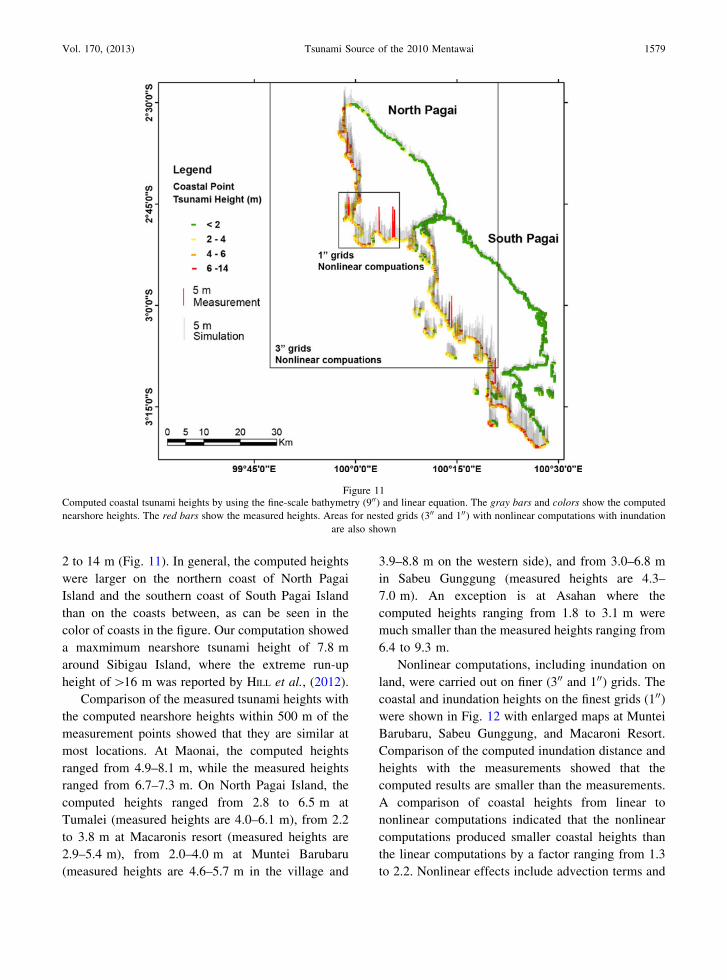
2 to 14 m (Fig. 11). In general, the computed heights
were larger on the northern coast of North Pagai
Island and the southern coast of South Pagai Island
than on the coasts between, as can be seen in the
color of coasts in the figure. Our computation showed
a maxmimum nearshore tsunami height of 7.8 m
around Sibigau Island, where the extreme run-up
height of [16 m was reported by HILL et al., (2012).
Comparison of the measured tsunami heights with
the computed nearshore heights within 500 m of the
measurement points showed that they are similar at
most locations. At Maonai, the computed heights
ranged from 4.9–8.1 m, while the measured heights
ranged from 6.7–7.3 m. On North Pagai Island, the
computed heights ranged from 2.8 to 6.5 m at
Tumalei (measured heights are 4.0–6.1 m), from 2.2
to 3.8 m at Macaronis resort (measured heights are
2.9–5.4 m), from 2.0–4.0 m at Muntei Barubaru
(measured heights are 4.6–5.7 m in the village and
3.9–8.8 m on the western side), and from 3.0–6.8 m
in Sabeu Gunggung (measured heights are 4.3–
7.0 m). An exception is at Asahan where the
computed heights ranging from 1.8 to 3.1 m were
much smaller than the measured heights ranging from
6.4 to 9.3 m.
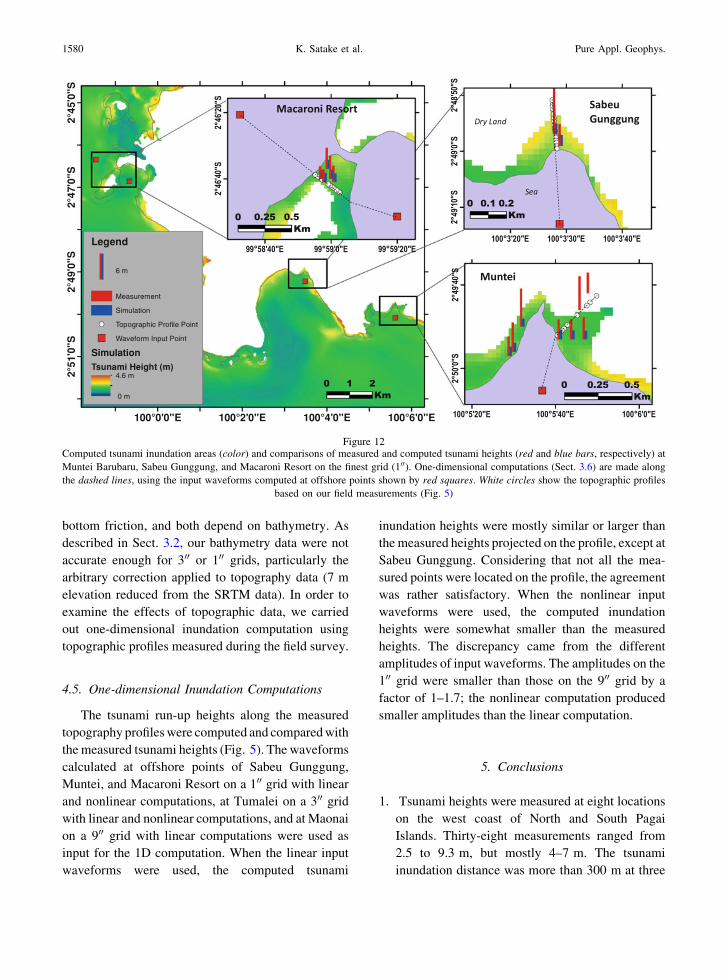
Nonlinear computations, including inundation on
land, were carried out on finer (300 and 100) grids. The
coastal and inundation heights on the finest grids (100)
were shown in Fig. 12 with enlarged maps at Muntei
Barubaru, Sabeu Gunggung, and Macaroni Resort.
Comparison of the computed inundation distance and
heights with the measurements showed that the
computed results are smaller than the measurements.
A comparison of coastal heights from linear to
nonlinear computations indicated that the nonlinear
computations produced smaller coastal heights than
the linear computations by a factor ranging from 1.3
to 2.2. Nonlinear effects include advection terms and
Figure 11Computed coastal tsunami heights by using the fine-scale bathymetry (900) and linear equation. The gray bars and colors show the computed
nearshore heights. The red bars show the measured heights. Areas for nested grids (300 and 100) with nonlinear computations with inundation
are also shown
Vol. 170, (2013) Tsunami Source of the 2010 Mentawai 1579
bottom friction, and both depend on bathymetry. As
described in Sect. 3.2, our bathymetry data were not
accurate enough for 300 or 100 grids, particularly the
arbitrary correction applied to topography data (7 m
elevation reduced from the SRTM data). In order to
examine the effects of topographic data, we carried
out one-dimensional inundation computation using
topographic profiles measured during the field survey.
4.5. One-dimensional Inundation Computations
The tsunami run-up heights along the measured
topography profiles were computed and compared with
the measured tsunami heights (Fig. 5). The waveforms
calculated at offshore points of Sabeu Gunggung,
Muntei, and Macaroni Resort on a 100 grid with linear
and nonlinear computations, at Tumalei on a 300 grid
with linear and nonlinear computations, and at Maonai
on a 900 grid with linear computations were used as
input for the 1D computation. When the linear input
waveforms were used, the computed tsunami
inundation heights were mostly similar or larger than
the measured heights projected on the profile, except at
Sabeu Gunggung. Considering that not all the mea-
sured points were located on the profile, the agreement
was rather satisfactory. When the nonlinear input
waveforms were used, the computed inundation
heights were somewhat smaller than the measured
heights. The discrepancy came from the different
amplitudes of input waveforms. The amplitudes on the
100 grid were smaller than those on the 900 grid by a
factor of 1–1.7; the nonlinear computation produced
smaller amplitudes than the linear computation.
5. Conclusions
1. Tsunami heights were measured at eight locations
on the west coast of North and South Pagai
Islands. Thirty-eight measurements ranged from
2.5 to 9.3 m, but mostly 4–7 m. The tsunami
inundation distance was more than 300 m at three
100°6'0"E100°4'0"E100°2'0"E100°0'0"E
2°45
'0"S
2°47
'0"S
2°49
'0"S
2°51
'0"S
Legend
Measurement
Simulation
Topographic Profile Point
Waveform Input Point
SimulationTsunami Height (m)
4.6 m 0 m
6 m
Figure 12Computed tsunami inundation areas (color) and comparisons of measured and computed tsunami heights (red and blue bars, respectively) at
Muntei Barubaru, Sabeu Gunggung, and Macaroni Resort on the finest grid (100). One-dimensional computations (Sect. 3.6) are made along
the dashed lines, using the input waveforms computed at offshore points shown by red squares. White circles show the topographic profiles
based on our field measurements (Fig. 5)
1580 K. Satake et al. Pure Appl. Geophys.
locations. Our survey was made within 2 weeks of
the earthquake, when sea conditions were very
rough, making land access difficult. Later surveys
(KERPEN et al., 2011; HILL et al., 2012) covered
larger areas and reported more extreme tsunami
heights.
2. This earthquake was a tsunami earthquake, one
that produces weak ground shaking but large tsu-
namis. Residents reported that the ground shaking
was weaker than during the 2007 Bengkulu or the
2009 Padang earthquake.
3. The official tsunami warning from BMKG reached
the Mentawai regency office, but did not reach
coastal communities because of the lack of com-
munication infrastructure. However, some coastal
residents were watching TV and saw running text
of a tsunami warning 5–18 min after the earth-
quake, according to BMKG (2010).
4. Inversion of tsunami waveforms indicated the slip
was larger at offshore subfaults, with a maximum
of 6.1 m. In particular, the nearby surface GPS
buoy recorded two pulses of tsunami waves,
probably from two large slip regions at shallower
subfaults.
5. The nearshore tsunami heights computed from
the above source model using the fine-scale
bathymetry (900) and linear equations were
roughly similar to our measured heights. Tsunami
inundation heights computed on a 100 grid using
nonlinear equations were smaller than the mea-
sured heights, probably because of inaccurate
bathymetry and topography. The one-dimensional
computations using measured profiles reduced the
discrepancy.
Acknowledgments
This survey was made as a part of the SATREPS
‘‘Multi-disciplinary natural hazard reduction from
earthquakes and volcanoes in Indonesia’’ project
supported by the JST (Japan Science and Technology
Agency) and JICA (Japan International Cooperation
Agency), as well as RISTEK and LIPI. Among the
authors, KS, YN, PSP, HS, and EY conducted the
survey. We thank Pariatmono, Mulyo Harris Pradono,
Atsushi Koresawa, and Megumi Sugimoto, who also
joined the survey to study the reactions of residents.
We thank Jody Bourgeois for reading and comment-
ing on the results of the field survey. The tsunami
waveform analysis and simulations were conducted
by KS, ARG, HS, TF, HL, and YT. In particular, YF
took the lead in tsunami waveform inversion, HS in
detailed simulation, and ARG in one-dimensional
computation. We respect and appreciate the efforts of
the operators of the costal tide gauge stations, DART
and GPS buoy stations. The buoy data were provided
to us by Wahyu Pandoe of BPPT and Tilo Schoene at
GFZ. We also thank Jose Borrero, two anonymous
reviewers, and Herman Fritz for their comments on
the final manuscript.
Open Access This article is distributed under the terms of the
Creative Commons Attribution License which permits any use,
distribution, and reproduction in any medium, provided the original
author(s) and the source are credited.
REFERENCES
BADAN METEOROLOGI KLIMATOLOGI DAN GEOFISIKA (2010), Laporan
Gempabumi Mentawai, 25 Oktober 2010, 18 pp.
BILEK, S.L., ENGDAHL, E.R., DESHON, E.R., and HARIRI, M.E.
(2011), The 25 October 2010 Sumatra tsunami earthquake: Slip
in a slow patch, Geophys. Res. Lett., 38, L14306, doi:
10.1029/2011GL047864.
BORRERO, J.C., WEISS, R., OKAL, E. A., HIDAYAT, R., SURANTO,
ARCAS, D., and TITOV, V. (2009), The tsunami of 2007 September
12, Bengkulu province, Sumatra, Indonesia: post-tsunami field
survey and numerical modeling, Geophys. J. Int., 178, 180–194.
FRITZ, H.M., KONGKO, W., MOORE, A., MCADOO, B., GOFF, J.,
HARBITZ, C., USLU, B., KALLIGERIS, N., SUTEJA, D., KALSUM, K.,
TITOV, V., GUSMAN, A., LATIEF, H., SANTOSO, E., SUJOKO, S.,
DJULKARNAEN, D., SUNENDAR, H., and SYNOLAKIS, C.E. (2007),
Extreme runup from the 17 July 2006 Java tsunami, Geophys.
Res. Lett., 34, L12602, doi:10.1029/2007GL029404.
FUJII, Y., and SATAKE, K. (2006), Source of the July 2006 West Java
tsunami estimated from tide gauge records, Geophys. Res. Lett.,
33, L24317, doi:10.1029/2006GL028049.
FUJII, Y., and SATAKE, K. (2007), Tsunami source of the 2004
Sumatra-Andaman Earthquake inferred from tide gauge and
satellite data, Bull. Seism. Soc. Am., 97, S192–S207.
FUJII, Y., and SATAKE, K. (2008), Tsunami waveform inversion of
the 2007 Bengkulu, southern Sumatra, earthquake, Earth, Planets
Space, 60, 993–998.
Vol. 170, (2013) Tsunami Source of the 2010 Mentawai 1581
GUSMAN, A. R., TANIOKA, Y., and TAKAHASHI, T. (2012), Numerical
experiment and a case study of sediment transport simulation of
the 2004 Indian Ocean tsunami in Lhok Nga, Banda Aceh,
Indonesia, Earth Planets Space, (in press).
Hill, E.M., BORRERO, J.C., HUANG, Z., QIU, Q., BANERJEE, P., NAT-
AWIDJAJA, D.H., ELOSEGUI, P., FRITZ, H.M., SUWARGADI, B.W.,
PRANANTYO, I.R., LI, L.-L., MACPHERSON, K.A., SKANAVIS, V.,
SYNOLAKIS, C.E., and SIEH, K. (2012), The 2010 Mw 7.8 Menta-
wai earthquake: very shallow source of a rare tsunami
earthquake determined from tsunami field survey and near-field
GPS data, J. Geophys. Res. 117, B06402, doi:10.1029/2012
JB009159.
KERPEN, N.B., KONGKO, W., KRAMER, K.D.D., GOSEBERG, N., and
SCHLURMANN, T. (2011), International post-tsunami survey rela-
ted to the October 25th, 2010 Mentawai tsunami, GFZ German
Research Centre for Geoscience, Report –Nr. 716, 31 pp.
LAY, T., AMMON, C.J., KANAMORI, H., YAMAZAKI, Y., CHEUNG, K.F.,
and HUTKO, A.R. (2011), The 25 October 2010 Mentawai tsunami
earthquake (Mw 7.8) and the tsunami hazard presented by
shallow megathrust ruptures, Geophys. Res. Lett., 38, L06302,
doi:10.1029/2010GL046552.
NATAWIDJAJA, D.H., SIEH, K., CHLIEH, M., GALETZKA, J., SUWARGADI,
B.W., CHENG, H., EDWARDS, R.L., AVOUAC, J-P., and WARD, S.N.
(2006), Source parameters of the great Sumatran megathrust
earthquakes of 1797 and 1833 inferred from coral microatolls, J.
Geophys. Res., 111. B06403, doi:10.129/2055JB004025.
NEWMAN, A.V., HAYES, G., WEI, Y., and CONVERS, J. (2011), The 25
October 2010 Mentawai tsunami earthquake, from real-time
discriminants, finite-fault rupture, and tsunami excitation, Geo-
phys. Res. Lett., 38, L05302, doi:10.1029/2010GL046498.
OKADA, Y. (1985), Surface deformation due to shear and tensile
faults in a half-space, Bull. Seism. Soc. Am., 75, 1135–1154.
PUTRA, P. S., NISHIMURA, Y., and YULIANTO, E. (2012), Sedimentary
features of tsunami deposits in carbonate-dominated beach
environments: a case study from the 25 October 2010 Mentawai
Tsunami, Pure Appl. Geophys. (in press).
SAHAL, A. and MORIN, J. (2012). Effects of the October 25, 2010,
Mentawai tsunami in La Reunion Island (France): observations
and crisis management, Nat. Hazards, 62, 1125–1136, doi:
10.1007/s11069-012-0136-2.
SATAKE, K. (1995), Linear and nonlinear computations of the 1992
Nicaragua earthquake tsunami, Pure Appl. Geophys., 144,
455–470.
SIEH, K., NATAWIDJAJA, D.H., MELTZNER, A.J., SHEN, C.-C., CHENG,
H., LI, K.-S., SUWARGADI, B.W., GALETZKA, J., PHILIBOSIAN, B.,
and EDWARDS, R.L. (2008), Earthquake supercycles inferred from
sea-level changes recorded in the corals of West Sumatra, Sci-
ence, 322, 1674–1678.
SINGH, S.C., HANANTO, N., MUKTI, M., PERMANA, H., DJAJADIHARDJA,
Y., and HARJONO, H. (2011), Seismic images of the megathrust
rupture during the 25th October 2010 Pagai earthquake, SW
Sumatra: frontal rupture and large tsunami, Geophys. Res. Lett.,
38, L16313. doi:10.1029/2011GL048935.
TANIOKA, Y. and SATAKE, K. (1996), Tsunami generation by hori-
zontal displacement of ocean bottom, Geophys. Res. Lett., 23,
861–864.
(Received January 16, 2012, revised June 16, 2012, accepted June 18, 2012, Published online July 25, 2012)
1582 K. Satake et al. Pure Appl. Geophys.