tt dynamic range meter dr-manual-v1_1-english
DESCRIPTION
Tt Dynamic Range Meter DrTRANSCRIPT

7/18/2019 Tt Dynamic Range Meter Dr-manual-V1_1-English
http://slidepdf.com/reader/full/tt-dynamic-range-meter-dr-manual-v11-english 1/14
TT
DR
Offline
Meter
Software (Windows)
TT
DYNAMIC
RANGE
METER
VST
Plugin (Windows)
Manual Version 1.1 24 February 2009
Dear User,
Congratulations on committing yourself to more dynamic music!
Simply allowing for peak headroom during CD mastering will lead to a significant improvement
of sound quality with "normal" consumer playback devices, MP3 data compression formats,
and with radio broadcasts.
Measurement and display of the Dynamic Range – as well as splitting the dynamics into whole
number values – is not without complexity, as we have discovered through the research and
development stages of finding this solution.
Please read this manual carefully so that the aim of obtaining better sound can be reached.
We are happy to share our knowledge with you.
Installation
To install, simply click on the "TT‐DR‐Install.exe" file. In the "Programs" folder, a folder called
"TT Dynamic Range" will be created within the "Algorithmix" sub‐folder. You can start the TT DR
Offline Meter with alias which is created automatically on your desktop.
Now open the folder C:\Programs\Algorithmix\TT Dynamic Range) and drop the "DR‐Meter"
folder in your preferred VST folder (for example: C:\Programs\Steinberg\VST). Now the plugin is
ready to be used the next time you start your host application. IMPORTANT: Please copy the
entire "DR‐Meter" folder into your VST folder, and not just the dll file!
Logos
The DR logos (DR_logo.zip) can be found with the specifications (DR_Logo_Guide.pdf) in the
folder entitled "TT Dynamic Range" (C:\Programs\Algorithmix\TT Dynamic Range).
General use and limitations of plugins
Plugin formats – regardless of whether they are VST, RTAS, or AU – are not fully suited for
graphic representation and are built on a series of compromises. Each DAW and each plugin
interface puts audio calculation on a higher‐level priority than graphic representation, which is
understandable. This is why truly professional meters are either hardware devices, native‐
running software which uses the CPU resources directly, or host‐integrated solutions. These all
allow for access to graphic and measurement information in a way which also makes it possible
to control
a meter's
so
‐called
ballistics.
In addition, plugins cannot save values and create histograms, which we need for obtaining our
objectives.

7/18/2019 Tt Dynamic Range Meter Dr-manual-V1_1-English
http://slidepdf.com/reader/full/tt-dynamic-range-meter-dr-manual-v11-english 2/14
This is why the TT DR Offline Meter serves to measure the "official" DR values with the
advantage of being able to measure an album within a few seconds. The real‐time plugin TT
Dynamic Range Meter however, provides accurate numerical values as a TRUE PEAK meter and
serves as a guide for the available dynamic range and the approximate DR‐Value that you
should expect. For this, the plugin can be used to loud passages of songs. The timing of the
metering can
vary,
depending
system
latency
and
the
mode
of
operation
of
the
host
application.
We have tested and optimized the meter plugin on a number of different host applications.
Despite system‐dependent limitations, we have obtained very good graphic results in most
cases.
Our goal
Out clearly‐defined goal is to discover and categorize over compression and to prevent overs
with good
true
peak
metering.
In
order
to
achieve
this
goal,
we
have
conducted
extensive
experimentation and have decided to obtain the "official" DR Value from the TT DR Offline
Meter. A real‐time measurement would have certainly taxed the patience of users in
determining the official and correct DR value.
Measuring with the TT DR Offline Meter
In order to determine the official DR value, a song or entire
album (16 bit, 44.1 kHz wave format) is scanned. A
histogram (loudness distribution diagram) is created with a
resolution of
0.01
dB.
The
RMS
–
an
established
loudness
measurement standard – is determined by gathering
approximately 10,000 pieces of loudness information within
a time span of 3 seconds (dB/RMS). From this result, only
the loudest 20% is used for determining the average
loudness of the loud passages.
At the same time, the loudest peak is determined.
The
DR
Value
is
the
difference
between
the
peak
and
the
top
20 average RMS measurements (top 20 RMS minus Peak =
DR).
The top 20 RMS value is not displayed separately. It can be
easily calculated in the head by adding the displayed stereo
(plus decimal place) DYNAMIC RANGE value with the peak
headroom.
To make this clear, the following is an example of the
measurement process.
2.
3.
4.
1.

7/18/2019 Tt Dynamic Range Meter Dr-manual-V1_1-English
http://slidepdf.com/reader/full/tt-dynamic-range-meter-dr-manual-v11-english 3/14
In the above illustration, you can see the song "Back on the Block" by Quincy Jones.
1) The RMS value is the standard average value in dBFS measured over the entire song.
"FS" stands for full scale.
2) The PEAK value is the highest measured peak value in dBFS. Because this is a true peak
measurement, values
above
0dBFS
are
shown
as
"overs."
We
strongly
recommend
keeping a headroom of 0.3dB and avoiding releases with "over" peak values. According
to the latest technical information available, such recordings could be labelled defective.
The precise basis of measurement and the explanation will be described under " True
Peak Display" and “Why 0.3 dB headroom?”below.
3) The DYNAMIC RANGE stereo value (including decimal places) shows the top 20 RMS
value, minus peak headroom (the top 20 RMS value is DR+Peak).
4) The official DR value is a rounded off whole number value of both stereo channels.
Please only use this value as the official DR Value!
Correct measurement and labeling of recordings
A fundamental part of the concept is being able to reproduce the measurement. Here there are
two factors to observe:
1) Please measure the entire recording (when the peak headroom of the individual songs
doesn´t vary
more
than
plus/minus
0,3dB.
Read
more
about
this
unter
“exceptions”).
Results may vary or not be 100% reproducible when you measure each song separately
and then calculate a value on your own. If you do not have a complete wave file of the
entire recording, you will find tips for creating your own files, making it easy to perform
a measurement.
2) The real‐time plugin is only meant to be used as orientation, NOT for determining the
official DR Value. For determining official DR Values, use only the TT DR Offline Meter
pictured above.
We strongly recommend keeping within a peak headroom of 0.3 dB! For an explanation why,
please read the section "True Peak Display” and “Why 0.3 dB headroom?”.

7/18/2019 Tt Dynamic Range Meter Dr-manual-V1_1-English
http://slidepdf.com/reader/full/tt-dynamic-range-meter-dr-manual-v11-english 4/14
DR Value calculation examples using the TT DR Offline Meter
The song "Why Do You Love Me" from the Garbage album
"Bleed Like Me" (2005) has an average RMS loudness of ‐5.1 dB
on both
stereo
channels.
Standard peak meters show a peak headroom of 0 dB. By using
"True Peak" technology, overs can clearly be recognized,
making a release strongly unadvisable.
The top 20 loudness measurements are very easy to calculate,
since there is no headroom: 3.3 + 0 = 3.3 for the left channel
and 3.2 + 0 = 3.2 for the right channel. The rounded off value
results in an official DR value of 3.
For this, we will give it the label "unfit for consumption."
Too bad!
Here we have measured the song "The Boy is Mine" from
Brandy (Never Say Never 1998).
The average RMS value of the whole song is ‐9.1 for the left
channel and ‐8.7 for the right channel.
The peak values can be clearly seen as overs. Distortion is
guaranteed here:

7/18/2019 Tt Dynamic Range Meter Dr-manual-V1_1-English
http://slidepdf.com/reader/full/tt-dynamic-range-meter-dr-manual-v11-english 5/14
A Release of such a master is strongly inadvisable, according to what we know today.
Because of the lack of headroom, the DR value is the same as the top 20 value.
The recording has a DR of 7 (DR7).
The song "Landscape" by jazz guitarist Christoph Oeding is a
natural‐sounding song with hardly any compression, made with
acoustic instruments.
You can see here that the top 20 RMS value here is ‐16.91 dB for
the left channel and ‐17.95 for the right one.
Once we subtract the peak headroom, we obtain a DR Value of
13.
If
this
song
had
been
normalized
to ‐
0.3
dB
headroom,
the
DR Value would be the same.
The illustration on the right is the measurement of Norah Jones'
hit "Don't Know Why" from the year 2002.
Most advanced users know that vocals are particularly thick, and
therefore loud. If you look at a waveform in your mastering
application from a loud, short passage where the vocals are very
intensive, values of up to ‐6 dB/RMS can occur, whereas the
whole song might have a value of ‐13 dB/RMS. Because the
refrain – as opposed to most popular styles – does not have a
homogenous loudness upswing, the real‐time plugin does not
always display the same values. In this case, the TT Dynamic
Range Meter plugin shows varying values that may be briefly too
high or too low. Beware of differences between the plugin and
the offline meter with vocals, acoustic instruments, and similar
music styles.
7/18/2019 Tt Dynamic Range Meter Dr-manual-V1_1-English
http://slidepdf.com/reader/full/tt-dynamic-range-meter-dr-manual-v11-english 6/14
DR9 is however a representative value. The producers have found a market‐oriented
compromise between loudness, peak headroom, and compression. For a post DR release,
values between DR12 and DR14 are however more desirable.
DR9 shows that a song with DR9 does not sound quieter on the radio than a title having DR3 to
DR8. Or did you miss this song on the radio?
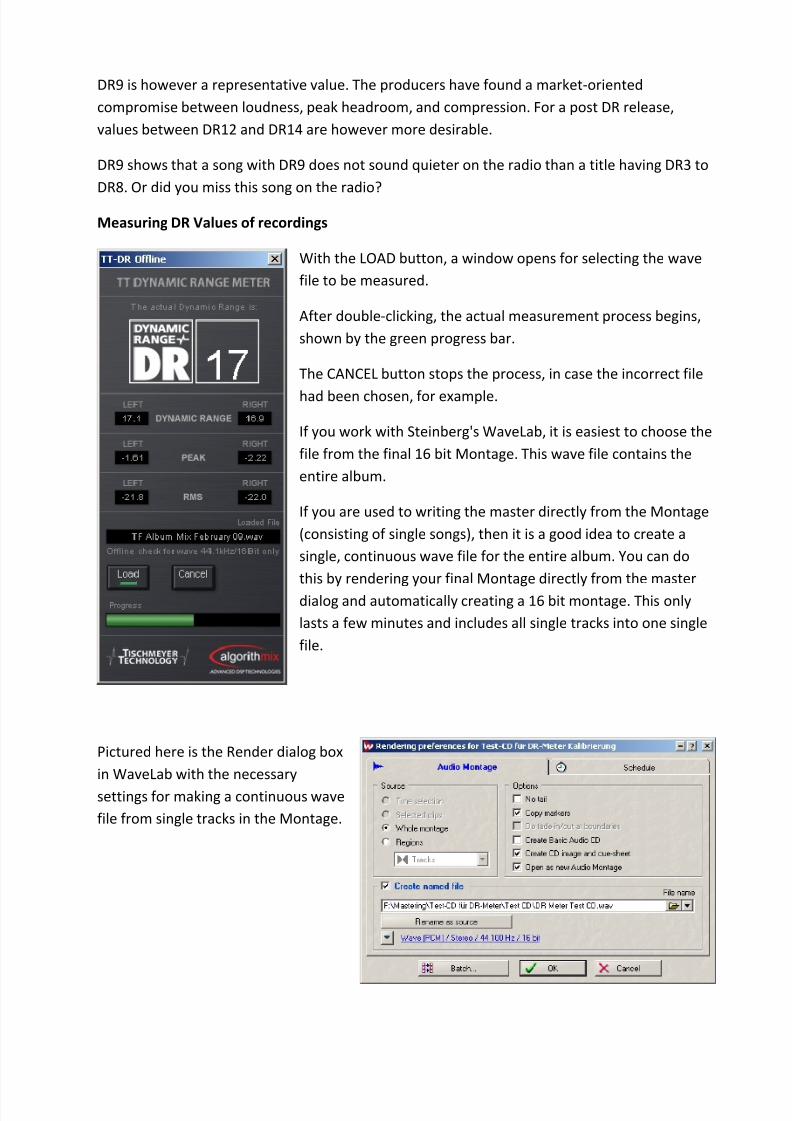
Measuring DR Values of recordings
With the LOAD button, a window opens for selecting the wave
file to be measured.
After double‐clicking, the actual measurement process begins,
shown by the green progress bar.
The CANCEL button stops the process, in case the incorrect file
had been
chosen,
for
example.
If you work with Steinberg's WaveLab, it is easiest to choose the
file from the final 16 bit Montage. This wave file contains the
entire album.
If you are used to writing the master directly from the Montage
(consisting of single songs), then it is a good idea to create a
single, continuous wave file for the entire album. You can do
this by rendering your final Montage directly from the master
dialog and automatically creating a 16 bit montage. This only
lasts a few minutes and includes all single tracks into one single
file.
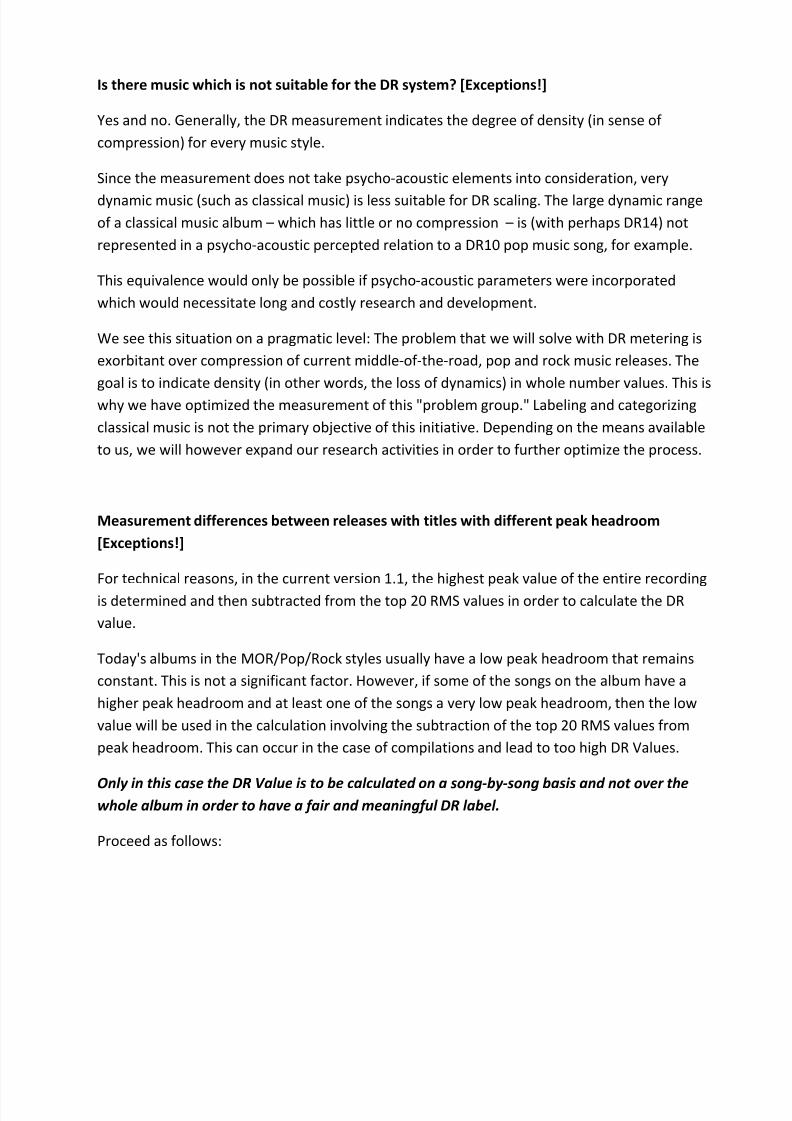
Pictured here is the Render dialog box
in WaveLab with the necessary
settings for making a continuous wave
file from single tracks in the Montage.

7/18/2019 Tt Dynamic Range Meter Dr-manual-V1_1-English
http://slidepdf.com/reader/full/tt-dynamic-range-meter-dr-manual-v11-english 7/14
Nearly every mastering application has the ability to make a so‐called image or to read from a
CD. For legal licensing reasons, the TT DR Offline Meter does not have the driver support for
reading a CD from a CD drive, but this feature is useful for measuring CDs that have already
been burned or duplicated.
Using WaveLab as an example:
• Place a CD you wish to measure into the CD drive of your computer.
• Open the "Import‐Dialog" in WaveLab (Command‐I).
The function "Convert to CD‐Image"/Cue‐
sheet" creates a continuous wave file with
the appropriate CD markers. Make sure
that the process is set for the 16bit/44.1kHz
format.
Use this continuous wave file for calculating the official DR Value.
Why are the top 20 RMS values used for determining the DR Value?
A mastering engineer compares loud passages of a song and, along with spectral adjustments
and various sonic enhancements, ensures that there is an even loudness over the entire
recording. This only works when the loud passages are used as a basis for comparison. A song
having a quiet,
long
introduction
and
a final
refrain
compressed
down
to
DR2
might
have
a RMS
value of DR10 or DR12. The DR Value would therefore not reflect the amount of loudness in the
passages where loudness is critical.
The DR Value therefore represents the amount of density/thickness (loudness) more than the
dynamic range of the entire song!
7/18/2019 Tt Dynamic Range Meter Dr-manual-V1_1-English
http://slidepdf.com/reader/full/tt-dynamic-range-meter-dr-manual-v11-english 8/14
Is there music which is not suitable for the DR system? [Exceptions!]
Yes and no. Generally, the DR measurement indicates the degree of density (in sense of
compression) for every music style.
Since the measurement does not take psycho‐acoustic elements into consideration, very
dynamic music
(such
as
classical
music)
is
less
suitable
for
DR
scaling.
The
large
dynamic
range
of a classical music album – which has little or no compression – is (with perhaps DR14) not
represented in a psycho‐acoustic percepted relation to a DR10 pop music song, for example.
This equivalence would only be possible if psycho‐acoustic parameters were incorporated
which would necessitate long and costly research and development.
We see this situation on a pragmatic level: The problem that we will solve with DR metering is
exorbitant over compression of current middle‐of ‐the‐road, pop and rock music releases. The
goal is to indicate density (in other words, the loss of dynamics) in whole number values. This is
why we have optimized the measurement of this "problem group." Labeling and categorizing
classical music is not the primary objective of this initiative. Depending on the means available
to us, we will however expand our research activities in order to further optimize the process.
Measurement differences between releases with titles with different peak headroom
[Exceptions!]
For technical reasons, in the current version 1.1, the highest peak value of the entire recording
is determined and then subtracted from the top 20 RMS values in order to calculate the DR
value.
Today's albums in the MOR/Pop/Rock styles usually have a low peak headroom that remains
constant. This is not a significant factor. However, if some of the songs on the album have a
higher peak headroom and at least one of the songs a very low peak headroom, then the low
value will be used in the calculation involving the subtraction of the top 20 RMS values from
peak headroom. This can occur in the case of compilations and lead to too high DR Values.
Only in
this
case
the
DR
Value
is
to
be
calculated
on
a song
‐by
‐song
basis
and
not
over
the
whole album in order to have a fair and meaningful DR label.
Proceed as follows:
7/18/2019 Tt Dynamic Range Meter Dr-manual-V1_1-English
http://slidepdf.com/reader/full/tt-dynamic-range-meter-dr-manual-v11-english 9/14
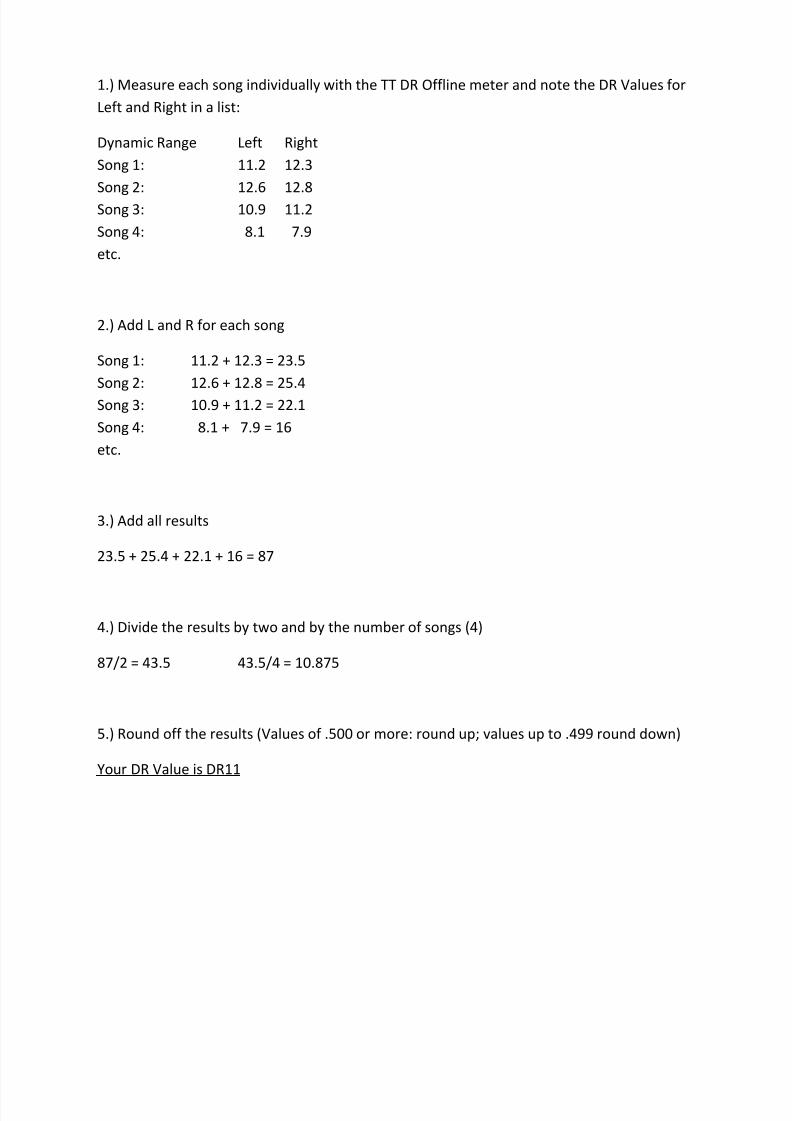
1.) Measure each song individually with the TT DR Offline meter and note the DR Values for
Left and Right in a list:
Dynamic Range Left Right
Song 1: 11.2 12.3
Song 2: 12.6 12.8
Song 3: 10.9 11.2
Song 4: 8.1 7.9
etc.
2.) Add L and R for each song
Song 1: 11.2 + 12.3 = 23.5
Song 2: 12.6 + 12.8 = 25.4
Song 3: 10.9 + 11.2 = 22.1
Song 4: 8.1 + 7.9 = 16
etc.
3.) Add all results
23.5 + 25.4 + 22.1 + 16 = 87
4.) Divide the results by two and by the number of songs (4)
87/2 = 43.5 43.5/4 = 10.875
5.) Round off the results (Values of .500 or more: round up; values up to .499 round down)
Your DR Value is DR11

7/18/2019 Tt Dynamic Range Meter Dr-manual-V1_1-English
http://slidepdf.com/reader/full/tt-dynamic-range-meter-dr-manual-v11-english 10/14
TT Dynamic Range Meter Plugin (VST)
Open the plugin in your host application in the last slot of the master bus, after the output
fader. This varies from DAW to DAW. If you are not sure, please check in the manual of the
software or set the output faders to 0 dB.
Here you
can
see
the
shocking
results
when
"Garbage"
is
played.
This is NOT how things should look.
1.) Stereo
correlation
meter: Display of the phase differences
between the left and right stereo channels. For information on
interpreting this, please refer to technical literature.
2.) True Peak Display with one decimal point and the corresponding
peak level bar on the outer side. In the area close to full scale, peak
measurement is particularly complex and critical. First of all, fixed
point resolution can only show values up to full scale, since on the
digital level,
no
overs
are
possible.
However,
contiguous
full
‐scale
words create audible overs and so‐called interleaved sample overs*.
Secondly, floating point calculation makes it possible to represent
values well over 0dB. The measurement and display of peak values in
4x over sampling** leads to a display of overs so frequently that we
have found a middle‐of ‐the‐road solution. The peak values are
measured "normally" and provided numerically. In the case that two
contiguous bit words show full scale (all 16 bits at 1 without any
oversampling) and at the same time a value of over 0 dB is detected
via oversampling metering (run as a parallel process), then the peak
display shows "OVER."
Peak
Bar: The
display
area
ranges
from
‐48
to
0dB.
A peak‐hold function with a slow release time (ballistics) makes it
easy to read and follow the values visually.
(* 4x over sampling = Quadrupling of the sampling rate).
(** Interleaved Sample Overs (also: inter‐sample peaks) are overs
which can be detected only after multiplying the sampling rate (over
sampling by a factor of 2 to 4). The values are not detected on the
digital level because values only up to 0dB can be represented
(fixpoint). An interleaved sample over can also occur when the peak
headroom is 0.1 dB or more and creates distortion only after leaving
the digital domain.
Stopping and restarting playback also results in an resetting of the
numerical peak display, in the same way that clicking the RESET
button does.
The numerical display shows the highest value reached since the last
reset.
7/18/2019 Tt Dynamic Range Meter Dr-manual-V1_1-English
http://slidepdf.com/reader/full/tt-dynamic-range-meter-dr-manual-v11-english 11/14
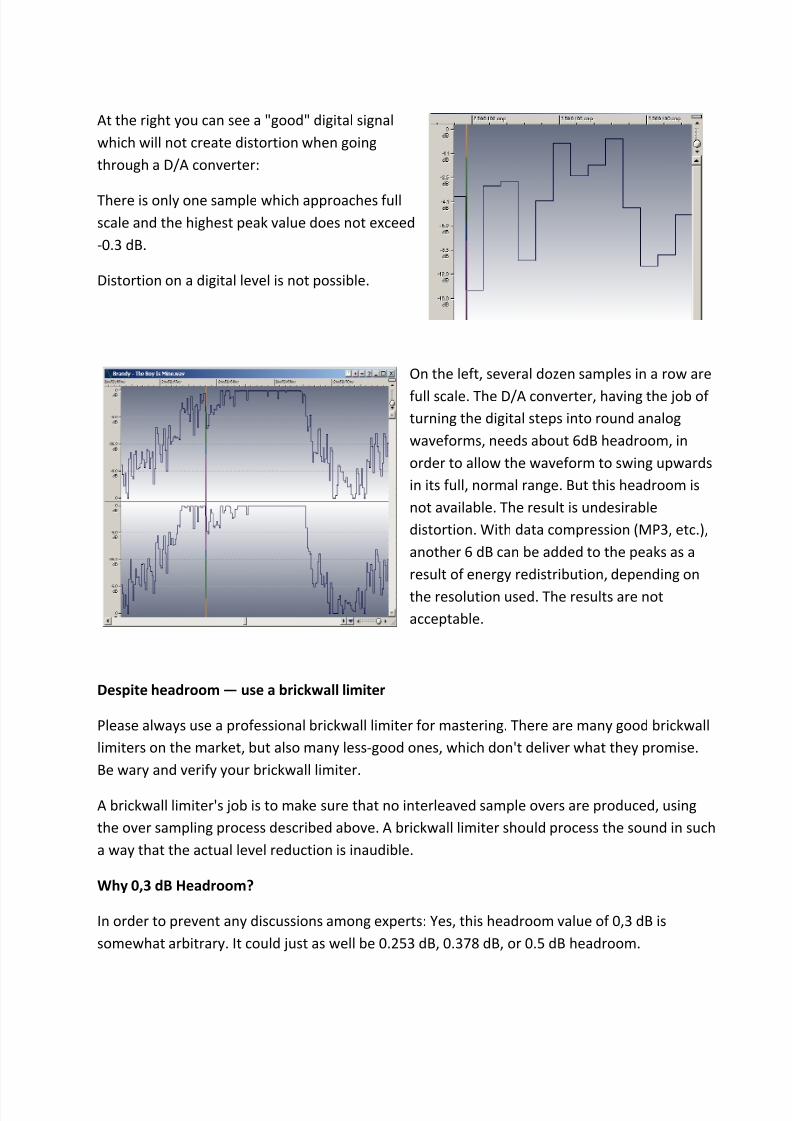
At the right you can see a "good" digital signal
which will not create distortion when going
through a D/A converter:
There is
only
one
sample
which
approaches
full
scale and the highest peak value does not exceed
‐0.3 dB.
Distortion on a digital level is not possible.
On the left, several dozen samples in a row are
full scale.
The
D/A
converter,
having
the
job
of
turning the digital steps into round analog
waveforms, needs about 6dB headroom, in
order to allow the waveform to swing upwards
in its full, normal range. But this headroom is
not available. The result is undesirable
distortion. With data compression (MP3, etc.),
another 6 dB can be added to the peaks as a
result of energy redistribution, depending on
the resolution
used.
The
results
are
not
acceptable.
Despite headroom — use a brickwall limiter
Please always use a professional brickwall limiter for mastering. There are many good brickwall
limiters on the market, but also many less‐good ones, which don't deliver what they promise.
Be wary and verify your brickwall limiter.
A brickwall limiter's job is to make sure that no interleaved sample overs are produced, using
the over sampling process described above. A brickwall limiter should process the sound in such
a way that the actual level reduction is inaudible.
Why 0,3 dB Headroom?
In order to prevent any discussions among experts: Yes, this headroom value of 0,3 dB is
somewhat arbitrary. It could just as well be 0.253 dB, 0.378 dB, or 0.5 dB headroom.
7/18/2019 Tt Dynamic Range Meter Dr-manual-V1_1-English
http://slidepdf.com/reader/full/tt-dynamic-range-meter-dr-manual-v11-english 12/14
Despite using a good brickwall limiter, there are two reasons for leaving some headroom:
1. Modern D/A converters use linear‐phase FIR reconstruction filters which are not always
designed to process full scale signals without distortion. This is particularly true of steep‐
sloping signals which are often produced by hard limiting or over compressed music.
Extra headroom significantly reduces this risk while making any loss of loudness to be
practically imperceptible (see Gibbs phenomenon).
2. Additional headroom reduces artifacts used by all data compression formats which use
the masking effect. The lower the data rate of the target format, the more headroom is
necessary. For highly compressed music, 0.3 dB headroom is not sufficient in order to
avoid distortion. In this case, a headroom of 5 dB would be theoretically necessary.
Recordings which have the DR logo are fortunately not so strongly compressed; a
headroom of 0.3 dB prevents unwanted artifacts in most cases!
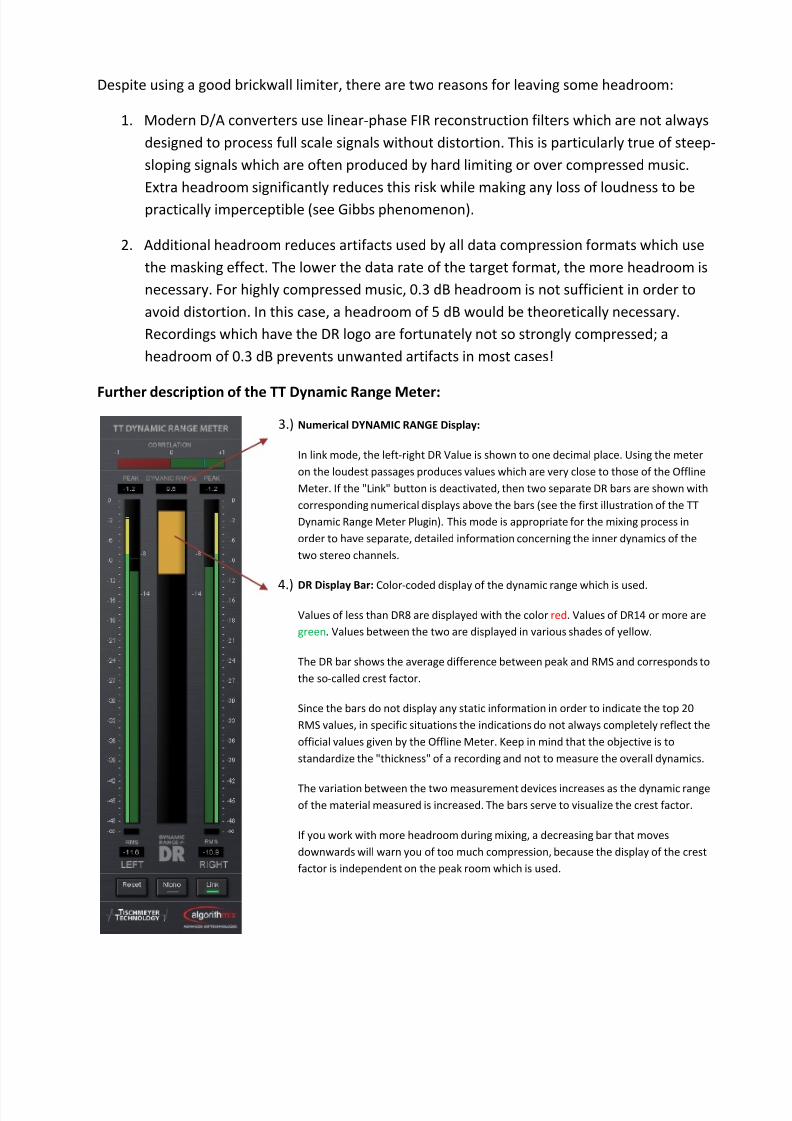
Further
description
of
the
TT
Dynamic
Range
Meter:
Numerical DYNAMIC RANGE Display:
In link mode, the left‐right DR Value is shown to one decimal place. Using the meter
on the loudest passages produces values which are very close to those of the Offline
Meter. If the "Link" button is deactivated, then two separate DR bars are shown with
corresponding numerical displays above the bars (see the first illustration of the TT
Dynamic Range Meter Plugin). This mode is appropriate for the mixing process in
order to have separate, detailed information concerning the inner dynamics of the
two stereo channels.
DR
Display
Bar:
Color‐
coded
display
of
the
dynamic
range
which
is
used.
Values of less than DR8 are displayed with the color red. Values of DR14 or more are
green. Values between the two are displayed in various shades of yellow.
The DR bar shows the average difference between peak and RMS and corresponds to
the so‐called crest factor.
Since the bars do not display any static information in order to indicate the top 20
RMS values, in specific situations the indications do not always completely reflect the
official values given by the Offline Meter. Keep in mind that the objective is to
standardize the "thickness" of a recording and not to measure the overall dynamics.
The variation
between
the
two
measurement
devices
increases
as
the
dynamic
range
of the material measured is increased. The bars serve to visualize the crest factor.
If you work with more headroom during mixing, a decreasing bar that moves
downwards will warn you of too much compression, because the display of the crest
factor is independent on the peak room which is used.
3.)
4.)

7/18/2019 Tt Dynamic Range Meter Dr-manual-V1_1-English
http://slidepdf.com/reader/full/tt-dynamic-range-meter-dr-manual-v11-english 13/14
5.) Digital 0 Display
The "minus‐infinity" display lights up as so as there is digital 0 at the
input.
6.) Numerical RMS Display: The display shows the current average
loudness very slowly, making it very practical for having an idea of
the amount of current loudness.
RMS Display Bars: (wide interior bars)
We decided to use the standard calculation of loudness in RMS (root mean square) because it
proved to be superior to most other measuring methods with complex frequency weighting
models when put through comparative testing. Those methods which were better required a
great deal of CPU resources and are very controversial among specialists. The idea behind the
DR Meter
is
a simplified
way
of
determining
thickness
and
NOT
a psycho
‐acoustically
perfect
loudness measurement tool. The RMS value is corrected by +3 dB so that sine waves have the
same peak and RMS value. This is the case with most meters.
7.) Mono Switch: This switches the stereo signal to mono for checking the signal and turns red
when activated. This switch can be used as a mono switch for checking stereo compatibility
when the DR Meter inserted into the stereo section of your DAW. The mono switch is a
practical tool, since many DAWs no longer have one.
8.) Reset Switch: Resets the numerical peak headroom display.
Support for other formats and platforms
We have already begun work on an RTAS version of the plugin for Mac OS and PC as well as an
AU version for Mac OS. A Mac OS version of the TT DR Offline Meter is also planned — thank
you for your patience! On the Website www.PleasurizeMusic.com you can learn about the
latest releases.
7.)8.)
7/18/2019 Tt Dynamic Range Meter Dr-manual-V1_1-English
http://slidepdf.com/reader/full/tt-dynamic-range-meter-dr-manual-v11-english 14/14
Updates
Please always use the latest version of the software.
Future optimization of the measurement procedure could lead to slightly different results.
In
future
versions,
the
following
additional
features
are
planned:
Plugin:
• numeric peak display with interpolated value indication in the zone above 0 dB.
Interpolation can uncover potential overs occurring in later D/A conversion in playback
devices resulting in peak values which are too high (interleaved sample overs). The
implementation involves significant research and development efforts.
• implementation of Bob Katz' K‐System. Particularly the K‐12 and K‐14 are very well
suited for achieving more dynamic mixes.
• surround version
Software:
• Direct reading in from DVD/CD drives
• This requires obtaining licenses and the payment of license fees for drivers from third‐
party manufacturers.
Donation
Under the
heading
Donation/Spende
you
can
help
support
our
work.
The
Pleasurize
Music
Foundation is a non‐profit organization aimed at establishing a dynamic sound standard and a
surround sound quality label, in order to generally raise the quality of recorded music and
thereby to help revitalize the music industry.
Credits
• DR idea and overall concept and realization: Friedemann Tischmeyer
• Technical concept and project management: Dr. Christoph Musialik from Algorithmix
• Programming: Dr. Ulrich Hatje from Algorithmix
Support [email protected]
C 2009 by Pleasurize Music Foundation
c/o Tischmeyer Publishing America Inc.
2400 Chanticleer Ave. Suite D2 Santa Cruz CA 95062 USA
www.PleasurizeMusic.com