tt&r definitions and cost drivers - final project report tt&r and identify associated cost...
TRANSCRIPT

Define TT&R and identify associated cost drivers for ABF purposes Final Report
May 2014
PAXTON PARTNERS | LEVEL 2, 448 ST KILDA ROAD, MELBOURNE VIC 3004 | PH. 03 9820 0333 | FAX. 03 9820 0777
1
INDEPENDENT HOSPITAL PRICING AUTHORITY DEFINE TEACHING, TRAINING AND RESEARCH AND
IDENTIFY ASSOCIATED COST DRIVERS FOR ABF PURPOSES FINAL PROJECT REPORT
May 2014

Define TT&R and identify associated cost drivers for ABF purposes Final Report
May 2014
PAXTON PARTNERS | LEVEL 2, 448 ST KILDA ROAD, MELBOURNE VIC 3004 | PH. 03 9820 0333 | FAX. 03 9820 0777
2
Executive Summary .................................................................................................................. 8
ES.1 Defining TT&R for ABF purposes ................................................................................ 8
ES.2 Cost drivers of TT&R ................................................................................................. 10
ES.3 Classification development framework for teaching and training ........................... 12
Summary of recommendations .............................................................................................. 14
1 Introduction .............................................................................................................. 17
1.1 Background and policy context ................................................................................ 17
1.2 Key project objectives .............................................................................................. 18
1.3 Project scope ............................................................................................................ 18
1.4 Project methodology ................................................................................................ 20
1.5 Document structure ................................................................................................. 22
2 Perspectives on TT&R ............................................................................................... 23
2.1 The embedded nature of TT&R within clinical service delivery ............................... 23
2.2 The changing nature of TT&R ................................................................................... 24
2.3 Service delivery benefits of TT&R ............................................................................. 24
3 Definitions of TT&R .................................................................................................. 27
3.1 Definition development process .............................................................................. 27
3.2 The previous draft definitions of TT&R .................................................................... 27
3.3 General considerations for framing new definitions ................................................ 29
3.4 Defining teaching and training for ABF purposes ..................................................... 30
3.5 Defining research for ABF purposes ......................................................................... 36
4 Identifying cost drivers of TT&R and developing a classification framework .......... 40
4.1 TT&R considerations influencing the cost driver analysis ........................................ 40
4.2 Overview of cost driver analysis methodology ........................................................ 42
4.3 Teaching and training cost drivers ........................................................................... 44
4.4 Classification development framework for teaching and training ........................... 57
4.5 Research cost drivers ............................................................................................... 61
Appendix A List of organisations that were consulted ........................................................... 68
Appendix B Cost driver analysis background and methodology ............................................ 71
B. 1. Purpose of cost driver analysis ....................................................................................... 71
B. 2. Analysis methodology .................................................................................................... 75
Appendix C Results of the statistical cost driver analysis of teaching and training ................ 98
C. 1. Model 1 – including total weighted activity as a predictor variable .............................. 98
C. 2. Model 2 – excluding total weighted activity as a predictor variable .............................. 99
C. 3. Model 3 – Stratified model based upon hospital peer group, while excluding total weighted activity as a predictor variable ................................................................................................... 100
C. 4. Assessment of a preferred model to determine the cost drivers of teaching and training102

Define TT&R and identify associated cost drivers for ABF purposes Final Report
May 2014
PAXTON PARTNERS | LEVEL 2, 448 ST KILDA ROAD, MELBOURNE VIC 3004 | PH. 03 9820 0333 | FAX. 03 9820 0777
3
Appendix D Outputs of exploratory analysis of research variables ...................................... 103
D. 1. Total weighted activity versus key research variables of interest ............................... 103
D. 2. Total trainee FTE versus key research variables of interest ......................................... 105
D. 3. Total recurrent expenditure versus key research variables of interest ....................... 107
D. 4. Total research directorate expenditure versus key research variables ....................... 109

Define TT&R and identify associated cost drivers for ABF purposes Final Report
May 2014
PAXTON PARTNERS | LEVEL 2, 448 ST KILDA ROAD, MELBOURNE VIC 3004 | PH. 03 9820 0333 | FAX. 03 9820 0777
4
Acknowledgements This report was prepared by Paxton Partners with the support of Dr. Peter Kas.
The authors acknowledge the significant contribution made by IHPA’s Teaching, Training and Research Working Group along with the employees of jurisdictional health departments, health services and peak bodies (as noted in Appendix A) in attending meetings, extracting data and providing written and verbal feedback on previous reports associated with this project.
List of Acronyms ABF Activity Based Funding
ACHS Australian Council on Healthcare Standards
ACSQHC Australian Commission on Safety and Quality in Health Care
ACT Australian Capital Territory
AHPCS Australian Hospital Patient Costing Standards
AHPRA Australian Health Practitioner Regulation Agency
AIHW Australian Institute of Health and Welfare
CAC Clinical Advisory Committee
CPD Continuing Professional Development
DoHA Department of Health and Ageing
DSS Data Set Specification
FTE Full-Time Equivalent
HOI Health Outcomes International
HREC Human Research Ethics Committee
HWA Health Workforce Australia
HTTA DSS Hospital Teaching and Training Activities Data Set Specification
IHPA Independent Hospital Pricing Authority
JAC Jurisdictional Advisory Committee
LHN Local Hospital Network
MRI Medical Research Institute
NHCDC National Hospital Cost Data Collection
NHRA National Health Reform Agreement
NMDS National Minimum Data Set
NSW New South Wales
PHE NMDS Public Hospital Establishments National Minimum Data Set
PGY Postgraduate Year
SA South Australia
SPSS Statistical Package for the Social Sciences
TT&R Teaching, Training and Research

Define TT&R and identify associated cost drivers for ABF purposes Final Report
May 2014
PAXTON PARTNERS | LEVEL 2, 448 ST KILDA ROAD, MELBOURNE VIC 3004 | PH. 03 9820 0333 | FAX. 03 9820 0777
5
TTRWG Teaching, Training & Research Working Group
WA Western Australia

Define TT&R and identify associated cost drivers for ABF purposes Final Report
May 2014
PAXTON PARTNERS | LEVEL 2, 448 ST KILDA ROAD, MELBOURNE VIC 3004 | PH. 03 9820 0333 | FAX. 03 9820 0777
6
Glossary of Terms Please note that the objective of this glossary is to clarify the intended meaning of terms used in this report and not to provide a set of nationally agreed definitions.
Activity based funding (ABF): Activity based funding is a means of funding hospitals for the type and volume of services they provide. It offers a clear link between funding and healthcare delivery, which should improve transparency and strengthen incentives for efficiency in public hospital services delivery
Admitted acute: A hospital admission for which the intent is to perform surgery, diagnostic or therapeutic procedures in the treatment of illness or injury.
Allied health: Health care professions that are distinct from medicine, dentistry, nursing or midwifery.
Block funding: A sum of money granted by a funder to a recipient of the funding, with only general provisions as to the way it is to be spent.
Casemix: A consistent method of classifying types of patients, their treatment and associated costs by assigning a relative value to common diagnosis of related patient cohorts.
Clinical audit: A quality improvement process that seeks to improve patient care and outcomes through systematic review of care against explicit criteria and the implementation of change.
Clinical service delivery: The provision of direct patient care in a health service as opposed to the non-clinical or corporate (administrative, support, management) services required to support the organisation.
Clinical teaching: The practical transfer of knowledge that takes place in a clinical environment.
Cost drivers: The factors that will result in the level of costs being higher at one health service, compared to another.
Cost neutral: The point where a trainee’s contribution to patient care is equivalent to the costs the health service incurs to provide their training.
Costs: The resources (financial and other) that a health service is required to supply to support the provision of teaching and training. Costs may be directly or indirectly related to teaching and training.
Direct costs: Costs that can be completely attributed to the production of specific goods or services. In the case of a health service, these costs are directly attributed to delivering patient related services.
Direct teaching and training activities: The theoretical or practical transfer of knowledge that occurs independently from the delivery of patient care.
Direct research activities: Distinct and separable activities that relate to the generation of new knowledge, typically undertaken as part research projects.
Early entry: Individuals who have recently been employed by a health service, usually in their first years of employment.
Embedded costs: Costs that are inextricably linked to another project, activity, program or process, and cannot be separately identified.
Embedded TT&R activities: describe events where TT&R occurs in conjunction with patient care.

Define TT&R and identify associated cost drivers for ABF purposes Final Report
May 2014
PAXTON PARTNERS | LEVEL 2, 448 ST KILDA ROAD, MELBOURNE VIC 3004 | PH. 03 9820 0333 | FAX. 03 9820 0777
7
Environmental scan: An assessment of the macro environment investigating multiple factors. Environmental scans draw on contemporary advice from industry participants rather than reproducing known statistics and information. In relation to this project to the Environmental Scan developed earlier in this project, which sought to identify perspectives of a broad range of stakeholders regarding how to define TT&R and identify its associated cost drivers
Indirect costs: Costs that are not explicitly attributable to a cost object, such as a particular project, facility, function or product.
Indirect teaching training and research activities: The activities undertaken by a health service that are essential to facilitate teaching and training, but do not involve either a didactic or experiential skills / knowledge transfer.
Literature review: A formal written analysis that considers the critical points of current knowledge on a particular topic, including substantive findings, as well as theoretical and methodological contributions. Literature reviews are secondary sources, and as such, do not report any new or original experimental work. For the purposes of this project, it refers to the Literature Review that was developed earlier in this project, which sought to identify perspectives on how to define TT&R, identify its associated cost drivers, the availability of TT&R data and confirm any emerging trends or developments in TT&R
Loading: A relative weighting applied to different levels of funding to provide different types or volumes of activities/services.
Non-admitted: Health care services provided to patients who do not undergo a formal admission process and do not occupy a hospital bed.
Non-clinical teaching: The transfer of knowledge outside of a clinical environment i.e. class room based learning.
Phase of teaching and training: A stage involving specific teaching and /or training requirements, through which a trainee may progress during the course of their career. For the purpose of this project, three main phases of training have been identified, including ‘pre-entry / student’, ‘early entry / prevocational’ and ‘advancement / vocational’.
Pre-vocational: The base of education in which health care professionals develop competencies after completion of their qualification.
Pre-entry: Medical, nursing and allied health professional groups in student placements.
Pricing Authority: The governing body of IHPA established under the National Health Reform Act 2011.
Quality assurance: The process that ensures the requirements pertaining to the delivery of any product or service are met.
Quantitative analysis: Numerical techniques used to carry out analysis.
Supernumerary: In addition to the usual number or a temporary or additional worker.
Tied funding: Funding that is tied to the provision of a specific service or activity, or to the achievement of certain levels of performance.

Define TT&R and identify associated cost drivers for ABF purposes Final Report
May 2014
PAXTON PARTNERS | LEVEL 2, 448 ST KILDA ROAD, MELBOURNE VIC 3004 | PH. 03 9820 0333 | FAX. 03 9820 0777
8
Executive Summary In August 2011, the Commonwealth, States and Territories signed The National Health Reform Agreement (NHRA). Among a number of other reforms, the NHRA committed the Commonwealth and State and Territory jurisdictions to implement an Activity Based Funding (ABF) model for public healthcare services. The NHRA also recognised that the infrastructure to fund teaching, training and research (TT&R) on an activity basis was not in place.
Clause A49 of the NHRA requires the Independent Hospital Pricing Authority (IHPA) to provide advice to the Standing Council on Health on the feasibility of transitioning funding for TT&R to ABF by 1 July 2018. Paxton Partners have therefore been engaged by IHPA to:
1. Develop a set of nationally agreed definition(s) of TT&R for public health services in Australia;
2. Identify the cost drivers associated with the agreed definitions of TT&R for ABF purposes; and
3. Produce a classification development framework that considers the ways in which the identified cost drivers can be grouped in a meaningful way to explain resource usage.
Achieving these three key project objectives have provided the foundation from which classification, costing, counting and pricing approaches can be developed for TT&R in the future. This document presents the findings of Paxton Partners’ work in relation to these three key project objectives, and provides recommendations that aim to support a feasibility assessment of transitioning TT&R to ABF by 1 July 2018.
ES.1 Defining TT&R for ABF purposes Definitions set the scope parameters from which classification, costing, counting and pricing arrangements can be developed. Although previous definitions of TT&R existed, they did not receive widespread acceptance.
Although they have been adopted as the basis for developing costing standards for ‘teaching’ and ‘research’, their limited acceptance has meant that various other descriptions have been adopted for the purposes of guiding teaching and training policy and funding arrangements across Australia.
An over-arching objective of this project was therefore to develop definitions that have broad-based support, can be practically implemented and are suitable for the purpose of ABF. The process to develop new definitions for TT&R is summarised in Figure 1.
Figure 1: Process to develop updated definitions of TT&R:

Define TT&R and identify associated cost drivers for ABF purposes Final Report
May 2014
PAXTON PARTNERS | LEVEL 2, 448 ST KILDA ROAD, MELBOURNE VIC 3004 | PH. 03 9820 0333 | FAX. 03 9820 0777
9
A key consideration in this project has been the changing nature of TT&R. The range of locations and settings in which TT&R activities are being conducted is broader than ever before, and TT&R activity has undergone a significant expansion in the last decade, with increasing activity in regional, rural and remote locations. Today, TT&R activities occur not only in large tertiary referral hospitals, but also in community, primary and ambulatory care settings. The role of public health services in the delivery of clinical teaching and training has become increasingly important, following significant expansion in clinical education places. The definitions developed through this project have necessarily been cognisant of these trends, and the need for flexibility to accommodate the evolution in technologies, settings and delivery modes that is currently taking place.
Framing a definition (or definitions) of TT&R that has practical meaning and can be implemented for the purpose of ABF is complicated by the ‘embedded’ nature of many TT&R activities occurring in conjunction with the delivery of patient care. The long lead time set by the NHRA to determine the feasibility of an ABF approach to TT&R recognises a number of inherent difficulties associated with identifying, and potentially distinguishing both the nature and costs of TT&R from clinical service delivery. This project has sought to provide a foundation from which these issues can be resolved and provides a framework for future work to better understand the costs of TT&R within clinical service delivery.
At an early stage, the project identified key conceptual and operational differences between ‘teaching and training’ and ‘research’ to warrant separating them for definitional, cost driver and classification purposes. A principles-based approach was then used to determine the unifying elements for defining ‘teaching and training’ and ‘research’ for ABF purposes. For teaching and training, the focus of the definition has been on identifying the professional groups that rely on exposure to clinical environments to obtain qualifications, registration, and recognition as a specialist or advanced practitioner or to develop clinical competence to practice upon entering the health workforce. For research, the definition has focused on the supporting elements that health services provide to facilitate research activity, rather than research activities themselves which are often funded by bodies other than states or territories.
Through this project, the following definitions have been approved by the Pricing Authority:
Teaching and training describes: the activities provided by or on behalf of a public health service to facilitate the acquisition of knowledge, or development of skills. These activities must be required for an individual to:
• attain the necessary qualifications or recognised professional body registration to practice; • acquire sufficient clinical competence upon entering the workforce; or • undertake specialist / advanced practice
in medicine, dentistry, nursing, midwifery or allied health. Research describes: The activities undertaken in a public health service where the primary objective is the advancement of knowledge that ultimately aims to improve consumer and patient health outcomes and/or health system performance. The activity must be undertaken in a structured and ethical way, be formally approved by a research governance or ethics body, and have potential for application outside of the health service in which the activity is undertaken. For ABF purposes, the definition of research relates to: the public health service’s contribution to maintain research capability, excluding the costs of research activities that are funded from a source other than the state or territory or provided in kind.

Define TT&R and identify associated cost drivers for ABF purposes Final Report
May 2014
PAXTON PARTNERS | LEVEL 2, 448 ST KILDA ROAD, MELBOURNE VIC 3004 | PH. 03 9820 0333 | FAX. 03 9820 0777
10
ES.2 Cost drivers of TT&R Supported by the outcomes of the environmental scan, the Pricing Authority-approved definitions of TT&R provided a starting point for understanding and assessing the impact of associated cost drivers of TT&R. The cost driver analysis was intended to provide a framework for developing classifications that discriminates between different activities, outputs or groups that use similar resources.
The Literature Review1 and Environmental Scan2 suggested four potential cost drivers of teaching and training and five cost drivers of research. However, current data availability restricted the range of proposed cost drivers that could be analysed.
The process for identifying the cost drivers of TT&R comprised two stages; an exploratory stage and a statistical (regression) stage, as illustrated in Figure 2. This approach sought to progressively focus the analysis towards identifying a sub-set of teaching and training variables that reliably predicted teaching and training costs.
Figure 2: Summary of cost driver analysis methodology
The exploratory analysis was undertaken to:
• obtain an initial understanding of the relationships between key variables;
• identify the most appropriate dependent variable3 to use in the Stage 2 statistical analysis; and
• test whether teaching and training variables were suitable for the type of statistical analysis that was conducted.
The results of the exploratory analysis of teaching and training showed that: • The most appropriate proxy for teaching and training costs, and thus the dependent variable
that should be used in the Stage 2 statistical analysis, was total recurrent hospital expenditure;
• The majority of clinical trainees are concentrated in principal referral hospitals;
• The majority of clinical trainees are located in major cities; and
• Proxies for teaching and training costs are not suitable for use as cost drivers.
The statistical analysis used stepwise linear regression4 to identify a set of teaching and training variables that have statistically significant relationships with total recurrent hospital expenditure.
1 Independent Hospital Pricing Authority (2013), ‘Define Teaching, Training and Research and identify Associated Cost Drivers: Literature Review’, accessed http://www.ihpa.gov.au/internet/ihpa/publishing.nsf/Content/teaching-training-and-research. 2 Independent Hospital Pricing Authority (2013), ‘Define Teaching, Training and Research and identify Associated Cost Drivers: Environmental Scan’, accessed from http://www.ihpa.gov.au/internet/ihpa/publishing.nsf/Content/teaching-training-and-research. 3 A ‘dependent variable’ is the variable to be predicted in a statistical analysis. In this analysis, the dependent variable was a proxy for teaching and training costs.

Define TT&R and identify associated cost drivers for ABF purposes Final Report
May 2014
PAXTON PARTNERS | LEVEL 2, 448 ST KILDA ROAD, MELBOURNE VIC 3004 | PH. 03 9820 0333 | FAX. 03 9820 0777
11
Based on the available data, six trainee groups were identified as key teaching and training cost drivers:
• Medical Postgraduate Year 2 staff;
• First year nursing and midwifery graduates;
• Medical students;
• First year allied health graduates;
• Nursing and midwifery students; and
• Basic registrars.
These cost drivers are broadly in keeping with the trainee groups identified as being associated with the most intensive teaching and training activity in the Literature review and Environmental scan and also those covered under the new definition.
These key teaching and training cost drivers represent the sub-set of teaching and training variables that reliably predicted total annual recurrent expenditure for the data set and thus those that are likely to be incorporated in any classification system. However, it should be noted that these key cost drivers will not be the only measures counted and costed by IHPA moving forward.
Furthermore, not all trainee groups or potential cost drivers could be tested in this cost driver analysis due to data limitations. For example, the following cost drivers that were proposed in the Environmental Scan could not be tested:
• Differences between proceduralist and non-proceduralist medical college training requirements to attain fellowship in medical vocational training; and
• International medical professionals in training.
Additionally, a number of jurisdictions were unable to identify some professional groups in their systems, such as Enrolled / Registered Nurses, dentistry trainees, Nurse Practitioner candidates or distribution between allied health disciplines. In some cases, this required that data on key trainee groups was ‘rolled up’ to a higher level. Ideally all trainee groups that are considered in-scope of the new definition, as well as the potential cost driver variables for which data was unavailable, would therefore be considered in the development of a future classification for teaching and training.
Obtaining data on research for the purpose of cost driver analysis was particularly problematic, and ultimately restricted the analysis of research cost drivers to an exploratory level only. In total, research data was obtained for eight facilities / Local Hospital networks (LHNs). Consultation highlighted significant difficulties in relation to the collection of the requested research data items, including:
• The absence of systematic collection and reporting of the type of research data that was requested – even for large facilities where research is a core component of operations;
• The likelihood that facilities would not be willing to provide some key data elements relating to the value of research grants received as a result of commercial and confidentiality concerns; and
4 Regression analysis is a statistical technique used for estimating the significance of relationships among variables by understanding how the value of one variable (the dependent or response variable) changes when any one of the other variables (the independent or predictor variables) is adjusted. Stepwise regression approaches use statistical criteria to find the most succinct combination of independent variables that explain the variation in a dependent variable.

Define TT&R and identify associated cost drivers for ABF purposes Final Report
May 2014
PAXTON PARTNERS | LEVEL 2, 448 ST KILDA ROAD, MELBOURNE VIC 3004 | PH. 03 9820 0333 | FAX. 03 9820 0777
12
• Difficulties identifying the state or territory-funded component of research output or capability as distinct from those funded through affiliated institutes or research partners.
Further development of research data collections would be required to establish a sufficient sample of facilities that can inform an analysis of research cost drivers.
The exploratory analysis of research data indicated that the number of approved research publications was the research variable that showed the greatest likelihood of being a cost driver of research – explaining 71.4% of the variation in total recurrent hospital expenditure. However, this relationship was not considered strong enough to establish the volume of publications as a research cost driver.
As a result, the exploratory analysis could not identify any meaningful cost driver relationships between research activities and research capability. The analysis showed:
• only a modest relationship between research capability and research output, which is contrary to the expected outcome of the analysis;
• measures of research capability are not associated with the same hospital characteristics as teaching and training variables; and
• the cost drivers for research are not related to the drivers for teaching and training.
These findings appear to reinforce the perspectives reflected in the Literature Review and Environmental Scan, that ‘teaching and training’ and ‘research’ are separate and distinct activities. Knowing the volume of one (for example teaching and training volume) would not therefore permit conclusions to be drawn about the other (research output).
Given the absence of data to assess the cost drivers of research, the inability to specify products associated with research capability and the absence of a definable unit of output for research capability, it was difficult to determine the cost drivers of research in an ABF environment.
ES.3 Classification development framework for teaching and training The approval of a definition of ‘teaching and training’, along with an initial understanding of associated cost drivers, have provided a foundation for further work to develop teaching and training as a future ABF work stream.
The suitability of the new definition of teaching and training to frame the scope of a future classification for teaching and training is supported by the alignment between the definition and the trainee groups that were identified as key teaching and training cost drivers during cost driver analysis. Using this definition, the number of full-time equivalent trainees either placed (as students) or employed by a public health service would be the preferred unit of count. The scope of the classification would be defined by:
• the professional groups in which the trainee is employed (or placed) (i.e. medical, dentistry, nursing, midwifery and allied health); and
• the phase of teaching and training in which the trainee is engaged (i.e. pre-entry / student, early graduate / prevocational or advanced / vocational.
Two options for structuring the classification have been identified. Both options include the same variables (professional group, professional discipline and phase of teaching and training), but differ in the variable used to initially ‘split’ the classification. In Option One the phase of teaching and training was used as the initial split, while in Option Two the professional group was used. Ultimately, the determination of the most appropriate splitting variable should be based upon which of these provides the clearest basis for distinguishing between the sub-groups of each variable. Further work

Define TT&R and identify associated cost drivers for ABF purposes Final Report
May 2014
PAXTON PARTNERS | LEVEL 2, 448 ST KILDA ROAD, MELBOURNE VIC 3004 | PH. 03 9820 0333 | FAX. 03 9820 0777
13
to understand the costs of delivering teaching and training will be required to select a preferred option for structuring the classification.
Further work to understand the costs to deliver ‘teaching and training’ activities will benefit from the development of systems and processes to collect and report cost and activity data. IHPA has developed a Hospital Teaching and Training Activities Data Set Specification that will be a dedicated, fit-for-purpose collection that is capable of supporting the development of ABF for teaching and training. This project has identified a number of areas to focus data improvement efforts within both jurisdictions and the DSS, including a need to:
• Consider revising the name of some elements within the DSS to provide additional clarity of interpretation;
• Complete work that is currently underway to develop counting rules that will underpin the application of the DSS;
• Clearly articulate the expectation that jurisdictions submit data under the DSS at a facility-level; and
• Improve the availability and consistency of data on a number of key teaching and training variables.
The principal findings of this project highlight a need to improve understanding of the costs required to deliver teaching and training. The embedded nature of teaching and training within patient care adds additional complexity to this task. Although it may be desirable to separate the embedded component of teaching and training costs from an allocative efficiency perspective, it may not be practical or feasible to do so. Separating the costs of teaching and training that are embedded within patient care would mean that prices attached to existing patient care classifications would need to be amended to remove the ‘teaching and training component’ that exists within them. Although it may be possible to develop an approach to estimating, modelling or quantifying these embedded costs, the administrative time and effort required to do this – and then to remove these elements from existing ABF models – would be significant.
The practicality of understanding and costing the embedded component of teaching and training is a threshold question that will need to be addressed in order to frame approaches to costing (and ultimately funding) teaching and training for classification purposes. Stakeholder perspectives expressed during this project suggested that the costs of embedded teaching and training activities within patient care may be the most significant component of teaching and training costs. However, the complexity associated with extricating these costs has meant that their influence has not been confirmed, and remains poorly understood.
In spite of the administrative difficulties associated with identifying the embedded component of teaching and training costs, some attempt should be made to identify them in a comprehensive way. Doing so would allow IHPA to determine whether:
• the embedded cost component of teaching and training can be practically and feasibly quantified; and
• the impact of embedded teaching and training is material enough to warrant amending existing patient-based ABF work streams.
A detailed costing study of teaching and training is the next step to provide further information in relation to the costs to deliver related activity. If IHPA wishes to undertake further work to identify better research data, this costing study may also be an appropriate vehicle to complete this work.
Define TT&R and identify associated cost drivers for ABF purposes Final Report
May 2014
PAXTON PARTNERS | LEVEL 2, 448 ST KILDA ROAD, MELBOURNE VIC 3004 | PH. 03 9820 0333 | FAX. 03 9820 0777
14
Summary of recommendations Recommendation 1: That any further work conducted by IHPA on teaching and training be undertaken on the basis that the term ‘teaching and training’ describes:
“the activities provided by or on behalf of a public health service to facilitate the acquisition of knowledge, or development of skills. These activities must be required for an individual to:
• attain the necessary qualifications or recognised professional body registration to practice;
• acquire sufficient clinical competence upon entering the workforce; or
• undertake specialist / advanced practice
in medicine, dentistry, nursing, midwifery or allied health.”
Recommendation 2: That the Australian Hospital Patient Costing Standards are updated to align with the new definition of ‘teaching and training’ that has been approved by the Pricing Authority.
Recommendation 3: That IHPA should seek to provide further guidance on how terms contained within the new definitions should be interpreted, including:
• necessary qualifications;
• recognised professional body;
• sufficient clinical competence;
• specialist / advanced practice; and
• allied health
Recommendation 4: That any further work conducted by IHPA on research be undertaken on the basis that the term ‘research’ describes:
“the activities undertaken in a public health service where the primary objective is the advancement of knowledge that ultimately aims to improve consumer and patient health outcomes and/or health system performance. The activity must be undertaken in a structured and ethical way, be formally approved by a research governance or ethics body, and have potential for application outside of the health service in which the activity is undertaken.”
and that for ABF purposes, the definition of research relates to:
“the public health service’s contribution to maintain research capability, excluding the costs of research activities that are funded from a source other than the state or territory or provided in kind”.
Recommendation 5 : That the Australian Hospital Patient Costing Standards are updated to align with the new definition of ‘research’ that has been approved by the Pricing Authority.
Recommendation 6 Any future work to develop a classification of teaching and training activities for ABF purposes should aim to collect data on the potential cost driver variables for which data was not available during this project, including:
• differences in teaching and training requirements of vocational medical trainees between procedural and non-procedural specialties; and
• the number of international medical professionals in training.

Define TT&R and identify associated cost drivers for ABF purposes Final Report
May 2014
PAXTON PARTNERS | LEVEL 2, 448 ST KILDA ROAD, MELBOURNE VIC 3004 | PH. 03 9820 0333 | FAX. 03 9820 0777
15
Recommendation 7: Any future work to develop a classification of teaching and training activities for ABF purposes should aim to collect data on all trainee professional groups that are in scope of the definition of ‘ teaching and training’ for ABF purposes.
Recommendation 8: that IHPA should consider renaming the trainee clusters in the HTTA DSS to provide a clearer basis for differentiating between trainees at each phase of teaching and training.
Recommendation 9: Any future work to assess the costs associated with the delivery of teaching and training should consider the extent to which revenues received by public health services for delivering teaching and training activities offset teaching and training costs.
Recommendation 10: Any further work to identify the costs associated with teaching and training should attempt to separately identify its associated direct, indirect and embedded cost components.
Recommendation 11: The unit of count in a future classification of teaching and training should be the number of full-time equivalent trainees either placed (as students) or employed by a public health service.
Recommendation 12: The scope of a future classification for teaching and training activities should be defined by two primary criteria:
1. the professional group in which a trainee is employed (or placed):
• medical;
• dentistry;
• nursing and midwifery; or
• allied health.
2. the phase of teaching and training in which the individual is engaged:
• pre-entry / student;
• early graduate / pre-vocational; or
• advanced / vocational.
Recommendation 13: Any future work to identify the costs to deliver teaching and training activities should identify a preferred classification structure, based upon either ‘professional group’ or ‘phase of teaching and training’ as the initial splitting variable.
Recommendation 14: IHPA should consider a comprehensive costing study to investigate the costs of delivering teaching and training for ABF purposes, subject to acceptance of the cost and data requirements by jurisdictions. At a minimum, the costing study should seek to:
• Separately understand the direct, indirect and embedded costs to deliver teaching and training, including a detailed assessment of the feasibility of estimating, modelling or quantifying the teaching and training costs that are embedded within patient care;
• Gather data on other key variables (including potential cost drivers and trainee groups) that could not be analysed as part of the cost driver analysis of this project;
• Identify whether variations exist in teaching and training cost and intensity between clinical professional groups in various phases of their training; and
• Understand the extent to which revenues received by public health services for delivering teaching and training activities may offset teaching and training costs.

Define TT&R and identify associated cost drivers for ABF purposes Final Report
May 2014
PAXTON PARTNERS | LEVEL 2, 448 ST KILDA ROAD, MELBOURNE VIC 3004 | PH. 03 9820 0333 | FAX. 03 9820 0777
16
Recommendation 15: IHPA should consider undertaking a research-specific data collection as part of the recommended costing study of teaching and training activities, to understand the nature of research capability costs.
Recommendation 16: That IHPA should engage with jurisdictions to understand the basis upon which they have reported the costs of research activities for 2014-15.

Define TT&R and identify associated cost drivers for ABF purposes Final Report
May 2014
PAXTON PARTNERS | LEVEL 2, 448 ST KILDA ROAD, MELBOURNE VIC 3004 | PH. 03 9820 0333 | FAX. 03 9820 0777
17
1 Introduction This section provides the context to the project and the project’s objectives, scope and methodology.
1.1 Background and policy context In August 2011, the Commonwealth, States and Territories signed The National Health Reform Agreement (NHRA). Among a number of other reforms, the NHRA committed the Commonwealth and State and Territory jurisdictions to implement an Activity Based Funding (ABF) model for public healthcare services. The scope of services eligible for funding on an activity basis began with admitted acute, emergency department and non-admitted services, which were introduced from 1 July 2012. ABF for remaining non-admitted, subacute and mental health services was introduced on 1 July 2013.
In addition to payments for services on an ABF basis, the NHRA recognised that some aspects of health service delivery and related operational functions could be more appropriately funded under alternative arrangements (for example, specified grants and block funding). TT&R functions provided by public health services5 were explicitly included in this category. Clause A49 of the NHRA requires IHPA to provide advice to the Standing Council on Health on the feasibility of transitioning funding for TT&R to ABF by 1 July 2018.
Figure 3 illustrates the funding streams that flow from the Commonwealth, including both activity-based and block funding allocations.
Figure 3: Relationship of TT&R funding to other funding sources
5 Throughout this document, references to ‘public health services’ and ‘public hospitals’ are used interchangeably.

Define TT&R and identify associated cost drivers for ABF purposes Final Report
May 2014
PAXTON PARTNERS | LEVEL 2, 448 ST KILDA ROAD, MELBOURNE VIC 3004 | PH. 03 9820 0333 | FAX. 03 9820 0777
18
1.2 Key project objectives Paxton Partners was engaged by the Independent Hospital Pricing Authority (IHPA) to define teaching, training and research (TT&R) and identify associated cost drivers for activity based funding (ABF) purposes (“the project”). The project was intended to achieve three major objectives, which were:
1. To develop a set of nationally agreed definition(s) of TT&R for public health services in Australia;
2. To identify the cost drivers associated with the agreed definitions of TT&R for ABF purposes; and
3. To produce a classification development framework that considers the ways in which the identified cost drivers can be grouped in a meaningful way to explain resource usage.
IHPA has adopted funding model concepts that are based on the building blocks required to support an efficient, transparent and sustainable ABF model. These include the ability to define, classify, count, cost and pay for activities in a consistent manner. By addressing these three major objectives, the project represents the foundation work for assessing the feasibility of transitioning funding for TT&R from existing arrangements to ABF. The project was intended to provide IHPA with a greater understanding of:
• the factors and drivers that lead particular health services to incur differential costs with respect to TT&R activities; and
• preliminary considerations for identifying a fairer and more efficient method for allocating existing commonwealth funds.
The project was not intended to:
• determine the adequacy of current TT&R funding, nor recommend any increase or adjustment to the size of the current TT&R funding pool;
• evaluate the merit or otherwise of jurisdictional investments or policy decisions – however, these were investigated to gain a better understanding of TT&R considerations;
• prescribe how TT&R should be supported.
1.3 Project scope Schedule A, Clause A1 of the NHRA describes the funding to be provided by the Commonwealth Government for TT&R, and in doing so clearly set the scope parameters within which this project was undertaken. The relevant sections of Clause A1 state that:
…(in addition to a range of other services) “the Commonwealth will fund:
• Teaching and training functions funded by states undertaken in public hospitals or other organisations (such as higher education providers and training providers); and
• Research funded by states undertaken in public hospitals.”
Clause A1 of the NHRA clarifies the scope of TT&R activities considered as part of this project, in terms of limiting it to those TT&R activities that are funded by States and Territories. State/Territory funding was thus the defining element of the services that were in scope of the project.

Define TT&R and identify associated cost drivers for ABF purposes Final Report
May 2014
PAXTON PARTNERS | LEVEL 2, 448 ST KILDA ROAD, MELBOURNE VIC 3004 | PH. 03 9820 0333 | FAX. 03 9820 0777
19
This clause also points out that research activities must be undertaken in public hospitals to be eligible for Commonwealth growth funding. An important difference is that in-scope teaching and training functions do not necessarily need to be delivered within a public health service, but must be delivered by or on behalf of public health services. So long as teaching and training activities are funded by states and territories, they may be delivered in settings such as higher education providers and vocational training providers.
1.3.1 Focus on clinical teaching and training activities
A vast range of activities that occur in public health services could be categorised under the banner of teaching, training or research. An important consideration for this project was to identify those activities which were noted as being differential drivers of costs to deliver TT&R activities in health services.
This is illustrated graphically in Figure 4, which presents the case of two hospitals (A and B) that may deliver similar levels of funded activity, but provide differing levels of TT&R activity. If hospital B is not funded for the higher level of TT&R activity it undertakes it may be financially disadvantaged compared to Hospital A.
Figure 4: Illustrated example of basis for differential TT&R funding
It is recognised that public health services have a wider responsibility to deliver non-clinical teaching and training activities (for example, fire safety training, occupational health and safety and staff orientation, management and leadership training) as part of good practice in maintaining a high-performing, safe workplace. However, these organisation-wide programs must be undertaken by all health services as part of essential day to day business operations and are not funded through existing TT&R block grants, but rather through the existing ABF pool.
This project therefore did not intend to capture all activities that may constitute TT&R in a public health service. Instead it focused on clinical TT&R activities, which were considered to have a material influence on health service resource requirements (and ultimately costs) and thus best differentiate one hospital’s funding allocation from another.
1.3.2 Focus on recurrent costs
While it was recognised throughout this project that the provision of TT&R requires both recurrent and capital resources, Clause A95 of the NHRA sets the focus of IHPA’s work program on pricing recurrent costs – stating that “Capital will not be explicitly priced by the IHPA…”. Consequently, the focus of this project is on how TT&R activity may influence a health service’s recurrent costs.

Define TT&R and identify associated cost drivers for ABF purposes Final Report
May 2014
PAXTON PARTNERS | LEVEL 2, 448 ST KILDA ROAD, MELBOURNE VIC 3004 | PH. 03 9820 0333 | FAX. 03 9820 0777
20
1.4 Project methodology The project was conducted over six stages, as summarised in Figure 5.
Figure 5: Teaching, training and research definitions and cost drivers project methodology
In the initial stages of the project a Literature Review6 was undertaken to:
• provide a preliminary understanding of the nature of TT&R;
• establish how TT&R is delivered across different settings;
• identify how the understanding of TT&R has evolved in Australia over time; and
• compare existing TT&R definitions across Australia and overseas, particularly where they relate to public funding.
6 Independent Hospital Pricing Authority (2013), ‘Define Teaching, Training and Research and identify Associated Cost Drivers: Literature Review’, accessed from http://www.ihpa.gov.au/internet/ihpa/publishing.nsf/Content/teaching-training-and-research.

Define TT&R and identify associated cost drivers for ABF purposes Final Report
May 2014
PAXTON PARTNERS | LEVEL 2, 448 ST KILDA ROAD, MELBOURNE VIC 3004 | PH. 03 9820 0333 | FAX. 03 9820 0777
21
The Literature Review was used to inform more detailed discussions with over 350 stakeholders across all states and territories as part of the development of the Environmental Scan. This consultation encompassed stakeholders from all jurisdictional health authorities, 24 health services and 31 peak bodies and interest groups. A full list of organisations that were consulted is provided in Appendix A.
The stakeholder consultations provided:
• a deeper understanding of how TT&R is delivered in public health services;
• information on various factors associated with supporting TT&R in different hospital settings;
• suggestions regarding how to defining TT&R;
• perspectives on TT&R cost drivers;
• insight into trends and foreseen developments in the delivery of TT&R;
• information on the logistical considerations relating to the data collection and reporting capabilities of various stakeholder groups; and
• preliminary views for establishing a framework for classifying the activities or groups associated with the delivery of TT&R.
Responses to these issues were incorporated into the project’s Environmental Scan7 to support a basis for proposing new definitions of TT&R. Stakeholder consultation workshops, involving representatives from the organisations that participated in initial consultations, were then held to present the key findings and validate the proposed definitions. Feedback from the workshops was subsequently incorporated into an addendum8 to the Environmental Scan which included revised principles for framing definitions and the revised draft definitions.
The draft definitions were issued to a number of IHPA advisory bodies for comment prior to approval by IHPA and then circulation to ministers for further comment. The definitions of TT&R for ABF purposes were approved by the Pricing Authority on 21 February 2014.
The next stage of the project involved a quantitative analysis of the key cost drivers of TT&R proposed in the Environmental Scan. Jurisdictions and other relevant bodies were engaged to contribute data to validate the potential cost drivers and exploratory (descriptive) and statistical analyses were then conducted on the data provided. The cost drivers identified during these analyses were used to create a framework for the development of an initial classification of TT&R activities.
This report presents the substantive findings obtained through each major stage of the project and provides a series of recommendations for the further development of the TT&R workstream. In doing so, the report summarises the outcomes detailed in this project’s Literature Review, Environmental Scan and related Environmental Scan Addendum and introduces the findings in relation to the exploratory and statistical cost driver analysis and classification development framework.
7 Independent Hospital Pricing Authority (2013), ‘Define Teaching, Training and Research and identify Associated Cost Drivers: Environmental Scan’, accessed from http://www.ihpa.gov.au/internet/ihpa/publishing.nsf/Content/teaching-training-and-research. 8 Independent Hospital Pricing Authority (2013), ‘Define Teaching, Training and Research and identify Associated Cost Drivers: Addendum to Environmental Scan’, accessed from. http://www.ihpa.gov.au/internet/ihpa/publishing.nsf/Content/teaching-training-and-research.

Define TT&R and identify associated cost drivers for ABF purposes Final Report
May 2014
PAXTON PARTNERS | LEVEL 2, 448 ST KILDA ROAD, MELBOURNE VIC 3004 | PH. 03 9820 0333 | FAX. 03 9820 0777
22
1.4.1 Role of IHPA advisory bodies
Throughout the project, IHPA advisory bodies played a key role in the formulation, review and endorsement of key project deliverables. These advisory bodies and their project role included:
• The Teaching, Training and Research Working Group (TTRWG), which comprises of 47 stakeholders from jurisdictional health authorities, peak bodies and interest groups that are involved in the delivery of TT&R. The TTRWG was an important reference forum providing:
o insights in to key issues, trends and developments in TT&R;
o assistance in the coordination of stakeholder consultations;
o guidance on the collection of data to inform the cost driver analysis; and
o feedback on all project deliverables.
• The Clinical Advisory Committee (CAC), which comprises 27 clinicians, from a range of specialties and backgrounds, appointed by the Australian Government Minister for Health. CAC provided high level technical and clinical advice to the Pricing Authority on key project deliverables; and
• The Jurisdictional Advisory Committee (JAC), which comprises representatives from each state, territory and the Australian Government. JAC provided advice to the Pricing Authority on key project deliverables.
1.5 Document structure This document is structured as follows:
• Section 1 (this section) provides an introduction and background to the TT&R definitions and cost drivers project, and the structure of this document;
• Section 2 summarises the key considerations that have framed the way in which this project has been conducted;
• Section 3 presents definitions of ‘teaching and training’ and ‘research’
• Section 4 presents the identified cost drivers and classification framework for TT&R.
Appendices provide further detail in relation to organisations consulted throughout the project, data quality and availability for cost driver analysis and the detailed results of cost driver analysis.
Define TT&R and identify associated cost drivers for ABF purposes Final Report
May 2014
PAXTON PARTNERS | LEVEL 2, 448 ST KILDA ROAD, MELBOURNE VIC 3004 | PH. 03 9820 0333 | FAX. 03 9820 0777
23
2 Perspectives on TT&R A number of key issues have framed the approach to identifying definitions, cost drivers and a classification development framework for TT&R, which form the three key deliverables of this project. This section describes the general considerations that have influenced the approach to delivering these key project deliverables. Considerations that are specific to one aspect of the project are discussed later in this document in relevant sections.
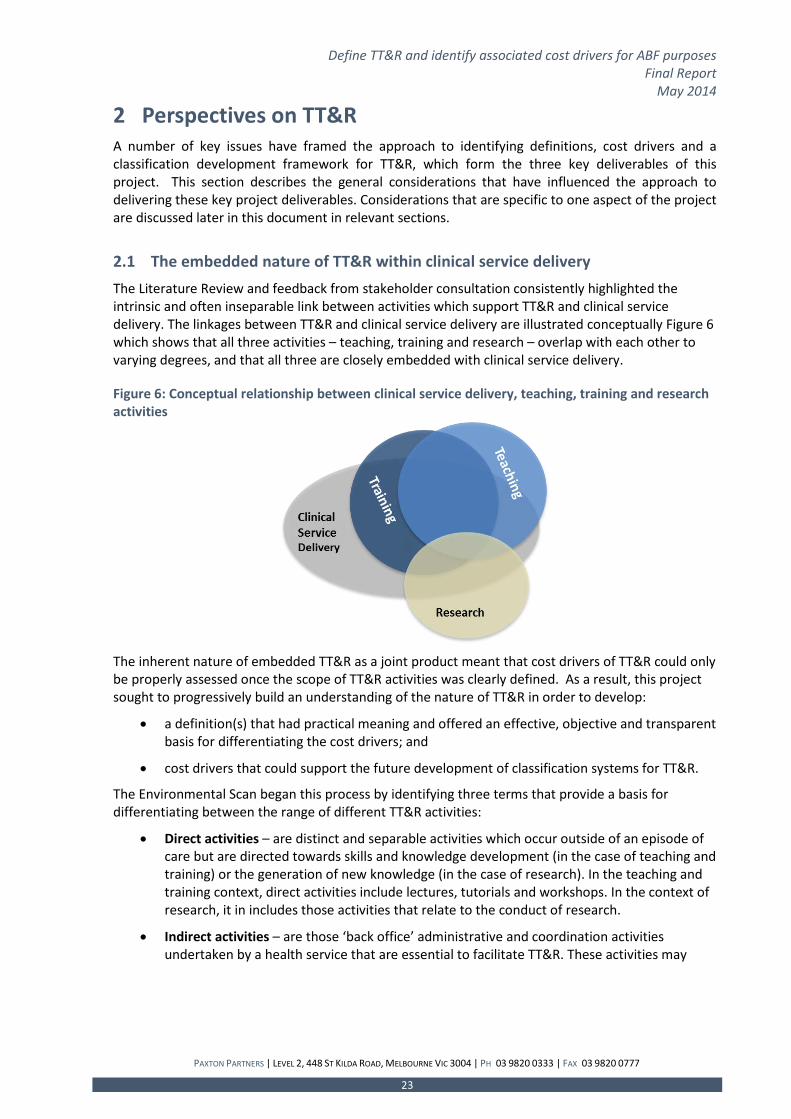
2.1 The embedded nature of TT&R within clinical service delivery The Literature Review and feedback from stakeholder consultation consistently highlighted the intrinsic and often inseparable link between activities which support TT&R and clinical service delivery. The linkages between TT&R and clinical service delivery are illustrated conceptually Figure 6 which shows that all three activities – teaching, training and research – overlap with each other to varying degrees, and that all three are closely embedded with clinical service delivery.
Figure 6: Conceptual relationship between clinical service delivery, teaching, training and research activities
The inherent nature of embedded TT&R as a joint product meant that cost drivers of TT&R could only be properly assessed once the scope of TT&R activities was clearly defined. As a result, this project sought to progressively build an understanding of the nature of TT&R in order to develop:
• a definition(s) that had practical meaning and offered an effective, objective and transparent basis for differentiating the cost drivers; and
• cost drivers that could support the future development of classification systems for TT&R.
The Environmental Scan began this process by identifying three terms that provide a basis for differentiating between the range of different TT&R activities:
• Direct activities – are distinct and separable activities which occur outside of an episode of care but are directed towards skills and knowledge development (in the case of teaching and training) or the generation of new knowledge (in the case of research). In the teaching and training context, direct activities include lectures, tutorials and workshops. In the context of research, it in includes those activities that relate to the conduct of research.
• Indirect activities – are those ‘back office’ administrative and coordination activities undertaken by a health service that are essential to facilitate TT&R. These activities may

Define TT&R and identify associated cost drivers for ABF purposes Final Report
May 2014
PAXTON PARTNERS | LEVEL 2, 448 ST KILDA ROAD, MELBOURNE VIC 3004 | PH. 03 9820 0333 | FAX. 03 9820 0777
24
include utilities, maintenance, the coordination of student placements, rotations, educational program development or negotiation with higher education providers.
Embedded activities – which describe where TT&R occurs in conjunction with patient care.
2.2 The changing nature of TT&R The Environmental Scan highlighted a number of emerging trends in TT&R that were considered during the project to ensure that project outputs (the definition(s) and classification development framework) had sufficient flexibility to capture future evolutions in delivery modes and locations. For example, to meet growing demand and as part of a rural workforce development strategy, TT&R is increasingly being conducted across a broader range of health service settings and providers. As such, TT&R now extends beyond large tertiary referral centres located in metropolitan areas to regional, rural and remote locations and community, primary and ambulatory care settings. Modes of delivering teaching and training are also evolving to take advantage of new technologies, in order to address both workforce challenges and to meet growing demand.
It is also expected that definitions will be subject to periodic review / amendment to reflect changes in practice and the broader TT&R environment.
2.3 Service delivery benefits of TT&R Notwithstanding the widespread recognition that the provision of TT&R activities result in additional costs for public health services, it was also acknowledged that, in many situations, TT&R activities are directly associated with clinical service delivery. Understanding the impacts of TT&R on patient care has provided key insights that have helped to frame the definitions, as well as understanding the impact of cost drivers in net terms.
2.3.1 Service delivery benefits associated with teaching and training
The hypothesised relationship of service delivery benefit versus teaching and training are illustrated in Figure 7 to Figure 9 for medicine, nursing / midwifery and allied health. The figures presented below were derived based on estimates contained in Western Australia’s ‘Junior Doctors Business Case’9, which were subsequently adjusted to take account of the feedback received from stakeholder consultations that informed the environmental scan.
9 Western Australia Department of Health (2011). ‘Junior Doctors Business Case’.

Define TT&R and identify associated cost drivers for ABF purposes Final Report
May 2014
PAXTON PARTNERS | LEVEL 2, 448 ST KILDA ROAD, MELBOURNE VIC 3004 | PH. 03 9820 0333 | FAX. 03 9820 0777
25
Figure 7: Training versus service delivery contribution of medical trainees
Figure 8: Training versus service delivery contribution of nursing and midwifery trainees
Figure 9: Training versus service delivery contribution of allied health trainees

Define TT&R and identify associated cost drivers for ABF purposes Final Report
May 2014
PAXTON PARTNERS | LEVEL 2, 448 ST KILDA ROAD, MELBOURNE VIC 3004 | PH. 03 9820 0333 | FAX. 03 9820 0777
26
In general terms, these figures show that the proportion of time spent on ‘teaching and training’ decreases as each trainee group gains more experience. However, the figures also acknowledged that service contribution drops, to some degree, to take account of the learning and supervision required as clinicians progress towards fulfillment of advanced qualifications. Medical trainees are thought to move towards a full service contribution at a slower pace than nursing, midwifery or allied health professionals, which, in many cases, may provide a larger contribution to clinical service delivery earlier in their employment.
2.3.2 Service delivery benefits associated with research
The project identified a range of benefits associated with providing research in clinical service environments, most of which were intangible, indirect benefits accruing to the health service’s reputation, ability to attract high-calibre staff, infrastructure investment and research funding. Research may also produce tangible benefits where research outputs can be commercialised, resulting in direct income generation for a health service.
In many cases, the value of health research endeavour is restricted to those health services that possess the infrastructure, expertise and patient characteristics to support clinical trials, tissue banking or new / advanced procedural interventions.
The benefits of research were recognised by stakeholders as being ‘real’ and significant, but they are not of a nature that would allow the health service itself to realise some type of productivity dividend as a result of its delivery. Indeed, the benefits of research may require that the value-add generated through research is intended to be disseminated to a broader population outside of the health service itself. This is in contrast to teaching and training, where the interaction of trainees with patients provides some degree of benefit to the health service’s capacity to discharge its core service delivery function.

Define TT&R and identify associated cost drivers for ABF purposes Final Report
May 2014
PAXTON PARTNERS | LEVEL 2, 448 ST KILDA ROAD, MELBOURNE VIC 3004 | PH. 03 9820 0333 | FAX. 03 9820 0777
27
3 Definitions of TT&R This section presents the definitions that were developed during this project, and describes the main considerations that informed their development.
3.1 Definition development process The process that was undertaken to determine new definitions is illustrated in Figure 10
Figure 10: Process to develop updated definitions of TT&R
3.2 The previous draft definitions of TT&R Existing ‘draft’ definitions of TT&R were developed in 2010 as part of a scoping study undertaken by Health Outcomes International (HOI) for the Commonwealth Department of Health and Ageing (DoHA). These definitions provided a starting point for the development of updated definitions of TT&R, and are provided in Box 1.

Define TT&R and identify associated cost drivers for ABF purposes Final Report
May 2014
PAXTON PARTNERS | LEVEL 2, 448 ST KILDA ROAD, MELBOURNE VIC 3004 | PH. 03 9820 0333 | FAX. 03 9820 0777
28
Box 1: Draft definitions of TT&R developed by Health Outcomes International
Teaching is any activity where the primary aim is to transfer clinical knowledge of ongoing professional development via a teacher or mentor to a student or candidate in a recognised program/course that will result in either: • qualifications that may meet registration requirements; or • other admission to a specified discipline where the right to practise in that discipline requires
completion of the program or course.
Teaching activities may include: • automated/self-directed learning where the teaching component is electronically provided; • presentation and development of content; and • supervision/ participation in curriculum based research.
Secondary benefits of teaching may include:
• improved health service recruitment and retention rates (through, for example, a successful student placement experience).
This excludes product teaching and indirect teaching.
Training is the planned and organised activity to impart skills, techniques and method to employers and their employees to assist them in: • supporting staff retention through career pathways; • professional development activities; • establishing and maintaining employment and a place of employment which is safe and healthy; • improving health knowledge through keeping staff up to date with health industry trends and
new technologies; and • reducing health costs through improved ways of working.
Research is an activity where the primary aim is the advancement of knowledge through: • observation, data analysis and interpretation, or other means that are secondary to the primary
purpose of providing patient care; • activities associated with patient care where additional components or tasks exist (e.g. the
addition of control group in a cohort study); • investigations or applications related to patient care.
Research is an activity which provides: • evidence as to whether or not new knowledge is being transformed into effective clinical practice
for the consumer; • reports about the importance, worth and meaning (of their health) to consumers; • recommendations and guidelines for future health investment; and • a contribution to health service capacity building through undertaking useful planning work such
as reviews, evaluations and needs studies.
This excludes curriculum-based research projects, by-product research, quality assurance, evaluation and clinical audit activity.

Define TT&R and identify associated cost drivers for ABF purposes Final Report
May 2014
PAXTON PARTNERS | LEVEL 2, 448 ST KILDA ROAD, MELBOURNE VIC 3004 | PH. 03 9820 0333 | FAX. 03 9820 0777
29
3.3 General considerations for framing new definitions This section summarises a range of considerations that shaped the approach to developing new definitions of TT&R.
3.3.1 Feedback on HOI draft definitions
Feedback was sought from stakeholders about:
• whether the HOI draft definitions provided an adequate starting point for framing new definitions for ABF purposes; and
• how HOI draft definitions could be modified, adapted or reconstructed.
Stakeholders generally agreed that the HOI definitions provided a basis for defining TT&R from a policy or theoretical perspective. However, a number of elements within the HOI definitions were identified as either too prescriptive, missing altogether or too difficult to capture in practical terms. Feedback highlighted the need to:
• establish a clearer distinction between teaching and training (although others identified that “training should be defined alongside the concept of teaching”);
• identify a schedule of included professions that are considered ‘clinical’ for the purposes of funding;
• distinguish between direct and indirect TT&R, and formal/informal TT&R;
• recognise the role of vocational education and training in health workforce development activities, rather than focus purely on higher education professions;
• capture infrastructure costs associated with research;
• clarify whether externally funded research is covered under the definition;
• resolve contradictions in the internal logic of the research definition – for example, the HOI research definition included “investigations or applications related to patient care” but excluded “indirect or by-product care”; and
• resolve ambiguity in the meaning of some terms such as “curriculum-based research” and “by-product research”.
The issues highlighted in relation to the HOI definitions indicated that a principles-based approach would be the best way to address these definitional issues.
3.3.2 Applicability for ABF
As discussed in Section 1.1, this project is intended to provide the foundation work for assessing the feasibility of transitioning funding for TT&R from existing arrangements to ABF. A requirement of the project was therefore that definitions be framed to support the identification and quantification of outputs that can be used as a measure of activity.
3.3.3 Conceptual differences between teaching, training and research
A threshold question in the development of definitions for TT&R was whether ‘TT&R’ should be treated as:
• a single concept i.e. ‘teaching training and research’;
• two separate concepts i.e. separating ‘teaching and training’ from ‘research’; or
• three separate concepts i.e. separating ‘teaching’, ‘training’ and ‘research’ from one another.

Define TT&R and identify associated cost drivers for ABF purposes Final Report
May 2014
PAXTON PARTNERS | LEVEL 2, 448 ST KILDA ROAD, MELBOURNE VIC 3004 | PH. 03 9820 0333 | FAX. 03 9820 0777
30
A consistent theme to be drawn out of the Literature Review and stakeholder consultation was that the structures and functions that support research are conceptually and practically distinct from those that support the delivery of teaching and training. The Literature Review and Environmental Scan also revealed that various descriptions of TT&R have been adopted for the purposes of policy, management and funding of TT&R across Australia and internationally. Some of these descriptions provided a distinction between ‘teaching’ and ‘training’. However, significant overlap was identified in activities considered ‘teaching’ and those that were considered ‘training’. This resulted in the two terms being used interchangeably in both published literature and jurisdictional policy and funding guidelines. Many articles also supported the view that a single concept such as ‘teaching’ or ‘education’ was sufficient to capture the essence of both ‘teaching’ and ‘training’. This raised questions regarding the materiality of distinguishing one from the other and the basis upon which any distinction could be made. It was therefore decided that definitions should cover two concepts – ‘teaching and training’ and ‘research’ – with teaching and training captured within one definition.
3.4 Defining teaching and training for ABF purposes This section describes the key issues and principles that have informed the development of the new definition of teaching and training for ABF purposes.
The Literature Review and Environmental Scan highlighted a number of key themes that informed the basis for understanding the nature of teaching and training and how it could be reflected in a definition that has applicability in an ABF context. These key themes related to:
• The continuum of teaching and training activities;
• The scope of teaching and training for ABF purposes; and
• The breadth of allied health disciplines.
3.4.1 The continuum of teaching and training activities in public health services
Public health services undertake a vast range of activities that may foreseeably be categorised as teaching and training. The range of teaching and training activities that may be undertaken in public health services, are described in Table 1. It should be noted that this table has been taken from the Environmental Scan and highlights both clinical and non-clinical teaching and training activities. However, as discussed in Section 1.3.1, the focus of this project was on clinical TT&R activities.
Table 1: The 'continuum' of teaching and training activities that may be undertaken in public health services
Type of teaching and training activity Examples Recipients
i. Pre-entry student placement
• Lectures / tutorials / grand rounds • Clinical unit supervision • Ward rounds / clinics • Assessment (including Work-Based Assessment).
• Undergraduate, diploma, certificate and postgraduate students on clinical placement (Medical, dentistry, nursing, midwifery and allied health).
ii. Early graduate and pre-vocational training programs
• Lectures / tutorials / grand rounds • Ward rounds / clinics • Dedicated education days and study leave
• Medical and dental PGY1s and PGY2s
• Nursing, midwifery and

Define TT&R and identify associated cost drivers for ABF purposes Final Report
May 2014
PAXTON PARTNERS | LEVEL 2, 448 ST KILDA ROAD, MELBOURNE VIC 3004 | PH. 03 9820 0333 | FAX. 03 9820 0777
31
Type of teaching and training activity Examples Recipients
• Clinical unit supervision • Assessment.
allied health professional entry graduates
• Allied health interns (selected disciplines only).
iii. Vocational medical training programs
• Clinical practice • Dedicated education day and study leave • Clinical speciality supervision • Work based assessment.
• Medical registrars (basic and advanced).
iv. Health service initiated training
• Orientation / induction • Occupational Health and Safety (OH&S) training • Security awareness.
• All staff employed within a health service.
v. Retraining of clinicians returning to the health workforce
Refresh – individuals still registered but require retraining to re-enter the health service workforce; Retrain – individuals seeking retraining where their registration has lapsed.
• All medical, dentistry, nursing and midwifery and allied health professionals.
vi. Training to achieve recognition as an advanced / specialist professional
• Attainment of post graduate qualifications to achieve advanced or extended scopes of practice;
• Typically Masters level or above.
• Nursing and midwifery – Clinical Nurse Specialists and Nurse Practitioners;
• Allied Health – specialist training.
vii. Continuing professional development
• Continuing Professional Development (CPD) hours • Refresh courses • Clinical practice competence • Conferences.
• All medical, dental, nursing, midwifery and allied health professionals.
viii. Externally mandated training
• Australian Commission on Safety and Quality in Health Care (ACSQHC) National safety and quality standards: o Infection control, Medication safety, Patient
identification and matching, Clinical handover, Blood products, Pressure injuries, Responding to clinical deterioration – Life support, Falls prevention.
• Australian Council on Healthcare Standards (ACHS) hospital accreditation standards.
• All medical, dentistry, nursing, midwifery and allied health professionals;
• Technicians.
ix. Clinical knowledge and skills training
• Skills training to support new purchase of diagnostic equipment;
• Education for introducing new drug on formulary; • Introduction of new procedure techniques.
• All medical, dentistry, nursing, midwifery and allied health professionals;
• Technicians.
x. Corporate, management and leadership training
• Business management training for Nurse Unit Managers;
• Clinician leadership training.
• Non-clinical staff; • Candidates for clinical
supervision roles.

Define TT&R and identify associated cost drivers for ABF purposes Final Report
May 2014
PAXTON PARTNERS | LEVEL 2, 448 ST KILDA ROAD, MELBOURNE VIC 3004 | PH. 03 9820 0333 | FAX. 03 9820 0777
32
The nature of clinical teaching and training in a public health service setting is often seen as a broad continuum, where different professional groups receive (and in turn, deliver) varying forms of teaching and training as they progress through phases of training.
Figure 11 illustrates a high level view of teaching and training pathways in public health services for each major clinical professional group. It should be noted that a ‘Clinical Practitioner’ phase has been included in Figure 11 for completeness, to describe those employees that are considered fully functional members of the health workforce but are typically not actively engaged in teaching and training activities. For the purpose of this project, however, ‘Clinical Practitioner’ is not considered as a phase of teaching and training, and is not captured by the definition.
Figure 11: Typical teaching and training pathways for major health professional groups

Define TT&R and identify associated cost drivers for ABF purposes Final Report
May 2014
PAXTON PARTNERS | LEVEL 2, 448 ST KILDA ROAD, MELBOURNE VIC 3004 | PH. 03 9820 0333 | FAX. 03 9820 0777
33
3.4.2 The scope of teaching and training for ABF purposes
The breadth of teaching and training activity resulted in a diversity of views between jurisdictions, peak bodies and professional groups on the parameters for defining teaching and training, particularly the basis for identifying which activities should be ‘in-scope’ of the definition.
For the purposes of informing the definition of teaching and training, the prevailing view was that, for ABF purposes, the definition should include only activities that are required for clinical professionals to either:
• obtain qualifications;
• achieve registration requirements of professional bodies;
• attain sufficient clinical competence to practice (including professionals seeking to re-enter the workforce after a period of absence); or
• undertake specialist or advanced practice.
Importantly, Continuing Professional Development (CPD) for clinicians was agreed not to form part of the definition on the basis that:
• CPD is required to be undertaken for clinicians across all hospitals and is therefore not a differential driver of training and teaching costs;
• it was suggested that CPD is a normal course of business activity;
• some states and territories provide separate funding for CPD as part of award conditions;
• CPD is not nationally or professionally consistent and may have different meanings in different professions; and
• it is ultimately an individual’s responsibility (not the health service’s) to support their own CPD.
Training required to support the introduction of new clinical techniques or technologies was also not included within the scope of the definition as this is largely at the discretion of a public health service to invest and introduce these new technologies. Furthermore, IHPA separately monitors the impact of new technologies to accurately and separately account for them in the pricing of public health services.
3.4.3 The breadth of allied health disciplines
A key issue discussed in the Environmental Scan related to the types of disciplines that should be included within the context of ‘allied health’. In total, 67 potential allied health disciplines were identified through the Literature Review and Environmental Scan, with the number of disciplines recognised as allied health for funding purposes across Australia varying from a minimum of 12 in one jurisdiction, to a maximum of 29 in another.
It was agreed that it was beyond the scope of this project to establish a definition for Allied Health. However, it was recognised that this project sits in the context of other policy documents that will clarify which allied health disciplines should be reported as part of teaching and training data collections. In this context, the inaugural HTTA DSS included 21 allied health disciplines in its list of permissible values. This list will be reviewed as the HTTA DSS develops.

Define TT&R and identify associated cost drivers for ABF purposes Final Report
May 2014
PAXTON PARTNERS | LEVEL 2, 448 ST KILDA ROAD, MELBOURNE VIC 3004 | PH. 03 9820 0333 | FAX. 03 9820 0777
34
3.4.4 Summary - principles underpinning the definition of teaching and training
The principles that framed the new definition of teaching and training were:
1. the definition should be concise and practical;
2. while a technical distinction for teaching and training could be defined, in practical terms the distinction between the two terms is ‘artificial’ or ‘semantic’. Teaching and training are most often delivered in a joint and complimentary way. Therefore a single definition should encapsulate the activities under both;
3. the definition should be easily adaptable to the changing nature and emerging trends in how teaching and training is conducted;
4. the definition should relate to medicine, dentistry, nursing, midwifery and allied health, on the basis that these disciplines have a direct patient or consumer relationship in a public health service;
5. the definition should cover those professional levels that require exposure to a clinical environment in order to fulfil the qualification or registration requirements of the discipline in which they intend to practice, and the attainment of additional qualifications to undertake specialist / advanced practice in the discipline;
6. the definition should cover those teaching and training activities that contribute to the attainment of a qualification or professional body registration;
7. the definition should only include activities and resources that are provided by or on behalf of public health services which are funded by the states and territories; and
8. the definition should cover the direct, indirect and embedded resources incurred by a public health service that are required to support teaching and training.
3.4.5 The inclusion of formal programs for nursing, midwifery and allied health first year graduates
It was suggested during stakeholder consultation workshops that formal programs for nursing, midwifery and allied health first year graduates should be covered by the teaching and training definition. However, there was varied feedback as to whether significant resource requirements are consistently incurred, for a significant period of time, before substantiative service delivery benefits are provided. These formal programs were therefore not included in the initial principles that framed the definition nor the definitions presented in the Environmental Scan Addendum.
This issue touched on the wider topic of the ‘work readiness’ of early graduates. The supervised practice required for provisional psychologists to attain general registration was already in-scope of the definition so the issue of first year graduate nurses, midwives and allied health professionals was thought to be worthy of further development work. However, the lack of national standards and defined end points across professions complicated inclusion of first year graduates in the definition. On balance, it was decided that it was appropriate to recognise the costs of first year graduates in the teaching and training definition. Formal programs for nursing, midwifery and allied health first year graduates are therefore covered by the definition of teaching and training that was approved by the Pricing Authority.

Define TT&R and identify associated cost drivers for ABF purposes Final Report
May 2014
PAXTON PARTNERS | LEVEL 2, 448 ST KILDA ROAD, MELBOURNE VIC 3004 | PH. 03 9820 0333 | FAX. 03 9820 0777
35
3.4.6 The new definition of teaching and training for ABF purposes
The definition of teaching and training that was approved by the Pricing Authority is presented in Box 2.
Box 2: Definition of 'teaching and training' approved by the Pricing Authority Teaching and training describes:
the activities provided by or on behalf of a public health service to facilitate the acquisition of knowledge, or development of skills. These activities must be required for an individual to:
• attain the necessary qualifications or recognised professional body registration to practice;
• acquire sufficient clinical competence upon entering the workforce; or
• undertake specialist / advanced practice
in medicine, dentistry, nursing, midwifery or allied health.
Recommendation 1: That any further work conducted by IHPA on teaching and training be undertaken on the basis that the term ‘teaching and training’ describes: “the activities provided by or on behalf of a public health service to facilitate the acquisition of knowledge, or development of skills. These activities must be required for an individual to:
• attain the necessary qualifications or recognised professional body registration to practice;
• acquire sufficient clinical competence upon entering the workforce; or
• undertake specialist / advanced practice
in medicine, dentistry, nursing, midwifery or allied health.”
Following the approval of the definition for the purpose of ABF, a logical next step would be to ensure that future work to classify, count, cost and price teaching and training activities is conducted in accordance with the definition’s scope. Although costing standards are in place that govern the allocation of costs for ‘teaching’, these are based upon the definitions of ‘teaching’ and ‘training’ that were developed by HOI, which are not consistent with the new definitions adopted above. Therefore, the Australian Hospital Patient costing Standards (AHPCS) should be updated to align with the new definition of teaching and training.
Recommendation 2: That the Australian Hospital Patient Costing Standards are updated to align with the new definition of ‘teaching and training’ that has been approved by the Pricing Authority
For the purpose of practicality and conciseness, the definition of teaching and training was drafted at a high level. As a result, the definition includes terms that may require interpretation before it can operate as intended. Terms specifically identified as requiring interpretation were ‘necessary qualifications’, ‘recognised professional body’, ‘sufficient clinical competence’, ‘specialist / advanced practice’ and ‘allied health’.
It is not intended that further amendment be pursued to the definition itself. Rather, to ensure clarity of interpretation, guidance should be provided in documents that support its application – for example the permissible values and guide for use of the HTTA DSS.

Define TT&R and identify associated cost drivers for ABF purposes Final Report
May 2014
PAXTON PARTNERS | LEVEL 2, 448 ST KILDA ROAD, MELBOURNE VIC 3004 | PH. 03 9820 0333 | FAX. 03 9820 0777
36
Recommendation 3: That IHPA should seek to provide further guidance on how terms contained within the new definitions should be interpreted, including:
• necessary qualifications;
• recognised professional body;
• sufficient clinical competence;
• specialist / advanced practice; and
• allied health
3.5 Defining research for ABF purposes The available literature recognised the significant breadth of research activities that occur, the number of different organisations that may be involved in its delivery and the difficulties associated with identifying the type of research that is supported by public health services. Although there appears to be recognition that some health and medical research is funded directly and supported by states and territories, there was no explicit recognition of what the term ‘research’ actually means for the purpose of funding, aside from the definition developed by HOI.
In a similar way to the development of the teaching and training definition, the findings of the Literature Review and Environmental Scan identified a number of key issues that were considered important to reflect in an updated definition of research.
These issues included:
• Defining the scope of research for ABF purposes;
• How to capture the breadth of research activities that may occur in a public health service;
• How to account for the role of external research bodies;
• The added costs to public health services of establishing new research capability; and
• In-kind contributions by public health services towards research.
3.5.1 Defining the scope of ‘research’ for ABF purposes
A key conceptual challenge from the project related to identifying the factors that differentiate research for ABF purposes. As discussed in Section 1.1, the Commonwealth will only provide funding for research activities that are currently funded by states and territories. Stakeholders consistently recognised that most research conducted within public health services had an external source of funding. Public health services were predominately seen as facilitators of research, by providing the facilities, governance, administrative and labour resources for research to take place. The nature of support provided by public health services towards research activities was identified as including provision of:
• A governance unit, research directorate or administrative office which supports the coordination, registration and submission of research projects and related grants;
• Ethics and advisory committees (Human, Animal and Biosafety) including salaries for members, administrative supports and infrastructure;
• Research forums, events and publications including Grand Rounds, research weeks and research reports;
• Support for academic and health professional posts to support research activities; and

Define TT&R and identify associated cost drivers for ABF purposes Final Report
May 2014
PAXTON PARTNERS | LEVEL 2, 448 ST KILDA ROAD, MELBOURNE VIC 3004 | PH. 03 9820 0333 | FAX. 03 9820 0777
37
• The development and maintenance of data repositories and bioinformatics systems to collect, analyse and manage research data.
For this reason, it was not the research project activities themselves, but the identification of a public health service’s commitment or ‘capability’ to support research endeavour, that was considered to be the key element of any definition for ABF purposes.
3.5.2 How to capture the breadth of research activities
The Literature Review and Environmental Scan highlighted significant variability in the nature of research activities. At a high level, the types of research activities that are conducted in public health services may include pre-clinical, clinical, biomedical, translational, epidemiological, health systems and clinical trials, among others. The outputs of these activities will naturally differ, as will the activities and resources that are employed to produce the outputs. Even within a single ‘type’ of research, the nature of the activities and resources used may vary dramatically.
These findings provided further support to the use of a principles-based approach to framing the research definition. The principles-based approach provided sufficient breadth to ensure that the range of activities relevant to research could be captured, and avoided the likelihood of the definition getting caught up in specific examples of what research is and is not, which was identified as a shortcoming of the HOI draft definition.
3.5.3 How to account for the role of external research bodies
The direct and indirect relationships that a public health service holds with affiliated research organisations can have a significant bearing on the nature, size, approach and strategy towards research undertaken by a public health service.
Clinical research projects may be submitted, managed and delivered on a consortium basis and are often instigated by an organisation other than the public health service, even though the clinical research component will most likely be conducted within the public health service. However, these projects also require greater levels of control and accounting to ensure costs and charges are appropriately attributed against the relevant research grants for the direct and indirect costs that are attributable to the research projects.
The impact of these issues on this project relate to the ability to appropriately separate the contributory cost of the public health service in supporting the research activities of these multi-site research consortiums, particularly where the public health service is an active participant in providing key administrative, managerial and coordinating functions.
3.5.4 The added costs to public health services of establishing new research capability
A common theme to emerge from the project related to the differences between public health services seeking to build a research capability “de novo” compared to those public health services with long standing research experience and infrastructure already in place. Even though the costs required to invest in research endeavour is seen as a significant barrier to entry, research capability was highlighted as a significant value-add to a hospital’s ability to attract and retain high-quality clinical staff, to promote advances in the quality of patient care as well as indirectly fostering teaching and training activity. However, a ‘chicken and egg’ problem was noted with regard to the development of research capability – that is, research funding is typically reliant on sourcing funding through competitive grants, which are typically allocated to those facilities with more / better resources.

Define TT&R and identify associated cost drivers for ABF purposes Final Report
May 2014
PAXTON PARTNERS | LEVEL 2, 448 ST KILDA ROAD, MELBOURNE VIC 3004 | PH. 03 9820 0333 | FAX. 03 9820 0777
38
Most hospitals located outside of major cities were seen to be relatively disadvantaged in terms of the infrastructure and resources required to support research, and often missed out on sourcing competitive grant funding (which is usually awarded to researchers in metropolitan tertiary hospitals or affiliated research institutes). In effect, this suggests that the playing field is not even, making it difficult for smaller hospitals to attract and build research capability.
3.5.5 In-kind contributions by public health services towards research
Stakeholders also acknowledged that public health services may often support research project activities that are either externally funded or internally invested (not explicitly funded through State and Territory grants) through ‘in-kind’ support. In these situations, the public health service either directly or indirectly provides additional resources which may not be expressly reflected in the research projects’ grant funding agreement. Examples of the types of resources contributed ‘in-kind’ include support provided by clinical or non-clinical public hospital staff andthe use of public health service equipment, diagnostic testing and other consumables. It is assumed in these situations, that management of the public health service endorses the use of these resources in the knowledge that they are not being recovered through alternative funding sources.
3.5.6 Summary - principles underpinning the definition of research for ABF purposes
The principles that framed the new definition of research were:
1. result in an output(s) that generates new knowledge;
2. require that the activities associated with research are undertaken in accordance with a structured, methodical or systematic approach;
3. only capture activity that is approved through an appropriate governance body or ethics committee structure of the health service / jurisdiction;
4. include activities that are conducted within the public health service but that may be instigated and managed by an affiliated organisation;
5. result in an output(s) that has potential applicability in a wider context than just the organisation conducting the research;
6. allow for a broader range of investigations and applications than just those related to patient care;
7. exclude activities that are part of a public health service’s normal course of business to deliver high quality care and safe environments (i.e. clinical audit, quality assurance, continuous improvement);
8. exclude any costs related to a research activity that are directly tied to a funding source other than the state or territory government;
9. recognise that some research activities which involve patient interaction may result in impacts on clinical service delivery other than just the direct costs of research (e.g. changes in length of stay, change in normal clinical pathways etc.)

Define TT&R and identify associated cost drivers for ABF purposes Final Report
May 2014
PAXTON PARTNERS | LEVEL 2, 448 ST KILDA ROAD, MELBOURNE VIC 3004 | PH. 03 9820 0333 | FAX. 03 9820 0777
39
3.5.7 The new definition of research for ABF purposes
The definition of research that was approved by the Pricing Authority is presented in Box 310.
Box 3: Definition of 'research' approved by the Pricing Authority Research describes:
The activities undertaken in a public health service where the primary objective is the advancement of knowledge that ultimately aims to improve consumer and patient health outcomes and/or health system performance. The activity must be undertaken in a structured and ethical way, be formally approved by a research governance or ethics body, and have potential for application outside of the health service in which the activity is undertaken.
For ABF purposes, the definition of research relates to:
the public health service’s contribution to maintain research capability, excluding the costs of research activities that are funded from a source other than the state or territory or provided in kind.
Recommendation 4: That any further work conducted by IHPA on research be undertaken on the basis that the term ‘research’ describes:
“the activities undertaken in a public health service where the primary objective is the advancement of knowledge that ultimately aims to improve consumer and patient health outcomes and/or health system performance. The activity must be undertaken in a structured and ethical way, be formally approved by a research governance or ethics body, and have potential for application outside of the health service in which the activity is undertaken.”
and that for ABF purposes, the definition of research relates to:
“the public health service’s contribution to maintain research capability, excluding the costs of research activities that are funded from a source other than the state or territory or provided in kind.”
In a similar way to ‘teaching and training’, existing guidance for costing ‘research’ exists within the AHPCS, however, these costing standards are not consistent with the new definition of research for ABF purposes that has been approved by the Pricing Authority. Accordingly, the AHPCS should be updated to align with the new definition of research.
Recommendation 5 : That the Australian Hospital Patient Costing Standards are updated to align with the new definition of ‘research’ that has been approved by the Pricing Authority.
10 This definition differs slightly from the research definition presented in the Environmental Scan Addendum, due to revisions by the Pricing Authority in response to feedback received from IHPA advisory bodies – specifically, to clarify the exclusion of in-kind contributions.

Define TT&R and identify associated cost drivers for ABF purposes Final Report
May 2014
PAXTON PARTNERS | LEVEL 2, 448 ST KILDA ROAD, MELBOURNE VIC 3004 | PH. 03 9820 0333 | FAX. 03 9820 0777
40
4 Identifying cost drivers of TT&R and developing a classification framework
The next stage of the project aimed to establish factors that are differential drivers of resource costs between hospitals, in order identify a basis for classifying TT&R activities.
4.1 TT&R considerations influencing the cost driver analysis It is generally acknowledged that health services that perform TT&R functions have higher costs compared to health services of a similar type where TT&R activities are not performed. Despite this general understanding, the factors that drive those costs are not commonly understood or agreed. The Literature Review and Environmental Scan revealed that the reasons for this lack of consensus are multi-factorial, including:
• Differences in hospital characteristics as sources of cost variation;
• The availability of robust data to understand the cost drivers of TT&R; and
• Diversity in approaches to teaching and training.
As a result, identifying the cost drivers of TT&R is a complex undertaking. The influence of these factors is discussed below.
4.1.1 Differences in hospital characteristics as sources of cost variation
The inherent variability in a public health service’s mix of case load, service mix, workforce organisation structures and geography (among others) make it difficult to assess two public health services on the same footing for comparative purposes.
Even if two health services have the same mix of TT&R activity, variations in their respective operating characteristics may mean the impact of TT&R on their overall cost base will be different. As a result, the task of isolating cost drivers of TT&R is a highly complex issue – particularly in an environment where TT&R is undertaken in a broadening range of locations and facilities, with different cost bases and operating characteristics.
Consequently, the statistical analysis for this project sought to account for the sources of legitimate and unavoidable variations in hospitals costs before assessing the impact of TT&R variables.
4.1.2 The availability of robust data to understand the cost drivers of TT&R
There is no existing national data collection that is specifically designed for the purpose of describing TT&R activity or costs. Some jurisdictions have developed systems and processes that provide this data. However, while most other jurisdictions recognise the value and importance of having such systems in place, to date they have not been developed to a level of maturity that is capable of supporting an ABF approach to TT&R.
IHPA has recognised the critical importance of robust data to inform the development of TT&R as an ABF work stream. As a result, IHPA has developed a Hospital Teaching and Training Data Set Specification (HTTA DSS) that will provide a framework for the future collection of teaching and training (and potentially, research) data through the states and territories. A staged process is planned for collection using the DSS, beginning with collection on a ‘best efforts’ basis during 2014-15. This staged approach will allow jurisdictions to establish systems to collect TT&R data in a stepwise fashion, which is intended to promote improved data reliability and robustness.

Define TT&R and identify associated cost drivers for ABF purposes Final Report
May 2014
PAXTON PARTNERS | LEVEL 2, 448 ST KILDA ROAD, MELBOURNE VIC 3004 | PH. 03 9820 0333 | FAX. 03 9820 0777
41
The absence of a single national data collection that describes TT&R activity or costs proved to be a significant complication in data procurement, and required that data was obtained from a number of different sources, including jurisdictional health departments, HWA, IHPA and the Association of Australian Medical Research Institutes (AAMRI). Data collection in relation to research was particularly problematic, and ultimately required manual collection from health services, which yielded data for only eight facilities. The absence of a sufficient sample of research data subsequently precluded the application of a statistical analysis of research cost drivers. Appendix B describes the approach to collecting TT&R data in more detail.
4.1.3 The diversity in approaches to teaching and training
The Environmental Scan highlighted the diversity of approaches to teaching and training provision between jurisdictions, health services and education providers. Although national standards and frameworks exist for the delivery of clinical education and training to all levels of the health workforce (pre-entry / student, early graduate / pre-vocational and advanced / vocational), the approaches to achieving these requirements vary substantially according to:
• The education provider (at the student or post-graduate level) – differences in clinical placement data varies by university in some instances. Similarly, education providers may set varying levels of clinical exposure requirements for postgraduate trainees such as Nurse Practitioner candidates to achieve their qualifications;
• Jurisdiction (at the pre-vocational level) – although a National Curriculum Framework for Junior Doctors has been established that outlines the knowledge, skills and behaviours required of prevocational doctors, the intensity of training for prevocational medical training is known to vary by jurisdiction. Different bodies are responsible for managing the placement and training of junior doctors in each jurisdiction which may also set different standards of training; for example, the Health Education and Training Institute in New South Wales, the Postgraduate Medical Council of Victoria, Queensland Health, South Australian Medical Education and Training, and the Postgraduate Medical Council of Western Australia.
• The health service (at the early graduate and post-graduate levels) – although some hospitals run formalised graduate programs for nursing and allied health professionals entering the workforce for the first time, others do not. There is no uniform national requirement for early graduates to be rotated through a range of different clinical areas, to have protected training time, or for preceptor guidance.
Professional peak body / colleges – across all disciplines, the various professional bodies / colleges set different requirements to achieve registration. This extends beyond medical vocational training into areas such as allied health where some disciplines are required to undertake ‘pre-vocational years’ akin to medicine and others are not. Many allied health disciplines are ‘self-regulated’, which means that professionals are eligible for membership following completion of an accredited higher education course or training program. Differences in training requirements between procedural (surgical) and non-procedural (medical) colleges were highlighted as being highly divergent during the Environmental Scan, to the point that these factors were identified as potential cost drivers.
These variations complicated the task of establishing the costs of teaching and training across all trainee levels.

Define TT&R and identify associated cost drivers for ABF purposes Final Report
May 2014
PAXTON PARTNERS | LEVEL 2, 448 ST KILDA ROAD, MELBOURNE VIC 3004 | PH. 03 9820 0333 | FAX. 03 9820 0777
42
4.2 Overview of cost driver analysis methodology The analytical approach to cost driver analysis comprised two stages, an exploratory stage and a statistical (regression) stage. This approach sought to progressively focus the analysis towards identifying a sub-set of teaching and training variables that reliably predicted teaching and training costs. This process is summarised in Figure 12.
Figure 12: Summary of cost driver analysis methodology
4.2.1 Exploratory analysis
The exploratory analysis was undertaken using a range of scatter plots, histograms and descriptive statistics to:
• develop an initial understanding of the relationships between key variables;
• identify the most appropriate dependent variable to use in the statistical analysis; and
• to test whether variables were suitable for the type of statistical analysis that was conducted.
4.2.2 Statistical analysis
To achieve the level of certainty required to establish variables as cost drivers, regression analysis was used, incorporating a stepwise approach. Statistical Package for the Social Sciences (SPSS) version 22 was used to perform the analysis.
Regression analysis is a statistical technique used for estimating the significance of relationships among variables by understanding how the typical value of one variable (the dependent or ‘response’ variable) changes when any one of the other variables (the independent or ‘predictor’ variables) is adjusted. For this analysis, the dependent variable was total recurrent hospital expenditure (a proxy for teaching and training costs), while the independent variables included:
• a range of ‘general hospital cost factors’ that are known to be sources of legitimate and unavoidable variations in hospital costs; and
• a set of variables (for which data was available) that represented the potential drivers of teaching and training costs.
These independent variables are listed in Table 2.

Define TT&R and identify associated cost drivers for ABF purposes Final Report
May 2014
PAXTON PARTNERS | LEVEL 2, 448 ST KILDA ROAD, MELBOURNE VIC 3004 | PH. 03 9820 0333 | FAX. 03 9820 0777
43
Table 2: Variables tested in the statistical analysis of teaching and training cost drivers General hospital cost factors Teaching and training variables
• acute case complexity index • teaching status • paediatric hospital status • geography (remoteness area) • total weighted hospital activity volume
• medical student FTE • dentistry student FTE • nursing and midwifery student FTE • allied health student FTE • first year nursing and midwifery graduate FTE • first year allied health graduate FTE • medical postgraduate year 1 FTE • medical postgraduate year 2 FTE • basic registrar FTE11 • advanced registrar FTE12
Stepwise regression approaches use statistical criteria to find the most succinct combination of independent variables that explain the variation in a dependent variable. The general hospital cost factors were entered into the model first. The model then chose which teaching and training variables provided a statistically significant improvement to explaining the variation in total recurrent expenditure, using statistical criteria. The outputs of the analysis represented a subset of the teaching and training variables that were potential drivers of total recurrent expenditure. These teaching and training variables represent those that are most likely to be incorporated in any future teaching and training classification system. The detailed methodology and data sources used to conduct the statistical cost driver analysis are outlined in Appendix B.
4.2.3 The difference between cost driver analysis and costing studies
It is important to note that the analysis of TT&R cost drivers described in this paper is not a ‘costing study’. Cost driver analyses and costing studies differ in some key aspects, including that cost driver analyses aim to identify the factors that explain differences in costs between hospitals. Costing studies aim to quantify costs.
As a result, cost driver analysis is often undertaken as a precursor to a costing study. Knowledge of the factors driving costs must first be understood before these costs can be used to develop a classification for ABF purposes.
11 ‘Basic Registrars’ are considered to be medical trainees in their first and second years of training post-admission to a vocational training program. Although this is known not to be a uniform rule across all medical specialist colleges, this has been adopted as a general rule for the purpose of this project only. 12 ‘Advanced Registrars’ are considered to be medical trainees in their third year or above of training post-admission to a vocational training program. Although this is known not to be a uniform rule across all medical specialist colleges, this has been adopted as a general rule for the purpose of this project only.

Define TT&R and identify associated cost drivers for ABF purposes Final Report
May 2014
PAXTON PARTNERS | LEVEL 2, 448 ST KILDA ROAD, MELBOURNE VIC 3004 | PH. 03 9820 0333 | FAX. 03 9820 0777
44
4.3 Teaching and training cost drivers This section presents the results of the cost driver analysis in relation to teaching and training.
4.3.1 Proposed cost drivers of teaching and training
The Environmental Scan identified the following four potential cost drivers of teaching and training
1. The volume and mix of trainees;
2. Geography (remoteness);
3. Teaching and training requirements of different registration bodies and colleges; and
4. The number of international medical professionals in training.
4.3.2 Issues regarding data quality and availability
There were a number of issues in the quality and coverage of the available data that meant that the full range of cost drivers identified in the Environmental Scan could not be tested. In some cases, these issues meant that the analysis has had to rely on assumptions. In others, the available data had to be manipulated for it to be usable on a consistent basis with other data sources. Details of the data available to conduct the cost driver analysis are described in detail in Appendix B.
The teaching and training cost drivers proposed in the Environmental Scan that could not be tested due to data availability included:
• Differences between proceduralist and non-proceduralist medical college training requirements to attain fellowship in medical vocational training; and
• International medical professionals in training.
Although these variables could not be tested, they were consistently identified by stakeholders as potential cost drivers. Consequently, further work to develop a teaching and training classification for ABF purposes should also consider potential cost drivers that were identified in the Literature Review and Environmental Scan, but could not be tested due to the lack of available data.
Recommendation 6: Any future work to develop a classification of teaching and training activities for ABF purposes should aim to collect data on the potential cost driver variables for which data was not available during this project, including:
• differences in teaching and training requirements of vocational medical trainees between procedural and non-procedural specialties; and
• the number of international medical professionals in training.
Additionally, a number of jurisdictions were unable to identify some professional groups in their systems, such as Enrolled / Registered Nurses, dentistry trainees, Nurse Practitioner candidates or distribution between allied health disciplines. In some cases, this required that data on key trainee groups was ‘rolled up’ to a higher level. For example, the inability to collect data on Enrolled Nurses in their first year of practice meant that data for all types of nurses in their first year of practice (Enrolled, Registered and Assistants in Nursing) was ‘rolled up’ to a new variable called ‘First year nursing and midwifery graduates’. In other cases (such as for dentistry trainees), some professional groups could not be analysed at all.
Although these trainee types could not be tested, they may also represent differential drivers of teaching and training costs. Consequently, any future work to develop a classification of teaching

Define TT&R and identify associated cost drivers for ABF purposes Final Report
May 2014
PAXTON PARTNERS | LEVEL 2, 448 ST KILDA ROAD, MELBOURNE VIC 3004 | PH. 03 9820 0333 | FAX. 03 9820 0777
45
and training activities for ABF purposes should aim to collect data on all trainee professional groups that are in scope of the definition of ‘ teaching and training’ for ABF purposes.
Recommendation 7: Any future work to develop a classification of teaching and training activities for ABF purposes should aim to collect data on all trainee professional groups that are in scope of the definition of ‘ teaching and training’ for ABF purposes.
4.3.3 Improving the quality of teaching and training data
The development of a ‘Hospital Teaching and Training Activities Data Set Specification’ (HTTA DSS) by IHPA is well progressed, and presents the greatest opportunity to improve the quality and consistency of teaching and training activity data in the short-to-medium-term.
As currently drafted, the HTTA DSS aligns closely with the updated definition of ‘teaching and training’, and is capable of accommodating the cost drivers of teaching and training without requiring significant amendments. However, the outcomes of the data collection and analysis phase of this project highlighted some important lessons which may improve the development of the HTTA DSS, including:
• Data elements must be very clearly specified: The descriptions of data elements must be clearly described, and must be easily and consistently interpreted / differentiated. As currently drafted, the names assigned to various trainee clusters are difficult to differentiate from one another, which may lead to jurisdictions reporting data against the incorrect group.
These existing trainee clusters include groups such as ‘professional entry health professionals’, ‘new health professional graduates’ and ‘health professional graduates’. Considering that the classification structure proposed in Section 4.3.4 includes ‘phase of teaching and training’ as a splitting variable in the classification, it will be important that the various phases of training can be differentiated clearly. IHPA may wish to consider how the trainee clusters included in the HTTA DSS can be re-named in a way that will allow a clearer differentiation between trainee groups at different phases of training, for example:
• The ‘Professional Entry Health Professionals’ cluster could be re-named to ‘Student Health Professional’ cluster;
• The ‘New Health Professional Graduate’ cluster could be re-named to the ‘Early Graduate / Pre-Vocational Health Professional’ cluster; and
• The ‘Health Professional Graduate Trainee’ cluster could be re-named to the ‘Postgraduate / Vocational Health Professional’ cluster.
Recommendation 8: that IHPA should consider renaming the trainee clusters in the HTTA DSS to provide a clearer basis for differentiating between trainees at each phase of teaching and training.
• Rules for counting must be consistent, and must be very clearly specified: The breadth of jurisdictional systems and data collection processes resulted in some variations in the basis for counting trainee FTE when submitting data to the cost driver analysis. For example, some jurisdictions counted FTE as an average across the entire year, whereas others were only capable of providing a snapshot of their FTE numbers at a single point in time. Ideally, a consistent basis for counting teaching and training activity should be clearly specified in the collection rules within the HTTA DSS. Work is currently underway to define counting rules that address these issues through IHPA’s TTRWG.
• The impact of graduate programs should be considered: The cost impacts of formalised graduate programs for nursing, midwifery and allied health was a key question considered as

Define TT&R and identify associated cost drivers for ABF purposes Final Report
May 2014
PAXTON PARTNERS | LEVEL 2, 448 ST KILDA ROAD, MELBOURNE VIC 3004 | PH. 03 9820 0333 | FAX. 03 9820 0777
46
part of the process to frame the definition of teaching and training. It was suggested that the cost impacts for these professional groups are only likely to be material where a formalised graduate program is in place. To this end, it will be important that the DSS is capable of identifying whether graduate programs exist for ‘new health professional graduates’.
• The primary summary-level identifier for reporting TT&R activity should be consistent across jurisdictions: Some jurisdictions were only able to provide teaching and training data to the cost driver analysis at the Local Hospital Network level, while others reported data at a facility level.
The draft HTTA DSS already stipulates that “the scope of the DSS is establishment-level data”. It will be important that jurisdictional systems and processes can support the recording and reporting of facility-level teaching and training data, to ensure the basis of costing, classification and funding is consistent across jurisdictions.
• The availability and consistency of data on a number of key variables needs to be improved: While jurisdictions will continue to maintain different systems and processes, it will be important that they are able to progressively align their reporting capabilities to the level of detail that will be required under the HTTA DSS. To this end, the development of a ‘road map’ that includes targeted timeframes for implementing each data element may assist jurisdictions to progressively focus their systems improvement efforts.
As an initial step, it would be reasonable for data improvement efforts to focus on those variables that will eventually comprise the initial splits in the recommended classification structure for teaching and training. Over time, as data collection and reporting processes mature, jurisdictional data improvement efforts should be directed towards more granular splits in the classification structure. This approach will support the refinement of the teaching and training classification over time, and allow jurisdictions to gradually build momentum towards a more detailed data collection.
4.3.4 Exploratory analysis findings
The exploratory analysis revealed a number of findings that may help to inform future work to classify teaching and training activities for ABF purposes, including that:
• The most appropriate dependent variable to use in the statistical analysis is total recurrent hospital expenditure;
• The majority of clinical trainees are concentrated in principal referral hospitals;
• The majority of clinical trainees are located in major cities; and
• Proxies for teaching and training costs are not suitable for use as cost drivers.
These findings are discussed in more detail below.
4.3.4.1 The most appropriate dependent variable to use in the statistical analysis is total recurrent hospital expenditure
The selection of a dependent variable (the variable to be predicted) is an important determinant of the results of any predictive analysis, since relationships with independent variables (which include potential cost drivers) may vary dramatically depending on the dependent variable used.
The selection of a dependent variable is typically straightforward where there is a readily available and easily definable measure to be predicted. However, unlike other ABF workstreams, which have

Define TT&R and identify associated cost drivers for ABF purposes Final Report
May 2014
PAXTON PARTNERS | LEVEL 2, 448 ST KILDA ROAD, MELBOURNE VIC 3004 | PH. 03 9820 0333 | FAX. 03 9820 0777
47
developed to the stage that costs per patient separation can be calculated (or at least modeled); there is currently no specific measure of TT&R costs available.
Four potential candidates were raised as potentially useful dependent variables during the course of the literature review and environmental scan. These included:
• Total annual recurrent health service expenditure
• Total annual recurrent expenditure per weighted activity unit (across acute, ED and non-admitted workstreams combined)
• Total annual recurrent expenditure per hospital bed, and
• Total (medical, dental, nursing / midwifery and allied health) labour costs.
Exploratory analysis indicated that total recurrent hospital expenditure was the most appropriate and reliable dependent variable to use in the cost driver analysis – given its highly linear relationship with the volume of trainees13 (R2 = 0.974).
4.3.4.2 The majority of clinical trainees are concentrated in principal referral hospitals
Figure 13 shows that the vast majority of trainee volumes are concentrated in peer group A1 principal referral hospitals (according to the AIHW peer group classification14), with 378 trainee FTE (excluding students) hosted at each principal referral hospital, on average. In total, the data provided for the purpose of cost driver analysis showed that 87.2% of all trainees are located within peer group A hospitals. Beyond peer group A hospitals, average trainee volumes fall away sharply, to 51 in B1 facilities (large major cities), 35 in B2 facilities (large regional and remote), 22 in C1 facilities and 8 in C2 hospitals. Peer group D hospitals reported less than 4 trainees on average.
Figure 13: Average trainee volume, by hospital peer group
Note: Peer group A1 = Principal referral; A2 = Specialist women’s and children’s; B1 = Large major cities;
B2 = Large regional and remote; C1 = Medium (group 1); C2 = Medium (group 2); D1 = Small regional acute D2 = Small non-acute; D3 = Remote acute
13 Stepwise multivariate regression analyses have been employed by this study. Linear relationships between independent and dependent variables increase the reliability of this type of analysis. 14 The Public Hospital Peer Group Classification groups public health services into similar groups in terms of their range of admitted patient activities, and geographical location, as follows: A1 = Principal referral; A2 = Specialist women’s and children’s; B1 = Large major cities; B2 = Large regional and remote; C1 = Medium (group 1); C2 = Medium (group 2); D1 = Small regional acute; D2 = Small non-acute; D3 = Remote acute.

Define TT&R and identify associated cost drivers for ABF purposes Final Report
May 2014
PAXTON PARTNERS | LEVEL 2, 448 ST KILDA ROAD, MELBOURNE VIC 3004 | PH. 03 9820 0333 | FAX. 03 9820 0777
48
Figure 14 shows that the composition of trainees, according to their professional group and phase of teaching and training also differs by hospital type, most notably:
• The mix of trainees at principal referral (peer group A1) hospitals is relatively evenly spread across trainee groups;
• The proportion of medical trainees decreases as hospitals become smaller and more remote (i.e. moving from peer group A hospitals through to peer group D hospitals);
• The proportion of nursing and midwifery trainees generally increases as hospitals become smaller and more remote; and
• Looking at peer group A through to C1 hospitals, medical trainees comprise at least 50% of the total trainee cohort, nursing / midwifery trainees comprise between 22% and 41% of trainees, and allied health trainees comprise between 1% and 9% of trainees.
Figure 14: Average trainee composition, by hospital peer group
Note: Peer group A1 = Principal referral; A2 = Specialist women’s and children’s; B1 = Large major cities;
B2 = Large regional and remote; C1 = Medium (group 1); C2 = Medium (group 2); D1 = Small regional acute D2 = Small non-acute; D3 = Remote acute
The exploratory analysis also found that the proportion of total FTE that are accounted for by trainee groups (excluding student trainees) is greater in peer groups that include larger hospitals, as shown in Table 3.This reinforces the view that larger hospitals that treat more (and more complex) patients bear a proportionately greater training load than smaller hospitals that treat less complex (and fewer) patients.

Define TT&R and identify associated cost drivers for ABF purposes Final Report
May 2014
PAXTON PARTNERS | LEVEL 2, 448 ST KILDA ROAD, MELBOURNE VIC 3004 | PH. 03 9820 0333 | FAX. 03 9820 0777
49
Table 3: Average trainee volumes (excluding students) as a proportion of total staff FTE, by peer group AIHW Hospital peer group classification Average trainee FTE Average all staff FTE Trainees as a % of all staff FTE
A1 378.0 3,226.2 11.7%
A2 155.1 1,475.3 10.5%
B1 51.0 757.7 6.7%
B2 35.1 458.5 7.7%
C1 21.8 338.2 6.4%
C2 7.6 190.4 4.0%
D1 1.4 70.9 2.0%
D2 2.4 73.7 3.3%
D3 4.0 118.7 3.4% Note: Peer group A1 = Principal referral; A2 = Specialist women’s and children’s; B1 = Large major cities;
B2 = Large regional and remote; C1 = Medium (group 1); C2 = Medium (group 2); D1 = Small regional acute D2 = Small non-acute; D3 = Remote acute
4.3.4.3 The majority of clinical trainees are located in major cities
It was found that geography (according to the Australian Standard Geographical Classification Remoteness Areas15) influences the volume and mix of trainees in a similar way to hospital peer groups. As shown in Figure 15, the vast majority of trainee volumes (81.6% on average) are concentrated in facilities located in major cities. Notably, there were less than 10 trainee FTE on average in remote areas.
Figure 15: Average trainee volume (excluding students), by remoteness area
15 The Australian Standard Geographical Classification was used from 1984 to 2011 by the Australian Bureau of Statistics (ABS) for the collection and dissemination of geographically classified statistics, and was replaced in 2012 by the Australian Statistical Geography Standard (ASGS). The remoteness areas within the ASGS included Major Cities; Inner Regional, Outer Regional, Remote and Very Remote.

Define TT&R and identify associated cost drivers for ABF purposes Final Report
May 2014
PAXTON PARTNERS | LEVEL 2, 448 ST KILDA ROAD, MELBOURNE VIC 3004 | PH. 03 9820 0333 | FAX. 03 9820 0777
50
As shown in Figure 16, the proportion of nurse /midwife trainees progressively increases with remoteness, from 23% in major cities to 33% in regional areas, 67% in remote areas and almost 100% in very remote areas. The opposite situation occurs for vocational medical trainees, which decrease with remoteness from over 50% of all trainees in major cities, to 24% in inner regional areas, 30% in outer regional areas, 13% in remote areas and 0% in very remote areas.
Figure 16: Average trainee composition (excluding students), by remoteness area
Table 4 also shows that major city hospitals bear the greatest relative training load when the average number of trainees as a proportion of all staff FTE is compared.
Table 4: Average trainee volumes (excluding students) as a proportion of total staff FTE, by remoteness area
Remoteness area Average trainee FTE Average all staff FTE Trainee % of all staff
Major Cities 327.1 2,858.7 11.4%
Inner Regional 25.7 369.8 6.9%
Outer Regional 37.9 433.9 8.7%
Remote Australia 9.2 197.6 4.7%
Very Remote 1.1 55.2 2.0%
4.3.4.4 Proxies for teaching and training costs are not suitable for use as cost drivers
The Literature review and Environmental scan suggested that proxies for teaching and training costs, (more specifically total weighted hospital activity and casemix), could potentially be used to inform a simplified approach to TTR reimbursement that does not involve developing a standalone classification for ABF purposes
Figure 17 shows that there is a very strong association between trainee volumes and total weighted hospital activity16 . Figure 18 shows a similarly strong relationship between trainee volumes and total
16 Taking into account weighted activity volumes for admitted patient, emergency department and non-admitted service type activity.

Define TT&R and identify associated cost drivers for ABF purposes Final Report
May 2014
PAXTON PARTNERS | LEVEL 2, 448 ST KILDA ROAD, MELBOURNE VIC 3004 | PH. 03 9820 0333 | FAX. 03 9820 0777
51
recurrent hospital expenditure. Although these relationships may intuitively suggest that total weighted separations might be a proxy for deriving the relationship between trainee activity and total recurrent hospital expenditure, this approach would require the assumption that all trainee types have an equal impact on costs. This assumption is inconsistent with views expressed by stakeholders during the Environmental Scan, and the perceived differences in the service delivery contribution of various trainee groups, which is described in Section 2.3.
Considering the significant variations in trainee mix according to both peer group and remoteness area identified in the exploratory analysis (and presented in Section 4.3.4.1 and 4.3.4.3), a reimbursement mechanism based upon a universal loading could thus result in hospitals being under- or over-funded depending on their trainee mix.
Figure 17: Relationship between trainee volume (including students) and total weighted activity
Figure 18: Relationship between trainee volume (including students) and total recurrent hospital expenditure
The Environmental Scan also highlighted a view held by some stakeholders that health services with a higher acute casemix are likely to have higher teaching and training costs.
Figure 19 presents a scatterplot of acute case complexity index (including both overnight and same day separations), compared to total recurrent hospital expenditure, which shows a weak association

Define TT&R and identify associated cost drivers for ABF purposes Final Report
May 2014
PAXTON PARTNERS | LEVEL 2, 448 ST KILDA ROAD, MELBOURNE VIC 3004 | PH. 03 9820 0333 | FAX. 03 9820 0777
52
between the two variables (R2= 0.309)17. Figure 20 shows a similarly weak relationship between case complexity index and total trainee volumes (R2= 0.299). These graphs suggest that casemix alone is unlikely to be a good predictor of teaching and training costs.
Figure 19: Relationship between casemix index (same day + overnight) and total recurrent expenditure
Figure 20: Relationship between casemix index (same day + overnight) and trainee volume
These exploratory results suggested that proxies for teaching and training costs are not suitable for adoption as cost drivers in their own right. It was therefore important that the cost driver analysis investigated whether certain types of trainees drive costs to a greater extent than others. This was tested through statistical analysis of the impact of various trainee groups on total recurrent hospital expenditure.
17 R2 (or r-squared’) is a statistical measure of association between two variables. Values of R2 range from 0 (no relationship) to 1 (perfect relationship)
R² = 0.3091
$0
$200
$400
$600
$800
$1,000
$1,200
0.00 0.20 0.40 0.60 0.80 1.00 1.20 1.40 1.60
Tota
l rec
urre
nt e
xpen
ditu
re
Mill
ions
Acute case complexity index (same day and overnight separations)
R² = 0.2994
0
200
400
600
800
1,000
1,200
1,400
1,600
0.40 0.60 0.80 1.00 1.20 1.40 1.60
Tota
l tra
inee
FTE
(in
clud
ing
stud
ents
)
Acute case complexity index (same day and overnight separations)

Define TT&R and identify associated cost drivers for ABF purposes Final Report
May 2014
PAXTON PARTNERS | LEVEL 2, 448 ST KILDA ROAD, MELBOURNE VIC 3004 | PH. 03 9820 0333 | FAX. 03 9820 0777
53
4.3.5 Statistical analysis of teaching and training cost drivers
The statistical analysis of teaching and training cost drivers sought to test whether the volume and mix of trainees are important cost drivers, as well as whether geography (remoteness) influences teaching and training costs. The results of the statistical analysis identified a baseline range of trainee groups that can be used to inform the future development of the teaching and training workstream. Detailed results of the statistical cost driver analysis are presented in Appendix C.
4.3.5.1 The volume and mix of trainees
Importantly, the statistical analysis found that variables describing the number of trainee FTE explained a statistically significant amount of variation in total recurrent expenditure, over and above the variation that was accounted for by other variables that are known to be ‘general hospital cost drivers’ (such as remoteness, pediatric hospital status, casemix and total weighted activity volumes). This suggests that variables that describe the number of trainee FTE are important cost drivers;
Six trainee groups were identified as key teaching and training cost drivers, including:
• Medical Postgraduate Year 2 staff;
• First year nursing and midwifery graduates;
• Medical students;
• First year allied health graduates;
• Nursing and midwifery students; and
• Basic registrars.
These key teaching and training cost drivers represent the sub-set of teaching and training variables that reliably predicted total annual recurrent expenditure for the data set and thus those that are likely to be incorporated in any future classification system for teaching and training. These cost drivers include trainees at the pre-entry / student, pre-vocational / early graduate and advanced / vocational levels, which are broadly in keeping with the trainee types that were identified as being associated with the most intensive teaching and training activity in the Literature Review and Environmental Scan.
4.3.5.2 Geography (remoteness)
In addition to analysing the relationship between the volume and mix of trainees as potential cost drivers, the analysis sought to determine whether geography (remoteness) was also a teaching and training cost driver, as proposed in the Literature Review and Environmental Scan.
The analysis found that geography (remoteness) influences the volume and mix of trainees, but it does not have a statistically significant18 relationship with total recurrent hospital expenditure (p=0.679). Geography was therefore not considered as a driver of teaching and training costs.
4.3.6 Assumptions and limitations of the cost driver analysis
Although the results of the cost driver analysis appear to align broadly with the perspectives of many stakeholders consulted during the Environmental Scan, it is important to recognise some limitations in the approach used to conduct the cost driver analysis. 18 The statistical criterion applied to determine ‘significance’ in the analysis was a probability of 5% that a variable is identified as a cost driver in error.

Define TT&R and identify associated cost drivers for ABF purposes Final Report
May 2014
PAXTON PARTNERS | LEVEL 2, 448 ST KILDA ROAD, MELBOURNE VIC 3004 | PH. 03 9820 0333 | FAX. 03 9820 0777
54
4.3.6.1 Inability to account for variations in how teaching and training is delivered between groups
The data collected for the cost driver analysis reports the overall number of trainee FTE as the basis for assessing whether each trainee group is a potential cost driver. However, Using the number of trainee FTE as independent variables implicitly assumes that all trainee groups require the same level of supervision and support and contribute equally to clinical service provision (i.e. all trainees regardless of clinical profession or phase of teaching and training receive the same level of teaching and training). In practice, the stakeholder perspectives expressed during the environmental scan highlighted that this is unlikely to hold true in reality.
As discussed in Section 2.3, the Environmental Scan identified variations in the level of teaching and training activity (as opposed to service delivery benefits) across the various clinical professional groups, and also variation within these groups according to phase of teaching and training. If there are systematic differences in the level, costliness or intensity of teaching and training across different trainee groups, then any analysis of cost drivers should adjust for these factors, rather than assess them as if they were equal.
Ideally, some adjustment for teaching and training ‘intensity’ would have been made as part of the cost driver analysis. However, the Literature Review noted that “the relationship between TT&R and service delivery benefits is an extremely complex cost/benefit relationship to quantify in the context of a consultant delivered service…and consequently, no attempt should be made to reflect it in resource allocation mechanisms at this time.”19
Modifications to the number of trainee FTEs were therefore considered, but were ruled out on the basis of insufficient evidence for making such an adjustment. It will be important that future work to develop the TT&R workstream is able to determine whether variations exist in the costs to deliver teaching and training between clinical professional groups, and across the various levels within those professional groups.
4.3.6.2 Uncertainty of the impact of formalised graduate programs on teaching and training costs
A related issue to the impact of variations in teaching and training across groups is whether the existence of formalised graduate programs impacts the costs to deliver teaching and training. As discussed in Section 3.4.5, many stakeholders believed that early graduates in nursing, midwifery and allied health were only associated with significant cost impacts for health services where a formal graduate program was in place. The stakeholder consultation highlighted that these programs are not uniformly in place across all health services, which may impact the reliability of the cost driver analysis results for these early graduate trainee groups.
Where graduate programs are in place, there are likely to be additional costs associated with the related teaching and training activity. Where no graduate programs exist, then these early graduates are likely to dedicate a higher proportion of time delivering patient care (as opposed to undertaking teaching and training activity). If this is true, it may only be appropriate to early graduates within a teaching and training classification for ABF purposes if they are undertaking a graduate program.
Unfortunately, existing data collections were unable to identify whether nursing, midwifery and allied health employees are undertaking a graduate program, so the impact of graduate programs could not be analysed during this project. Future work to identify the costs associated with teaching
19 Northern Ireland Departments of Health and Department of Health and Social Services and Public Safety (2006). ‘Research into Costs Associated with Acute Hospital Provision in Northern Ireland’

Define TT&R and identify associated cost drivers for ABF purposes Final Report
May 2014
PAXTON PARTNERS | LEVEL 2, 448 ST KILDA ROAD, MELBOURNE VIC 3004 | PH. 03 9820 0333 | FAX. 03 9820 0777
55
and training should assess whether the existence of a graduate program for nursing, midwifery and allied health employees results in differential impacts in terms of teaching and training costs.
4.3.6.3 Need to acknowledge revenues received for delivering teaching and training activity
Public health services may have commercial agreements with education providers, research institutes and other bodies that act to defray some teaching and training costs. Although these types of agreements were reported to be common during stakeholder consultations, they are not undertaken consistently – for example, student supervision, research and/or clinical service delivery may be undertaken by either salaried hospital staff or academic staff provided by education providers.
Some jurisdictional health authorities are also moving towards adopting standardised schedules of fees for clinical placements, which are levied by health services on education providers. Daily charges for clinical placement have been adopted in Victoria and three New South Wales Local Health Districts have sought to implement similar charges. Some education providers expect that pressure is likely to build towards the introduction of daily clinical placement charges into other jurisdictions.20
Although this information is likely to be commercial-in-confidence, future work to develop the TT&R workstream should consider the extent to which revenues are received by public health services for delivering teaching and training activities, offset state and territory costs.
Recommendation 9: Any future work to assess the costs associated with the delivery of teaching and training should consider the extent to which revenues received by public health services for delivering teaching and training activities offset teaching and training costs.
4.3.7 Potential overlap of teaching and training cost drivers with other IHPA models
The transparency of an ABF approach relies on the ability to accurately discriminate between the costs of different work streams to ensure that health services are not funded more than once for the activities they deliver. The project identified potential areas of overlap between the cost drivers of teaching and training and other existing IHPA models.
4.3.7.1 Overlap between teaching and training and patient care
Under ABF, hospitals are funded according to the volume and mix of services that they deliver. Activity volumes are thus a key driver of the funding provided to hospitals under ABF. The intrinsic association between many teaching and training activities and clinical service delivery are extensively noted in the literature and Environmental Scan. It is therefore important to consider the impacts of overlap between teaching and training activity, clinical service delivery, and the price hospitals receive to deliver patient care. However, the complexity associated with extricating these costs has meant that their influence has not been confirmed, and remains poorly understood.
The intrinsic association between teaching and training activities and patient care may mean that embedded teaching and training costs are a significant component of overall costs to deliver teaching and training activity. If this is the case, it may be desirable to separate the embedded component of teaching and training costs from an allocative efficiency perspective.
However, from a practical perspective it may not be practical or feasible to do so. This would mean that prices attached to existing patient care classifications would need to be amended to remove the 20 University of Sydney (2013).

Define TT&R and identify associated cost drivers for ABF purposes Final Report
May 2014
PAXTON PARTNERS | LEVEL 2, 448 ST KILDA ROAD, MELBOURNE VIC 3004 | PH. 03 9820 0333 | FAX. 03 9820 0777
56
‘teaching and training component’ that exists within them, to avoid double-counting (and hence, double-funding) activity. During stakeholder consultations it was widely recognised that dissecting the funding envelope between the absolute costs of clinical service delivery and those attributed to teaching and training activities may create ineffective and unworkable barriers, perverse incentives and behaviours which go against the seamlessness in which these embedded activities are delivered.
The practicality of costing the embedded component of teaching and training within patient care is a threshold question that IHPA will need to address in order to frame approaches to costing (and ultimately funding) teaching and training activities for classification purposes.
If the influence of embedded costs is as significant as expected, but no attempt is made to quantify them, it is possible that the resulting prices attached to both patient care and teaching and training activities will not reflect the true resource costs associated with delivering them.
In spite of the administrative difficulties associated with identifying the embedded component of teaching and training costs, some attempt should be made to identify them in a comprehensive way. Doing so would allow IHPA to determine whether:
• the embedded cost component of teaching and training can be practically and feasibly identified; and
• the impact of embedded teaching and training is material enough to warrant amending existing patient-based ABF work streams.
This is not to suggest that the embedded teaching and training costs should be costed separately, but rather to obtain a baseline understanding of the prevalence of embedded costs as a proportion of overall teaching and training costs.
Recommendation 10: Any further work to identify the costs associated with teaching and training should attempt to separately identify its associated direct, indirect and embedded cost components.
4.3.7.2 Overlap between teaching and training and existing IHPA pricing arrangements
Under ABF, the price paid per unit of activity – the National Efficient Price – is subject to a range of adjustments that are known to reflect factors that drive legitimate and unavoidable variations in the cost of delivering hospital services. The exploratory analysis highlighted a number of relationships between trainee volumes and existing adjustment factors to the National Efficient Price, such as geography (remoteness) and paediatric hospital status.
The statistical cost driver analysis also provided a way of assessing the extent to which each identified trainee group may be correlated with the hospital-level factors that are included as adjustments to the National Efficient Price (to the extent that data permitted). The results indicated a moderate strength correlation between most trainee groups that were identified as cost drivers of teaching and training, and remoteness – specifically, the more remote a hospital, the lower the number of trainees in each group. The extent of this overlap suggests that it may be worthwhile considering adjustments to the existing loading for remoteness within IHPA’s ABF model at some stage in the future – but only if IHPA wishes to cost embedded teaching and training costs as a component of a future teaching and training ABF workstream.
The statistical analysis revealed a very weak correlation between most cost drivers of teaching and training, and paediatric hospitals, which suggests a very small degree of overlap. Consequently, there would be no benefit in adjusting the paediatric hospital loading within the NEP to take account of an ABF approach to teaching and training.

Define TT&R and identify associated cost drivers for ABF purposes Final Report
May 2014
PAXTON PARTNERS | LEVEL 2, 448 ST KILDA ROAD, MELBOURNE VIC 3004 | PH. 03 9820 0333 | FAX. 03 9820 0777
57
4.4 Classification development framework for teaching and training This section builds on the Pricing Authority-approved definition of teaching and training and the identified cost drivers to propose a recommended scope, structure and unit of count for a future teaching and training classification for ABF purposes. Additionally, this section articulates a range of key issues that will need to be addressed for a classification system to operate effectively.
4.4.1 Unit of count
The new definition of teaching and training implicitly identifies the number of trainees (either placed in or employed by a public health service) as the primary unit of measure in the development of an ABF model for teaching and training. The importance of the number of trainees was subsequently reinforced through the cost driver analysis, where a range of trainee types were identified as important cost drivers.
The derivation of an appropriate unit of count is complicated by differences in the current reporting conventions applied to students and employed trainees. The majority of available data describing student placement is reported in terms of placement hours or days, whereas the standard metric for reporting employee numbers is a ‘full-time equivalent’ (FTE). The process to obtain data for the purpose of cost driver analysis indicated that data describing staff FTE was readily available in most jurisdictional systems. Since employed trainees form the bulk of the trainee groups that are in-scope of the definition, it would be reasonable to use trainee FTE as the primary unit of count. Although student placement data is commonly reported in terms of placement hours or days, this can be easily converted to a full-time equivalent measure. IHPA may need to consider and agree an approach to converting student placement hours to FTE in future, if the number of FTE staff is adopted as an appropriate unit of count.
It is therefore recommended that the unit of count for a future teaching and training classification should be the number of full-time-equivalent trainees that are either placed in (in the case of students) or employed by a public health service.
Recommendation 11: The unit of count in a future classification of teaching and training should be the number of full-time equivalent trainees either placed (as students) or employed by a public health service.
4.4.2 Scope of classification
The results of the cost driver analysis were broadly aligned with the scope of the teaching and training definition developed as part of this project. This supports the suitability of the definition to frame the scope of a future classification. Specifically, the following key elements should be considered as defining elements of the scope:
• the professional group in which the trainee Is employed (or placed), (i.e. medical, dentistry, nursing, midwifery or allied health); and
• the phase of teaching and training in which the trainee is engaged (i.e. ‘pre-entry / student’, ‘early graduate / pre-vocational’ or ‘advanced / vocational’)

Define TT&R and identify associated cost drivers for ABF purposes Final Report
May 2014
PAXTON PARTNERS | LEVEL 2, 448 ST KILDA ROAD, MELBOURNE VIC 3004 | PH. 03 9820 0333 | FAX. 03 9820 0777
58
Recommendation 12: The scope of a future classification for teaching and training activities should be defined by two primary criteria:
1. the professional group in which a trainee is employed (or placed):
• medical;
• dentistry;
• nursing and midwifery; or
• allied health.
2. the phase of teaching and training in which the individual is engaged:
• pre-entry / student;
• early graduate / pre-vocational; or
• advanced / vocational.
4.4.3 Proposed classification structure
To be suitable for the purpose of ABF, classification schemes should aim to group activities according to resource usage – the resulting groupings should maximise differences in resource utilisation between groups, but minimise differences within groups. Ideally, the variable initially used to split the classification structure should be the one that provides the greatest difference in teaching and training costs between the sub-categories of this initial splitting variable.
The scope parameters used to frame the Pricing Authority-approved definition of teaching and training provide two options for structuring the classification – on the basis of either (1) phase of teaching and training, or (2) professional group as an initial splitting variable. However, the absence of a ‘teaching and training cost’ has meant that it is not possible to confidently establish which of these two options will provide the best basis for discriminating between groups according to resource usage. As a result, we recommend that the structure of a future teaching and training classification system is determined following a detailed costing study, which compares the relative costs to conduct teaching and training across both phase of training and professional group. The variable that provides the best basis for discriminating between groups according to cost should determine the preferred option for structuring the classification.
The two options for framing the classification structure are illustrated in Figure 21 and Figure 22. Option One, presented in Figure 21 proposes phase of teaching and training as an initial splitting variable, with subsequent splits based upon professional group and discipline. This option has the advantage of being aligned with the existing data collection structure proposed by the HTTA DSS, as well as being analogous to an episode of care, which is the focus of existing patient-based classification schemes. Intuitively, a classification structure that uses phase of training as an initial splitting variable would provide a practically and conceptually attractive approach, since it provides for movement to a progressively more granular level of detail in the second (professional group) and third (discipline) splits.

Define TT&R and identify associated cost drivers for ABF purposes Final Report
May 2014
PAXTON PARTNERS | LEVEL 2, 448 ST KILDA ROAD, MELBOURNE VIC 3004 | PH. 03 9820 0333 | FAX. 03 9820 0777
59
However, perspectives gathered during the Literature Review and Environmental Scan suggested that clinical professional group may be a better basis to differentiate between trainee groups according to cost.21 It will be important that future work to understand the costs to deliver teaching and training to provide a basis for resolving which variable should be used as the initial split in the classification.
Figure 21: Option One for teaching and training classification structure, using phase of teaching and training as the initial splitting variable
Figure 22 presents Option Two for the proposed classification structure, using ‘professional group’ as the initial splitting variable. Although use of professional group is consistent with stakeholder perspectives regarding variations in teaching and training costs (i.e. the cost to train medical professionals is substantially greater at all phases of training than other professional groups), it provides a slightly more complicated, less intuitive structure. If data can be collected at the discipline level the structure will need to treat medical trainees differently to dental, nursing, midwifery and allied health trainees, since medical trainees can only be sub-classified by discipline once they reach the advanced / vocational phase of teaching and training.
21 Both proposed options are based on a classification framework using known cost driver variables explored in the cost driver analysis. The presence of other potential cost drivers such as international medical professionals may ultimately influence the classification framework once their relevance as cost drivers are known.

Define TT&R and identify associated cost drivers for ABF purposes Final Report
May 2014
PAXTON PARTNERS | LEVEL 2, 448 ST KILDA ROAD, MELBOURNE VIC 3004 | PH. 03 9820 0333 | FAX. 03 9820 0777
60
Figure 22: Option Two for teaching and training classification structure, using 'professional group' as the initial splitting variable
Recommendation 13: Any future work to identify the costs to deliver teaching and training activities should identify a preferred classification structure, based upon either ‘professional group’ or ‘phase of teaching and training’ as the initial splitting variable.
These options also assume that discipline-level data is available to support additional granularity in the level of trainee groups that can be identified in the classification. This may take the form of a third split in the classification based upon discipline, or a more detailed listing of professional groups within the ‘professional group’ variable. The data obtained for the cost driver analysis indicated that discipline-level detail is not currently available across most jurisdictions, so version one of the teaching and training classification may not be capable of including this level of detail.
If implementation of the HTTA DSS improves the quality and granularity of teaching and training data as expected, the classification may evolve to include discipline-level detail in the future. If data describing ‘discipline’ is not commonly available and robust, the split based on professional discipline should be ‘rolled up’ to the highest level at which robust data is available.
It should be noted that additional splits in the classification should not be adopted solely because data is available to support them. For ABF purposes, the classification should be framed at the highest level at which the cost to deliver teaching and training for an individual trainee group, is predictable.

Define TT&R and identify associated cost drivers for ABF purposes Final Report
May 2014
PAXTON PARTNERS | LEVEL 2, 448 ST KILDA ROAD, MELBOURNE VIC 3004 | PH. 03 9820 0333 | FAX. 03 9820 0777
61
4.4.4 Understanding the costs to deliver teaching and training
The findings of this project have identified a range of issues that need to be resolved before an initial classification scheme for teaching and training activities can be developed for ABF purposes. Central to this additional work is a need to understand the costs to deliver teaching and training to different professional groups and / or across various phases of training. To address these issues, a logical next step in the development of the TT&R ABF work stream would be to undertake a detailed costing study of teaching and training activities in public health services. .
This study should be based upon new costing approaches that aim to cost both direct and indirect teaching and training activities that occur separate to the provision of patient care but should also formulate a basis for understanding the costs of embedded teaching and training that occur alongside the delivery of patient care.
Recommendation 14: IHPA should consider a comprehensive costing study to investigate the costs of delivering teaching and training for ABF purposes, subject to acceptance of the cost and data requirements by jurisdictions. At a minimum, the costing study should seek to:
• Separately understand the direct, indirect and embedded costs to deliver teaching and training, including a detailed assessment of the feasibility of estimating, modelling or quantifying the teaching and training costs that are embedded within patient care;
• Gather data on other key variables (including potential cost drivers and trainee groups) that could not be analysed as part of the cost driver analysis of this project;
• Identify whether variations exist in teaching and training cost and intensity between clinical professional groups in various phases of their training; and
• Understand the extent to which revenues received by public health services for delivering teaching and training activities may offset teaching and training costs.
4.5 Research cost drivers This section presents the results of the cost driver analysis in relation to research.
4.5.1 Proposed cost drivers of research
The Environmental Scan identified the following five potential cost drivers of research:
1. The type of research being conducted;
2. The number of dedicated research staff;
3. The volume of approved research projects;
4. The value of research grants in dollar terms; and
5. The number of patients participating in clinical research trials.
4.5.2 Issues regarding data quality and availability
The process to obtain data for the purpose of analysing research cost drivers confirmed the extensive fragmentation of research data that was raised as an issue in the Literature Review and Environmental Scan. As a result, manual collection of research data had to be undertaken in most jurisdictions, which resulted in only eight facilities being able to submit research data in the timeframe required to complete the analysis. Four out of the five facilities for which data was provided were located in major cities and all were either principal referral hospitals or specialist women’s and children’s facilities, as shown in Table 5.

Define TT&R and identify associated cost drivers for ABF purposes Final Report
May 2014
PAXTON PARTNERS | LEVEL 2, 448 ST KILDA ROAD, MELBOURNE VIC 3004 | PH. 03 9820 0333 | FAX. 03 9820 0777
62
Table 5: Characteristics of facilities that submitted research data to the cost driver analysis
Jurisdiction Number of facilities Peer group Remoteness area
Victoria 3 A1 Major cities
Victoria 1 A1 Inner regional
Queensland 2 A1 Major cities
Queensland 1 A2 Major cities
Western Australia 1 A1 Major cities
Although a broad scope of research data collection was initially planned, consultation highlighted significant difficulties in relation to the collection of research data items, including:
• The absence of systematic collection and reporting of the type of research data that was requested – even for large facilities where research is a core component of operations;
• The likelihood that facilities would not be willing to provide some key data elements relating to the value of research grants received as a result of commercial and confidentiality concerns;
• Difficulties identifying the state or territory-funded component of research output or capability as distinct from those funded through affiliated institutes or research partners.
Research data was sought on a number of variables that were comparable to the cost drivers highlighted in the Environmental Scan, or were also mentioned as having some relationship with research costs. The data that could be collected spanned both research capability and research output variables, as summarised in Table 6
Table 6: Research variables collected for the purpose of cost driver analysis Research capability variables Research output variables
• Annual research directorate expenditure • Number of research projects* approved by an ethics committee
• Number of research directorate FTE staff • Number of clinical trials in-progress
• Number of affiliations with Medical Research Institutes
• Number of peer-reviewed publications
• Number of students studying towards a higher-education degree by research
Note: * ‘Approved research projects’ exclude ‘low-risk’ approvals
A number of completed research data responses included comments from submitting organisations that should be considered as an input to improving the collection of research data in the future:
• Figures reported across 2010-11 and 2011-12 varied substantially for some facilities. This suggests that the systems and processes used to collect research data are still maturing and may require more time for data to become reliable and robust to support consistent comparison of research measures across public health services;
• Some facilities were only able to report on a calendar year basis (data was requested on the basis of financial year). While this is not likely to materially affect the magnitude of the data

Define TT&R and identify associated cost drivers for ABF purposes Final Report
May 2014
PAXTON PARTNERS | LEVEL 2, 448 ST KILDA ROAD, MELBOURNE VIC 3004 | PH. 03 9820 0333 | FAX. 03 9820 0777
63
reported, it suggests that some harmonisation of systems used to collect research data may need to occur for data to be reported on a truly consistent basis across facilities;
• The costs attributable to research capability that are undertaken using funding from states and territories may also include a number of items that are difficult to distinguish from funding provided by affiliated institutes, benefactors, or research partners. These include the direct costs associated with research activity as well as indirect, institutional costs such as human resources or infrastructure overheads; and
• Although HREC approvals are commonly recorded, details of research outputs (such as the number of projects or publications) were more difficult for data custodians to source. However, data submissions did note that processes to capture and monitor this data are under development.
4.5.2.1 Improving the quality of research data
The extent of issues that were encountered in collecting research data highlights the importance of improving the quality and quantity of data in public health services. Doing so may enhance understanding of research capability in public health services across Australia, and may potentially provide some basis for a more transparent and equitable allocation of funding for research compared to existing block funding arrangements.
The key areas of focus to improve the quality and quantity of research data include a need to:
• Develop consistent reporting arrangements for research at a jurisdictional level: Further developments to make data collection processes and publication protocols more consistent across jurisdictions will provide a solid starting point for achieving improvements in the availability of research data. To this end, some information systems do already exist that can be used as a platform for further development of research data. (e.g. Australian Research Ethics Database - AU-RED).
• Clearly distinguish between research activities undertaken by public health services and medical research institutes: The lines are often blurred between the research activities of public health services and conjoined medical research institutes or other bodies that share a public health service’s floor space, resources and equipment. The untangling of internal reporting and accounting arrangements may help to distinguish between public and privately-funded / delivered research activity more clearly. Research data elements will need to be clearly defined to avoid activities undertaken by MRIs or other private research bodies being reported under the umbrella of a public health service.
• Data elements must be very clearly specified: As was the case with teaching and training data, any research data elements will need to be very carefully and clearly worded to avoid activities undertaken by MRIs or other private research bodies being reported. Common issues encountered during the data procurement to inform the cost driver analysis included:
o How should ‘approved research projects’ be defined (e.g. does it include human, animal or other governance bodies? Should it include low-risk projects?)
o How should the temporal aspects of research activity be dealt with (e.g. should the number of clinical trials or research projects be counted if they have been completed, in progress or approved?). Quite often one research project or grant will span many years or reporting periods, and
o Should an allowance be included for clinical staff that have a research component within their contract?

Define TT&R and identify associated cost drivers for ABF purposes Final Report
May 2014
PAXTON PARTNERS | LEVEL 2, 448 ST KILDA ROAD, MELBOURNE VIC 3004 | PH. 03 9820 0333 | FAX. 03 9820 0777
64
4.5.3 Exploratory analysis findings
The small sample size of facilities submitting research data meant that the results of the exploratory analysis proved to be of little value in elucidating relationships between the factors that were thought to drive relationships between research capability, activity and costs. The available data indicated that:
• it was difficult for health services to provide research data on a consistent basis;
• there is only a modest relationship between research capability and research output;
• measures of research capability are not associated with the same hospital characteristics as teaching and training variables; and
• the cost drivers for research are not related to the drivers for teaching and training.
These findings appear to reinforce the perspectives reflected in the Literature Review and Environmental Scan, that ‘teaching and training’ and ‘research’ are separate and distinct activities. Knowing the volume of one (for example teaching and training volume) would not therefore permit conclusions to be drawn about the other (research output).
4.5.3.1 It was difficult for health services to provide research data on a consistent basis
A threshold test to determine the reasonableness of the research data provided was to examine the relationship within research capability – i.e. between the number of research directorate FTE and the reported research directorate expenditure. Logically, the costs to provide research capability are largely vested in the salaries and wages of the staff within a research directorate, so there should be a very direct, and very strong relationship between these two variables. As shown in Figure 23, only a modest relationship was initially identified.
Figure 23: Initial relationship between research directorate FTE and research directorate expenditure
Closer investigation of the data showed that one facility appeared to under-report the number of research directorate FTE, relative to its expenditure and research output. Once this facility was removed from the analysis, the association between total research directorate expenditure and research directorate FTE increased from an R2 of 0.7074 to an R2 of 0.9656, as shown in Figure 24. This highlights the scope for variation in how research data may be reported sand potentially, issues

Define TT&R and identify associated cost drivers for ABF purposes Final Report
May 2014
PAXTON PARTNERS | LEVEL 2, 448 ST KILDA ROAD, MELBOURNE VIC 3004 | PH. 03 9820 0333 | FAX. 03 9820 0777
65
in separating expenditure or FTE located in research directorates from that which is housed within affiliated bodies.
Figure 24: Relationship between research directorate FTE and research directorate expenditure after removal of outlier
4.5.3.2 There is only a modest relationship between research capability and research output
An initial step in the exploratory analysis for research was to examine the strength of relationships between measures of research capability, and measures of research output. It would be logical to expect that hospitals with a larger research directorate (either in terms of expenditure or staff FTE) would produce a greater level of research output. However, the exploratory analysis did not reveal an association that was strong enough to validate this hypothesis.
As shown in Table 7, the strongest association was found to be between the number of approved research projects and research directorate expenditure (R2 = 0.539), followed by peer-reviewed publications and research directorate FTE (R2 = 0.448). The correlation between the number of approved research projects and research directorate expenditure was also notable (R2 = 0.416).
These findings suggest that measures of research activity are not good predictors of research capability.
Table 7: Correlations (correlation coefficients) between measures of research output and research capability
Research output measure Research
directorate expenditure
Research directorate FTE
Affiliations with Medical Research
Institutes
Research projects 0.539 0.322 0.221
Clinical trials 0.103 0.003 0.013
Peer-reviewed publications 0.416 0.448 0.147
Students studying for higher degrees 0.002 0.005 0.005

Define TT&R and identify associated cost drivers for ABF purposes Final Report
May 2014
PAXTON PARTNERS | LEVEL 2, 448 ST KILDA ROAD, MELBOURNE VIC 3004 | PH. 03 9820 0333 | FAX. 03 9820 0777
66
4.5.3.3 Measures of research capability are not associated with the same hospital characteristics as teaching and training variables
The exploratory analysis of teaching and training variables showed some very strong relationships between the number of trainees and certain health service characteristics – most notably total recurrent hospital expenditure and total weighted patient activity. The cost driver analysis for research sought to determine whether research capability had similarly strong relationships with these high-level hospital characteristics.
Exploratory analysis of research data showed that there were very few research variables that showed any close association with either total recurrent expenditure or total weighted activity.
Surprisingly, both research directorate expenditure (R2 = 0.487) and research FTE (R2 = 0.522) appeared to be only moderately associated with the level of hospital recurrent expenditure. Once more, the number of peer-reviewed publications was an exception and showed a good strength association (R2 = 0.714) with the level of hospital recurrent expenditure.
Unlike the strong associations that exist between hospital service volumes and teaching and training, exploratory analysis showed weak linear associations between total weighted hospital activity and measures of research capability. The strongest relationships were found to exist between total weighted hospital activity and the value of research directorate expenditure (R2 = 0.387), as well as the number of FTE staff employed in a health service’s research directorate (R2 = 0.399).
The weak relationships therefore suggest that it is unlikely that research capability is closely associated with hospital patient activity volumes.
4.5.3.4 The cost drivers of research are not related to the cost drivers of teaching and training
A key question to investigate as part of the exploratory analysis included whether the hypothesised cost drivers of teaching and training have a close association with research. To investigate, variables describing research output and capability were plotted against total trainee volumes, which was identified as a cost driver of teaching and training.
The majority of research variables showed no notable correlation with total trainee volumes, although the number of peer-reviewed research publications (R2 = 0.605) and the number of research directorate FTE (R2 = 0.579) showed a moderate association.
This appears to reinforce the idea that ‘teaching and training’ and ‘research’ are separate and distinct activities, as identified in the Environmental scan. Knowing the volume of one (for example teaching and training volume) would not therefore permit conclusions to be drawn about the other (research output).
4.5.4 Statistical analysis of research cost drivers
The very small sample of facilities submitting research data meant that regression analysis of research cost drivers was of little value, since the sample size would not be sufficient to draw statistically-valid conclusions from the analysis. Additionally, the characteristics of hospitals submitting research data strongly favored larger facilities in metropolitan areas. The findings of both the Literature Review and Environmental Scan identified that research activity is increasingly being conducted outside of traditional metropolitan teaching hospitals so ideally these types of facilities should be represented in the analysis dataset.
The analysis of research variables provides some indication of the factors that may drive the costs to provide research capability, but should not be considered as cost drivers. Further development of

Define TT&R and identify associated cost drivers for ABF purposes Final Report
May 2014
PAXTON PARTNERS | LEVEL 2, 448 ST KILDA ROAD, MELBOURNE VIC 3004 | PH. 03 9820 0333 | FAX. 03 9820 0777
67
research data collections would be required to establish a sufficient sample of facilities that can inform an analysis of research cost drivers.
4.5.5 Data development required
This project has highlighted significant constraints in the availability of data to support an analysis of research cost drivers, including a requirement for manual collection of research data in most cases. Considering the significant difficulties this project has identified in the collection of research data, IHPA should consider collecting research data collection over a longer period of time than was possible in this project.
A more comprehensive data collection over a longer period of time may support participation by a larger number of hospitals, as well as providing better quality of data overall to assess the nature of costs incurred to provide research capability. A research-specific data collection would also help to focus the development of a research DSS, if IHPA wishes to resume DSS development for research at some point in the future.
Recommendation 15: IHPA should consider undertaking a research-specific data collection as part of the recommended costing study of teaching and training activities, to understand the nature of research capability costs.
4.5.5.1 Identifying a National Efficient Cost for research capability
IHPA’s 2014-15 National Efficient Cost Determination has relied on advice from states and territories to identify the efficient cost of teaching, training and research activity. The reported costs for each jurisdiction are shown in Table 8.
Table 8: Cost to deliver TT&R activity for 2014-15, by jurisdiction Jurisdiction Reported cost of TT&R activity for 2014-15 New South Wales $364.63 million Victoria $251.44 million Queensland $267.10 million South Australia $99.60 million Western Australia $200.24 million Tasmania $30.50 million Northern Territory $20.47 million Australian Capital Territory $14.29 million TOTAL $1,248.27 million
The absence of a nationally agreed definition of research is likely to mean that different approaches have been used to arrive at the estimate of the ‘research’ component of the costs presented in Table 8. It will be important to understand the basis that has been used by jurisdictions to report initial estimates of research costs. Doing so may assist IHPA to determine whether it is worthwhile undertaking further work to identify a better basis for funding research capability than the existing block grants approach.
Recommendation 16: IHPA should engage with jurisdictions to understand the basis upon which they have reported the costs of research activities for 2014-15.

Define TT&R and identify associated cost drivers for ABF purposes Final Report
May 2014
PAXTON PARTNERS | LEVEL 2, 448 ST KILDA ROAD, MELBOURNE VIC 3004 | PH. 03 9820 0333 | FAX. 03 9820 0777
68
Appendix A List of organisations that were consulted Location Type TTRWG
member? Organisation Consultation mode
Date consulted
ACT Jurisdiction Yes Commonwealth Department of Health and Ageing Site visit 22-Aug
ACT Jurisdiction Yes ACT Health Group visit 11-Sep
ACT Health Service No Canberra Hospital Group visit 11-Sep
ACT Peak body Yes Australian Medical Association Group visit 22-Aug
ACT Peak body Yes Australian Medical Association Doctors in Training Group visit 22-Aug
ACT Peak body Yes National Health and Medical Research Council Site visit 22-Aug
ACT Peak body Yes Australian Rural Health Education Network Teleconference 2-Sep
ACT Peak body Yes Catholic Health Australia Group visit 9-Sep
ACT Peak body Yes Australian Private Hospital Association Group visit 9-Sep
ACT Interest Group No Services for Rural and Remote Allied
Health Site visit 9-Sep
ACT Peak body No Australian Healthcare & Hospitals Association Site visit 9-Sep
ACT Interest Group Yes Federation of Rural Australian Medical
Educators Teleconference 16-Sep
ACT Peak body No Consumers Health Forum Teleconference 24-Sep
NSW Jurisdiction Yes NSW Ministry of Health / HETI Site visit 26-Aug
NSW Health Service No Liverpool Hospital Site visit 26-Aug
NSW Health Service No Sydney Childrens Hospital Site visit 27-Aug
NSW Health Service No St Vincents Hospital Site visit 27-Aug
NSW Health Service No Sydney LHD Site visit 28-Aug
NSW Health Service No Sutherland Hospital Site visit 28-Aug
NSW Health Service No Westmead Hospital Site visit 29-Aug
NSW Health Service No Hunter New England LHD Site visit 29-Aug
NSW Peak body Yes Committee of Presidents of Medical Colleges Site visit 28-Aug
NSW Peak body Yes Medical Deans Australia and New Zealand Site visit 29-Aug
NSW Peak body No Universities Australia Teleconference 29-Aug
NSW Interest Group No University of Sydney Site visit 29-Aug
NT Jurisdiction Yes Department of Health Northern Territory Site visit 4-Sep
NT Health No Royal Darwin Hospital Site visit 5-Sep

Define TT&R and identify associated cost drivers for ABF purposes Final Report
May 2014
PAXTON PARTNERS | LEVEL 2, 448 ST KILDA ROAD, MELBOURNE VIC 3004 | PH. 03 9820 0333 | FAX. 03 9820 0777
69
Location Type TTRWG member? Organisation Consultation
mode Date
consulted Service
NT Health Service No Alice Springs Hospital Site visit 6-Sep
Qld Jurisdiction Yes Queensland Health Site visit 6-Aug
Qld Health service
No Group of Regional Hospitals (Cairns, Cape York, Mackay, Townsville)
Group visit (Cairns) 5-Aug
Qld Health service
No Metro North HHS - Princess Alexandra Hospital
Site visit 7-Aug
Qld Health service
No Metro South HHS - Royal Brisbane Hospital
Site visit 7-Aug
Qld Peak body Yes Australian Council of Pro Vice -
Chancellors and Deans of Health Sciences
Site visit 5-Aug
Qld Interest Group
No Allied Health Advisors Committee Site visit 6-Aug
SA Jurisdiction Yes SA Health Site visit 15-Aug
SA Health service
No South East Health (Mt Gambier) Videoconference 15-Aug
SA Health service
No Flinders Medical Centre Site visit 16-Aug
SA Health service
No Repatriation General Hospital Site visit 16-Aug
SA Peak body Yes Health Workforce Australia - Clinical
Training Reform Teleconference
8-Aug
SA Peak body Yes Health Workforce Australia - Workforce
Innov & Reform Teleconference
12-Aug
Tas Jurisdiction Yes Department of Health and Human
Services Site visit
14-Aug
Tas Health service
No Royal Hobart Hospital Site visit 14-Aug
Vic Jurisdiction Yes Victorian Department of Health Site visit 23-Aug
Vic Health service
No Austin Health Site visit 13-Aug
Vic Health service
No Peninsula Health Site visit 23-Aug
Vic Health service
No Bendigo Health Videoconference 12-Aug
Vic Interest Group
No Royal Australasian College of Physicians Site visit / Teleconference 12-Aug
Vic Peak body Yes Association of Australian Medical Research Institutes
Group visit 13-Aug

Define TT&R and identify associated cost drivers for ABF purposes Final Report
May 2014
PAXTON PARTNERS | LEVEL 2, 448 ST KILDA ROAD, MELBOURNE VIC 3004 | PH. 03 9820 0333 | FAX. 03 9820 0777
70
Location Type TTRWG member? Organisation Consultation
mode Date
consulted Vic Peak body No Research Australia
Vic Peak body Yes Council of Deans of Nursing and Midwifery
Teleconference 13-Aug
Vic Peak body Yes Allied Health Professionals Australia Site visit 30-Aug
Vic Peak body Yes Confederation of Postgraduate Medical Councils
Videoconference 30-Aug
Vic Peak body Yes TAFE Directors Australia Site visit 30-Aug
Vic Interest Group
No Australasian College for Emergency Medicine
Site visit 2-Sep
Vic Interest Group
No Royal Australasian College of Surgeons Site visit 3-Sep
Vic Interest Group
No Clinical Trials Group (Peter Macallum Cancer Institute)
Site visit 10-Sep
Vic Interest Group
No Royal Australasian College of Medical Administrators
Site visit 13-Sep
Vic Peak body Yes Australian College of Nursing Site visit 17-Sep
Vic Interest Group
No Royal Australian and New Zealand College of Psychiatrists
Site visit 19-Sep
WA Jurisdiction Yes WA Health Site visit 19-Aug
WA Health service
No Princess Margaret Hospital Site visit 19-Aug
WA Health service
No Sir Charles Gardiner Hospital Site visit 20-Aug
WA Health service
No Western Australia Country Health Service
Site visit / Teleconference 20-Aug
WA Health service
No Armadale Health Service Site visit 21-Aug

Define TT&R and identify associated cost drivers for ABF purposes Final Report
May 2014
PAXTON PARTNERS | LEVEL 2, 448 ST KILDA ROAD, MELBOURNE VIC 3004 | PH. 03 9820 0333 | FAX. 03 9820 0777
71
Appendix B Cost driver analysis background and methodology
This appendix details the process undertaken to conduct the quantitative analysis of TT&R cost drivers.
B. 1. Purpose of cost driver analysis Following the establishment of agreed definitions of TT&R, the next stage in the development of TT&R as a potential ABF workstream was the identification of a classification scheme that is capable of discriminating between teaching and training activities in a meaningful way according to resource usage.
The identification of cost drivers provided the foundation for the classification framework by determining which teaching and training factors were differential drivers of resource costs across hospitals. These drivers can then be measured and compared, to identify a basis for grouping activities that will provide as much variation between groups as possible, while at the same time minimising variation within these groups.
It is important to note that the analysis of TT&R cost drivers described in this appendix is not a ‘costing study’. Cost driver analyses and costing studies differ in some key aspects, including that cost driver analyses aim to identify the factors that explain differences in costs between hospitals. In contrast, costing studies aim to quantify the costs. As a result, cost driver analysis is often undertaken as a precursor to a costing study (as is the case in this project). Knowledge of the factors driving costs must first be understood before these costs can be quantified.
Once hypotheses had been developed regarding the cost drivers of TT&R, data had to be sourced to allow these hypotheses to be tested. The absence of a single national data collection that describes TT&R activity or costs proved to be a significant complication in data procurement, and required that data was obtained from a number of different sources that were identified during the Environmental Scan consultation as being useful starting points.
B. 1. 1. Cost driver analysis and its role in this project
The identification of cost drivers aims to provide the foundation for classification development by establishing the variables that are differential drivers of resource costs across hospitals. Figure 25 provides a summary of the overall project methodology and the aim of the cost driver analysis within it.

Define TT&R and identify associated cost drivers for ABF purposes Final Report
May 2014
PAXTON PARTNERS | LEVEL 2, 448 ST KILDA ROAD, MELBOURNE VIC 3004 | PH. 03 9820 0333 | FAX. 03 9820 0777
72
Figure 25: Role of cost driver analysis in the overall project methodology
Extensive qualitative work was conducted during previous project stages to establish the basis for developing draft definitions of TT&R for ABF purposes and identify a number of potential cost drivers of TT&R. This qualitative work was informed through both a Literature Review and Environmental Scan during Stage 2 of the project. The Environmental Scan involved targeted consultations with over 350 stakeholders in jurisdictional health departments, health services, peak bodies and interest groups across Australia.
The stakeholder consultations drew out a range of issues that were used to identify definitions and cost drivers and a proposed classification framework for TT&R, including:
• a deeper understanding of how TT&R is delivered in public hospitals;
• various factors associated with supporting TT&R in different hospital settings;
• further suggestions regarding approaches to defining TT&R;
• perspectives on TT&R cost drivers;
• insight into trends and foreseen developments in the delivery of TT&R;
• information on the logistical considerations relating to the data collection and reporting capabilities of various stakeholder groups; and
• preliminary views for establishing a framework for classifying the activities or groups associated with the delivery of TT&R.
Stage 6: Final report
Stage 5: Draft report
Stage 4: Identify cost drivers of TT&R
Stage 3: Test draft definitions and consult
Stage 2: Develop draft definitions
Stage 1: Project planning
Key deliverables
• Agreed Project Plan within one month of contract execution
• Literature review;• Environmental scan document;• Working definitions of TT&R.
• Plan for stakeholder consultation;
• Workshop consultation paper;• Stakeholder consultation
workshops.
• Specification for data extracts;• Identify TT&R cost drivers;• Cost driver analysis discussion
paper.
• Draft report identifying definition(s) of TT&R, cost drivers and classification development framework;
• Presentation to IHPA and TTRWG.
• Final report submitted to IHPA.
Com
plet
edCu
rrent
Next
stag
es

Define TT&R and identify associated cost drivers for ABF purposes Final Report
May 2014
PAXTON PARTNERS | LEVEL 2, 448 ST KILDA ROAD, MELBOURNE VIC 3004 | PH. 03 9820 0333 | FAX. 03 9820 0777
73
These perspectives informed the development (and subsequent refinement) of new definitions of TT&R, which incorporated feedback from key stakeholders and IHPA advisory groups. The new definitions were approved by the Pricing Authority in February 2014. The Pricing Authority-approved definitions guided the scope of activities and professional groups for which data was sought as an input to the cost driver analysis, which aimed to test whether the variables identified as potential cost drivers in the Literature Review and Environmental Scan were supported by available cost and activity data.
The identification of cost drivers aims to provide the foundation for classification development by determining which TT&R variables are differential drivers of resource costs across hospitals. These drivers can then be measured and compared, to identify a basis for grouping activities according to resource usage.
The cost drivers identified during the analysis were used to inform a classification development framework for Stage 5 of the project. The classification of teaching and training represents the next stage in the process to determine whether TT&R can feasibly be funded using an activity based approach prior to 1 July 2018.
B. 1. 2. The definitions of teaching and training, and research that have been approved by the Pricing Authority
The draft definitions developed during Stage 3 of the project influenced the type and scope of data collected for the cost driver analysis. The draft definitions were later revised (and approved) by the Pricing Authority. The most notable change to the definition was the inclusion of a statement to recognise the impact of early nurse, midwife and allied health graduates on health service teaching and training costs. Box 4 shows the definitions of ‘teaching and training’, and ‘research’ for ABF purposes that have been approved by the Pricing Authority. Revisions made by the Pricing Authority are underlined. Importantly, data collected to support cost driver analysis already covered the changes made to the definitions.
Box 4: Pricing Authority-approved definitions of ‘teaching and training’ and ‘research’ Teaching and training describes:
the activities provided by or on behalf of a public health service to facilitate the acquisition of knowledge, or development of skills. These activities must be required for an individual to:
• attain the necessary qualifications or recognised professional body registration to practice;
• acquire sufficient clinical competence upon entering the workforce; or
• undertake specialist/advanced practice
in medicine, dentistry, nursing, midwifery or allied health.
Research describes:
The activities undertaken in a public health service where the primary objective is the advancement of knowledge that ultimately aims to improve consumer and patient health outcomes and/or health system performance. The activity must be undertaken in a structured and ethical way, be formally approved by a research governance or ethics body, and have potential for application outside of the health service in which the activity is undertaken.
For ABF purposes, the definition of research relates to:
the public health service’s contribution to maintain research capability, excluding the costs of research activities that are funded from a source other than the state or territory or provided in kind.

Define TT&R and identify associated cost drivers for ABF purposes Final Report
May 2014
PAXTON PARTNERS | LEVEL 2, 448 ST KILDA ROAD, MELBOURNE VIC 3004 | PH. 03 9820 0333 | FAX. 03 9820 0777
74
B. 1. 3. Perspectives on cost drivers identified in the Literature Review
The initial stages of the project involved the examination of a range of national and international literature, with the aim of establishing an understanding of the nature of TT&R, how it is defined elsewhere and perspectives on TT&R cost drivers, trends, issues and developments.
With respect to teaching and training cost drivers, it was found that:
• The cost impacts of teaching and training typically manifest in terms of opportunity costs / productivity impairments, additional diagnostic costs, additional staffing / supervision requirements, equipment costs and the higher care costs as a result of the availability of highly specialised facilities and services;
• The literature generally identifies a similar set of TT&R cost drivers. However, there is less consensus regarding the value of costs that are attributable to each cost driver. Previous studies have estimated that TT&R consumes anywhere between 8-15% of a health services’ global budget; and
• The most commonly-cited cost drivers of teaching and training included:
o Training volumes (number of students, early graduates and / or staff undertaking training);
o Patient complexity;
o Number of trainee rotations;
o Integration with a medical school;
o Broader range of specialisation; and
o Greater number of medical units.
With respect to research cost drivers:
• Most of the literature regarding research cost drivers was based on analysis of activities directly related to conducting the research itself rather than an examination of costs which support research capability;
• The cost impacts of research that are funded by states and territories typically arise through elements that directly support research activities such as laboratory, equipment and overall facility maintenance, consumables, administration and governance costs. Salaries of researchers and research directorate staff were also highlighted as being influential; and
• It was difficult to identify a true activity-based measure to assess the cost drivers of research from the available literature. In most cases, the proxy used to assess research cost drivers related to the available research budget, or simply the existence (or absence) of capability Human Research Ethics Committee at a health service. Literature noted that various research outputs provided only a loose association with research costs. Examples included the number of papers published or research protocols applying for HREC approval.
B. 1. 4. Perspectives on cost drivers identified in the Environmental Scan
In framing the discussion of cost drivers in the Environmental Scan, a distinction was drawn between costs, cost drivers and other factors that may act to determine (or moderate) the impact of cost drivers across health services:

Define TT&R and identify associated cost drivers for ABF purposes Final Report
May 2014
PAXTON PARTNERS | LEVEL 2, 448 ST KILDA ROAD, MELBOURNE VIC 3004 | PH. 03 9820 0333 | FAX. 03 9820 0777
75
Costs: describe the financial and other resources that the health service is required to provide during the course of providing teaching and training. Costs may be directly or indirectly related to teaching and training
Cost drivers: describe the factors and indicators that will result in costs being higher at one health service, compared to another
Moderating factors: describe characteristics of the health service’s internal or external environment that may influence (but do not drive) the extent of teaching and training costs (and hence the relative influence of cost drivers).
The Environmental Scan concluded that the following factors are likely to be the primary cost drivers of teaching and training for ABF purposes and should be tested as part of the cost driver analysis:
• The volume of trainees;
• Geography (remoteness);
• Teaching and training requirements of different registration bodies and colleges; and
• The number of international medical professionals in training.
Additionally, the Environmental Scan concluded that the following factors are likely to be the primary cost drivers of research for ABF purposes:
• The type of research being conducted (scientific / clinical / epidemiological / other);
• The number of dedicated staff FTE engaged to deliver research;
• The volume of approved research projects;
• The value of research grants (in dollar terms); and
• The number of patients participating in clinical research trials.
B. 2. Analysis methodology This section details the approach adopted across each major stage of the cost driver analysis, including hypothesis development, data collection and analysis.
B. 2. 1. Stage One – Hypothesis development
A major finding from the Literature Review was that the factors impacting TT&R costs varied significantly and may change depending on the size, location and operating characteristics of the health service in which TT&R is provided.
The Environmental Scan involved extensive qualitative work to gather and synthesise perspectives on the cost drivers of TT&R, and largely reinforced perspectives on TT&R cost drivers that were identified in the literature. Where consensus existed between the findings of the Literature Review and Environmental Scan, it was important to verify this in a quantitative sense through cost driver analysis.
The Literature Review and Environmental Scan generated a series of testable hypotheses about the cost drivers of TT&R for confirmation through the cost driver analysis. These hypotheses are summarised in Box 5:

Define TT&R and identify associated cost drivers for ABF purposes Final Report
May 2014
PAXTON PARTNERS | LEVEL 2, 448 ST KILDA ROAD, MELBOURNE VIC 3004 | PH. 03 9820 0333 | FAX. 03 9820 0777
76
Box 5: Hypothesised cost drivers of teaching and training, and research
• The main cost drivers of teaching and training are:
1. The volume and mix of trainees (a greater number, level and varying type of trainees will result in higher T&T costs);
2. Geography (more remote health services will have higher T&T costs);
3. Teaching and training requirements of different registration bodies and colleges (health services with a proportionally larger surgical caseload will have higher T&T costs as a result of more complex training requirements for medical professionals);
4. The number of international medical professionals in training (a greater number of international medical professionals in training will result in higher T&T costs).
• The main cost drivers of research are:
1. The type of research being conducted (scientific / clinical / epidemiological / other);
2. The number of FTE staff engaged to deliver research (a higher number of research personnel will result in greater research costs);
3. The volume of approved research projects (a greater volume of approved research projects will result in higher research costs);
4. The value of research grants (in dollar terms) (a higher average grant amount per project will result in higher research costs); and
5. The number of patients participating in clinical research trials (a higher number of participants on-site will result in higher research costs).

Define TT&R and identify associated cost drivers for ABF purposes Final Report
May 2014
PAXTON PARTNERS | LEVEL 2, 448 ST KILDA ROAD, MELBOURNE VIC 3004 | PH. 03 9820 0333 | FAX. 03 9820 0777
77
B. 2. 2. Stage Two – TT&R data collection
Once hypotheses had been developed regarding the cost drivers of TT&R, data had to be sourced to allow these hypotheses to be tested. The absence of a single national data collection that describes TT&R activity or costs proved to be a significant complication in data procurement, and required that data be obtained from a number of different sources. The findings from the Environmental Scan consultation indicated that the data sources described in Figure 26 might be the best starting point for obtaining the broad scope of data needed to inform the cost driver analysis.
Figure 26: Initial plan for TT&R cost driver data collection
The broad approach to the collection of TT&R data across all organisations is summarised in Figure 27.
Figure 27: Overview of TT&R cost driver data collection process
To undertake the analysis, facility (hospital) level data were sought from data custodians for the 2010-11 and 2011-12 financial years. These time periods were chosen on the basis that they are the periods for which the most reliable data for health service cost, activity and clinical placement is available. Unlike other ABF work streams, where the patient is the main unit of analysis, the main unit for analysis of TT&R cost drivers was individual hospitals / health services.
Data requirements to test TT&R cost driver hypotheses
Hospital expenditure and activity
•Total hospital expenditure•Total weighted separations
(acute, ED, non-admitted)•Research expenditure•Research output (publications)•Number of clinical trials
Hospital characteristics
•Bed numbers• Service mix•Casemix•Teaching status• Location•Peer group
Clinical placement
data•Number of clinical
placement hours / days
Workforce data
•Trainee FTE staff (by professional group)
•Research directorate FTE• Students studying for higher
degrees by research
Data type >>> Examples >>> Intended data source (s)
• IHPA• Jurisdictional health
departments•NHMRC
• IHPA • Jurisdictional health
departments•AAMRI
•Health Workforce Australia
• Jurisdictional health departments
Develop data requests
Response, feedback & follow-up
Receive data / follow-up issues
Include data in TTR database
Stakeholder Consultation

Define TT&R and identify associated cost drivers for ABF purposes Final Report
May 2014
PAXTON PARTNERS | LEVEL 2, 448 ST KILDA ROAD, MELBOURNE VIC 3004 | PH. 03 9820 0333 | FAX. 03 9820 0777
78
B. 2. 2. 1. Stakeholder consultation
The first stage in the data collection process included consultation with key organisations to confirm their level of interest, capacity and capability to contribute data to the project. These potential sources of cost driver data included:
• Jurisdictional health departments;
• HWA;
• IHPA;
• The National Health and Medical Research Council (NHMRC); and
• The Association of Australian Medical Research Institutes (AAMRI).
B. 2. 2. 1. 1. Jurisdictional health departments
It was originally envisaged that state and territory jurisdictions would be able to provide the majority of data required. All jurisdictions were supplied with a discussion paper outlining the type, extent and source of data required to undertake the analysis.
Feedback obtained from jurisdictions highlighted considerable variation in data holdings and capacity to contribute data to the project. Jurisdictions also identified a number of risks associated with the collection of the proposed research data. Specifically, that much of the data requested either did not exist, or was not routinely collected by jurisdictional health departments or individual health services.
Overall, the feedback received resulted in:
• A more comprehensive data request being sought directly from IHPA than originally envisaged;
• Jurisdictional data requests being re-focussed on providing data related to their trainee workforce and research activity only;
• Jurisdictions being provided with the option to submit data in a format requested by Paxton Partners, or as raw data from their payroll / HR systems; and
• The research component of the jurisdictional data request being refined and reduced to accommodate the level of data currently available.
B. 2. 2. 1. 2. Health Workforce Australia
HWA conducts an annual survey of clinical placement activity in Australian public and private hospitals, aimed at describing the size of the student population in professional-entry health courses and associated national clinical placement activity for the calendar year.22 The survey is undertaken through universities and other higher education providers that deliver training in the areas of medicine, dentistry, nursing, midwifery and allied health.
HWA’s Clinical Placements data collection was initially identified as a key data source to the cost driver analysis during the Literature Review. Student clinical placements were consistently identified in both the literature and by stakeholder consultations as a primary driver of health service teaching and training resource costs. However, few jurisdictions (with the exception of Victoria and New
22 Health Workforce Australia (2012), ‘Clinical Training Placement Statistics’, accessed from https://www.hwa.gov.au/work-programs/information-analysis-and-planning/national-statistical-resource/clinical-training-plac on 18 February 2014.

Define TT&R and identify associated cost drivers for ABF purposes Final Report
May 2014
PAXTON PARTNERS | LEVEL 2, 448 ST KILDA ROAD, MELBOURNE VIC 3004 | PH. 03 9820 0333 | FAX. 03 9820 0777
79
South Wales) routinely collect hospital level clinical placement data. HWA’s Clinical Placements data collection therefore represented a single source of clinical placement data that provided almost complete coverage of placements conducted across Australia.
B. 2. 2. 1. 3. IHPA
IHPA is responsible for a number of relevant data collections, including patient-level and cost data collections. Additionally, IHPA has access to data collected by other national bodies, such as the National Public Hospital Establishments Database, which is managed by AIHW and based upon data submitted by jurisdictional health authorities.
Feedback received from jurisdictions suggested that IHPA would be in the best position to efficiently provide a large component of the data requested on health service operating characteristics, activity and costs.
B. 2. 2. 1. 4. National Health and Medical Research Council (NHMRC)
Discussions were conducted with representatives of NHMRC to assess the value of collecting research-related data, including value of research grants provided by NHMRC, number of research proposals considered and the presence of a HREC.
While NHMRC were willing to provide the data, the information was not available at the required facility-level. It was therefore decided to exclude this data source for the purpose of this cost driver analysis.
B. 2. 2. 1. 5. The Association of Australian Medical Research Institutes (AAMRI)
AAMRI indicated that it was currently in the process of developing a database of medical research institutes and what health services they are affiliated to. Although AAMRI acknowledged that this dataset was still under development, it provided an opportunity to access information regarding health service affiliations with medical research institutes that was not available from any other centralised source.
B. 2. 2. 2. Development of data requests
Following the initial rounds of discussions with proposed data providers, Paxton Partners refined and reissued data requests to jurisdictional health departments, IHPA, HWA and AAMRI. These data requests included a detailed specification of the data to be extracted from each organisation’s systems, including details of:
• the years for which data was sought (financial years 2010-11 and 2011-12);
• the variables requested, and a brief description of each;
• valid data values, field types, formats and maximum character length;
• the desired formats in which data should be submitted; and
• the intended purpose of collection for each variable.
Table 9 to Table 12 provide a summary of the data requested from each organisation.

Define TT&R and identify associated cost drivers for ABF purposes Final Report
May 2014
PAXTON PARTNERS | LEVEL 2, 448 ST KILDA ROAD, MELBOURNE VIC 3004 | PH. 03 9820 0333 | FAX. 03 9820 0777
80
Table 9: Summary of cost driver data requested from jurisdictions Intended data source Type of data requested
Workforce / payroll / HR systems • Student placement hours; • Total trainee staff FTE (by professional group); • International medical professionals in training; and • Research-specific staff FTE.
Research data systems • Number of approved research projects; • University affiliations; • Number of clinical trials; and • Research institute co-location.
Table 10: Summary of cost driver data requested from HWA Intended data source Type of data requested
Clinical Placements data set • Number of clinical placement hours by facility and professional group (medicine, dentistry, nursing, allied health).
Table 11: Summary of cost driver data requested from IHPA Intended data source Type of data requested
National Hospital Cost Data Collection
• Acute separations; • Bed days; • Complexity indices; and • Total cost (by cost bucket).
Admitted Patient Care National Minimum Data Set
• Total number of separations by DRG; and • Number of separations by DRG partition (medical, surgical or
other). Non-Admitted Patient Care Aggregate National Minimum Data Set
• Total number of service events.
Non-Admitted Patient Emergency Department Care National Minimum Data Set
• Total number of service events.
Public Hospital Establishments National Minimum Data Set
• Health service expenditure (by category); • Health service staffing (by professional group); and • Health service characteristics (bed numbers, specialised
service indicators, etc.).
Table 12: Summary of cost driver data requested from AAMRI Intended data source Type of data requested
Medical Research Institute affiliations database
• Number of health service affiliations with Medical Research Institutes.

Define TT&R and identify associated cost drivers for ABF purposes Final Report
May 2014
PAXTON PARTNERS | LEVEL 2, 448 ST KILDA ROAD, MELBOURNE VIC 3004 | PH. 03 9820 0333 | FAX. 03 9820 0777
81
B. 2. 2. 3. Response, feedback and follow-up
Once all data requests had been submitted, Paxton Partners followed up organisations to secure their participation in the data collection, and to identify and resolve any issues in the submission of data.
B. 2. 2. 3. 1. Jurisdictional health departments
Following release of the data requests, jurisdictions were contacted individually to resolve points of clarification. Paxton Partners also conducted joint jurisdictional teleconferences on the 3 December 2013 to identify and resolve issues related to availability of data and consistency in collection approach between states and territories.
Discussions between Paxton Partners and state and territory representatives established four jurisdictional health departments (Victoria, Queensland, Western Australia and the Australian Capital Territory) as being able to contribute a sufficient level of data to the analysis. New South Wales was not in a position to participate primarily due to the fact that the years for which data was sought corresponded to a significant restructure of the NSW health system. South Australia did not participate as data could not be extracted within the required timeframes, while Tasmania and the Northern Territory could not participate due to resourcing constraints.
To support the jurisdictions during the collection phase, the timeframe for provision of data was extended from mid-December 2013 to January 2014.
B. 2. 2. 3. 2. Health Workforce Australia
HWA’s clinical placements data is available publicly through HWA’s website, however, the online portal does not provide this data at the facility-level. As a result, clinical placement activity at the establishment level was formally requested through HWA’s Information, Analysis and Planning branch.
Before data could be released, approval was also required from each of the higher education providers that contribute data to HWA’s Clinical Placements Data Collection. By 17 January 2014 only one of the 78 higher education providers had not responded to correspondence requesting release of the data.
B. 2. 2. 4. Receive data and follow-up issues
Finalised data submissions were received from participating organisations between 6 December 2013 and 12 February 2014. Upon receipt of each data set, a high-level analysis was conducted for reasonableness, integrity and compliance with the data request. Any issues were followed up with data custodians and resolved (where possible). Where data issues required the development of assumptions that might influence the results of the analysis, a proposed approach was discussed and agreed with IHPA before proceeding.
B. 2. 2. 5. Review of data sources to support cost driver analysis
This section details the data that was sourced from participating jurisdictions, HWA, IHPA and AAMRI as an input to the analysis. Table 13 to Table 24 summarises the data requested from these organisations, the data received, and provides an indication of the suitability of the data for the purpose of cost driver analysis (Y = data met request specification; Yb = used with amendment; Na = could not be provided due to time constraints; Nb = data not usable / not submitted; NR = not requested). Explanations for some ratings are provided in the ‘Data quality, completeness, assumptions and limitations’ sections.

Define TT&R and identify associated cost drivers for ABF purposes Final Report
May 2014
PAXTON PARTNERS | LEVEL 2, 448 ST KILDA ROAD, MELBOURNE VIC 3004 | PH. 03 9820 0333 | FAX. 03 9820 0777
82
B. 2. 2. 5. 1. Jurisdictional data sources
Most jurisdictions indicated that the process to extract the requested workforce data was not straightforward, and in some cases had to be based upon assumptions. These assumptions were reviewed by Paxton Partners to determine their impact (if any) on the proposed analysis. Aside from the data coverage / quality issues noted below, all assumptions were considered to be reasonable. In some cases, different approaches were used across jurisdictions to compiling the data (e.g. Victoria used FTE levels as at June of each fiscal year, whereas WA averaged the number of monthly FTE across the entire financial year). These differences are not expected to cause material variations in the analysis.
Table 13: Data received from jurisdictions on medical trainee groups for the purpose of cost driver analysis
Variable requested Vic1,2 Qld WA ACT
Student clinical placements Yb1 NR NR NR Medical PGY1s Y Y Y Y Medical PGY2s Y Y Y Y Other medical professionals that are not in a vocational training program
Y Nb2 Y Y
Medical trainees in basic vocational training positions Y Y Y Y Medical trainees in advanced vocational training positions Y Nb2 Y Y Consultant / specialist medical professionals Y Y Y Y Visiting Medical Officers Y Y Nb3 Nb3
International medical professional in training Nb4 Nb4 Nb4 Nb4
Note: ‘NR’ = not requested; Y = data met request specification; Yb = used with amendment; Nb = data not usable / not submitted
Table 14: Data received from jurisdictions on dental trainee groups for the purpose of cost driver analysis
Variable requested Vic12 Qld WA ACT
Student clinical placements Yb1 NR NR NR Dentistry PGY1s (1st year only) Y Nb5 Nb5 Nb5
Dentistry trainees (2nd year onwards) undertaking postgraduate training or supervised practice
Nb5 Nb5 Nb5 Nb5
Other (non-trainee) Dentists Y Nb5 Y Y Note: ‘NR’ = not requested; Y = data met request specification; Yb = used with amendment; Nb = data not usable / not submitted
Table 15: Data received from jurisdictions on nursing and midwifery trainee groups for the purpose of cost driver analysis
Variable requested Vic12 Qld WA ACT
Student clinical placements Yb1 NR NR NR Nursing Assistants in their first year of practice Nb6 Y Y Y

Define TT&R and identify associated cost drivers for ABF purposes Final Report
May 2014
PAXTON PARTNERS | LEVEL 2, 448 ST KILDA ROAD, MELBOURNE VIC 3004 | PH. 03 9820 0333 | FAX. 03 9820 0777
83
Variable requested Vic12 Qld WA ACT
Enrolled Nurses in their first year of practice Nb6 Y Y Y Registered Nurses in their first year of practice Y Y Y Y Nurse Practitioner candidates Nb7 Nb7 Nb7 Nb7 Total other (non-trainee) nursing personnel Y Y Y Y Midwifery Assistants in their first year of practice Nb8 Nb8 Nb8 Nb8 Enrolled Midwives in their first year of practice Nb8 Nb8 Nb8 Nb8 Registered Midwives in their first year of practice Nb8 Nb8 Nb8 Nb8 Midwife Practitioner candidates Nb8 Nb8 Nb8 Nb8 Total other (non-trainee) midwifery personnel Nb7 Nb7 Nb7 Nb7 Note: ‘NR’ = not requested; Y = data met request specification; Yb = used with amendment; Nb = data not usable / not submitted
Table 16: Data received from jurisdictions on allied health trainee groups for the purpose of cost driver analysis
Variable requested Vic1,2 Qld WA ACT
Student clinical placements Yb1 NR NR NR Allied Health Assistants in in their first year of practice Nb9 Yb9 Nb9 Nb9 Allied health professionals in their first year of practice Y10 Yb10 Nb10 Yb10
Pharmacy PGY1s Y Y Nb10 Nb10 Medical radiation science PGY1s Y Y Nb10 Y Psychology PGY1s Nb10 Y Nb10 Nb10
Total other (non-trainee) allied health personnel Y Y Y Y Note: ‘NR’ = not requested; Y = data met request specification; Yb = used with amendment; Nb = data not usable / not submitted
Table 17: Data received from jurisdictions on research for the purpose of cost driver analysis Variable requested Vic1,2 Qld WA ACT
The research directorate expenditure Y Y Y Y Average number of FTE staff employed in research directorate
Y Y Y Y
Total number of research projects approved by HREC Y Y Y Y Total number of approved clinical trials in progress Y Y Y Y Number of published peer-reviewed articles Y Y Y Y Number of students studying for a higher degree by research Yb11 Y Nb11 Y Note: Y = data met request specification; Yb = used with amendment; Nb = data not usable / not submitted
Jurisdictional data quality, completeness, assumptions and limitations
Although there was good data coverage and quality for most medical trainee groups, there were a number of issues in the data submitted that resulted in changes to the variables that could ultimately be analysed:

Define TT&R and identify associated cost drivers for ABF purposes Final Report
May 2014
PAXTON PARTNERS | LEVEL 2, 448 ST KILDA ROAD, MELBOURNE VIC 3004 | PH. 03 9820 0333 | FAX. 03 9820 0777
84
1. Victoria requested that it submit its own student clinical placement data. This data was submitted in terms of clinical placement days, whereas HWA’s clinical placement data was submitted in terms of clinical placement hours. This discrepancy required Paxton Partners to adopt different approaches to adjusting Victoria’s and HWA’s clinical placement data to an equivalent number of FTE. The methodology for performing this conversion is detailed in Table 25. Victoria has indicated that data could have been submitted as either clinical placement hours or days;
2. With the exception of basic registrars, Queensland was unable to differentiate third year medical graduates and above (PGY3+’s) from consultant medical staff. The absence of data on advanced registrars for Queensland meant that this group was not analysed for Queensland;
3. Data relating to visiting medical officers could not be provided by WA and ACT. This was not expected to impact the analysis in a material way since these groups were not hypothesised cost drivers of teaching and training;
4. No jurisdiction was able to differentiate international medical professionals in training from other staff in its payroll / workforce HR data systems (although these staff were included in the count for other FTE groups). This meant that the proposed cost driver relating to the number of international medical professionals in training could not be tested in the analysis;
5. No jurisdiction was able to provide sufficient data related to dental employees that would allow their inclusion in the analysis. The data on dental trainees provided by Victoria suggested that this group is a small subset of the overall trainee volume, so the omission of dental trainees was unlikely to influence the analysis in a material way;
6. Victoria was the only jurisdiction unable to differentiate both first year nursing assistants and Enrolled Nurses from other professional groups. Feedback from Victoria indicated that the trainee FTE applicable to these groups were reported as ‘first year Registered Nurses’. This meant that data for all nursing and midwifery early graduates (across all jurisdictions) were consolidated into an overall variable called ‘1st year nursing graduates’;
7. No jurisdiction was able to submit data on the number of nurses studying to advance their skills set to become a Nurse Practitioner. As a result, postgraduate advancement training for nurses could not be assessed as a potential cost driver;
8. No jurisdiction was able to separate midwifery staff from nursing staff in its workforce data systems. Nonetheless, jurisdictions indicated that the reported FTE for nurses would include FTE relating to midwives;
9. The quality of data relating to allied health assistants was not sufficient to be included in the analysis. Trainee volumes for allied health were based upon the number of trainees in their first year of practice (or in pre-vocational years where applicable);
10. The quality of data submitted in relation to first year allied health professionals varied substantially across all jurisdictions. WA was unable to identify first year allied health professionals within its data collection. Both ACT and Queensland submitted some data relating to first year allied health professions, but the number of FTE reported were very low. These issues were followed up with ACT and Queensland, and the accuracy of the data was confirmed. The reason for the low number of allied health professionals was identified as being related to budget cuts, which has resulted in a much lower number of allied health graduate positions.

Define TT&R and identify associated cost drivers for ABF purposes Final Report
May 2014
PAXTON PARTNERS | LEVEL 2, 448 ST KILDA ROAD, MELBOURNE VIC 3004 | PH. 03 9820 0333 | FAX. 03 9820 0777
85
Similar issues of consistency and coverage were encountered in relation to pharmacy, medical radiation science and psychology interns. These issues meant that a reliable and consistent base could not be established for allied health early entry trainees across all jurisdictions;
11. One Victorian health service was unable to report data relating to the number of students studying for higher degrees by research. One WA facility was also unable to identify this information. Given the small sample size of health services providing research data, this may have reduced the reliability of this variable in the analysis, and
12. Victoria submitted all of its data at the Local Health Network (LHN) level, rather than at a facility level. As a result, any Victorian data provided by national bodies (e.g. IHPA) at a facility level was aggregated up to the LHN level based upon a mapping of facilities to LHNs provided by Victoria.
B. 2. 2. 5. 2. Health Workforce Australia
All data was requested at the establishment (hospital) level, for public health services only, for the 2010 and 2011 calendar years.
Table 18: Data received from HWA for the purpose of cost driver analysis Variables requested Received? Quality reliability /
completeness
Volume of clinical placement hours for medicine students
Yes Yb1,2,3
Volume of clinical placement hours for dentistry students
Yes Yb1,2,3
Volume of clinical placement hours for nursing and midwifery students
Yes Yb1,2,3
Volume of clinical placement hours for allied health students (split by discipline)
Yes Yb1,2,3,4
Notes: Yb =used with amendment
B. 2. 2. 6. Data quality, completeness, assumptions and limitations
The scope of data provided by HWA was delivered in accordance with the data request. However one higher education provider did not respond to requests to obtain consent for HWA to release their clinical placement data for the purpose of this cost driver analysis. As a result, clinical placement activity for this education provider was not included in the clinical placement data provided by HWA. This provider was not located in a jurisdiction that had agreed to participate in the data request. Therefore, both Paxton Partners and IHPA considered that their non-participation would not have a material impact on the quality or coverage of the data that was subjected to cost driver analysis.
Notwithstanding the completeness and coverage of the data provided by HWA, there are some issues in its usability for the purpose of this cost driver analysis that warrant explanation. These include:
1. Inspection of HWA’s clinical placement data between years showed some significant movements in the clinical placement activity reported for the same professional group, at the same health services between 2011 and 2012. These large movements were not restricted to small or remote facilities. This issue was investigated with HWA, who indicated that its Clinical Placement Data Set has only been operational since 2010 and is still maturing. HWA is

Define TT&R and identify associated cost drivers for ABF purposes Final Report
May 2014
PAXTON PARTNERS | LEVEL 2, 448 ST KILDA ROAD, MELBOURNE VIC 3004 | PH. 03 9820 0333 | FAX. 03 9820 0777
86
continually refining the processes used to undertake the survey and education providers are gaining in knowledge and experience with the annual collection. As a result, HWA has a significantly higher degree of confidence in the 2012 clinical placement data, and expects to have a higher degree of confidence again in the 2013 data. HWA has also cited a number of potential sources of variation in the clinical placement data, including (but not limited to) the phasing in / out of training arrangements between education and health care providers, reporting anomalies, normal variation from year to year and matching issues.
Given the magnitude of the variations in the 2011 year, and the importance of HWA’s clinical placement data to the analysis, Paxton Partners and IHPA considered that the analysis should be conducted on the basis of 2011 data only;
2. HWA’s clinical placement data for all professional groups was provided on the basis of calendar year (2011 and 2012). However all data supplied by IHPA and jurisdictions was provided on the basis of financial year. Given the critical link between clinical placements and one of the primary drivers of teaching and training costs (trainee volumes), it was decided that HWA’s 2012 data would be matched to the 2011-12 year. Although the possibility of using an average between the 2011 and 2012 years’ clinical placement data was considered, Paxton Partners assessment was that the data quality issues for 2011 would only reduce the quality of the 2012 data, so this approach was not pursued further;
3. HWA’s clinical placement data is collected on the basis of the number of hours of placement undertaken at each facility. However, the workforce data submitted by jurisdictions relates to full-time equivalent staff. As a result, some conversion was required to place HWA’s data on a common base to the workforce data submitted by jurisdictions, as described in Table 25. Establishing a common base for determining training volumes allowed a series of composite variables to be constructed that described overall training volumes delivered to each professional group; and
4. The scope of allied health disciplines reported by HWA did not match the scope of services provided by jurisdictions. Although this was expected to some degree, it may have introduced comparability issues where one jurisdiction or organisation reported a significantly larger range of allied health disciplines than another.
In total, HWA reported 19 allied health disciplines, including Aboriginal and Torres Strait Islander Health Worker, audiology, dietetics, exercise physiology, medical laboratory science, occupational therapy, optometry, oral health, orthoptics, orthotics / prosthetics, paramedicine, pharmacy, podiatry, psychology, radiation science, social work, sonography and speech pathology.
B. 2. 2. 6. 1. IHPA
All data was requested at the establishment (hospital) level, for both the 2010-11 and 2011-12 financial years. Where only patient-level data was available, IHPA was able to ‘roll up’ the relevant variables to the hospital level.

Define TT&R and identify associated cost drivers for ABF purposes Final Report
May 2014
PAXTON PARTNERS | LEVEL 2, 448 ST KILDA ROAD, MELBOURNE VIC 3004 | PH. 03 9820 0333 | FAX. 03 9820 0777
87
Table 19: Data received from IHPA on the National Hospital Cost Data Collection for the purpose of cost driver analysis
Variables requested Received? Quality / reliability completeness
Complexity (casemix) index Yes Y Total same day separations (weighted and un-weighted)
Yes Y
Total overnight separations (weighted and un-weighted)
Yes Y
Total overnight bed days Yes Y Total component costs (by NHCDC cost bucket) Yes Y Notes: Y = data met request specification
Table 20: Data received from IHPA on the Admitted Patient Care NMDS for the purpose of cost driver analysis
Variables requested Received? Quality / reliability completeness
Overnight separations by DRG partition (medical / surgical / other)
Yes Y
Same day separations by DRG partition (medical / surgical / other)
Yes Y
Number of separations relating to top 20 most complex DRGs
Yes Y
Notes: Y = data met request specification
Table 21: Data received from IHPA on the Non-admitted Patient Care Aggregate NMDS for the purpose of cost driver analysis
Variables requested Received? Quality / reliability completeness
Total service events (weighted) Yes Yb2 Total service events (un-weighted) Yes Y Notes: Y = data met request specification; Yb = used with amendment
Table 22: Data received from IHPA on the Non-Admitted Emergency Department Care NMDS for the purpose of cost driver analysis
Variables requested Received? Quality / reliability completeness
Total service events (weighted) Yes Y Total service events (un-weighted) Yes Y Notes: Y = data met request specification
Table 23: Data received from IHPA on the Public Hospital Establishments NMDS for the purpose of cost driver analysis
Variables requested Received? Quality / reliability completeness
All variables within the NMDS Yes Y Notes: Y = data met request specification

Define TT&R and identify associated cost drivers for ABF purposes Final Report
May 2014
PAXTON PARTNERS | LEVEL 2, 448 ST KILDA ROAD, MELBOURNE VIC 3004 | PH. 03 9820 0333 | FAX. 03 9820 0777
88
Data quality, completeness, assumptions and limitations
1. Paxton Partners are aware that not all health services submitted NHDCD data in 2011-12. The intended use of this data will be for the purpose of exploratory analysis only and will not be used to determine the significance of TT&R cost drivers; and
2. Overall, the data IHPA provided was fit-for-purpose and submitted as requested. However, IHPA was unable to provide data relating to non-admitted (outpatient) service events for 2010-11 (although this data was available for the 2011-12 data set). The Tier 2 classification was not implemented in 2010-11 and a different unit of count (occasions of service) was used instead of ‘service events’. Occasions of service had greater variance in practice across jurisdictions and are not reconcilable with service events (as used currently). The inability to provide non-admitted data meant that a consolidated measure of overall health service activity across the acute, ED and non-admitted workstreams could not be derived for 2010-11, but was computed for 2011-12.
B. 2. 2. 6. 2. The Association of Australian Medical Research Institutes
Although AAMRI recognised that the database may not be entirely complete and only included institutes that were members of AAMRI (thus excluding some smaller organisations), the database should have captured those research institutes responsible for a substantial amount of Australia’s research output. AAMRI also stated that it was currently rolling out a more comprehensive Medical Research Institute data collection survey, and that 2014 data should be more complete.
Table 24: Data received from AAMRI for the purpose of cost driver analysis Variables requested Received? Quality reliability /
completeness
Number of medical research institutes, by hospital Yes Yb
Note: Yb = used with amendment
B. 2. 2. 7. Compilation of the analysis datasets
The coverage and content contained in the final datasets were informed largely by the extent of data submitted by jurisdictional health authorities. Although IHPA and HWA provided coverage of almost all health services nation-wide, in most cases, jurisdictions only submitted a subset of their total number of facilities, including:
• Victoria submitting data for its 86 LHNs;
• Queensland submitting data for a sample of 13 facilities;
• ACT submitting data for the Canberra Hospital only; and
• Western Australia providing data extracts for all facilities at an establishment level.
The data provided by each source was linked using the unique facility identifier used by the AIHW, which also has the advantage of including network-level identifiers, which allows Victorian (LHN-level) data to be used with minimal additional manipulation.
The number of facilities was refined further as the dataset was reviewed. The number of facilities in the dataset was reduced further to remove facilities that:
• did not report data to IHPA and HWA;
• were managed by private operators under a public-private contracting arrangement;

Define TT&R and identify associated cost drivers for ABF purposes Final Report
May 2014
PAXTON PARTNERS | LEVEL 2, 448 ST KILDA ROAD, MELBOURNE VIC 3004 | PH. 03 9820 0333 | FAX. 03 9820 0777
89
• were specialist dental hospitals;
• were justice and forensic mental health services; and
• were multi-purpose health services and ‘un-peered’ facilities (these facility types were commonly found to have not reported a range of variables, and also to report values that were considered ‘outliers’ on a number of key variables).
At a high-level, the final analysis databases included variables relating to:
• Measures of health service operating activity (e.g. acute case complexity (casemix) index, weighted separations, service mix, number of research publications, number of clinical trials);
• Descriptive hospital-level characteristics (e.g. bed numbers, geographic location, ‘teaching status’);
• Expenditure and cost information (e.g. health service recurrent expenditure, salary costs by professional group, costs reported to the NHCDC); and
• Workforce characteristics (e.g. number of trainee, non-trainee and student FTE equivalents).
B. 2. 2. 8. Variables computed by Paxton Partners
Some variables in the final analysis dataset were computed by Paxton Partners using the data submitted by original data custodians. This was only undertaken where computation was required to develop variables that were directly relevant to the cost driver hypotheses, or to consolidate data at a very detailed level to a more aggregated level for the purpose of hypothesis testing.
Of greatest importance was the conversion of clinical placement hours and days into a common base (FTE) that allowed the calculation of overall training volumes in a way that was consistent with the workforce trainee data provided by jurisdictions. Different approaches were adopted for each professional group to account for differences in HWA’s definition of a ‘full-time-equivalent’ load across professions (i.e. 40 hours per week for medicine and dentistry, but 37.5 hours per week for other disciplines). Table 25 to Table 28 describes the conversion methodologies applied to clinical placement data.
Table 25: Conversion methodologies applied to clinical placement data for medicine students Professional
group Conversion method applied to HWA data Conversion method applied to Victorian
data
Medicine students
𝑐𝑙𝑖𝑛𝑖𝑐𝑎𝑙 𝑝𝑙𝑎𝑐𝑒𝑚𝑒𝑛𝑡 ℎ𝑜𝑢𝑟𝑠𝑤𝑒𝑒𝑘𝑙𝑦 ℎ𝑜𝑢𝑟𝑠 𝑤𝑜𝑟𝑘𝑒𝑑 (40)𝑥 𝑤𝑒𝑒𝑘𝑠 𝑝𝑒𝑟 𝑦𝑒𝑎𝑟 (52)
𝑐𝑙𝑖𝑛𝑖𝑐𝑎𝑙 𝑝𝑙𝑎𝑐𝑒𝑚𝑒𝑛𝑡 𝑑𝑎𝑦𝑠𝑤𝑜𝑟𝑘𝑖𝑛𝑔 𝑑𝑎𝑦𝑠 𝑝𝑒𝑟 𝑤𝑒𝑒𝑘 (5) 𝑥 𝑤𝑒𝑒𝑘𝑠 𝑝𝑒𝑟 𝑦𝑒𝑎𝑟 (52)
Table 26: Conversion methodologies applied to clinical placement data for nursing and midwifery students
Professional group
Conversion method applied to HWA data Conversion method applied to Victorian data
Nursing and midwifery students
𝑐𝑙𝑖𝑛𝑖𝑐𝑎𝑙 𝑝𝑙𝑎𝑐𝑒𝑚𝑒𝑛𝑡 ℎ𝑜𝑢𝑟𝑠𝑤𝑒𝑒𝑘𝑙𝑦 ℎ𝑜𝑢𝑟𝑠 𝑤𝑜𝑟𝑘𝑒𝑑 (37.5)𝑥 𝑤𝑒𝑒𝑘𝑠 𝑝𝑒𝑟 𝑦𝑒𝑎𝑟 (52)
𝑐𝑙𝑖𝑛𝑖𝑐𝑎𝑙 𝑝𝑙𝑎𝑐𝑒𝑚𝑒𝑛𝑡 𝑑𝑎𝑦𝑠𝑤𝑜𝑟𝑘𝑖𝑛𝑔 𝑑𝑎𝑦𝑠 𝑝𝑒𝑟 𝑤𝑒𝑒𝑘 (5) 𝑥 𝑤𝑒𝑒𝑘𝑠 𝑝𝑒𝑟 𝑦𝑒𝑎𝑟 (52)

Define TT&R and identify associated cost drivers for ABF purposes Final Report
May 2014
PAXTON PARTNERS | LEVEL 2, 448 ST KILDA ROAD, MELBOURNE VIC 3004 | PH. 03 9820 0333 | FAX. 03 9820 0777
90
Table 27: Conversion methodologies applied to clinical placement data for dental students Professional
group Conversion method applied to HWA data Conversion method applied to Victorian
data
Dental students 𝑐𝑙𝑖𝑛𝑖𝑐𝑎𝑙 𝑝𝑙𝑎𝑐𝑒𝑚𝑒𝑛𝑡 ℎ𝑜𝑢𝑟𝑠𝑤𝑒𝑒𝑘𝑙𝑦 ℎ𝑜𝑢𝑟𝑠 𝑤𝑜𝑟𝑘𝑒𝑑 (40)𝑥 𝑤𝑒𝑒𝑘𝑠 𝑝𝑒𝑟 𝑦𝑒𝑎𝑟 (52)
𝑐𝑙𝑖𝑛𝑖𝑐𝑎𝑙 𝑝𝑙𝑎𝑐𝑒𝑚𝑒𝑛𝑡 𝑑𝑎𝑦𝑠𝑤𝑜𝑟𝑘𝑖𝑛𝑔 𝑑𝑎𝑦𝑠 𝑝𝑒𝑟 𝑤𝑒𝑒𝑘 (5) 𝑥 𝑤𝑒𝑒𝑘𝑠 𝑝𝑒𝑟 𝑦𝑒𝑎𝑟 (52)
Table 28: Conversion methodologies applied to clinical placement data for allied health students Professional
group Conversion method applied to HWA data Conversion method applied to Victorian
data
Allied health students
𝑐𝑙𝑖𝑛𝑖𝑐𝑎𝑙 𝑝𝑙𝑎𝑐𝑒𝑚𝑒𝑛𝑡 ℎ𝑜𝑢𝑟𝑠𝑤𝑒𝑒𝑘𝑙𝑦 ℎ𝑜𝑢𝑟𝑠 𝑤𝑜𝑟𝑘𝑒𝑑 (37.5)𝑥 𝑤𝑒𝑒𝑘𝑠 𝑝𝑒𝑟 𝑦𝑒𝑎𝑟 (52)
𝑐𝑙𝑖𝑛𝑖𝑐𝑎𝑙 𝑝𝑙𝑎𝑐𝑒𝑚𝑒𝑛𝑡 𝑑𝑎𝑦𝑠𝑤𝑜𝑟𝑘𝑖𝑛𝑔 𝑑𝑎𝑦𝑠 𝑝𝑒𝑟 𝑤𝑒𝑒𝑘 (5) 𝑥 𝑤𝑒𝑒𝑘𝑠 𝑝𝑒𝑟 𝑦𝑒𝑎𝑟 (52)
It should be noted that a ‘full-time load’ for nursing and midwifery students in Victoria comprises 35 hours compared to the 37.5 applied as the basis for converting HWA clinical placement hours for this group. It was considered that this point of difference would be immaterial in terms of analytical outcomes’.
B. 2. 2. 9. Characteristics of the analysis data set
The final data set contained a total of 112 health services after the process of data consolidation, cleansing and quality assurance. The data collection was intended to result in a sample of health services with national coverage that was as representative as possible of the overall population of health services across Australia. As a result, data was drawn from a wide range of facilities, with a diverse range of operating characteristics. The characteristics of these health services at a summary level are presented below in Table 29 and Table 30.
Table 29 provides a description of each facility / LHN included in the dataset, by jurisdiction and hospital peer group. The Public Hospital Peer Group Classification was developed by the AIHW in 1999 to explain variability in the average cost per casemix-adjusted separation. The classification also groups public health services into similar groups in terms of their range of admitted patient activities, and geographical location. The peer group codes shown in the table represent the following hospital types:
• A1: Principal referral;
• A2: Specialist women’s and children’s;
• B1: Large major cities;
• B2: Large regional and remote;
• C1: Medium (group 1);
• C2: Medium (group 2);
• D1: Small regional acute;
• D2: Small non-acute; and
• D3: Remote acute.
The 62 Victorian LHNs remaining in the dataset comprised 55% of all establishments included in the dataset, with Western Australia’s 36 facilities representing 32% and Queensland’s 13 facilities comprising 12%. A wide range of hospital types were also included in the dataset, including 28% in

Define TT&R and identify associated cost drivers for ABF purposes Final Report
May 2014
PAXTON PARTNERS | LEVEL 2, 448 ST KILDA ROAD, MELBOURNE VIC 3004 | PH. 03 9820 0333 | FAX. 03 9820 0777
91
peer group A1, 21% in peer group D1, 13% in peer group C2 and 11% in peer group D3 (all of which were from Western Australia).
Table 29: Characteristics of final TT&R dataset – hospital peer group by jurisdiction Jurisdiction A1 A2 B1 B2 C1 C2 D1 D2 D3 Total
Victoria 17 1 1 6 2 11 20 4 0 62
Queensland 9 1 0 1 1 1 0 0 0 13
Western Australia 4 2 3 3 3 2 3 4 12 36
ACT 1 0 0 0 0 0 0 0 0 1
Total 31 4 4 10 6 14 23 8 12 112
Table 30 presents the number of facilities / networks in the final analysis dataset, by jurisdiction and remoteness area. The majority (39%) of facilities / networks were located in inner regional areas, with 88% of all facilities in the dataset located in major cities and regional areas.
Table 30: Characteristics of final TT&R dataset – hospital remoteness area by jurisdiction Jurisdiction Major
Cities Inner
Regional Outer
Regional Remote
Australia Very
Remote Total
Victoria 14 35 13 0 0 62
Queensland 6 4 2 1 0 13
Western Australia 12 5 7 6 6 36
ACT 1 0 0 0 0 1
Total 33 44 22 7 6 112
Unfortunately, the requirement for manual data collection resulted in only a small number of facilities reporting data relating to research – eight in total. Notwithstanding the very small sample size for research, the coverage of research data requested was very good.
The characteristics of the facilities that provided research data to the analysis are provided in Table 31. Seven of the eight facilities for which data was provided were located in major cities and all were either principal referral hospitals or specialist women’s and children’s facilities.

Define TT&R and identify associated cost drivers for ABF purposes Final Report
May 2014
PAXTON PARTNERS | LEVEL 2, 448 ST KILDA ROAD, MELBOURNE VIC 3004 | PH. 03 9820 0333 | FAX. 03 9820 0777
92
Table 31: Characteristics of facilities that submitted research data to the cost driver analysis Jurisdiction Number of facilities Peer group Remoteness area
Victoria 3 A1 Major cities
Victoria 1 A1 Inner regional
Queensland 2 A1 Major cities
Queensland 1 A2 Major cities
Western Australia 1 A1 Major cities
B. 2. 3. Stage Three – Cost driver analysis
This section describes the approach to the cost driver analysis, including the methods that were used to conduct the analysis and issues that informed the approach that was ultimately adopted.
The analytical approach to cost driver analysis comprised two stages, an exploratory stage and a statistical (regression) stage, which sought to progressively focus the analysis towards identifying a set of cost drivers that are most likely to be priced in a future classification system. This process is summarised in Figure 28.
Figure 28: Summary of cost driver analysis methodology
B. 2. 3. 1. Exploratory analysis
The exploratory analysis was undertaken using a range of scatter plots, histograms and descriptive statistics to:
• develop an initial understanding of the relationships between key variables;
• identify the most appropriate dependent variable23 to use in the statistical analysis; and
• to test whether variables were suitable for the type of statistical analysis that was conducted.
The exploratory analysis indicated that research variables were unsuitable for statistical analysis.
The exploratory analysis highlighted a range of issues that informed the approach to the statistical analysis. For example, the exploratory findings identified a need to:
23 A ‘dependent variable’ is the variable to be predicted in a statistical analysis. In this analysis, the dependent variable was a proxy for teaching and training costs.

Define TT&R and identify associated cost drivers for ABF purposes Final Report
May 2014
PAXTON PARTNERS | LEVEL 2, 448 ST KILDA ROAD, MELBOURNE VIC 3004 | PH. 03 9820 0333 | FAX. 03 9820 0777
93
• conduct cost driver analysis on two separate datasets – one with data from peer group D hospitals included and another with peer group D hospitals excluded – to account for low trainee volumes and the difference in trainee mix for peer group D hospitals;
• investigate whether a reliable basis existed to stratify the analysis to account for broad variation in trainee volumes and mix. Stratifying the analysis involved splitting into discrete sub-groups that were analysed separately, to identify cost drivers within each sub-group; and
• test whether total weighted hospital activity as a predictor was likely to ‘crowd out’ the effects of other legitimate drivers of teaching and training costs.
B. 2. 3. 1. 1. Use of the exploratory analysis to identify a dependent variable
The selection of a dependent variable is typically straightforward where there is a readily available and easily definable measure to be predicted. However, unlike other ABF workstreams, which have developed to the stage that costs per patient separation can be calculated (or at least modeled); there is currently no specific measure of TT&R costs available.
Four potential candidates were raised as potentially useful dependent variables during the course of the literature review and environmental scan. These included:
• Total annual recurrent health service expenditure
• Total annual recurrent expenditure per weighted activity unit (across acute, ED and non-admitted workstreams combined)
• Total annual recurrent expenditure per hospital bed, and
• Total (medical, dental, nursing / midwifery and allied health) labour costs.
Exploratory analysis revealed that the second and third variables in this list were not suitable for the type of regression analysis that was deemed appropriate to identify teaching and training cost drivers. Scatter plots of these variables against overall trainee volumes are provided in Figure 29 and Figure 30.
For stepwise regression to be reliable, the independent variables should ideally have a linear relationship with the dependent variable. However, both cost per weighted activity unit, and cost per bed have almost no discernible relationship to trainee volumes.

Define TT&R and identify associated cost drivers for ABF purposes Final Report
May 2014
PAXTON PARTNERS | LEVEL 2, 448 ST KILDA ROAD, MELBOURNE VIC 3004 | PH. 03 9820 0333 | FAX. 03 9820 0777
94
Figure 29: Relationship between total trainee volumes and hospital expenditure per weighted activity unit
Figure 30: Relationship between total trainee volumes and hospital expenditure per bed
Additionally, the literature noted an intrinsic association between labour costs of clinical professions (medical, nursing / midwifery and allied health) and teaching and training volumes. Labour costs were also investigated as a potential dependent variable in the analysis. The results of these investigations showed that using total clinical labour costs as a dependent variable would systematically bias those trainee groups that accounted for the majority of a hospital’s overall salary and wage costs, at the expense of other trainee groups (such as students) that are not paid by the hospital. On this basis, total labour costs were not considered to be a useful dependent variable.
However, the exploratory analysis revealed that total recurrent expenditure has an almost perfect linear relationship with the volume of trainees (including students), as shown in Figure 31.
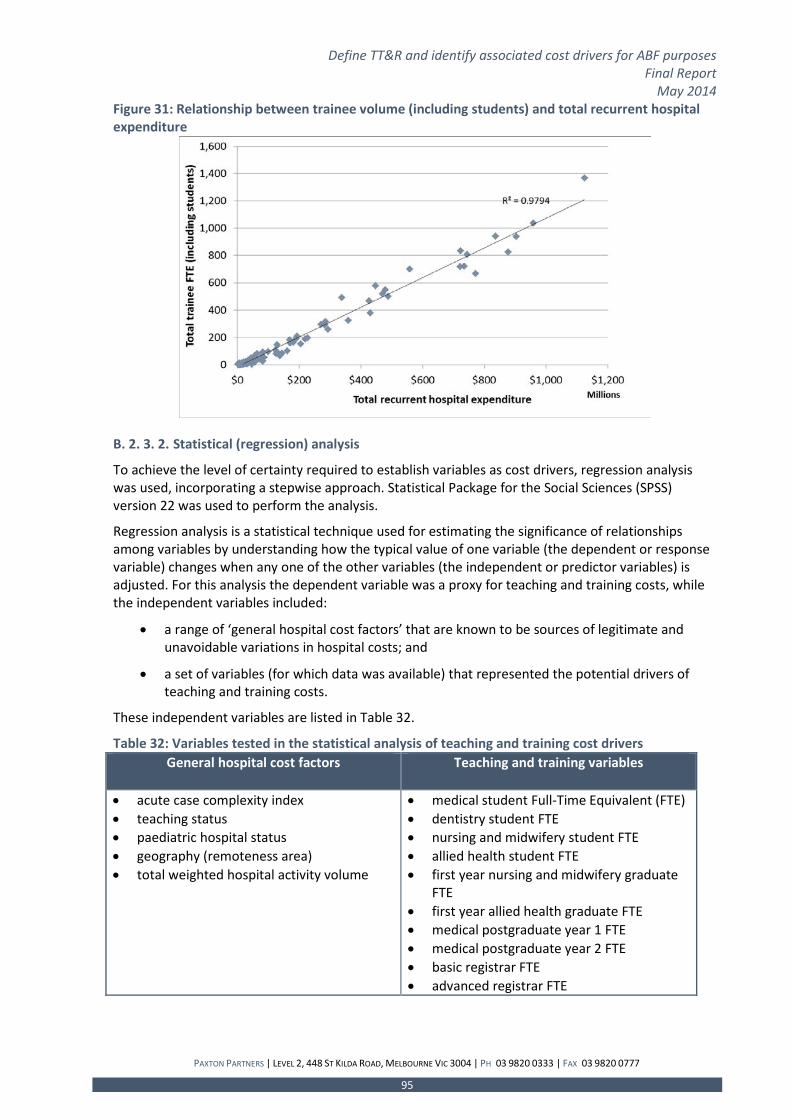
Define TT&R and identify associated cost drivers for ABF purposes Final Report
May 2014
PAXTON PARTNERS | LEVEL 2, 448 ST KILDA ROAD, MELBOURNE VIC 3004 | PH. 03 9820 0333 | FAX. 03 9820 0777
95
Figure 31: Relationship between trainee volume (including students) and total recurrent hospital expenditure
B. 2. 3. 2. Statistical (regression) analysis
To achieve the level of certainty required to establish variables as cost drivers, regression analysis was used, incorporating a stepwise approach. Statistical Package for the Social Sciences (SPSS) version 22 was used to perform the analysis.
Regression analysis is a statistical technique used for estimating the significance of relationships among variables by understanding how the typical value of one variable (the dependent or response variable) changes when any one of the other variables (the independent or predictor variables) is adjusted. For this analysis the dependent variable was a proxy for teaching and training costs, while the independent variables included:
• a range of ‘general hospital cost factors’ that are known to be sources of legitimate and unavoidable variations in hospital costs; and
• a set of variables (for which data was available) that represented the potential drivers of teaching and training costs.
These independent variables are listed in Table 32.
Table 32: Variables tested in the statistical analysis of teaching and training cost drivers General hospital cost factors Teaching and training variables
• acute case complexity index • teaching status • paediatric hospital status • geography (remoteness area) • total weighted hospital activity volume
• medical student Full-Time Equivalent (FTE) • dentistry student FTE • nursing and midwifery student FTE • allied health student FTE • first year nursing and midwifery graduate
FTE • first year allied health graduate FTE • medical postgraduate year 1 FTE • medical postgraduate year 2 FTE • basic registrar FTE • advanced registrar FTE

Define TT&R and identify associated cost drivers for ABF purposes Final Report
May 2014
PAXTON PARTNERS | LEVEL 2, 448 ST KILDA ROAD, MELBOURNE VIC 3004 | PH. 03 9820 0333 | FAX. 03 9820 0777
96
Stepwise regression approaches use statistical criteria to find the most succinct combination of independent variables that explain the variation in a dependent variable. The general hospital cost factors were entered into the model first. The model then chose which teaching and training variables provided a statistically significant improvement to explaining the variation in the proxy for teaching and training costs, using statistical criteria. The outputs of the analysis represented a subset of the teaching and training variables that are the potential drivers of the proxy for teaching and training costs. These teaching and training variables are those that are most likely to be incorporated in any future teaching and training classification system.
The approach that was used to conduct the statistical cost driver analysis, and which took the issues highlighted by the exploratory analysis into account, is summarised in Figure 32. At a high level, three modelling approaches were used, and models were calibrated to test significance at the 95% confidence level.
Figure 32: Summary of approach to conducting statistical analysis of teaching and training cost drivers
The difference in approach between Models 1 and 2 aimed to identify whether the inclusion of total weighted activity ‘crowded out’ the influence of some teaching and training variables.
• Model 1 included total weighted activity within the list of general hospital cost factors
• Model 2 excluded total weighted activity from the list of general hospital cost factors
The results of these models were compared to establish which model provided the best prediction of the proxy for teaching and training costs, at the same time as satisfying the assumptions that are required for regression to be reliable. The analysis undertaken in Models 1 and 2 was performed using two separate datasets for each – one on the full dataset (Peer Groups A to D) and another on a smaller dataset that only includes hospitals in peer groups A to C.

Define TT&R and identify associated cost drivers for ABF purposes Final Report
May 2014
PAXTON PARTNERS | LEVEL 2, 448 ST KILDA ROAD, MELBOURNE VIC 3004 | PH. 03 9820 0333 | FAX. 03 9820 0777
97
The third model aimed to account for the broad variation in trainee volumes and mix identified during the exploratory analysis, by developing and testing a basis for stratifying data into sub-groups. The results of Models 1 and 2 helped to identify which variables might be appropriate to stratify the analysis – the first variable to enter the preferred model became the preferred stratification variable.
The preferred model was determined based on an assessment of each model’s relative reliability and capability to account for variations in the dependent variable. The preferred model was taken forward as the basis for identifying the cost drivers of teaching and training.

Define TT&R and identify associated cost drivers for ABF purposes Final Report
May 2014
PAXTON PARTNERS | LEVEL 2, 448 ST KILDA ROAD, MELBOURNE VIC 3004 | PH. 03 9820 0333 | FAX. 03 9820 0777
98
Appendix C Results of the statistical cost driver analysis of teaching and training
The statistical analysis built on the information obtained during the exploratory analysis to identify the cost drivers associated with teaching and training. This appendix presents the results of the modeling that was conducted as part of the statistical analysis.
C. 1. Model 1 – including total weighted activity as a predictor variable Model 1 included total weighted activity within the list of general hospital cost factors entered into the regression model, and tested whether the addition of teaching and training variables in a second ‘block’ were able to explain additional variation in total recurrent expenditure.
Table 33: Results of cost driver analysis on Model 1 (including weighted separations as a predictor) Key indicator Model 1A: Peer groups A to D Model 1B: Peer groups A to C
Number of hospitals 112 69
Model goodness of fit 100.0% 100.0%
Variation accounted for by ‘general’ cost factors
97.2% 96.4%
Statistically significant teaching and training variables
These are potential cost drivers of teaching and training
1. Advanced registrars 2. Nursing and midwifery
students 3. Basic registrars 4. 1st year nursing and midwifery
graduates 5. PGY2s 6. Dentistry students 7. Allied health students
1. Advanced registrars 2. Nursing and midwifery
students 3. 1st year nursing and midwifery
graduates 4. PGY2s 5. Medicine PGY1s 6. Allied health students 7. Dentistry students
Important findings to emerge from both datasets included that:
• The reported goodness of fit value of 100.0% indicates ‘over-fitting’ of the independent variables to total recurrent hospital expenditure. This result suggests that some independent variables in the model are very highly correlated, so including them as predictors results in a degree of duplication that means some predictors are effectively redundant and could be removed. As a result, this value should not be used as a basis for assessing or comparing the model.
o This finding points to some issues in the underlying data that may prevent some variables from being identified as cost drivers as a result of highly correlated independent variables, and
o Model diagnostics suggested that both the distribution and variance in the sample data may be problematic. This may be due to the large variation in the characteristics of hospitals included in the sample or the relatively small size of the sample overall.
• Total weighted activity was the only ‘general hospital cost factor’ that was found to have a statistically significant association with total recurrent expenditure. Total weighted activity was highly significant (sig < 0.01), which suggests that it is an excellent predictor of total recurrent expenditure on its own, and may be causing the ‘over-fitting’ described above

Define TT&R and identify associated cost drivers for ABF purposes Final Report
May 2014
PAXTON PARTNERS | LEVEL 2, 448 ST KILDA ROAD, MELBOURNE VIC 3004 | PH. 03 9820 0333 | FAX. 03 9820 0777
99
• The inclusion of teaching and training variables accounted for a statistically-significant level of variation in total recurrent expenditure, over and above the variation accounted for by the ‘general’ hospital cost drivers described above. This suggests that teaching and training volumes are important cost drivers.
C. 2. Model 2 – excluding total weighted activity as a predictor variable Excluding total weighted activity within the list of general hospital cost factors resulted in some changes to the type of variables found to be significant in the model, and appeared to improve the reliability of the analysis conducted on peer groups A to D.
The results of Model 2 are summarised in Table 34 for each dataset that was analysed:
Table 34: Results of cost driver analysis on Model 2 (excluding weighted separations as a predictor) Key indicator Model 2A: Peer groups A to D Model 2B: Peer groups A to C
Sample n 112 69
Model fit 98.3% 100.0%
Variation accounted for by ‘general’ cost factors
62.5% 55.9%
Statistically significant teaching and training variables
These are potential cost drivers of teaching and training
1. Medicine PGY2s 2. 1st year nursing graduates 3. Medicine students 4. 1st year allied health graduates 5. Nursing and midwifery
students 6. Basic registrars
1. Advanced registrars 2. Nursing and midwifery
students 3. Basic registrars 4. 1st year nursing and
midwifery graduates 5. Medicine students 6. Medical PGY1s 7. Dentistry students
An important finding to emerge from both datasets included that the removal of total weighted activity as a predictor reduced the influence of the general hospital cost factors substantially. Nonetheless, once teaching and training variables were included in the model, the predictive ability of Model 2 was still very high (98.3% for peer groups A to D).
Findings from the peer group A to D dataset
The issue of over-fitting to the underlying data was improved for peer groups A to D, but some degree of residual multicollinearity24 existed.
It was somewhat surprising that medical PGY2s were identified as an important cost driver, rather than medical PGY1s. The model output showed a very high correlation between these two variables (0.905), and also between PGY2s and total recurrent expenditure (0.959). Consequently, the inclusion of PGY2s as a significant predictor appears to be masking the influence of medical PGY1s in the results.
24 Multicollinearity is a statistical phenomenon in which two or more predictor variables in a multiple regression model are highly correlated, meaning that one can be linearly predicted from the others with a non-trivial degree of accuracy. Multicollinearity does not reduce the predictive power or reliability of the model as a whole, at least within the sample data themselves; it only affects calculations regarding individual predictors. That is, a multiple regression model with correlated predictors can indicate how well the entire bundle of predictors predicts the outcome variable, but it may not give valid results about any individual predictor, or about which predictors are redundant with respect to others

Define TT&R and identify associated cost drivers for ABF purposes Final Report
May 2014
PAXTON PARTNERS | LEVEL 2, 448 ST KILDA ROAD, MELBOURNE VIC 3004 | PH. 03 9820 0333 | FAX. 03 9820 0777
100
Regression diagnostics suggested a substantial improvement in the reliability and validity of Model 2, compared to Model 1. Although not perfect, Model 2 provides a reliable basis upon which to identify the potential cost drivers of teaching and training, and its results have been taken forward to identify those trainee groups that, at a minimum, should be incorporated in a teaching and training classification.
Findings from the peer group A to C dataset
The removal of total weighted activity as a predictor did not address the issue of over-fitting for peer groups A to C, as reflected by the goodness-of-fit statistic of 100.0%. This suggested that strong correlations between other independent variables caused the over-fitting issues in this model
Interestingly, PGY2s were not identified as important cost drivers in this model, but medical PGY1s were identified as a potentially important cost driver. This may lend weight to the suggestion that the strong correlation between PGY1s and PGY2s was masking the impact of medical PGY1s in the dataset covering peer groups A to D
The results for peer groups A to C suggest that the most important cost drivers in these hospitals tend towards the more ‘advanced’ trainee groups (such as advanced registrars), whereas the analysis on hospitals from peer groups A to D suggested that pre-vocational and early graduate trainee groups were more important cost drivers:
• This suggests that the different trainee mix in peer group D hospitals did influence the results, with their inclusion bringing down the average complexity of trainee groups identified as potential cost drivers
• This also suggested that there may be different cost drivers in peer group A to C hospitals, compared to peer group D hospitals.
C. 3. Model 3 – Stratified model based upon hospital peer group, while excluding total weighted activity as a predictor variable
The exploratory analysis highlighted that there were significant variations between the volume and mix of trainees and a number of hospital-level variables – including hospital teaching status, geography (remoteness area) and the Australian Institute of Health and Welfare’s (AIHWs) hospital peer group classification. For example, the analysis indicated that the mix of trainee groups in remote/peer group D hospitals was different to hospitals in regional areas, major cities or those classified to peer groups A to C – tending to comprise of a greater proportion of nursing trainees and a lower proportion of medical professions.
It was therefore decided that the dataset should be split to:
• control for the effect of differences in hospital characteristics on the results of cost driver analysis; and
• potentially identify how influential trainee groups change depending on hospital type.
Separate regression analysis showed that the hospital characteristics that explained the greatest amount of variation in total recurrent expenditure were teaching status (p < 0.01) and peer group (p< 0.01). Hospital peer group was chosen as the most appropriate splitting variable since it remained significant as teaching and training variables were progressively added, while ‘teaching status’ became a redundant predictor.
Peer groups were consolidated to a higher level (peer group A, B, C or D) to account for the relatively small sample sizes of some of the groups.
The results of Model 3 are summarised in Table 35.

Define TT&R and identify associated cost drivers for ABF purposes Final Report
May 2014
PAXTON PARTNERS | LEVEL 2, 448 ST KILDA ROAD, MELBOURNE VIC 3004 | PH. 03 9820 0333 | FAX. 03 9820 0777
101
Table 35: Results of cost driver analysis for Model 3 Peer Group A Peer Group B Peer Group C Peer Group D
Sample n 35 14 18 43
Model fit 100.0% 28.9% 63.7% 79.1%
Variation accounted
for by ‘general’
cost factors
15.7% 28.9% 16.9% 14.0%
Statistically significant
teaching and training
variables
1. Advanced registrars
2. Basic Registrars 3. Allied health
students
None identified 1. Advanced registrars
1. Advanced registrars
2. Medical students 3. Allied health
students 4. PGY2s
The results of Model 3 showed that the model fit varied substantially between peer groups. General hospital cost factors accounted for approximately 15% of the variation in total recurrent expenditure for peer groups A, C and D and 28.9% of the variation in peer group B. The inclusion of teaching and training variables provided a substantial improvement in the model fit for peer group A (to the point of over-fitting the data), but no statistically significant improvement at all for peer group B.
Advanced registrars were reported as the most influential teaching and training variables for peer groups A, C and D. However, there was little consistency in the other trainee groups that were statistically significant across peer groups.
When comparing the results of Model 3 to the outcomes of the exploratory analysis that was undertaken by peer group, a few surprises emerged, including that:
• No trainee groups were identified as cost drivers for peer group B hospitals at all;
• No nursing trainee groups were identified as cost drivers for peer group C hospitals, in spite of early nursing graduates on average comprising 44.8% of all trainees in this peer group; and
• No nursing trainee groups were identified as cost drivers for peer group D hospitals, in spite of early nursing graduates comprising 74.5% of all trainees in this peer group, on average.
Further analysis of the result for peer group B showed a much lower association between trainee volumes and total recurrent expenditure than for other peer groups. However, no particular reason could be identified. It is hypothesised that the absence of a statistically significant teaching and training variable reflects the relative diversity of this group of hospitals in terms of their trainee profiles and operating characteristics.
Further inspection of the data for peer groups C and D revealed that results were driven by two or three hospitals in each peer group that had substantially greater expenditure or activity volumes. For these hospitals, the trainee mix was different to the ‘average’ across the overall peer group (i.e. they had a greater mix of medical trainees rather than nursing), and their high relative expenditure made them more influential in the analysis. This may point to some shortcomings in the ability of the peer group classification to classify hospitals with like characteristics on a consistent basis, or may potentially have been caused by the consolidation of peer groups to a higher level (e.g. conducting the analysis at the level of peer group A rather than separately for A1s and A2s).

Define TT&R and identify associated cost drivers for ABF purposes Final Report
May 2014
PAXTON PARTNERS | LEVEL 2, 448 ST KILDA ROAD, MELBOURNE VIC 3004 | PH. 03 9820 0333 | FAX. 03 9820 0777
102
C. 4. Assessment of a preferred model to determine the cost drivers of teaching and training
Each of the models developed to analyse the cost drivers of teaching and training provided insight into the factors that are likely to drive teaching and training costs. Model 2A was adopted as the preferred model and taken forward as the basis for identifying the potential cost drivers of teaching and training.
Model 1 showed that teaching and training variables provided a statistically significant contribution to explaining total recurrent hospital expenditure over and above that which was accounted for by general hospital cost factors – suggesting that teaching and training volumes are important cost drivers.
However, Model 1 ‘over fitted’ the data for both data sets, which suggests that the predictor variables included in the model were very highly correlated with both total recurrent expenditure, and with each other. As a result, some independent variables contained redundant information and could potentially have been removed. Considering the very strong association between total recurrent expenditure and total weighted activity, it was expected that removing total weighted activity might address this issue in Model 2.
The removal of total weighted activity as a predictor in Model 2 appeared to improve the issue of ‘over-fitting’ for the analysis based on peer groups A to D, but not for peer groups A to C. The resulting set of potential cost drivers (for peer groups A to D) appears to be broadly aligned with the range of professional groups and trainee types that are encompassed by the updated definition of teaching and training, but do contain some surprising results, such as the absence of medical PGY1s as cost drivers. Closer inspection of the data suggested that this might be due to the strong correlation between medical PGY1s and PGY2s.
Although stratifying the analysis by peer group in Model 3 attempted to identify how trainee groups may change in different types of hospitals, the results appeared to be un-representative of the trainee mix identified during the exploratory analysis. This may have been due to the relatively small sample size of hospitals included within peer groups, however, the results did not seem to reflect the known mix of trainees at different facility types, and therefore could not be taken forward as the basis for identifying the cost drivers of teaching and training.
After comparing all models, the results suggest that Model 2 (using data from peer groups A to D) is the most reliable model to identify the trainee groups that are primary cost drivers of teaching and training. Using the results of this model, the analysis suggests that the main trainee groups driving costs of teaching and training are:
• Medical Postgraduate Year 2 staff
• First year nursing graduates
• Medical students
• First year allied health graduates
• Nursing and midwifery students and
• Basic registrars.
Given the data limitations noted in connection to the cost driver analysis, these trainee groups should not be viewed as the definitive list of teaching and training cost drivers, rather they provide a starting point for understanding how variables may be grouped to explain resource usage for public hospitals delivering teaching and training activities.

Define TT&R and identify associated cost drivers for ABF purposes Final Report
May 2014
PAXTON PARTNERS | LEVEL 2, 448 ST KILDA ROAD, MELBOURNE VIC 3004 | PH. 03 9820 0333 | FAX. 03 9820 0777
103
Appendix D Outputs of exploratory analysis of research variables
D. 1. Total weighted activity versus key research variables of interest Figure 33: Relationship between total weighted hospital activity and research directorate expenditure
Figure 34: Relationship between total weighted hospital activity and number of approved research projects

Define TT&R and identify associated cost drivers for ABF purposes Final Report
May 2014
PAXTON PARTNERS | LEVEL 2, 448 ST KILDA ROAD, MELBOURNE VIC 3004 | PH. 03 9820 0333 | FAX. 03 9820 0777
104
Figure 35: Relationship between total weighted hospital activity and number of approved clinical trials
Figure 36: Relationship between total weighted hospital activity and number of research directorate FTE

Define TT&R and identify associated cost drivers for ABF purposes Final Report
May 2014
PAXTON PARTNERS | LEVEL 2, 448 ST KILDA ROAD, MELBOURNE VIC 3004 | PH. 03 9820 0333 | FAX. 03 9820 0777
105
D. 2. Total trainee FTE versus key research variables of interest Figure 37: Relationship between total trainee FTE and research directorate expenditure
Figure 38: Relationship between total trainee FTE and research directorate FTE

Define TT&R and identify associated cost drivers for ABF purposes Final Report
May 2014
PAXTON PARTNERS | LEVEL 2, 448 ST KILDA ROAD, MELBOURNE VIC 3004 | PH. 03 9820 0333 | FAX. 03 9820 0777
106
Figure 39: Relationship between total trainee FTE and approved research projects
Figure 40: Relationship between total trainee FTE and number of research publications

Define TT&R and identify associated cost drivers for ABF purposes Final Report
May 2014
PAXTON PARTNERS | LEVEL 2, 448 ST KILDA ROAD, MELBOURNE VIC 3004 | PH. 03 9820 0333 | FAX. 03 9820 0777
107
D. 3. Total recurrent expenditure versus key research variables of interest Figure 41: Relationship between total recurrent hospital expenditure and research directorate expenditure
Figure 42: Relationship between total recurrent hospital expenditure and number of approved research projects

Define TT&R and identify associated cost drivers for ABF purposes Final Report
May 2014
PAXTON PARTNERS | LEVEL 2, 448 ST KILDA ROAD, MELBOURNE VIC 3004 | PH. 03 9820 0333 | FAX. 03 9820 0777
108
Figure 43: Relationship between total recurrent hospital expenditure and number of approved research publications
Figure 44: Relationship between total hospital recurrent expenditure and number of research directorate FTE

Define TT&R and identify associated cost drivers for ABF purposes Final Report
May 2014
PAXTON PARTNERS | LEVEL 2, 448 ST KILDA ROAD, MELBOURNE VIC 3004 | PH. 03 9820 0333 | FAX. 03 9820 0777
109
D. 4. Total research directorate expenditure versus key research variables Figure 45: Relationship between total research directorate expenditure and number of approved research projects
Figure 46: Relationship between total research directorate expenditure and number of approved research publications

Define TT&R and identify associated cost drivers for ABF purposes Final Report
May 2014
PAXTON PARTNERS | LEVEL 2, 448 ST KILDA ROAD, MELBOURNE VIC 3004 | PH. 03 9820 0333 | FAX. 03 9820 0777
110
Figure 47: Relationship between total research directorate expenditure and number of approved clinical trials
Figure 48: Relationship between total research directorate expenditure and number of research directorate FTE