tualatin, or
TRANSCRIPT

National Research Center, Inc. International City/County Management Asssociation 2955 Valmont Road Suite 300 777 North Capitol Street NE Suite 500 Boulder, Colorado 80301 Washington, DC 20002 n-r-c.com • 303-444-7863 icma.org • 800-745-8780
Tualatin, OR Supplemental Online Survey Results 2020

The National Community Survey™ © 2001-2020 National Research Center, Inc.
The NCS™ is presented by NRC in collaboration with ICMA.
NRC is a charter member of the AAPOR Transparency Initiative, providing
clear disclosure of our sound and ethical survey research practices.
Contents About the Open Participation Online Survey ..................................................................................... 1
Complete Survey Responses to Online Open Participation Survey...................................................... 3
The National Community Survey™ - Supplemental Online Survey Report
1
About the Open Participation Online Survey As part of its participation in The National Community Survey™ (The NCS™), the City of Tualatin conducted a mailed survey of 3,500 residents. Surveys were mailed to randomly selected households in May 2020 and data were collected through June 2020 (see the report, The National Community Survey: Community Livability Report, Tualatin, OR, 2020). The results from this main survey effort represent the most robust estimate of your residents’ opinions.
After the above data collection period was underway, the City made available a web-based survey to its residents through a link on the City’s website. Visitors to the site were able to complete the survey during June 2020 and 572 surveys were received. This report contains the results of this opt-in administration of the web-based survey. These data were not collected through a random sample and it is unknown who in the community was aware of link on the City’s website; therefore, a level of confidence in the representativeness of the sample cannot be estimated. However, to reduce bias where possible, these data were weighted to match the demographic characteristics of the 2010 Census and 2017 American Community Survey estimates for adults in the City of Tualatin.

The National Community Survey™ - Supplemental Online Survey Report
2
The results of the weighting scheme for the opt-in survey are presented in the following table.
Table 1: Tualatin, OR 2020 Weighting Table
Characteristic Population Norm Unweighted Data Weighted Data
Housing
Rent home 45% 9% 29%
Own home 55% 91% 71%
Detached unit* 53% 87% 68%
Attached unit* 47% 13% 32%
Race and Ethnicity
White 89% 90% 85%
Not white 11% 10% 15%
Not Hispanic 87% 97% 91%
Hispanic 13% 3% 9%
Sex and Age
Female 52% 57% 55%
Male 48% 43% 45%
18-34 years of age 29% 8% 18%
35-54 years of age 40% 43% 43%
55+ years of age 31% 49% 39%
Females 18-34 15% 5% 11%
Females 35-54 21% 26% 25%
Females 55+ 16% 27% 19%
Males 18-34 14% 3% 9%
Males 35-54 19% 17% 18%
Males 55+ 14% 22% 18%
Area
East Tualatin 26% 20% 23%
Northwest Tualatin 28% 22% 26%
Southwest Tualatin 46% 57% 51%
* U.S. Census Bureau, ACS 2017 5-year estimates
The National Community Survey™ - Supplemental Online Survey Report
3
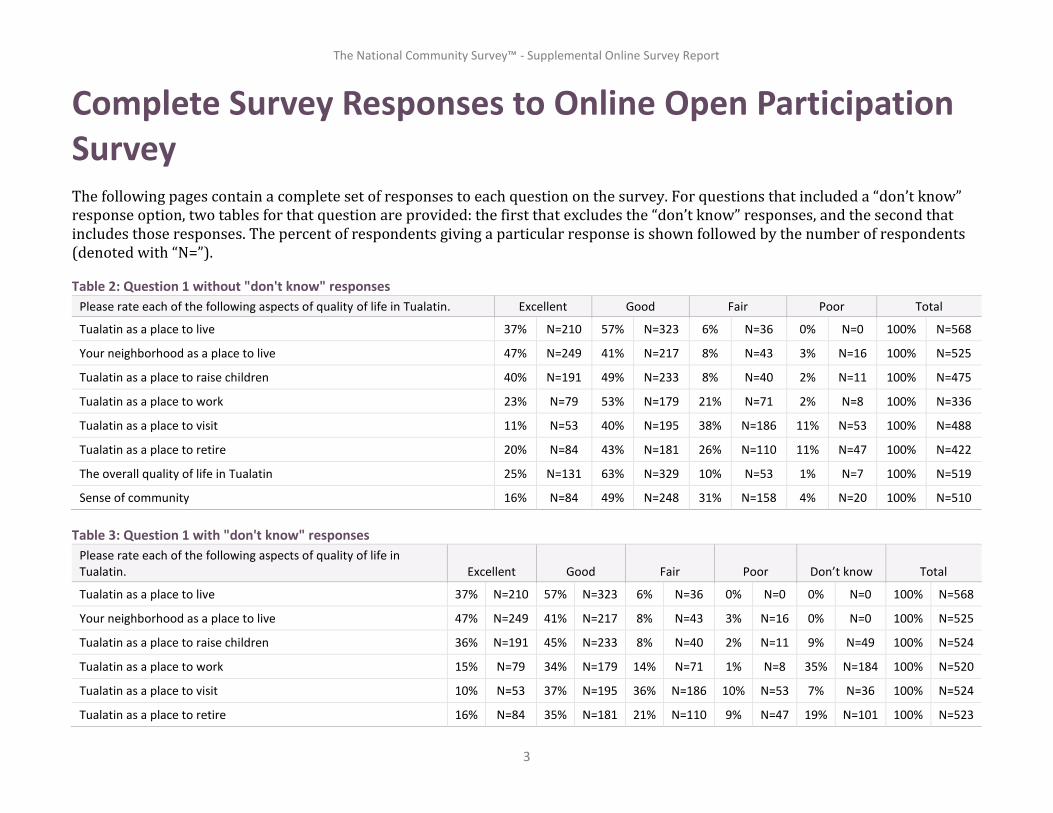
Complete Survey Responses to Online Open Participation Survey The following pages contain a complete set of responses to each question on the survey. For questions that included a “don’t know” response option, two tables for that question are provided: the first that excludes the “don’t know” responses, and the second that includes those responses. The percent of respondents giving a particular response is shown followed by the number of respondents (denoted with “N=”).
Table 2: Question 1 without "don't know" responses
Please rate each of the following aspects of quality of life in Tualatin. Excellent Good Fair Poor Total
Tualatin as a place to live 37% N=210 57% N=323 6% N=36 0% N=0 100% N=568
Your neighborhood as a place to live 47% N=249 41% N=217 8% N=43 3% N=16 100% N=525
Tualatin as a place to raise children 40% N=191 49% N=233 8% N=40 2% N=11 100% N=475
Tualatin as a place to work 23% N=79 53% N=179 21% N=71 2% N=8 100% N=336
Tualatin as a place to visit 11% N=53 40% N=195 38% N=186 11% N=53 100% N=488
Tualatin as a place to retire 20% N=84 43% N=181 26% N=110 11% N=47 100% N=422
The overall quality of life in Tualatin 25% N=131 63% N=329 10% N=53 1% N=7 100% N=519
Sense of community 16% N=84 49% N=248 31% N=158 4% N=20 100% N=510
Table 3: Question 1 with "don't know" responses
Please rate each of the following aspects of quality of life in Tualatin. Excellent Good Fair Poor Don’t know Total
Tualatin as a place to live 37% N=210 57% N=323 6% N=36 0% N=0 0% N=0 100% N=568
Your neighborhood as a place to live 47% N=249 41% N=217 8% N=43 3% N=16 0% N=0 100% N=525
Tualatin as a place to raise children 36% N=191 45% N=233 8% N=40 2% N=11 9% N=49 100% N=524
Tualatin as a place to work 15% N=79 34% N=179 14% N=71 1% N=8 35% N=184 100% N=520
Tualatin as a place to visit 10% N=53 37% N=195 36% N=186 10% N=53 7% N=36 100% N=524
Tualatin as a place to retire 16% N=84 35% N=181 21% N=110 9% N=47 19% N=101 100% N=523

The National Community Survey™ - Supplemental Online Survey Report
4
Please rate each of the following aspects of quality of life in Tualatin. Excellent Good Fair Poor Don’t know Total
The overall quality of life in Tualatin 25% N=131 63% N=329 10% N=53 1% N=7 0% N=0 100% N=519
Sense of community 16% N=84 47% N=248 30% N=158 4% N=20 3% N=14 100% N=524
Table 4: Question 2 without "don't know" responses
Please rate each of the following characteristics as they relate to Tualatin as a whole. Excellent Good Fair Poor Total
Overall economic health of Tualatin 8% N=38 70% N=325 20% N=93 2% N=10 100% N=467
Overall quality of the transportation system (auto, bicycle, foot, bus) in Tualatin 9% N=44 42% N=209 37% N=183 12% N=60 100% N=495
Overall design or layout of Tualatin's residential and commercial areas (e.g., homes, buildings, streets, parks, etc.) 8% N=41 51% N=252 33% N=164 7% N=36 100% N=494
Overall quality of the utility infrastructure in Tualatin (water, sewer, storm water, electric/gas) 24% N=118 67% N=324 8% N=37 1% N=7 100% N=485
Overall feeling of safety in Tualatin 26% N=134 61% N=306 11% N=57 2% N=9 100% N=505
Overall quality of natural environment in Tualatin 31% N=156 59% N=299 9% N=47 1% N=3 100% N=505
Overall quality of parks and recreation opportunities 32% N=158 53% N=263 14% N=70 1% N=6 100% N=497
Overall health and wellness opportunities in Tualatin 19% N=93 60% N=289 16% N=77 4% N=21 100% N=480
Overall opportunities for education, culture, and the arts 9% N=42 49% N=236 34% N=161 8% N=39 100% N=479
Residents' connection and engagement with their community 10% N=47 47% N=221 35% N=164 8% N=39 100% N=472
Table 5: Question 2 with "don't know" responses
Please rate each of the following characteristics as they relate to Tualatin as a whole. Excellent Good Fair Poor Don’t know Total
Overall economic health of Tualatin 7% N=38 61% N=325 17% N=93 2% N=10 13% N=70 100% N=537
Overall quality of the transportation system (auto, bicycle, foot, bus) in Tualatin 9% N=44 41% N=209 36% N=183 12% N=60 2% N=12 100% N=507
Overall design or layout of Tualatin's residential and commercial areas (e.g., homes, buildings, streets, parks, etc.) 8% N=41 51% N=252 33% N=164 7% N=36 0% N=2 100% N=496
Overall quality of the utility infrastructure in Tualatin (water, sewer, storm water, electric/gas) 23% N=118 64% N=324 7% N=37 1% N=7 4% N=22 100% N=508

The National Community Survey™ - Supplemental Online Survey Report
5
Please rate each of the following characteristics as they relate to Tualatin as a whole. Excellent Good Fair Poor Don’t know Total
Overall feeling of safety in Tualatin 26% N=134 61% N=306 11% N=57 2% N=9 0% N=0 100% N=505
Overall quality of natural environment in Tualatin 31% N=156 59% N=299 9% N=47 1% N=3 0% N=0 100% N=505
Overall quality of parks and recreation opportunities 32% N=158 52% N=263 14% N=70 1% N=6 1% N=4 100% N=501
Overall health and wellness opportunities in Tualatin 18% N=93 57% N=289 15% N=77 4% N=21 5% N=28 100% N=508
Overall opportunities for education, culture, and the arts 8% N=42 47% N=236 32% N=161 8% N=39 5% N=27 100% N=506
Residents' connection and engagement with their community 9% N=47 44% N=221 32% N=164 8% N=39 7% N=34 100% N=506
Table 6: Question 3 without "don't know" responses
Please indicate how likely or unlikely you are to do each of the following. Very likely Somewhat likely Somewhat unlikely Very unlikely Total
Recommend living in Tualatin to someone who asks 45% N=238 44% N=233 7% N=35 4% N=21 100% N=527
Remain in Tualatin for the next five years 55% N=267 28% N=135 11% N=53 7% N=34 100% N=488
Table 7: Question 3 with "don't know" responses
Please indicate how likely or unlikely you are to do each of the following. Very likely
Somewhat likely
Somewhat unlikely
Very unlikely
Don’t know Total
Recommend living in Tualatin to someone who asks 45% N=238 44% N=233 7% N=35 4% N=21 1% N=4 100% N=531
Remain in Tualatin for the next five years 53% N=267 27% N=135 11% N=53 7% N=34 2% N=10 100% N=499
Table 8: Question 4 without "don't know" responses
Please rate how safe or unsafe you feel: Very safe Somewhat
safe Neither safe nor
unsafe Somewhat
unsafe Very
unsafe Total
In your neighborhood during the day 75% N=374 20% N=100 3% N=16 2% N=9 0% N=0 100% N=500
In Tualatin's downtown/commercial area during the day 70% N=340 23% N=114 5% N=23 2% N=10 0% N=0 100% N=487
From property crime 31% N=154 47% N=235 11% N=56 9% N=45 2% N=8 100% N=498
From violent crime 59% N=291 32% N=160 6% N=28 2% N=12 1% N=5 100% N=496
From fire, flood, or other natural disaster 50% N=244 36% N=175 11% N=56 3% N=14 0% N=2 100% N=491

The National Community Survey™ - Supplemental Online Survey Report
6
Table 9: Question 4 with "don't know" responses
Please rate how safe or unsafe you feel: Very safe Somewhat
safe Neither safe nor
unsafe Somewhat
unsafe Very
unsafe Don’t know Total
In your neighborhood during the day 75% N=374 20% N=100 3% N=16 2% N=9 0% N=0 0% N=0 100% N=500
In Tualatin's downtown/commercial area during the day 68% N=340 23% N=114 5% N=23 2% N=10 0% N=0 3% N=13 100% N=500
From property crime 31% N=154 47% N=235 11% N=56 9% N=45 2% N=8 0% N=2 100% N=500
From violent crime 58% N=291 32% N=160 6% N=28 2% N=12 1% N=5 0% N=2 100% N=498
From fire, flood, or other natural disaster 49% N=244 35% N=175 11% N=56 3% N=14 0% N=2 1% N=5 100% N=496
Table 10: Question 5 without "don't know" responses
Please rate the job you feel the Tualatin community does at each of the following. Excellent Good Fair Poor Total
Making all residents feel welcome 17% N=82 57% N=273 22% N=106 4% N=21 100% N=482
Attracting people from diverse backgrounds 10% N=45 33% N=143 42% N=181 15% N=67 100% N=436
Valuing/respecting residents from diverse backgrounds 13% N=56 48% N=209 33% N=141 6% N=28 100% N=435
Taking care of vulnerable residents (elderly, disabled, homeless, etc.) 9% N=33 46% N=166 36% N=130 9% N=34 100% N=364
Table 11: Question 5 with "don't know" responses
Please rate the job you feel the Tualatin community does at each of the following. Excellent Good Fair Poor Don’t know Total
Making all residents feel welcome 16% N=82 53% N=273 21% N=106 4% N=21 6% N=33 100% N=515
Attracting people from diverse backgrounds 9% N=45 29% N=143 37% N=181 14% N=67 11% N=55 100% N=490
Valuing/respecting residents from diverse backgrounds 11% N=56 43% N=209 29% N=141 6% N=28 11% N=53 100% N=487
Taking care of vulnerable residents (elderly, disabled, homeless, etc.) 7% N=33 34% N=166 27% N=130 7% N=34 25% N=124 100% N=488
Table 12: Question 6 without "don't know" responses
Please rate each of the following characteristics as they relate to Tualatin as a whole. Excellent Good Fair Poor Total
Overall quality of business and service establishments in Tualatin 11% N=51 62% N=300 25% N=122 2% N=11 100% N=485
Variety of business and service establishments in Tualatin 10% N=47 42% N=204 38% N=187 10% N=49 100% N=487

The National Community Survey™ - Supplemental Online Survey Report
7
Please rate each of the following characteristics as they relate to Tualatin as a whole. Excellent Good Fair Poor Total
Vibrancy of downtown/commercial area 8% N=39 29% N=139 40% N=188 23% N=109 100% N=475
Employment opportunities 6% N=17 45% N=139 36% N=111 14% N=44 100% N=311
Shopping opportunities 11% N=54 51% N=247 31% N=151 7% N=34 100% N=486
Cost of living in Tualatin 3% N=16 35% N=167 45% N=217 17% N=83 100% N=483
Overall image or reputation of Tualatin 18% N=87 64% N=302 16% N=73 2% N=9 100% N=471
Table 13: Question 6 with "don't know" responses
Please rate each of the following characteristics as they relate to Tualatin as a whole. Excellent Good Fair Poor Don’t know Total
Overall quality of business and service establishments in Tualatin 10% N=51 61% N=300 25% N=122 2% N=11 1% N=4 100% N=488
Variety of business and service establishments in Tualatin 10% N=47 42% N=204 38% N=187 10% N=49 0% N=1 100% N=488
Vibrancy of downtown/commercial area 8% N=39 29% N=139 39% N=188 22% N=109 2% N=12 100% N=487
Employment opportunities 4% N=17 28% N=139 23% N=111 9% N=44 36% N=177 100% N=488
Shopping opportunities 11% N=54 51% N=247 31% N=151 7% N=34 0% N=1 100% N=488
Cost of living in Tualatin 3% N=16 34% N=167 44% N=217 17% N=83 1% N=6 100% N=488
Overall image or reputation of Tualatin 18% N=87 62% N=302 15% N=73 2% N=9 3% N=16 100% N=487
Table 14: Question 7 without "don't know" responses
Please rate each of the following characteristics as they relate to Tualatin as a whole. Excellent Good Fair Poor Total
Traffic flow on major streets 1% N=5 21% N=103 41% N=200 36% N=177 100% N=485
Ease of public parking 13% N=57 49% N=223 33% N=151 5% N=21 100% N=452
Ease of travel by car in Tualatin 8% N=36 46% N=210 33% N=153 13% N=59 100% N=458
Ease of travel by public transportation in Tualatin 5% N=16 22% N=64 43% N=127 30% N=89 100% N=296
Ease of travel by bicycle in Tualatin 12% N=42 42% N=145 33% N=111 13% N=43 100% N=342
Ease of walking in Tualatin 19% N=83 49% N=218 26% N=115 6% N=28 100% N=444
Well-planned residential growth 7% N=25 38% N=141 41% N=151 13% N=49 100% N=367

The National Community Survey™ - Supplemental Online Survey Report
8
Please rate each of the following characteristics as they relate to Tualatin as a whole. Excellent Good Fair Poor Total
Well-planned commercial growth 6% N=19 42% N=139 35% N=115 17% N=58 100% N=332
Well-designed neighborhoods 12% N=51 56% N=244 26% N=112 7% N=29 100% N=436
Preservation of the historical or cultural character of the community 12% N=47 51% N=192 33% N=124 4% N=17 100% N=380
Public places where people want to spend time 12% N=54 45% N=202 35% N=157 8% N=37 100% N=449
Variety of housing options 6% N=26 44% N=184 33% N=136 17% N=72 100% N=418
Availability of affordable quality housing 4% N=15 24% N=86 35% N=126 36% N=130 100% N=357
Overall quality of new development in Tualatin 6% N=22 40% N=144 42% N=150 12% N=45 100% N=360
Overall appearance of Tualatin 17% N=78 64% N=290 17% N=79 2% N=9 100% N=456
Cleanliness of Tualatin 29% N=132 61% N=278 10% N=43 0% N=1 100% N=455
Water resources (beaches, lakes, ponds, riverways, etc.) 18% N=78 49% N=214 27% N=119 6% N=28 100% N=439
Air quality 25% N=110 66% N=294 9% N=38 1% N=4 100% N=446
Availability of paths and walking trails 27% N=119 55% N=244 17% N=74 2% N=9 100% N=446
Fitness opportunities (including exercise classes and paths or trails, etc.) 21% N=88 53% N=221 23% N=96 3% N=12 100% N=417
Recreational opportunities 11% N=50 53% N=234 30% N=133 6% N=27 100% N=444
Availability of affordable quality food 13% N=57 55% N=245 26% N=116 6% N=28 100% N=447
Availability of affordable quality health care 17% N=68 61% N=240 18% N=71 4% N=17 100% N=395
Availability of preventive health services 18% N=68 62% N=237 17% N=64 4% N=14 100% N=383
Availability of affordable quality mental health care 8% N=19 38% N=85 26% N=59 27% N=61 100% N=223
Opportunities to attend cultural/arts/music activities 8% N=36 47% N=203 33% N=142 12% N=52 100% N=433
Community support for the arts 15% N=60 47% N=187 28% N=111 11% N=43 100% N=400
Availability of affordable quality childcare/preschool 7% N=13 45% N=87 34% N=66 15% N=30 100% N=196
K-12 education 25% N=89 50% N=176 16% N=57 8% N=29 100% N=350
Adult educational opportunities 6% N=18 40% N=116 32% N=92 22% N=64 100% N=289
Sense of civic/community pride 9% N=39 50% N=209 34% N=143 6% N=26 100% N=417
Neighborliness of residents in Tualatin 17% N=76 54% N=238 23% N=100 6% N=26 100% N=441

The National Community Survey™ - Supplemental Online Survey Report
9
Please rate each of the following characteristics as they relate to Tualatin as a whole. Excellent Good Fair Poor Total
Opportunities to participate in social events and activities 12% N=50 50% N=212 29% N=123 9% N=39 100% N=424
Opportunities to attend special events and festivals 16% N=69 51% N=226 24% N=107 9% N=40 100% N=442
Opportunities to volunteer 19% N=78 53% N=216 21% N=85 7% N=29 100% N=408
Opportunities to participate in community matters 15% N=63 53% N=220 26% N=107 6% N=27 100% N=417
Openness and acceptance of the community toward people of diverse backgrounds 14% N=49 47% N=163 29% N=101 10% N=36 100% N=349
Table 15: Question 7 with "don't know" responses
Please rate each of the following characteristics as they relate to Tualatin as a whole. Excellent Good Fair Poor Don’t know Total
Traffic flow on major streets 1% N=5 21% N=103 41% N=200 36% N=177 0% N=0 100% N=485
Ease of public parking 12% N=57 49% N=223 33% N=151 5% N=21 2% N=7 100% N=460
Ease of travel by car in Tualatin 8% N=36 46% N=210 33% N=153 13% N=59 0% N=1 100% N=459
Ease of travel by public transportation in Tualatin 3% N=16 14% N=64 28% N=127 19% N=89 36% N=164 100% N=460
Ease of travel by bicycle in Tualatin 9% N=42 32% N=145 25% N=111 10% N=43 25% N=113 100% N=454
Ease of walking in Tualatin 18% N=83 48% N=218 25% N=115 6% N=28 2% N=11 100% N=454
Well-planned residential growth 5% N=25 31% N=141 33% N=151 11% N=49 20% N=92 100% N=459
Well-planned commercial growth 4% N=19 30% N=139 25% N=115 13% N=58 28% N=127 100% N=459
Well-designed neighborhoods 11% N=51 53% N=244 25% N=112 6% N=29 5% N=22 100% N=457
Preservation of the historical or cultural character of the community 10% N=47 42% N=192 27% N=124 4% N=17 17% N=78 100% N=457
Public places where people want to spend time 12% N=54 44% N=202 34% N=157 8% N=37 2% N=8 100% N=457
Variety of housing options 6% N=26 40% N=184 30% N=136 16% N=72 8% N=39 100% N=457
Availability of affordable quality housing 3% N=15 19% N=86 28% N=126 28% N=130 22% N=100 100% N=457
Overall quality of new development in Tualatin 5% N=22 32% N=144 33% N=150 10% N=45 21% N=96 100% N=456
Overall appearance of Tualatin 17% N=78 64% N=290 17% N=79 2% N=9 0% N=0 100% N=456
Cleanliness of Tualatin 29% N=132 61% N=278 9% N=43 0% N=1 0% N=1 100% N=455
The National Community Survey™ - Supplemental Online Survey Report
10
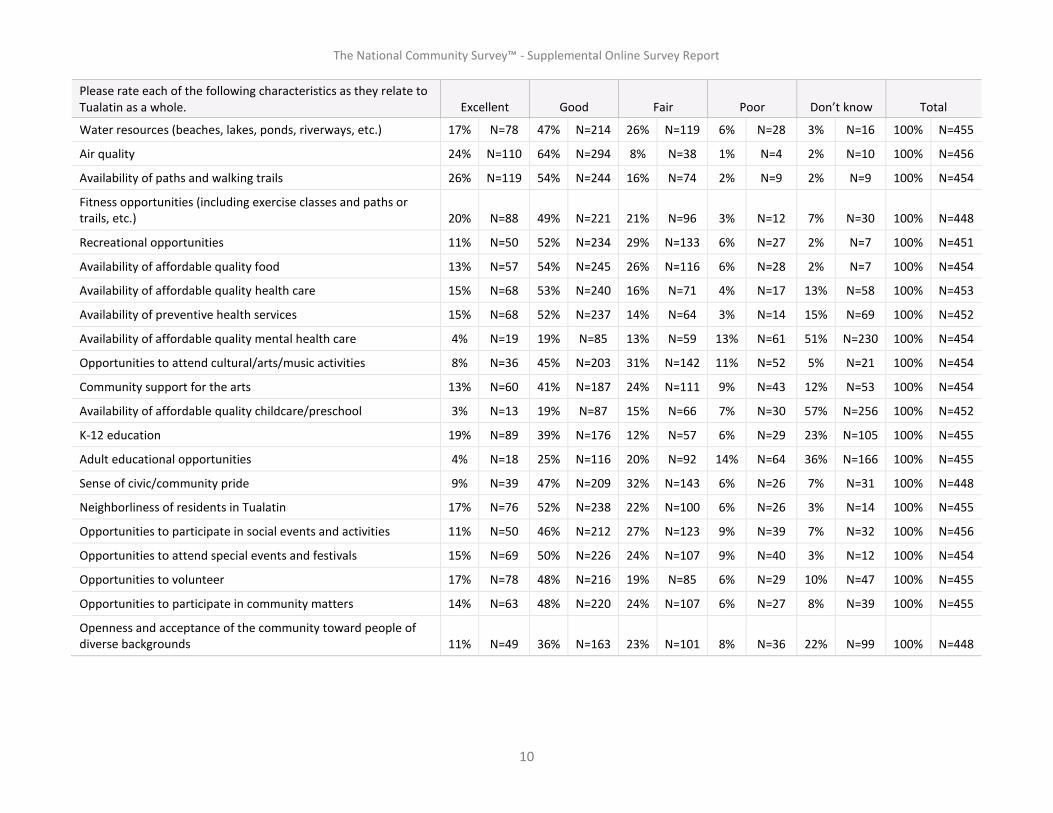
Please rate each of the following characteristics as they relate to Tualatin as a whole. Excellent Good Fair Poor Don’t know Total
Water resources (beaches, lakes, ponds, riverways, etc.) 17% N=78 47% N=214 26% N=119 6% N=28 3% N=16 100% N=455
Air quality 24% N=110 64% N=294 8% N=38 1% N=4 2% N=10 100% N=456
Availability of paths and walking trails 26% N=119 54% N=244 16% N=74 2% N=9 2% N=9 100% N=454
Fitness opportunities (including exercise classes and paths or trails, etc.) 20% N=88 49% N=221 21% N=96 3% N=12 7% N=30 100% N=448
Recreational opportunities 11% N=50 52% N=234 29% N=133 6% N=27 2% N=7 100% N=451
Availability of affordable quality food 13% N=57 54% N=245 26% N=116 6% N=28 2% N=7 100% N=454
Availability of affordable quality health care 15% N=68 53% N=240 16% N=71 4% N=17 13% N=58 100% N=453
Availability of preventive health services 15% N=68 52% N=237 14% N=64 3% N=14 15% N=69 100% N=452
Availability of affordable quality mental health care 4% N=19 19% N=85 13% N=59 13% N=61 51% N=230 100% N=454
Opportunities to attend cultural/arts/music activities 8% N=36 45% N=203 31% N=142 11% N=52 5% N=21 100% N=454
Community support for the arts 13% N=60 41% N=187 24% N=111 9% N=43 12% N=53 100% N=454
Availability of affordable quality childcare/preschool 3% N=13 19% N=87 15% N=66 7% N=30 57% N=256 100% N=452
K-12 education 19% N=89 39% N=176 12% N=57 6% N=29 23% N=105 100% N=455
Adult educational opportunities 4% N=18 25% N=116 20% N=92 14% N=64 36% N=166 100% N=455
Sense of civic/community pride 9% N=39 47% N=209 32% N=143 6% N=26 7% N=31 100% N=448
Neighborliness of residents in Tualatin 17% N=76 52% N=238 22% N=100 6% N=26 3% N=14 100% N=455
Opportunities to participate in social events and activities 11% N=50 46% N=212 27% N=123 9% N=39 7% N=32 100% N=456
Opportunities to attend special events and festivals 15% N=69 50% N=226 24% N=107 9% N=40 3% N=12 100% N=454
Opportunities to volunteer 17% N=78 48% N=216 19% N=85 6% N=29 10% N=47 100% N=455
Opportunities to participate in community matters 14% N=63 48% N=220 24% N=107 6% N=27 8% N=39 100% N=455
Openness and acceptance of the community toward people of diverse backgrounds 11% N=49 36% N=163 23% N=101 8% N=36 22% N=99 100% N=448
The National Community Survey™ - Supplemental Online Survey Report
11
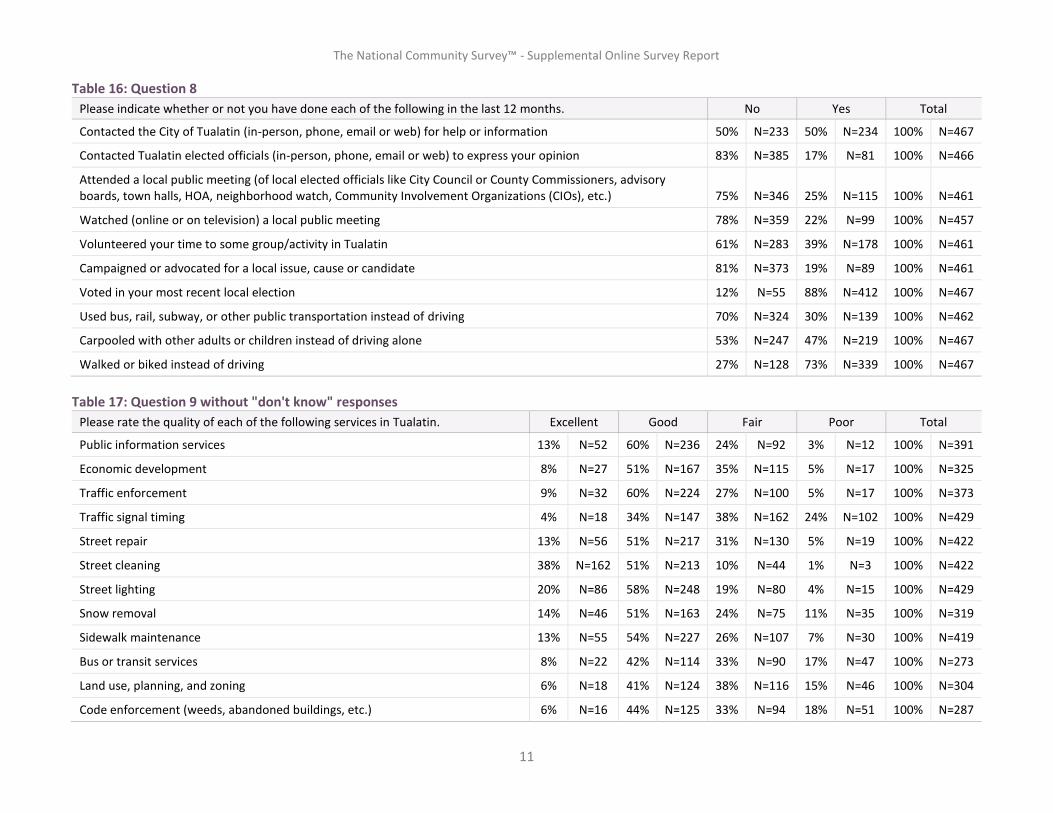
Table 16: Question 8
Please indicate whether or not you have done each of the following in the last 12 months. No Yes Total
Contacted the City of Tualatin (in-person, phone, email or web) for help or information 50% N=233 50% N=234 100% N=467
Contacted Tualatin elected officials (in-person, phone, email or web) to express your opinion 83% N=385 17% N=81 100% N=466
Attended a local public meeting (of local elected officials like City Council or County Commissioners, advisory boards, town halls, HOA, neighborhood watch, Community Involvement Organizations (CIOs), etc.) 75% N=346 25% N=115 100% N=461
Watched (online or on television) a local public meeting 78% N=359 22% N=99 100% N=457
Volunteered your time to some group/activity in Tualatin 61% N=283 39% N=178 100% N=461
Campaigned or advocated for a local issue, cause or candidate 81% N=373 19% N=89 100% N=461
Voted in your most recent local election 12% N=55 88% N=412 100% N=467
Used bus, rail, subway, or other public transportation instead of driving 70% N=324 30% N=139 100% N=462
Carpooled with other adults or children instead of driving alone 53% N=247 47% N=219 100% N=467
Walked or biked instead of driving 27% N=128 73% N=339 100% N=467
Table 17: Question 9 without "don't know" responses
Please rate the quality of each of the following services in Tualatin. Excellent Good Fair Poor Total
Public information services 13% N=52 60% N=236 24% N=92 3% N=12 100% N=391
Economic development 8% N=27 51% N=167 35% N=115 5% N=17 100% N=325
Traffic enforcement 9% N=32 60% N=224 27% N=100 5% N=17 100% N=373
Traffic signal timing 4% N=18 34% N=147 38% N=162 24% N=102 100% N=429
Street repair 13% N=56 51% N=217 31% N=130 5% N=19 100% N=422
Street cleaning 38% N=162 51% N=213 10% N=44 1% N=3 100% N=422
Street lighting 20% N=86 58% N=248 19% N=80 4% N=15 100% N=429
Snow removal 14% N=46 51% N=163 24% N=75 11% N=35 100% N=319
Sidewalk maintenance 13% N=55 54% N=227 26% N=107 7% N=30 100% N=419
Bus or transit services 8% N=22 42% N=114 33% N=90 17% N=47 100% N=273
Land use, planning, and zoning 6% N=18 41% N=124 38% N=116 15% N=46 100% N=304
Code enforcement (weeds, abandoned buildings, etc.) 6% N=16 44% N=125 33% N=94 18% N=51 100% N=287

The National Community Survey™ - Supplemental Online Survey Report
12
Please rate the quality of each of the following services in Tualatin. Excellent Good Fair Poor Total
Affordable high-speed internet access 13% N=51 48% N=185 28% N=106 11% N=43 100% N=385
Garbage collection 37% N=158 53% N=223 7% N=30 3% N=13 100% N=424
Drinking water 46% N=197 45% N=194 7% N=31 1% N=6 100% N=427
Sewer services 40% N=162 52% N=209 6% N=24 2% N=8 100% N=403
Storm water management (storm drainage, dams, levees, etc.) 33% N=128 56% N=217 9% N=34 2% N=9 100% N=388
Power (electric and/or gas) utility 37% N=153 56% N=233 8% N=32 0% N=0 100% N=418
Utility billing 29% N=119 59% N=241 11% N=45 1% N=3 100% N=408
Police/Sheriff services 33% N=130 51% N=198 14% N=55 2% N=7 100% N=389
Crime prevention 20% N=73 55% N=198 22% N=78 3% N=12 100% N=361
Animal control 22% N=57 56% N=144 15% N=40 7% N=18 100% N=258
Ambulance or emergency medical services 34% N=110 58% N=186 8% N=25 0% N=1 100% N=322
Fire services 44% N=147 48% N=163 7% N=25 0% N=2 100% N=337
Fire prevention and education 23% N=64 53% N=149 16% N=44 8% N=21 100% N=279
Emergency preparedness (services that prepare the community for natural disasters or other emergency situations) 23% N=75 46% N=150 21% N=67 10% N=33 100% N=325
Preservation of natural areas (open space, farmlands, and greenbelts) 23% N=92 52% N=209 18% N=71 8% N=30 100% N=402
Tualatin open space 19% N=74 58% N=224 18% N=69 5% N=21 100% N=388
Recycling 28% N=117 54% N=222 11% N=44 6% N=27 100% N=409
Yard waste pick-up 37% N=132 49% N=174 11% N=40 3% N=11 100% N=357
City parks 36% N=154 53% N=228 9% N=37 2% N=10 100% N=428
Recreation programs or classes 17% N=58 49% N=172 26% N=91 8% N=29 100% N=350
Recreation centers or facilities 13% N=48 46% N=163 28% N=99 13% N=44 100% N=355
Health services 18% N=60 61% N=200 18% N=60 3% N=9 100% N=329
Public library services 50% N=211 45% N=187 4% N=15 2% N=6 100% N=419
Overall customer service by Tualatin employees (police, receptionists, planners, etc.) 33% N=125 57% N=218 8% N=30 3% N=11 100% N=384

The National Community Survey™ - Supplemental Online Survey Report
13
Table 18: Question 9 with "don't know" responses
Please rate the quality of each of the following services in Tualatin. Excellent Good Fair Poor Don’t know Total
Public information services 12% N=52 53% N=236 21% N=92 3% N=12 12% N=54 100% N=444
Economic development 6% N=27 38% N=167 27% N=115 4% N=17 25% N=108 100% N=433
Traffic enforcement 7% N=32 52% N=224 23% N=100 4% N=17 13% N=58 100% N=431
Traffic signal timing 4% N=18 34% N=147 37% N=162 24% N=102 1% N=3 100% N=432
Street repair 13% N=56 51% N=217 30% N=130 5% N=19 2% N=7 100% N=430
Street cleaning 38% N=162 49% N=213 10% N=44 1% N=3 2% N=10 100% N=432
Street lighting 20% N=86 58% N=248 19% N=80 4% N=15 0% N=1 100% N=431
Snow removal 11% N=46 38% N=163 18% N=75 8% N=35 26% N=110 100% N=428
Sidewalk maintenance 13% N=55 52% N=227 25% N=107 7% N=30 3% N=13 100% N=432
Bus or transit services 5% N=22 26% N=114 21% N=90 11% N=47 37% N=159 100% N=432
Land use, planning, and zoning 4% N=18 29% N=124 27% N=116 11% N=46 29% N=127 100% N=430
Code enforcement (weeds, abandoned buildings, etc.) 4% N=16 29% N=125 22% N=94 12% N=51 34% N=145 100% N=432
Affordable high-speed internet access 12% N=51 43% N=185 25% N=106 10% N=43 11% N=48 100% N=432
Garbage collection 36% N=158 52% N=223 7% N=30 3% N=13 2% N=9 100% N=432
Drinking water 45% N=197 45% N=194 7% N=31 1% N=6 1% N=5 100% N=432
Sewer services 38% N=162 49% N=209 5% N=24 2% N=8 7% N=28 100% N=431
Storm water management (storm drainage, dams, levees, etc.) 30% N=128 50% N=217 8% N=34 2% N=9 10% N=42 100% N=430
Power (electric and/or gas) utility 36% N=153 54% N=233 7% N=32 0% N=0 3% N=13 100% N=431
Utility billing 27% N=119 56% N=241 10% N=45 1% N=3 6% N=25 100% N=432
Police/Sheriff services 30% N=130 46% N=198 13% N=55 2% N=7 10% N=42 100% N=431
Crime prevention 17% N=73 46% N=198 18% N=78 3% N=12 16% N=68 100% N=430
Animal control 13% N=57 34% N=144 9% N=40 4% N=18 40% N=172 100% N=430
Ambulance or emergency medical services 26% N=110 43% N=186 6% N=25 0% N=1 25% N=110 100% N=431
Fire services 34% N=147 38% N=163 6% N=25 0% N=2 22% N=94 100% N=430
Fire prevention and education 15% N=64 35% N=149 10% N=44 5% N=21 35% N=152 100% N=431
The National Community Survey™ - Supplemental Online Survey Report
14
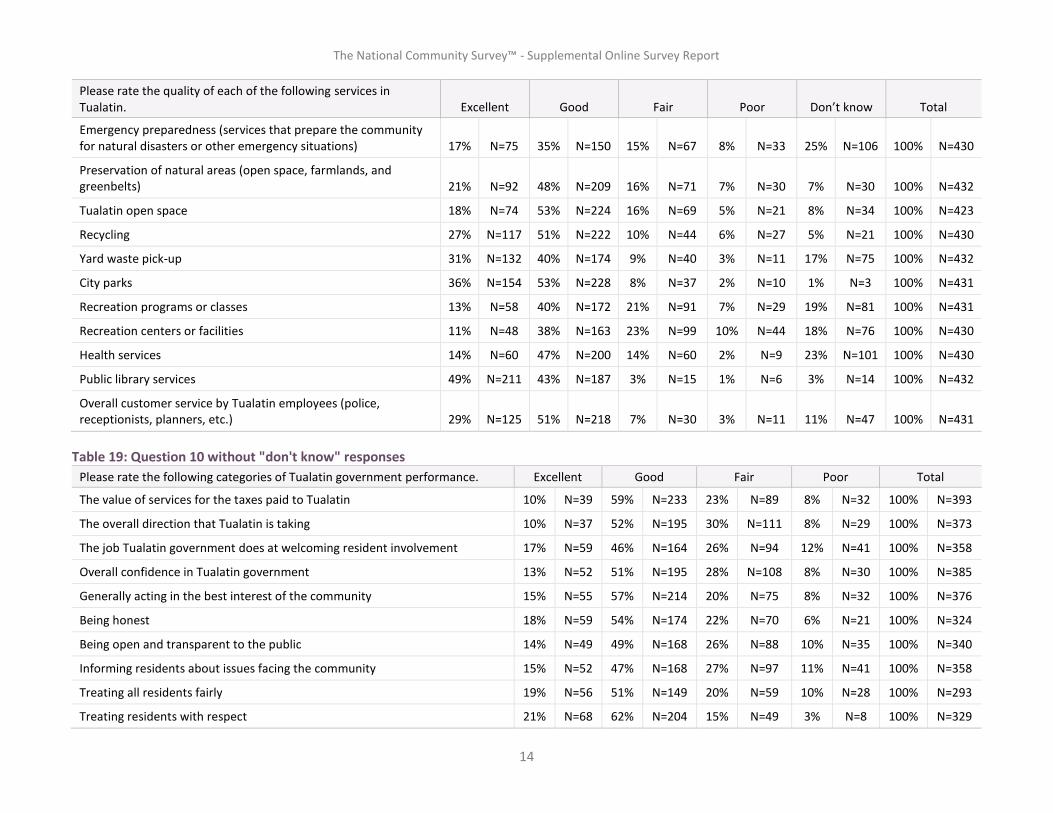
Please rate the quality of each of the following services in Tualatin. Excellent Good Fair Poor Don’t know Total
Emergency preparedness (services that prepare the community for natural disasters or other emergency situations) 17% N=75 35% N=150 15% N=67 8% N=33 25% N=106 100% N=430
Preservation of natural areas (open space, farmlands, and greenbelts) 21% N=92 48% N=209 16% N=71 7% N=30 7% N=30 100% N=432
Tualatin open space 18% N=74 53% N=224 16% N=69 5% N=21 8% N=34 100% N=423
Recycling 27% N=117 51% N=222 10% N=44 6% N=27 5% N=21 100% N=430
Yard waste pick-up 31% N=132 40% N=174 9% N=40 3% N=11 17% N=75 100% N=432
City parks 36% N=154 53% N=228 8% N=37 2% N=10 1% N=3 100% N=431
Recreation programs or classes 13% N=58 40% N=172 21% N=91 7% N=29 19% N=81 100% N=431
Recreation centers or facilities 11% N=48 38% N=163 23% N=99 10% N=44 18% N=76 100% N=430
Health services 14% N=60 47% N=200 14% N=60 2% N=9 23% N=101 100% N=430
Public library services 49% N=211 43% N=187 3% N=15 1% N=6 3% N=14 100% N=432
Overall customer service by Tualatin employees (police, receptionists, planners, etc.) 29% N=125 51% N=218 7% N=30 3% N=11 11% N=47 100% N=431
Table 19: Question 10 without "don't know" responses
Please rate the following categories of Tualatin government performance. Excellent Good Fair Poor Total
The value of services for the taxes paid to Tualatin 10% N=39 59% N=233 23% N=89 8% N=32 100% N=393
The overall direction that Tualatin is taking 10% N=37 52% N=195 30% N=111 8% N=29 100% N=373
The job Tualatin government does at welcoming resident involvement 17% N=59 46% N=164 26% N=94 12% N=41 100% N=358
Overall confidence in Tualatin government 13% N=52 51% N=195 28% N=108 8% N=30 100% N=385
Generally acting in the best interest of the community 15% N=55 57% N=214 20% N=75 8% N=32 100% N=376
Being honest 18% N=59 54% N=174 22% N=70 6% N=21 100% N=324
Being open and transparent to the public 14% N=49 49% N=168 26% N=88 10% N=35 100% N=340
Informing residents about issues facing the community 15% N=52 47% N=168 27% N=97 11% N=41 100% N=358
Treating all residents fairly 19% N=56 51% N=149 20% N=59 10% N=28 100% N=293
Treating residents with respect 21% N=68 62% N=204 15% N=49 3% N=8 100% N=329

The National Community Survey™ - Supplemental Online Survey Report
15
Table 20: Question 10 with "don't know" responses
Please rate the following categories of Tualatin government performance. Excellent Good Fair Poor Don’t know Total
The value of services for the taxes paid to Tualatin 9% N=39 56% N=233 21% N=89 8% N=32 6% N=24 100% N=417
The overall direction that Tualatin is taking 9% N=37 49% N=195 28% N=111 7% N=29 7% N=29 100% N=403
The job Tualatin government does at welcoming resident involvement 15% N=59 40% N=164 23% N=94 10% N=41 12% N=50 100% N=408
Overall confidence in Tualatin government 13% N=52 48% N=195 27% N=108 7% N=30 6% N=23 100% N=408
Generally acting in the best interest of the community 13% N=55 52% N=214 18% N=75 8% N=32 8% N=32 100% N=408
Being honest 15% N=59 43% N=174 17% N=70 5% N=21 20% N=83 100% N=407
Being open and transparent to the public 12% N=49 41% N=168 22% N=88 9% N=35 17% N=68 100% N=408
Informing residents about issues facing the community 13% N=52 41% N=168 24% N=97 10% N=41 12% N=50 100% N=408
Treating all residents fairly 14% N=56 36% N=149 14% N=59 7% N=28 28% N=116 100% N=408
Treating residents with respect 17% N=68 50% N=204 12% N=49 2% N=8 19% N=79 100% N=408
Table 21: Question 11 without "don't know" responses
Overall, how would you rate the quality of the services provided by each of the following? Excellent Good Fair Poor Total
The City of Tualatin 21% N=81 58% N=218 20% N=76 1% N=3 100% N=378
The Federal Government 5% N=17 21% N=77 42% N=153 32% N=114 100% N=361
Table 22: Question 11 with "don't know" responses
Overall, how would you rate the quality of the services provided by each of the following? Excellent Good Fair Poor
Don’t know Total
The City of Tualatin 20% N=81 54% N=218 19% N=76 1% N=3 7% N=29 100% N=407
The Federal Government 4% N=17 19% N=77 38% N=153 29% N=114 9% N=37 100% N=398

The National Community Survey™ - Supplemental Online Survey Report
16
Table 23: Question 12
Please rate how important, if at all, you think it is for the Tualatin community to focus on each of the following in the coming two years. Essential
Very important
Somewhat important
Not at all important Total
Overall economic health of Tualatin 43% N=172 47% N=189 8% N=31 2% N=7 100% N=398
Overall quality of the transportation system (auto, bicycle, foot, bus) in Tualatin 46% N=185 40% N=161 13% N=51 1% N=3 100% N=400
Overall design or layout of Tualatin's residential and commercial areas (e.g., homes, buildings, streets, parks, etc.) 34% N=136 47% N=187 19% N=74 1% N=3 100% N=400
Overall quality of the utility infrastructure in Tualatin (water, sewer, storm water, electric/gas) 37% N=147 44% N=176 19% N=74 1% N=3 100% N=399
Overall feeling of safety in Tualatin 51% N=201 39% N=157 9% N=36 1% N=4 100% N=399
Overall quality of natural environment in Tualatin 34% N=138 47% N=187 17% N=69 2% N=7 100% N=401
Overall quality of parks and recreation opportunities 33% N=134 45% N=181 20% N=78 2% N=7 100% N=400
Overall health and wellness opportunities in Tualatin 23% N=91 45% N=180 30% N=120 2% N=10 100% N=400
Overall opportunities for education, culture and the arts 27% N=108 43% N=170 29% N=114 2% N=7 100% N=399
Residents' connection and engagement with their community 20% N=81 52% N=207 26% N=105 2% N=6 100% N=399
Table 24: Question 13 without "don't know" responses
Many parks amenities are reaching the end of their safe and reliable life (e.g., Brown’s Ferry Community Center building and the playground at Jurgens Park). Without additional funding for renovation or replacement, the City may soon need to close, reduce, or remove park amenities. Knowing this, how much would you support or oppose each of the following actions the City might take?
Strongly support
Somewhat support
Somewhat oppose
Strongly oppose Total
Develop a proposal for a property tax levy or bond for maintaining our parks amenities and then place the question on the ballot for voters to decide 40% N=156 36% N=140 9% N=36 15% N=58 100% N=390
Add a fee to each utility bill, with the amount to be determined and approved by City Council, to pay for maintaining our parks amenities 22% N=86 33% N=130 21% N=81 24% N=95 100% N=392
Do not ask property owners or utility rate payers to pay more even if it means reducing or removing amenities 14% N=50 18% N=67 33% N=122 35% N=127 100% N=366

The National Community Survey™ - Supplemental Online Survey Report
17
Table 25: Question 13 with "don't know" responses
Many parks amenities are reaching the end of their safe and reliable life (e.g., Brown’s Ferry Community Center building and the playground at Jurgens Park). Without additional funding for renovation or replacement, the City may soon need to close, reduce, or remove park amenities. Knowing this, how much would you support or oppose each of the following actions the City might take?
Strongly support
Somewhat support
Somewhat oppose
Strongly oppose
Don’t know Total
Develop a proposal for a property tax levy or bond for maintaining our parks amenities and then place the question on the ballot for voters to decide 39% N=156 35% N=140 9% N=36 14% N=58 3% N=11 100% N=400
Add a fee to each utility bill, with the amount to be determined and approved by City Council, to pay for maintaining our parks amenities 22% N=86 33% N=130 20% N=81 24% N=95 1% N=4 100% N=396
Do not ask property owners or utility rate payers to pay more even if it means reducing or removing amenities 13% N=50 17% N=67 31% N=122 32% N=127 8% N=30 100% N=396
Table 26: Question 14
Please indicate how much of a source, if at all, you consider each of the following to be for obtaining information about the City of Tualatin government and its activities, events, and services. Major source Minor source Not a source Total
City website (www.tualatinoregon.gov) 69% N=274 26% N=103 5% N=21 100% N=397
Local media outlets (Tualatin Times, Tualatin Life, local television stations) 51% N=203 42% N=165 7% N=29 100% N=398
City e-newsletter Tualatin Today 44% N=173 41% N=162 16% N=63 100% N=398
Talking with City officials 15% N=59 44% N=174 41% N=163 100% N=396
City Council or other public meetings 20% N=77 47% N=188 33% N=131 100% N=396
City communications via social media (Facebook, Twitter, Nextdoor, etc.) 36% N=144 42% N=165 22% N=87 100% N=395
Word-of-mouth 20% N=79 59% N=233 21% N=84 100% N=396

The National Community Survey™ - Supplemental Online Survey Report
18
Table 27: Question D1 without "don't know" responses
Thinking about a typical week, how many times do you:
Several times a day Once a day
A few times a week
Every few weeks
Less often or never Total
Access the internet from your home using a computer, laptop or tablet computer 86% N=344 4% N=17 3% N=14 3% N=13 3% N=13 100% N=401
Access the internet from your cell phone 89% N=350 3% N=13 4% N=17 1% N=5 2% N=9 100% N=394
Visit social media sites such as Facebook, Twitter, WhatsApp, etc. 58% N=231 16% N=65 7% N=30 4% N=15 15% N=59 100% N=400
Use or check email 87% N=346 11% N=45 2% N=8 0% N=0 0% N=0 100% N=399
Share your opinions online 16% N=61 6% N=25 17% N=66 14% N=55 47% N=185 100% N=391
Shop online 11% N=43 9% N=35 36% N=144 36% N=142 9% N=36 100% N=400
Table 28: Question D1 with "don't know" responses
Thinking about a typical week, how many times do you:
Several times a day Once a day
A few times a week
Every few weeks
Less often or never
Don’t know Total
Access the internet from your home using a computer, laptop or tablet computer 85% N=344 4% N=17 3% N=14 3% N=13 3% N=13 0% N=2 100% N=403
Access the internet from your cell phone 89% N=350 3% N=13 4% N=17 1% N=5 2% N=9 0% N=0 100% N=394
Visit social media sites such as Facebook, Twitter, WhatsApp, etc. 58% N=231 16% N=65 7% N=30 4% N=15 15% N=59 0% N=1 100% N=400
Use or check email 87% N=346 11% N=45 2% N=8 0% N=0 0% N=0 0% N=0 100% N=399
Share your opinions online 15% N=61 6% N=25 16% N=66 14% N=55 46% N=185 2% N=7 100% N=398
Shop online 11% N=43 9% N=35 36% N=144 36% N=142 9% N=36 0% N=0 100% N=400
The National Community Survey™ - Supplemental Online Survey Report
19
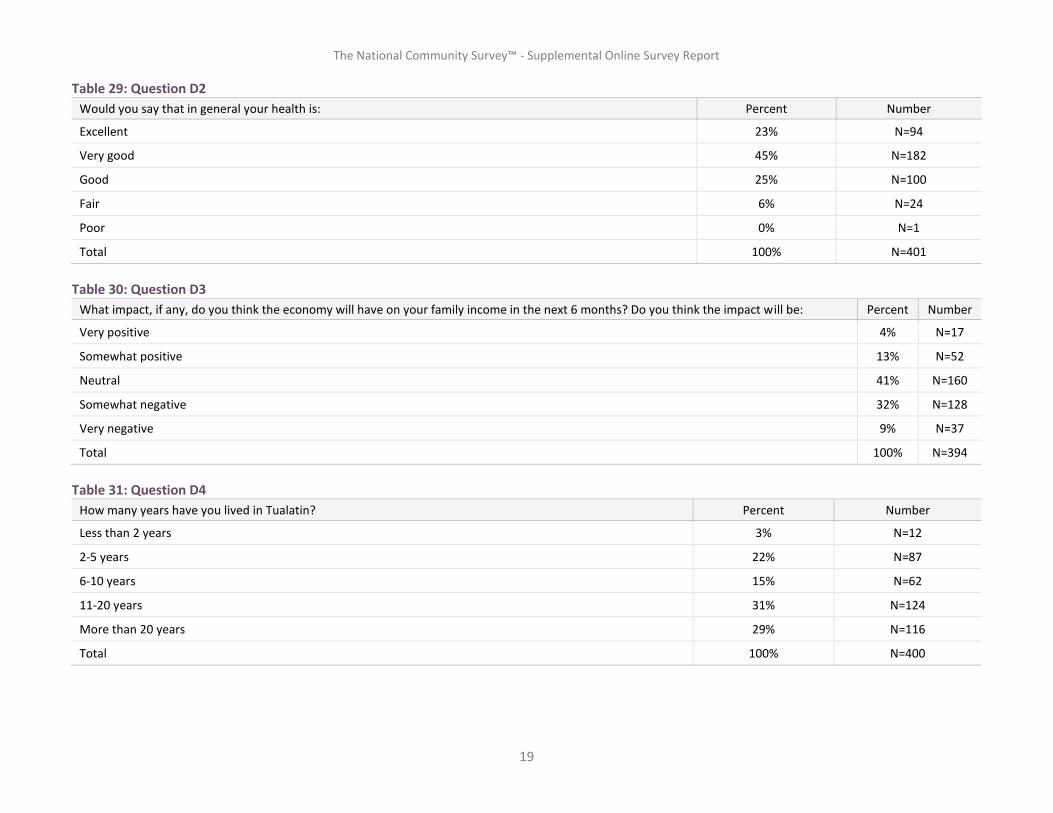
Table 29: Question D2
Would you say that in general your health is: Percent Number
Excellent 23% N=94
Very good 45% N=182
Good 25% N=100
Fair 6% N=24
Poor 0% N=1
Total 100% N=401
Table 30: Question D3
What impact, if any, do you think the economy will have on your family income in the next 6 months? Do you think the impact will be: Percent Number
Very positive 4% N=17
Somewhat positive 13% N=52
Neutral 41% N=160
Somewhat negative 32% N=128
Very negative 9% N=37
Total 100% N=394
Table 31: Question D4
How many years have you lived in Tualatin? Percent Number
Less than 2 years 3% N=12
2-5 years 22% N=87
6-10 years 15% N=62
11-20 years 31% N=124
More than 20 years 29% N=116
Total 100% N=400

The National Community Survey™ - Supplemental Online Survey Report
20
Table 32: Question D5
Which best describes the building you live in? Percent Number
One family house detached from any other houses 66% N=311
Building with two or more homes (duplex, townhome, apartment or condominium) 30% N=140
Mobile home 2% N=8
Other 2% N=10
Total 100% N=468
Table 33: Question D6
Do you rent or own your home? Percent Number
Rent 29% N=136
Own 71% N=331
Total 100% N=467
Table 34: Question D7
About how much is your monthly housing cost for the place you live (including rent, mortgage payment, property tax, property insurance and homeowners' association (HOA) fees)? Percent Number
Less than $500 5% N=18
$500 to $999 11% N=38
$1,000 to $1,499 25% N=90
$1,500 to $1,999 30% N=107
$2,000 to $2,499 14% N=52
$2,500 to $2,999 9% N=31
$3,000 to $3,499 4% N=14
$3,500 or more 2% N=9
Total 100% N=360

The National Community Survey™ - Supplemental Online Survey Report
21
Table 35: Question D8
Do any children 17 or under live in your household? Percent Number
No 60% N=215
Yes 40% N=143
Total 100% N=357
Table 36: Question D9
Are you or any other members of your household aged 65 or older? Percent Number
No 71% N=281
Yes 29% N=115
Total 100% N=396
Table 37: Question D10
How much do you anticipate your household's total income before taxes will be for the current year? (Please include in your total income money from all sources for all persons living in your household.) Percent Number
Less than $25,000 8% N=32
$25,000 to $49,999 13% N=49
$50,000 to $74,999 16% N=61
$75,000 to $99,999 18% N=66
$100,000 to $149,999 24% N=90
$150,000 or more 21% N=79
Total 100% N=377
Table 38: Question D11
Are you Spanish, Hispanic or Latino? Percent Number
No, not Spanish, Hispanic or Latino 91% N=358
Yes, I consider myself to be Spanish, Hispanic or Latino 9% N=33
Total 100% N=391

The National Community Survey™ - Supplemental Online Survey Report
22
Table 39: Question D12
What is your race? (Mark one or more races to indicate what race(s) you consider yourself to be.) Percent Number
American Indian or Alaskan Native 2% N=8
Asian, Asian Indian or Pacific Islander 6% N=23
Black or African American 0% N=0
White 88% N=336
Other 8% N=32
Total may exceed 100% as respondents could select more than one option.
Table 40: Question D13
In which category is your age? Percent Number
18-24 years 6% N=36
25-34 years 11% N=65
35-44 years 24% N=137
45-54 years 19% N=110
55-64 years 18% N=103
65-74 years 17% N=98
75 years or older 4% N=21
Total 100% N=569
Table 41: Question D14
What is your gender? Percent Number
Female 55% N=258
Male 45% N=211
Identify in another way 0% N=1
Total 100% N=470