tuberculosis in london - gov.uk...tuberculosis in london: annual review (2018 data) 5 executive...
TRANSCRIPT
Tuberculosis in London Annual review (2018 data)
Data from 2000 to 2018
Tuberculosis in London: annual review (2018 data)
2
About Public Health England
Public Health England exists to protect and improve the nation’s health and wellbeing,
and reduce health inequalities. We do this through world-leading science, research,
knowledge and intelligence, advocacy, partnerships and the delivery of specialist public
health services. We are an executive agency of the Department of Health and Social
Care, and a distinct delivery organisation with operational autonomy. We provide
government, local government, the NHS, Parliament, industry and the public with
evidence-based professional, scientific and delivery expertise and support.
Public Health England
Wellington House
133-155 Waterloo Road
London SE1 8UG
Tel: 020 7654 8000
www.gov.uk/phe
Twitter: @PHE_uk
Facebook: www.facebook.com/PublicHealthEngland
Prepared by: Field Service (South East and London)
For queries relating to this document, please contact: [email protected]
© Crown copyright 2019
You may re-use this information (excluding logos) free of charge in any format or
medium, under the terms of the Open Government Licence v3.0. To view this licence,
visit OGL. Where we have identified any third-party copyright information you will need
to obtain permission from the copyright holders concerned.
Published September 2019
PHE publications PHE supports the UN
Gateway number: GW-761 Sustainable Development Goals
Tuberculosis in London: annual review (2018 data)
3
Contents
Executive summary 5
1. TB notifications and incidence 7
2. Laboratory confirmation of TB 18
3. TB transmission 19
4. Delay from onset of symptoms to start of treatment 21
5. TB outcomes in drug-sensitive cohort 22
6. Drug-resistant TB (including outcomes in the drug-resistant cohort) 25
7. TB in under-served populations 27
8. TB-HIV co-infection and HIV testing of people with TB 30
9. BCG 31
Discussion 31
Conclusion and recommendations 32
Appendix A: Notes on the report 33
Appendix B: Description of data sources and definitions 34
Appendix C: TB among London residents 38
The data presented in this report are correct as at August 2019.
Tuberculosis in London: annual review (2018 data)
4
Acknowledgements
We are grateful to all those who contribute information on people with tuberculosis in
London, including nurses, physicians, microbiologists, scientists, outreach and social
care and administrative staff. We also acknowledge colleagues at the PHE National
Mycobacterium Reference Service for information on culture confirmation and drug
susceptibility testing. Further thanks are due to the PHE National TB Unit for providing
the cleaned matched dataset, London Centre Health Protection Teams and the Field
Service team for their work supporting the London TB Register.
Authors
This report was prepared by Oliver McManus, Neil Macdonald and Charlotte Anderson
of the Field Service (South East and London), National Infection Service, PHE.
Suggested citation
Public Health England. (September 2019) Tuberculosis in London: Annual review
(2018 data), 2019. Public Health England: (London)
Tuberculosis in London: annual review (2018 data)
5
Executive summary
While London remains the area of highest TB incidence in England, accounting for 36%
of all people with TB in 2018 and over double the national rate, case numbers continue
to decline. In 2018 1,691 people notified with TB in 2018; a rate of 19.0 per 100,000 of
the population. This was a drop of more than half from the peak in 2011.
The London borough of Newham was the only area with a rate above 40 per 100,000,
and most boroughs saw decreases in TB rates. Some very low incidence areas,
however, such as Kingston upon Thames, did have an increase in cases in 2018.
Rates decreased among both those born abroad and those born in the UK, to their
lowest levels since 2000. The majority (82%) of people with TB in London were born
outside the UK, most of whom had been in the UK a long time prior to TB notification.
The most common countries of birth were India, Pakistan, Somalia and Bangladesh,
with median time from entry to notification between 9 and 14 years. The fifth most
common country of birth was Romania: people from here with TB had been in the UK a
median of 3 years prior to notification, with 37% entering diagnosed less than a year
after entering.
Just over half of all people with TB had pulmonary disease, with extra-thoracic lymph
node the next most common site. In 2018, 61% of people with TB had their TB culture
confirmed; 75% among those with pulmonary TB. Of those with pulmonary disease,
77% had a known sputum smear result, of whom 51% were sputum smear positive.
TB rates among UK born children have declined over the last decade, evidence of
declining transmission. From the first year of using WGS to determine relatedness
between people with TB, 25% were clustered within 12 SNPs of another individual.
Rates of clustering were higher among people who were UK born, had one or more
social risk factor and among those with isoniazid resistant disease.
More than 1 in 5 people had a key co-morbidity (diabetes, hepatitis B, hepatitis C,
chronic renal disease, chronic liver disease or immunosuppression), most commonly
diabetes. These were more common among older people (almost half of those aged 65
or older). Almost all people with TB in London were tested for HIV. In 2018 2.9% of
people with TB in London were estimated to be co-infected with HIV.
People with TB in London had shorter periods from becoming unwell to starting
treatment that on average for England (70 days compared to 75).
Of those people with TB notified in 2016 that would be expected to receive 6 months
standard treatment, (excluding those with rifampicin resistant, CNS, spinal, miliary or
cryptic disseminated disease) 86% had completed at 12 months. People who were
Tuberculosis in London: annual review (2018 data)
6
older (65 years of more), had at least one social risk factor or one of the key co-
morbidities were less likely to complete treatment. In addition, only 73% of those with
CNS, spinal, miliary or cryptic disseminated TB had completed treatment by the last
recorded outcome. Overall, 4% of people with rifampicin sensitive TB died before
completing treatment and TB was reported to have caused or contributed to over half of
these deaths.
The proportion of people with TB resistant to 1 or more first line drug increased to 12%,
mostly due to an increase in isoniazid mono-resistance. The proportion with multi-drug
resistant disease remained around 1%.
An increasing proportion of adults with TB had a social risk factor (14% in 2018),
defined as homelessness, prison history, drug or alcohol misuse. Experience of one or
more social risk factor was more common among people born in the UK, men and
those of white ethnicity. People with TB with a social risk factor were more likely to be
infectious and less likely to complete treatment.
In conclusion, it is encouraging that TB rates in London continue to decline and are
now at to their lowest level since 2000. However, 1 in 3 people with TB in London have
either a social risk factor or key co-morbidity. This medical and social complexity
provides significant challenges to TB control and the achievement of TB elimination in
England by 2035
Recommendations
Further reductions in TB in London will require:
• work to reduce diagnostic delay and ensure a prompt start of appropriate treatment,
as well as ongoing work to ensure completion of treatment
• robust contact tracing and further development of WGS cluster investigation to
interrupt transmission
• prioritization of work to improve outcomes for underserved populations and people
with drug resistant TB
The Cohort Review process provides a critical forum for local oversight of these key
aspects of TB control.
TB networks should ensure Cohort review and MDR cohort review continue to play a
vital role in quality assurance of TB case and contact management with identification
and escalation of issues to TB control board.
The TB Control Board working with TB Networks will need to consider changing
epidemiology and case mix to ensure appropriate service provision.
Tuberculosis in London: annual review (2018 data)
7
1. TB notifications and incidence
Overall numbers, rates and geographical distribution
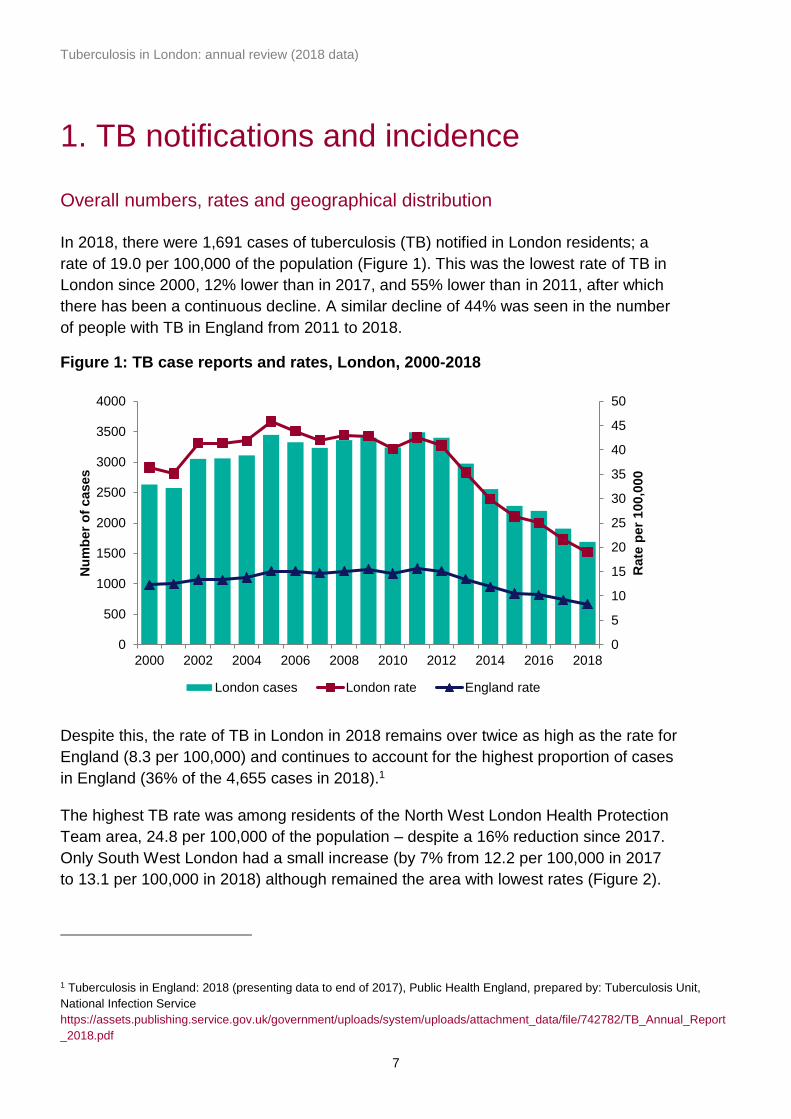
In 2018, there were 1,691 cases of tuberculosis (TB) notified in London residents; a
rate of 19.0 per 100,000 of the population (Figure 1). This was the lowest rate of TB in
London since 2000, 12% lower than in 2017, and 55% lower than in 2011, after which
there has been a continuous decline. A similar decline of 44% was seen in the number
of people with TB in England from 2011 to 2018.
Figure 1: TB case reports and rates, London, 2000-2018
Despite this, the rate of TB in London in 2018 remains over twice as high as the rate for
England (8.3 per 100,000) and continues to account for the highest proportion of cases
in England (36% of the 4,655 cases in 2018).1
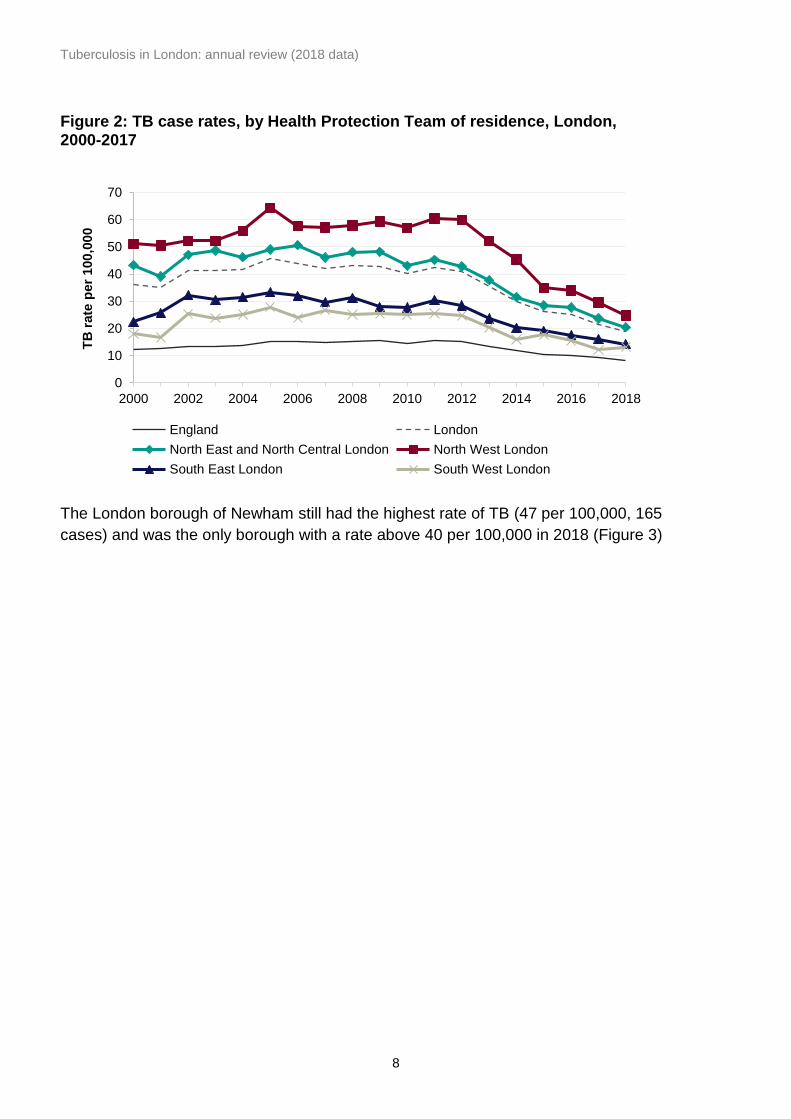
The highest TB rate was among residents of the North West London Health Protection
Team area, 24.8 per 100,000 of the population – despite a 16% reduction since 2017.
Only South West London had a small increase (by 7% from 12.2 per 100,000 in 2017
to 13.1 per 100,000 in 2018) although remained the area with lowest rates (Figure 2).
1 Tuberculosis in England: 2018 (presenting data to end of 2017), Public Health England, prepared by: Tuberculosis Unit,
National Infection Service
https://assets.publishing.service.gov.uk/government/uploads/system/uploads/attachment_data/file/742782/TB_Annual_Report
_2018.pdf
0
5
10
15
20
25
30
35
40
45
50
0
500
1000
1500
2000
2500
3000
3500
4000
2000 2002 2004 2006 2008 2010 2012 2014 2016 2018
Rate
per
100,0
00
Nu
mb
er
of
cases
London cases London rate England rate
Tuberculosis in London: annual review (2018 data)
8
Figure 2: TB case rates, by Health Protection Team of residence, London, 2000-2017
The London borough of Newham still had the highest rate of TB (47 per 100,000, 165
cases) and was the only borough with a rate above 40 per 100,000 in 2018 (Figure 3)
0
10
20
30
40
50
60
70
2000 2002 2004 2006 2008 2010 2012 2014 2016 2018
TB
rate
per
100,0
00
England London
North East and North Central London North West London
South East London South West London

Tuberculosis in London: annual review (2018 data)
9
Figure 3: TB case rate by upper tier local authority of residence, London, 2018
The second highest rate was in Ealing (38 per 100,000, 129 cases). Rates and case
numbers were similar to last year in both these boroughs. There was a sharp decrease
in the rate in Brent (from 46 to 33 per 100,000, 110 cases), which had the second
highest rate in 2017.
Rates in most other boroughs continued to decline, particularly Camden (47%, from
17.4 in 2017 to 9.2 per 100,000 in 2018), Waltham Forest (42%, 29.0 to 17.0 per
100,000), Hammersmith and Fulham (42%, 18.6 to 10.8 per 100,000), Southwark
(38%, 22.3 to 13.9 per 100,000), and Islington (32%, 17.9 to 12.1 per 100,000). There
were some increased rates in lower-incidence boroughs, but these should be treated
with caution due to small numbers (Appendix Cii).
At a higher geographical resolution, more variation was seen in the incidence of TB in
London, such that high overall rates in boroughs, could be attributed to a relatively
small number of very high incidence middle super output areas (Figure 4). This was
particularly the case for Brent, Ealing, Redbridge, Newham and Hounslow.

Tuberculosis in London: annual review (2018 data)
10
Figure 4: TB case rate by Middle Super Output Area of residence, London, 2018
Demographic characteristics
Age and sex
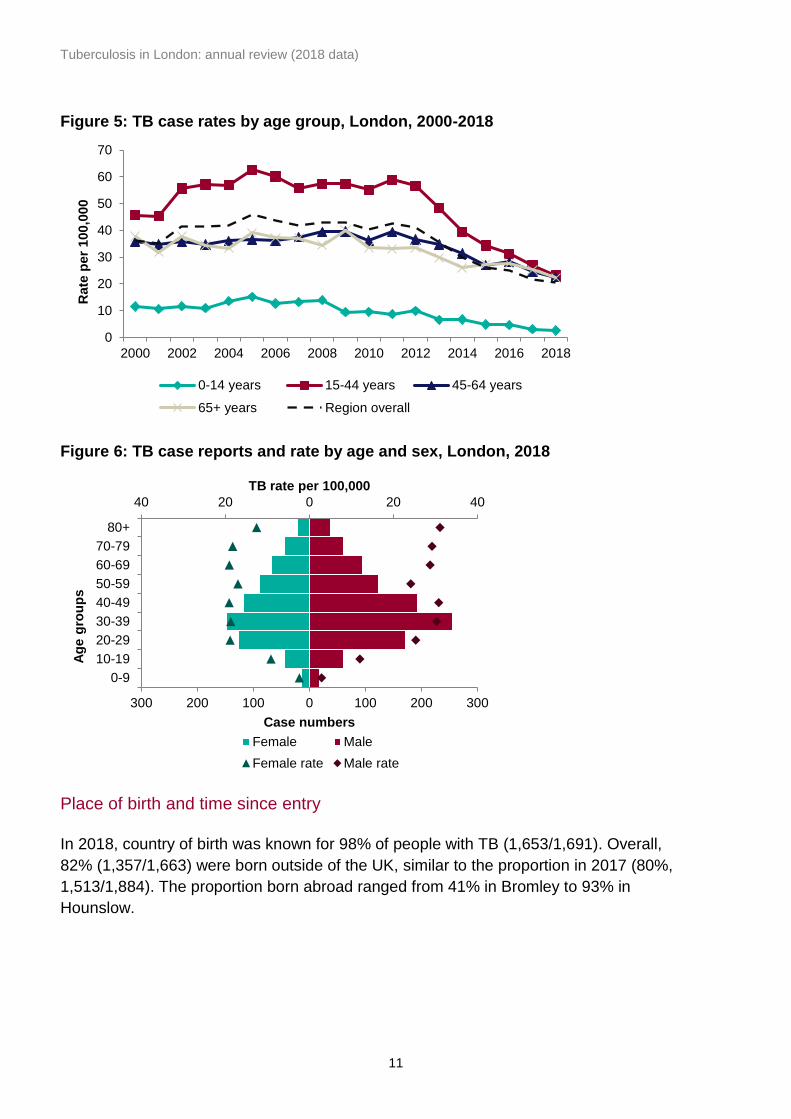
The decline in case numbers since 2011 has been most pronounced in those aged 15
to 44 years (Figure 5). In 2018, 60% (1,016/1,691) of people with TB in London were
male, and the rate was higher among males (22.8 per 100,000) than females (15.1 per
100,000). Among men, rates were close to 30 per 100,000 in all age groups above 30
years, except for the 50-59 age group (24.1 per 100,000) (Figure 6). Among women,
rates were similar (just under 20 per 100,000) for all adults over 20 years up to 80
years or older.
Tuberculosis in London: annual review (2018 data)
11
Figure 5: TB case rates by age group, London, 2000-2018
Figure 6: TB case reports and rate by age and sex, London, 2018
Place of birth and time since entry
In 2018, country of birth was known for 98% of people with TB (1,653/1,691). Overall,
82% (1,357/1,663) were born outside of the UK, similar to the proportion in 2017 (80%,
1,513/1,884). The proportion born abroad ranged from 41% in Bromley to 93% in
Hounslow.
0
10
20
30
40
50
60
70
2000 2002 2004 2006 2008 2010 2012 2014 2016 2018
Rate
per
100,0
00
0-14 years 15-44 years 45-64 years
65+ years Region overall
40 20 0 20 40
300 200 100 0 100 200 300
0-9
10-19
20-29
30-39
40-49
50-59
60-69
70-79
80+
TB rate per 100,000
Case numbers
Ag
e g
rou
ps
Female Male
Female rate Male rate
Tuberculosis in London: annual review (2018 data)
12
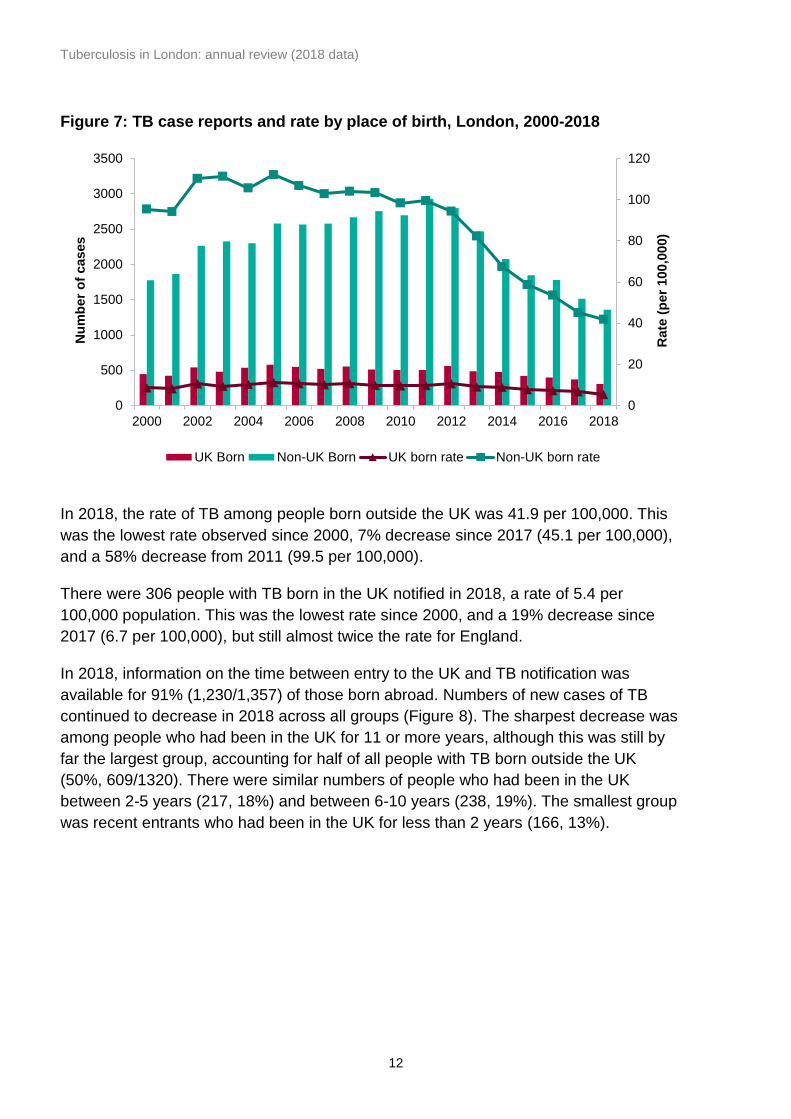
Figure 7: TB case reports and rate by place of birth, London, 2000-2018
In 2018, the rate of TB among people born outside the UK was 41.9 per 100,000. This
was the lowest rate observed since 2000, 7% decrease since 2017 (45.1 per 100,000),
and a 58% decrease from 2011 (99.5 per 100,000).
There were 306 people with TB born in the UK notified in 2018, a rate of 5.4 per
100,000 population. This was the lowest rate since 2000, and a 19% decrease since
2017 (6.7 per 100,000), but still almost twice the rate for England.
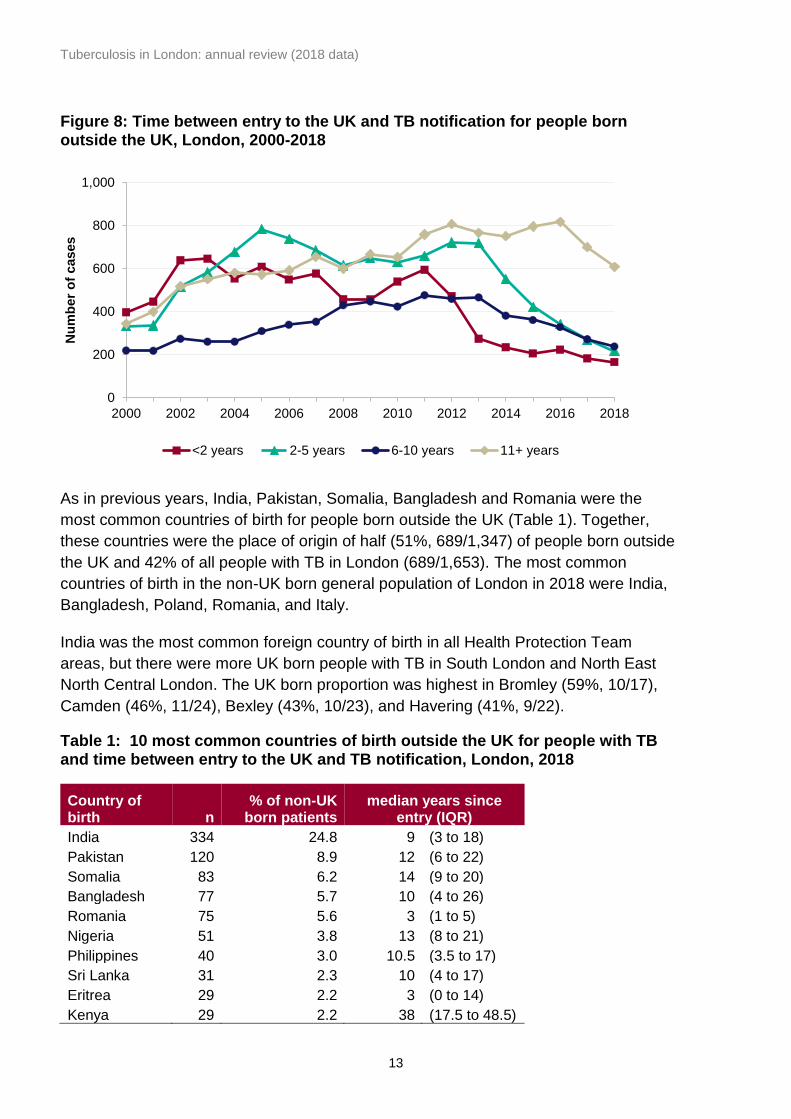
In 2018, information on the time between entry to the UK and TB notification was
available for 91% (1,230/1,357) of those born abroad. Numbers of new cases of TB
continued to decrease in 2018 across all groups (Figure 8). The sharpest decrease was
among people who had been in the UK for 11 or more years, although this was still by
far the largest group, accounting for half of all people with TB born outside the UK
(50%, 609/1320). There were similar numbers of people who had been in the UK
between 2-5 years (217, 18%) and between 6-10 years (238, 19%). The smallest group
was recent entrants who had been in the UK for less than 2 years (166, 13%).
0
20
40
60
80
100
120
0
500
1000
1500
2000
2500
3000
3500
2000 2002 2004 2006 2008 2010 2012 2014 2016 2018
Rate
(p
er
100,0
00)
Nu
mb
er
of
cases
UK Born Non-UK Born UK born rate Non-UK born rate
Tuberculosis in London: annual review (2018 data)
13
Figure 8: Time between entry to the UK and TB notification for people born outside the UK, London, 2000-2018
As in previous years, India, Pakistan, Somalia, Bangladesh and Romania were the
most common countries of birth for people born outside the UK (Table 1). Together,
these countries were the place of origin of half (51%, 689/1,347) of people born outside
the UK and 42% of all people with TB in London (689/1,653). The most common
countries of birth in the non-UK born general population of London in 2018 were India,
Bangladesh, Poland, Romania, and Italy.
India was the most common foreign country of birth in all Health Protection Team
areas, but there were more UK born people with TB in South London and North East
North Central London. The UK born proportion was highest in Bromley (59%, 10/17),
Camden (46%, 11/24), Bexley (43%, 10/23), and Havering (41%, 9/22).
Table 1: 10 most common countries of birth outside the UK for people with TB and time between entry to the UK and TB notification, London, 2018
Country of birth n
% of non-UK born patients
median years since entry (IQR)
India 334 24.8 9 (3 to 18)
Pakistan 120 8.9 12 (6 to 22)
Somalia 83 6.2 14 (9 to 20)
Bangladesh 77 5.7 10 (4 to 26)
Romania 75 5.6 3 (1 to 5)
Nigeria 51 3.8 13 (8 to 21)
Philippines 40 3.0 10.5 (3.5 to 17)
Sri Lanka 31 2.3 10 (4 to 17)
Eritrea 29 2.2 3 (0 to 14)
Kenya 29 2.2 38 (17.5 to 48.5)
0
200
400
600
800
1,000
2000 2002 2004 2006 2008 2010 2012 2014 2016 2018
Nu
mb
er
of
cases
<2 years 2-5 years 6-10 years 11+ years
Tuberculosis in London: annual review (2018 data)
14
The median time since entry was 10 years (IQR 4-19), similar to 2017 but longer than
any other year since 2000. Among common countries of birth, the median time since
entry was shortest for people from Romania (3 years, IQR 1 to 5). Romania also had
the highest proportion of recent entrants: 37% (24/65) had entered the UK less than a
year before diagnosis.
Ethnicity
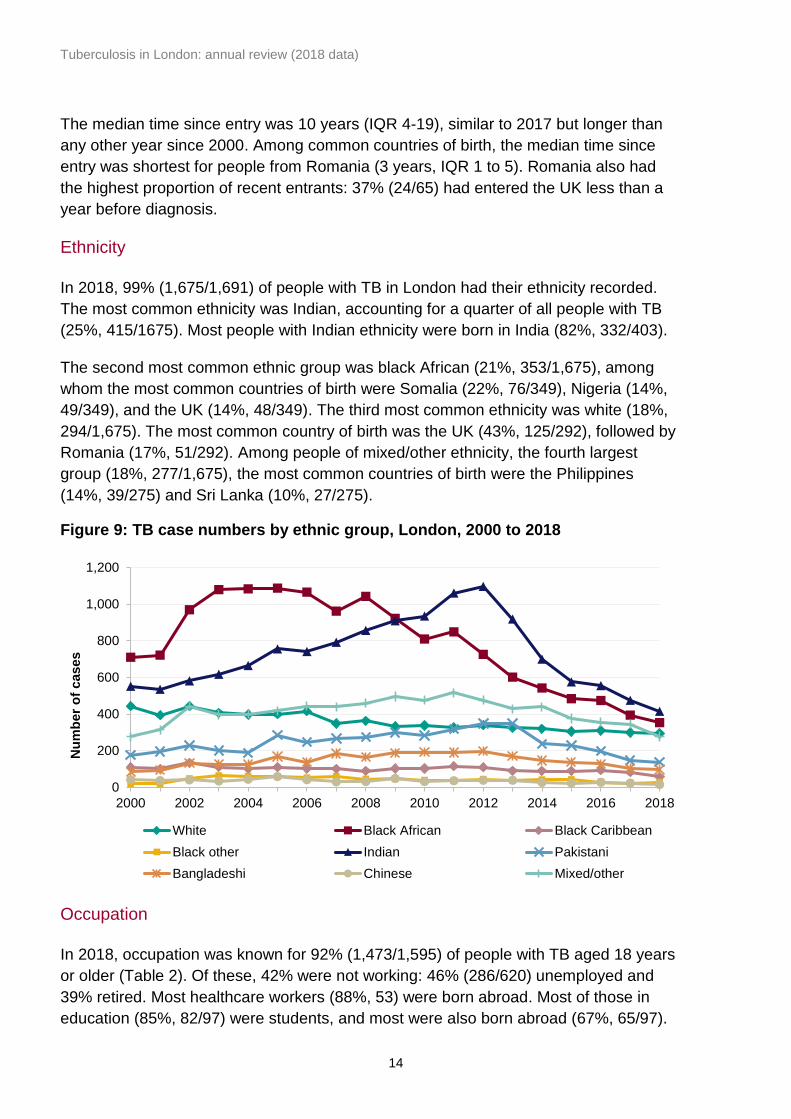
In 2018, 99% (1,675/1,691) of people with TB in London had their ethnicity recorded.
The most common ethnicity was Indian, accounting for a quarter of all people with TB
(25%, 415/1675). Most people with Indian ethnicity were born in India (82%, 332/403).
The second most common ethnic group was black African (21%, 353/1,675), among
whom the most common countries of birth were Somalia (22%, 76/349), Nigeria (14%,
49/349), and the UK (14%, 48/349). The third most common ethnicity was white (18%,
294/1,675). The most common country of birth was the UK (43%, 125/292), followed by
Romania (17%, 51/292). Among people of mixed/other ethnicity, the fourth largest
group (18%, 277/1,675), the most common countries of birth were the Philippines
(14%, 39/275) and Sri Lanka (10%, 27/275).
Figure 9: TB case numbers by ethnic group, London, 2000 to 2018
Occupation
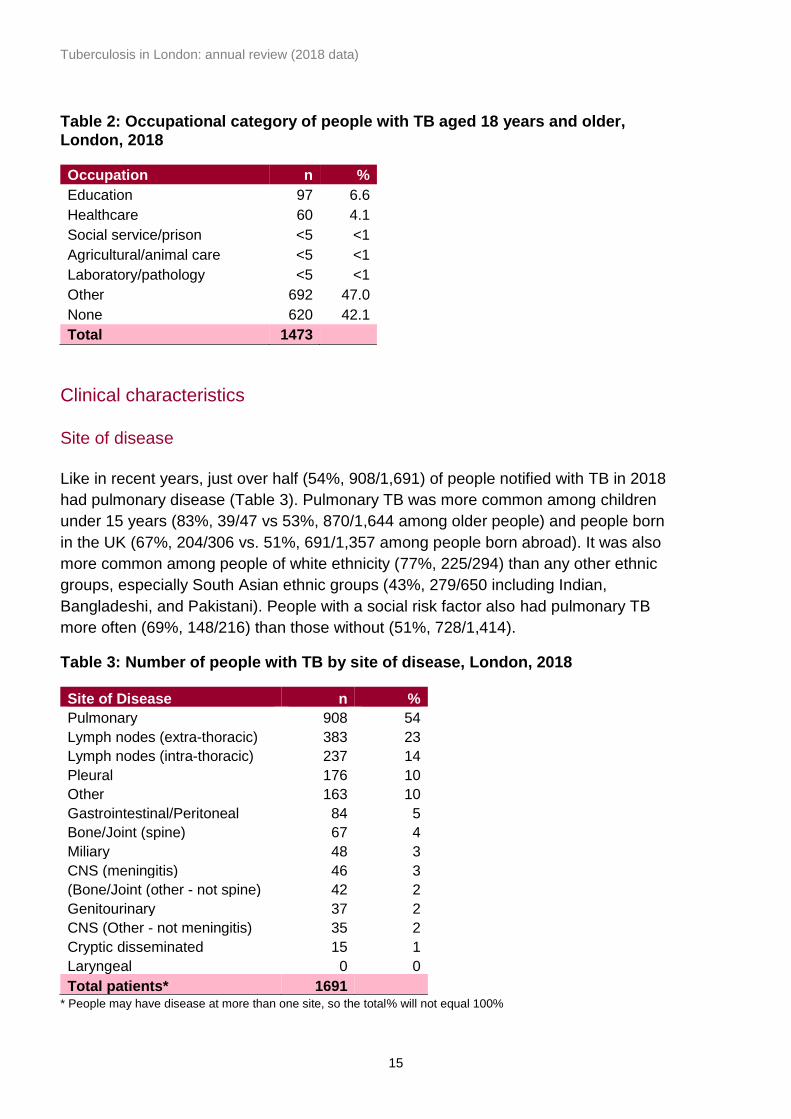
In 2018, occupation was known for 92% (1,473/1,595) of people with TB aged 18 years
or older (Table 2). Of these, 42% were not working: 46% (286/620) unemployed and
39% retired. Most healthcare workers (88%, 53) were born abroad. Most of those in
education (85%, 82/97) were students, and most were also born abroad (67%, 65/97).
0
200
400
600
800
1,000
1,200
2000 2002 2004 2006 2008 2010 2012 2014 2016 2018
Nu
mb
er
of
cases
White Black African Black Caribbean
Black other Indian Pakistani
Bangladeshi Chinese Mixed/other
Tuberculosis in London: annual review (2018 data)
15
Table 2: Occupational category of people with TB aged 18 years and older, London, 2018
Occupation n %
Education 97 6.6
Healthcare 60 4.1
Social service/prison <5 <1
Agricultural/animal care <5 <1
Laboratory/pathology <5 <1
Other 692 47.0
None 620 42.1
Total 1473
Clinical characteristics
Site of disease
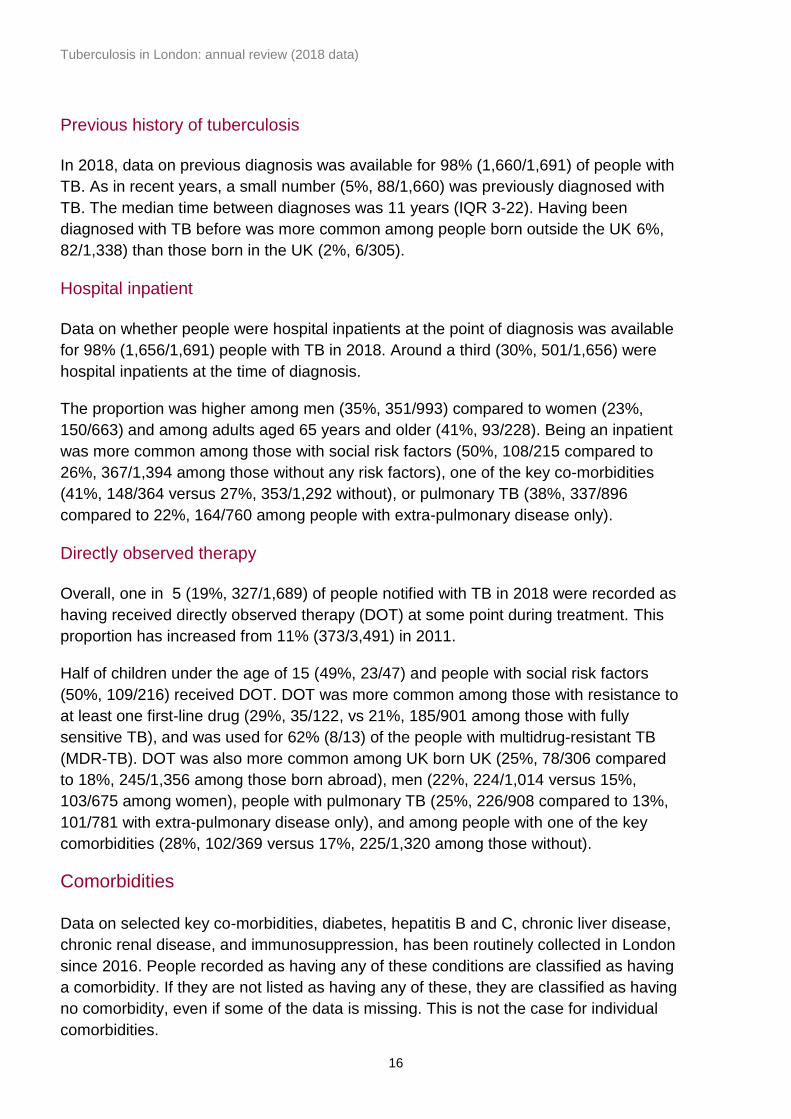
Like in recent years, just over half (54%, 908/1,691) of people notified with TB in 2018
had pulmonary disease (Table 3). Pulmonary TB was more common among children
under 15 years (83%, 39/47 vs 53%, 870/1,644 among older people) and people born
in the UK (67%, 204/306 vs. 51%, 691/1,357 among people born abroad). It was also
more common among people of white ethnicity (77%, 225/294) than any other ethnic
groups, especially South Asian ethnic groups (43%, 279/650 including Indian,
Bangladeshi, and Pakistani). People with a social risk factor also had pulmonary TB
more often (69%, 148/216) than those without (51%, 728/1,414).
Table 3: Number of people with TB by site of disease, London, 2018
Site of Disease n %
Pulmonary 908 54
Lymph nodes (extra-thoracic) 383 23
Lymph nodes (intra-thoracic) 237 14
Pleural 176 10
Other 163 10
Gastrointestinal/Peritoneal 84 5
Bone/Joint (spine) 67 4
Miliary 48 3
CNS (meningitis) 46 3
(Bone/Joint (other - not spine) 42 2
Genitourinary 37 2
CNS (Other - not meningitis) 35 2
Cryptic disseminated 15 1
Laryngeal 0 0
Total patients* 1691 * People may have disease at more than one site, so the total% will not equal 100%
Tuberculosis in London: annual review (2018 data)
16
Previous history of tuberculosis
In 2018, data on previous diagnosis was available for 98% (1,660/1,691) of people with
TB. As in recent years, a small number (5%, 88/1,660) was previously diagnosed with
TB. The median time between diagnoses was 11 years (IQR 3-22). Having been
diagnosed with TB before was more common among people born outside the UK 6%,
82/1,338) than those born in the UK (2%, 6/305).
Hospital inpatient
Data on whether people were hospital inpatients at the point of diagnosis was available
for 98% (1,656/1,691) people with TB in 2018. Around a third (30%, 501/1,656) were
hospital inpatients at the time of diagnosis.
The proportion was higher among men (35%, 351/993) compared to women (23%,
150/663) and among adults aged 65 years and older (41%, 93/228). Being an inpatient
was more common among those with social risk factors (50%, 108/215 compared to
26%, 367/1,394 among those without any risk factors), one of the key co-morbidities
(41%, 148/364 versus 27%, 353/1,292 without), or pulmonary TB (38%, 337/896
compared to 22%, 164/760 among people with extra-pulmonary disease only).
Directly observed therapy
Overall, one in 5 (19%, 327/1,689) of people notified with TB in 2018 were recorded as
having received directly observed therapy (DOT) at some point during treatment. This
proportion has increased from 11% (373/3,491) in 2011.
Half of children under the age of 15 (49%, 23/47) and people with social risk factors
(50%, 109/216) received DOT. DOT was more common among those with resistance to
at least one first-line drug (29%, 35/122, vs 21%, 185/901 among those with fully
sensitive TB), and was used for 62% (8/13) of the people with multidrug-resistant TB
(MDR-TB). DOT was also more common among UK born UK (25%, 78/306 compared
to 18%, 245/1,356 among those born abroad), men (22%, 224/1,014 versus 15%,
103/675 among women), people with pulmonary TB (25%, 226/908 compared to 13%,
101/781 with extra-pulmonary disease only), and among people with one of the key
comorbidities (28%, 102/369 versus 17%, 225/1,320 among those without).
Comorbidities
Data on selected key co-morbidities, diabetes, hepatitis B and C, chronic liver disease,
chronic renal disease, and immunosuppression, has been routinely collected in London
since 2016. People recorded as having any of these conditions are classified as having
a comorbidity. If they are not listed as having any of these, they are classified as having
no comorbidity, even if some of the data is missing. This is not the case for individual
comorbidities.
Tuberculosis in London: annual review (2018 data)
17
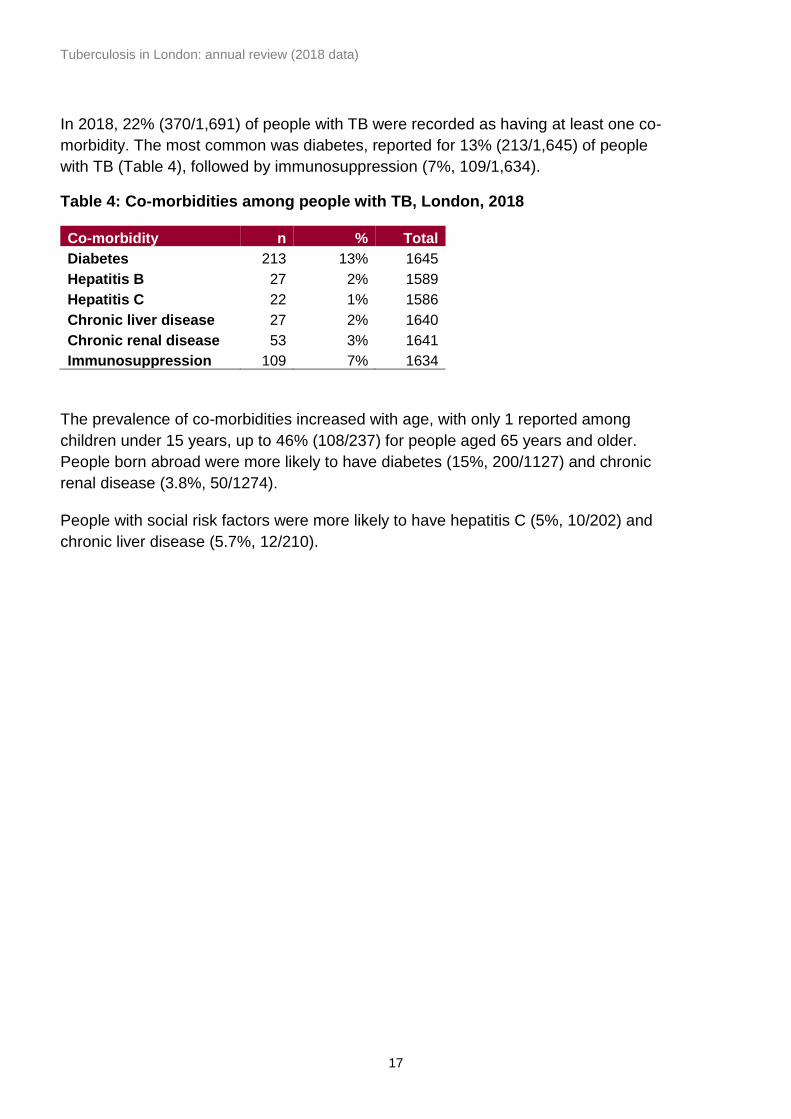
In 2018, 22% (370/1,691) of people with TB were recorded as having at least one co-
morbidity. The most common was diabetes, reported for 13% (213/1,645) of people
with TB (Table 4), followed by immunosuppression (7%, 109/1,634).
Table 4: Co-morbidities among people with TB, London, 2018
Co-morbidity n % Total
Diabetes 213 13% 1645
Hepatitis B 27 2% 1589
Hepatitis C 22 1% 1586
Chronic liver disease 27 2% 1640
Chronic renal disease 53 3% 1641
Immunosuppression 109 7% 1634
The prevalence of co-morbidities increased with age, with only 1 reported among
children under 15 years, up to 46% (108/237) for people aged 65 years and older.
People born abroad were more likely to have diabetes (15%, 200/1127) and chronic
renal disease (3.8%, 50/1274).
People with social risk factors were more likely to have hepatitis C (5%, 10/202) and
chronic liver disease (5.7%, 12/210).
Tuberculosis in London: annual review (2018 data)
18
2. Laboratory confirmation of TB
Laboratory tests data collection
Laboratory data on culture confirmed TB isolates from the National Mycobacterium
Reference Service were matched to TB case notifications and used to report culture
confirmation. Results for microscopy, PCR and histology are also collected in LTBR.
Culture confirmation and speciation
In 2018 in London, 61% of people with TB had their diagnosis confirmed by culture
1,036/1,691), the same proportion as seen nationally. This was higher among those
with pulmonary TB (75%, 685/909 vs. 45%, 351/782 of people with exclusively extra-
pulmonary TB).
Of those people with TB who had a positive culture diagnosis, the vast majority had
Mycobacterium tuberculosis (98%, 1,018/1,036), 14 had M. africanum, and 4 had M.
bovis.
Of the 655 who did not have their diagnosis confirmed by culture, 31 had positive
microscopy, 16 had positive a positive PCR result, and 7 had positive histology. In total,
30% (503/1,691) of the people who had TB in 2018 had no recorded laboratory
evidence of TB, similar to previous years. The proportion without a recorded laboratory
result was highest among those under 15 years old (66%, 31/47), those with extra-
pulmonary TB (42%, 332/782 vs 19%, 171/ 909 among those with pulmonary disease),
and those with no social risk factors (31%, 444/1,414 vs 19%, 42/ 216 among those
with social risk factors).
Sputum smear
In 2018, sputum-smear results were known for 77% (701/909) of people with
pulmonary TB, similar to recent years and the highest proportion recorded by any PHE
Centre. Results were more likely to be known among people with a social risk factor
(86%, 128/148) than those without (75%, 547/728), among people with first-line drug
resistance (91%, 71/78) than those with fully sensitive TB (81%, 482/597). It was least
likely to be known among children under 15 years (56%, 22/39).
Where known, 51% (360/701) of people with pulmonary TB had sputum smear positive
disease, similar to previous years.
Tuberculosis in London: annual review (2018 data)
19
3. TB transmission
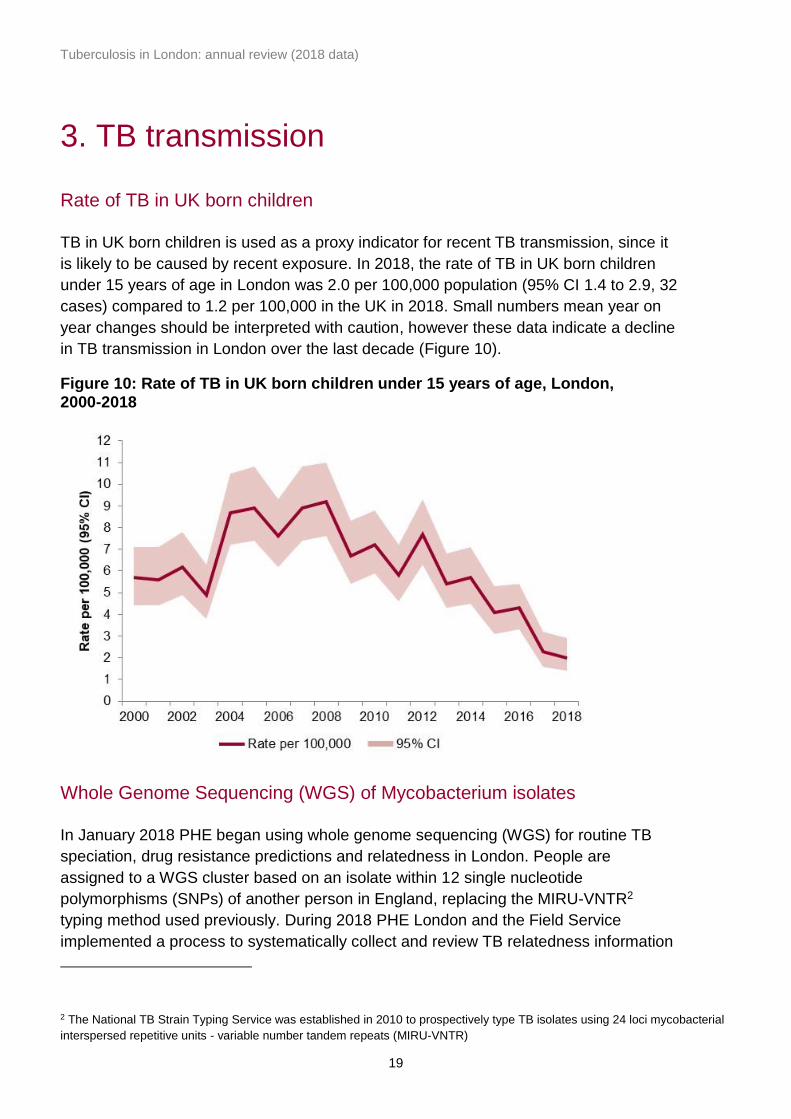
Rate of TB in UK born children
TB in UK born children is used as a proxy indicator for recent TB transmission, since it
is likely to be caused by recent exposure. In 2018, the rate of TB in UK born children
under 15 years of age in London was 2.0 per 100,000 population (95% CI 1.4 to 2.9, 32
cases) compared to 1.2 per 100,000 in the UK in 2018. Small numbers mean year on
year changes should be interpreted with caution, however these data indicate a decline
in TB transmission in London over the last decade (Figure 10).
Figure 10: Rate of TB in UK born children under 15 years of age, London, 2000-2018
Whole Genome Sequencing (WGS) of Mycobacterium isolates
In January 2018 PHE began using whole genome sequencing (WGS) for routine TB
speciation, drug resistance predictions and relatedness in London. People are
assigned to a WGS cluster based on an isolate within 12 single nucleotide
polymorphisms (SNPs) of another person in England, replacing the MIRU-VNTR2
typing method used previously. During 2018 PHE London and the Field Service
implemented a process to systematically collect and review TB relatedness information
2 The National TB Strain Typing Service was established in 2010 to prospectively type TB isolates using 24 loci mycobacterial
interspersed repetitive units - variable number tandem repeats (MIRU-VNTR)
Tuberculosis in London: annual review (2018 data)
20
to better understand TB transmission in London and identify where public health action
may be applied to interrupt this. In May 2018, the Field Service began notifying TB
services in London if someone they were treating was identified as being within 5 SNPs
of another person.
Characteristics of people with TB in clusters in 2018
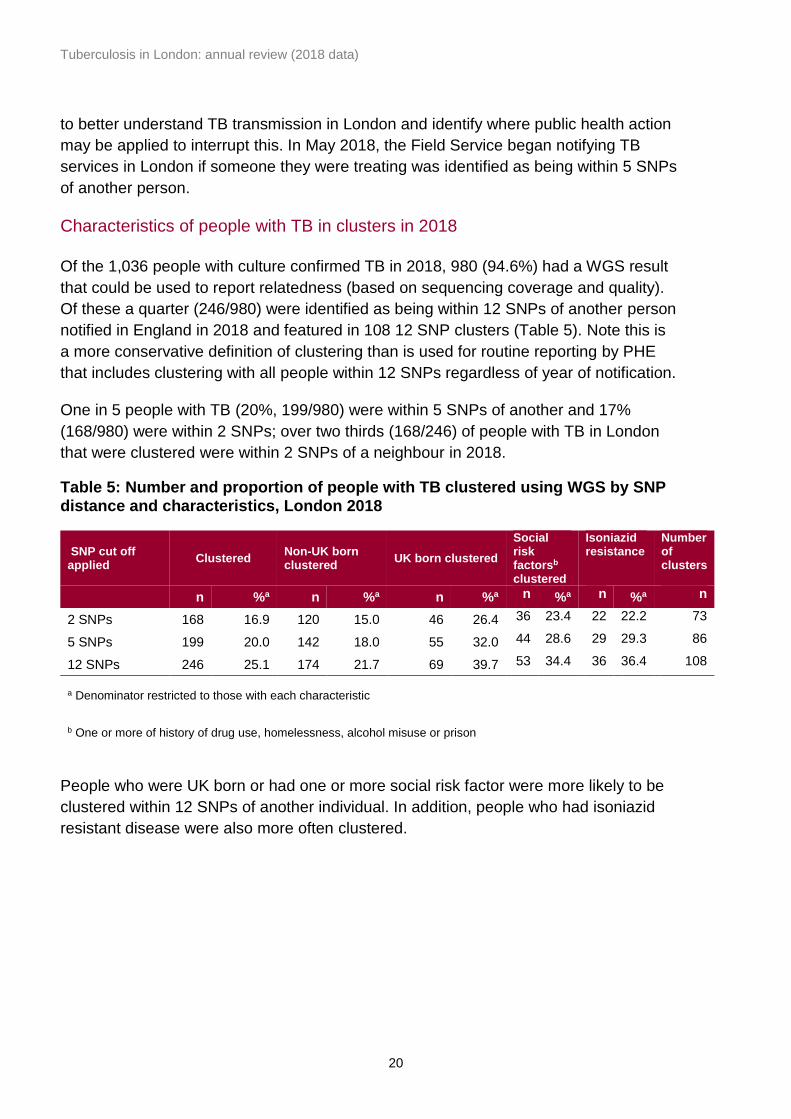
Of the 1,036 people with culture confirmed TB in 2018, 980 (94.6%) had a WGS result
that could be used to report relatedness (based on sequencing coverage and quality).
Of these a quarter (246/980) were identified as being within 12 SNPs of another person
notified in England in 2018 and featured in 108 12 SNP clusters (Table 5). Note this is
a more conservative definition of clustering than is used for routine reporting by PHE
that includes clustering with all people within 12 SNPs regardless of year of notification.
One in 5 people with TB (20%, 199/980) were within 5 SNPs of another and 17%
(168/980) were within 2 SNPs; over two thirds (168/246) of people with TB in London
that were clustered were within 2 SNPs of a neighbour in 2018.
Table 5: Number and proportion of people with TB clustered using WGS by SNP distance and characteristics, London 2018
SNP cut off applied
Clustered Non-UK born clustered
UK born clustered
Social risk factorsb clustered
Isoniazid resistance
Number of clusters
n %a n %a n %a n %a n %a n
2 SNPs 168 16.9 120 15.0 46 26.4 36 23.4 22 22.2 73
5 SNPs 199 20.0 142 18.0 55 32.0 44 28.6 29 29.3 86
12 SNPs 246 25.1 174 21.7 69 39.7 53 34.4 36 36.4 108
a Denominator restricted to those with each characteristic
b One or more of history of drug use, homelessness, alcohol misuse or prison
People who were UK born or had one or more social risk factor were more likely to be
clustered within 12 SNPs of another individual. In addition, people who had isoniazid
resistant disease were also more often clustered.
Tuberculosis in London: annual review (2018 data)
21
4. Delay from onset of symptoms to start of
treatment
Time from symptom onset to treatment start for people with pulmonary TB
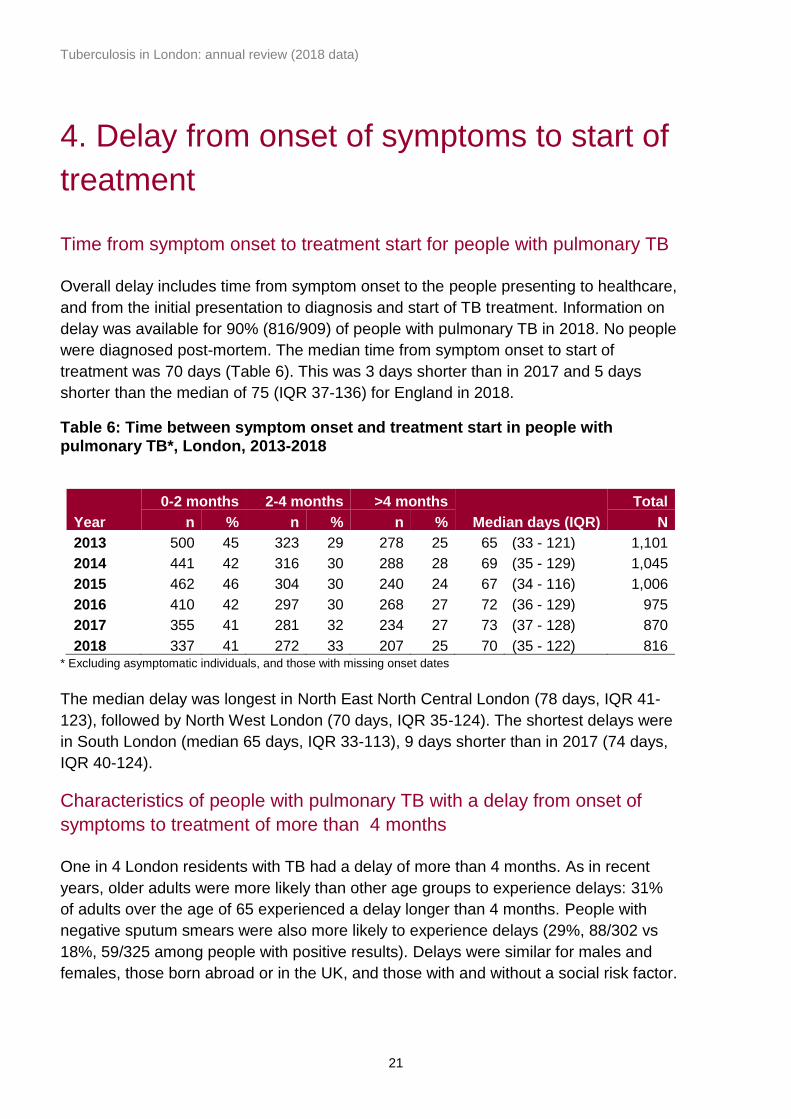
Overall delay includes time from symptom onset to the people presenting to healthcare,
and from the initial presentation to diagnosis and start of TB treatment. Information on
delay was available for 90% (816/909) of people with pulmonary TB in 2018. No people
were diagnosed post-mortem. The median time from symptom onset to start of
treatment was 70 days (Table 6). This was 3 days shorter than in 2017 and 5 days
shorter than the median of 75 (IQR 37-136) for England in 2018.
Table 6: Time between symptom onset and treatment start in people with pulmonary TB*, London, 2013-2018
Year
0-2 months 2-4 months >4 months
Median days (IQR)
Total
n % n % n % N
2013 500 45 323 29 278 25 65 (33 - 121) 1,101
2014 441 42 316 30 288 28 69 (35 - 129) 1,045
2015 462 46 304 30 240 24 67 (34 - 116) 1,006
2016 410 42 297 30 268 27 72 (36 - 129) 975
2017 355 41 281 32 234 27 73 (37 - 128) 870
2018 337 41 272 33 207 25 70 (35 - 122) 816 * Excluding asymptomatic individuals, and those with missing onset dates
The median delay was longest in North East North Central London (78 days, IQR 41-
123), followed by North West London (70 days, IQR 35-124). The shortest delays were
in South London (median 65 days, IQR 33-113), 9 days shorter than in 2017 (74 days,
IQR 40-124).
Characteristics of people with pulmonary TB with a delay from onset of
symptoms to treatment of more than 4 months
One in 4 London residents with TB had a delay of more than 4 months. As in recent
years, older adults were more likely than other age groups to experience delays: 31%
of adults over the age of 65 experienced a delay longer than 4 months. People with
negative sputum smears were also more likely to experience delays (29%, 88/302 vs
18%, 59/325 among people with positive results). Delays were similar for males and
females, those born abroad or in the UK, and those with and without a social risk factor.

Tuberculosis in London: annual review (2018 data)
22
5. TB outcomes in drug-sensitive cohort
Drug-sensitive cohort
For the purposes of reporting outcomes for people with TB, the drug-sensitive cohort is
defined as all people notified with TB excluding those in the drug-resistant cohort (see
Chapter 6). Under this definition, people with TB resistant to isoniazid, ethambutol
and/or pyrazinamide but without resistance to rifampicin are included in the drug-
sensitive cohort. Outcomes are reported according to year of notification.
Treatment outcomes for the drug-sensitive cohort are reported separately for:
• people with TB with expected duration of treatment less than 12 months, outcomes
at 12 months are reported - this excludes individuals with central nervous system
(CNS) disease, who would be treated for 12 months. In addition, those with spinal,
cryptic disseminated or miliary disease are also excluded, as CNS involvement
cannot be reliably ruled out for the purposes of reporting
• people with CNS, spinal, cryptic disseminated or miliary disease, the last recorded
treatment outcome is reported
Detailed data on deaths and people lost to follow-up at last recorded outcome are
presented for the entire drug-sensitive cohort.
Outcomes for people with TB with expected treatment duration of less than
12 months
In 2017, 86%, (1,439/1,675) of those with rifampicin-sensitive TB (and without CNS,
spinal, miliary or cryptic disseminated disease) completed treatment at 12 months.
Figure 11: Proportion completing treatment at 12 months, London, 2005-2017*
* Excludes rifampicin-resistant TB, and patients with CNS, spinal, miliary or cryptic disseminated disease
0
20
40
60
80
100
2005 2006 2007 2008 2009 2010 2011 2012 2013 2014 2015 2016 2017
Perc
en
tag
e (
%)
Tuberculosis in London: annual review (2018 data)
23
This was similar to that nationally (85%, 3,796/4,482). Among the 1,473 people for
whom duration of treatment was known, the median treatment time was 185 days (IQR
181-239). The proportion completing treatment has remained stable for more than a
decade (Figure 11).
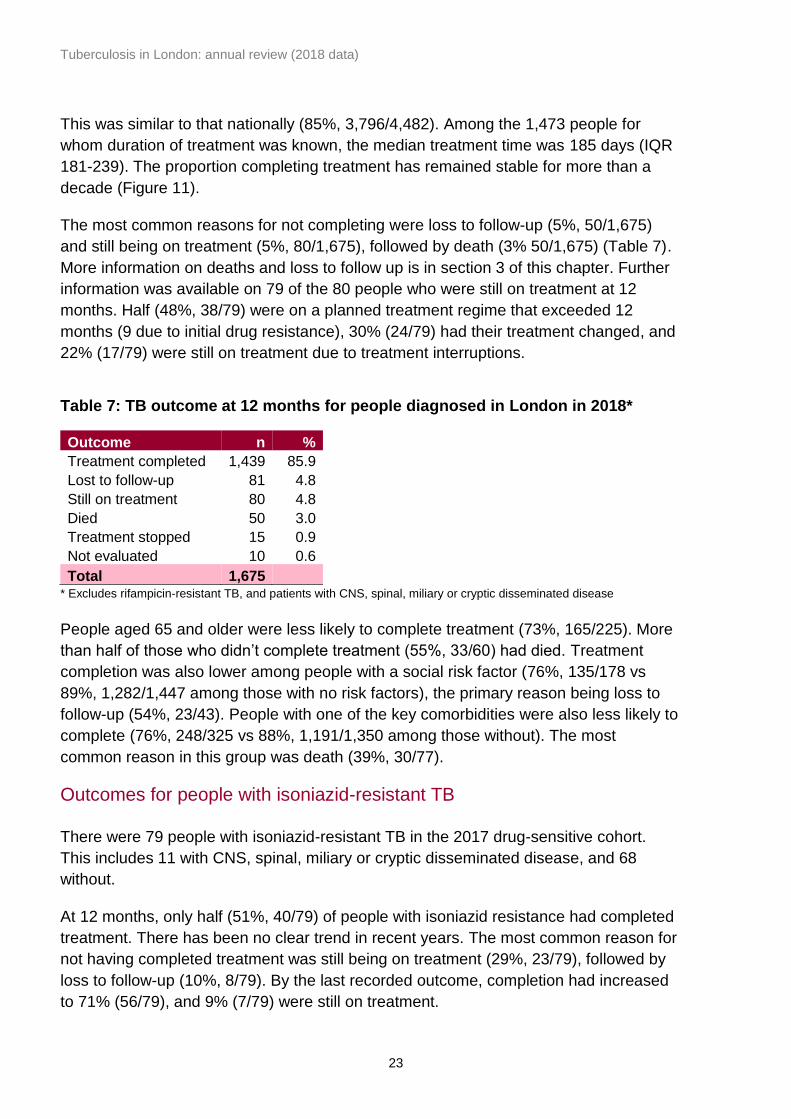
The most common reasons for not completing were loss to follow-up (5%, 50/1,675)
and still being on treatment (5%, 80/1,675), followed by death (3% 50/1,675) (Table 7).
More information on deaths and loss to follow up is in section 3 of this chapter. Further
information was available on 79 of the 80 people who were still on treatment at 12
months. Half (48%, 38/79) were on a planned treatment regime that exceeded 12
months (9 due to initial drug resistance), 30% (24/79) had their treatment changed, and
22% (17/79) were still on treatment due to treatment interruptions.
Table 7: TB outcome at 12 months for people diagnosed in London in 2018*
Outcome n %
Treatment completed 1,439 85.9
Lost to follow-up 81 4.8
Still on treatment 80 4.8
Died 50 3.0
Treatment stopped 15 0.9
Not evaluated 10 0.6
Total 1,675 * Excludes rifampicin-resistant TB, and patients with CNS, spinal, miliary or cryptic disseminated disease
People aged 65 and older were less likely to complete treatment (73%, 165/225). More
than half of those who didn’t complete treatment (55%, 33/60) had died. Treatment
completion was also lower among people with a social risk factor (76%, 135/178 vs
89%, 1,282/1,447 among those with no risk factors), the primary reason being loss to
follow-up (54%, 23/43). People with one of the key comorbidities were also less likely to
complete (76%, 248/325 vs 88%, 1,191/1,350 among those without). The most
common reason in this group was death (39%, 30/77).
Outcomes for people with isoniazid-resistant TB
There were 79 people with isoniazid-resistant TB in the 2017 drug-sensitive cohort.
This includes 11 with CNS, spinal, miliary or cryptic disseminated disease, and 68
without.
At 12 months, only half (51%, 40/79) of people with isoniazid resistance had completed
treatment. There has been no clear trend in recent years. The most common reason for
not having completed treatment was still being on treatment (29%, 23/79), followed by
loss to follow-up (10%, 8/79). By the last recorded outcome, completion had increased
to 71% (56/79), and 9% (7/79) were still on treatment.
Tuberculosis in London: annual review (2018 data)
24
Outcomes for drug-sensitive cohort of people with CNS, spinal, miliary or
cryptic disseminated TB
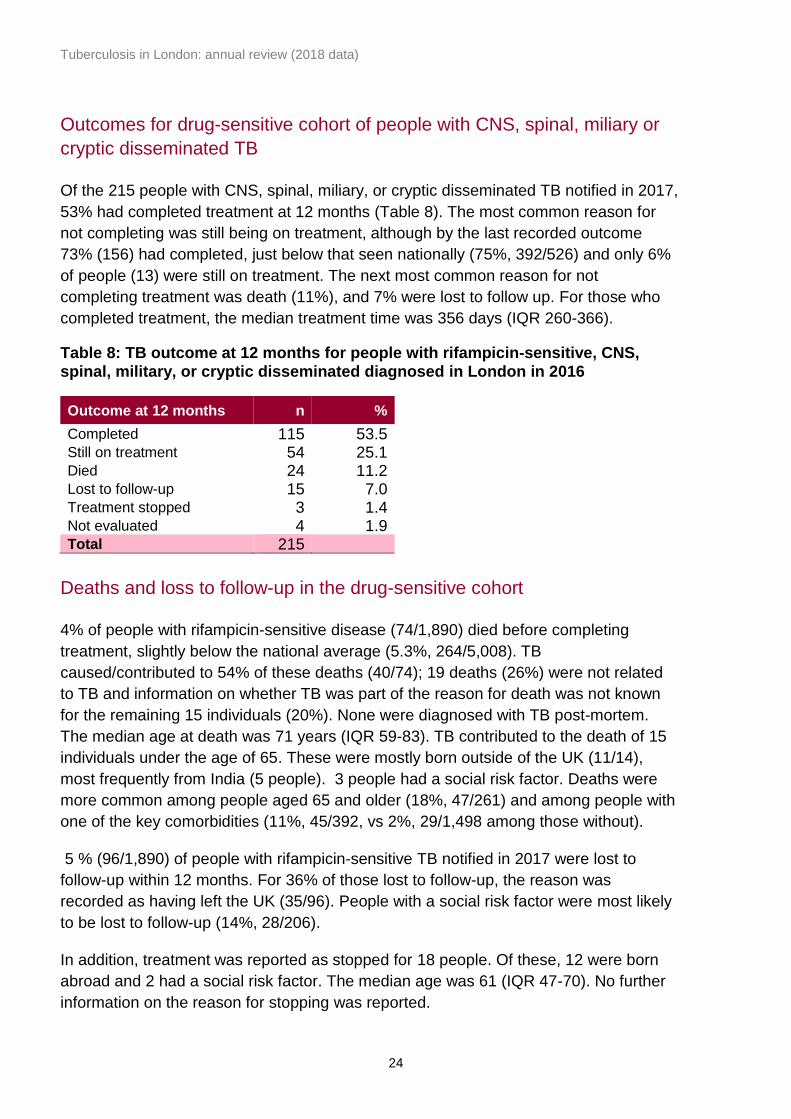
Of the 215 people with CNS, spinal, miliary, or cryptic disseminated TB notified in 2017,
53% had completed treatment at 12 months (Table 8). The most common reason for
not completing was still being on treatment, although by the last recorded outcome
73% (156) had completed, just below that seen nationally (75%, 392/526) and only 6%
of people (13) were still on treatment. The next most common reason for not
completing treatment was death (11%), and 7% were lost to follow up. For those who
completed treatment, the median treatment time was 356 days (IQR 260-366).
Table 8: TB outcome at 12 months for people with rifampicin-sensitive, CNS, spinal, military, or cryptic disseminated diagnosed in London in 2016
Outcome at 12 months n %
Completed 115 53.5
Still on treatment 54 25.1
Died 24 11.2
Lost to follow-up 15 7.0
Treatment stopped 3 1.4
Not evaluated 4 1.9 Total 215
Deaths and loss to follow-up in the drug-sensitive cohort
4% of people with rifampicin-sensitive disease (74/1,890) died before completing
treatment, slightly below the national average (5.3%, 264/5,008). TB
caused/contributed to 54% of these deaths (40/74); 19 deaths (26%) were not related
to TB and information on whether TB was part of the reason for death was not known
for the remaining 15 individuals (20%). None were diagnosed with TB post-mortem.
The median age at death was 71 years (IQR 59-83). TB contributed to the death of 15
individuals under the age of 65. These were mostly born outside of the UK (11/14),
most frequently from India (5 people). 3 people had a social risk factor. Deaths were
more common among people aged 65 and older (18%, 47/261) and among people with
one of the key comorbidities (11%, 45/392, vs 2%, 29/1,498 among those without).
5 % (96/1,890) of people with rifampicin-sensitive TB notified in 2017 were lost to
follow-up within 12 months. For 36% of those lost to follow-up, the reason was
recorded as having left the UK (35/96). People with a social risk factor were most likely
to be lost to follow-up (14%, 28/206).
In addition, treatment was reported as stopped for 18 people. Of these, 12 were born
abroad and 2 had a social risk factor. The median age was 61 (IQR 47-70). No further
information on the reason for stopping was reported.
Tuberculosis in London: annual review (2018 data)
25
6. Drug-resistant TB (including outcomes in
the drug-resistant cohort)
Drug resistance
Anti-TB antibiotic drugs are a large family and resistance may occur to 1 or more of
these antibiotics and may be in complex combinations. A distinction is made between
first, second and third-line TB antibiotic drugs depending upon their clinical
effectiveness. First-line drugs include isoniazid, rifampicin, pyrazinamide and
ethambutol. Second-line drugs are injectable agents (for example amikacin,
capreomycin, kanamycin), fluoroquinolones (such as moxifloxacin, ofloxacin,
ciprofloxacin) and other oral bacteriostatic agents. MDR-TB cases are initially resistant
to at least isoniazid and rifampicin. Extensively drug-resistant TB cases (XDR-TB) are
initially MDR and resistant to at least 1 injectable agent and at least 1 fluoroquinolone.
Overall initial drug resistance and geographical distribution
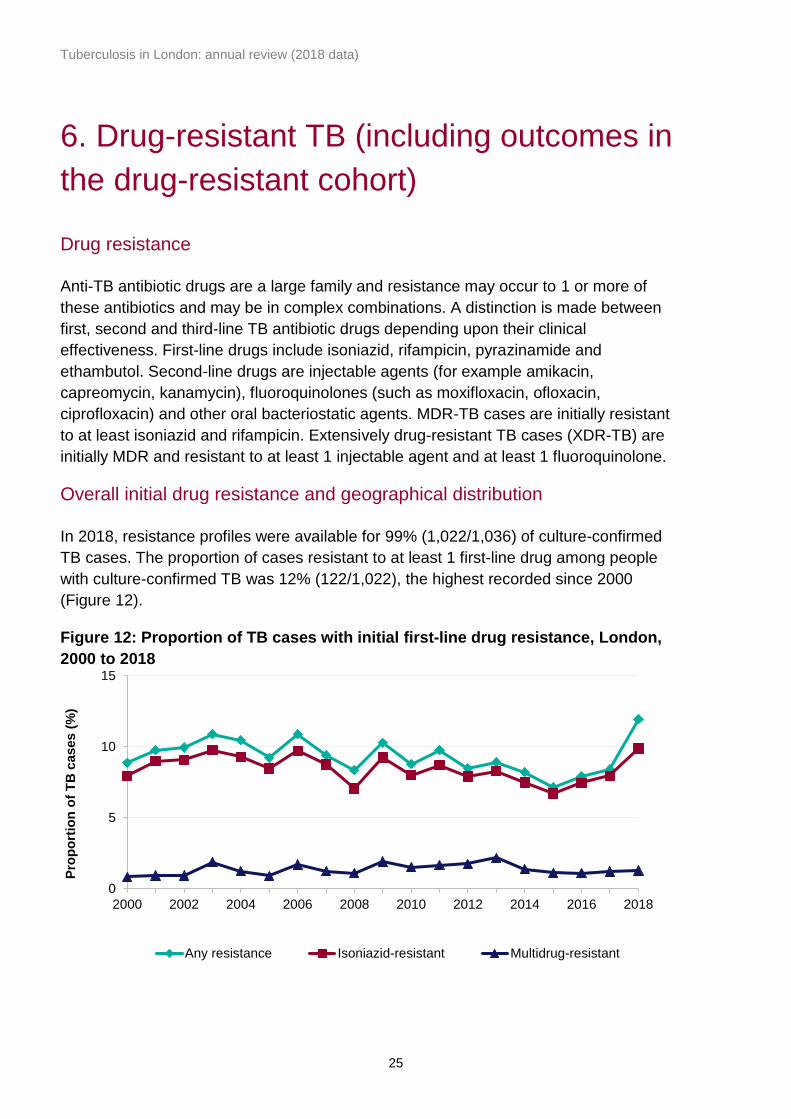
In 2018, resistance profiles were available for 99% (1,022/1,036) of culture-confirmed
TB cases. The proportion of cases resistant to at least 1 first-line drug among people
with culture-confirmed TB was 12% (122/1,022), the highest recorded since 2000
(Figure 12).
Figure 12: Proportion of TB cases with initial first-line drug resistance, London,
2000 to 2018
0
5
10
15
2000 2002 2004 2006 2008 2010 2012 2014 2016 2018
Pro
po
rtio
n o
f T
B c
ases (
%)
Any resistance Isoniazid-resistant Multidrug-resistant
Tuberculosis in London: annual review (2018 data)
26
Most people with resistance to a first-line drug had resistance to isoniazid (83%,
101/122). Of the 21 people who did not have resistance to isoniazid, 16 had resistance
to pyrazinamide, 3 to rifampicin, 2 to ethambutol.
There were no recorded cases of acquired drug resistance in 2018.
Characteristics of people with drug-resistant TB
Any first-line drug resistance
Drug resistance was more prevalent among people with a previous diagnosis of TB
(18%, 8/44 vs 12%, 112/956 among those without). Among common ethnicities, there
was the least resistance among people of Indian ethnicity (8%, 12/244), and most
among people of mixed/other (15%, 26/173) and black African (14% 31/214) ethnicity.
Drug resistance did not differ based on sex, social risk factors, comorbidities or site of
disease.
Multidrug-resistance (MDR) and extensively drug-resistant (XDR) TB
Small numbers mean the following information should be interpreted with caution. In
2018, there were 13 people with MDR-TB (resistance to isoniazid and rifampicin), 1%
of the 1,036 culture-confirmed cases of TB among London residents. 7 were also
resistant to ethambutol, 5 to pyrazinamide, 5 to streptomycin, and 1 each to
moxifloxacin, ofloxacin, and prothionamide. One person had XDR-TB, with resistance
to isoniazid, rifampicin, ethambutol, pyrazinamide, streptomycin, moxifloxacin, and
ofloxacin.
Ages ranged from 15 to 83 years, 7 were female, and 12 were born abroad, including 3
each in India, the Philippines, and Somalia. Their time since entry to the UK ranged
from 0 to 48 years. 3 were known to have been treated for TB previously. One was
reported as having a social risk factor (alcohol misuse).
TB outcome at 24 months for patients with rifampicin-resistant disease
Of the 16 people in the rifampicin-resistant TB cohort notified in 2016, 12 had
completed treatment at 24 months, while the others were either still on treatment or not
evaluated. At the last known outcome, 14 people had completed treatment, 1 was still
on treatment, and 1 had died.
Tuberculosis in London: annual review (2018 data)
27
7. TB in under-served populations
Social risk factors
In this chapter, social risk factors (defined as current or previous history of
homelessness, drug use or imprisonment, or current alcohol misuse) are described for
people with TB aged 15 years or over.
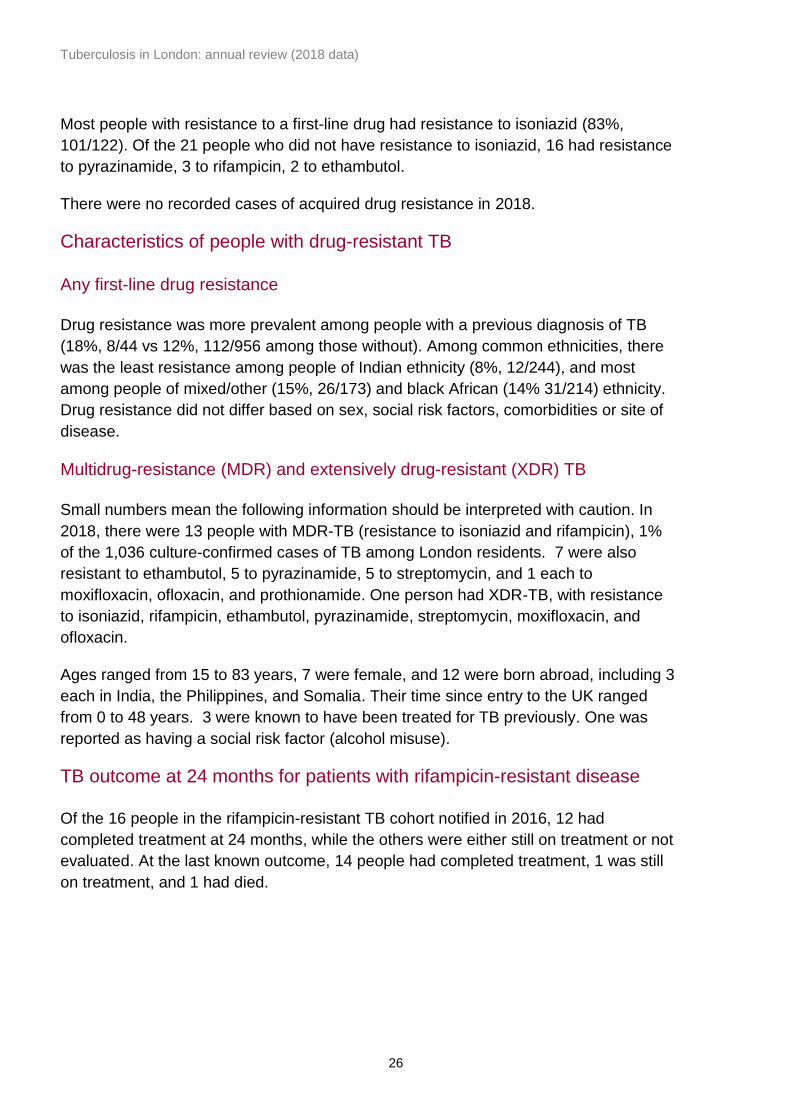
In 2018, 14% (214/1,583) of people with TB resident in London who were aged over 15
years old had at least one social risk factor. The prevalence of risk factors has
increased since 2011, especially in the past 2 years (10%, 209/2,060 in 2010).
The most common social risk factors in 2018 were alcohol misuse (6%, 90/1,595),
followed by homelessness (5%, 84/1,597), drug misuse (5%, 81/1,586), and history of
imprisonment (4%, 61/1,585). Of those with at least one social risk factor, 33% (70/214)
experienced multiple.
Figure 13: Social risk factors among people with TB, London, 2011-2018
Consistent with recent years, people born in the UK were more likely to have
experienced a social risk factor (20%, 53/269) than those born abroad (12%,
159/1,302). Among common countries of birth outside the UK, risk factors were most
prevalent among people born in Poland (50%, 13/26), Eritrea (46%, 13/28), Romania
(19%, 14/72), and Somalia (18%, 14/80).
Risk factors were more common among men (19%, 185/951) than women (5%,
29/632). Almost all of the increase since 2011 has been among men, while prevalence
0%
2%
4%
6%
8%
10%
12%
14%
16%
0
50
100
150
200
250
300
2011 2012 2013 2014 2015 2016 2017 2018
Pro
po
rtio
n (
%)
Peo
ple
wit
h T
B w
ith
a s
ocia
l ri
sk f
acto
r
Number Proportion

Tuberculosis in London: annual review (2018 data)
28
among women has remained stable. They were also more prevalent among people of
white ethnicity (25%, 68/275) than people of other ethnicities (11%, 145/1,303), and
among people with pulmonary TB (17%, 146/837) than those with exclusively extra-
pulmonary disease (9%, 68/746).
People with TB who experienced social risk factors were more likely to have infectious
disease (defined as having sputum-smear positive pulmonary TB): 41% (87/214),
compared to those with no social risk factors (19%, 254/1,369).
Deprivation
Deprivation was assessed using the 2015 Index of Multiple Deprivation. In 2018, more
than half of all people with TB were resident in the 2 most deprived quintiles of London
(55%, 944/1,691) (Figure 14). Rates were also highest in these 2 quintiles (28 and 29
per 100,000, respectively). The rate progressively decreased along with decreasing
deprivation, reaching 7.3 per 100,000 in the least deprived quintile.
Figure 14: TB case rate by deprivation, London, 2018
0
10
20
30
40
1(most deprived)
2 3 4 5(least deprived)
Rate
per
100,0
00 (
95%
CI)
Deprivation quintile
Tuberculosis in London: annual review (2018 data)
29
8. TB-HIV co-infection and HIV testing of
people with TB
HIV testing
Of the 1,691 people with TB notified in 2018, HIV status was already known for 63. Of
the remaining 1,628, information on HIV testing was available for 98% (1,609). Of
these, 97% (1,558) were offered and received testing; higher than the national figure of
95%. A further 2% (26) were offered but did not receive testing, and 1 person refused
testing. The proportion not offered testing was 2% (24). Children under 15 were less
likely to be offered HIV testing (83%, 38/46).
TB-HIV co-infection rates
The latest available information on TB-HIV co-infection for notified adults 15 years and
older, estimated that 2.9% (48) of people with TB in London in 2018 were co-infected
with HIV.3 This was similar to recent years, and remains considerably lower than the
highest estimate of 10% in 2003.
For England in 2017, only 2.7% of people with TB were co-infected with HIV, the lowest
since the peak of 8.4% in 2004, with an increase in the median age of people with co-
infection (from 34 in 2001 to 46 in 2018).
3 Tuberculosis in England: 2018 (presenting data to end of 2017), Public Health England, prepared by: Tuberculosis Unit,
National Infection Service
https://assets.publishing.service.gov.uk/government/uploads/system/uploads/attachment_data/file/742782/TB_Annual_Report
_2018.pdf

Tuberculosis in London: annual review (2018 data)
30
9. BCG
BCG vaccination status of people with TB
BCG immunisation is recommended for people at higher risk of exposure to TB,
particularly to protect against serious forms of disease in infants.
Information on BCG vaccination was available for 81% (1,376/1,691) of London
residents notified in 2018, of whom 65% (895) were vaccinated (Table 9), lower than
previous years (72% in 2017). Consistent with previous years, a higher proportion of
non-UK born cases had been vaccinated.
Table 9: BCG vaccination coverage among people with TB, London, 2018
< 5 years old < 15 years old All ages
n N % n N % n N %
UK born 8 18 44% 15 29 52% 155 246 63%
Non-UK born 2 2 100% 9 12 75% 735 1123 65%
All cases* 10 20 50% 25 42 60% 895 1376 65%
* Including missing place of birth
Of the 22 children aged less than 5 years old with TB, 20 were UK born and only 10
were vaccinated. Of the 10 UK born not vaccinated, 4 were white, 1 was black African,
1 black Caribbean, 1 Indian, 1 Pakistani, 1 black-other and 1 was of mixed/other
ethnicity. One had CNS disease (not meningitis) and none had miliary disease.
Tuberculosis in London: annual review (2018 data)
31
Discussion
TB rates in London continue to decline, having dropped by more than half the number
notified since the peak in 2011. Rates decreased both among people born abroad and
those born in the UK.
Most cases still occurred among people born in the Indian sub-continent, although most
of these had been in the UK for a very long time before diagnosis. People with TB from
East and Central Europe were more likely to have recently arrived in the UK.
People with TB frequently have complex medical and social needs. Almost 1 in 3 had
one of either the key social risk factors or co-morbidities (32%, 533). Diabetes was
particularly common, affecting 13% of all people with TB in London in 2018. People
with social risk factors continue to have worse outcomes, being less likely to complete
treatment.
London maintained excellent levels of HIV testing among people with TB, and shorter
delays from symptom onset to start of treatment than the national average.
Increasing isoniazid resistance is of concern, although multi-drug resistant disease
remains at low levels. This highlights the importance of obtaining culture confirmation:
rates were still low, only 61% of all people with TB (and 75% of those with pulmonary
disease) had a culture result.
Rates of clustering were higher among people who were UK born, had one or more
social risk factor and among those with isoniazid resistant disease, indicating recent
transmission is occurring among these groups in London.
A continued focus on early diagnosis and support through treatment, particularly for
people with social risk factors, must therefore remain a priority for successful TB control
in London.
Tuberculosis in London: annual review (2018 data)
32
Conclusion and recommendations
In conclusion, it is encouraging that TB rates in London continue to decline and are
now at to their lowest level since 2000. However, 1 in 3 people with TB in London have
either a social risk factor or key co-morbidity. This medical and social complexity
provides significant challenges to TB control and the achievement of TB elimination in
England by 2035.
Recommendations
Further reductions in TB in London will require:
• work to reduce diagnostic delay and ensure a prompt start of appropriate treatment,
as well as ongoing work to ensure completion of treatment
• robust contact tracing and further development of WGS cluster investigation to
interrupt transmission
• prioritisation of work to improve outcomes for underserved populations and people
with drug resistant TB
The Cohort Review process provides a critical forum for local oversight of these key
aspects of TB control
TB networks should ensure Cohort review and MDR cohort review continue to play a
vital role in quality assurance of TB case and contact management with identification
and escalation of issues to TB control board
The TB Control Board working with TB Networks will need to consider changing
epidemiology and case mix to ensure appropriate service provision.

Tuberculosis in London: annual review (2018 data)
33
Appendix A: Notes on the report
About the Field Service
The Field Service (FS) supports PHE Centres and partner organisations through the
application of epidemiological methods to inform public health action. It does this firstly
by providing a flexible expert resource, available, as and when needed, to undertake
epidemiological investigations for key health protection work and secondly through the
expert analysis, interpretation and dissemination of surveillance information to PHE
Centres, local health partners, service providers and commissioners of services. Within
the FS network, excellence and innovation is encouraged, we foster academic
collaborations and take active part and lead in research, development and training.
Intended audience
This report is for use by healthcare professionals who diagnose and/or care for people
with TB, commissioners involved in planning and financing TB services, public health
professionals working to improve TB control and the health of at-risk populations,
researchers with an interest in TB, and government and non-governmental
organisations working in the field of TB. In particular this report is for the use of the
South TB Control Board and local TB networks and health protection forums.
Aim of report
This report describes the recent epidemiology of TB in London. It includes local trends,
areas and population groups with a high burden of disease, and detail on the care of
people with TB.
Further TB information
The national report of TB in England
www.gov.uk/government/publications/tuberculosis-in-england-annual-report.
Official Statistic for TB www.gov.uk/government/collections/tuberculosis-and-other-
mycobacterial-diseases-diagnosis-screening-management-and-data.
TB Strategy Monitoring Indicators Collaborative TB Strategy for England 2015-2020
www.gov.uk/government/uploads/system/uploads/attachment_data/file/403231/Collabo
rative_TB_Strategy_for_England_2015_2020_.pdf).
TB indicators at Upper Tier Local Authority and Clinical Commissioning Group level
http://fingertips.phe.org.uk/profile/tb-monitoring
Tuberculosis in London: annual review (2018 data)
34
Appendix B: Description of data sources
and definitions
Data sources
This report is based on TB case notifications made to the PHE Enhanced TB
Surveillance system (ETS) and London TB Register in England to the end of 2018. This
information is updated annually to take into account denotifications (if the patient was
found not to have TB), late notifications and other updates. The data presented in this
report supersedes data in previous reports.
Diagnostic laboratories serving acute hospitals are the first place in which TB infection-
related samples are received and processed within the pathway of clinical diagnosis
and management of suspected TB. Results for microscopy, polymerase chain reaction
(PCR), histology and culture are collected in ETS. The National Mycobacterium
Reference Service (NMRS) receives these diagnostic materials and undertake
characterisation using culture and molecular diagnostic methods to define species of
Mycobacterium, TB antibiotic (drug) susceptibility and organism relatedness.
Definitions
BCG Bacillus Calmette-Guérin vaccination
CI Confidence interval
CCG Clinical Commissioning Group
Cluster 2 or more people notified within the time period of analysis
caused by indistinguishable strains, with at least 23 complete
MIRU-VNTR loci
CNS Central nervous system
Cohort review The systematic review of all people with TB notified by a TB
service in a 3-4 month period, looking at standard outcomes
in terms of care and contacts tracing
Cryptic
disseminated TB
Systemic illness without localising features
DOT Directly observed treatment
Tuberculosis in London: annual review (2018 data)
35
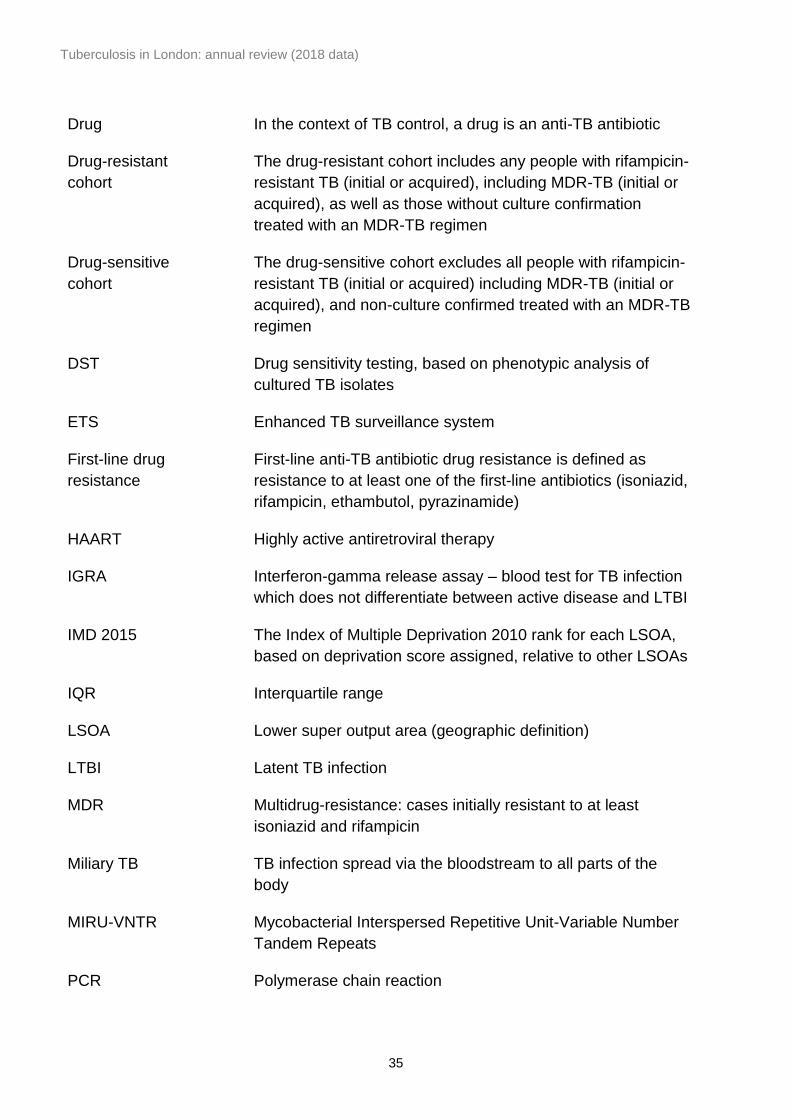
Drug In the context of TB control, a drug is an anti-TB antibiotic
Drug-resistant
cohort
The drug-resistant cohort includes any people with rifampicin-
resistant TB (initial or acquired), including MDR-TB (initial or
acquired), as well as those without culture confirmation
treated with an MDR-TB regimen
Drug-sensitive
cohort
The drug-sensitive cohort excludes all people with rifampicin-
resistant TB (initial or acquired) including MDR-TB (initial or
acquired), and non-culture confirmed treated with an MDR-TB
regimen
DST Drug sensitivity testing, based on phenotypic analysis of
cultured TB isolates
ETS Enhanced TB surveillance system
First-line drug
resistance
First-line anti-TB antibiotic drug resistance is defined as
resistance to at least one of the first-line antibiotics (isoniazid,
rifampicin, ethambutol, pyrazinamide)
HAART Highly active antiretroviral therapy
IGRA Interferon-gamma release assay – blood test for TB infection
which does not differentiate between active disease and LTBI
IMD 2015 The Index of Multiple Deprivation 2010 rank for each LSOA,
based on deprivation score assigned, relative to other LSOAs
IQR Interquartile range
LSOA Lower super output area (geographic definition)
LTBI Latent TB infection
MDR Multidrug-resistance: cases initially resistant to at least
isoniazid and rifampicin
Miliary TB TB infection spread via the bloodstream to all parts of the
body
MIRU-VNTR Mycobacterial Interspersed Repetitive Unit-Variable Number
Tandem Repeats
PCR Polymerase chain reaction
Tuberculosis in London: annual review (2018 data)
36
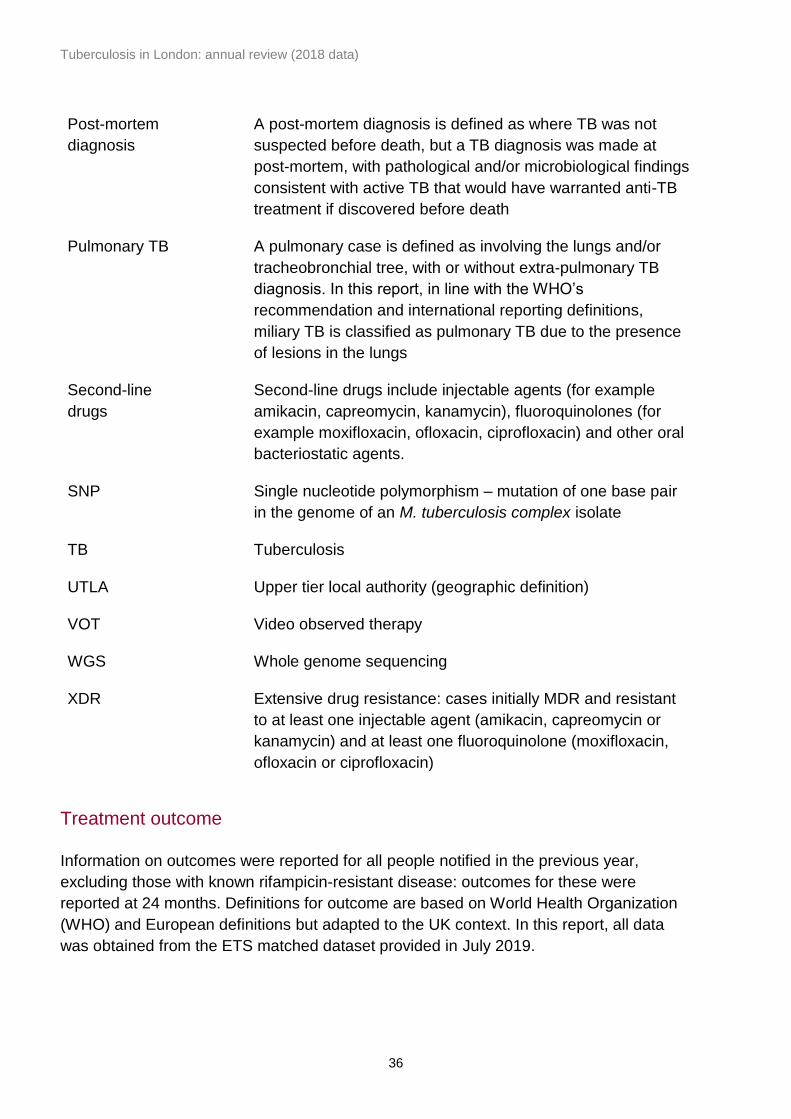
Post-mortem
diagnosis
A post-mortem diagnosis is defined as where TB was not
suspected before death, but a TB diagnosis was made at
post-mortem, with pathological and/or microbiological findings
consistent with active TB that would have warranted anti-TB
treatment if discovered before death
Pulmonary TB A pulmonary case is defined as involving the lungs and/or
tracheobronchial tree, with or without extra-pulmonary TB
diagnosis. In this report, in line with the WHO’s
recommendation and international reporting definitions,
miliary TB is classified as pulmonary TB due to the presence
of lesions in the lungs
Second-line
drugs
Second-line drugs include injectable agents (for example
amikacin, capreomycin, kanamycin), fluoroquinolones (for
example moxifloxacin, ofloxacin, ciprofloxacin) and other oral
bacteriostatic agents.
SNP Single nucleotide polymorphism – mutation of one base pair
in the genome of an M. tuberculosis complex isolate
TB Tuberculosis
UTLA Upper tier local authority (geographic definition)
VOT Video observed therapy
WGS Whole genome sequencing
XDR Extensive drug resistance: cases initially MDR and resistant
to at least one injectable agent (amikacin, capreomycin or
kanamycin) and at least one fluoroquinolone (moxifloxacin,
ofloxacin or ciprofloxacin)
Treatment outcome
Information on outcomes were reported for all people notified in the previous year,
excluding those with known rifampicin-resistant disease: outcomes for these were
reported at 24 months. Definitions for outcome are based on World Health Organization
(WHO) and European definitions but adapted to the UK context. In this report, all data
was obtained from the ETS matched dataset provided in July 2019.
Tuberculosis in London: annual review (2018 data)
37
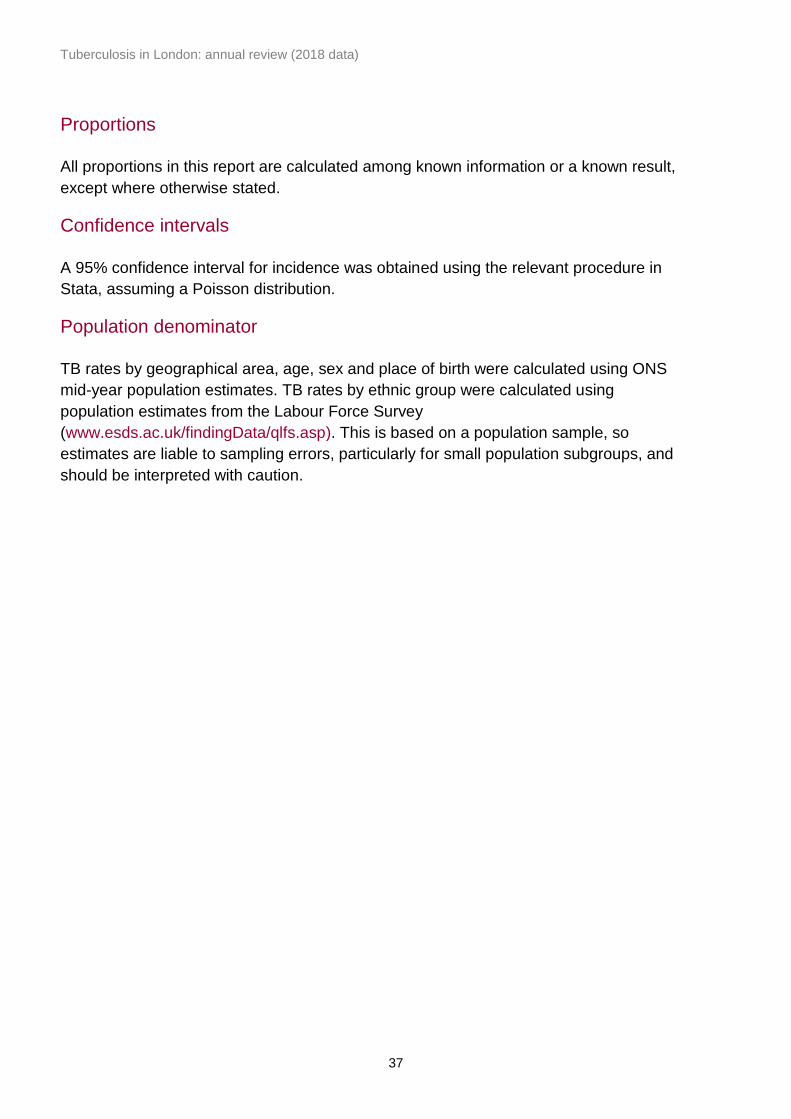
Proportions
All proportions in this report are calculated among known information or a known result,
except where otherwise stated.
Confidence intervals
A 95% confidence interval for incidence was obtained using the relevant procedure in
Stata, assuming a Poisson distribution.
Population denominator
TB rates by geographical area, age, sex and place of birth were calculated using ONS
mid-year population estimates. TB rates by ethnic group were calculated using
population estimates from the Labour Force Survey
(www.esds.ac.uk/findingData/qlfs.asp). This is based on a population sample, so
estimates are liable to sampling errors, particularly for small population subgroups, and
should be interpreted with caution.
Tuberculosis in London: annual review (2018 data)
38
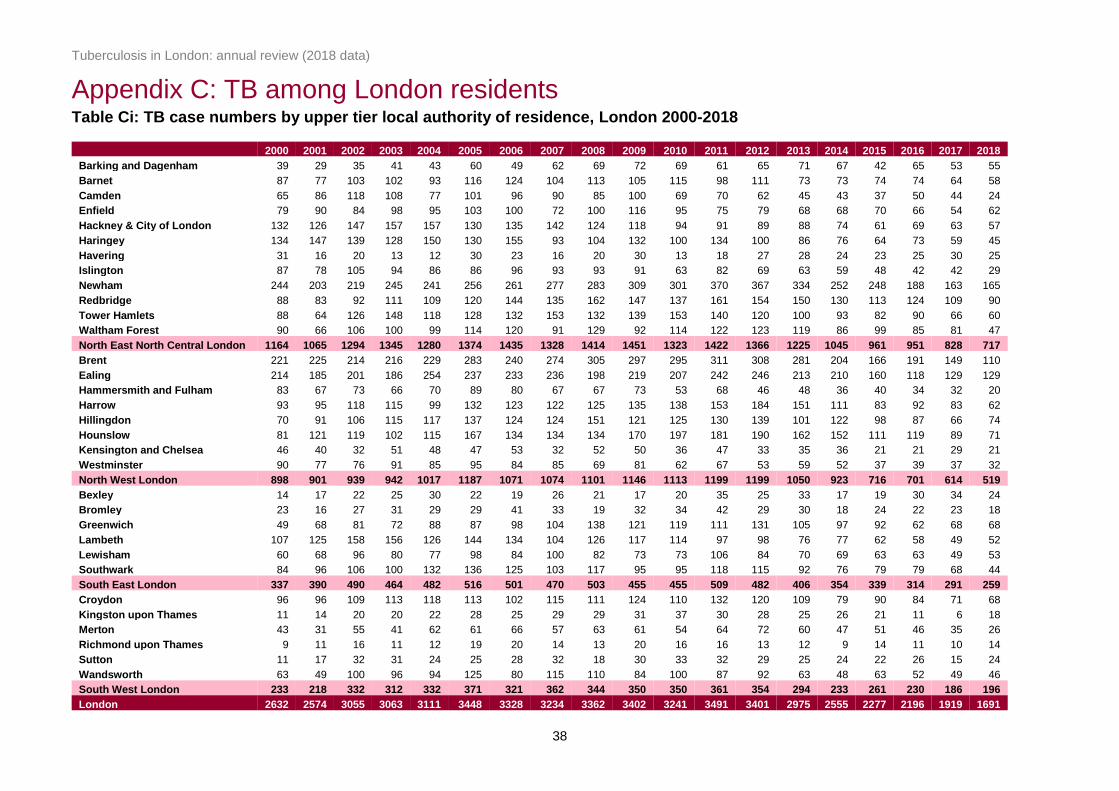
Appendix C: TB among London residents Table Ci: TB case numbers by upper tier local authority of residence, London 2000-2018
2000 2001 2002 2003 2004 2005 2006 2007 2008 2009 2010 2011 2012 2013 2014 2015 2016 2017 2018
Barking and Dagenham 39 29 35 41 43 60 49 62 69 72 69 61 65 71 67 42 65 53 55
Barnet 87 77 103 102 93 116 124 104 113 105 115 98 111 73 73 74 74 64 58
Camden 65 86 118 108 77 101 96 90 85 100 69 70 62 45 43 37 50 44 24
Enfield 79 90 84 98 95 103 100 72 100 116 95 75 79 68 68 70 66 54 62
Hackney & City of London 132 126 147 157 157 130 135 142 124 118 94 91 89 88 74 61 69 63 57
Haringey 134 147 139 128 150 130 155 93 104 132 100 134 100 86 76 64 73 59 45
Havering 31 16 20 13 12 30 23 16 20 30 13 18 27 28 24 23 25 30 25
Islington 87 78 105 94 86 86 96 93 93 91 63 82 69 63 59 48 42 42 29
Newham 244 203 219 245 241 256 261 277 283 309 301 370 367 334 252 248 188 163 165
Redbridge 88 83 92 111 109 120 144 135 162 147 137 161 154 150 130 113 124 109 90
Tower Hamlets 88 64 126 148 118 128 132 153 132 139 153 140 120 100 93 82 90 66 60
Waltham Forest 90 66 106 100 99 114 120 91 129 92 114 122 123 119 86 99 85 81 47
North East North Central London 1164 1065 1294 1345 1280 1374 1435 1328 1414 1451 1323 1422 1366 1225 1045 961 951 828 717
Brent 221 225 214 216 229 283 240 274 305 297 295 311 308 281 204 166 191 149 110
Ealing 214 185 201 186 254 237 233 236 198 219 207 242 246 213 210 160 118 129 129
Hammersmith and Fulham 83 67 73 66 70 89 80 67 67 73 53 68 46 48 36 40 34 32 20
Harrow 93 95 118 115 99 132 123 122 125 135 138 153 184 151 111 83 92 83 62
Hillingdon 70 91 106 115 117 137 124 124 151 121 125 130 139 101 122 98 87 66 74
Hounslow 81 121 119 102 115 167 134 134 134 170 197 181 190 162 152 111 119 89 71
Kensington and Chelsea 46 40 32 51 48 47 53 32 52 50 36 47 33 35 36 21 21 29 21
Westminster 90 77 76 91 85 95 84 85 69 81 62 67 53 59 52 37 39 37 32
North West London 898 901 939 942 1017 1187 1071 1074 1101 1146 1113 1199 1199 1050 923 716 701 614 519
Bexley 14 17 22 25 30 22 19 26 21 17 20 35 25 33 17 19 30 34 24
Bromley 23 16 27 31 29 29 41 33 19 32 34 42 29 30 18 24 22 23 18
Greenwich 49 68 81 72 88 87 98 104 138 121 119 111 131 105 97 92 62 68 68
Lambeth 107 125 158 156 126 144 134 104 126 117 114 97 98 76 77 62 58 49 52
Lewisham 60 68 96 80 77 98 84 100 82 73 73 106 84 70 69 63 63 49 53
Southwark 84 96 106 100 132 136 125 103 117 95 95 118 115 92 76 79 79 68 44
South East London 337 390 490 464 482 516 501 470 503 455 455 509 482 406 354 339 314 291 259
Croydon 96 96 109 113 118 113 102 115 111 124 110 132 120 109 79 90 84 71 68
Kingston upon Thames 11 14 20 20 22 28 25 29 29 31 37 30 28 25 26 21 11 6 18
Merton 43 31 55 41 62 61 66 57 63 61 54 64 72 60 47 51 46 35 26
Richmond upon Thames 9 11 16 11 12 19 20 14 13 20 16 16 13 12 9 14 11 10 14
Sutton 11 17 32 31 24 25 28 32 18 30 33 32 29 25 24 22 26 15 24
Wandsworth 63 49 100 96 94 125 80 115 110 84 100 87 92 63 48 63 52 49 46
South West London 233 218 332 312 332 371 321 362 344 350 350 361 354 294 233 261 230 186 196
London 2632 2574 3055 3063 3111 3448 3328 3234 3362 3402 3241 3491 3401 2975 2555 2277 2196 1919 1691

Tuberculosis in London: annual review (2018 data)
39
Table Cii: TB rate* per 100,000 by local authority of residence, London, 2000-2018
2000 2001 2002 2003 2004 2005 2006 2007 2008 2009 2010 2011 2012 2013 2014 2015 2016 2017 2018
Barking and Dagenham 23.8 17.5 21.0 24.7 26.0 36.1 29.3 36.7 40.0 40.5 37.7 32.6 34.1 36.5 33.7 20.7 31.2 25.2 25.9
Barnet 27.6 24.1 32.1 31.7 28.7 35.4 37.5 31.1 33.3 30.4 32.7 27.4 30.5 19.8 19.5 19.5 19.2 16.5 14.8
Camden 33.1 42.5 57.9 52.9 37.1 47.8 45.5 42.5 40.4 47.0 32.1 31.8 27.6 19.5 18.2 15.2 20.1 17.4 9.2
Enfield 28.7 32.5 29.9 34.8 33.7 36.2 34.8 24.7 33.6 38.4 30.9 23.9 24.9 21.2 21.0 21.3 19.9 16.2 18.6
Hackney & City of London 62.7 58.7 67.4 71.5 71.1 58.1 59.4 61.2 52.0 48.3 37.7 35.7 34.4 33.4 27.5 22.2 24.6 22.2 19.8
Haringey 61.0 66.4 61.9 56.9 66.2 56.7 66.5 39.3 42.5 52.8 39.6 52.4 38.8 32.9 28.7 23.9 26.8 21.8 16.6
Havering 13.8 7.1 8.9 5.8 5.3 13.2 10.1 7.0 8.6 12.8 5.5 7.6 11.3 11.6 9.8 9.2 9.9 11.7 9.7
Islington 48.9 43.5 58.3 52.0 47.6 46.9 51.8 49.3 48.4 46.3 31.5 39.8 32.7 29.2 26.6 21.1 18.1 17.9 12.1
Newham 99.4 81.4 85.8 95.6 94.7 100.9 101.2 104.0 102.4 107.9 100.6 119.2 116.0 103.9 76.8 73.8 54.6 46.8 46.9
Redbridge 36.7 34.3 37.7 44.9 43.8 47.7 56.3 51.9 61.0 54.4 49.8 57.2 54.1 51.9 44.2 37.9 41.2 36.1 29.6
Tower Hamlets 44.6 31.8 60.9 70.9 55.9 60.0 60.4 67.9 56.9 57.8 61.6 54.7 45.5 36.5 32.7 27.9 29.9 21.4 18.9
Waltham Forest 40.7 29.7 47.4 44.6 44.0 50.3 52.0 38.6 53.3 37.1 44.9 47.0 46.9 44.8 32.1 36.6 31.0 29.4 17.0
North East North Central London 43.3 39.2 47.0 48.7 46.2 49.1 50.6 46.1 48.1 48.2 43.1 45.3 42.8 37.8 31.6 28.7 27.9 23.3 20.4
Brent 83.4 83.5 79.3 80.5 85.3 104.5 86.8 96.7 104.8 99.6 96.8 99.6 97.9 88.6 63.7 51.3 58.5 45.3 33.3
Ealing 70.3 60.2 65.0 60.4 81.9 75.8 73.9 74.1 61.1 66.4 62.0 71.3 72.3 62.3 61.2 46.5 34.2 37.6 37.7
Hammersmith and Fulham 50.5 39.6 42.4 38.5 40.7 51.4 45.8 38.0 37.8 40.5 29.3 37.3 25.3 26.5 19.8 22.0 18.7 17.5 10.8
Harrow 44.5 45.2 55.6 53.8 45.8 59.7 55.0 53.9 54.5 57.8 58.1 63.6 76.0 62.1 45.3 33.6 37.0 33.3 24.8
Hillingdon 28.5 37.0 42.9 46.4 47.0 54.5 48.7 48.3 57.8 45.5 46.4 47.2 49.4 35.3 41.9 33.1 29.0 21.8 24.3
Hounslow 37.7 56.0 54.9 47.1 52.4 74.6 58.7 57.4 56.3 69.9 79.0 71.0 73.5 62.0 57.6 41.7 44.4 33.1 26.2
Kensington and Chelsea 29.7 24.7 19.5 30.9 29.0 27.9 32.1 19.6 32.0 30.9 22.4 29.7 21.0 22.3 22.8 13.2 13.4 18.6 13.4
Westminster 45.8 37.9 36.5 43.1 39.6 42.6 37.7 38.5 31.6 37.3 28.5 30.5 23.7 26.2 22.6 15.5 16.1 15.1 12.5
North West London 51.2 50.5 52.2 52.3 56.0 64.3 57.6 57.2 57.9 59.4 57.0 60.5 60.1 52.1 45.4 34.5 33.9 29.6 24.8
Bexley 6.4 7.8 10.0 11.4 13.6 9.9 8.5 11.6 9.3 7.5 8.7 15.0 10.7 13.9 7.1 7.8 12.2 13.8 9.7
Bromley 7.8 5.4 9.1 10.4 9.8 9.7 13.6 10.9 6.2 10.4 11.0 13.5 9.2 9.4 5.6 7.4 6.7 7.0 5.4
Greenwich 22.9 31.3 36.6 32.1 38.7 37.7 41.9 44.0 57.6 49.7 47.8 43.4 50.4 39.8 36.1 33.5 22.2 24.0 23.8
Lambeth 39.6 45.7 57.9 57.3 45.9 51.9 47.8 36.5 43.6 39.8 38.3 31.9 31.7 24.3 24.3 19.3 18.0 15.1 16.0
Lewisham 23.8 26.7 37.8 31.8 30.5 38.4 32.6 38.3 30.8 27.0 26.8 38.3 29.9 24.6 23.8 21.4 21.1 16.3 17.5
Southwark 33.2 37.4 41.4 39.2 51.3 51.9 46.7 37.8 42.2 33.8 33.5 40.9 39.2 30.8 25.1 25.6 25.3 21.6 13.9
South East London 22.4 25.7 32.2 30.5 31.5 33.4 32.0 29.7 31.4 28.0 27.7 30.5 28.6 23.6 20.3 18.8 12.7 16.2 14.3
Croydon 28.7 28.6 32.5 33.6 35.0 33.3 30.0 33.4 31.8 35.2 30.7 36.2 32.5 29.2 21.0 23.7 21.9 18.4 17.6
Kingston upon Thames 7.5 9.4 13.4 13.4 14.6 18.4 16.3 18.8 18.6 19.7 23.3 18.7 17.2 15.1 15.4 12.2 6.3 3.4 10.3
Merton 22.8 16.2 28.9 21.7 32.8 32.0 34.3 29.3 32.2 30.8 27.1 31.9 35.6 29.5 23.0 24.8 22.3 17.0 12.6
Richmond upon Thames 5.2 6.3 9.1 6.2 6.7 10.5 11.0 7.7 7.1 10.8 8.6 8.5 6.9 6.3 4.7 7.2 5.6 5.1 7.1
Sutton 6.1 9.4 17.7 17.1 13.3 13.7 15.3 17.4 9.7 15.9 17.4 16.7 15.0 12.8 12.1 11.0 12.9 7.4 11.7
Wandsworth 23.5 18.0 36.4 34.7 33.7 44.1 27.8 39.5 37.4 28.1 33.0 28.3 29.7 20.1 15.2 19.7 16.2 15.2 14.1
South West London 18.0 16.7 25.4 23.8 25.2 27.9 24.0 26.8 25.2 25.4 25.1 25.6 24.9 20.3 16.0 17.5 15.1 12.5 13.1
London 36.4 35.2 41.4 41.4 41.9 45.9 43.8 42.0 43.0 42.8 40.2 42.6 41.0 35.3 29.9 26.2 24.2 21.7 19.0
* Rates calculated using ONS mid-year population estimates
Title goes here as running header
40
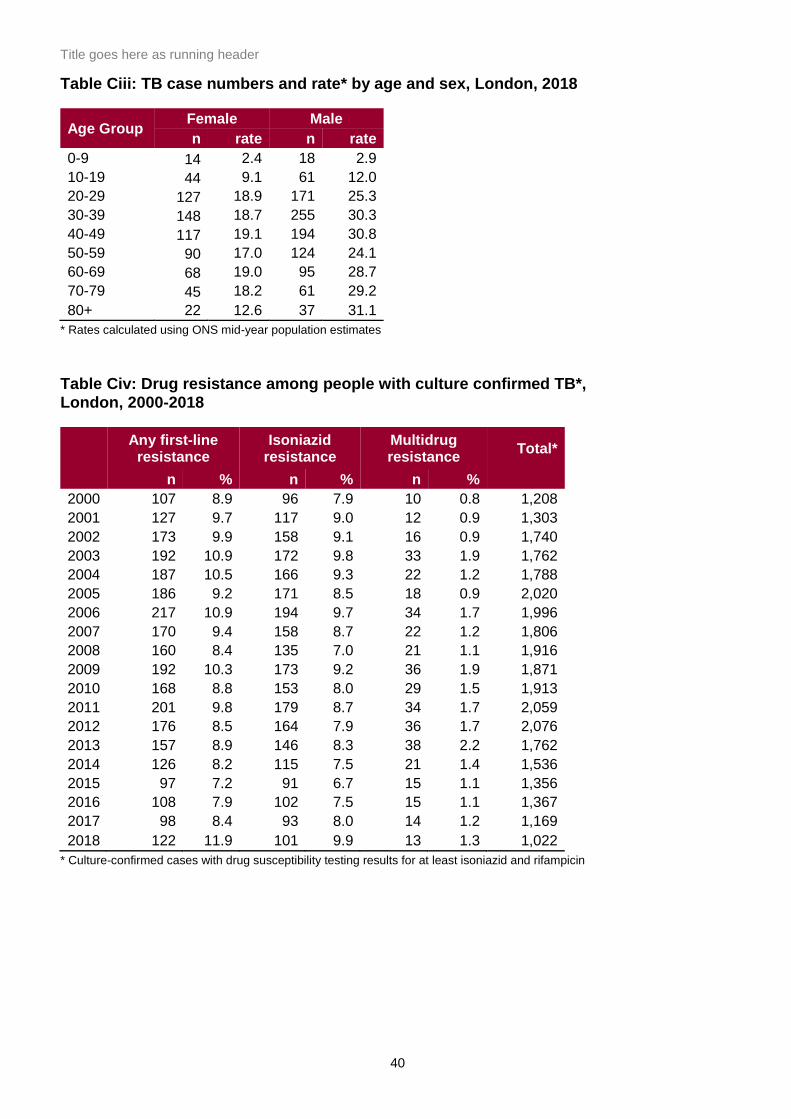
Table Ciii: TB case numbers and rate* by age and sex, London, 2018
Age Group Female Male
n rate n rate
0-9 14 2.4 18 2.9
10-19 44 9.1 61 12.0
20-29 127 18.9 171 25.3
30-39 148 18.7 255 30.3
40-49 117 19.1 194 30.8
50-59 90 17.0 124 24.1
60-69 68 19.0 95 28.7
70-79 45 18.2 61 29.2
80+ 22 12.6 37 31.1
* Rates calculated using ONS mid-year population estimates
Table Civ: Drug resistance among people with culture confirmed TB*, London, 2000-2018
Any first-line
resistance Isoniazid
resistance Multidrug resistance
Total*
n % n % n %
2000 107 8.9 96 7.9 10 0.8 1,208
2001 127 9.7 117 9.0 12 0.9 1,303
2002 173 9.9 158 9.1 16 0.9 1,740
2003 192 10.9 172 9.8 33 1.9 1,762
2004 187 10.5 166 9.3 22 1.2 1,788
2005 186 9.2 171 8.5 18 0.9 2,020
2006 217 10.9 194 9.7 34 1.7 1,996
2007 170 9.4 158 8.7 22 1.2 1,806
2008 160 8.4 135 7.0 21 1.1 1,916
2009 192 10.3 173 9.2 36 1.9 1,871
2010 168 8.8 153 8.0 29 1.5 1,913
2011 201 9.8 179 8.7 34 1.7 2,059
2012 176 8.5 164 7.9 36 1.7 2,076
2013 157 8.9 146 8.3 38 2.2 1,762
2014 126 8.2 115 7.5 21 1.4 1,536
2015 97 7.2 91 6.7 15 1.1 1,356
2016 108 7.9 102 7.5 15 1.1 1,367
2017 98 8.4 93 8.0 14 1.2 1,169
2018 122 11.9 101 9.9 13 1.3 1,022
* Culture-confirmed cases with drug susceptibility testing results for at least isoniazid and rifampicin