tuberculosis in the uk 2014 report · tuberculosis in the uk: 2014 report 4 foreword i am pleased...
TRANSCRIPT

Tuberculosis in the UK 2014 report

Tuberculosis in the UK: 2014 report
2
About Public Health England
Public Health England exists to protect and improve the nation's health and wellbeing,
and reduce health inequalities. It does this through advocacy, partnerships, world-
class science, knowledge and intelligence, and the delivery of specialist public health
services. PHE is an operationally autonomous executive agency of the Department of
Health.
Public Health England
Wellington House
133-155 Waterloo Road
London SE1 8UG
Tel: 020 7654 8000
http://www.gov.uk/phe
Twitter: @PHE_uk
Facebook: www.facebook.com/PublicHealthEngland
For queries relating to this document, please contact: [email protected]
© Crown copyright 2014
You may re-use this information (excluding logos) free of charge in any format or
medium, under the terms of the Open Government Licence v2.0. To view this licence,
visit OGL or email [email protected]. Where we have identified any
third party copyright information you will need to obtain permission from the copyright
holders concerned. Any enquiries regarding this publication should be sent to
You can download this publication from www.gov.uk/phe
Published September 2014
PHE publications gateway number: 2014353

Tuberculosis in the UK: 2014 report
3
Contents
About Public Health England 2
Foreword 4
Acknowledgements 5
1. Tuberculosis case reports, 2004-2013 7
2. Microscopy, culture confirmation, speciation and drug susceptibility, 2004-2013 25
3. Strain typing, 2010-2013 33
4. Tuberculosis case outcomes 42
5. Conclusions 50
References 52
Appendix I. Supplementary tables 53
Appendix II. Methods 86
Appendix III. Surveillance data quality 92
Glossary 97
This report is accompanied by a slide set, available at
https://www.gov.uk/government/publications/tuberculosis-tb-in-the-uk and the
official statistics “Reports of cases of tuberculosis to the national Enhanced
Tuberculosis Surveillance System, 2004-2013, Official statistics”, available at
www.gov.uk/government/collections/tuberculosis-and-other-mycobacterial-
diseases-diagnosis-screening-management-and-data
Further tables, such as those containing breakdown by local geography, are
also available at https://www.gov.uk/government/statistics/uk-tuberculosis-tb-
surveillance-data
Data for Scotland in this report may differ slightly to data presented by
Scotland in their own reports. In this UK report, cases that have transferred
from England to Scotland are not counted in the Scottish figures to avoid
duplication at the UK level.
The data presented in this report is correct as at May 2014.

Tuberculosis in the UK: 2014 report
4
Foreword
I am pleased to introduce the Tuberculosis in the UK 2014 report, based on
surveillance data provided by frontline TB staff from across the UK. This year’s report
presents detailed data for the 10 year period 2004-2013, providing a valuable picture
of the trends in TB epidemiology in the UK over the past decade.
While TB rates in the UK continue to be unacceptably high compared to other
comparable countries, it is encouraging that we have seen a small decrease in case
numbers and incidence in the past two years. However, it is too early to tell whether
this is the beginning of a downward trend, and certainly no time for complacency.
Tackling TB is one of the key priorities for Public Health England, and we have been
working closely with NHS England and a coalition of key stakeholders to develop a
collaborative TB strategy for England. With the public health, clinical and social care
arrangements in England since April 2013, and with the strengthened accountability
arrangements for TB control set out in the strategy, we have a real opportunity to bring
about a step change in TB control in England.
We are committed to working together with our key stakeholders to ensure that our
vision of a sustained year-on-year reduction in TB, a reduction in health inequalities,
and eventual elimination of the disease as a public health problem is achieved.
Dr Paul Cosford
Director for Health Protection and Medical Director
Public Health England
Tuberculosis in the UK: 2014 report
5
Acknowledgements
This report was prepared by the Tuberculosis Section, Centre for Infectious Disease
Surveillance and Control, PHE. The report was made possible through collaboration
with the Public Health Agency for Northern Ireland, Health Protection Scotland and
Public Health Wales, along with the PHE’s Microbiology Services, the Scottish
Mycobacteria Reference Laboratory, the Wales Centre for Mycobacteria and the
Northern Ireland Public Health Laboratory.
We gratefully acknowledge all those who contributed information on TB cases in the
UK, including physicians, nurses, microbiologists, scientists and administrative staff.
Special thanks are extended to those who co-ordinate and oversee TB surveillance at
regional/country level for their essential collaboration in the ongoing improvements to
TB surveillance.
Authors
This report was prepared by Dr Maeve K. Lalor, Debora Pedrazzoli, Jennifer A.
Davidson, Dr Laura F. Anderson, Kunju Shaji, Tehreem Mohiyuddin, Dr Morris
Muzyamba, Dr Dominik Zenner, Professor Ibrahim Abubakar and Dr H Lucy Thomas
Tuberculosis Section, Centre for Infectious Disease Surveillance and Control, PHE.
Additional contributors
Natasha Ratna, Surinder Tamne, Dr Anjana Roy, Dr Jo Southern, John Ratchford, Dr
Paul Cosford, Paul Clowry, Ruth Roach, Jacqueline Carless, Lamya Kanfoudi,
Charlotte Anderson, Suad Jama, Angela Cox, Stefanie Davies, Elizabeth Tempest,
Helen Bagnall, Jianxia Sun, Ivan Probert, Dr Helen Maguire (PHE, Health Protection
Directorate); Victoria Adebesi, Nikhil Sherine Thampi (Software Development Unit,
PHE Health Protection Directorate); Dr Philip Monk, Dr Mike Lilley, Dr Sarah
Anderson, Dr Peter Acheson, Dr Ken Lamden, Dr Marko Petrovic, Dr Muhammad
Abid, Dr Nic Coetzee, Dr Anand Fernandes, Dr Sarah Harrison, Dr David Hunt, Dr
Catherine Southwood, Dr Sophia Makki, Dr Evdokkia Dardamissis, Dr Giri Shankar, Dr
Ebere Okereke (PHE Operations Directorate); Cathriona Kearns (Public Health
Agency for Northern Ireland); Hannah Evans, Laia Fina, Daniel Thomas, Dr Lika
Nehaul (Public Health Wales); Alison Smith-Palmer, Fiona Johnston, Eisin McDonald
(Health Protection Scotland); Professor Francis Drobniewski, Dr Madeline Stone, Dr
Tim Brown, Phil More (PHE National Mycobacterium Reference Laboratory); Dr Grace

Tuberculosis in the UK: 2014 report
6
Smith, Jason Evans, Janet Mowbray (PHE Regional Centre for Mycobacteriology,
Birmingham); Professor John Magee, Anne Barrett, Debbie Osborne (PHE Regional
Centre for Mycobacteriology, Newcastle); Susan Benson (Royal Brompton Hospital
Microbiology Department, London); Dr Michael Ruddy, Lewis White, Michael Perry
(Public Health Wales, Wales Centre for Mycobacteria); Timothy Stanley (Northern
Ireland Public Health Laboratory); Dr Ian Laurenson, Louise Seagar (Scottish
Mycobacteria Reference Laboratory).
Suggested citation
Public Health England. (2014) Tuberculosis in the UK: 2014 report. Public Health
England: London.
Tuberculosis in the UK: 2014 report
7
1. Tuberculosis case reports, 2004-2013
Key messages
a total of 7,892 cases of TB were notified in the UK in 2013, an incidence of 12.3/100,000
overall numbers of TB cases in the UK have declined 11.6% in the past two years, due to a
small decline in numbers and rates in the non-UK born population
overall numbers and rates in the UK born population have not declined in the past decade,
although rates in the UK born population under 15 years have reduced in the past five
years
as in previous years, almost three quarters of TB cases (73%) occurred among people
born outside the UK; only 15% of these were recent migrants (diagnosed within two years
of entering the UK)
TB remains concentrated in the most deprived populations; in 2013, 70% of cases were
resident in the 40% most deprived areas, nearly half (44%) of cases were not in
employment and 10% had at least one social risk factor (history of alcohol or drug misuse,
homelessness or imprisonment)
more than a quarter (28%) of patients with pulmonary TB started treatment more than four
months after symptom onset, and the proportion of cases with a delay of more than four
months has increased slightly in the past 3 years
Overall numbers, rates and geographical distribution
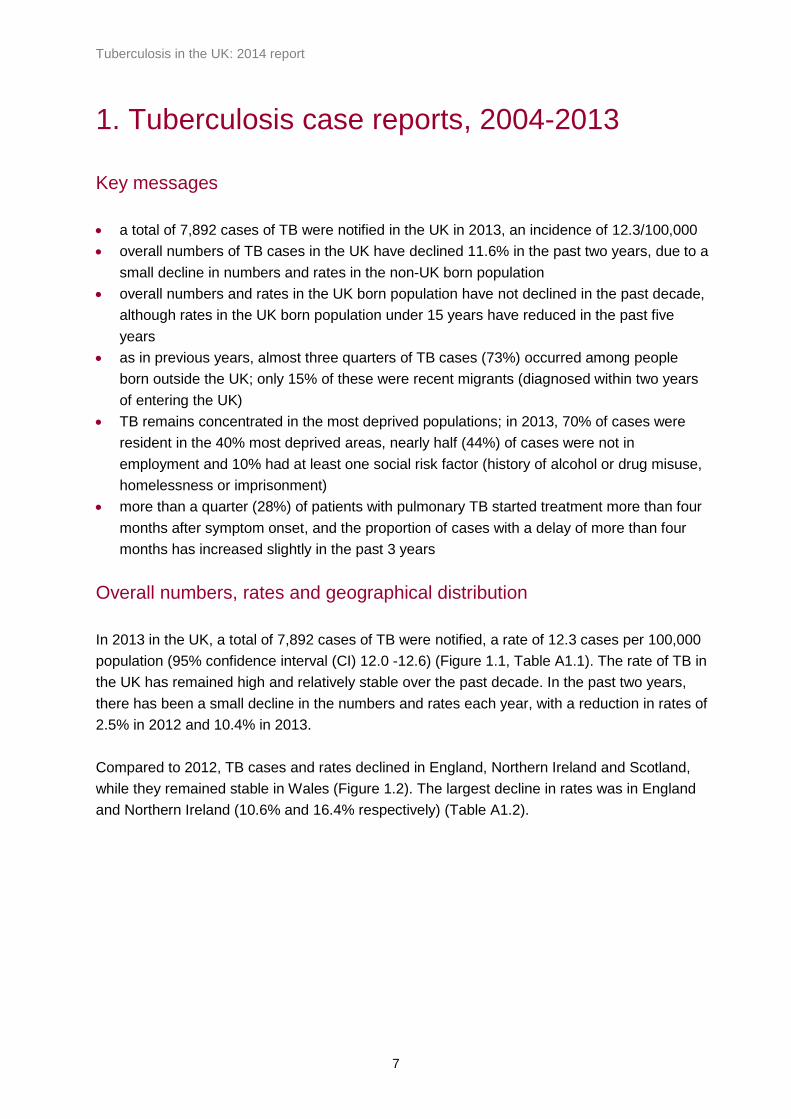
In 2013 in the UK, a total of 7,892 cases of TB were notified, a rate of 12.3 cases per 100,000
population (95% confidence interval (CI) 12.0 -12.6) (Figure 1.1, Table A1.1). The rate of TB in
the UK has remained high and relatively stable over the past decade. In the past two years,
there has been a small decline in the numbers and rates each year, with a reduction in rates of
2.5% in 2012 and 10.4% in 2013.
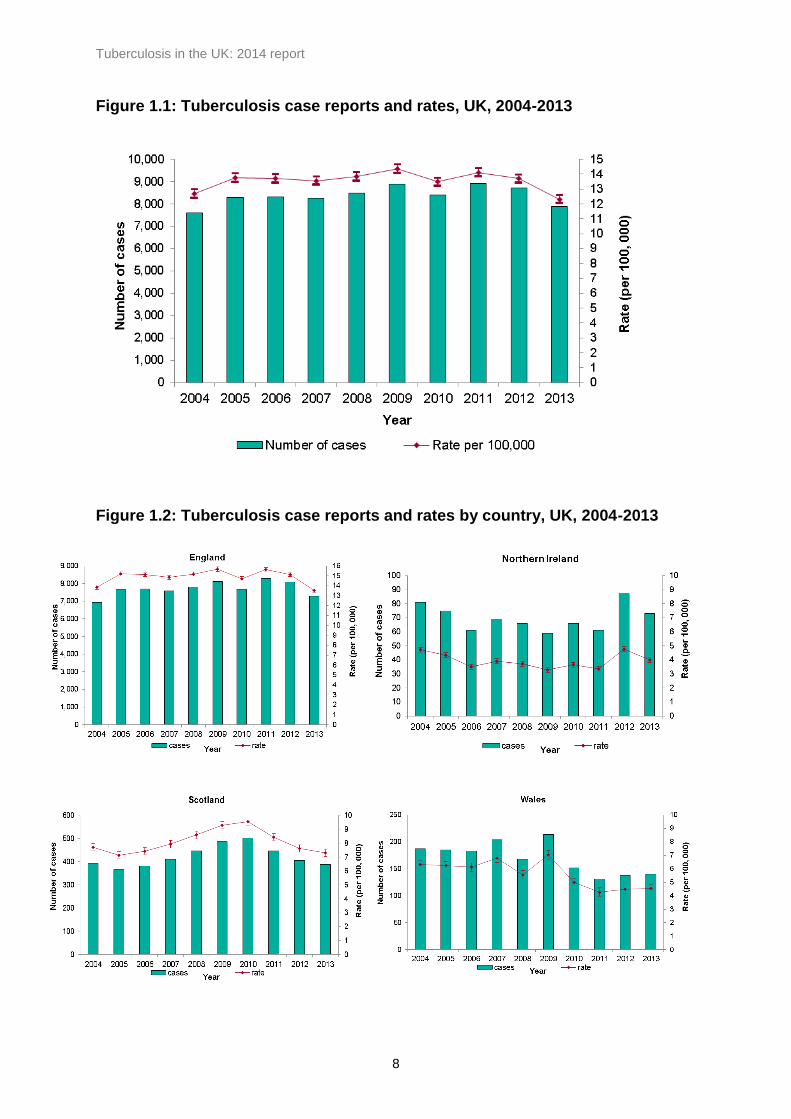
Compared to 2012, TB cases and rates declined in England, Northern Ireland and Scotland,
while they remained stable in Wales (Figure 1.2). The largest decline in rates was in England
and Northern Ireland (10.6% and 16.4% respectively) (Table A1.2).
Tuberculosis in the UK: 2014 report
8
Figure 1.1: Tuberculosis case reports and rates, UK, 2004-2013
Figure 1.2: Tuberculosis case reports and rates by country, UK, 2004-2013

Tuberculosis in the UK: 2014 report
9
As in previous years, London accounted for the highest proportion of cases in the UK (37.8%,
2,985/7,892), with a rate of 35.5 cases per 100,000 (95% CI 34.2-36.8), followed by the West
Midlands PHE Centre (PHEC) area (12.4%, 981; 17.3 per 100,000; CI 16.2-18.4). TB rates
have shown a small decline in most PHEC areas in the past year or two, with the exception of
Avon, Gloucestershire and Wiltshire and Cheshire and Merseyside PHE Centres (Figure 1.3,
Table A1.3). The main burden of disease remained concentrated in large urban areas (Figure
1.4).
Figure 1.3: TB rates by Public Health England centre, 2004-2013

Tuberculosis in the UK: 2014 report
10

Tuberculosis in the UK: 2014 report
11
Figure 1.4: Three-year average tuberculosis rates by local authority (England),
health board (Scotland and Wales) and country (Northern Ireland), UK, 2011-
2013. Box shows enlarged map of London area.
Contains Ordnance Survey data © Crown copyright and database right 2014
Tuberculosis in the UK: 2014 report
12
Demographic characteristics
Age and sex
In 2013, just over half of all cases were male (58%, 4,560/7,892). Nearly 60% of all cases
were aged 15 to 44 years old (4,654/7,892). Patients aged 45 to 64 years accounted for 23%,
and those 65 years and over for 14% of all cases. Three percent of patients were aged 5 to 14
years and 1.4% were aged less than five years. Similar to previous years, in 2013 TB rates
were highest in patients aged 25 to 34 years (24.4 per 100,000, CI 23.4-25.5) (Table A1.4)).
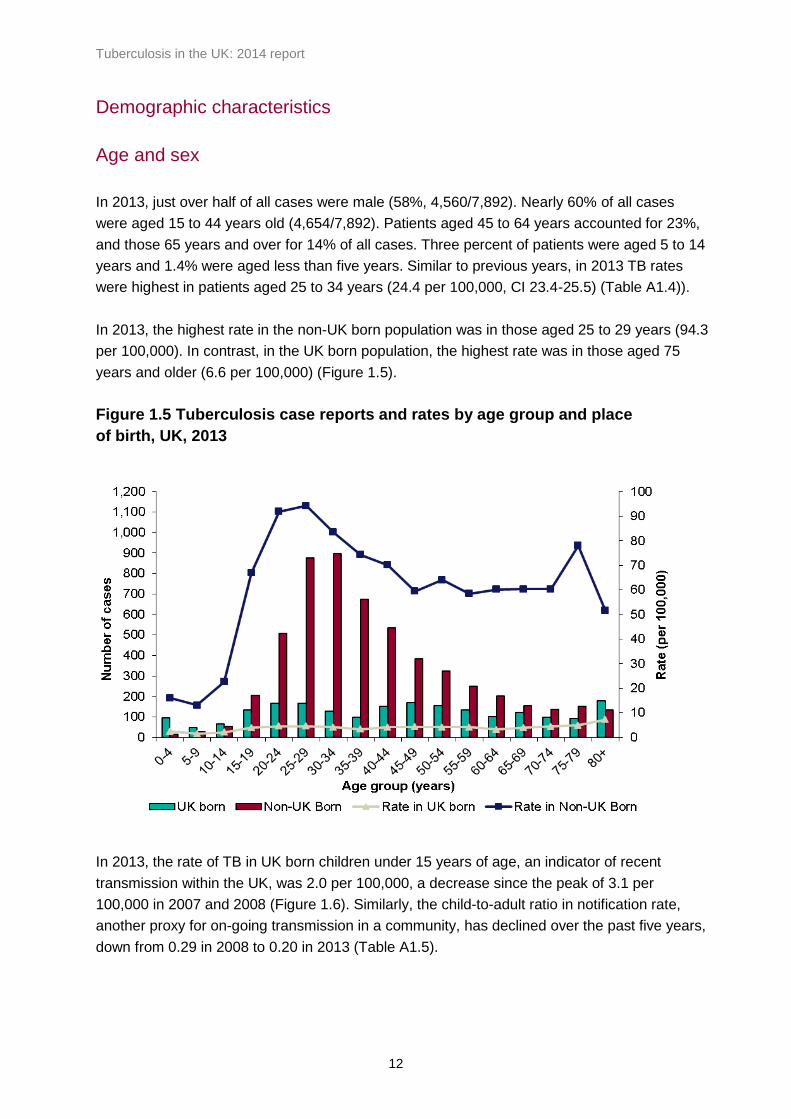
In 2013, the highest rate in the non-UK born population was in those aged 25 to 29 years (94.3
per 100,000). In contrast, in the UK born population, the highest rate was in those aged 75
years and older (6.6 per 100,000) (Figure 1.5).
Figure 1.5 Tuberculosis case reports and rates by age group and place
of birth, UK, 2013
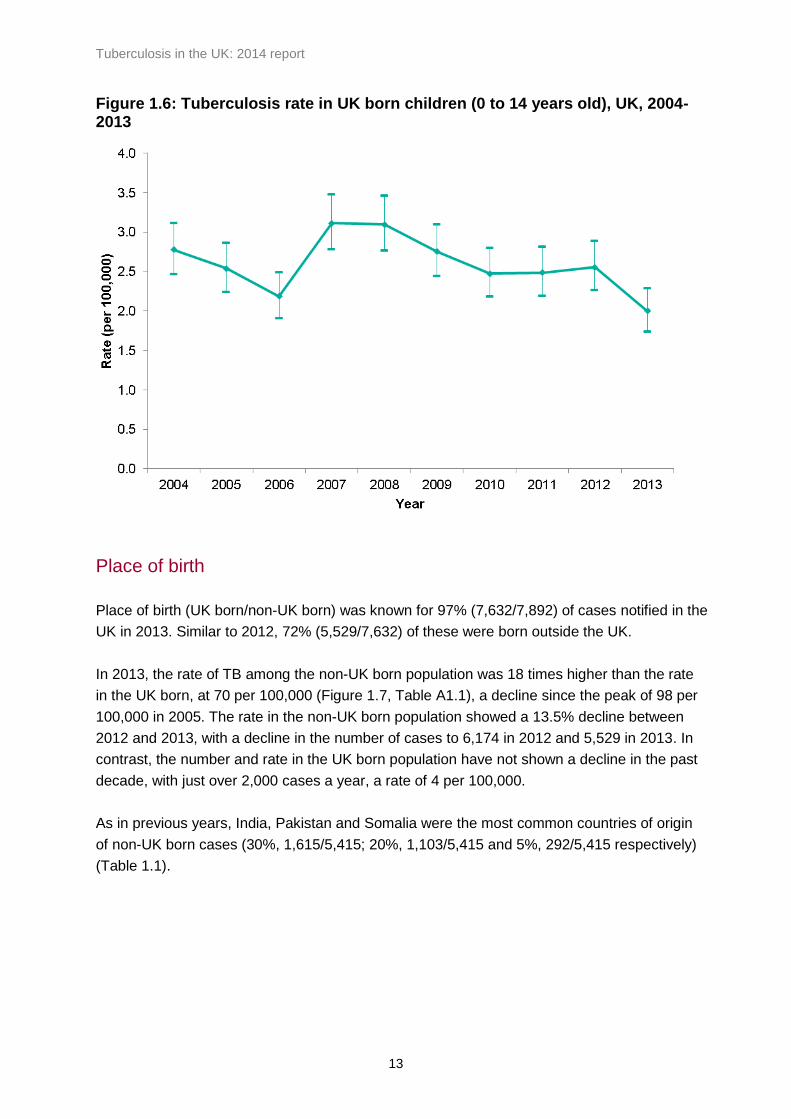
In 2013, the rate of TB in UK born children under 15 years of age, an indicator of recent
transmission within the UK, was 2.0 per 100,000, a decrease since the peak of 3.1 per
100,000 in 2007 and 2008 (Figure 1.6). Similarly, the child-to-adult ratio in notification rate,
another proxy for on-going transmission in a community, has declined over the past five years,
down from 0.29 in 2008 to 0.20 in 2013 (Table A1.5).
Tuberculosis in the UK: 2014 report
13
Figure 1.6: Tuberculosis rate in UK born children (0 to 14 years old), UK, 2004-2013
Place of birth
Place of birth (UK born/non-UK born) was known for 97% (7,632/7,892) of cases notified in the
UK in 2013. Similar to 2012, 72% (5,529/7,632) of these were born outside the UK.
In 2013, the rate of TB among the non-UK born population was 18 times higher than the rate
in the UK born, at 70 per 100,000 (Figure 1.7, Table A1.1), a decline since the peak of 98 per
100,000 in 2005. The rate in the non-UK born population showed a 13.5% decline between
2012 and 2013, with a decline in the number of cases to 6,174 in 2012 and 5,529 in 2013. In
contrast, the number and rate in the UK born population have not shown a decline in the past
decade, with just over 2,000 cases a year, a rate of 4 per 100,000.
As in previous years, India, Pakistan and Somalia were the most common countries of origin
of non-UK born cases (30%, 1,615/5,415; 20%, 1,103/5,415 and 5%, 292/5,415 respectively)
(Table 1.1).

Tuberculosis in the UK: 2014 report
14
Figure 1.7: Tuberculosis case reports and rates by place of birth, UK, 2004-2013
Table 1.1 Most frequent countries of birth for non-UK born tuberculosis cases and time since entry to the UK to tuberculosis diagnosis, UK, 2013
Country of birth Number of cases Percentage of cases*
Median time since entry to UK (IQR)**
India 1,615 29.8 5 (2 -13)
Pakistan 1,103 20.4 7 (2 -22)
Somalia 292 5.4 9 (4 -13)
Bangladesh 248 4.6 7 (3 -18)
Nepal 170 3.1 3 (2 -6)
Nigeria 164 3.0 7 (3 -11)
Philippines 136 2.5 8 (5 -12)
Zimbabwe 105 1.9 11 (7 -12)
Sri Lanka 95 1.8 7 (3 -13)
Kenya 84 1.6 22 (8 -37)
Romania 70 1.3 2 (0 -4)
Afghanistan 67 1.2 6 (2 -11)
Poland 66 1.2 5 (2 -7.5)
Eritrea 62 1.1 4 (2 -7)
China 56 1.0 7 (4 -11)
Others (each <1%)
1,082 20.0 5 (1 -13)
Total* 5,415 100 7 (3 -14)
*Where country of birth was known
**Years, IQR refers to interquartile range
Tuberculosis in the UK: 2014 report
15
Trends in number of TB cases by country of birth
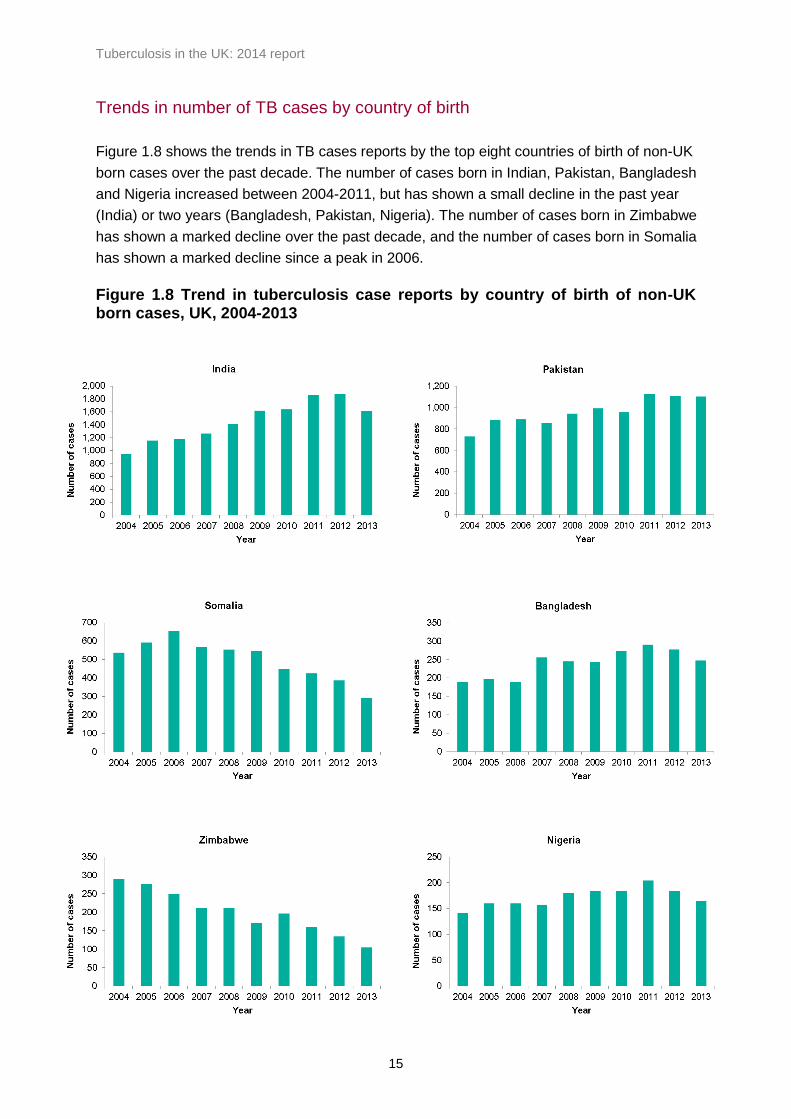
Figure 1.8 shows the trends in TB cases reports by the top eight countries of birth of non-UK
born cases over the past decade. The number of cases born in Indian, Pakistan, Bangladesh
and Nigeria increased between 2004-2011, but has shown a small decline in the past year
(India) or two years (Bangladesh, Pakistan, Nigeria). The number of cases born in Zimbabwe
has shown a marked decline over the past decade, and the number of cases born in Somalia
has shown a marked decline since a peak in 2006.
Figure 1.8 Trend in tuberculosis case reports by country of birth of non-UK born cases, UK, 2004-2013

Tuberculosis in the UK: 2014 report
16
Trends in migration from high TB burden countries
Trends in the number of TB cases in the non-UK born population should be interpreted in the
context of trends in migration. Figure 1.9 shows the number of long-term migrants requiring a
visa to enter the UK1 between 2005 and 2013, stratified by TB incidence in their country of
birth. In the past decade, the number of long term migrants from countries with a very high TB
incidence (>250 per 100,000) has decreased by 68%, and since 2009 the number of long term
migrants from countries with a high TB incidence (151-250 per 100,000) has decreased by
almost half (49%). Since 2009, numbers of migrants from medium TB incidence countries (40-
150 per 100,000) has shown a small increase (11%).
Figure 1.9: Number of long term migrants (>6 months) to the UK, stratified by 2012 WHO TB incidence estimates in their country of birth, 2005 to 2013
1 Person issued with an entry clearance visa to stay in the UK for longer than 6 months. Does not include
migrants from EU countries that do not require a visa to enter the UK, (source: Home Office Statistics).

Tuberculosis in the UK: 2014 report
17
Pre-entry screening for active tuberculosis
Trends in numbers of TB in the non-UK born population should be also be interpreted in the
context of changes to pre-entry screening policies. Since 2005, the UK has collaborated with
the International Organisation of Migration to pilot pre-entry screening of long term migrants to
the UK for active pulmonary TB in 15 high TB incidence countries2, and from autumn 2012,
pre-entry screening was rolled out to all high incidence countries (>40/100,000) [1]. Figure
1.10 shows the number and rate of TB detected in high incidence countries through pre-entry
screening by year. The number of cases of TB detected by pre-entry screening increased in
2013, to 130 cases, and rates have increased from 45 per 100,000 in 2006 to 188 per 100,000
in 2013.
Figure 1.10: Number and rate of TB cases detected in high incidence countries through the UK pre-entry screening programme, 2006 to 20133
Time since entry to the UK
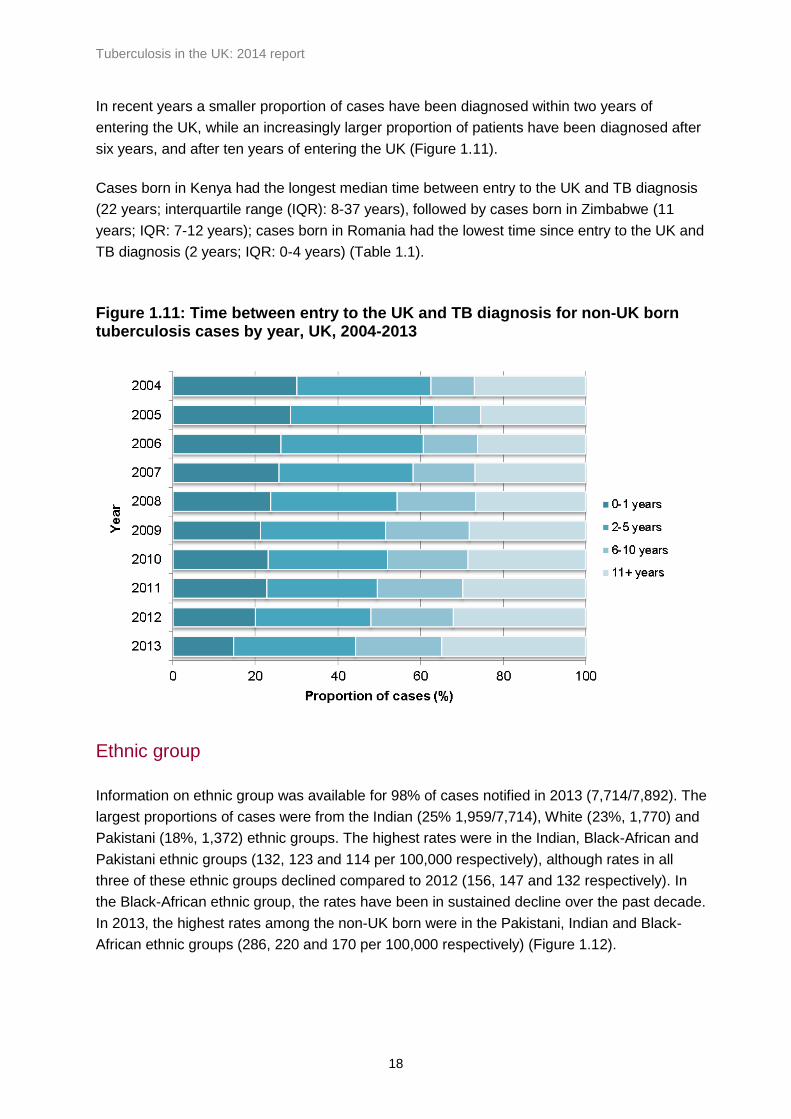
In 2013, the time between entry to the UK and TB diagnosis was known for 91% (5,012/5,529)
of non-UK born cases. Of these, 15% (738) were diagnosed within two years and 44% (2,213)
within five years of entering the UK (Figure 1.11).
2 The 15 high incidence countries were Bangladesh, Burkina Faso, Cambodia, Cote d’Ivoire, Eritrea, Ghana,
Kenya, Laos, Niger, Pakistan, Somalia, Sudan, Tanzania, Thailand and Togo. 3 For countries that only became part of pre-entry screening during the global roll-out in 2012-13, there is a
possibility of under-ascertainment, as clinics were establishing reporting systems during this transition phase
Tuberculosis in the UK: 2014 report
18
In recent years a smaller proportion of cases have been diagnosed within two years of
entering the UK, while an increasingly larger proportion of patients have been diagnosed after
six years, and after ten years of entering the UK (Figure 1.11).
Cases born in Kenya had the longest median time between entry to the UK and TB diagnosis
(22 years; interquartile range (IQR): 8-37 years), followed by cases born in Zimbabwe (11
years; IQR: 7-12 years); cases born in Romania had the lowest time since entry to the UK and
TB diagnosis (2 years; IQR: 0-4 years) (Table 1.1).
Figure 1.11: Time between entry to the UK and TB diagnosis for non-UK born tuberculosis cases by year, UK, 2004-2013
Ethnic group
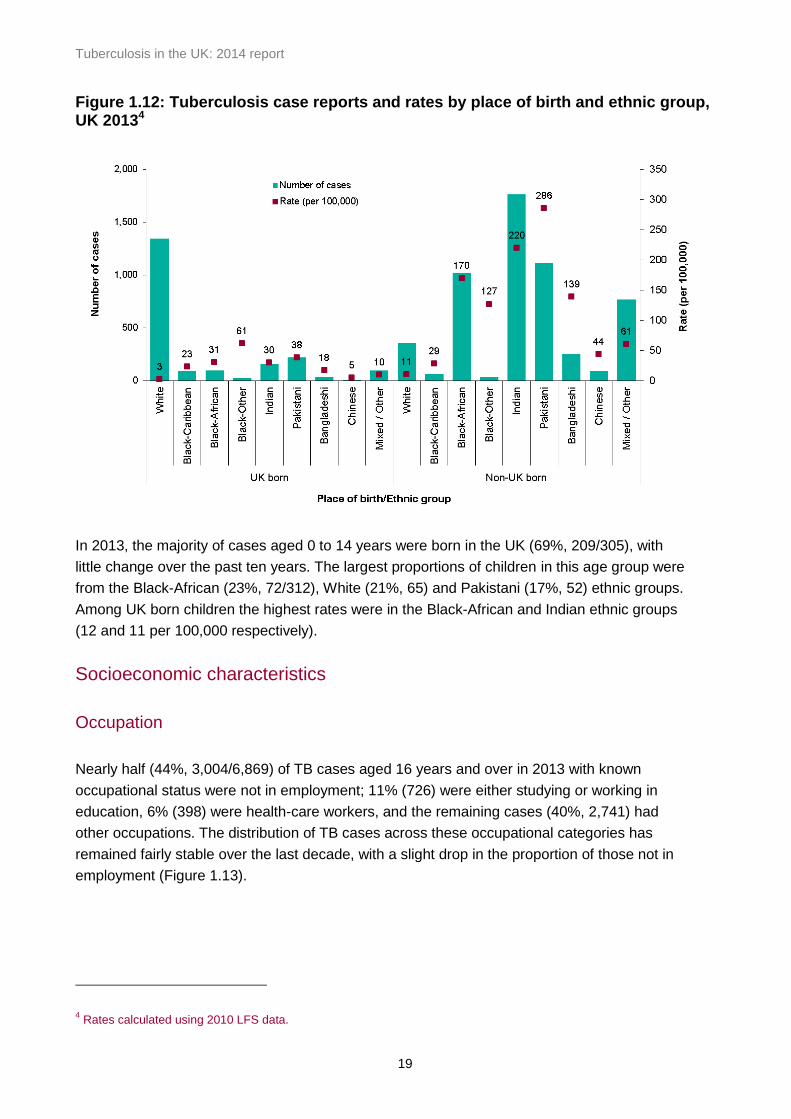
Information on ethnic group was available for 98% of cases notified in 2013 (7,714/7,892). The
largest proportions of cases were from the Indian (25% 1,959/7,714), White (23%, 1,770) and
Pakistani (18%, 1,372) ethnic groups. The highest rates were in the Indian, Black-African and
Pakistani ethnic groups (132, 123 and 114 per 100,000 respectively), although rates in all
three of these ethnic groups declined compared to 2012 (156, 147 and 132 respectively). In
the Black-African ethnic group, the rates have been in sustained decline over the past decade.
In 2013, the highest rates among the non-UK born were in the Pakistani, Indian and Black-
African ethnic groups (286, 220 and 170 per 100,000 respectively) (Figure 1.12).
Tuberculosis in the UK: 2014 report
19
Figure 1.12: Tuberculosis case reports and rates by place of birth and ethnic group, UK 20134
In 2013, the majority of cases aged 0 to 14 years were born in the UK (69%, 209/305), with
little change over the past ten years. The largest proportions of children in this age group were
from the Black-African (23%, 72/312), White (21%, 65) and Pakistani (17%, 52) ethnic groups.
Among UK born children the highest rates were in the Black-African and Indian ethnic groups
(12 and 11 per 100,000 respectively).
Socioeconomic characteristics
Occupation
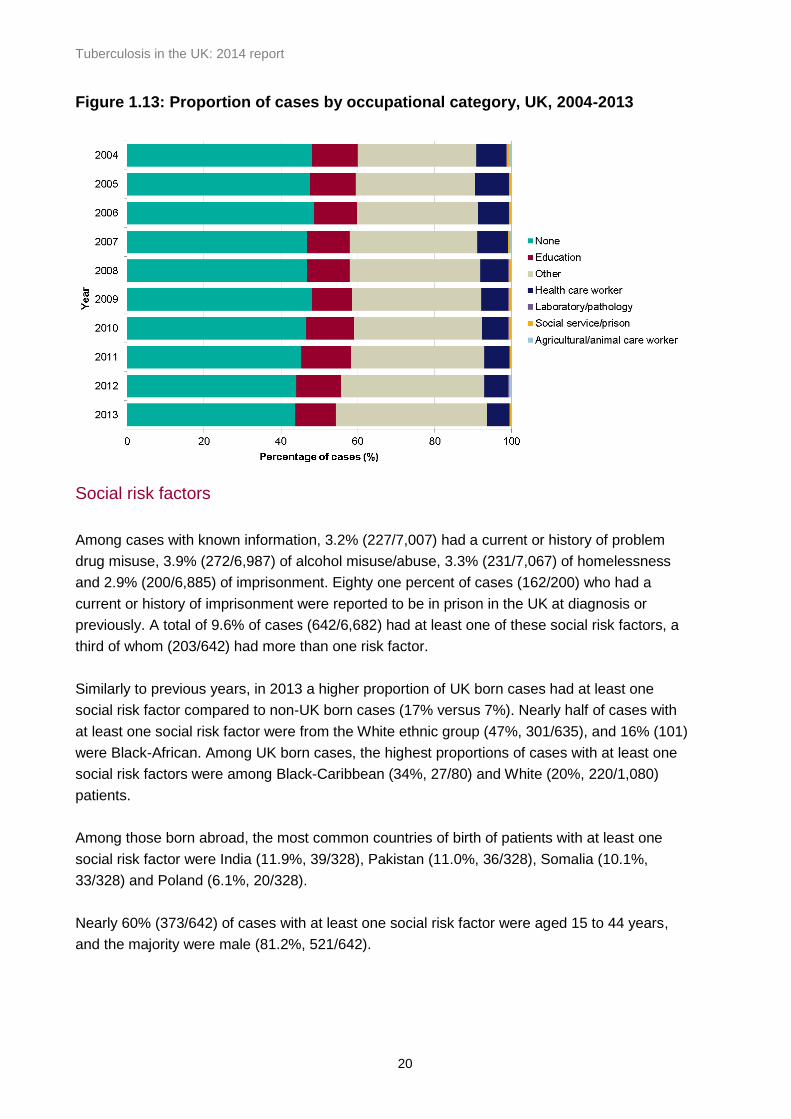
Nearly half (44%, 3,004/6,869) of TB cases aged 16 years and over in 2013 with known
occupational status were not in employment; 11% (726) were either studying or working in
education, 6% (398) were health-care workers, and the remaining cases (40%, 2,741) had
other occupations. The distribution of TB cases across these occupational categories has
remained fairly stable over the last decade, with a slight drop in the proportion of those not in
employment (Figure 1.13).
4 Rates calculated using 2010 LFS data.
Tuberculosis in the UK: 2014 report
20
Figure 1.13: Proportion of cases by occupational category, UK, 2004-2013
Social risk factors
Among cases with known information, 3.2% (227/7,007) had a current or history of problem
drug misuse, 3.9% (272/6,987) of alcohol misuse/abuse, 3.3% (231/7,067) of homelessness
and 2.9% (200/6,885) of imprisonment. Eighty one percent of cases (162/200) who had a
current or history of imprisonment were reported to be in prison in the UK at diagnosis or
previously. A total of 9.6% of cases (642/6,682) had at least one of these social risk factors, a
third of whom (203/642) had more than one risk factor.
Similarly to previous years, in 2013 a higher proportion of UK born cases had at least one
social risk factor compared to non-UK born cases (17% versus 7%). Nearly half of cases with
at least one social risk factor were from the White ethnic group (47%, 301/635), and 16% (101)
were Black-African. Among UK born cases, the highest proportions of cases with at least one
social risk factors were among Black-Caribbean (34%, 27/80) and White (20%, 220/1,080)
patients.
Among those born abroad, the most common countries of birth of patients with at least one
social risk factor were India (11.9%, 39/328), Pakistan (11.0%, 36/328), Somalia (10.1%,
33/328) and Poland (6.1%, 20/328).
Nearly 60% (373/642) of cases with at least one social risk factor were aged 15 to 44 years,
and the majority were male (81.2%, 521/642).
Tuberculosis in the UK: 2014 report
21
Area-level deprivation
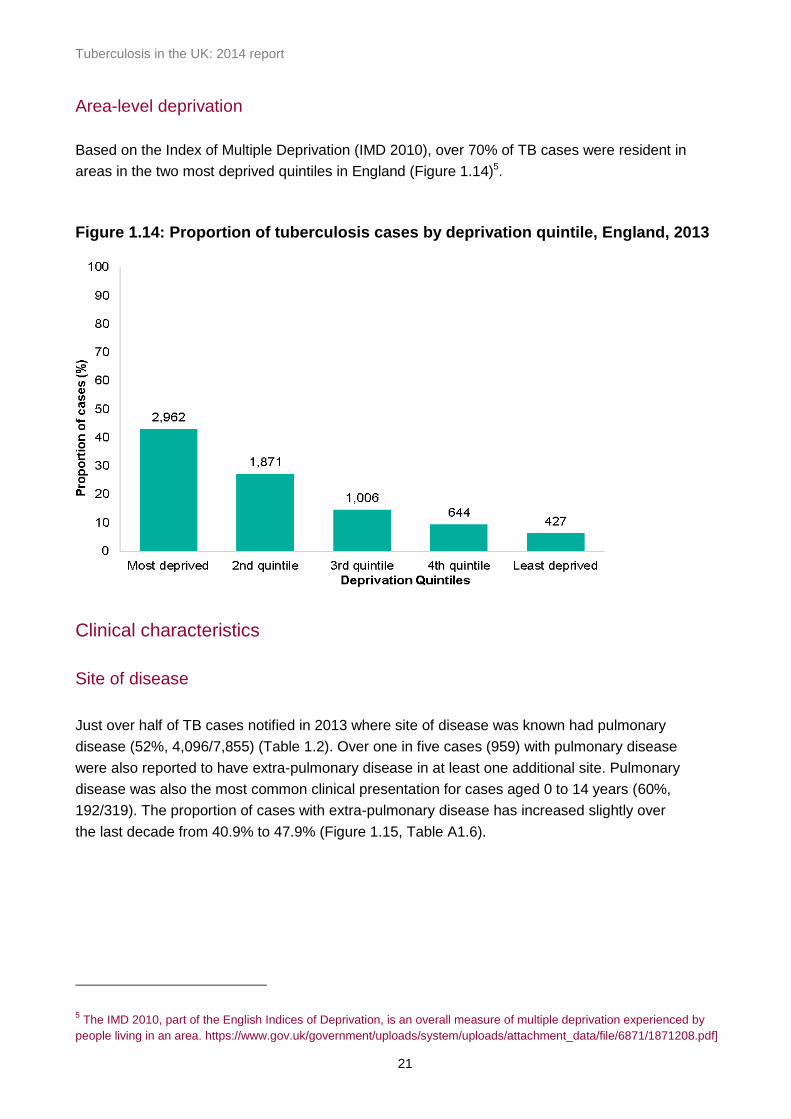
Based on the Index of Multiple Deprivation (IMD 2010), over 70% of TB cases were resident in
areas in the two most deprived quintiles in England (Figure 1.14)5.
Figure 1.14: Proportion of tuberculosis cases by deprivation quintile, England, 2013
Clinical characteristics
Site of disease
Just over half of TB cases notified in 2013 where site of disease was known had pulmonary
disease (52%, 4,096/7,855) (Table 1.2). Over one in five cases (959) with pulmonary disease
were also reported to have extra-pulmonary disease in at least one additional site. Pulmonary
disease was also the most common clinical presentation for cases aged 0 to 14 years (60%,
192/319). The proportion of cases with extra-pulmonary disease has increased slightly over
the last decade from 40.9% to 47.9% (Figure 1.15, Table A1.6).
5 The IMD 2010, part of the English Indices of Deprivation, is an overall measure of multiple deprivation experienced by
people living in an area. https://www.gov.uk/government/uploads/system/uploads/attachment_data/file/6871/1871208.pdf]

Tuberculosis in the UK: 2014 report
22
Figure 1.15: Proportion of pulmonary/extra-pulmonary tuberculosis cases, UK, 2004-
2013
* With or without extra-pulmonary disease
Table 1.2: Tuberculosis case reports by site of disease, UK, 2013
Site of disease* Number of cases Percentage**
Pulmonary 4,096 52.1
Extra-thoracic lymph nodes 1,874 23.9
Unknown extra-pulmonary 931 11.9
Intra-thoracic lymph nodes 916 11.7
Pleural 673 8.6
Other extra-pulmonary 689 8.8
Gastrointestinal 432 5.5
Bone – spine 353 4.5
Bone – other 220 0.5
Miliary± 211 2.8
CNS – meningitis 172 2.7
Genitourinary 145 2.2
CNS – other 129 1.8
Cryptic 39 1.6
Laryngeal 19 0.2
*With or without disease at another site **Percentage of cases with known sites of disease (7,855) ± For Scotland cases, this includes both cryptic and miliary site CNS - Central Nervous System Total percentage exceeds 100% due to disease at more than one site
Tuberculosis in the UK: 2014 report
23
Of cases with at least one social risk factor, the majority had pulmonary disease (78%,
500/642); of these 58% (237/412) for whom a sputum smear result was available were sputum
smear positive.
Planned course of treatment and directly observed therapy
Data on the planned course of treatment were known for 53% of cases (4,167/7,892) notified
in 2013; 92% (3,839) of these were planned to start on a standard six month course of
treatment.
Information on whether a patient received directly observed therapy (DOT)6 was known for
93% of cases (7,325/7,892); of these 10% (734) were reported to have received DOT
treatment. Twenty four percent (71/293) of children aged 0 to 14 years received DOT. Only
48% (295/611) of cases with at least one social risk factor received DOT, compared to 93%
(28/30) of cases who were in prison at diagnosis.
Previous diagnosis of tuberculosis
Information on previous history of TB was available for 95% (7,509/7,892) of cases recorded in
2013; of these 7% (508) had a previous diagnosis of TB more than 12 months previously.
Among cases known to have a previous diagnosis of TB, 24% (117/479) received DOT. Just
above 10% (64/615) of cases with at least one social risk factor were reported to have a
previous history of TB.
Hospital inpatient
Information on whether cases were hospital inpatients at diagnosis was available for 96% of
cases (7,568/7,892); of these 28% (2,115/7,568) were hospital inpatients at diagnosis, half the
proportion reported to be hospital inpatients in 2004.
BCG vaccination
In 2013, data on BCG vaccination status were available for 70% of cases (5,552/7,892); 71%
(3,941) of these had previously received BCG vaccination. Almost three-quarters of cases
aged 0 to 14 years had received BCG vaccination (74%, 211/284); the proportion of children
who had received BCG vaccination was higher in non-UK born children (80%, 63/79) than in
UK born children (72%,141/195). A similar pattern could be observed among children less
than 5 years of age, where the proportion of children who had received BCG vaccination was
85% in non-UK born (11/13) compared with 74% for UK born children (64/86).
6 In the Enhanced TB Surveillance system (ETS), the relevant variable is “Patient to begin a course of treatment under direct observation”; in the
London TB Register ( LTBR) the relevant variable is “Patient was taking Directly Observed Therapy at any time during the episode of care”.

Tuberculosis in the UK: 2014 report
24
HIV testing
In 2013, information on HIV testing was known for 81% of cases whose HIV status was not
previously known (6,205/7,616). Of these, 88.5% of cases (5,490) were offered and received
HIV testing, 6.8% of cases (424) were not offered testing, and 4.7% (291) were offered HIV
testing but did not receive it, of which 1.7% (106) declined. A high proportion of children aged
0 to 14 years old were not offered HIV testing (35%, 78/221. Data on HIV status is not
collected in the surveillance system. Information on the proportion of TB cases aged 15 years
and older with HIV is obtained by record linkage between the national TB and HIV datasets.
For 2012 data, this information will be available later in the year after record linkage has been
completed.
Time from symptom onset to TB treatment start for pulmonary TB cases
In 2013, information on time from symptom onset to TB treatment start was available for 73%
of pulmonary patients (3,009/4,096), with a median time between onset of symptoms to TB
treatment start of 72 days (interquartile range (IQR) 36-132). Forty one percent (1,235/3,009)
of patients started treatment within two months and 72% (2,153) within four months of
symptom onset. Data on the time from symptom onset to TB treatment start has been
available for more than two thirds of patients since 2011 only. The proportion of patients who
started treatment within two months (2011: 48.1%, 2013: 41.0%) and four months (2011:
75.5%, 2013: 71.6%) of symptom onset has decreased over the last three years, with a
greater proportion of patients experiencing longer delays.
The proportion of cases who experienced a delay from onset of symptoms to start of treatment
of at least four months increased with age (0-14: 15.4%, 15-44: 24.9%, 45-64: 33.2%, over 65:
38.6%).
The proportion of cases who had a delay of greater than four months was similar for those with
at least one social risk factor (28%, 106/374) and for those without social risk factors (29%,
693/2,375).

Tuberculosis in the UK: 2014 report
25
2. Microscopy, culture confirmation, speciation
and drug susceptibility, 2004-2013
Key messages
the proportion of cases resistant to isoniazid has fluctuated over the past decade, and
remains at the same level in 2013 as in 2004
isoniazid resistance was most common in those with a previous history of TB or social
risk factors, in particular those reporting drug misuse or imprisonment
the proportion of cases with MDR-TB has remained stable at 1.6% over the past 3
years
the majority of cases with MDR-TB (87.3%) were born outside the UK; the highest
number of cases were from India, Pakistan and Somalia, and the highest proportions
were in those from the Ukraine, Lithuania, Latvia and Sierra Leone
the majority of MDR-TB cases with resistance to an injectable agent were born in
EU/EEA countries (58.3%)
the majority of MDR-TB cases with resistance to a fluoroquinolone were born in
countries outside the EU/EEA (72.7%)
Culture and species identification
Of all TB cases notified in 2013, 59.3% (4,680/7,892) were culture confirmed. In the UK, the
proportion of culture confirmed cases was highest in Northern Ireland (61.6%, 45/73) and
Scotland (61.2%, 238/389). In England culture confirmation was highest in the North East of
England (74.2%, 89/120) and lowest in Avon, Gloucestershire and Wiltshire (50.5%, 111/220)
(Table A2.1).
A higher proportion of pulmonary cases were culture confirmed compared to extra-pulmonary
cases (71.3%, 2,920/4,096 versus 46.8%, 1,759/3,759) (Table A2.2).
Over the last decade, the proportion of TB cases that were culture confirmed in the UK
remained relatively stable, although there was a decline in Scotland from 77.0% (302/392) in
2004 to 61.2% (238/389) in 2013. The proportion of culture confirmed cases in 0-14 year olds
was consistently two to three times lower (range 20-29%) than in 15-44 year olds (range 63-
66%) (Figure 2.1).
Among all culture confirmed cases notified in 2013, 97.5% (4,563/4,680) were identified with
Mycobacterium tuberculosis (M.tuberculosis) infection, 0.6% (29/4,680) with Mycobacterium
bovis (M.bovis), 1.4% (63/4,680) with Mycobacterium africanum (M.africanum) and 0.5%
(25/4,680) with Mycobacterium tuberculosis complex (MTBC) bacteria which were not further
differentiated. There were no cases of Mycobacterium microti. The apparent decrease in the

Tuberculosis in the UK: 2014 report
26
proportion of cases with M. tuberculosis, and parallel increase in those with with MTBC
between 2009 and 2013 (Table A2.3) reflects the fact that prior to 2009 the majority of MTBC
cases were reclassified as M. tuberculosis.
The increase in the proportion of M. africanum cases from 0.1% in 2004 to 0.3% in 2006 and a
further increase to 1.4% in 2011 can be explained by improvements in speciation techniques
such as the introduction of molecular probes in 2006 and Mycobacterial Interspersed
Repetitive Unit-Variable Number Tandem Repeats (MIRU-VNTR) in 2010. The proportion of
M. bovis cases remained relatively stable over time. There were only 4 cases of confirmed M.
microti in the last 10 years.
Figure 2.1 Culture confirmation by age group, UK, 2004-2013
Drug resistance
Drug susceptibility test results for at least isoniazid and rifampicin were available from the
earliest TB isolate for 98.4% (4,606/4,680) of the 2013 culture-confirmed cases, similar to
previous years. Of these, 7.1 % (329/4,606) were resistant to isoniazid, 1.9% (86/4,606) were
resistant to rifampicin, 0.9% (43/4,606) were resistant to pyrazinamide, 0.9% (41/4,897) were
resistant to ethambutol, 7.8% (360/4,606) were resistant to at least one first line antibiotic and
1.6% (74/4,606) were MDR-TB cases, with resistance to at least isoniazid and rifampicin
(Table A2.4).
Isoniazid resistance
Over the past 10 years, the proportion of TB cases resistant to isoniazid fluctuated between
5.8 and 7.5% (Figure 2.2). In 2013, the proportion of cases resistant to isoniazid was slightly
higher in males compared to females (7.3%, 202/2,764 versus 6.9%, 127/1,842) and in those

Tuberculosis in the UK: 2014 report
27
15-44 years old (8.1%, 238/2,931) compared to other age groups (Table 2.1). The proportion
of cases resistant to isoniazid was lowest in 0-14 year olds, and decreased in this age group
from 11 cases in 2012 to 1 case in 2013.
Figure 2.2: Proportion of tuberculosis cases with isoniazid resistance or MDR-TB, UK, 2004-2013
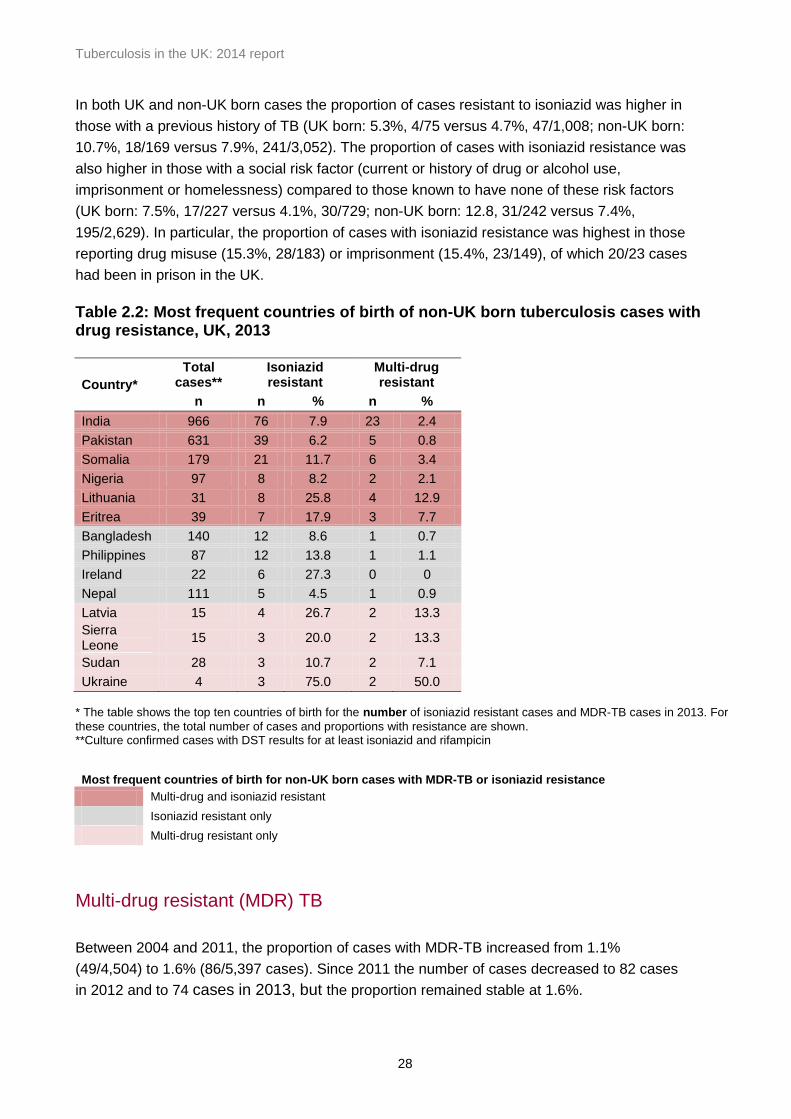
The proportion of cases with isoniazid resistance was higher in the non-UK born compared to
those born in the UK (8.0%, 267/3,332 versus 4.6%, 52/1,127). Among the 10 most common
countries of birth for non-UK born cases with isoniazid resistance, the highest number of cases
with isoniazid resistance were in those born in India, Pakistan and Somalia, but the highest
proportions of TB cases with isoniazid resistance, were in those born in Ireland, Lithuania, the
Ukraine and Eritrea (Table 2.2). Half of the cases with isoniazid resistance that were born in
Ireland were part of a known isoniazid resistant outbreak in London (cluster E1244: strain type
424332431515321236423-52), which predominantly involves White or Black-Caribbean UK
born cases with social risk factors. In 2013, 7.3% (20/274) of all isoniazid resistant cases with
a strain type were part of this cluster.
Table 2.1: Number and proportion of tuberculosis cases with drug resistance by age group, UK, 2013
Age Group
Isoniazid resistant
Multi-drug resistant
Total*
n % n % n
0-14 1 1.6 0 0.0 62
15-44 238 8.1 61 2.1 2,931
45-65 66 6.9 11 1.1 964
65+ 24 3.7 2 0.3 649
*Culture confirmed cases with DST results for at least isoniazid and rifampicin
Tuberculosis in the UK: 2014 report
28
In both UK and non-UK born cases the proportion of cases resistant to isoniazid was higher in
those with a previous history of TB (UK born: 5.3%, 4/75 versus 4.7%, 47/1,008; non-UK born:
10.7%, 18/169 versus 7.9%, 241/3,052). The proportion of cases with isoniazid resistance was
also higher in those with a social risk factor (current or history of drug or alcohol use,
imprisonment or homelessness) compared to those known to have none of these risk factors
(UK born: 7.5%, 17/227 versus 4.1%, 30/729; non-UK born: 12.8, 31/242 versus 7.4%,
195/2,629). In particular, the proportion of cases with isoniazid resistance was highest in those
reporting drug misuse (15.3%, 28/183) or imprisonment (15.4%, 23/149), of which 20/23 cases
had been in prison in the UK.
Table 2.2: Most frequent countries of birth of non-UK born tuberculosis cases with drug resistance, UK, 2013
Country*
Total cases**
Isoniazid resistant
Multi-drug resistant
n n % n %
India 966 76 7.9 23 2.4
Pakistan 631 39 6.2 5 0.8
Somalia 179 21 11.7 6 3.4
Nigeria 97 8 8.2 2 2.1
Lithuania 31 8 25.8 4 12.9
Eritrea 39 7 17.9 3 7.7
Bangladesh 140 12 8.6 1 0.7
Philippines 87 12 13.8 1 1.1
Ireland 22 6 27.3 0 0
Nepal 111 5 4.5 1 0.9
Latvia 15 4 26.7 2 13.3
Sierra Leone
15 3 20.0 2 13.3
Sudan 28 3 10.7 2 7.1
Ukraine 4 3 75.0 2 50.0
* The table shows the top ten countries of birth for the number of isoniazid resistant cases and MDR-TB cases in 2013. For
these countries, the total number of cases and proportions with resistance are shown. **Culture confirmed cases with DST results for at least isoniazid and rifampicin
Most frequent countries of birth for non-UK born cases with MDR-TB or isoniazid resistance
Multi-drug and isoniazid resistant
Isoniazid resistant only
Multi-drug resistant only
Multi-drug resistant (MDR) TB
Between 2004 and 2011, the proportion of cases with MDR-TB increased from 1.1%
(49/4,504) to 1.6% (86/5,397 cases). Since 2011 the number of cases decreased to 82 cases
in 2012 and to 74 cases in 2013, but the proportion remained stable at 1.6%.
Tuberculosis in the UK: 2014 report
29
In 2013, the proportion of cases with MDR-TB was slightly higher in males compared to
females (1.7%, 48/ 2,764 versus 1.4%, 26/ 1,842), and in 15 to 44 year olds (2.1%, 61/2,931)
compared to other age groups (Table 2.1). There were no laboratory confirmed cases of MDR-
TB in children aged 0-14 years in 2013, compared to seven cases in 2012.
The vast majority of MDR-TB cases were non-UK born (87.3%; 62/71) and had entered the
UK within the past five years (61.7%, 37/60). The most frequent countries of birth of MDR-TB
cases were India, Somalia and Pakistan, but the highest proportions were in the small number
of cases born in Ukraine, Latvia, Lithuania and Sierra Leone (Table 2.2). The proportion of
cases with MDR-TB was higher in those with a previous history of TB compared to those
without (4.0%, 10/250 versus 1.4%, 59/ 4,128).
In addition to the culture confirmed MDR-TB cases, two TB cases who were not culture
confirmed in the UK received MDR-TB treatment. One case was a contact of a culture
confirmed MDR-TB case, and one entered the UK having been culture confirmed abroad.
Second line drug resistance and Extensively Drug Resistant (XDR) TB
Of those MDR-TB cases that were tested for all first line drugs (isoniazid, rifampicin,
ethambutol and pyrazinamide), 17.4% were resistant to all four (12/69). Fifty percent (37/74) of
MDR-TB cases were resistant to at least one second line drug. A high proportion (98.6%,
73/74) of MDR-TB cases were tested for at least one injectable agent (amikacin, capreomycin
or kanamycin); a lower proportion (93.2%, 69/74) were tested for at least one fluoroquinolone
(either ofloxacin or moxifloxacin). Of these, similar proportions were resistant to an injectable
agent (16.4%, 12/73) or a fluoroquinolone (15.9%, 11/69). There were 17 MDR-TB cases
resistant to at least one injectable agent OR one fluoroquinolone (pre-XDR). The majority of
MDR-TB cases with resistance to an injectable agent were from countries in the EU/EEA
(58.3%, 7/12) whereas the majority with fluoroquinolone resistance were from outside the
EU/EEA (72.7%, 8/11).
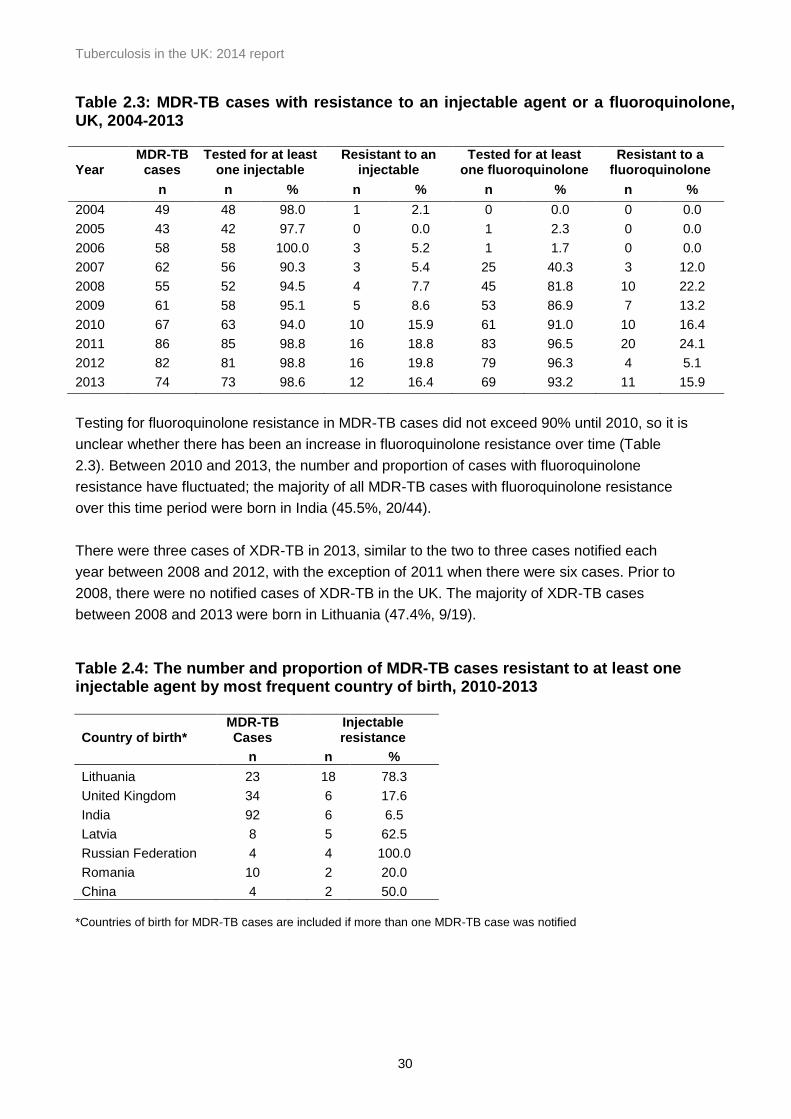
Between 2004 and 2009, the proportion of MDR-TB cases resistant to an injectable agent
increased from 2.1% to 8.6%. In 2010, there was a substantial increase to 15.9% and this
higher proportion has been sustained for the past 4 years (Table 2.3). This increase was
mainly due to a rise in the number and proportion of MDR-TB cases with resistance to an
injectable agent born in Lithuania, from 25.0% (3/12) between 2004 and 2009 to 78.3%
(18/23) between 2010 and 2013 (Table 2.4).Between 2010 and 2013, at least half of the MDR-
TB cases born in Latvia or China also had resistance to an injectable agent. All MDR-TB
cases from the Russian Federation in this time period were resistant to an injectable agent.
Despite an increase in the number of MDR-TB cases from Romania in the past four years, the
proportion with resistance to an injectable agent (20%) has not increased.
Tuberculosis in the UK: 2014 report
30
Table 2.3: MDR-TB cases with resistance to an injectable agent or a fluoroquinolone, UK, 2004-2013 Year
MDR-TB cases
Tested for at least one injectable
Resistant to an injectable
Tested for at least one fluoroquinolone
Resistant to a fluoroquinolone
n n % n % n % n %
2004 49 48 98.0 1 2.1 0 0.0 0 0.0
2005 43 42 97.7 0 0.0 1 2.3 0 0.0
2006 58 58 100.0 3 5.2 1 1.7 0 0.0
2007 62 56 90.3 3 5.4 25 40.3 3 12.0
2008 55 52 94.5 4 7.7 45 81.8 10 22.2
2009 61 58 95.1 5 8.6 53 86.9 7 13.2
2010 67 63 94.0 10 15.9 61 91.0 10 16.4
2011 86 85 98.8 16 18.8 83 96.5 20 24.1
2012 82 81 98.8 16 19.8 79 96.3 4 5.1
2013 74 73 98.6 12 16.4 69 93.2 11 15.9
Testing for fluoroquinolone resistance in MDR-TB cases did not exceed 90% until 2010, so it is
unclear whether there has been an increase in fluoroquinolone resistance over time (Table
2.3). Between 2010 and 2013, the number and proportion of cases with fluoroquinolone
resistance have fluctuated; the majority of all MDR-TB cases with fluoroquinolone resistance
over this time period were born in India (45.5%, 20/44).
There were three cases of XDR-TB in 2013, similar to the two to three cases notified each
year between 2008 and 2012, with the exception of 2011 when there were six cases. Prior to
2008, there were no notified cases of XDR-TB in the UK. The majority of XDR-TB cases
between 2008 and 2013 were born in Lithuania (47.4%, 9/19).
Table 2.4: The number and proportion of MDR-TB cases resistant to at least one injectable agent by most frequent country of birth, 2010-2013
Country of birth* MDR-TB Cases
Injectable resistance
n n %
Lithuania 23 18 78.3
United Kingdom 34 6 17.6
India 92 6 6.5
Latvia 8 5 62.5
Russian Federation 4 4 100.0
Romania 10 2 20.0
China 4 2 50.0
*Countries of birth for MDR-TB cases are included if more than one MDR-TB case was notified

Tuberculosis in the UK: 2014 report
31
Amplification of drug resistance on repeat culture
In 2013, 0.2% (9/4,606) of culture confirmed cases with initial drug susceptibility test results for
at least isoniazid and rifampicin were identified as having amplified resistance on repeat
culture. There were no amplified MDR-TB or rifampicin resistant TB cases, although since
many cases diagnosed in 2013 are still on treatment some of these may amplify resistance in
the future.
Between 2004 and 2013 there were 121 cases of amplified resistance, of which 31.4% (38
cases) amplified rifampicin resistance and of these the majority (34 cases) amplified to MDR-
TB (Table 2.5). The average number of cases amplifying MDR-TB per year decreased over
time from five cases between 2004-2008 compared to two cases between 2009 and 2013. For
those with a treatment start date recorded (31 cases), the median time for MDR amplification
after starting treatment was 249 days (range 19-1092).
Six percent (36/637) of MDR-TB cases notified between 2004 and 2013 amplified further
resistance in subsequent cultures taken during treatment. Further resistance most commonly
developed to Ethionamide (12 cases), Ethambutol (11 cases) and Pyrazinamide (10 cases).
Over the past decade, only one case has amplified to XDR-TB.
Table 2.5: Number of TB cases with initial and amplified rifampicin resistance and MDR-TB, UK, 2004-2013
Rifampicin resistance MDR-TB
Year Initial
resistance Amplified
resistance* Total
Initial resistance
Amplified resistance*
Treated as an MDR-TB case*^
Total
2004 66 7 73 49 6 0 55
2005 59 3 62 43 2 0 45
2006 79 5 84 58 5 1 64
2007 76 7 83 62 5 1 68
2008 74 4 78 55 6 0 61
2009 73 3 76 61 2 0 63
2010 77 3 80 67 2 0 69
2011 95 3 98 86 3 0 89
2012 92 3 95 82 3 4 89
2013 86 0 86 74 0 2 76 *Excludes Scotland ^ Not culture confirmed
TB isolates not matched to notified cases
The PHE Tuberculosis Surveillance Unit receives data from the mycobacterial reference
laboratories in England, Wales and Northern Ireland on all laboratory confirmed TB isolates,
including speciation, drug resistance and MIRU-VNTR strain type, and matches this data with
Tuberculosis in the UK: 2014 report
32
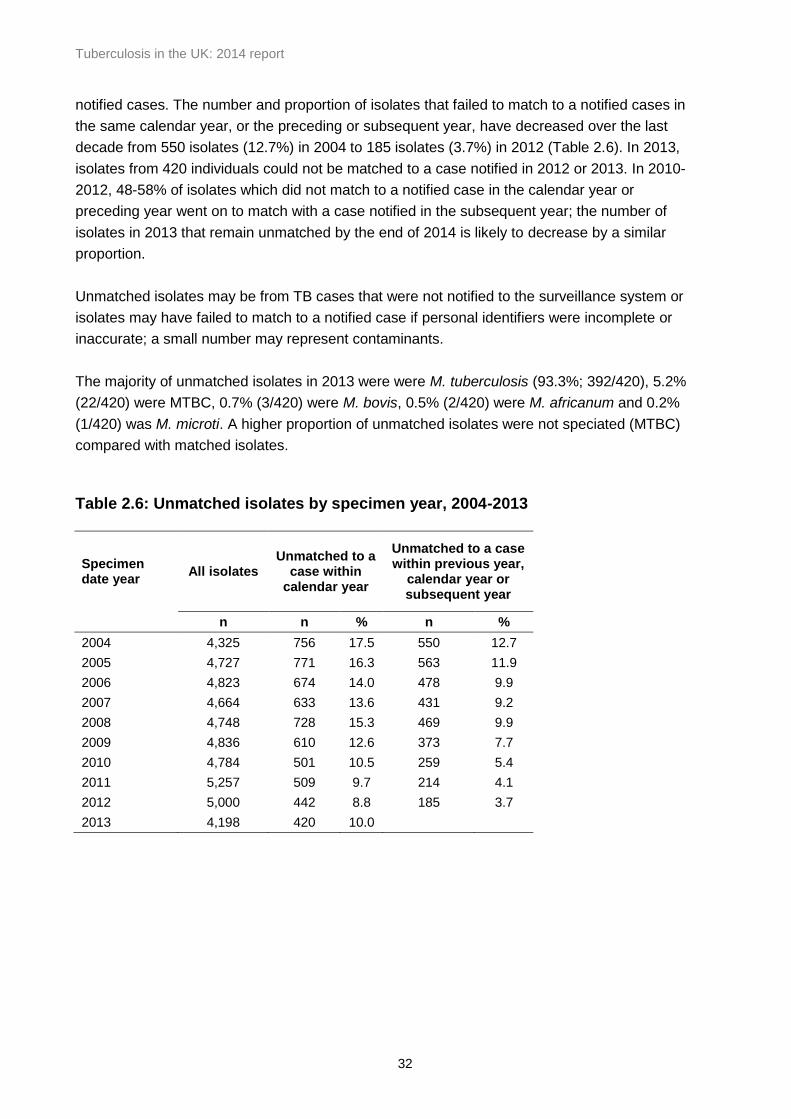
notified cases. The number and proportion of isolates that failed to match to a notified cases in
the same calendar year, or the preceding or subsequent year, have decreased over the last
decade from 550 isolates (12.7%) in 2004 to 185 isolates (3.7%) in 2012 (Table 2.6). In 2013,
isolates from 420 individuals could not be matched to a case notified in 2012 or 2013. In 2010-
2012, 48-58% of isolates which did not match to a notified case in the calendar year or
preceding year went on to match with a case notified in the subsequent year; the number of
isolates in 2013 that remain unmatched by the end of 2014 is likely to decrease by a similar
proportion.
Unmatched isolates may be from TB cases that were not notified to the surveillance system or
isolates may have failed to match to a notified case if personal identifiers were incomplete or
inaccurate; a small number may represent contaminants.
The majority of unmatched isolates in 2013 were were M. tuberculosis (93.3%; 392/420), 5.2%
(22/420) were MTBC, 0.7% (3/420) were M. bovis, 0.5% (2/420) were M. africanum and 0.2%
(1/420) was M. microti. A higher proportion of unmatched isolates were not speciated (MTBC)
compared with matched isolates.
Table 2.6: Unmatched isolates by specimen year, 2004-2013
Specimen date year
All isolates Unmatched to a
case within calendar year
Unmatched to a case within previous year,
calendar year or subsequent year
n n % n %
2004 4,325 756 17.5 550 12.7
2005 4,727 771 16.3 563 11.9
2006 4,823 674 14.0 478 9.9
2007 4,664 633 13.6 431 9.2
2008 4,748 728 15.3 469 9.9
2009 4,836 610 12.6 373 7.7
2010 4,784 501 10.5 259 5.4
2011 5,257 509 9.7 214 4.1
2012 5,000 442 8.8 185 3.7
2013 4,198 420 10.0
Tuberculosis in the UK: 2014 report
33
3. Strain typing, 2010-2013
Key messages
in 2013, 82% of culture confirmed cases had their strains typed at 23 loci or more
between 2010-2013, the proportion of strain typed TB cases that clustered was 53.5%
the proportion UK born cases that clustered was higher than the proportion of non-UK born
cases that clustered
there was considerable variation in lineage by country of birth
Background
The National Strain Typing Service, which was established in 2010, involves prospectively
typing TB isolates using 24 loci MIRU-VNTR. Molecular clusters of patients with
indistinguishable 24 loci MIRU-VNTR profiles which fulfil certain criteria are investigated to try
to identify epidemiological links and transmission settings and inform public health action [2].
Proportion of culture confirmed cases strain typed and clustered
In 2013, 98.4% (4,607/4,680) of culture confirmed cases in the UK had an isolate strain typed.
Eighty two percent (3,838) of the culture confirmed cases had at least 23 loci typed, a lower
proportion than in 2012. This is in part due to a decrease in Scotland, where the DNA
extraction methodology was changed in 2013 (Table A3.1, Figure 3.1). Between January 2010
and December 2013, there were a total of 80.7% (16,602/20,560) isolates from culture
confirmed cases on which strain typing was completed for at least 23 loci; of these 53.5%
(8,890) cases were in 1,854 molecular clusters and 46.5% (7,712) cases had a unique strain
type (Table 3.1).
Clusters of TB cases with indistinguishable MIRU-VNTR strain types (clustered cases), may
reflect cases that are part of the same chain of transmission, but could also reflect common
endemic strains circulating either within the UK or abroad. In previous years, the n-1 method
was used to estimate the proportion of cases likely to be due to recent transmission on the
basis of the proportion of cases clustered and the number of clusters [3]. This method has
some limitations and is unlikely to provide a reliable estimate of recent transmission in the UK,
particularly as such a high proportion of UK TB cases are born abroad. To obtain reliable
estimates of the proportion of cases due to recent transmission in the UK requires strain typing
data to be combined with detailed epidemiological data on links between cases derived from
cluster investigation, which is the subject of on-going work. For this reason, in this report we
present data on the proportion of cases that cluster, without attempting to derive estimates of
the proportion of cases due to recent transmission.

Tuberculosis in the UK: 2014 report
34
Figure 3.1 Proportion of culture confirmed cases with at least 23 loci typed by country 2010-2013
The proportion of culture confirmed cases which clustered varied by country, with lower
proportions in Wales (15.9%), Northern Ireland (24.6%) and Scotland (30.8%). In England, the
proportion of clustered cases was 53.3% and varied by PHEC area, with the highest
proportions in London (47.6%) and the West Midlands (45.9%), and the lowest in Cheshire
and Merseyside (16.2%) (Table 3.1).

Tuberculosis in the UK: 2014 report
35
Table 3.1: Number of tuberculosis clusters and proportion clustered by country and Public Health England Centre, 2010-2013
Notified
cases
Number
of
clusters
n n % n % n % n % n n % n % n % n % n %
UK‡ 33,942 20,560 60.6 16,602 80.7 7,712 46.5 8,890 53.5 1,854 858 46.3 365 19.7 188 10.1 306 16.5 137 7.4
Country
England§ 31,350 18,838 60.1 15,375 81.6 7,182 46.7 8,193 53.3 1,733 813 46.9 336 19.4 183 10.6 278 16.0 123 7.1
Wales 561 390 69.5 239 61.3 201 84.1 38 15.9 16 12 75.0 3 18.8 0 0.0 1 6.3 0 0.0
Northern Ireland 287 198 69.0 130 65.7 98 75.4 32 24.6 14 11 78.6 2 14.3 1 7.1 0 0.0 0 0.0
Scotland 1,744 1,134 65.0 858 75.7 594 69.2 264 30.8 62 33 53.2 8 12.9 3 4.8 13 21.0 5 8.1
PHE Region/Centre
North of England 6,177 3,739 60.5 2,680 71.7 1,767 65.9 913 34.1 240 133 55.4 47 19.6 15 6.3 33 13.8 12 5.0
North East 566 401 70.8 284 70.8 218 76.8 66 23.2 22 11 50.0 6 27.3 3 13.6 2 9.1 0 0.0
Cumbria and Lancashire 798 458 57.4 309 67.5 205 66.3 104 33.7 29 13 44.8 9 31.0 2 6.9 3 10.3 2 6.9
Yorkshire and Humber 2,483 1,445 58.2 1,067 73.8 750 70.3 317 29.7 85 49 57.6 17 20.0 5 5.9 9 10.6 5 5.9
Greater Manchester 1,882 1,138 60.5 798 70.1 602 75.4 196 24.6 57 36 63.2 10 17.5 3 5.3 5 8.8 3 5.3
Cheshire and Merseyside 448 297 66.3 222 74.7 186 83.8 36 16.2 15 11 73.3 3 20.0 0 0.0 1 6.7 0 0.0
Midlands and East of England 7,873 4,665 59.3 3,879 83.2 2,162 55.7 1,717 44.3 418 211 50.5 73 17.5 47 11.2 62 14.8 25 6.0
East Midlands 1,641 964 58.7 808 83.8 548 67.8 260 32.2 77 43 55.8 15 19.5 4 5.2 11 14.3 4 5.2
West Midlands 3,943 2,279 57.8 1,898 83.3 1,026 54.1 872 45.9 202 101 50.0 37 18.3 29 14.4 22 10.9 13 6.4
Anglia and Essex 1,034 628 60.7 528 84.1 423 80.1 105 19.9 41 27 65.9 10 24.4 2 4.9 2 4.9 0 0.0
South Midlands and
Hertfordshire1,255 794 63.3 645 81.2 486 75.3 159 24.7 51 29 56.9 11 21.6 5 9.8 5 9.8 1 2.0
London 13,118 7,881 60.1 6,704 85.1 3,510 52.4 3,194 47.6 767 389 50.7 168 21.9 65 8.5 98 12.8 47 6.1
South of England 4,179 2,550 61.0 2,109 82.7 1,408 66.8 701 33.2 219 124 56.6 46 21.0 19 8.7 23 10.5 7 3.2
Sussex, Surrey and Kent 1,290 830 64.3 692 83.4 502 72.5 190 27.5 68 42 61.8 15 22.1 2 2.9 9 13.2 0 0.0
Thames Valley 1,167 704 60.3 594 84.4 458 77.1 136 22.9 52 36 69.2 9 17.3 4 7.7 3 5.8 0 0.0
Wessex 648 387 59.7 327 84.5 258 78.9 69 21.1 23 16 69.6 4 17.4 1 4.3 1 4.3 1 4.3
Devon, Cornwall and Somerset 321 206 64.2 169 82.0 125 74.0 44 26.0 12 7 58.3 2 16.7 1 8.3 1 8.3 1 8.3
Avon, Gloucestershire and
Wiltshire753 423 56.2 327 77.3 249 76.1 78 23.9 25 12 48.0 7 28.0 1 4.0 5 20.0 0 0.0
5-9 ≥102 3 4
Culture
confirmed cases
Culture
confirmed cases
with a strain
type*
Number of cases
with a unique
strain
Number of cases
clustered**Number and proportion of clusters by cluster size
* Culture confirmed cases with a MIRU-VNTR profile with at least 23 complete loci ** Clustered cases are clustered with each other within the same geographical area ‡ The number of cases clustered in the UK is lower than the sum of all clustered cases in the four countries because it includes clusters that span more than
one country. The number of clusters in the UK is higher than the sum of all clusters in the four countries because it includes clusters that span more than one country. § The number of clusters in England is higher than the sum of all PHEC clusters because it includes clusters that span more than PHEC

Tuberculosis in the UK: 2014 report
36
Clustering by year, 2010-2013
The proportion of cases that clustered with at least one other case within the four year period
2010-2013 was relatively stable between 2010 and 2013 (range 52.5 to 55.1) (Table A3.2). The
number of new clusters that formed each year7 was 395 in 2010, 523 in 2011, 557 in 2011 and
379 in 2013. It is difficult to interpret changes in the proportion of cases that cluster and the
number of new clusters that form each year when only four year’s data are available. Cases
within the first year of the time period do not have the opportunity to cluster with cases in
previous years, and cases in the final year do not have the opportunity to cluster with cases in
future years.
Cluster size
Over the four year period of 2010 to 2013, there were a total of 1,854 clusters, with a median
cluster size of three cases (range 2-166). The majority of clusters (76.1%, 1,411/1,854) were
small in size (<5 cases), with 46.3% (858/1854) of clusters having only two cases in the cluster.
A further 16.5% (306) of clusters were medium sized (5-9 cases), and 7.4% (137) were large
(>10 cases), of which twelve clusters (0.6%) were very large (>50 cases) (Table 3.1, Figure
3.2).
Figure 3.2 Proportion of clusters by size, 2010-2013
7 A new cluster forms at the point when a second case is notified with the same MIRU-VNTR strain type as an
existing case
Tuberculosis in the UK: 2014 report
37
Descriptive epidemiology of clusters
The proportion of cases that clustered within the four year time period 2010-2013 varied
considerably by country of birth. The proportion of UK born cases that clustered was 65.6%
(2,683/4,088) compared to 49.5% in non-UK born cases (Table 3.2).
Table 3.2: Number of tuberculosis cases and proportion of clustering stratified by place of birth, 2010-2013
Notified cases
Culture confirmed cases
Strain typed cases*
Unique cases Clustered cases
Number of clusters**
n n % n % n % n % n
Total ‡ 33,942 20,560 60.6 16,602 80.7 7,712 46.5 8,890 53.5 1,854
UK born § 8,713 4,896 56.2 4,088 83.5 1,405 34.4 2,683 65.6 909
Non-UK born ◊
23,875 14,844 62.2 11,909 80.2 6,016 50.5 5,893 49.5 1,625
* Culture confirmed cases with a MIRU-VNTR profile with at least 23 complete loci **The number of clusters in the UK born plus the non-UK born is greater than the total number of clusters as some clusters contain both UK born and non-UK born cases
‡ The number of cases in the UK is higher than the sum UK born and non-UK born as 605 strain type
cases have unknown place of birth §Number of clusters with at least one UK born person in the cluster ◊ Number of clusters with at least one non-UK born person in the cluster
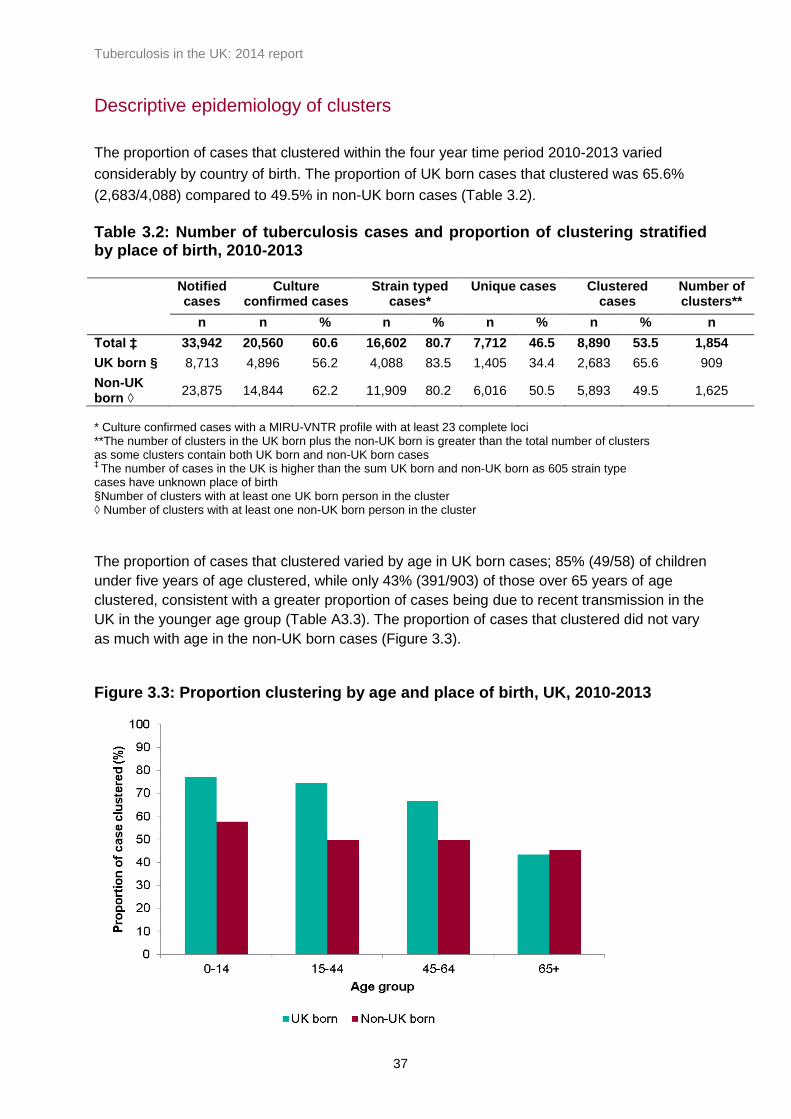
The proportion of cases that clustered varied by age in UK born cases; 85% (49/58) of children
under five years of age clustered, while only 43% (391/903) of those over 65 years of age
clustered, consistent with a greater proportion of cases being due to recent transmission in the
UK in the younger age group (Table A3.3). The proportion of cases that clustered did not vary
as much with age in the non-UK born cases (Figure 3.3).
Figure 3.3: Proportion clustering by age and place of birth, UK, 2010-2013
Tuberculosis in the UK: 2014 report
38
Out of the 1,854 clusters, 9% (167) of clusters contained only UK born cases, 51% (945) of
clusters contained only non-UK born cases, and 40% (742) had a mix of UK born and non-UK
born cases (Table 3.3). More than a quarter of clusters (495/1,854) had at least one case with
a social risk factor, and 9.9% (184/1,854) of clusters had at least 50% of cases with at least
one social risk factor. Having more than 50% of cases with at least one social risk factor
occurred in one quarter of clusters consisting of exclusively UK born cases (41/167),
compared to only 7.0% of clusters of exclusively non-UK born cases (66/945).
Thirty four percent (628) of clusters consisted of exclusively pulmonary cases, and 8.5% (157)
of exclusively extra-pulmonary cases, with the remainder having both pulmonary and extra-
pulmonary cases. Clusters consisting of exclusively UK born cases were more likely to be
exclusively pulmonary (72.5%, 121/167) and almost all included at least one pulmonary case
(97.6%, 163/167). A higher proportion of clusters containing only non-UK born cases had
extra-pulmonary disease only (131/945, 13.9%).
Five percent (97) of clusters had two or more isoniazid resistant cases, and 1% (19) had two
or more MDR-TB cases.

Tuberculosis in the UK: 2014 report
39
Table 3.3: Descriptive epidemiology of clusters, stratified by clusters with only UK born cases, clusters with only non-UK born cases, and clusters with both UK and non-UK born cases All clusters Clusters with
only UK born cases
Clusters with only non-UK born
cases
Clusters with both UK born and non-UK born
clusters
n % n % n % n %
Number of cases clustered
n 8,890
502
2823
5565
Number of clusters n 1,854
167
945
742
Cluster size
median (range) 3 (2-166)
2 (2-13)
2 (2-16)
4 (2-166)
Social Risk factors*
Clusters with at least 50% of cases with at least one risk factor
184 9.9 41 24.6 66 7.0 77 10.4
Site of disease*
Clusters where all cases have pulmonary disease (with or without extrapulmonary)
628 33.9 121 72.5 268 28.4 239 32.2
Clusters where all cases have extrapulmonary disease
157 8.5 4 2.4 131 13.9 22 3.0
Clusters with a mix of cases with pulmonary and extrapulmonary disease
1,069 57.7 42 25.1 546 57.8 481 64.8
*proportions are out of the number of clusters

Tuberculosis in the UK: 2014 report
40
Lineage of strains
Lineage was derived from the MIRU-VNTR for cases with strain types; 36.5% of cases (6,059)
were of Euro-American lineage, followed by 25.7% (4,267) Central Asian strain (CAS), 12.2%
(2,024) East African Indian (EAI), 5.3% (875) Beijing, 0.8% (125) M.africanum, 0.5% (74)
M.bovis, and 19.1% (3,178) had no lineage assigned (Figure 3.4).
The distribution of different lineages varied considerably by place of birth (Figure 3.4 and 3.5).
Figure 3.4: Lineage of cases with MIRU-VNTR strain types 2010-2013*
*as determined by MIRU-VNTR
n=4,088 n=11,909

Tuberculosis in the UK: 2014 report
41
Figure 3.5: Lineage of cases with MIRU-VNTR strain types as determined by MIRU-VNTR by country of birth for the top 15 countries of birth by burden of TB in the, UK, 2010-2013
n=3,397 n=1,910 n=454 n=463
n=271 n=131 n=164 n=173
n=795 n=193 n=193 n=333
n=200
n=168
n=366

Tuberculosis in the UK: 2014 report
42
4. Tuberculosis case outcomes
Key messages
the proportion of drug sensitive cases with an expected treatment duration of less than 12
months who had completed treatment by 12 months has improved gradually over the past
decade, reaching 82.8% of those notified in 2013
the proportion of drug sensitive cases who died has decreased over the last 10 years, to
stabilise at 5.0% in 2011 and 2012
drug sensitive cases with at least one social risk factor have worse treatment outcomes
than those without; 6.1% of those notified in 2012 died and 7.1% were lost to follow up
the proportion of drug resistant TB cases who completed treatment by 24 months was low
(48.0%), with many still on treatment (22.5%) or lost to follow up (19.4%)
Drug sensitive cohort, 2003-2012
In line with the revised 2013 World Health Organization (WHO) TB outcome definitions, for the
purposes of TB outcome reporting the drug sensitive cohort is defined as all TB cases,
excluding those with rifampicin resistant TB or MDR-TB (initial or amplified), or non-culture
confirmed cases treated as MDR-TB [4].
In this report, treatment outcomes for drug sensitive TB cases are reported separately for the
following groups:
for cases with an expected duration of treatment less than 12 months, treatment
outcomes at 12 months are reported. This group excludes cases with CNS disease,
who have an expected duration of treatment of 12 months. In addition, those with
spinal, cryptic disseminated or miliary disease are excluded from this group, as CNS
involvement cannot be reliably ruled out for the purposes of reporting.
for cases with CNS, spinal, cryptic disseminated or miliary disease, the last recorded
treatment outcome is reported.
Data on deaths and loss to follow up at last recorded outcome are presented for the entire
drug sensitive cohort.
Additional data validation has been conducted this year, using data on the date of treatment
start and the date of treatment completion to validate duration of treatment (see Appendix II-
Methods for further details).
TB outcomes reported using these new cohort definitions and validation methods will not be
directly comparable with outcome data presented in previous reports. Within this report,
treatment outcomes for all cases notified from 20 03-2012 have been calculated using these
new definitions, so that trends can be monitored.

Tuberculosis in the UK: 2014 report
43
TB outcomes for drug sensitive cohort with expected duration of treatment
less than 12 months
Information on TB outcome 12 months after starting treatment was available for 97.9%
(7,615/7,774) of cases in this cohort notified in 2012 (Table 4.1).
Table 4.1: TB outcome at 12 months for drug sensitive cases with expected treatment duration < 12 months*, UK, 2012
Treatment outcome n %
Completed 6,438 82.8
Died 345 4.4
Lost to follow up 307 4.0
Still on treatment 446 5.7
Stopped 79 1.0
Not evaluated** 159 2.1
Total 7,774
* Excludes initial and amplified to rifampicin resistant TB and MDR-TB cases and MDR-TB treated cases and those with CNS, spinal, miliary or cryptic disseminated TB ** Not evaluated includes missing, unknown and transferred out
The proportion of cases in this cohort notified in 2012 who completed treatment within 12
months was 82.8% (6,438/7,774), compared to 81.4% (6,459/7,933) in 2011 (Figure 4.1, Table
A4.1). A further 4.0% (313) of cases are known to have completed treatment after 12 months
bringing overall treatment completion for 2012 cases to 86.8% (6,751/7,774) (Table A4.2).
Treatment duration was recorded for 71.4% (4,819/6,751) of the 2012 cases who completed
treatment, with a median time to complete treatment of 191 days (Table A4.3); 73.7%
(3,552/4,819) completed treatment between 6 and 7 months after treatment start (Figure 4.2).
Figure 4.1: Treatment completion at 12 months for drug sensitive cases with expected treatment duration < 12 months*, UK, 2003-2012
* Excludes initial and amplified to rifampicin resistant TB and MDR-TB cases and MDR-TB treated cases and those with CNS, spinal, miliary or cryptic disseminated TB
Tuberculosis in the UK: 2014 report
44
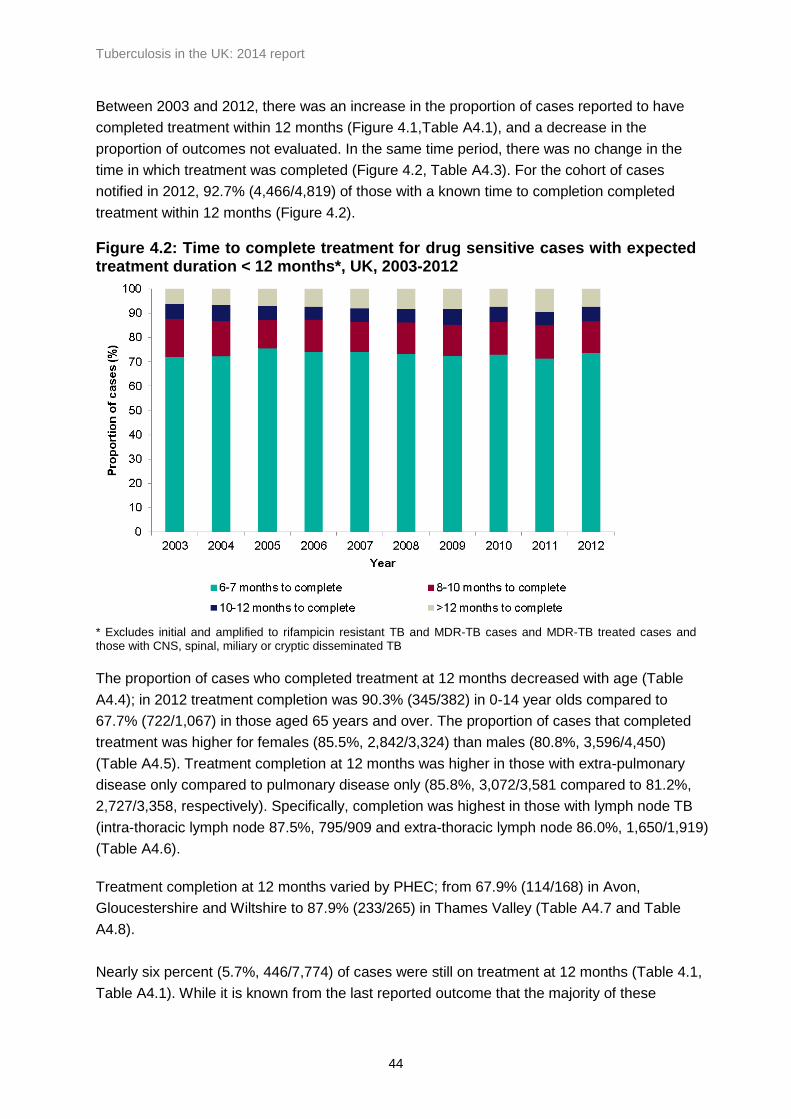
Between 2003 and 2012, there was an increase in the proportion of cases reported to have
completed treatment within 12 months (Figure 4.1,Table A4.1), and a decrease in the
proportion of outcomes not evaluated. In the same time period, there was no change in the
time in which treatment was completed (Figure 4.2, Table A4.3). For the cohort of cases
notified in 2012, 92.7% (4,466/4,819) of those with a known time to completion completed
treatment within 12 months (Figure 4.2).
Figure 4.2: Time to complete treatment for drug sensitive cases with expected treatment duration < 12 months*, UK, 2003-2012
* Excludes initial and amplified to rifampicin resistant TB and MDR-TB cases and MDR-TB treated cases and those with CNS, spinal, miliary or cryptic disseminated TB
The proportion of cases who completed treatment at 12 months decreased with age (Table
A4.4); in 2012 treatment completion was 90.3% (345/382) in 0-14 year olds compared to
67.7% (722/1,067) in those aged 65 years and over. The proportion of cases that completed
treatment was higher for females (85.5%, 2,842/3,324) than males (80.8%, 3,596/4,450)
(Table A4.5). Treatment completion at 12 months was higher in those with extra-pulmonary
disease only compared to pulmonary disease only (85.8%, 3,072/3,581 compared to 81.2%,
2,727/3,358, respectively). Specifically, completion was highest in those with lymph node TB
(intra-thoracic lymph node 87.5%, 795/909 and extra-thoracic lymph node 86.0%, 1,650/1,919)
(Table A4.6).
Treatment completion at 12 months varied by PHEC; from 67.9% (114/168) in Avon,
Gloucestershire and Wiltshire to 87.9% (233/265) in Thames Valley (Table A4.7 and Table
A4.8).
Nearly six percent (5.7%, 446/7,774) of cases were still on treatment at 12 months (Table 4.1,
Table A4.1). While it is known from the last reported outcome that the majority of these
Tuberculosis in the UK: 2014 report
45
(70.2%, 313/446) eventually completed treatment, the reason for still being on treatment 12
months after starting was not recorded for the majority of cases (60.3%, 269/446). Where the
reason was recorded, 49.7% (88/177) were known to be on a regimen exceeding 12 months,
although initial drug resistance was only reported for 28.4% (25/88) of these cases. Fifteen
percent (27/177) were still on treatment due to intolerance or side effects, and 9.6% (17/177)
had been non-compliant with treatment.
TB outcomes for drug sensitive cohort with CNS, spinal, miliary or cryptic
disseminated TB
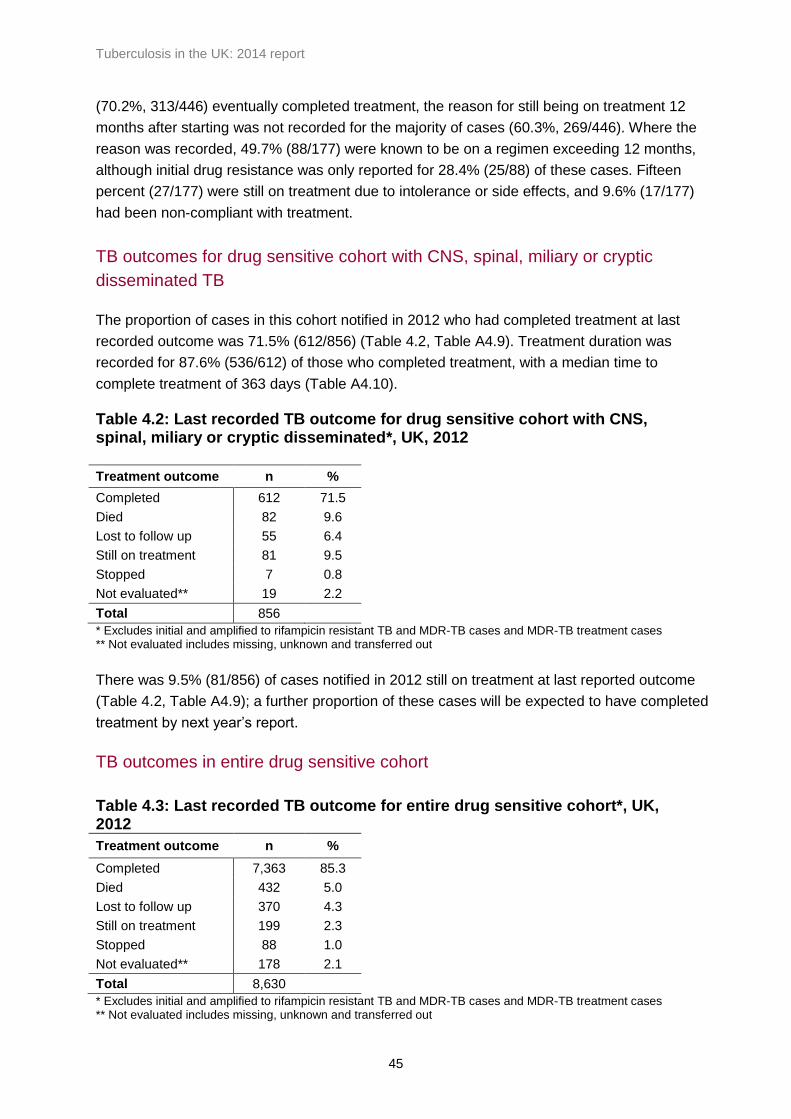
The proportion of cases in this cohort notified in 2012 who had completed treatment at last
recorded outcome was 71.5% (612/856) (Table 4.2, Table A4.9). Treatment duration was
recorded for 87.6% (536/612) of those who completed treatment, with a median time to
complete treatment of 363 days (Table A4.10).
Table 4.2: Last recorded TB outcome for drug sensitive cohort with CNS, spinal, miliary or cryptic disseminated*, UK, 2012
Treatment outcome n %
Completed 612 71.5
Died 82 9.6
Lost to follow up 55 6.4
Still on treatment 81 9.5
Stopped 7 0.8
Not evaluated** 19 2.2
Total 856
* Excludes initial and amplified to rifampicin resistant TB and MDR-TB cases and MDR-TB treatment cases ** Not evaluated includes missing, unknown and transferred out
There was 9.5% (81/856) of cases notified in 2012 still on treatment at last reported outcome
(Table 4.2, Table A4.9); a further proportion of these cases will be expected to have completed
treatment by next year’s report.
TB outcomes in entire drug sensitive cohort
Table 4.3: Last recorded TB outcome for entire drug sensitive cohort*, UK, 2012
Treatment outcome n %
Completed 7,363 85.3
Died 432 5.0
Lost to follow up 370 4.3
Still on treatment 199 2.3
Stopped 88 1.0
Not evaluated** 178 2.1
Total 8,630
* Excludes initial and amplified to rifampicin resistant TB and MDR-TB cases and MDR-TB treatment cases ** Not evaluated includes missing, unknown and transferred out
Tuberculosis in the UK: 2014 report
46
Deaths in drug sensitive cohort
Between 2003 and 2011, the proportion of cases who were reported to have died at the last
reported outcome among all drug sensitive TB cases (including those with CNS, spinal, miliary
or cryptic disseminated TB) decreased year on year, from 6.5% to 5.0% (Table A4.11). In
2012 the proportion remained stable at 5.0% (432/8,630 respectively) (Table 4.3). In 2012, TB
caused or contributed to 32.4% (140/432) of deaths, was incidental to death in 22.7%
(98/432), and the relationship between TB and death was unknown in 44.9% (194/432).
Among those reported to have died, 17.4% (75/432) were diagnosed post mortem. The
majority of those who died were 65 years or older (64.6%, 279). More than two thirds of those
who died were male (69.4%, 300). By site of disease, death occurred most frequently in those
with miliary TB (18.4%, 39/212), and CNS TB (CNS meningitis 15.3%, 29/189 and CNS other
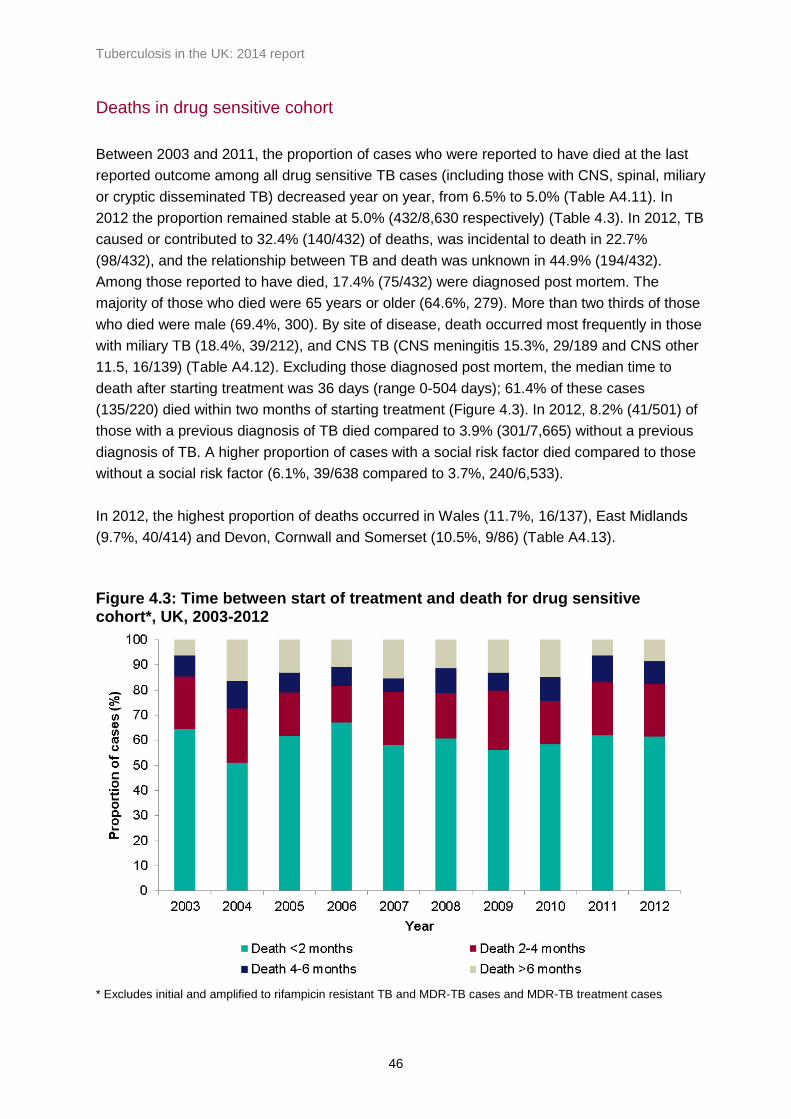
11.5, 16/139) (Table A4.12). Excluding those diagnosed post mortem, the median time to
death after starting treatment was 36 days (range 0-504 days); 61.4% of these cases
(135/220) died within two months of starting treatment (Figure 4.3). In 2012, 8.2% (41/501) of
those with a previous diagnosis of TB died compared to 3.9% (301/7,665) without a previous
diagnosis of TB. A higher proportion of cases with a social risk factor died compared to those
without a social risk factor (6.1%, 39/638 compared to 3.7%, 240/6,533).
In 2012, the highest proportion of deaths occurred in Wales (11.7%, 16/137), East Midlands
(9.7%, 40/414) and Devon, Cornwall and Somerset (10.5%, 9/86) (Table A4.13).
Figure 4.3: Time between start of treatment and death for drug sensitive cohort*, UK, 2003-2012
* Excludes initial and amplified to rifampicin resistant TB and MDR-TB cases and MDR-TB treatment cases
Tuberculosis in the UK: 2014 report
47
Loss to follow up in entire drug sensitive cohort
In 2012, 4.3% (370/8,630) of all drug sensitive TB cases (including those with CNS, spinal,
miliary or cryptic disseminated TB) were lost to follow up at the last reported outcome, 85.9%
(318/370), of which were born abroad (Table 4.3). Where the reason for loss to follow up was
recorded, 67.6% (198/293) of those born abroad had left the UK (Table A4.14). Eighty four
percent (311/370) of lost to follow up cases occurred in the 15-44 age group, a total of 6.0%
(311/5,222) of this age group were lost to follow up (Table A4.15). Overall, 7.1% (45/638) of
those with at least one social risk factor were lost to follow up, compared to on 3.7%
(239/6,533) in those without a social risk factor. Seven cases were known to have been lost to
follow up before any treatment commenced. Fifty three percent (196/370) of cases lost to
follow up had pulmonary disease.
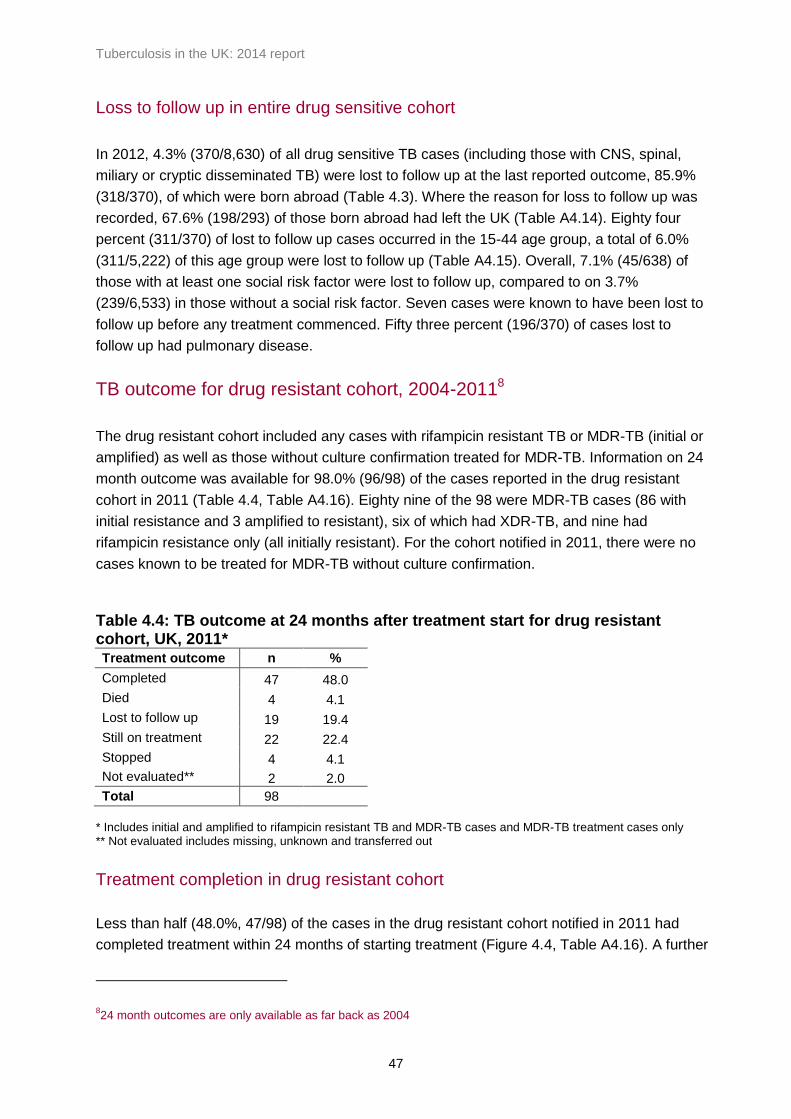
TB outcome for drug resistant cohort, 2004-20118
The drug resistant cohort included any cases with rifampicin resistant TB or MDR-TB (initial or
amplified) as well as those without culture confirmation treated for MDR-TB. Information on 24
month outcome was available for 98.0% (96/98) of the cases reported in the drug resistant
cohort in 2011 (Table 4.4, Table A4.16). Eighty nine of the 98 were MDR-TB cases (86 with
initial resistance and 3 amplified to resistant), six of which had XDR-TB, and nine had
rifampicin resistance only (all initially resistant). For the cohort notified in 2011, there were no
cases known to be treated for MDR-TB without culture confirmation.
Table 4.4: TB outcome at 24 months after treatment start for drug resistant cohort, UK, 2011* Treatment outcome n %
Completed 47 48.0
Died 4 4.1
Lost to follow up 19 19.4
Still on treatment 22 22.4
Stopped 4 4.1
Not evaluated** 2 2.0
Total 98
* Includes initial and amplified to rifampicin resistant TB and MDR-TB cases and MDR-TB treatment cases only ** Not evaluated includes missing, unknown and transferred out
Treatment completion in drug resistant cohort
Less than half (48.0%, 47/98) of the cases in the drug resistant cohort notified in 2011 had
completed treatment within 24 months of starting treatment (Figure 4.4, Table A4.16). A further
824 month outcomes are only available as far back as 2004

Tuberculosis in the UK: 2014 report
48
16 cases are known to have completed treatment after 24 months, bringing overall treatment
completion for cases notified in 2011 to 64.3% (63/98). This is lower than in previous years,
although six cases were still on treatment when outcome was last measured (Table A4.17).
Figure 4.4: Treatment completion for drug resistant TB cases, UK, 2004-2011*
* Includes initial and amplified to rifampicin resistant TB and MDR-TB cases and MDR-TB treatment cases only Data labels display the number of cases completing treatment
Treatment duration was recorded for 90.5% (57/63) of the drug resistant cohort notified in
2011 known to have completed treatment, with a median time to complete treatment of 698
days (23 months) (Table A4.18). Of the six XDR-TB cases notified in 2011, two had completed
treatment, two were still on treatment, one had died and one was lost to follow up at the last
recorded outcome.
Twenty two percent (22/98) of cases were still on treatment at 24 months, with a planned
course of treatment exceeding 24 months for 45.5% (10/22) of cases. The last recorded
outcome shows that the majority (72.7%, 16/22) of those still on treatment at 24 months went
on to complete treatment.
Deaths in drug resistant cohort
Four of the drug resistant cases notified in 2011 died by their last recorded outcome, one of
whom was a case diagnosed post mortem. All four had pulmonary TB. The case diagnosed
post mortem was aged 45-64 and the relationship between TB and death was unknown. The
other three deaths were all aged 15-44, and TB caused or contributed to their deaths. All four

Tuberculosis in the UK: 2014 report
49
cases were born abroad. For two of the cases who died, the time between treatment start and
death was recorded; both died more than a year after starting treatment. One case had a
history of homelessness and alcohol use and a second had a history of drug misuse. Although
the proportion of drug resistant cases who died has fluctuated over time, in the past three
years the proportion was lower than for cases notified in 2007 and 2008, and similar to the
proportion recorded in the drug sensitive cohort.
Loss to follow up in the drug resistant cohort
The most common reason for drug resistant cases not completing treatment (based on last
recorded outcome) was loss to follow up. In 2011, 19.4% (19/98) of drug resistant TB cases
were lost to follow up; all were born abroad and 78.9% (15/19) were documented to have been
lost to follow up abroad. Twenty percent (17/85) of cases aged 15-44 were lost to follow up,
with this age group accounting for 89.5% (17/19) of all cases lost to follow up. The majority
(73.7%, 14/19) of cases lost to follow up had pulmonary disease. The proportion of cases lost
to follow up in 2011 was higher than in previous years (Table A4.19).

Tuberculosis in the UK: 2014 report
50
5. Conclusions
The incidence of TB in the UK in 2013 continues to be high compared to most other Western
European countries [5]. TB continues to disproportionately affect the most deprived
communities, with 70% of all TB cases coming from the 40% most deprived areas. TB is
concentrated in large urban centres, with rates in London, Leicester, Birmingham, Luton,
Manchester and Coventry more than three times the national average. Nearly three quarters of
all TB cases occur in those born abroad, mainly in high TB burden countries, and 10% of all
TB cases had at least one social risk factor (a history of alcohol or drug misuse, homelessness
or imprisonment).
Following a decline in TB incidence throughout most of the twentieth century, TB rates in the
UK increased from the early 1980s until the mid-2000s, and have been at a high but relatively
stable level ever since [6]. The overall incidence of TB in 2013, of 12.3 per 100,000 population,
has shown a small decline over the past two years, and is currently at a similar level to 2003.
The small drop in TB rates in the past two years is due to a decline in TB in the non-UK born
population, and is likely to be influenced by a number of factors, including changes in
migration patterns, and the impact of interventions to improve the control of TB, both in the UK
and abroad.
The decline in the number of TB cases born in countries in sub-Saharan Africa and, more
recently, the Indian subcontinent, is likely to in part reflect changes in the countries of origin of
migrants to the UK, with reductions in the numbers of migrants from high and very high TB
burden countries. In addition, the risk of TB in new migrants from such countries may have
decreased, as WHO estimates a reduction in TB incidence in the majority of these countries in
the past decade [7]. The introduction of pre-entry screening for active TB is likely to have led
to a reduction in the small proportion of pulmonary TB cases diagnosed shortly after arrival in
long term migrants from high TB incidence countries. While this decline is welcome, it is
important to recognise that the vast majority of TB cases in the non-UK born population (85%)
occur among settled migrants rather than new entrants. Tackling the reactivation of latent TB
in such migrants will require systematic implementation of screening and treatment of latent
TB infection.
In contrast to the decline in TB incidence in the non-UK born population, the rates of TB in the
UK born population have been stable over the past decade. However, it is encouraging to see
that the incidence in UK born children aged under 15 years has shown a small decline in the
past five years, which suggests some reduction in recent acquisition of TB in the UK.
The proportion of cases with first line drug resistance has remained relatively stable over the
past decade at around 7%. The proportion of cases with MDR-TB increased from 2005-2011,
and has been stable over the past three years at 1.6%. While the largest number of MDR-TB

Tuberculosis in the UK: 2014 report
51
cases were born in India, Pakistan and Somalia, a particularly high proportion of the small
numbers of TB cases born in the Ukraine, Lithuania and Latvia were found to have MDR-TB.
This reflects the high proportion of cases with MDR-TB in many countries of the former Soviet
Union [7]. Clinicians should take into account the risk of MDR-TB in different countries of origin
when making initial infection control and treatment decisions.
The proportion of pulmonary TB cases that had a delay of more than four months between
symptom onset and treatment start has shown a small increase over the past three years, with
more than a quarter of patients having a delay of greater than four months in 2013. This
highlights the need to improve awareness of TB and to tackle obstacles to accessing services,
especially for vulnerable groups. With current levels of data completeness on the date of first
presentation to health services, it is not yet possible to determine what proportion of this delay
is due to late presentation to health services, and what proportion due to a delay in making the
diagnosis within the health sector. Improvements in data completeness in the future should
enable a better understanding of this delay, and help inform better targeting of awareness
raising activities.
It is encouraging that the proportion of drug sensitive TB cases that completed treatment by 12
months, an indicator of the quality of TB services, has continued to gradually improve over the
past decade, and the proportion of patients who died has decreased. The proportion of cases
who died or were lost to follow up is higher in those with social risk factors, highlighting the
need for extra support for vulnerable patients with complex needs. In contrast to the
improvements in treatment outcomes in the drug sensitive cohort, the proportion of drug
resistant cases that completed treatment at 24 months has not improved, for the cohort
notified in 2011, nearly a quarter were still on treatment and 20% were lost to follow up at 24
months. This highlights the complexity of treating patients with MDR-TB, and the need to
ensure access to specialist advice and comprehensive support services to meet the social as
well as clinical needs of such patients.
Public Health England and NHS England will shortly publish the Collaborative TB Strategy for
England 2015-2020, which sets out the improvements that need to be achieved across 10 key
areas to bring about a sustained decline in TB in England, and the mechanisms by which
these should be achieved. Improvements in TB control across the country, particularly among
the most vulnerable groups, will require the social and economic determinants of the disease
to be addressed, in addition to the provision of strong and effective public health and clinical
services. Following implementation of the Strategy, we look forward to monitoring the
improvements that we hope will be achieved over the next decade.
Tuberculosis in the UK: 2014 report
52
References
1. UK TB Screening website. https://www.gov.uk/tuberculosis-screening#pre-entry-tb-screening-for-migrants
2. TB Strain Typing Cluster Investigation Handbook, 3rd Edition, 2014.
http://webarchive.nationalarchives.gov.uk/20140714084352/http://www.hpa.org.uk/web
c/HPAwebFile/HPAweb_C/1317140774833
3. Glynn JR; Vynnycky E; Fine PE. Influence of sampling on estimates of clustering and
recent transmission of Mycobacterium tuberculosis derived from DNA fingerprinting
techniques. Am J Epidemiol. 1999;149:366-71.
4. Definitions and reporting framework for tuberculosis – 2013 revision. WHO 2013.
http://apps.who.int/iris/bitstream/10665/79199/1/9789241505345_eng.pdf
5. European Centre for Disease Prevention and Control (ECDC)/WHO Regional Office for
Europe. Tuberculosis surveillance and monitoring in Europe 2014. Stockholm: ECDC;
2014.
http://www.ecdc.europa.eu/en/publications/_layouts/forms/Publication_DispForm.aspx?
List=4f55ad51-4aed-4d32-b960-af70113dbb90&ID=1050
6. Tuberculosis Update, Health Protection Agency, 2013 http://webarchive.nationalarchives.gov.uk/20140714084352/http://www.hpa.org.uk/webc/HPAwebFile/HPAweb_C/1317138493033
7. World Health Organization, Global Tuberculosis Report, WHO 2013.
http://apps.who.int/iris/bitstream/10665/91355/1/9789241564656_eng.pdf?ua=1
8. Potz N, Powell D, Pebody R et al (2006) Development of a method to link infection and mortality data, poster presentation, Health Protection Agency Annual Conference, Sept 2006, Warwick, http://webarchive.nationalarchives.gov.uk/20140714084352/http://www.hpa.org.uk/webc/HPAwebFile/HPAweb_C/1200660056163
9. Department of Health. Tuberculosis prevention and treatment: a toolkit for planning,
commissioning and delivering high-quality services in England, 2007.
http://webarchive.nationalarchives.gov.uk/20130107105354/http:/www.dh.gov.uk/en/Pu
blicationsandstatistics/Publications/PublicationsPolicyAndGuidance/DH_075621

Tuberculosis in the UK: 2014 report
53
Appendix I. Supplementary tables
Table A1.1: Tuberculosis case reports, rates and annual percentage change, UK, 2004-2013
Year
Total Annual change
in case numbers (%)
Annual change in rate (%)
Place of birth
UK born Non-UK born
Number of cases
Rate per 100,000 (95% CI)
Number of cases
Rate per 100,000 (95% CI)
Number of cases
Rate per 100,000 (95% CI)
2004 7,594 12.7 (12.4 -13.0) - - 2171 4.0 (3.9 -4.2) 4789 92.8 (90.2 -95.5)
2005 8,290 13.8 (13.5 -14.1) 9.2% 13.0% 2142 4.0 (3.8 -4.1) 5411 98.0 (95.4 -100.6)
2006 8,314 13.7 (13.4 -14.0) 0.3% 0.3% 2049 3.8 (3.6 -4.0) 5429 91.2 (88.7 -93.6)
2007 8,268 13.6 (13.3 -13.9) -0.6% 0.3% 2118 3.9 (3.8 -4.1) 5445 84.4 (82.1 -86.6)
2008 8,495 13.8 (13.5 -14.1) 2.7% 5.5% 2175 4.0 (3.9 -4.2) 5742 85.5 (83.3 -87.8)
2009 8,878 14.4 (14.1 -14.7) 4.5% 4.2% 2282 4.2 (4.1 -4.4) 5982 85.6 (83.4 -87.8)
2010 8,398 13.5 (13.2 -13.8) -5.4% -2.4% 2115 3.9 (3.7 -4.1) 5837 81.8 (79.8 -84.0)
2011 8,923 14.1 (13.8 -14.4) 6.3% 8.5% 2224 4.1 (3.9 -4.3) 6335 84.3 (82.2 -86.4)
2012 8,729 13.7 (13.4 -14.0) -2.2% -2.5% 2271 4.2 (4.0 -4.3) 6174 80.6 (78.6 -82.6)
2013 7,892 12.3 (12.0 -12.6) -9.6% -10.4% 2103 3.8 (3.7 -4.0) 5529 69.7 (67.9 -71.6)
CI- confidence intervals

Tuberculosis in the UK: 2014 report
54
Table A1.2: TB case reports and rates by country, UK, 2004-2013
Year
Country
England Northern Ireland Scotland Wales Total
Number of cases
Rate per 100,000 (95% CI)
Number of cases
Rate per 100,000 (95% CI)
Number of cases
Rate per 100,000 (95% CI)
Number of cases
Rate per 100,000 (95% CI)
Number of cases
Rate per 100,000 (95% CI)
2004 6,934 13.8 (13.5 -14.2) 81 4.7 (3.8 -5.9) 392 7.7 (7.0 -8.5) 187 6.3 (5.4 -7.3) 7,594 12.7 (12.4 -13.0)
2005 7,665 15.2 (14.9 -15.5) 75 4.3 (3.4 -5.4) 365 7.1 (6.4 -7.9) 185 6.2 (5.4 -7.2) 8,290 13.8 (13.5 -14.1)
2006 7,689 15.1 (14.8 -15.5) 61 3.5 (2.7 -4.5) 381 7.4 (6.7 -8.2) 183 6.1 (5.3 -7.1) 8,314 13.7 (13.4 -14.0)
2007 7,585 14.8 (14.5 -15.2) 69 3.9 (3.0 -5.0) 410 7.9 (7.2 -8.7) 204 6.8 (5.9 -7.8) 8,268 13.6 (13.3 -13.9)
2008 7,814 15.2 (14.8 -15.5) 66 3.7 (2.9 -4.7) 447 8.6 (7.8 -9.4) 168 5.6 (4.7 -6.5) 8,495 13.8 (13.5 -14.1)
2009 8,119 15.7 (15.3 -16.0) 59 3.3 (2.5 -4.2) 486 9.3 (8.5 -10.2) 214 7.0 (6.1 -8.1) 8,878 14.4 (14.1 -14.7)
2010 7,677 14.7 (14.4 -15.0) 66 3.7 (2.8 -4.7) 503 9.6 (8.7 -10.4) 152 5.0 (4.2 -5.8) 8,398 13.5 (13.2 -13.8)
2011 8,284 15.6 (15.3 -16.0) 61 3.4 (2.6 -4.3) 447 8.4 (7.7 -9.3) 131 4.3 (3.6 -5.1) 8,923 14.1 (13.8 -14.4)
2012 8,099 15.1 (14.8 -15.5) 87 4.8 (3.8 -5.9) 405 7.6 (6.9 -8.4) 138 4.5 (3.8 -5.3) 8,729 13.7 (13.4 -14.0)
2013 7,290 13.5 (13.2 -13.8) 73 4.0 (3.1 -5.0) 389 7.3 (6.6 -8.1) 140 4.5 (3.8 -5.4) 7,892 12.3 (12.0 -12.6)
CI - confidence interval

Tuberculosis in the UK: 2014 report
55
Table A1.3: TB case reports and rates by PHE region and centre, England, 2004-2013
PHE Area
2004 2005 2006 2007 2008
Number of cases
Rate per 100,000 (95% CI)
Number of cases
Rate per 100,000 (95% CI)
Number of cases
Rate per 100,000 (95% CI)
Number of cases
Rate per 100,000 (95% CI)
Number of cases
Rate per 100,000 (95% CI)
North Of England 1,247 8.6 (8.2 -9.1) 1,432 9.9 (9.4 -10.4) 1,500 10.3 (9.8 -10.8) 1,564 10.7 (10.2 -11.2) 1,542 10.5 (10.0 -11.0)
North East 143 5.6 (4.7 -6.6) 132 5.2 (4.3 -6.1) 141 5.5 (4.6 -6.5) 197 7.7 (6.7 -8.8) 177 6.9 (5.9 -8.0)
Cumbria and Lancashire 172 8.9 (7.6 -10.4) 188 9.7 (8.4 -11.2) 163 8.4 (7.1 -9.8) 196 10.1 (8.7 -11.6) 172 8.8 (7.5 -10.2)
Yorkshire and the Humber 535 10.6 (9.7 -11.5) 557 10.9 (10.0 -11.8) 663 12.9 (11.9 -13.9) 633 12.3 (11.3 -13.3) 634 12.2 (11.3 -13.2)
Greater Manchester 343 13.5 (12.1 -15.0) 412 16.1 (14.6 -17.7) 407 15.8 (14.3 -17.4) 442 17.0 (15.5 -18.7) 455 17.4 (15.8 -19)
Cheshire and Merseyside 54 2.4 (1.8 -3.2) 143 6.4 (5.4 -7.5) 126 5.6 (4.6 -6.6) 96 4.2 (3.4 -5.1) 104 4.5 (3.7 -5.5)
Midlands and East of England
1,745 11.4 (10.8 -11.9) 1,927 12.4 (11.9 -13.0) 1,974 12.6 (12.1 -13.2) 1,888 12 (11.5 -12.6) 2,000 12.6 (12.1 -13.2)
East Midlands 344 9.4 (8.5 -10.5) 457 12.4 (11.3 -13.6) 500 13.5 (12.3 -14.7) 472 12.6 (11.5 -13.8) 421 11.2 (10.1 -12.3)
West Midlands 920 17.2 (16.1 -18.4) 921 17.1 (16 -18.3) 927 17.1 (16.0 -18.3) 929 17.0 (16.0 -18.2) 1,010 18.4 (17.3 -19.5)
Anglia and Essex 219 5.6 (4.9 -6.4) 225 5.7 (5.0 -6.5) 231 5.8 (5.1 -6.6) 212 5.3 (4.6 -6.1) 278 6.9 (6.1 -7.8)
South Midlands and Hertfordshire
262 10.5 (9.3 -11.9) 324 12.9 (11.5 -14.4) 316 12.5 (11.1 -13.9) 275 10.7 (9.5 -12.1) 291 11.2 (10.0 -12.6)
London 3,111 41.9 (40.4 -43.4) 3,449 45.9 (44.4 -47.4) 3,328 43.8 (42.3 -45.3) 3,234 42 (40.6 -43.5) 3,363 43 (41.6 -44.5)
South of England 823 6.4 (5.9 -6.8) 850 6.5 (6.1 -7.0) 885 6.7 (6.3 -7.2) 896 6.7 (6.3 -7.2) 906 6.8 (6.3 -7.2)
Kent, Surrey and Sussex 220 5.2 (4.6 -6.0) 211 5.0 (4.3 -5.7) 276 6.5 (5.7 -7.3) 261 6.0 (5.3 -6.8) 306 7.0 (6.3 -7.9)
Thames Valley 231 12.1 (10.6 -13.8) 280 14.5 (12.9 -16.4) 229 11.8 (10.3 -13.4) 258 13.2 (11.6 -14.9) 236 11.9 (10.5 -13.6)
Wessex 146 5.8 (4.9 -6.8) 144 5.7 (4.8 -6.7) 149 5.9 (4.9 -6.9) 145 5.6 (4.8 -6.6) 122 4.7 (3.9 -5.6)
Devon, Cornwall and Somerset
78 3.7 (2.9 -4.6) 68 3.2 (2.5 -4.0) 61 2.8 (2.2 -3.6) 70 3.2 (2.5 -4.1) 73 3.4 (2.6 -4.2)
Avon, Gloucestershire and Wiltshire
148 6.7 (5.6 -7.8) 147 6.6 (5.5 -7.7) 170 7.5 (6.4 -8.7) 162 7.1 (6.0 -8.3) 169 7.3 (6.3 -8.5)
CI - confidence interval

Tuberculosis in the UK: 2014 report
56
Table A1.3: TB case reports and rates by PHE region and centre, England, 2004-2013 cont.
CI - confidence interval
PHE Area
2009 2010 2011 2012 2013
Number of cases
Rate per 100,000 (95% CI)
Number of cases
Rate per 100,000 (95% CI)
Number of cases
Rate per 100,000 (95% CI)
Number of cases
Rate per 100,000 (95% CI)
Number of cases
Rate per 100,000 (95% CI)
North Of England 1,652 11.2 (10.6 -11.7) 1,588 10.7 (10.2 -11.2) 1,613 10.8 (10.3 -11.3) 1,539 10.3 (9.8 -10.8) 1,437 9.5 (9.1 -10.1)
North East 165 6.4 (5.5 -7.5) 150 5.8 (4.9 -6.8) 131 5.0 (4.2 -6.0) 165 6.3 (5.4 -7.4) 120 4.6 (3.8 -5.5)
Cumbria and Lancashire 180 9.2 (7.9 -10.7) 193 9.9 (8.5 -11.4) 212 10.8 (9.4 -12.4) 212 10.8 (9.4 -12.3) 181 9.2 (7.9 -10.6)
Yorkshire and the Humber 690 13.2 (12.2 -14.2) 628 12.0 (11.0 -12.9) 664 12.6 (11.6 -13.5) 595 11.2 (10.3 -12.1) 596 11.2 (10.3 -12.1)
Greater Manchester 520 19.7 (18 -21.5) 490 18.4 (16.8 -20.1) 511 19 (17.4 -20.8) 457 16.9 (15.4 -18.5) 424 15.6 (14.2 -17.2)
Cheshire and Merseyside 96 4.1 (3.4 -5.1) 127 5.4 (4.5 -6.5) 95 4.0 (3.3 -4.9) 110 4.6 (3.8 -5.6) 116 4.8 (4.0 -5.8)
Midlands and East of England
2,049 12.8 (12.3 -13.4) 1,873 11.6 (11.1 -12.2) 2,059 12.7 (12.1 -13.2) 2,080 12.7 (12.2 -13.3) 1,861 11.3 (10.8 -11.8)
East Midlands 449 11.9 (10.8 -13) 426 11.2 (10.1 -12.3) 428 11.1 (10.1 -12.2) 416 10.8 (9.7 -11.8) 371 9.5 (8.6 -10.6)
West Midlands 1,008 18.2 (17.1 -19.4) 872 15.7 (14.6 -16.7) 1,006 17.9 (16.8 -19.1) 1,084 19.2 (18.1 -20.4) 981 17.3 (16.2 -18.4)
Anglia and Essex 265 6.5 (5.8 -7.4) 244 6.0 (5.2 -6.8) 276 6.7 (5.9 -7.5) 253 6.1 (5.4 -6.9) 261 6.2 (5.5 -7.1)
South Midlands and Hertfordshire
327 12.5 (11.2 -13.9) 331 12.5 (11.2 -13.9) 349 13.0 (11.7 -14.5) 327 12.1 (10.8 -13.5) 248 9.1 (8.0 -10.3)
London 3,404 42.9 (41.4 -44.3) 3,241 40.2 (38.8 -41.6) 3,489 42.5 (41.1 -44) 3,403 41 (39.6 -42.4) 2,985 35.5 (34.2 -36.8)
South of England 1,014 7.5 (7.1 -8.0) 975 7.2 (6.7 -7.6) 1,122 8.2 (7.7 -8.7) 1,075 7.8 (7.3 -8.3) 1,007 7.2 (6.8 -7.7)
Kent, Surrey and Sussex 331 7.5 (6.7 -8.4) 303 6.8 (6.1 -7.6) 367 8.2 (7.4 -9.1) 343 7.6 (6.8 -8.4) 277 6.1 (5.4 -6.8)
Thames Valley 247 12.4 (10.9 -14.1) 283 14.1 (12.5 -15.8) 295 14.6 (13 -16.3) 294 14.4 (12.8 -16.1) 295 14.3 (12.7 -16.0)
Wessex 176 6.8 (5.8 -7.8) 156 5.9 (5.0 -7.0) 189 7.1 (6.2 -8.2) 166 6.2 (5.3 -7.3) 137 5.1 (4.3 -6.0)
Devon, Cornwall and Somerset
72 3.3 (2.6 -4.2) 64 2.9 (2.3 -3.7) 91 4.1 (3.3 -5.1) 88 4.0 (3.2 -4.9) 78 3.5 (2.8 -4.4)
Avon, Gloucestershire and Wiltshire
188 8.1 (7.0 -9.4) 169 7.2 (6.2 -8.4) 180 7.7 (6.6 -8.9) 184 7.8 (6.7 -9) 220 9.2 (8.0 -10.5)

Tuberculosis in the UK: 2014 report
57
Table A1.4 Tuberculosis rates by age group, UK, 2004-2013
Age groups
0-14 years 5-14 years 15-24 years 25-34 years 35-44 years
Year Number of cases
Rate per 100,000 (95% CI)
Number of cases
Rate per 100,000 (95% CI)
Number of cases
Rate per 100,000 (95% CI)
Number of cases
Rate per 100,000 (95% CI)
Number of cases
Rate per 100,000 (95% CI)
2004 155 4.5 (3.9 -5.3) 283 3.8 (3.3 -4.2) 1,151 14.9 (14.8 -15.8) 2,126 26.5 (25.4 -27.7) 1,278 13.9 (13.2 -14.7)
2005 161 4.7 (4.0 -5.5) 283 3.8 (3.4 -4.3) 1,285 16.4 (15.5 -17.3) 2,338 29.1 (27.9 -30.3) 1,476 15.9 (15.1 -16.8)
2006 123 3.5 (2.9 -4.2) 260 3.5 (3.1 -4.0) 1,341 16.9 (16.0 -17.8) 2,291 28.5 (27.4 -29.7) 1,482 16.0 (15.2 -16.8)
2007 168 4.7 (4.0 -5.4) 318 4.4 (3.9 -4.9) 1,230 15.2 (14.4 -16.1) 2,381 29.6 (28.4 -30.8) 1,447 15.6 (14.8 -16.4)
2008 182 4.9 (4.2 -5.7) 305 4.2 (3.8 -4.7) 1,267 15.6 (14.7 -16.5) 2,371 29.2 (28.0 -30.4) 1,579 17.1 (16.3 -18.0)
2009 168 4.4 (3.8 -5.2) 256 3.6 (3.1 -4.0) 1,334 16.3 (15.5 -17.2) 2,374 28.9 (27.8 -30.1) 1,646 18.1 (17.2 -19.0)
2010 125 3.2 (2.7 -3.9) 255 3.6 (3.1 -4.0) 1,267 15.4 (14.6 -16.3) 2,284 27.4 (26.3 -28.6) 1,513 16.9 (16.1 -17.8)
2011 140 3.6 (3.0 -4.2) 268 3.7 (3.3 -4.2) 1,352 16.3 (15.5 -17.2) 2,456 29.0 (27.9 -30.2) 1,612 18.4 (17.5 -19.3)
2012 159 4.0 (3.4 -4.7) 254 3.5 (3.1 -4.0) 1,285 15.6 (14.7 -16.4) 2,428 28.4 (27.3 -29.5) 1,588 18.5 (17.6 -19.4)
2013 113 2.8 (2.3 -3.4) 206 2.8 (2.5 -3.2) 1,040 12.7 (11.9 -13.5) 2,120 24.4 (23.4 -25.5) 1,494 17.7 (16.8 -18.6)
CI - confidence interval
Age groups
45-54 years 55-64 years 65 and older Total
Year
Number of cases
Rate per 100,000 (95% CI)
Number of cases
Rate per 100,000 (95% CI)
Number of cases
Rate per 100,000 (95% CI)
Number of cases
Rate per 100,000 (95% CI)
2004 847 11.1 (10.4 -11.9) 604 8.7 (8.1 -9.5) 1,149 12.0 (11.4 -12.8) 7,593 12.7 (12.4 -13.0)
2005 867 11.2 (10.5 -12.0) 644 9.2 (8.5 -9.9) 1,234 12.8 (12.1 -13.6) 8,288 13.7 (13.4 -14.0)
2006 943 12.0 (11.7 -13.3) 661 9.2 (8.5 -10.0) 1,213 12.6 (11.9 -13.3) 8,314 13.7 (13.4 -14.0)
2007 899 11.2 (10.5 -12.0) 665 9.2 (8.5 -9.9) 1,160 11.9 (11.2 -12.6) 8,268 13.5 (13.2 -13.8)
2008 1,006 12.3 (11.5 -13.0) 641 8.8 (8.1 -9.5) 1,140 11.5 (10.9 -12.2) 8,491 13.7 (13.4 -14.0)
2009 1,060 12.6 (11.9 -13.4) 751 10.2 (9.5 -11.0) 1,289 12.8 (12.1 -13.5) 8,878 14.3 (14.0 -14.6)
2010 1,027 11.9 (11.2 -12.7) 725 9.8 (9.1 -10.6) 1,201 11.7 (11.1 -12.4) 8,397 13.4 (13.1 -13.7)
2011 1,089 12.4 (11.7 -13.2) 783 10.6 (9.8 -11.3) 1,223 11.7 (11.1 -12.4) 8,923 14.1 (13.8 -14.4)
2012 1,058 11.9 (11.2 -12.6) 757 10.4 (9.6 -11.1) 1,200 11.1 (10.5 -11.7) 8,729 13.7 (13.4 -14.0)
2013 1,066 11.8 (11.1 -12.5) 719 9.9 (9.2 -10.6) 1,134 10.2 (9.6 -10.8) 7,892 12.3 (12.0 -12.6)
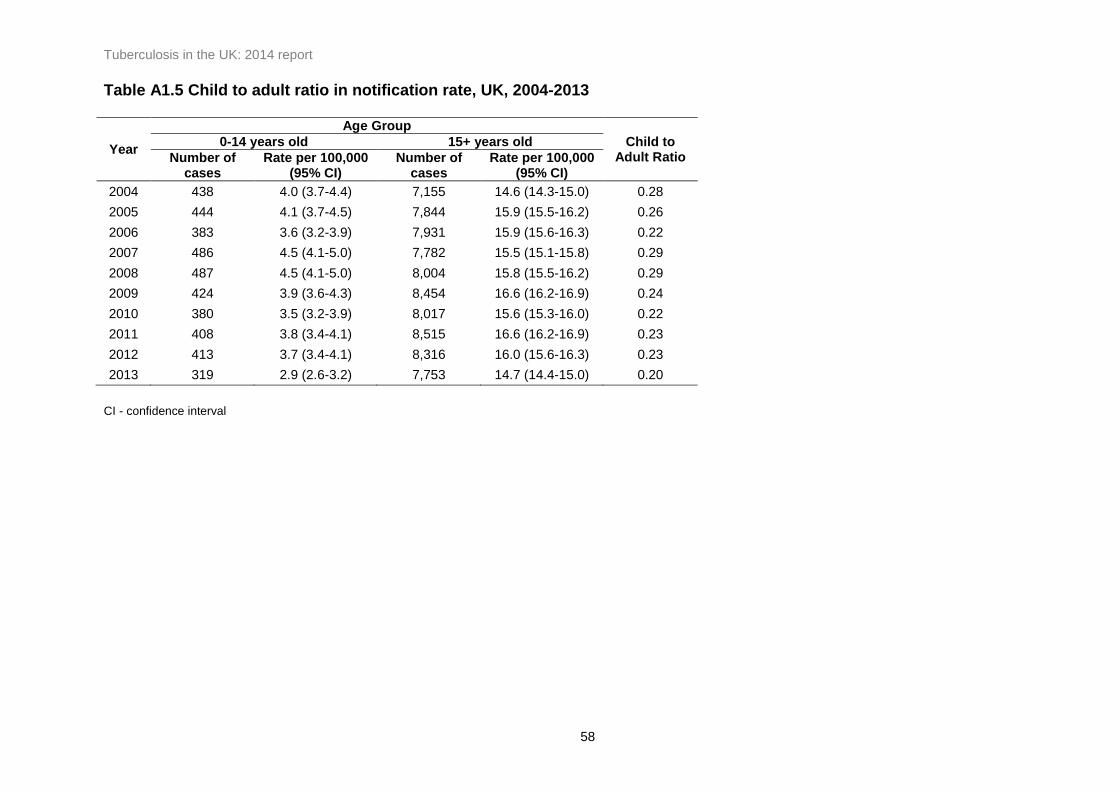
Tuberculosis in the UK: 2014 report
58
Table A1.5 Child to adult ratio in notification rate, UK, 2004-2013
Year
Age Group
Child to Adult Ratio
0-14 years old 15+ years old
Number of cases
Rate per 100,000 (95% CI)
Number of cases
Rate per 100,000 (95% CI)
2004 438 4.0 (3.7-4.4) 7,155 14.6 (14.3-15.0) 0.28
2005 444 4.1 (3.7-4.5) 7,844 15.9 (15.5-16.2) 0.26
2006 383 3.6 (3.2-3.9) 7,931 15.9 (15.6-16.3) 0.22
2007 486 4.5 (4.1-5.0) 7,782 15.5 (15.1-15.8) 0.29
2008 487 4.5 (4.1-5.0) 8,004 15.8 (15.5-16.2) 0.29
2009 424 3.9 (3.6-4.3) 8,454 16.6 (16.2-16.9) 0.24
2010 380 3.5 (3.2-3.9) 8,017 15.6 (15.3-16.0) 0.22
2011 408 3.8 (3.4-4.1) 8,515 16.6 (16.2-16.9) 0.23
2012 413 3.7 (3.4-4.1) 8,316 16.0 (15.6-16.3) 0.23
2013 319 2.9 (2.6-3.2) 7,753 14.7 (14.4-15.0) 0.20
CI - confidence interval

Tuberculosis in the UK: 2014 report
59
Table A1.6: Number and proportion of tuberculosis case reports by site of disease and place of birth, UK, 2004-2013
* With or without extra-pulmonary disease ** Where place of birth was known
UK born** Non-UK born**
Year Pulmonary* Extra-pulmonary Total Pulmonary* Extra-pulmonary Total Pulmonary* Extra-pulmonary Total
Number of cases
% Number of cases
% Number of cases
% Number of cases
% Number of cases
% Number of cases
%
2004 4,480 59.1 3,095 40.9 7,575 1,587 73.3 578 26.7 2,165 2,524 52.8 2,257 47.2 4,781
2005 4,718 57.1 3,548 42.9 8,266 1,536 71.9 601 28.1 2,137 2,795 51.8 2,605 48.2 5,400
2006 4,689 56.6 3,599 43.4 8,288 1,474 72.2 567 27.8 2,041 2,761 51.0 2,658 49.0 5,419
2007 4,608 55.9 3,633 44.1 8,241 1,473 69.8 636 30.2 2,109 2,705 49.8 2,732 50.2 5,437
2008 4,686 55.6 3,749 44.4 8,435 1,546 71.4 618 28.6 2,164 2,810 49.2 2,897 50.8 5,707
2009 4,871 55.2 3,949 44.8 8,820 1,625 71.7 641 28.3 2,266 2,882 48.4 3,078 51.6 5,960
2010 4,524 54.1 3,842 45.9 8,366 1,477 70.1 630 29.9 2,107 2,748 47.2 3,071 52.8 5,819
2011 4,687 52.8 4,194 47.2 8,881 1,576 71.7 622 28.3 2,198 2,902 45.9 3,421 54.1 6,323
2012 4,538 52.3 4,142 47.7 8,680 1,549 68.7 706 31.3 2,255 2,836 46.1 3,321 53.9 6,157
2013 4,096 52.1 3,759 47.9 7,855 1,434 68.7 654 31.3 2,088 2,513 45.5 3,005 54.5 5,518
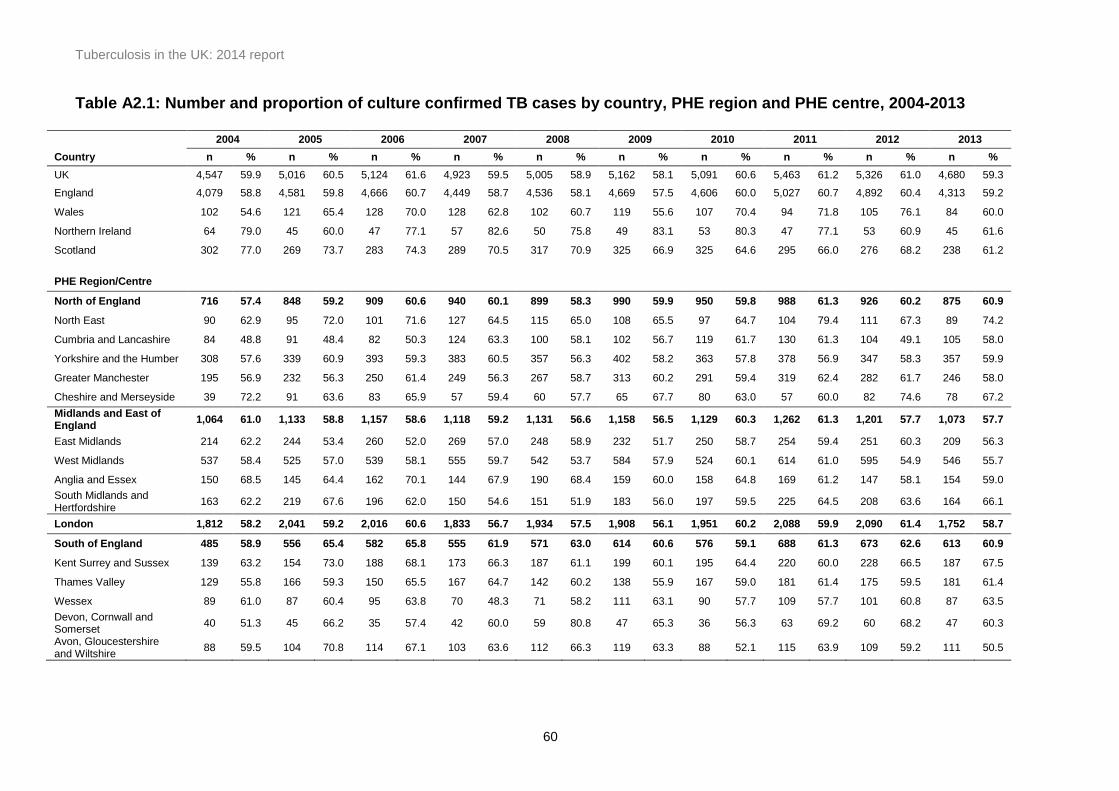
Tuberculosis in the UK: 2014 report
60
Table A2.1: Number and proportion of culture confirmed TB cases by country, PHE region and PHE centre, 2004-2013
2004 2005 2006 2007 2008 2009 2010 2011 2012 2013
Country n % n % n % n % n % n % n % n % n % n %
UK 4,547 59.9 5,016 60.5 5,124 61.6 4,923 59.5 5,005 58.9 5,162 58.1 5,091 60.6 5,463 61.2 5,326 61.0 4,680 59.3
England 4,079 58.8 4,581 59.8 4,666 60.7 4,449 58.7 4,536 58.1 4,669 57.5 4,606 60.0 5,027 60.7 4,892 60.4 4,313 59.2
Wales 102 54.6 121 65.4 128 70.0 128 62.8 102 60.7 119 55.6 107 70.4 94 71.8 105 76.1 84 60.0
Northern Ireland 64 79.0 45 60.0 47 77.1 57 82.6 50 75.8 49 83.1 53 80.3 47 77.1 53 60.9 45 61.6
Scotland 302 77.0 269 73.7 283 74.3 289 70.5 317 70.9 325 66.9 325 64.6 295 66.0 276 68.2 238 61.2
PHE Region/Centre
North of England 716 57.4 848 59.2 909 60.6 940 60.1 899 58.3 990 59.9 950 59.8 988 61.3 926 60.2 875 60.9
North East 90 62.9 95 72.0 101 71.6 127 64.5 115 65.0 108 65.5 97 64.7 104 79.4 111 67.3 89 74.2
Cumbria and Lancashire 84 48.8 91 48.4 82 50.3 124 63.3 100 58.1 102 56.7 119 61.7 130 61.3 104 49.1 105 58.0
Yorkshire and the Humber 308 57.6 339 60.9 393 59.3 383 60.5 357 56.3 402 58.2 363 57.8 378 56.9 347 58.3 357 59.9
Greater Manchester 195 56.9 232 56.3 250 61.4 249 56.3 267 58.7 313 60.2 291 59.4 319 62.4 282 61.7 246 58.0
Cheshire and Merseyside 39 72.2 91 63.6 83 65.9 57 59.4 60 57.7 65 67.7 80 63.0 57 60.0 82 74.6 78 67.2
Midlands and East of England
1,064 61.0 1,133 58.8 1,157 58.6 1,118 59.2 1,131 56.6 1,158 56.5 1,129 60.3 1,262 61.3 1,201 57.7 1,073 57.7
East Midlands 214 62.2 244 53.4 260 52.0 269 57.0 248 58.9 232 51.7 250 58.7 254 59.4 251 60.3 209 56.3
West Midlands 537 58.4 525 57.0 539 58.1 555 59.7 542 53.7 584 57.9 524 60.1 614 61.0 595 54.9 546 55.7
Anglia and Essex 150 68.5 145 64.4 162 70.1 144 67.9 190 68.4 159 60.0 158 64.8 169 61.2 147 58.1 154 59.0
South Midlands and Hertfordshire
163 62.2 219 67.6 196 62.0 150 54.6 151 51.9 183 56.0 197 59.5 225 64.5 208 63.6 164 66.1
London 1,812 58.2 2,041 59.2 2,016 60.6 1,833 56.7 1,934 57.5 1,908 56.1 1,951 60.2 2,088 59.9 2,090 61.4 1,752 58.7
South of England 485 58.9 556 65.4 582 65.8 555 61.9 571 63.0 614 60.6 576 59.1 688 61.3 673 62.6 613 60.9
Kent Surrey and Sussex 139 63.2 154 73.0 188 68.1 173 66.3 187 61.1 199 60.1 195 64.4 220 60.0 228 66.5 187 67.5
Thames Valley 129 55.8 166 59.3 150 65.5 167 64.7 142 60.2 138 55.9 167 59.0 181 61.4 175 59.5 181 61.4
Wessex 89 61.0 87 60.4 95 63.8 70 48.3 71 58.2 111 63.1 90 57.7 109 57.7 101 60.8 87 63.5
Devon, Cornwall and Somerset
40 51.3 45 66.2 35 57.4 42 60.0 59 80.8 47 65.3 36 56.3 63 69.2 60 68.2 47 60.3
Avon, Gloucestershire and Wiltshire
88 59.5 104 70.8 114 67.1 103 63.6 112 66.3 119 63.3 88 52.1 115 63.9 109 59.2 111 50.5

Tuberculosis in the UK: 2014 report
61
Table A2.2: Number and proportion of pulmonary culture confirmed TB cases by country and PHEC, 2004-2013
Country 2004 2005 2006 2007 2008 2009 2010 2011 2012 2013
n % n % n % n % n % n % n % n % n % n %
UK 3,102 69.2 3,298 69.9 3,292 70.2 3,198 69.4 3,214 68.6 3,337 68.5 3,199 70.7 3,358 71.6 3,209 70.7 2,920 71.3
England 2,741 68.4 2,986 69.1 2,978 69.3 2,851 68.7 2,899 67.7 3,004 68.1 2,864 70.4 3,069 71.6 2,945 70.3 2,673 71.3
Wales 72 56.7 81 69.2 89 79.5 93 68.9 73 72.3 80 63.0 72 78.3 56 78.9 63 79.8 61 73.5
Northern Ireland 56 82.4 36 80.0 36 83.7 42 93.3 30 81.1 38 86.4 35 94.6 38 80.9 36 76.6 29 67.4
Scotland 233 83.5 195 82.3 189 80.4 212 76.3 212 79.7 215 74.4 228 70.2 195 69.2 165 75.0 157 70.7
PHE Region/Centre
North of England 502 69.8 552 68.2 581 69.9 625 69.5 564 70.1 651 70.2 627 70.8 603 69.9 575 70.5 547 70.8
North East 68 70.8 63 75.9 68 73.9 85 69.7 74 74.0 69 70.4 60 73.2 59 81.9 69 71.9 65 85.5
Cumbria and Lancashire 50 61.0 62 68.9 55 63.2 79 75.2 67 73.6 76 72.4 79 79.0 89 74.8 78 69.6 67 68.4
Yorkshire and the Humber 221 71.5 218 68.6 249 66.9 247 65.9 213 63.8 265 67.1 255 67.1 247 65.2 222 67.5 225 66.4
Greater Manchester 139 69.2 140 62.2 147 72.4 168 70.0 164 74.9 196 71.3 180 72.6 178 71.5 151 70.9 138 69.7
Cheshire and Merseyside 24 77.4 69 73.4 62 80.5 46 80.7 46 75.4 45 81.8 53 69.7 30 68.2 55 83.3 52 83.9
Midlands and East of England
757 70.9 731 67.1 752 65.5 733 69.2 765 65.4 777 68.0 731 71.6 827 72.2 740 66.1 697 68.8
East Midlands 132 72.9 145 64.4 159 57.2 190 69.3 173 70.6 157 68.0 161 78.2 173 72.7 159 66.5 149 69.0
West Midlands 393 67.5 339 65.3 359 65.2 357 69.1 365 64.2 383 68.0 332 70.5 406 72.0 372 65.0 348 65.7
Anglia and Essex 113 79.6 105 69.1 113 79.0 96 72.2 135 73.0 109 73.2 106 71.6 110 70.5 94 63.1 98 71.0
South Midlands and Hertfordshire
119 73.0 142 73.2 121 68.8 90 66.2 92 54.1 128 64.3 132 67.4 138 73.4 115 71.9 102 79.1
London 1,151 67.6 1,313 70.1 1,287 71.1 1,119 67.2 1,176 67.1 1,175 66.8 1,149 71.5 1,189 72.6 1,183 72.6 1,039 73.3
South of England 330 64.2 387 71.5 356 70.2 372 71.0 393 71.1 402 69.1 357 64.2 449 70.2 446 71.3 390 71.6
Kent, Surrey and Sussex 92 65.7 113 78.5 125 73.5 122 74.9 136 67.0 132 68.8 124 70.9 138 71.5 152 73.4 122 77.7
Thames Valley 90 71.4 110 73.8 82 73.2 105 82.0 90 74.4 83 70.3 87 64.9 103 70.1 91 71.1 103 83.7
Wessex 62 60.8 55 59.1 53 66.3 49 54.4 44 63.8 78 70.9 61 63.5 82 67.8 78 71.6 55 70.5
Devon, Cornwall and Somerset
31 55.4 34 61.8 27 58.7 33 63.5 44 80.0 37 74.0 27 57.5 49 72.1 47 71.2 32 61.5
Avon, Gloucestershire and Wiltshire
55 61.1 75 75.0 69 69.7 63 69.2 79 75.2 72 64.3 58 55.8 77 69.4 78 67.2 78 57.8
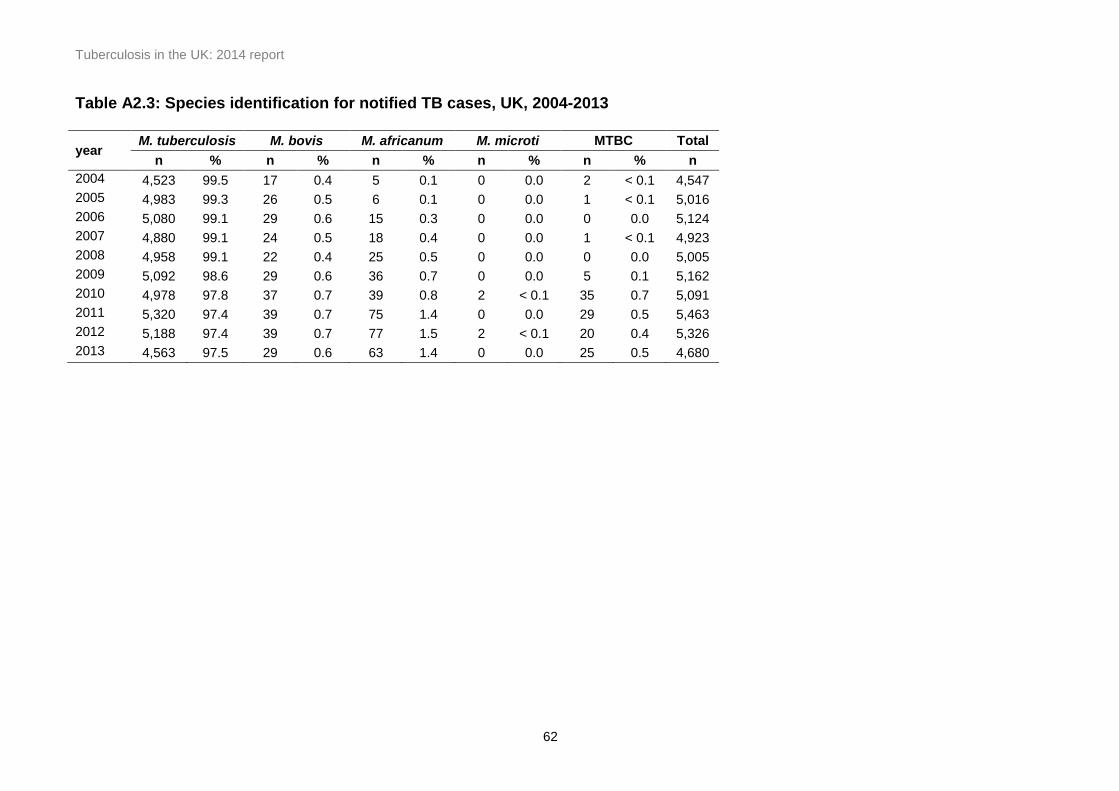
Tuberculosis in the UK: 2014 report
62
Table A2.3: Species identification for notified TB cases, UK, 2004-2013
year M. tuberculosis M. bovis M. africanum M. microti MTBC Total
n % n % n % n % n % n
2004 4,523 99.5 17 0.4 5 0.1 0 0.0 2 < 0.1 4,547
2005 4,983 99.3 26 0.5 6 0.1 0 0.0 1 < 0.1 5,016
2006 5,080 99.1 29 0.6 15 0.3 0 0.0 0 0.0 5,124
2007 4,880 99.1 24 0.5 18 0.4 0 0.0 1 < 0.1 4,923
2008 4,958 99.1 22 0.4 25 0.5 0 0.0 0 0.0 5,005
2009 5,092 98.6 29 0.6 36 0.7 0 0.0 5 0.1 5,162
2010 4,978 97.8 37 0.7 39 0.8 2 < 0.1 35 0.7 5,091
2011 5,320 97.4 39 0.7 75 1.4 0 0.0 29 0.5 5,463
2012 5,188 97.4 39 0.7 77 1.5 2 < 0.1 20 0.4 5,326
2013 4,563 97.5 29 0.6 63 1.4 0 0.0 25 0.5 4,680

Tuberculosis in the UK: 2014 report
63
Table A2.4: Number and proportion of tuberculosis cases with first line drug resistance, UK, 2004-2013
Year Isoniazid Rifampicin Ethambutol Pyrazinamide Multi-drug Resistant to any
Total** resistant resistant resistant resistant* resistant first line drug
n % n % n % n % n % n %
2004 321 7.1 66 1.5 19 0.4 30 0.7 49 1.1 356 7.9 4,504
2005 336 6.8 59 1.2 18 0.4 15 0.3 43 0.9 362 7.3 4,981
2006 359 7.1 79 1.6 29 0.6 29 0.6 58 1.1 397 7.8 5,085
2007 338 6.9 76 1.6 32 0.7 35 0.7 62 1.3 369 7.6 4,872
2008 288 5.8 74 1.5 39 0.8 36 0.7 55 1.1 329 6.7 4,945
2009 353 6.9 73 1.4 29 0.6 54 1.1 61 1.2 399 7.8 5,088
2010 316 6.3 77 1.5 37 0.7 43 0.9 67 1.3 347 6.9 5,035
2011 402 7.5 95 1.8 60 1.1 59 1.1 86 1.6 449 8.3 5,397
2012 360 6.8 92 1.7 51 1.0 47 0.9 82 1.6 389 7.4 5,278
2013 329 7.1 86 1.9 41 0.9 43 0.9 74 1.6 360 7.8 4,606
Total 3,402 6.8 777 1.6 355 0.7 391 0.8 637 1.3 3,757 7.5 49,791
* Excluding M. bovis cases **Culture confirmed cases with DST results for at least isoniazid and rifampicin
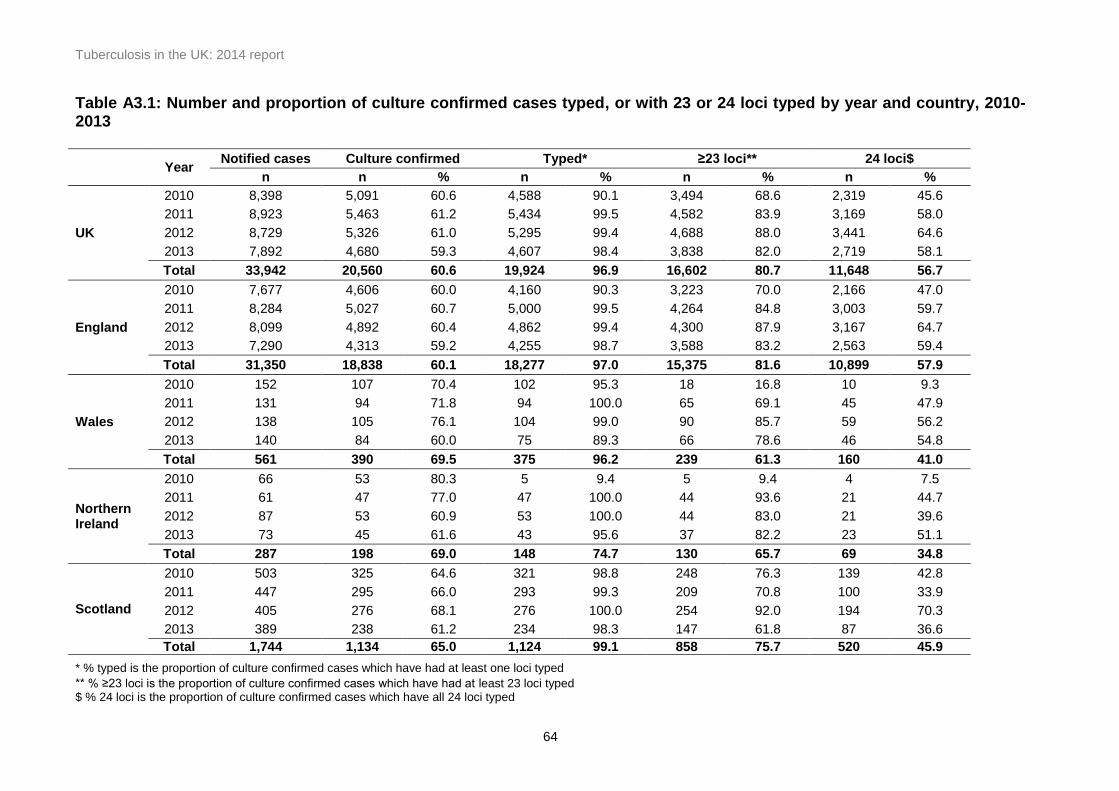
Tuberculosis in the UK: 2014 report
64
Table A3.1: Number and proportion of culture confirmed cases typed, or with 23 or 24 loci typed by year and country, 2010-2013
Year Notified cases Culture confirmed Typed* ≥23 loci** 24 loci$
n n % n % n % n %
UK
2010 8,398 5,091 60.6 4,588 90.1 3,494 68.6 2,319 45.6
2011 8,923 5,463 61.2 5,434 99.5 4,582 83.9 3,169 58.0
2012 8,729 5,326 61.0 5,295 99.4 4,688 88.0 3,441 64.6
2013 7,892 4,680 59.3 4,607 98.4 3,838 82.0 2,719 58.1
Total 33,942 20,560 60.6 19,924 96.9 16,602 80.7 11,648 56.7
England
2010 7,677 4,606 60.0 4,160 90.3 3,223 70.0 2,166 47.0
2011 8,284 5,027 60.7 5,000 99.5 4,264 84.8 3,003 59.7
2012 8,099 4,892 60.4 4,862 99.4 4,300 87.9 3,167 64.7
2013 7,290 4,313 59.2 4,255 98.7 3,588 83.2 2,563 59.4
Total 31,350 18,838 60.1 18,277 97.0 15,375 81.6 10,899 57.9
Wales
2010 152 107 70.4 102 95.3 18 16.8 10 9.3
2011 131 94 71.8 94 100.0 65 69.1 45 47.9
2012 138 105 76.1 104 99.0 90 85.7 59 56.2
2013 140 84 60.0 75 89.3 66 78.6 46 54.8
Total 561 390 69.5 375 96.2 239 61.3 160 41.0
Northern Ireland
2010 66 53 80.3 5 9.4 5 9.4 4 7.5
2011 61 47 77.0 47 100.0 44 93.6 21 44.7
2012 87 53 60.9 53 100.0 44 83.0 21 39.6
2013 73 45 61.6 43 95.6 37 82.2 23 51.1
Total 287 198 69.0 148 74.7 130 65.7 69 34.8
Scotland
2010 503 325 64.6 321 98.8 248 76.3 139 42.8
2011 447 295 66.0 293 99.3 209 70.8 100 33.9
2012 405 276 68.1 276 100.0 254 92.0 194 70.3
2013 389 238 61.2 234 98.3 147 61.8 87 36.6
Total 1,744 1,134 65.0 1,124 99.1 858 75.7 520 45.9
* % typed is the proportion of culture confirmed cases which have had at least one loci typed
** % ≥23 loci is the proportion of culture confirmed cases which have had at least 23 loci typed $ % 24 loci is the proportion of culture confirmed cases which have all 24 loci typed

Tuberculosis in the UK: 2014 report
65
Table A3.2: Number and proportion of unique cases, clustered cases and new clusters by year, 2010-2013
Notified
cases Culture
confirmed cases Strain typed
cases (≥23 loci) Unique cases
Clustered cases*
New clusters (per year)**
n n % n % n % n % n
2010 8,398 5,091 60.6 3,494 68.6 1,630 46.7 1,864 53.3 395
2011 8,923 5,463 61.2 4,582 83.9 2,154 47.0 2,428 53.0 523
2012 8,729 5,326 61.0 4,688 88.0 2,106 44.9 2,582 55.1 557
2013 7,892 4,680 59.3 3,838 82.0 1,822 47.5 2,016 52.5 379
Total (2010-2013) 33,942 20,560 60.6 16,602 80.7 7,712 46.5 8,890 53.5 1,854
* i.e. clustered in time period (2010-2013), clustered cases notified in year ** a new cluster forms at the point when a second case is notified with the same MIRU-VNTR strain type as an existing case
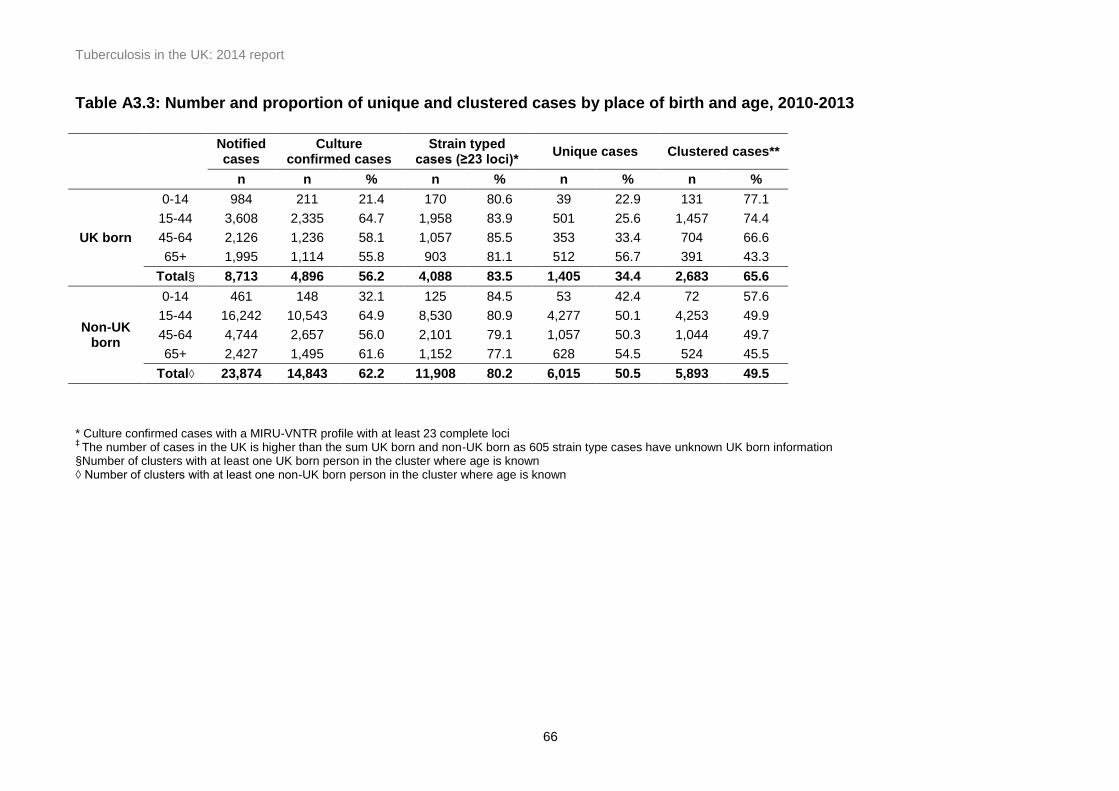
Tuberculosis in the UK: 2014 report
66
Table A3.3: Number and proportion of unique and clustered cases by place of birth and age, 2010-2013
Notified cases
Culture confirmed cases
Strain typed cases (≥23 loci)*
Unique cases Clustered cases**
n n % n % n % n %
UK born
0-14 984 211 21.4 170 80.6 39 22.9 131 77.1
15-44 3,608 2,335 64.7 1,958 83.9 501 25.6 1,457 74.4
45-64 2,126 1,236 58.1 1,057 85.5 353 33.4 704 66.6
65+ 1,995 1,114 55.8 903 81.1 512 56.7 391 43.3
Total§ 8,713 4,896 56.2 4,088 83.5 1,405 34.4 2,683 65.6
Non-UK born
0-14 461 148 32.1 125 84.5 53 42.4 72 57.6
15-44 16,242 10,543 64.9 8,530 80.9 4,277 50.1 4,253 49.9
45-64 4,744 2,657 56.0 2,101 79.1 1,057 50.3 1,044 49.7
65+ 2,427 1,495 61.6 1,152 77.1 628 54.5 524 45.5
Total◊ 23,874 14,843 62.2 11,908 80.2 6,015 50.5 5,893 49.5
* Culture confirmed cases with a MIRU-VNTR profile with at least 23 complete loci ‡
The number of cases in the UK is higher than the sum UK born and non-UK born as 605 strain type cases have unknown UK born information §Number of clusters with at least one UK born person in the cluster where age is known ◊ Number of clusters with at least one non-UK born person in the cluster where age is known

Tuberculosis in the UK: 2014 report
67
Table A4.1: TB outcome at 12 months after treatment start for drug sensitive cases with expected treatment duration < 12months*, UK, 2003-2012
Year Completed Died
Lost to follow up
Still on treatment
Stopped Not evaluated** Total
n % n % n % n % n % n % n
2003 4,561 69.4 404 6.1 285 4.3 253 3.9 64 1.0 1,008 15.3 6,575
2004 4,876 70.3 390 5.6 337 4.9 315 4.5 80 1.2 940 13.6 6,938
2005 5,287 70.2 431 5.7 371 4.9 416 5.5 88 1.2 937 12.4 7,530
2006 5,622 74.9 409 5.5 401 5.4 483 6.4 91 1.2 496 6.6 7,502
2007 5,724 77.3 409 5.5 335 4.5 510 6.9 83 1.1 344 4.7 7,405
2008 6,019 79.1 397 5.2 344 4.5 468 6.2 74 1.0 309 4.1 7,611
2009 6,420 81.0 382 4.8 328 4.1 474 6.0 88 1.1 236 3.0 7,928
2010 6,133 82.1 366 4.9 317 4.2 428 5.7 67 0.9 158 2.1 7,469
2011 6,459 81.4 361 4.6 388 4.9 505 6.4 77 1.0 143 1.8 7,933
2012 6,438 82.8 345 4.4 307 4.0 446 5.7 79 1.0 159 2.1 7,774
* Excludes initial and amplified to rifampcin resistant TB and MDR-TB cases and MDR-TB treated cases and those with CNS, spinal, miliary or cryptic disseminated TB ** Not evaluated includes missing, unknown and transferred out
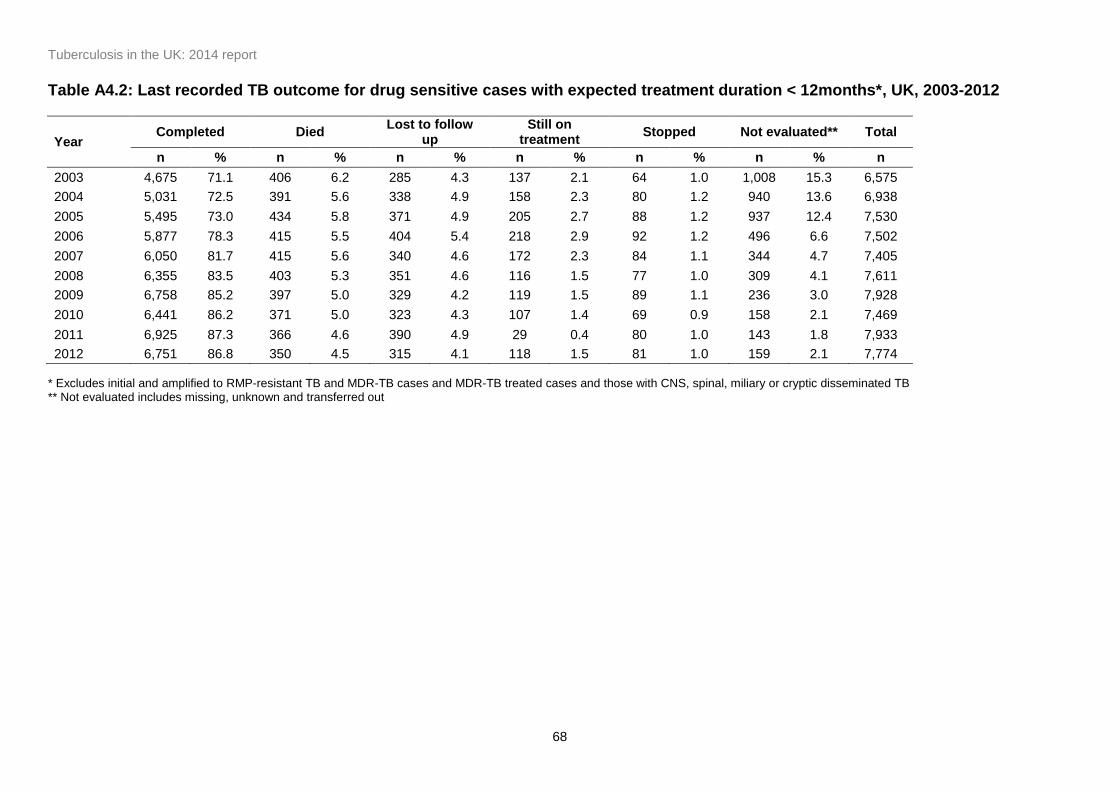
Tuberculosis in the UK: 2014 report
68
Table A4.2: Last recorded TB outcome for drug sensitive cases with expected treatment duration < 12months*, UK, 2003-2012
Year Completed Died
Lost to follow up
Still on treatment
Stopped Not evaluated** Total
n % n % n % n % n % n % n
2003 4,675 71.1 406 6.2 285 4.3 137 2.1 64 1.0 1,008 15.3 6,575
2004 5,031 72.5 391 5.6 338 4.9 158 2.3 80 1.2 940 13.6 6,938
2005 5,495 73.0 434 5.8 371 4.9 205 2.7 88 1.2 937 12.4 7,530
2006 5,877 78.3 415 5.5 404 5.4 218 2.9 92 1.2 496 6.6 7,502
2007 6,050 81.7 415 5.6 340 4.6 172 2.3 84 1.1 344 4.7 7,405
2008 6,355 83.5 403 5.3 351 4.6 116 1.5 77 1.0 309 4.1 7,611
2009 6,758 85.2 397 5.0 329 4.2 119 1.5 89 1.1 236 3.0 7,928
2010 6,441 86.2 371 5.0 323 4.3 107 1.4 69 0.9 158 2.1 7,469
2011 6,925 87.3 366 4.6 390 4.9 29 0.4 80 1.0 143 1.8 7,933
2012 6,751 86.8 350 4.5 315 4.1 118 1.5 81 1.0 159 2.1 7,774
* Excludes initial and amplified to RMP-resistant TB and MDR-TB cases and MDR-TB treated cases and those with CNS, spinal, miliary or cryptic disseminated TB ** Not evaluated includes missing, unknown and transferred out
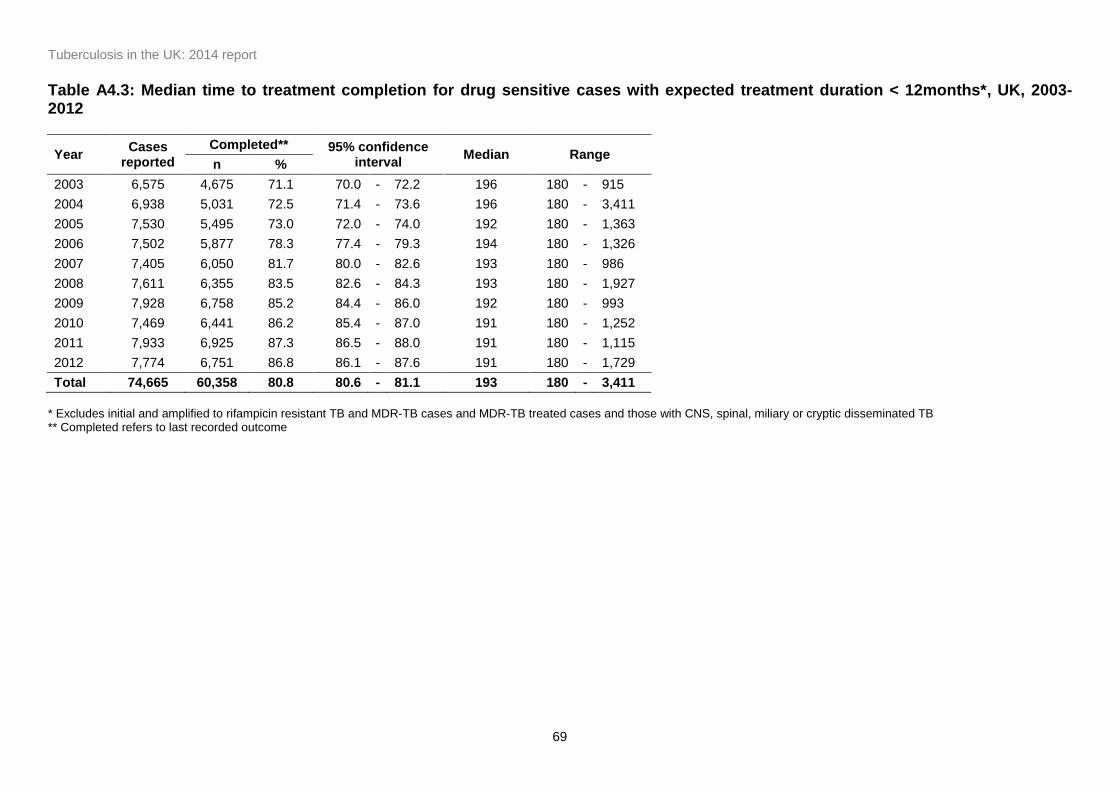
Tuberculosis in the UK: 2014 report
69
Table A4.3: Median time to treatment completion for drug sensitive cases with expected treatment duration < 12months*, UK, 2003-2012
Year Cases
reported
Completed** 95% confidence interval
Median Range n %
2003 6,575 4,675 71.1 70.0 - 72.2 196 180 - 915
2004 6,938 5,031 72.5 71.4 - 73.6 196 180 - 3,411
2005 7,530 5,495 73.0 72.0 - 74.0 192 180 - 1,363
2006 7,502 5,877 78.3 77.4 - 79.3 194 180 - 1,326
2007 7,405 6,050 81.7 80.0 - 82.6 193 180 - 986
2008 7,611 6,355 83.5 82.6 - 84.3 193 180 - 1,927
2009 7,928 6,758 85.2 84.4 - 86.0 192 180 - 993
2010 7,469 6,441 86.2 85.4 - 87.0 191 180 - 1,252
2011 7,933 6,925 87.3 86.5 - 88.0 191 180 - 1,115
2012 7,774 6,751 86.8 86.1 - 87.6 191 180 - 1,729
Total 74,665 60,358 80.8 80.6 - 81.1 193 180 - 3,411
* Excludes initial and amplified to rifampicin resistant TB and MDR-TB cases and MDR-TB treated cases and those with CNS, spinal, miliary or cryptic disseminated TB ** Completed refers to last recorded outcome

Tuberculosis in the UK: 2014 report
70
Table A4.4: Treatment completion at 12 months by age group for drug sensitive cases with expected treatment duration < 12months*, UK, 2003-2012
Year 0-14 15-44 45-64 65+
n % n % n % n %
2003 259 79.0 2,856 73.0 854 67.0 591 56.0
2004 327 80.5 3,042 73.5 940 70.1 567 54.0
2005 325 79.7 3,438 74.1 901 65.8 622 55.9
2006 301 84.8 3,592 78.1 1,088 75.9 641 57.6
2007 380 83.9 3,610 80.3 1,096 77.9 638 60.8
2008 402 88.9 3,821 81.7 1,168 80.1 625 61.3
2009 372 91.6 3,993 83.8 1,292 80.3 763 66.3
2010 320 91.7 3,816 85.1 1,275 82.3 722 66.7
2011 329 85.9 4,031 84.1 1,391 82.7 708 65.7
2012 345 90.3 4,020 85.5 1,351 83.2 722 67.7
* Excludes initial and amplified to rifampicin resistant TB and MDR-TB cases and MDR-TB treated cases and those with CNS, spinal, miliary or cryptic disseminated TB
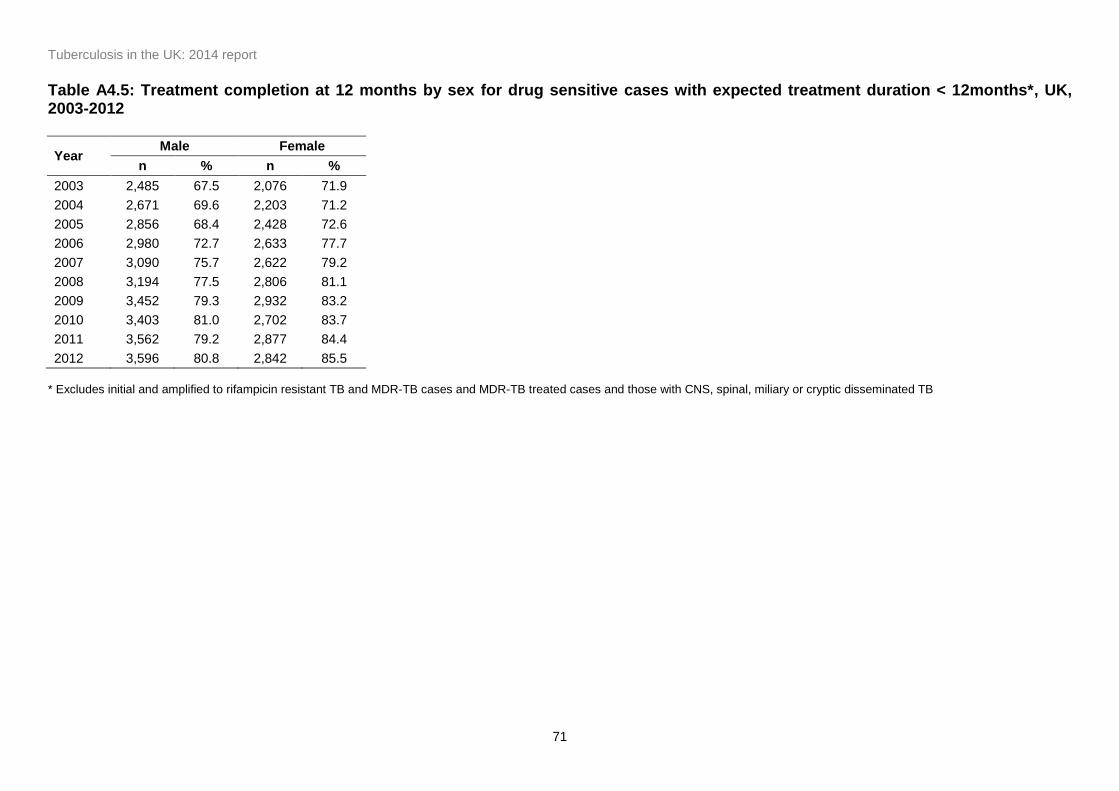
Tuberculosis in the UK: 2014 report
71
Table A4.5: Treatment completion at 12 months by sex for drug sensitive cases with expected treatment duration < 12months*, UK, 2003-2012
Year Male Female
n % n %
2003 2,485 67.5 2,076 71.9
2004 2,671 69.6 2,203 71.2
2005 2,856 68.4 2,428 72.6
2006 2,980 72.7 2,633 77.7
2007 3,090 75.7 2,622 79.2
2008 3,194 77.5 2,806 81.1
2009 3,452 79.3 2,932 83.2
2010 3,403 81.0 2,702 83.7
2011 3,562 79.2 2,877 84.4
2012 3,596 80.8 2,842 85.5
* Excludes initial and amplified to rifampicin resistant TB and MDR-TB cases and MDR-TB treated cases and those with CNS, spinal, miliary or cryptic disseminated TB

Tuberculosis in the UK: 2014 report
72
Table A4.6: TB outcome at 12 months by site of disease for drug sensitive cases with expected treatment duration < 12months, 2012*
Site of disease Completed Died Lost to follow up Still on treatment Stopped Not evaluated** Total
#
n % n % n % n % n % n % n
Pulmonary only 2,727 81.2 204 6.1 132 3.9 192 5.7 31 0.9 72 2.1 3,358
Pulmonary, with or without EP 3,333 80.4 250 6.0 175 4.2 266 6.4 36 0.9 84 2.0 4,144
Extrapulmonary only 3,072 85.8 92 2.6 128 3.6 175 4.9 41 1.1 73 2.0 3,581
Extra-thoracic lymph nodes 1,650 86.0 31 1.6 79 4.1 94 4.9 22 1.2 43 2.2 1,919
Intra-thoracic lymph nodes 795 87.5 14 1.5 34 3.7 46 5.1 5 0.6 15 1.7 909
Pleural 581 82.1 44 6.2 31 4.4 32 4.5 5 0.7 15 2.1 708
Bone Other 141 69.1 7 3.4 9 4.4 37 18.1 4 2.0 6 2.9 204
All other EP sites‡ 1,538 82.4 71 3.8 76 4.1 124 6.6 22 1.2 36 1.9 1,867
Unknown site 55 64.7 5 5.8 4 4.7 6 7.1 2 2.4 13 15.3 85
Total 6,438 82.8 345 4.4 307 4.0 446 5.7 79 1.0 159 2.1 7,774
* Excludes initial and amplified to rifampicin resistant TB and MDR-TB cases and MDR-TB treated cases and those with CNS, spinal, miliary or cryptic disseminated TB ** Not evaluated includes missing, unknown and transferred out # Multiple sites of disease can be reported so does not add up to the total number of cases ‡ All other EP sites - includes gastrointestinal, genitourinary, laryngeal, other and unknown extra pulmonary (EP) disease

Tuberculosis in the UK: 2014 report
73
Table A4.7: TB outcome at 12 months for drug sensitive cases with expected treatment duration <12 months by country, PHE region and PHE centre, 2012
Completed Died Lost to follow up Still on treatment Stopped Not evaluated** Total
Country n % n % n % n % n % n % n
England 5,998 83.3 305 4.2 282 3.9 417 5.8 76 1.1 120 1.7 7,198
Wales 88 72.1 12 9.8 6 4.9 10 8.2 2 1.6 4 3.3 122
Northern Ireland 53 67.9 3 3.8 7 9.0 13 16.7 1 1.3 1 1.3 78
Scotland 299 79.5 25 6.6 12 3.2 6 1.6 0 0.0 34 9.0 376
PHE Centre/Region
North of England 1,125 81.7 74 5.4 45 3.3 89 6.5 16 1.2 28 2.0 1,377
North East 117 77.5 11 7.3 4 2.6 10 6.6 3 2.0 6 4.0 151
Cumbria and Lancashire 163 82.7 8 4.1 2 1.0 13 6.6 2 1.0 9 4.6 197
Yorkshire and the Humber 436 81.2 26 4.8 22 4.1 46 8.6 5 0.9 2 0.4 537
Greater Manchester 325 82.3 21 5.3 16 4.1 18 4.6 5 1.3 10 2.5 395
Cheshire and Merseyside 84 86.6 8 8.2 1 1.0 2 2.1 1 1.0 1 1.0 97
Midlands and East of England
1,528 82.5 100 5.4 76 4.1 104 5.6 22 1.2 22 1.2 1,852
East Midlands 295 81.5 27 7.5 14 3.9 13 3.6 5 1.4 8 2.2 362
West Midlands 828 85.4 43 4.4 33 3.4 53 5.5 9 0.9 3 0.3 969
Anglia and Essex 180 76.3 16 6.8 15 6.4 21 8.9 0 0.0 4 1.7 236
South Midlands and Hertfordshire
225 78.9 14 4.9 14 4.9 17 6.0 8 2.8 7 2.5 285
London 2,572 85.9 81 2.7 122 4.1 168 5.6 30 1.0 20 0.7 2,993
South of England 773 79.3 50 5.1 38 3.9 56 5.7 8 0.8 50 5.1 975
Kent, Surrey and Sussex 241 78.2 17 5.5 13 4.2 11 3.6 1 0.3 25 8.1 308
Thames Valley 233 87.9 11 4.2 6 2.3 11 4.2 3 1.1 1 0.4 265
Wessex 124 81.6 4 2.6 9 5.9 10 6.6 1 0.7 4 2.6 152
Devon, Cornwall and Somerset
61 74.4 6 7.3 2 2.4 10 12.2 1 1.2 2 2.4 82
Avon, Gloucestershire and Wiltshire
114 67.9 12 7.1 8 4.8 14 8.3 2 1.2 18 10.7 168
* Excludes initial and amplified to rifampicin resistant TB and MDR-TB cases and MDR-TB treated cases and those with CNS, spinal, miliary or cryptic disseminated TB ** Not evaluated includes missing, unknown and transferred out
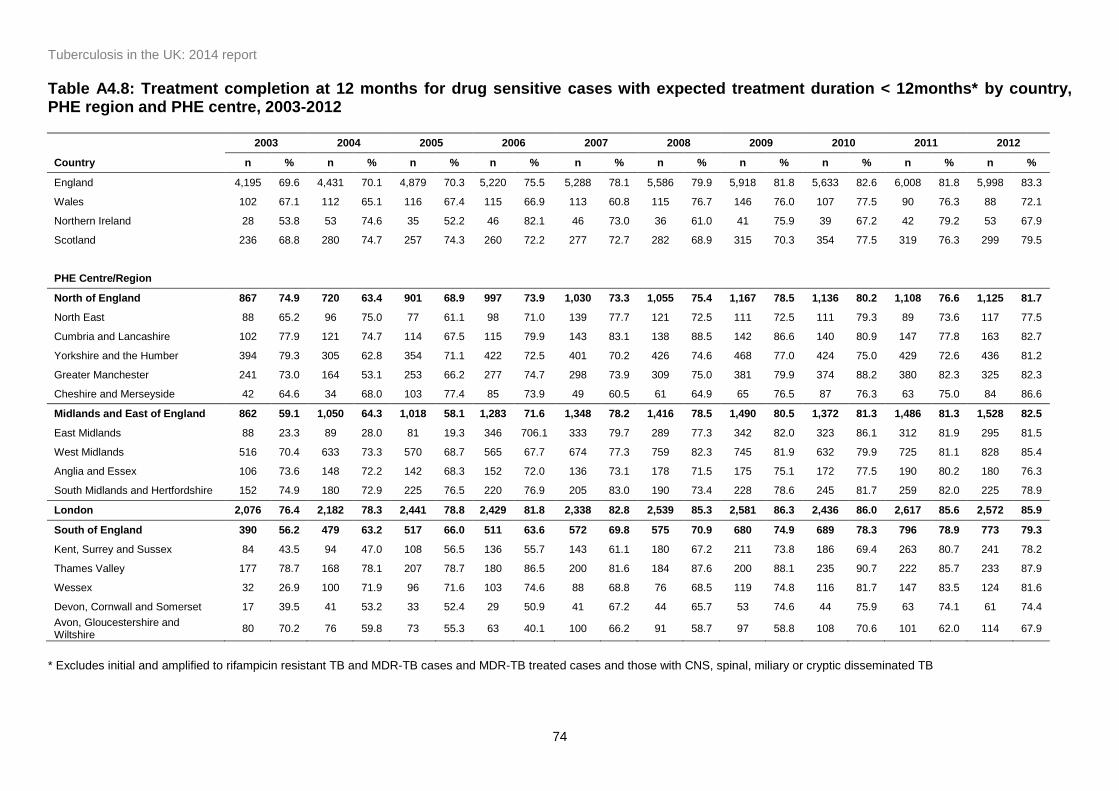
Tuberculosis in the UK: 2014 report
74
Table A4.8: Treatment completion at 12 months for drug sensitive cases with expected treatment duration < 12months* by country, PHE region and PHE centre, 2003-2012
2003 2004 2005 2006 2007 2008 2009 2010 2011 2012
Country n % n % n % n % n % n % n % n % n % n %
England 4,195 69.6 4,431 70.1 4,879 70.3 5,220 75.5 5,288 78.1 5,586 79.9 5,918 81.8 5,633 82.6 6,008 81.8 5,998 83.3
Wales 102 67.1 112 65.1 116 67.4 115 66.9 113 60.8 115 76.7 146 76.0 107 77.5 90 76.3 88 72.1
Northern Ireland 28 53.8 53 74.6 35 52.2 46 82.1 46 73.0 36 61.0 41 75.9 39 67.2 42 79.2 53 67.9
Scotland 236 68.8 280 74.7 257 74.3 260 72.2 277 72.7 282 68.9 315 70.3 354 77.5 319 76.3 299 79.5
PHE Centre/Region
North of England 867 74.9 720 63.4 901 68.9 997 73.9 1,030 73.3 1,055 75.4 1,167 78.5 1,136 80.2 1,108 76.6 1,125 81.7
North East 88 65.2 96 75.0 77 61.1 98 71.0 139 77.7 121 72.5 111 72.5 111 79.3 89 73.6 117 77.5
Cumbria and Lancashire 102 77.9 121 74.7 114 67.5 115 79.9 143 83.1 138 88.5 142 86.6 140 80.9 147 77.8 163 82.7
Yorkshire and the Humber 394 79.3 305 62.8 354 71.1 422 72.5 401 70.2 426 74.6 468 77.0 424 75.0 429 72.6 436 81.2
Greater Manchester 241 73.0 164 53.1 253 66.2 277 74.7 298 73.9 309 75.0 381 79.9 374 88.2 380 82.3 325 82.3
Cheshire and Merseyside 42 64.6 34 68.0 103 77.4 85 73.9 49 60.5 61 64.9 65 76.5 87 76.3 63 75.0 84 86.6
Midlands and East of England 862 59.1 1,050 64.3 1,018 58.1 1,283 71.6 1,348 78.2 1,416 78.5 1,490 80.5 1,372 81.3 1,486 81.3 1,528 82.5
East Midlands 88 23.3 89 28.0 81 19.3 346 706.1 333 79.7 289 77.3 342 82.0 323 86.1 312 81.9 295 81.5
West Midlands 516 70.4 633 73.3 570 68.7 565 67.7 674 77.3 759 82.3 745 81.9 632 79.9 725 81.1 828 85.4
Anglia and Essex 106 73.6 148 72.2 142 68.3 152 72.0 136 73.1 178 71.5 175 75.1 172 77.5 190 80.2 180 76.3
South Midlands and Hertfordshire 152 74.9 180 72.9 225 76.5 220 76.9 205 83.0 190 73.4 228 78.6 245 81.7 259 82.0 225 78.9
London 2,076 76.4 2,182 78.3 2,441 78.8 2,429 81.8 2,338 82.8 2,539 85.3 2,581 86.3 2,436 86.0 2,617 85.6 2,572 85.9
South of England 390 56.2 479 63.2 517 66.0 511 63.6 572 69.8 575 70.9 680 74.9 689 78.3 796 78.9 773 79.3
Kent, Surrey and Sussex 84 43.5 94 47.0 108 56.5 136 55.7 143 61.1 180 67.2 211 73.8 186 69.4 263 80.7 241 78.2
Thames Valley 177 78.7 168 78.1 207 78.7 180 86.5 200 81.6 184 87.6 200 88.1 235 90.7 222 85.7 233 87.9
Wessex 32 26.9 100 71.9 96 71.6 103 74.6 88 68.8 76 68.5 119 74.8 116 81.7 147 83.5 124 81.6
Devon, Cornwall and Somerset 17 39.5 41 53.2 33 52.4 29 50.9 41 67.2 44 65.7 53 74.6 44 75.9 63 74.1 61 74.4
Avon, Gloucestershire and Wiltshire
80 70.2 76 59.8 73 55.3 63 40.1 100 66.2 91 58.7 97 58.8 108 70.6 101 62.0 114 67.9
* Excludes initial and amplified to rifampicin resistant TB and MDR-TB cases and MDR-TB treated cases and those with CNS, spinal, miliary or cryptic disseminated TB
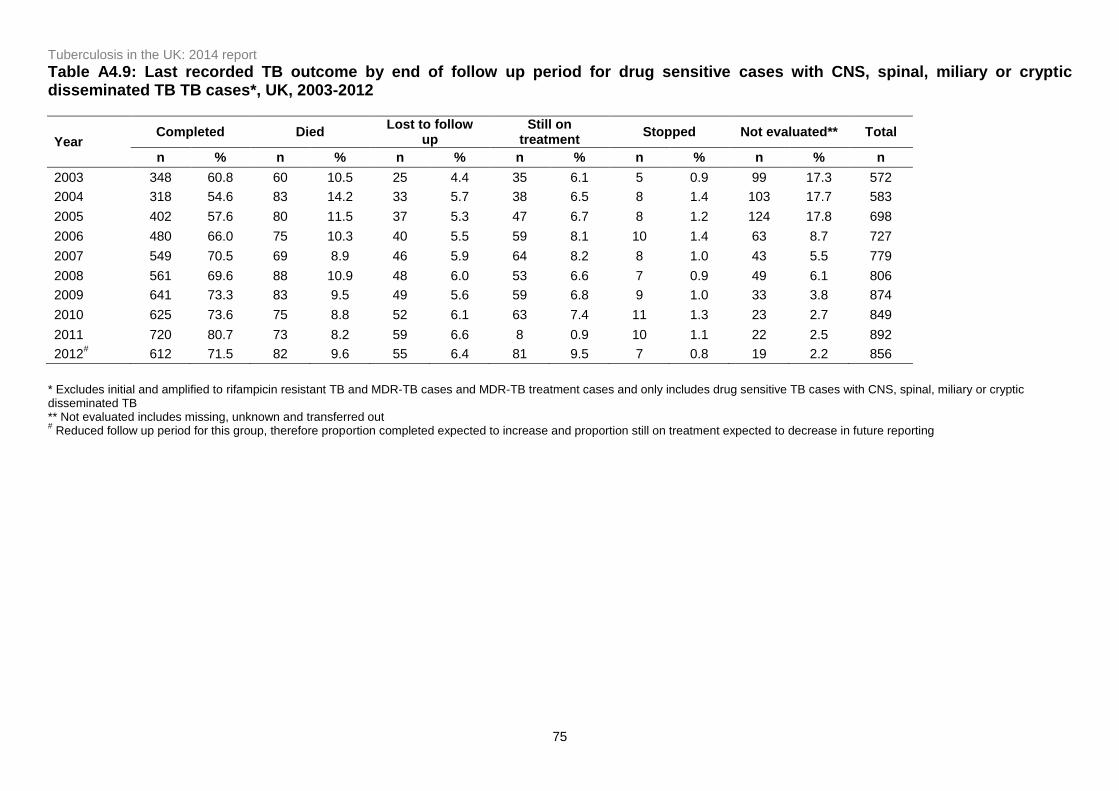
Tuberculosis in the UK: 2014 report
75
Table A4.9: Last recorded TB outcome by end of follow up period for drug sensitive cases with CNS, spinal, miliary or cryptic disseminated TB TB cases*, UK, 2003-2012
Year Completed Died
Lost to follow up
Still on treatment
Stopped Not evaluated** Total
n % n % n % n % n % n % n
2003 348 60.8 60 10.5 25 4.4 35 6.1 5 0.9 99 17.3 572
2004 318 54.6 83 14.2 33 5.7 38 6.5 8 1.4 103 17.7 583
2005 402 57.6 80 11.5 37 5.3 47 6.7 8 1.2 124 17.8 698
2006 480 66.0 75 10.3 40 5.5 59 8.1 10 1.4 63 8.7 727
2007 549 70.5 69 8.9 46 5.9 64 8.2 8 1.0 43 5.5 779
2008 561 69.6 88 10.9 48 6.0 53 6.6 7 0.9 49 6.1 806
2009 641 73.3 83 9.5 49 5.6 59 6.8 9 1.0 33 3.8 874
2010 625 73.6 75 8.8 52 6.1 63 7.4 11 1.3 23 2.7 849
2011 720 80.7 73 8.2 59 6.6 8 0.9 10 1.1 22 2.5 892
2012# 612 71.5 82 9.6 55 6.4 81 9.5 7 0.8 19 2.2 856
* Excludes initial and amplified to rifampicin resistant TB and MDR-TB cases and MDR-TB treatment cases and only includes drug sensitive TB cases with CNS, spinal, miliary or cryptic disseminated TB ** Not evaluated includes missing, unknown and transferred out # Reduced follow up period for this group, therefore proportion completed expected to increase and proportion still on treatment expected to decrease in future reporting

Tuberculosis in the UK: 2014 report
76
Table A4.10: Median time to treatment completion for drug sensitive cases with CNS, spinal, miliary or cryptic disseminated TB cases*, UK, 2003-2012
Year Cases
reported
Completed 95% confidence interval
Median Range n %
2003 572 348 60.8 56.7 - 64.9 315 180 - 406
2004 583 318 54.6 50.4 - 58.6 282 180 - 785
2005 698 402 57.6 53.8 - 61.3 334 180 - 1,183
2006 727 480 66.0 62.5 - 69.5 303 180 - 883
2007 779 549 70.5 67.1 - 73.7 351 180 - 831
2008 806 561 69.6 66.3 - 72.8 358 180 - 976
2009 874 641 73.3 70.3 - 76.2 360 180 - 1,402
2010 849 625 73.6 70.5 - 76.6 362 180 - 1,058
2011 892 720 80.7 78.0 - 83.3 365 180 - 1,029
2012 856 612 71.5 68.3 - 74.5 363 180 - 743
Total 7,636 5,256 68.8 67.8 - 69.9 359 180 - 1,402
* Excludes initial and amplified to rifampicin resistant TB and MDR-TB cases and MDR-TB treatment cases and only includes drug sensitive TB cases with CNS, spinal, miliary or cryptic disseminated TB

Tuberculosis in the UK: 2014 report
77
Table A4.11: Drug sensitive* TB cases reported to have died at last recorded outcome, UK, 2003-2012
Year Cases
reported
Total deaths TB caused or contributed to
death
TB incidental to death
Unknown
n % n % n % n %
2003 7,147 466 6.5 173 37.1 96 20.6 197 42.3
2004 7,521 474 6.3 182 38.4 122 25.7 170 35.9
2005 8,228 514 6.2 172 33.5 125 24.3 217 42.2
2006 8,229 490 6.0 165 33.7 106 21.6 219 44.7
2007 8,184 484 5.9 164 33.9 97 20.0 223 46.1
2008 8,417 491 5.8 175 35.6 117 23.8 199 40.5
2009 8,802 480 5.5 175 36.5 102 21.3 203 42.3
2010 8,318 446 5.4 131 29.4 122 27.4 193 43.3
2011 8,825 439 5.0 131 29.8 110 25.1 198 45.1
2012 8,630 432 5.0 140 32.4 98 22.7 194 44.9
* Excludes initial and amplified to rifampicin resistant TB and MDR-TB cases and MDR-TB treatment cases
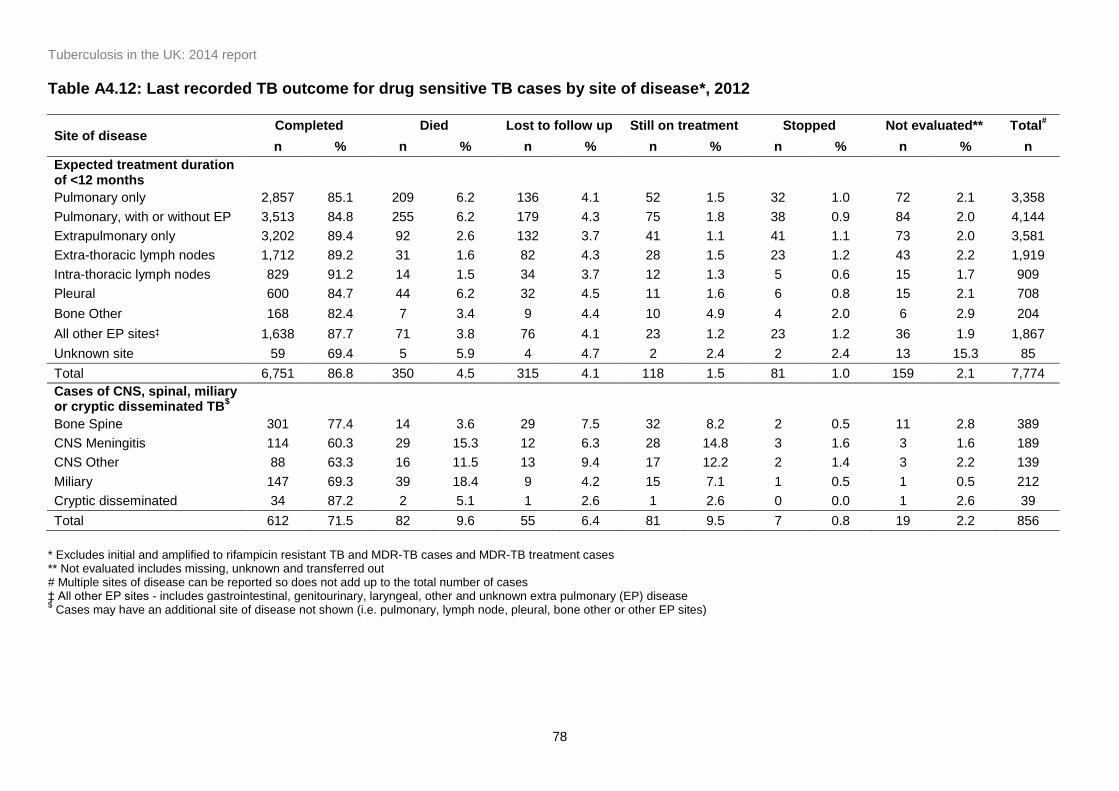
Tuberculosis in the UK: 2014 report
78
Table A4.12: Last recorded TB outcome for drug sensitive TB cases by site of disease*, 2012
Site of disease Completed Died Lost to follow up Still on treatment Stopped Not evaluated** Total
#
n % n % n % n % n % n % n
Expected treatment duration of <12 months
Pulmonary only 2,857 85.1 209 6.2 136 4.1 52 1.5 32 1.0 72 2.1 3,358
Pulmonary, with or without EP 3,513 84.8 255 6.2 179 4.3 75 1.8 38 0.9 84 2.0 4,144
Extrapulmonary only 3,202 89.4 92 2.6 132 3.7 41 1.1 41 1.1 73 2.0 3,581
Extra-thoracic lymph nodes 1,712 89.2 31 1.6 82 4.3 28 1.5 23 1.2 43 2.2 1,919
Intra-thoracic lymph nodes 829 91.2 14 1.5 34 3.7 12 1.3 5 0.6 15 1.7 909
Pleural 600 84.7 44 6.2 32 4.5 11 1.6 6 0.8 15 2.1 708
Bone Other 168 82.4 7 3.4 9 4.4 10 4.9 4 2.0 6 2.9 204
All other EP sites‡ 1,638 87.7 71 3.8 76 4.1 23 1.2 23 1.2 36 1.9 1,867
Unknown site 59 69.4 5 5.9 4 4.7 2 2.4 2 2.4 13 15.3 85
Total 6,751 86.8 350 4.5 315 4.1 118 1.5 81 1.0 159 2.1 7,774
Cases of CNS, spinal, miliary or cryptic disseminated TB
$
Bone Spine 301 77.4 14 3.6 29 7.5 32 8.2 2 0.5 11 2.8 389
CNS Meningitis 114 60.3 29 15.3 12 6.3 28 14.8 3 1.6 3 1.6 189
CNS Other 88 63.3 16 11.5 13 9.4 17 12.2 2 1.4 3 2.2 139
Miliary 147 69.3 39 18.4 9 4.2 15 7.1 1 0.5 1 0.5 212
Cryptic disseminated 34 87.2 2 5.1 1 2.6 1 2.6 0 0.0 1 2.6 39
Total 612 71.5 82 9.6 55 6.4 81 9.5 7 0.8 19 2.2 856
* Excludes initial and amplified to rifampicin resistant TB and MDR-TB cases and MDR-TB treatment cases ** Not evaluated includes missing, unknown and transferred out # Multiple sites of disease can be reported so does not add up to the total number of cases ‡ All other EP sites - includes gastrointestinal, genitourinary, laryngeal, other and unknown extra pulmonary (EP) disease $ Cases may have an additional site of disease not shown (i.e. pulmonary, lymph node, pleural, bone other or other EP sites)
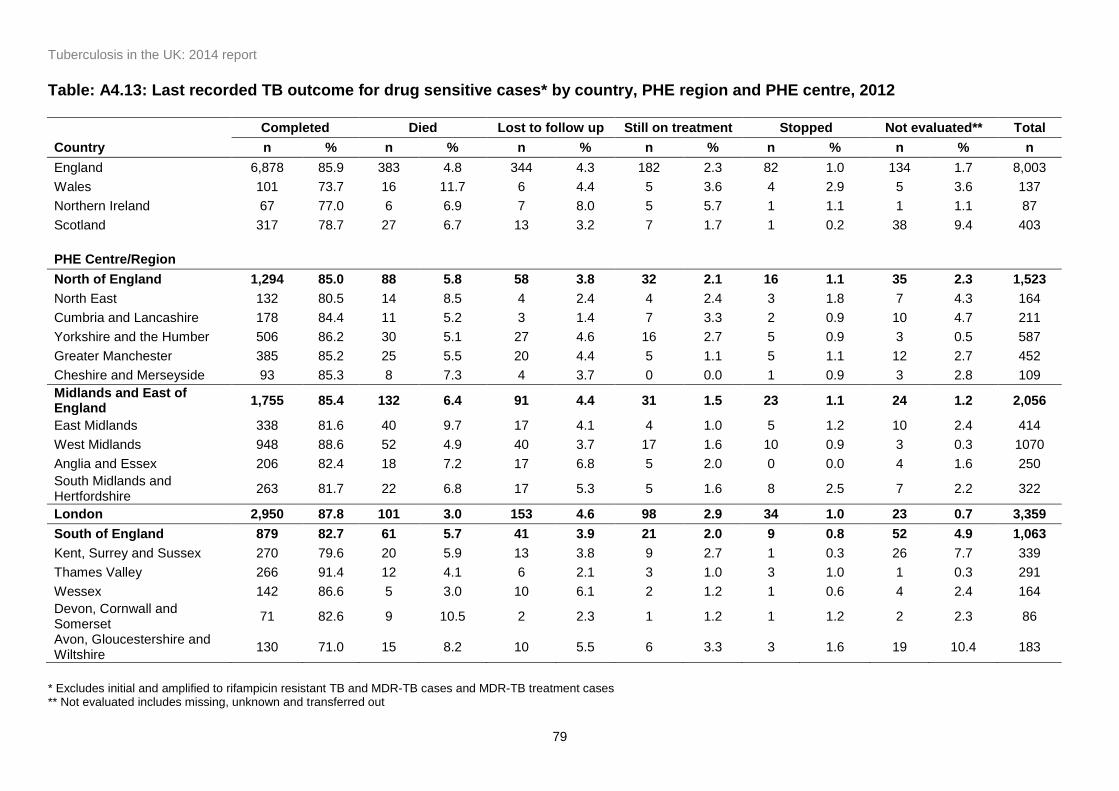
Tuberculosis in the UK: 2014 report
79
Table: A4.13: Last recorded TB outcome for drug sensitive cases* by country, PHE region and PHE centre, 2012
Completed Died Lost to follow up Still on treatment Stopped Not evaluated** Total
Country n % n % n % n % n % n % n
England 6,878 85.9 383 4.8 344 4.3 182 2.3 82 1.0 134 1.7 8,003
Wales 101 73.7 16 11.7 6 4.4 5 3.6 4 2.9 5 3.6 137
Northern Ireland 67 77.0 6 6.9 7 8.0 5 5.7 1 1.1 1 1.1 87
Scotland 317 78.7 27 6.7 13 3.2 7 1.7 1 0.2 38 9.4 403
PHE Centre/Region
North of England 1,294 85.0 88 5.8 58 3.8 32 2.1 16 1.1 35 2.3 1,523
North East 132 80.5 14 8.5 4 2.4 4 2.4 3 1.8 7 4.3 164
Cumbria and Lancashire 178 84.4 11 5.2 3 1.4 7 3.3 2 0.9 10 4.7 211
Yorkshire and the Humber 506 86.2 30 5.1 27 4.6 16 2.7 5 0.9 3 0.5 587
Greater Manchester 385 85.2 25 5.5 20 4.4 5 1.1 5 1.1 12 2.7 452
Cheshire and Merseyside 93 85.3 8 7.3 4 3.7 0 0.0 1 0.9 3 2.8 109
Midlands and East of England
1,755 85.4 132 6.4 91 4.4 31 1.5 23 1.1 24 1.2 2,056
East Midlands 338 81.6 40 9.7 17 4.1 4 1.0 5 1.2 10 2.4 414
West Midlands 948 88.6 52 4.9 40 3.7 17 1.6 10 0.9 3 0.3 1070
Anglia and Essex 206 82.4 18 7.2 17 6.8 5 2.0 0 0.0 4 1.6 250
South Midlands and Hertfordshire
263 81.7 22 6.8 17 5.3 5 1.6 8 2.5 7 2.2 322
London 2,950 87.8 101 3.0 153 4.6 98 2.9 34 1.0 23 0.7 3,359
South of England 879 82.7 61 5.7 41 3.9 21 2.0 9 0.8 52 4.9 1,063
Kent, Surrey and Sussex 270 79.6 20 5.9 13 3.8 9 2.7 1 0.3 26 7.7 339
Thames Valley 266 91.4 12 4.1 6 2.1 3 1.0 3 1.0 1 0.3 291
Wessex 142 86.6 5 3.0 10 6.1 2 1.2 1 0.6 4 2.4 164
Devon, Cornwall and Somerset
71 82.6 9 10.5 2 2.3 1 1.2 1 1.2 2 2.3 86
Avon, Gloucestershire and Wiltshire
130 71.0 15 8.2 10 5.5 6 3.3 3 1.6 19 10.4 183
* Excludes initial and amplified to rifampicin resistant TB and MDR-TB cases and MDR-TB treatment cases ** Not evaluated includes missing, unknown and transferred out
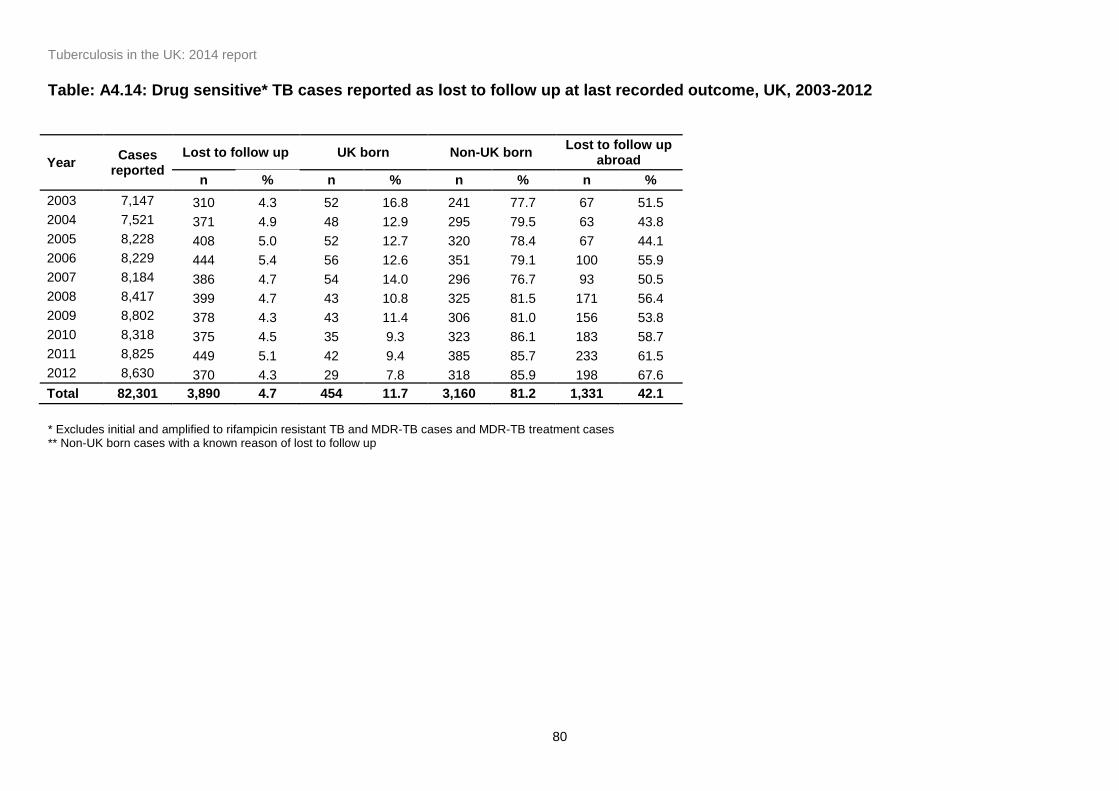
Tuberculosis in the UK: 2014 report
80
Table: A4.14: Drug sensitive* TB cases reported as lost to follow up at last recorded outcome, UK, 2003-2012
Year Cases
reported
Lost to follow up UK born Non-UK born Lost to follow up
abroad
n % n % n % n %
2003 7,147 310 4.3 52 16.8 241 77.7 67 51.5
2004 7,521 371 4.9 48 12.9 295 79.5 63 43.8
2005 8,228 408 5.0 52 12.7 320 78.4 67 44.1
2006 8,229 444 5.4 56 12.6 351 79.1 100 55.9
2007 8,184 386 4.7 54 14.0 296 76.7 93 50.5
2008 8,417 399 4.7 43 10.8 325 81.5 171 56.4
2009 8,802 378 4.3 43 11.4 306 81.0 156 53.8
2010 8,318 375 4.5 35 9.3 323 86.1 183 58.7
2011 8,825 449 5.1 42 9.4 385 85.7 233 61.5
2012 8,630 370 4.3 29 7.8 318 85.9 198 67.6
Total 82,301 3,890 4.7 454 11.7 3,160 81.2 1,331 42.1
* Excludes initial and amplified to rifampicin resistant TB and MDR-TB cases and MDR-TB treatment cases ** Non-UK born cases with a known reason of lost to follow up
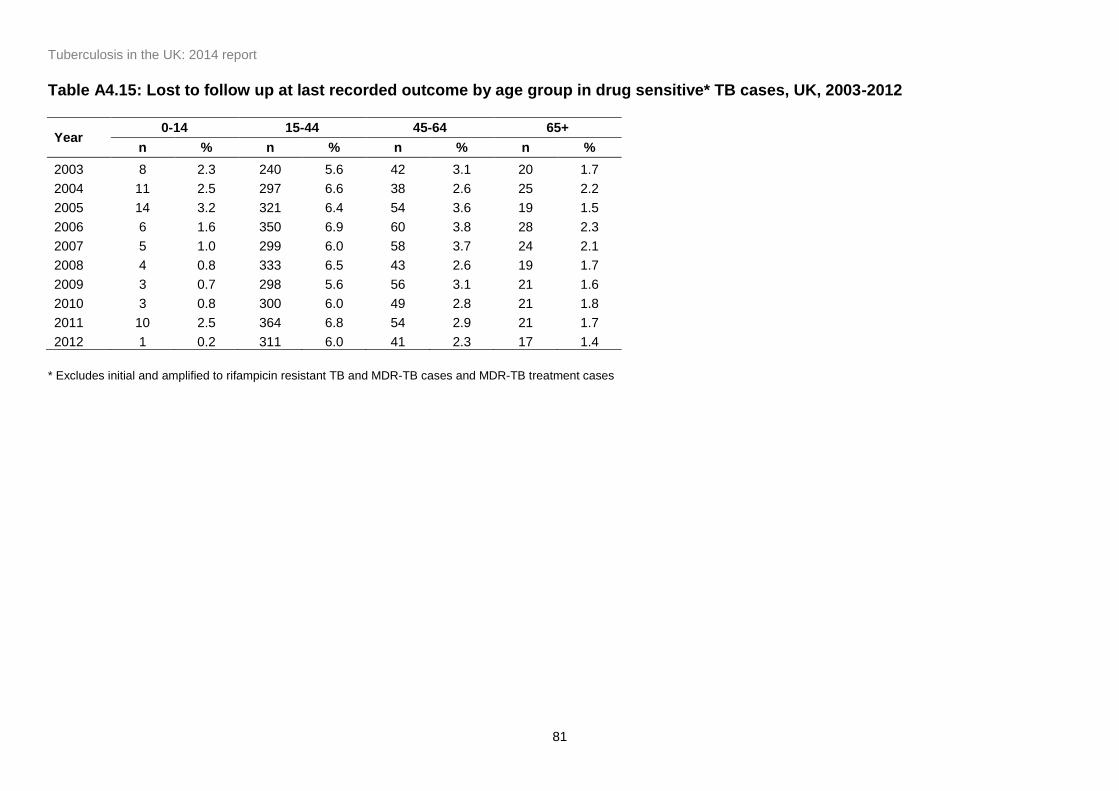
Tuberculosis in the UK: 2014 report
81
Table A4.15: Lost to follow up at last recorded outcome by age group in drug sensitive* TB cases, UK, 2003-2012
Year 0-14 15-44 45-64 65+
n % n % n % n %
2003 8 2.3 240 5.6 42 3.1 20 1.7
2004 11 2.5 297 6.6 38 2.6 25 2.2
2005 14 3.2 321 6.4 54 3.6 19 1.5
2006 6 1.6 350 6.9 60 3.8 28 2.3
2007 5 1.0 299 6.0 58 3.7 24 2.1
2008 4 0.8 333 6.5 43 2.6 19 1.7
2009 3 0.7 298 5.6 56 3.1 21 1.6
2010 3 0.8 300 6.0 49 2.8 21 1.8
2011 10 2.5 364 6.8 54 2.9 21 1.7
2012 1 0.2 311 6.0 41 2.3 17 1.4
* Excludes initial and amplified to rifampicin resistant TB and MDR-TB cases and MDR-TB treatment cases
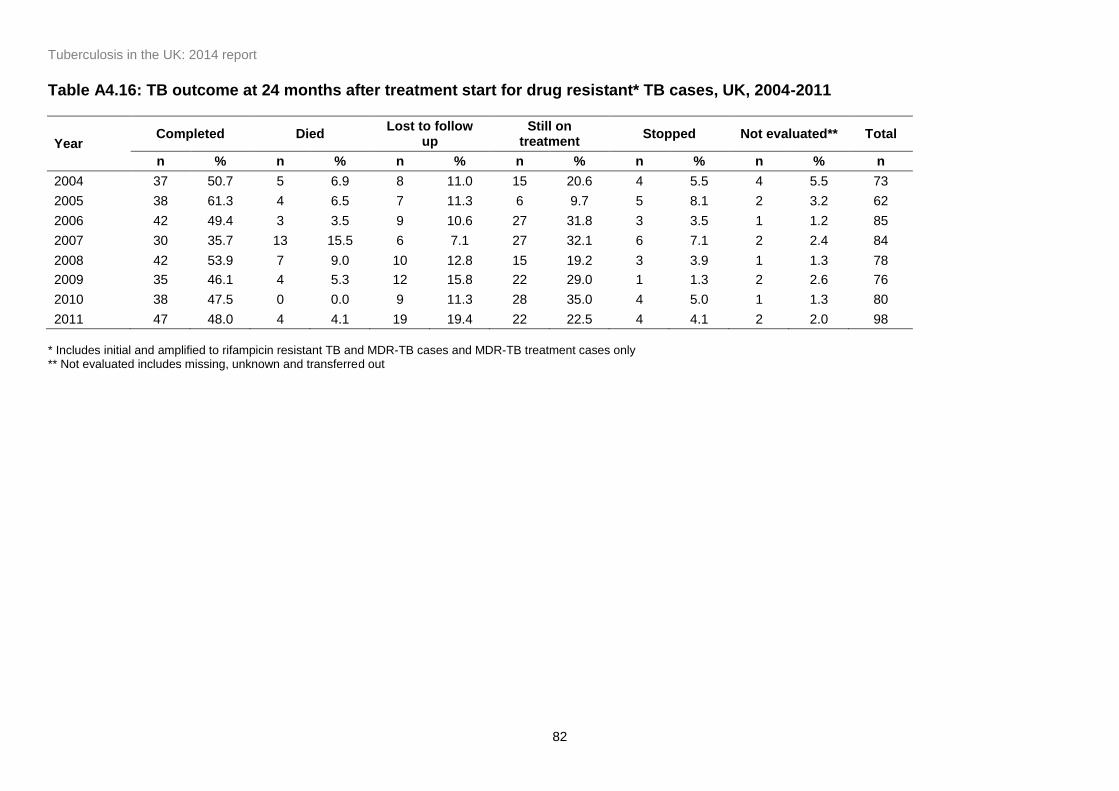
Tuberculosis in the UK: 2014 report
82
Table A4.16: TB outcome at 24 months after treatment start for drug resistant* TB cases, UK, 2004-2011
Year Completed Died
Lost to follow up
Still on treatment
Stopped Not evaluated** Total
n % n % n % n % n % n % n
2004 37 50.7 5 6.9 8 11.0 15 20.6 4 5.5 4 5.5 73
2005 38 61.3 4 6.5 7 11.3 6 9.7 5 8.1 2 3.2 62
2006 42 49.4 3 3.5 9 10.6 27 31.8 3 3.5 1 1.2 85
2007 30 35.7 13 15.5 6 7.1 27 32.1 6 7.1 2 2.4 84
2008 42 53.9 7 9.0 10 12.8 15 19.2 3 3.9 1 1.3 78
2009 35 46.1 4 5.3 12 15.8 22 29.0 1 1.3 2 2.6 76
2010 38 47.5 0 0.0 9 11.3 28 35.0 4 5.0 1 1.3 80
2011 47 48.0 4 4.1 19 19.4 22 22.5 4 4.1 2 2.0 98
* Includes initial and amplified to rifampicin resistant TB and MDR-TB cases and MDR-TB treatment cases only ** Not evaluated includes missing, unknown and transferred out
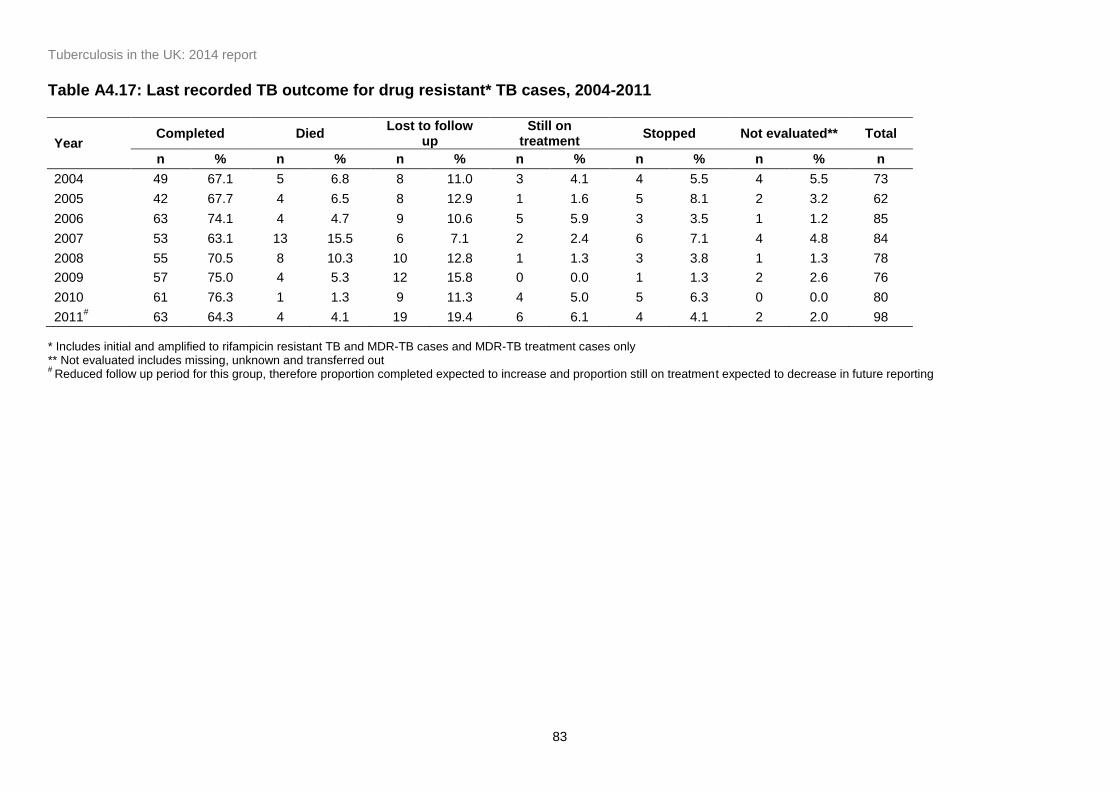
Tuberculosis in the UK: 2014 report
83
Table A4.17: Last recorded TB outcome for drug resistant* TB cases, 2004-2011
Year Completed Died
Lost to follow up
Still on treatment
Stopped Not evaluated** Total
n % n % n % n % n % n % n
2004 49 67.1 5 6.8 8 11.0 3 4.1 4 5.5 4 5.5 73
2005 42 67.7 4 6.5 8 12.9 1 1.6 5 8.1 2 3.2 62
2006 63 74.1 4 4.7 9 10.6 5 5.9 3 3.5 1 1.2 85
2007 53 63.1 13 15.5 6 7.1 2 2.4 6 7.1 4 4.8 84
2008 55 70.5 8 10.3 10 12.8 1 1.3 3 3.8 1 1.3 78
2009 57 75.0 4 5.3 12 15.8 0 0.0 1 1.3 2 2.6 76
2010 61 76.3 1 1.3 9 11.3 4 5.0 5 6.3 0 0.0 80
2011# 63 64.3 4 4.1 19 19.4 6 6.1 4 4.1 2 2.0 98
* Includes initial and amplified to rifampicin resistant TB and MDR-TB cases and MDR-TB treatment cases only ** Not evaluated includes missing, unknown and transferred out #
Reduced follow up period for this group, therefore proportion completed expected to increase and proportion still on treatment expected to decrease in future reporting

Tuberculosis in the UK: 2014 report
84
Table A4.18: Median time to treatment completion for drug resistant* TB cases, UK, 2003-2012
Year Cases
reported
Completed 95% confidence interval
Median Range n %
2004 73 49 67.1 55.1 - 77.7 585 201 - 1,955
2005 62 42 67.7 54.7 - 79.1 581 216 - 810
2006 85 63 74.1 63.5 - 83.0 622 362 - 1,099
2007 84 53 63.1 51.9 - 73.4 731 180 - 1,116
2008 78 55 70.5 59.1 - 80.3 634 361 - 985
2009 76 57 75.0 63.7 - 84.2 695 190 - 1,188
2010 80 61 76.3 65.4 - 85.1 648 271 - 1,103
2011 98 63 64.3 54.0 - 73.7 698 340 - 922
Total 761 465 61.1 57.5 - 64.6 624 180 - 1955
* Includes initial and amplified to rifampicin resistant TB and MDR-TB cases and MDR-TB treatment cases only

Tuberculosis in the UK: 2014 report
85
Table A4.19: Lost to follow up at last recorded outcome in drug resistant* TB cases by country of birth, UK, 2004-2011
Year Cases
reported
Lost to follow up UK born Non-UK born Lost to follow up
abroad**
n % n % n % n %
2004 73 8 11.0 0 0.0 7 87.5 4 57.1
2005 62 8 11.3 1 12.5 7 87.5 5 83.3
2006 85 9 10.6 1 11.1 8 88.9 5 71.4
2007 84 6 7.1 0 0.0 6 100.0 5 100.0
2008 78 10 12.8 0 0.0 10 100.0 8 80.0
2009 76 12 15.8 0 0.0 11 91.7 8 72.7
2010 80 9 11.3 0 0.0 9 100.0 8 88.9
2011 98 19 19.4 0 0.0 19 100.0 15 78.9
Total 761 86 11.3 2 2.3 80 93.0 58 72.5
* Includes initial and amplified to rifampicin resistant TB and MDR-TB cases and MDR-TB treatment cases only ** Non-UK born cases with a known reason of lost to follow up

Tuberculosis in the UK: 2014 report
86
Appendix II. Methods
Data Production
Case notifications
Cases in England, Wales and Northern Ireland are notified to the Enhanced Tuberculosis
Surveillance system (ETS). Cases in London region are currently notified to the London TB
Register (LTBR). Data from the LTBR is routinely imported to ETS. Cases in Scotland are
notified to the Enhanced Surveillance of Mycobacterial Infections (ESMI). Data from ETS and
ESMI are compiled for the purpose of UK reporting.
Matching laboratory isolates to case notifications
Data from all TB isolates identified in the four UK mycobacterium reference laboratories
between January 2003 and March 2014 were deduplicated and a summary record was
generated from all the isolates from the same individual within a 12 month period. MDR-TB
cases that received treatment for longer than 12 months were reviewed and summarised
outwith the 12-month period. These data were then matched to TB case notifications from
2003-2013, through a probabilistic matching process based on patient identifiers common to
both the laboratory isolate and the case notification [8]. Matches were also subject to manual
review to identify any false positive or false negative matches.
In addition, isolates and cases are matched in ETS; automatically where patient identifiers are
identical or manually by frontline users where differences in patient identifiers occur. These
matches were included in the production of the full dataset.
Data cleaning to improve data quality
In addition to validation checks at data entry and routine cleaning queries that identify missing
or inconsistent data within ETS, the following cleaning was subsequently carried out to
produce the dataset used in reporting.
Cases of BCGosis, patients with latent TB on chemoprophylaxis or cases of non-tuberculosis
mycobacteria who had been notified in error were identified using comments fields, queried
with clinics and denotified. Cases with culture confirmed results who were denotified were also
queried with clinics, and lab contaminations were removed or cases were renotified if they
were found to have been denotified in error.
The site of disease was reclassified to pulmonary if a positive sputum sample was recorded at
any time during treatment or, for culture confirmed cases, a positive culture was grown from a

Tuberculosis in the UK: 2014 report
87
pulmonary laboratory specimen. Site of disease for cases with extra-pulmonary disease was
reclassified for culture confirmed cases based on the site in the body where the specimen was
taken.
Occupation was categorised into the main occupation groups using the free text field, where
occupation was recorded as unknown or other.
The presence or absence of the social risk factors drug or alcohol misuse, homelessness and
prison were updated based on information in the comments fields. Drug misuse was updated
to yes if recorded as unknown but current or past drug misuse was mentioned in the
comments fields.
Alcohol use was updated if alcohol use was mentioned in the comments along with evidence
that the patient was non-compliant or on DOT, in line with the definition that alcohol affects the
ability to self administer treatment.
Homelessness was updated to yes if mentioned in the comments fields or if the address given
was “no fixed abode” or a shelter/hostel was named. Named homeless shelters/hostels were
confirmed to be for homeless residents.
Prison was updated to yes if mentioned in the comments fields or if HMP or a prison was
recorded as the address.
Children under 16 with drug or alcohol use recorded had data queried with the clinic and
corrected as appropriate.
Data cleaning of TB outcomes
Where ‘date of death’ and ‘post mortem date of death’ differed, the date of death was validated
using ONS mortality data and updated. Deaths were classified as post mortem deaths if the
date of death was earlier than the date of diagnosis, where date of diagnosis was available.
For cases who died and treatment start date was available, cases were reclassified as died at
12, 24 or 36 months based on the time between the date of starting treatment and the date of
death. Where the date of treatment start was not available, the case report date was used.
Outliers were queried with the clinic.
For cases who completed treatment and treatment start date was available, cases were
reclassified as completed at 12, 24 or 36 months based on the time between the date of
treatment start and the date of treatment completion. Where treatment start date was not
available ‘case report date’ was used. Outliers were queried with the clinic.
Tuberculosis in the UK: 2014 report
88
For cases with no known treatment outcome, data was updated based on comments fields.
For cases who were transferred to another clinic but a duplicate was entered in error the
treatment outcome was used from the record where it was recorded and the duplicate was
removed.
Reporting methodology
Tuberculosis rates
Overall tuberculosis rates per 100,000 population, as well as those by age, sex and area of
reporting, were calculated for the UK using the mid-year population estimates provided by the
Office for National Statistics (ONS).
Rates by place of birth and by ethnic group were calculated using population estimates from
the Labour Force Survey (LFS). The LFS is based on a population sample, so estimates are
liable to sampling errors, particularly for small population subgroups, and should be interpreted
with caution.
Rates for the most frequent countries of birth of non-UK born cases were calculated using
population estimates from the Annual Population Survey (APS).
Numbers of recent migrants were calculated using data on the number of people issued with a
UK entry clearance visa to stay for longer than 6 months, obtained from Home Office UK Visas
and Immigration Proviso-Central Reference System (CRS) visa case working system
published by ONS. Countries of birth for migrants were divided into 4 categories using the
World Health Organisation (WHO) estimated incidence rates for 2012. The categories were
<40, 40-150, 150-250 and ≥251 cases per 100,000 population.
TB rates detected during pre-entry TB screening were calculated by taking the cases detected
as the numerator and the number of applicants screened in the same year as the
denominator.
Three-year average rates
The three-year rolling average rates for TB incidence have been calculated by first calculating
a three-year average figure for the number of new TB cases (the numerator), and then the
denominator used is the mid-year population data for the middle year of the three year period.
DOT interpretation
The variables for collecting information on DOT are slightly different in ETS and LTBR. In ETS,
the relevant variable is “Is the patient to begin a course of treatment under direct
Tuberculosis in the UK: 2014 report
89
observation?”. In LTBR the relevant variable is “Patient was taking Directly Observed Therapy
at any time during the episode of care”. For the purposes of this report, a report of ‘yes’ for
either variable was taken as an indication that the patient had received DOT.
Reporting of Mycobacterium species
The species field was reclassified based on MIRU-VNTR phylotypic lineage (see below); those
reported as MTBC with a phylotypic lineage of EAI, Beijing, CAS, or Euro-american were
reclassified as M. tuberculosis. Those reported as M. tuberculosis or MTBC with phylotypic
lineage of M. bovis or M. africanum were reclassified as M. bovis or M. africanum respectively.
Reporting drug resistance
Initial resistance is classed as resistance identified within three months of the first specimen
date. However, if there was evidence of amplification of resistance within this three month
period, based on a change from a sensitive to resistant result following start of treatment, then
these were reclassified as amplified resistance. Any result which changed from sensitive to
resistant after the three month period was automatically counted as amplification. If no drug
susceptibility results were available for isolates cultured in the first three months, any
subsequent susceptibility results were not used, unless MDR-TB was identified. To ensure that
all MDR-TB cases were counted, where the first drug susceptibility test available was positive
for MDR-TB after the three month cut off, with no evidence of amplification, this MDR-TB result
was classified as initial resistance.
MDR-TB Treatment
Additional cases treated for MDR-TB, but not culture confirmed, were identified using key word
searches on the comment fields on the ETS case reports.
Strain typing
Strain types were assigned cluster numbers and phylogenetic lineage (based on MIRU-VNTR)
using data from the “UK TB Cluster Naming Resource”
(http://bioinformatics.phe.org.uk/TBCluster/tbhome.php) for those with a strain type with at
least 23 loci.
A cluster was defined as two or more cases with indistinguishable 24 MIRU-VNTR strain types
with at least one case with a complete 24 loci profile [2]. Additional cases in the cluster may
each have one missing loci. In addition there are clusters identified by the Mycobacteria
Reference Laboratories where all cases in the cluster have one untypable locus at the same
locus which are designated as u clusters. The year a cluster was assigned to being a new
cluster was the year of notification of the second case in the cluster.

Tuberculosis in the UK: 2014 report
90
Cases that are part of a cluster are referred to as clustered cases. Clustered cases were
presented nationally, and stratified by geographical area. Clustered cases within a
geographical area were only defined as clustered if they were in a cluster with other cases
within the same the area.
TB outcome cohorts
For the purposes of TB outcome reporting, the drug sensitive cohort is defined as all TB
cases, excluding those with rifampicin resistant TB or MDR-TB (initial or amplified), or non-
culture confirmed cases treated as MDR-TB [4]. In this report, treatment outcomes for drug
sensitive TB cases are reported separately for the following groups:
for cases with an expected duration of treatment less than 12 months, treatment
outcomes at 12 months are reported. This group excludes cases with CNS disease,
who have an expected duration of treatment of 12 months. In addition, those with
spinal, cryptic disseminated or miliary disease are excluded from this group, as CNS
involvement cannot be reliably ruled out for the purposes of reporting
for cases with CNS, spinal, cryptic disseminated or miliary disease, the last recorded
treatment outcome is reported
The drug resistant cohort included any cases with rifampicin resistant TB or MDR-TB (initial or
amplified) as well as those without culture confirmation treated for MDR-TB.
A TB outcome is assigned to each member of these cohorts; those that have an unknown
treatment outcome, or recorded as transferred to another clinic are assigned the outcome “not
evaluated”.
As well as reporting outcomes at defined time periods (at 12 and 24 months for drug sensitive
and drug resistant cohorts respectively), a last recorded outcome was collected and reported
for those still on treatment beyond the 12 and 24 month time periods.
Specifically, for this report the following groups have been presented:
drug sensitive cohort with expected course of treatment less than 12 months TB
outcomes were reported at 12 months, with analysis of treatment completion at 12
months
drug sensitive cohort with CNS, spinal, miliary or cryptic disseminated TB had
outcomes reported for the last recorded outcome
analysis of deaths in the entire drug sensitive cohort (including CNS, spinal, miliary or
cryptic disseminated TB) were presented for the last recorded outcome
analysis of loss to follow up in the entire drug sensitive cohort was presented for the
last recorded outcome

Tuberculosis in the UK: 2014 report
91
drug resistant cohort had TB outcomes reported at 24 months, with analysis of
treatment completion at 24 months
Deaths and loss to follow up of the drug resistant cohort were reported at last recorded
outcome
Confidence intervals
A 95% confidence interval for incidence rates were calculated using a Poisson distribution. For
proportions a binomial distribution was used.
Tuberculosis in the UK: 2014 report
92
Appendix III. Surveillance data quality
Data Completeness
Audits of records are undertaken annually based on the criteria suggested in the 2007
Department of Health TB Toolkit for Commissioners [9] which outlines the minimum quality
standards for surveillance. Table 5.1 shows the level of completeness of the information for
the Toolkit fields with have a 95% target. To further categorise completeness <95%, 95-98%
and 99-100% completeness are colour coded in the table. The fields “Name”, “Postcode”,
“Date of birth” and “Date of notification” are mandatory fields in Enhanced TB Surveillance
system (ETS) (100% completeness), thus these fields are not included in Table 5.1.
Demographic Variables
The recording of place of birth (UK, non-UK born or unknown) was high and met the target of
99% in all areas, with the exception of Scotland (it should be noted that this was introduced as
a mandatory field in ETS during 2013). A lower proportion of cases (97%) had a known place
of birth (i.e. when those reported as unknown were excluded). An improvement in “known”
information is required to provide useful data outputs. Data completeness for known place of
birth was particularly low for: North East (87% known), Yorkshire and the Humber (92%
known) and Devon, Cornwall and Somerset (88% known). Place of birth was known for 100%
of cases in Thames Valley and Wessex.
The proportion of cases with known ethnic group was >95% in all areas apart from Yorkshire
and Humber and Avon, Gloucestershire and Wiltshire.
NHS number, which is used for matching TB isolates to notified cases, and for identifying
duplicate cases, was very poorly completed. 25% of cases in England, 39% of cases in Wales
and 26% of cases in Northern Ireland did not have an NHS number reported. Forty four
percent of cases in London did not have an NHS number reported.
Clinical Variables
Data reported for previous TB diagnosis was high in all UK countries (99-100% with the
exception of Scotland) but the proportion of those that had a known previous TB diagnosis
(yes or no) was lower, particularly in Wales (93%). This was also a problem in the following
PHECs: Cheshire and Merseyside (91% known), Devon, Cornwall and Somerset (92%
known), Cumbria and Lancashire (93% known), West Midlands (93% known) and South
Midlands and Hertfordshire (93% known).
Tuberculosis in the UK: 2014 report
93
Data reported for previous TB treatment (for those with a previous TB diagnosis) was low
across the UK (overall 80%); with the lowest proportion of 50% in Avon, Gloucestershire and
Wiltshire PHEC; only one PHEC area had completeness of over 95% (Anglia and Essex at
100%).
Similarly, recording of HIV testing across England, Wales and Northern Ireland was low (with
majority ranging 45-89%) with the exception of Thames Valley PHEC, Cheshire and
Merseyside PHEC and London PHEC and (96%, 97%, and 99% respectively).
Social Risk Factor Variables
In England, Wales and Northern Ireland, the proportion of cases with information reported on
social risk factors (prison, drug misuse, alcohol abuse and homelessness) was high (all risk
factors 98%) but a lower proportion of cases (92, 93, 93, 94% respectively) had a known
history reported (i.e. not reported as ‘unknown’).
Diagnosis and treatment
The recording of sputum smear status was low (60% overall in the UK), with less than 65% in
all areas in England other than London (76%) (Table 5.2). In contrast, the recording of site of
disease was very high ranging from 98-100% in all areas in England.
Date Variables
In general, the recording of date of symptom onset and date presented was low in the UK, and
the date diagnosed and start of treatment could be improved. All areas in England had less
than 95% reported for date of symptom onset and date presented, with the exception of
Thames Valley (96, 97% respectively). For date of symptom onset and date presented, data
completion was particularly low for: Cumbria and Lancashire (73% and 76% reported), Greater
Manchester (68% and 72% reported) and East Midlands (72% and 65% reported).
The recording of date that treatment was completed was higher than other dates in the
system, perhaps as case managers are prompted to fill in these outcomes and there is active
follow up of this information.
For cases notified in 2012 with a reported outcome of died, the reporting of date of death was
100% in some areas (North East, Yorkshire and the Humber, Cheshire and Merseyside, East
Midlands, Thames Valley and Devon, Cornwall and Somerset PHECs), but was below 95% in
all other PHECs. London only reported the date of death for 28% of those that had died. By
country, Wales had the highest percentage of date of death recorded for those that had died
(94%) and England had the lowest (76%), excluding Scotland which did not report the date of
death for any of those that had died.
Tuberculosis in the UK: 2014 report
94
Treatment Outcome Variables
For cases notified in 2012, treatment outcome was known for more than 95% of cases at 12
months in all PHEC areas except for Kent, Surrey and Sussex (92%), Avon Gloucestershire
and Wiltshire (90%) and Scotland (90%). Known treatment outcome at 24 months for those
that were still on treatment at 12 months was generally good across the UK except for
Cheshire and Merseyside PHEC, West Midlands PHEC and Wessex PHEC (75%, 88% and
50% respectively). However, only small numbers of cases were still on treatment after 12
months in these areas (4 cases in Cheshire and Merseyside and 2 cases in Wessex).
Additional cleaning and validation of treatment outcomes
Data cleaning was conducted as described in appendix II (Methods).
Treatment Outcomes 2004-2013*
Treatment outcomes at 12 months
Fifty two percent (3,439/6,626) of cases with recorded dates on treatment start date and
treatment end date that were recorded as having completed treatment by 12 months, were
found to still be on treatment after data validation. Sixty two cases were reported to have died
by 12 months and were identified to still be on treatment and had died later than 12 months.
For those cases that were initially listed as ‘Unknown’ outcome, 14 had died and 38 were lost
to follow up.
Eighty cases that were initially recorded as having transferred out and 11 cases that were
initially recorded as treatment not completed were actually lost to follow up.
Treatment outcomes at 24 months
Sixty three cases were recorded as having completed treatment at 24 months, but after date
validation were found to still be on treatment at 24 months (in total this is 7% of those initially
recorded as ‘treatment completed’).
Treatment outcomes at 36 months
Only six cases that were initially recorded as treatment completed at 36 months were found to
still be on treatment following data validation. Of those that were previously recorded as ‘died’
two were found to still be on treatment (2/5 cases) at 36 months.
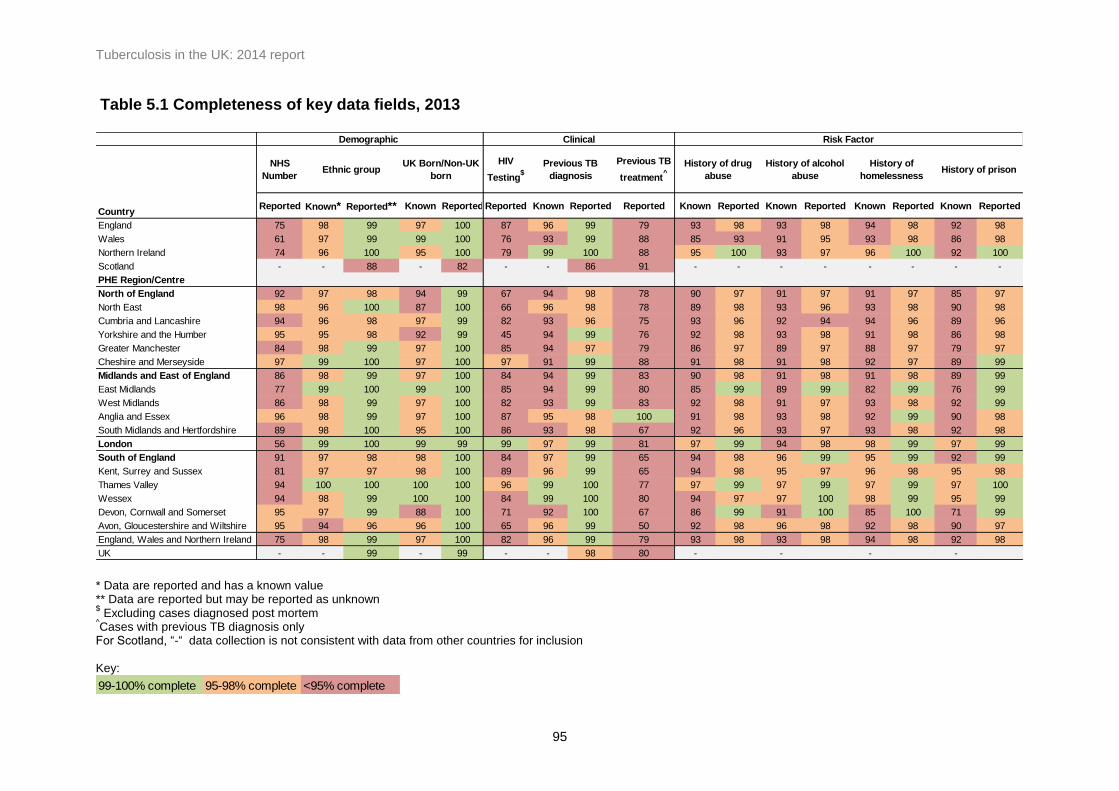
Tuberculosis in the UK: 2014 report
95
Table 5.1 Completeness of key data fields, 2013
NHS
Number
HIV
Testing$
Previous TB
treatment^
Reported Known* Reported** Known Reported Reported Known Reported Reported Known Reported Known Reported Known Reported Known Reported
England 75 98 99 97 100 87 96 99 79 93 98 93 98 94 98 92 98
Wales 61 97 99 99 100 76 93 99 88 85 93 91 95 93 98 86 98
Northern Ireland 74 96 100 95 100 79 99 100 88 95 100 93 97 96 100 92 100
Scotland - - 88 - 82 - - 86 91 - - - - - - - -
PHE Region/Centre
North of England 92 97 98 94 99 67 94 98 78 90 97 91 97 91 97 85 97
North East 98 96 100 87 100 66 96 98 78 89 98 93 96 93 98 90 98
Cumbria and Lancashire 94 96 98 97 99 82 93 96 75 93 96 92 94 94 96 89 96
Yorkshire and the Humber 95 95 98 92 99 45 94 99 76 92 98 93 98 91 98 86 98
Greater Manchester 84 98 99 97 100 85 94 97 79 86 97 89 97 88 97 79 97
Cheshire and Merseyside 97 99 100 97 100 97 91 99 88 91 98 91 98 92 97 89 99
Midlands and East of England 86 98 99 97 100 84 94 99 83 90 98 91 98 91 98 89 99
East Midlands 77 99 100 99 100 85 94 99 80 85 99 89 99 82 99 76 99
West Midlands 86 98 99 97 100 82 93 99 83 92 98 91 97 93 98 92 99
Anglia and Essex 96 98 99 97 100 87 95 98 100 91 98 93 98 92 99 90 98
South Midlands and Hertfordshire 89 98 100 95 100 86 93 98 67 92 96 93 97 93 98 92 98
London 56 99 100 99 99 99 97 99 81 97 99 94 98 98 99 97 99
South of England 91 97 98 98 100 84 97 99 65 94 98 96 99 95 99 92 99
Kent, Surrey and Sussex 81 97 97 98 100 89 96 99 65 94 98 95 97 96 98 95 98
Thames Valley 94 100 100 100 100 96 99 100 77 97 99 97 99 97 99 97 100
Wessex 94 98 99 100 100 84 99 100 80 94 97 97 100 98 99 95 99
Devon, Cornwall and Somerset 95 97 99 88 100 71 92 100 67 86 99 91 100 85 100 71 99
Avon, Gloucestershire and Wiltshire 95 94 96 96 100 65 96 99 50 92 98 96 98 92 98 90 97
England, Wales and Northern Ireland 75 98 99 97 100 82 96 99 79 93 98 93 98 94 98 92 98
UK - - 99 - 99 - - 98 80 - - - -
History of drug
abuse
History of alcohol
abuse
History of
homelessnessHistory of prison
Risk FactorDemographic Clinical
Country
Ethnic groupUK Born/Non-UK
born
Previous TB
diagnosis
* Data are reported and has a known value ** Data are reported but may be reported as unknown $ Excluding cases diagnosed post mortem
^Cases with previous TB diagnosis only
For Scotland, “-“ data collection is not consistent with data from other countries for inclusion Key:
99-100% complete 95-98% complete <95% complete
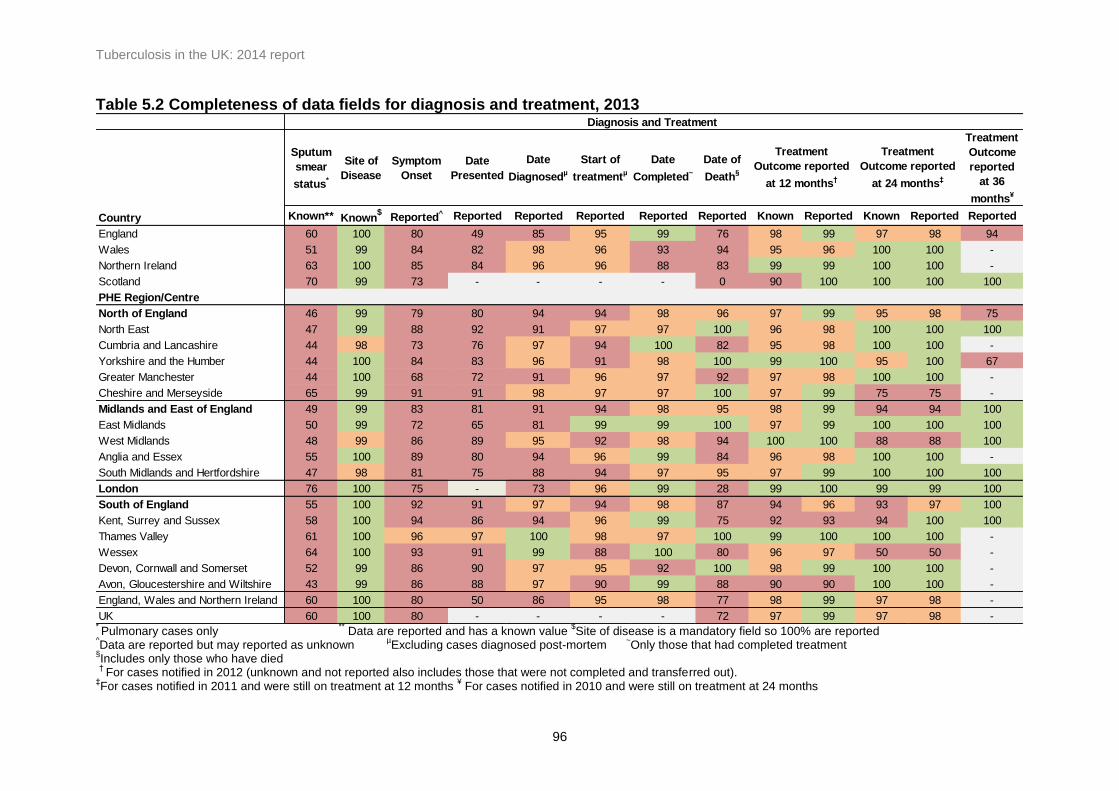
Tuberculosis in the UK: 2014 report
96
Table 5.2 Completeness of data fields for diagnosis and treatment, 2013
Sputum
smear
status*
Site of
Disease
Symptom
Onset
Date
Presented
Date
Diagnosedµ
Start of
treatmentµ
Date
Completed~
Date of
Death§
Treatment
Outcome
reported
at 36
months¥
Known** Known$
Reported^ Reported Reported Reported Reported Reported Known Reported Known Reported Reported
England 60 100 80 49 85 95 99 76 98 99 97 98 94
Wales 51 99 84 82 98 96 93 94 95 96 100 100 -
Northern Ireland 63 100 85 84 96 96 88 83 99 99 100 100 -
Scotland 70 99 73 - - - - 0 90 100 100 100 100
PHE Region/Centre
North of England 46 99 79 80 94 94 98 96 97 99 95 98 75
North East 47 99 88 92 91 97 97 100 96 98 100 100 100
Cumbria and Lancashire 44 98 73 76 97 94 100 82 95 98 100 100 -
Yorkshire and the Humber 44 100 84 83 96 91 98 100 99 100 95 100 67
Greater Manchester 44 100 68 72 91 96 97 92 97 98 100 100 -
Cheshire and Merseyside 65 99 91 91 98 97 97 100 97 99 75 75 -
Midlands and East of England 49 99 83 81 91 94 98 95 98 99 94 94 100
East Midlands 50 99 72 65 81 99 99 100 97 99 100 100 100
West Midlands 48 99 86 89 95 92 98 94 100 100 88 88 100
Anglia and Essex 55 100 89 80 94 96 99 84 96 98 100 100 -
South Midlands and Hertfordshire 47 98 81 75 88 94 97 95 97 99 100 100 100
London 76 100 75 - 73 96 99 28 99 100 99 99 100
South of England 55 100 92 91 97 94 98 87 94 96 93 97 100
Kent, Surrey and Sussex 58 100 94 86 94 96 99 75 92 93 94 100 100
Thames Valley 61 100 96 97 100 98 97 100 99 100 100 100 -
Wessex 64 100 93 91 99 88 100 80 96 97 50 50 -
Devon, Cornwall and Somerset 52 99 86 90 97 95 92 100 98 99 100 100 -
Avon, Gloucestershire and Wiltshire 43 99 86 88 97 90 99 88 90 90 100 100 -
England, Wales and Northern Ireland 60 100 80 50 86 95 98 77 98 99 97 98 -
UK 60 100 80 - - - - 72 97 99 97 98 -
Country
Diagnosis and Treatment
Treatment
Outcome reported
at 12 months†
Treatment
Outcome reported
at 24 months‡
* Pulmonary cases only
** Data are reported and has a known value
$Site of disease is a mandatory field so 100% are reported
^Data are reported but may reported as unknown
µExcluding cases diagnosed post-mortem
~Only those that had completed treatment
§Includes only those who have died
†
For cases notified in 2012 (unknown and not reported also includes those that were not completed and transferred out). ‡For cases notified in 2011 and were still on treatment at 12 months
¥ For cases notified in 2010 and were still on treatment at 24 months

Tuberculosis in the UK: 2014 report
97
Glossary
Amplified resistance
A cultured isolate was drug sensitive to a particular drug, with a subsequent isolate for the
same case found to have resistance to the same drug.
BCG
Bacillus Calmette-Guérin
Cluster
Clusters in this document refer to molecular clusters only. These are defined as a group of 2 or
more patients who are infected with a strain of Mycobacterium tuberculosis complex with
indistinguishable MIRU-VNTR profiles. Each cluster must have at least one person with a full
24 MIRU-VNTR profile, and other members of the cluster may have a maximum of one
missing loci.
Extensively drug resistant TB (XDR-TB)
XDR is defined as resistance to at least isonaizid and rifampicin (MDR), one injectable agent
(capreomycin, kanamycin or amikacin) and one fluoroquinolone.
First line drug resistance
First line drug resistance is defined as resistance to at least one of the first line drugs
(isoniazid, rifampicin, ethambutol, pyrazinamide).
Multi-drug resistant TB (MDR-TB)
MDR is defined as resistance to at least isoniazid and rifampicin, with or without resistance to
other drugs.
Pulmonary tuberculosis
A pulmonary case is defined as a case with TB involving the lungs and/or tracheo-bronchial
tree, with or without extra-pulmonary TB diagnosis. In this report, in line with the WHO’s
recommendation and international reporting definitions, miliary TB is classified as pulmonary
TB due to the presence of lesions in the lungs.