tuberculosis tutorials - github pages · tuberculosis(tb)tutorials 1 tuberculosis(tb)tutorials...
TRANSCRIPT
Tuberculosis Tutorials
These tuberculosis (TB) tutorials were created for the EMOD QuickStart v1.8. Later versions ofthe QuickStart may not be completely compatible with these tutorials as installation and some ofthe demographics, configuration and intervention parameters have been changed. IDM con-tinues to improve our EMOD documentation for training and research, and new and updated TBtutorial information will be added to our new documentation site. As the EMOD documentation ishosted on our new site, most of the links in the PDF will not work. If you have any questions orneed additional information, please contact [email protected].
TheCSS template wasmodified from source designed and built byCherry +AJ from template.co.The template is released under the Creative CommonsAttribution 3.0 license.
Tuberculosis (TB) Tutorials 1
Tuberculosis (TB) TutorialsIn a series of tutorials, each TB-specific feature is explored, allowing themodeler to become acquain-ted with the range of questions that can be approached using the EMOD TBmodel.
There are two ways to use the tutorials. You can read the tutorials information and graphs to learnabout themodel; installing the Quick Start is not required. Or, for amore hands-on approach, youcan also run the simulations that are associated with the tutorials andmake the suggested changesto the configuration files to see the impact on the output graphs. The EMOD executable and all of thefiles needed to run the simulations are included in the Quick Start installation.
The initial tutorials explore the fundamental disease dynamics and age dependence of disease pro-gression.
TB 1: Basic Tuberculosis (TB) Model
TB 2: Age Dependent Immunity
Subsequent tutorials delve into specialized topics of interest to health policy researchers includingcomplex health systems, the cascade of care and co-transmission of drug-sensitive TB andMDR-TB.
TB 3: Health Care Systems
TB 4: Cascade of Care
TB 5: Multidrug-resistant (MDR) TB
The final tutorial provides a simple example of usingmodel burn-in to more realisticallymodel a largepopulation where TB is endemic.
TB 6: Population Burn-in
The TB tutorial directories contain the configuration and campaign files described in the tutorials, aswell as python, batch, and command files to easily run the simulations and generate output charts. Ifyou have not installed the Quick Start, see Installing the Quick Start.
NOTE: These tutorials are for learning purposes only and are not considered scientifically valid.
©Copyright 2015 IntellectualVenturesManagement, LLC (IV)AllRightsReserved.EMOD is licensed under the Creative CommonsAttribution-Noncommercial-ShareAlike 4.0 License.
2 Tuberculosis (TB) Tutorials
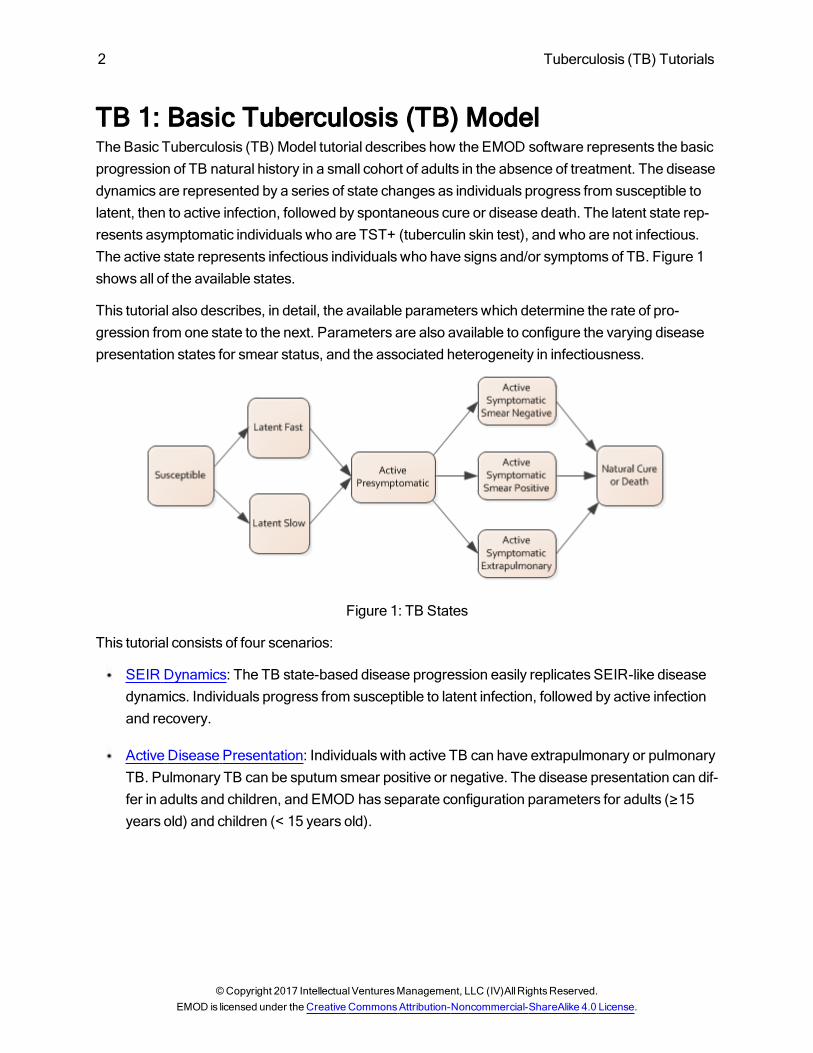
TB 1: Basic Tuberculosis (TB) ModelThe Basic Tuberculosis (TB) Model tutorial describes how the EMOD software represents the basicprogression of TB natural history in a small cohort of adults in the absence of treatment. The diseasedynamics are represented by a series of state changes as individuals progress from susceptible tolatent, then to active infection, followed by spontaneous cure or disease death. The latent state rep-resents asymptomatic individuals who are TST+ (tuberculin skin test), and who are not infectious.The active state represents infectious individuals who have signs and/or symptoms of TB. Figure 1shows all of the available states.
This tutorial also describes, in detail, the available parameters which determine the rate of pro-gression from one state to the next. Parameters are also available to configure the varying diseasepresentation states for smear status, and the associated heterogeneity in infectiousness.
Figure 1: TB States
This tutorial consists of four scenarios:
SEIR Dynamics: The TB state-based disease progression easily replicates SEIR-like diseasedynamics. Individuals progress from susceptible to latent infection, followed by active infectionand recovery.
Active Disease Presentation: Individuals with active TB can have extrapulmonary or pulmonaryTB. Pulmonary TB can be sputum smear positive or negative. The disease presentation can dif-fer in adults and children, and EMOD has separate configuration parameters for adults (≥15years old) and children (< 15 years old).
©Copyright 2017 IntellectualVenturesManagement, LLC (IV)AllRightsReserved.EMOD is licensed under the Creative CommonsAttribution-Noncommercial-ShareAlike 4.0 License.
Tuberculosis (TB) Tutorials 3
Presymptomatic Active State: Individuals progress from latent disease to an active presymp-tomatic state before progressing to the active symptomatic state, reflecting the spectrum of dis-ease from latent to active disease. The presymptomatic state represents a period of reducedinfectivity where patientsmay have objective signs of TB (for example, an increased cough) butlack subjective symptoms (they do not notice their increased cough).
Heterogeneous Progression: Heterogeneity is added in the disease progression time fromlatency (exposed) to active disease by subdividing the exposed population into fast and slowprogressors.
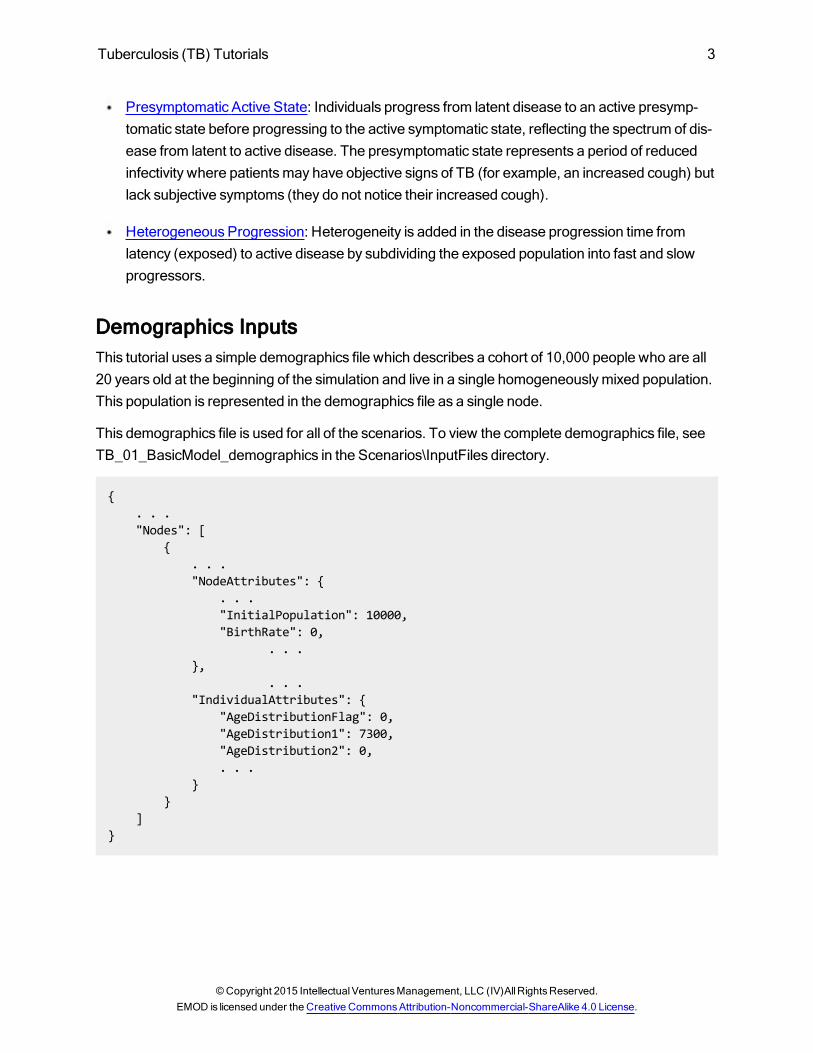
Demographics InputsThis tutorial uses a simple demographics file which describes a cohort of 10,000 people who are all20 years old at the beginning of the simulation and live in a single homogeneouslymixed population.This population is represented in the demographics file as a single node.
This demographics file is used for all of the scenarios. To view the complete demographics file, seeTB_01_BasicModel_demographics in the Scenarios\InputFiles directory.
{. . ."Nodes": [
{. . ."NodeAttributes": {
. . ."InitialPopulation": 10000,"BirthRate": 0,
. . .},
. . ."IndividualAttributes": {
"AgeDistributionFlag": 0,"AgeDistribution1": 7300,"AgeDistribution2": 0,. . .
}}
]}
©Copyright 2015 IntellectualVenturesManagement, LLC (IV)AllRightsReserved.EMOD is licensed under the Creative CommonsAttribution-Noncommercial-ShareAlike 4.0 License.
4 Tuberculosis (TB) Tutorials
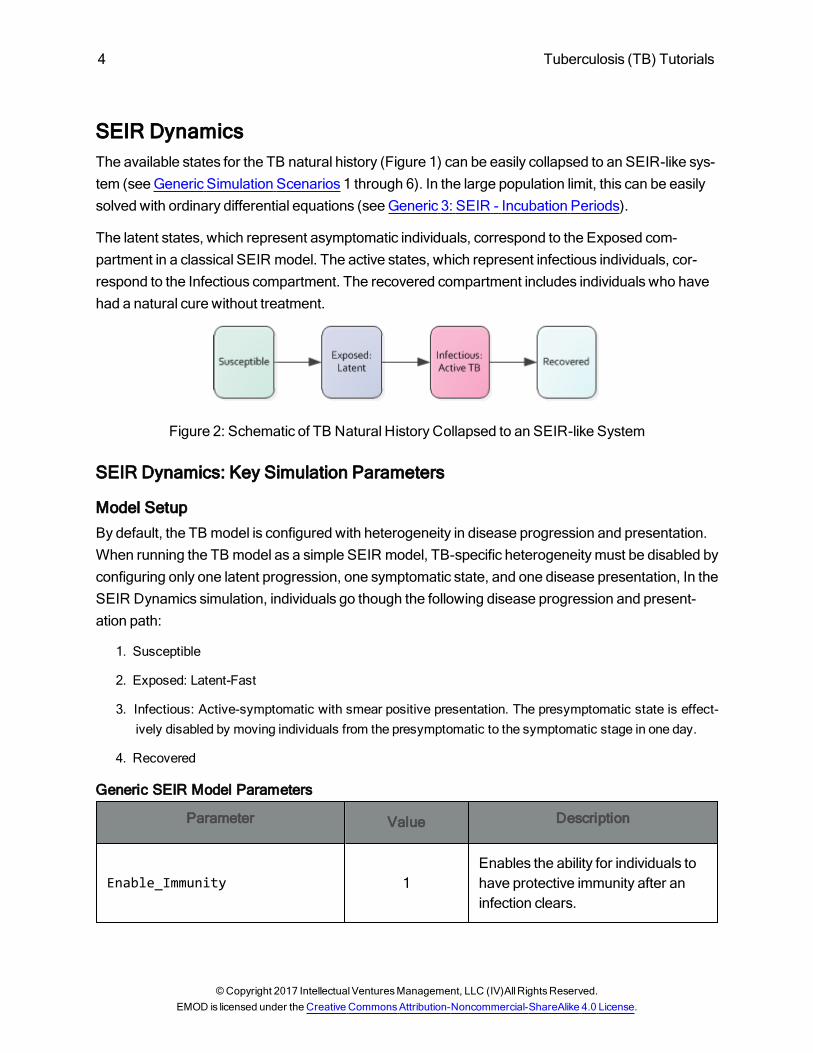
SEIR DynamicsThe available states for the TB natural history (Figure 1) can be easily collapsed to an SEIR-like sys-tem (seeGeneric Simulation Scenarios 1 through 6). In the large population limit, this can be easilysolved with ordinary differential equations (seeGeneric 3: SEIR - Incubation Periods).
The latent states, which represent asymptomatic individuals, correspond to the Exposed com-partment in a classical SEIR model. The active states, which represent infectious individuals, cor-respond to the Infectious compartment. The recovered compartment includes individuals who havehad a natural cure without treatment.
Figure 2: Schematic of TB Natural History Collapsed to an SEIR-like System
SEIR Dynamics: Key Simulation Parameters
Model SetupBy default, the TB model is configured with heterogeneity in disease progression and presentation.When running the TB model as a simple SEIR model, TB-specific heterogeneitymust be disabled byconfiguring only one latent progression, one symptomatic state, and one disease presentation, In theSEIR Dynamics simulation, individuals go though the following disease progression and present-ation path:
1. Susceptible
2. Exposed: Latent-Fast
3. Infectious: Active-symptomatic with smear positive presentation. The presymptomatic state is effect-ively disabled by moving individuals from the presymptomatic to the symptomatic stage in one day.
4. Recovered
Generic SEIR Model Parameters
Parameter Value Description
Enable_Immunity 1Enables the ability for individuals tohave protective immunity after aninfection clears.
©Copyright 2017 IntellectualVenturesManagement, LLC (IV)AllRightsReserved.EMOD is licensed under the Creative CommonsAttribution-Noncommercial-ShareAlike 4.0 License.
Tuberculosis (TB) Tutorials 5
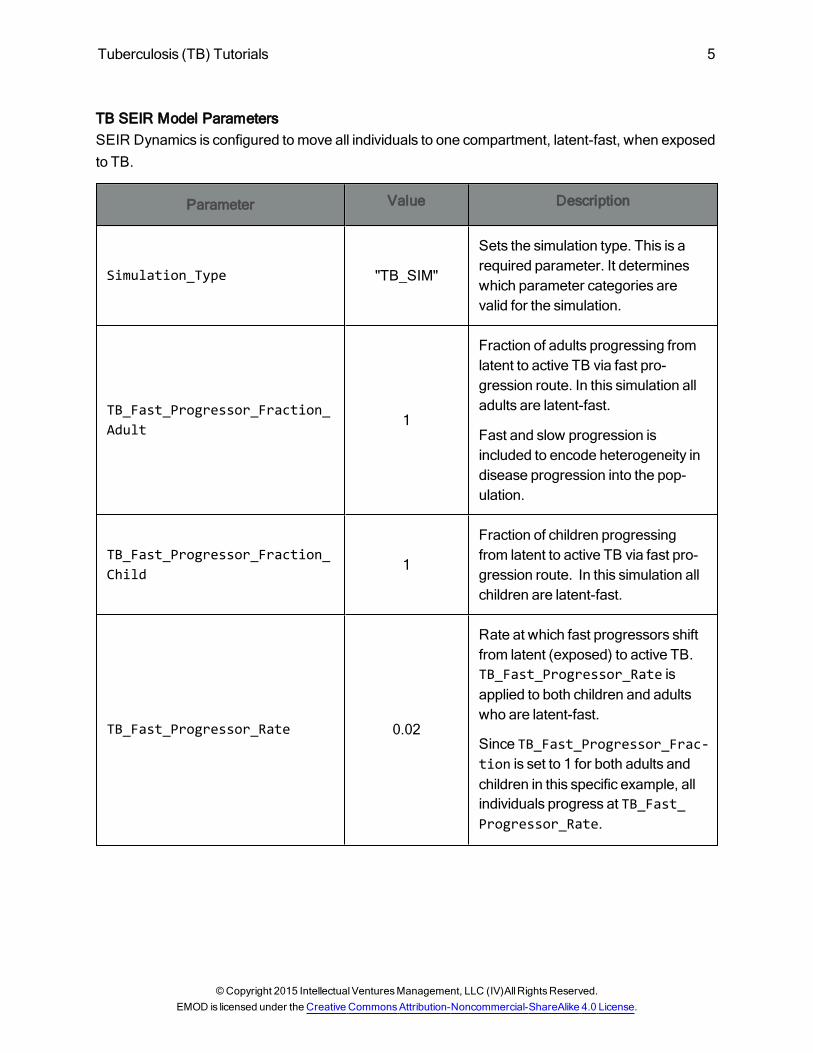
TB SEIR Model ParametersSEIR Dynamics is configured tomove all individuals to one compartment, latent-fast, when exposedto TB.
Parameter Value Description
Simulation_Type "TB_SIM"
Sets the simulation type. This is arequired parameter. It determineswhich parameter categories arevalid for the simulation.
TB_Fast_Progressor_Fraction_Adult
1
Fraction of adults progressing fromlatent to active TB via fast pro-gression route. In this simulation alladults are latent-fast.
Fast and slow progression isincluded to encode heterogeneity indisease progression into the pop-ulation.
TB_Fast_Progressor_Fraction_Child
1
Fraction of children progressingfrom latent to active TB via fast pro-gression route. In this simulation allchildren are latent-fast.
TB_Fast_Progressor_Rate 0.02
Rate at which fast progressors shiftfrom latent (exposed) to active TB.TB_Fast_Progressor_Rate isapplied to both children and adultswho are latent-fast.
Since TB_Fast_Progressor_Frac-tion is set to 1 for both adults andchildren in this specific example, allindividuals progress at TB_Fast_Progressor_Rate.
©Copyright 2015 IntellectualVenturesManagement, LLC (IV)AllRightsReserved.EMOD is licensed under the Creative CommonsAttribution-Noncommercial-ShareAlike 4.0 License.
6 Tuberculosis (TB) Tutorials
Parameter Value Description
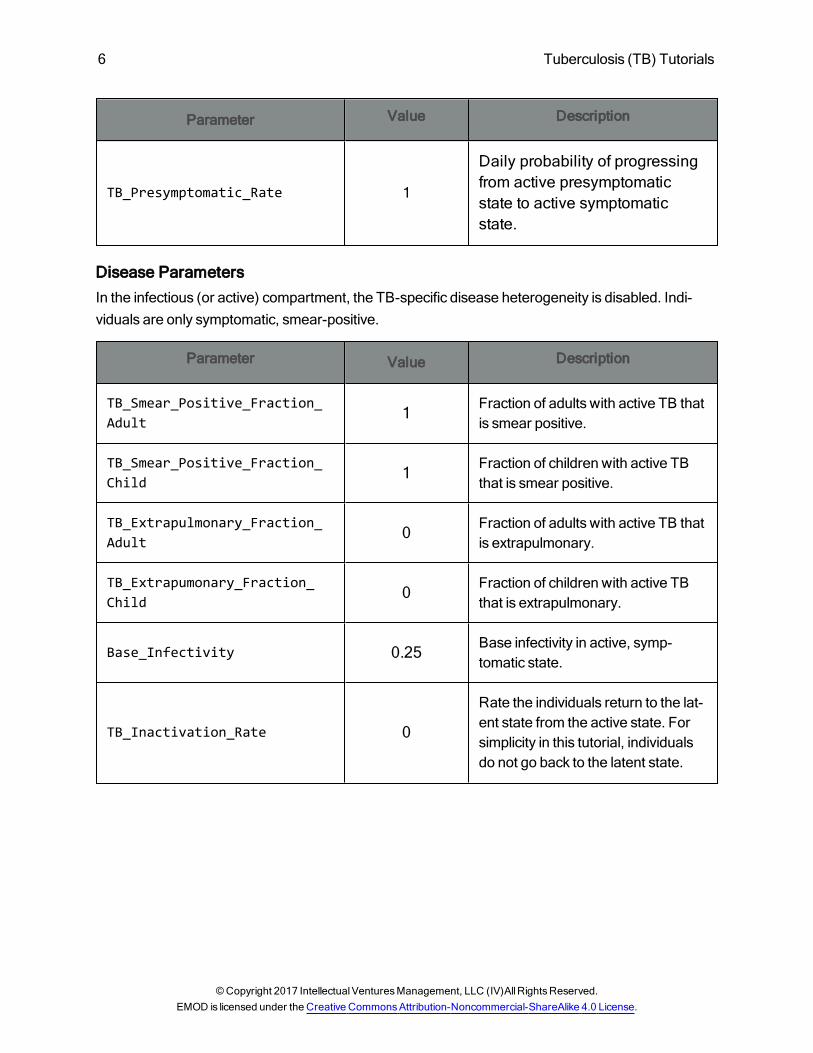
TB_Presymptomatic_Rate 1
Daily probability of progressingfrom active presymptomaticstate to active symptomaticstate.
Disease ParametersIn the infectious (or active) compartment, the TB-specific disease heterogeneity is disabled. Indi-viduals are only symptomatic, smear-positive.
Parameter Value Description
TB_Smear_Positive_Fraction_Adult 1
Fraction of adults with active TB thatis smear positive.
TB_Smear_Positive_Fraction_Child 1
Fraction of children with active TBthat is smear positive.
TB_Extrapulmonary_Fraction_Adult 0
Fraction of adults with active TB thatis extrapulmonary.
TB_Extrapumonary_Fraction_Child 0
Fraction of children with active TBthat is extrapulmonary.
Base_Infectivity 0.25Base infectivity in active, symp-tomatic state.
TB_Inactivation_Rate 0
Rate the individuals return to the lat-ent state from the active state. Forsimplicity in this tutorial, individualsdo not go back to the latent state.
©Copyright 2017 IntellectualVenturesManagement, LLC (IV)AllRightsReserved.EMOD is licensed under the Creative CommonsAttribution-Noncommercial-ShareAlike 4.0 License.
Tuberculosis (TB) Tutorials 7
Parameter Value Description
TB_Active_Mortality_Rate 1e-09
For individuals who have not hadtreatment, this rate is combined withTB_Inactivation_Rate and TB_Active_Cure_Rate to determinethe duration of active disease untilresolution of active phase. The frac-tion of TB_Active_Mortality_Rate divided by the total rate is usedto determine the probability of cure.
Simulation Duration Parameters
Parameter Value Description
Simulation_Timestep 1Value indicating simulation time stepin days. For this simulation, the timestep is one day.
Simulation_Duration 400 Duration of simulation in days.
For the complete list of simulation parameters, see the config.json file in the Scenarios\TB\01_BasicModel\A_SEIR directory.
SEIR Dynamics: InterventionsThere is only one intervention which is an outbreak on day 1. All of the scenarios use this inter-vention.
{"Events": [
{ "Event_Coordinator_Config": {
"Demographic_Coverage": 0.005,"Intervention_Config": {
"Outbreak_Source": "PrevalenceIncrease","class": "OutbreakIndividual"
},"class": "StandardInterventionDistributionEventCoordinator"
},
©Copyright 2015 IntellectualVenturesManagement, LLC (IV)AllRightsReserved.EMOD is licensed under the Creative CommonsAttribution-Noncommercial-ShareAlike 4.0 License.
8 Tuberculosis (TB) Tutorials
"Event_Name": "Outbreak","Nodeset_Config": {
"class": "NodeSetAll"},"Start_Day": 1,"class": "CampaignEvent"
}],
"Use_Defaults": 1}
This intervention is in the campaign.json file in the Scenarios\TB\01_BasicModel\A_SEIR directory.
SEIR Dynamics: Running the SimulationAt your discretion, you can use the sample batch file, runEMOD, in the Scenarios\TB\01_BasicModel\A_SEIR directory to run the simulation.
SEIR Dynamics: Expected Simulation Output
Generating Simulation GraphsAt your discretion, you can use the sample files, plotResults and compareScenarios, in the Scen-arios\TB\01_BasicModel\A_SEIR directory to generate graphs from the simulation's Inset Chart out-put file.
To run plotResults, you will need to install Python andMatplotlib.pyplot on your computer. See Pre-requisite Software for Plotting Tutorial Graphs for information on installing Python andMat-plotlib.pyplot.
Simulation Output GraphsThe complete course of the epidemic is observed. The initial outbreak seeds the epidemic, quicsklydepleting the susceptible population with latent individuals who then transition to active disease.Ultimately, the entire population gets infected and subsequently recovers.
NOTE: Because the EMODmodel is stochastic, your graphs may appear slightly different from thosegiven below.
©Copyright 2017 IntellectualVenturesManagement, LLC (IV)AllRightsReserved.EMOD is licensed under the Creative CommonsAttribution-Noncommercial-ShareAlike 4.0 License.
Tuberculosis (TB) Tutorials 9
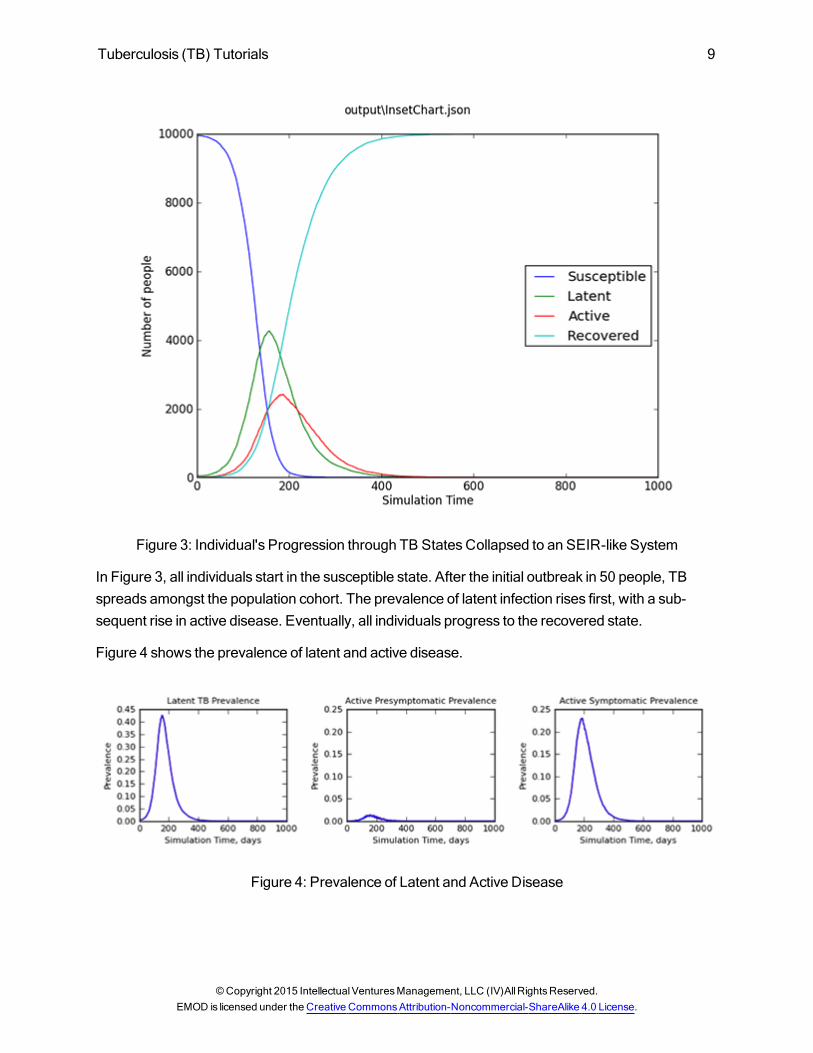
Figure 3: Individual's Progression through TB StatesCollapsed to an SEIR-like System
In Figure 3, all individuals start in the susceptible state. After the initial outbreak in 50 people, TBspreads amongst the population cohort. The prevalence of latent infection rises first, with a sub-sequent rise in active disease. Eventually, all individuals progress to the recovered state.
Figure 4 shows the prevalence of latent and active disease.
Figure 4: Prevalence of Latent and Active Disease
©Copyright 2015 IntellectualVenturesManagement, LLC (IV)AllRightsReserved.EMOD is licensed under the Creative CommonsAttribution-Noncommercial-ShareAlike 4.0 License.
10 Tuberculosis (TB) Tutorials
All individuals progress quickly from latent to active disease as the initial outbreak spreads to the pop-ulation.
SEIR Dynamics: Exploring the Model
1: Exposed Compartment: Latent-SlowChange the Latent-Fast compartment to Latent-Slow by setting the following values:
"TB_Fast_Progressor_Fraction_Adult": 0
"TB_Fast_Progressor_Fraction_Child": 0
If you compare themodel output you will see that the Latent TB Prevalence is now entirely com-posed of latent-slow. The Latent Fast TB Prevalence is now zero.
2: Infectious Compartment: Active
Smear-NegativeIn SEIR Model, active smear-positive represents the active compartment. You can also use smear-negative or extrapulmonary. Try setting all individuals to use smear-negative, with the following para-meter values.
"TB_Smear_Positive_Fraction_Adult": 0,
"TB_Smear_Positive_Fraction_Child": 0,
"TB_Extrapulmonary_Fraction_Adult": 0,
"TB_Extrapulmonary_Fraction_Child": 0,
"TB_Smear_Negative_Infectivity_Multiplier": 1,
You can get the same output as in SEIR Dynamics except active smear-negative prevalence willhave non-zero prevalence and the active smear-positive prevalence will be zero.
Smear-Negative Multiplier
Continue using smear-negative as the active compartment and set the "TB_Smear_Negative_Infectivity_Multiplier" to 0.5.
You will see that the R0has decreased with slower spread of the disease. This is the same result
you would get if you used the SEIR Dynamics scenario but reduced base_infectivity by 50%.
Non-infectious ExtrapulmonarySet all individuals disease presentation to extrapulmonary. By definition the extrapulmonary fractionis non-infectious (not configurable) so you will see that there is no spread of infection. The only
©Copyright 2017 IntellectualVenturesManagement, LLC (IV)AllRightsReserved.EMOD is licensed under the Creative CommonsAttribution-Noncommercial-ShareAlike 4.0 License.
Tuberculosis (TB) Tutorials 11
infected people in the simulation are the original outbreak, who progress from latent-fast to activeextrapulmonary.
"TB_Smear_Positive_Fraction_Adult": 0,
"TB_Smear_Positive_Fraction_Child": 0,
"TB_Extrapulmonary_Fraction_Adult": 1,
"TB_Extrapulmonary_Fraction_Child": 1
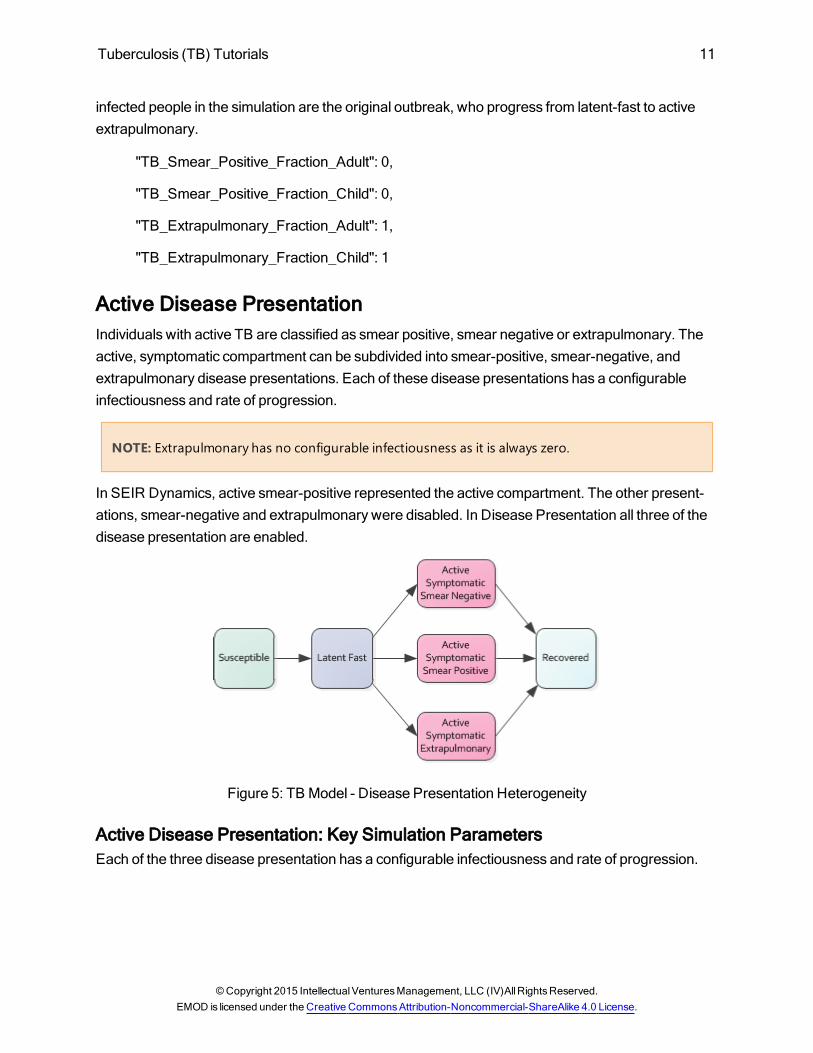
Active Disease PresentationIndividuals with active TB are classified as smear positive, smear negative or extrapulmonary. Theactive, symptomatic compartment can be subdivided into smear-positive, smear-negative, andextrapulmonary disease presentations. Each of these disease presentations has a configurableinfectiousness and rate of progression.
NOTE: Extrapulmonary has no configurable infectiousness as it is always zero.
In SEIR Dynamics, active smear-positive represented the active compartment. The other present-ations, smear-negative and extrapulmonary were disabled. In Disease Presentation all three of thedisease presentation are enabled.
Figure 5: TB Model - Disease Presentation Heterogeneity
Active Disease Presentation: Key Simulation ParametersEach of the three disease presentation has a configurable infectiousness and rate of progression.
©Copyright 2015 IntellectualVenturesManagement, LLC (IV)AllRightsReserved.EMOD is licensed under the Creative CommonsAttribution-Noncommercial-ShareAlike 4.0 License.
12 Tuberculosis (TB) Tutorials
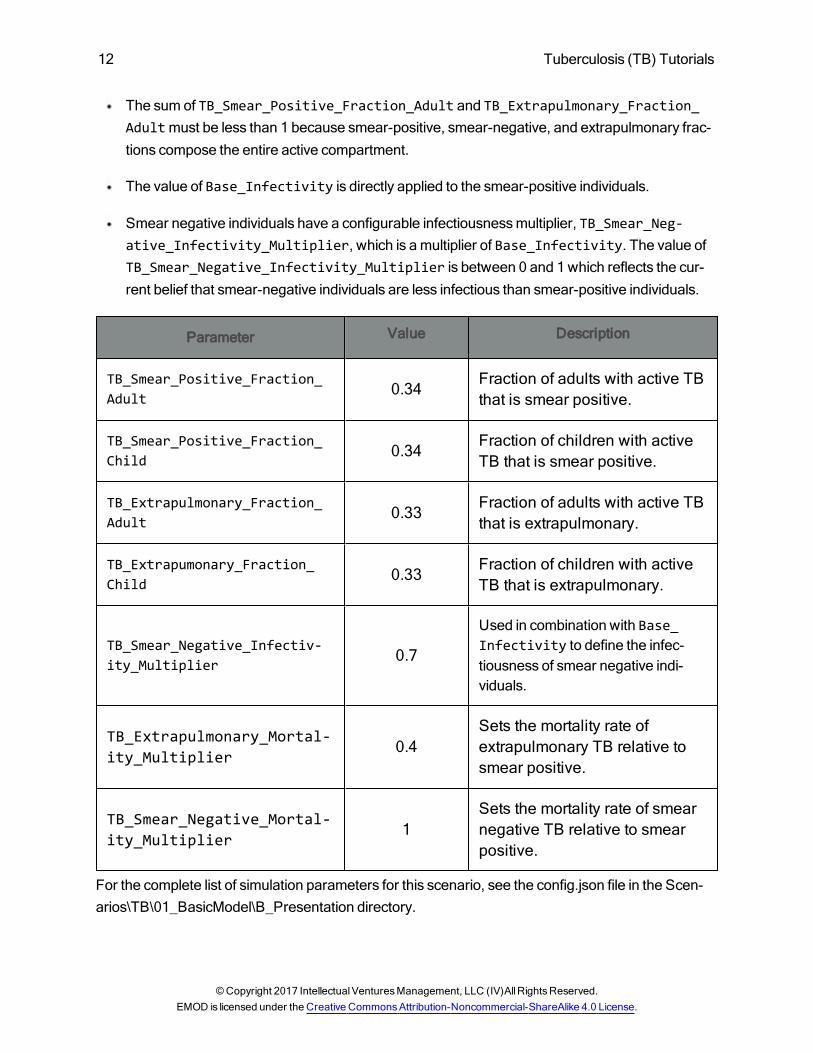
The sum of TB_Smear_Positive_Fraction_Adult and TB_Extrapulmonary_Fraction_Adultmust be less than 1 because smear-positive, smear-negative, and extrapulmonary frac-tions compose the entire active compartment.
The value of Base_Infectivity is directly applied to the smear-positive individuals.
Smear negative individuals have a configurable infectiousnessmultiplier, TB_Smear_Neg-ative_Infectivity_Multiplier, which is amultiplier of Base_Infectivity. The value ofTB_Smear_Negative_Infectivity_Multiplier is between 0 and 1 which reflects the cur-rent belief that smear-negative individuals are less infectious than smear-positive individuals.
Parameter Value Description
TB_Smear_Positive_Fraction_Adult 0.34
Fraction of adults with active TBthat is smear positive.
TB_Smear_Positive_Fraction_Child 0.34
Fraction of children with activeTB that is smear positive.
TB_Extrapulmonary_Fraction_Adult 0.33
Fraction of adults with active TBthat is extrapulmonary.
TB_Extrapumonary_Fraction_Child 0.33
Fraction of children with activeTB that is extrapulmonary.
TB_Smear_Negative_Infectiv-ity_Multiplier 0.7
Used in combination with Base_Infectivity to define the infec-tiousness of smear negative indi-viduals.
TB_Extrapulmonary_Mortal-ity_Multiplier
0.4Sets the mortality rate ofextrapulmonary TB relative tosmear positive.
TB_Smear_Negative_Mortal-ity_Multiplier
1Sets the mortality rate of smearnegative TB relative to smearpositive.
For the complete list of simulation parameters for this scenario, see the config.json file in the Scen-arios\TB\01_BasicModel\B_Presentation directory.
©Copyright 2017 IntellectualVenturesManagement, LLC (IV)AllRightsReserved.EMOD is licensed under the Creative CommonsAttribution-Noncommercial-ShareAlike 4.0 License.
Tuberculosis (TB) Tutorials 13
Active Disease Presentation: InterventionsThe intervention is the same as the intervention in SEIR Dynamics. You can find a copy of the cam-paign file in the Scenarios\TB\01_BasicModel\B_Presentation directory.
Active Disease Presentation: Running the SimulationAt your discretion, you can run the sample batch file, runEMOD, in the Scenarios\TB\01_BasicModel\B_Presentation directory.
Active Disease Presentation: Expected Simulation Output
Generating Simulation GraphsAt your discretion, you can use the sample files, plotResults and compareScenarios, in the Scen-arios\TB\01_BasicModel\B_Presentaton directory to generate graphs from the simulation's InsetChart output file.
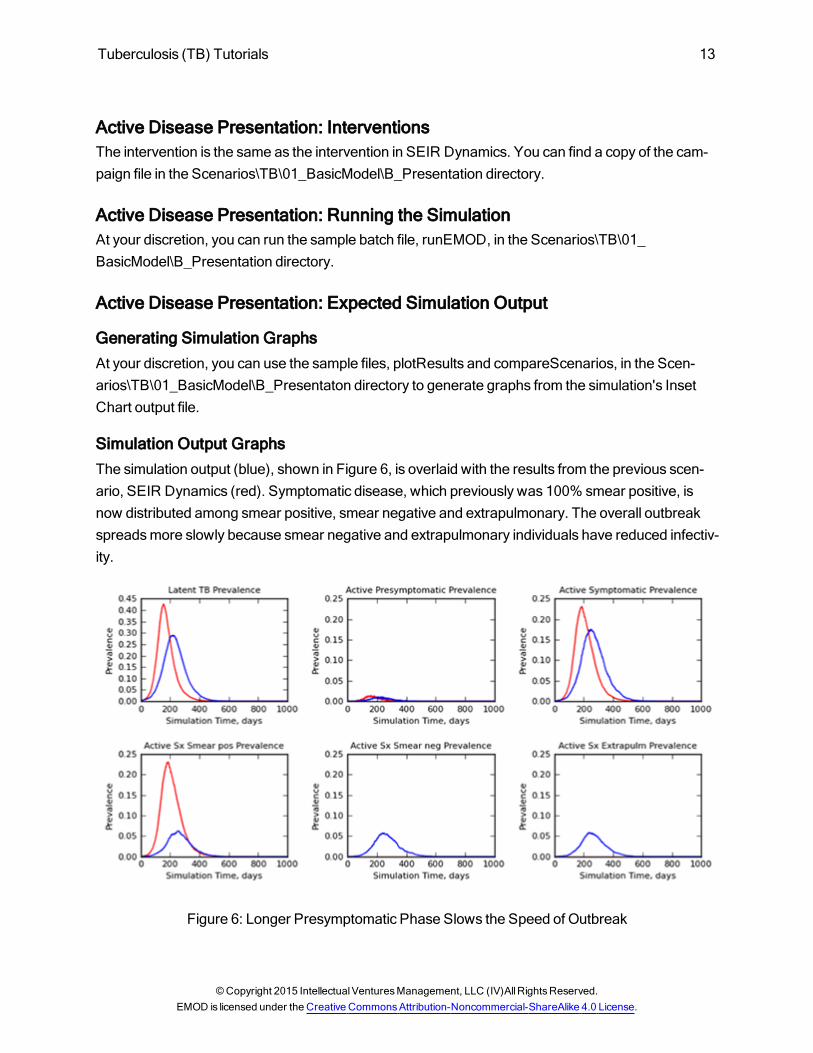
Simulation Output GraphsThe simulation output (blue), shown in Figure 6, is overlaid with the results from the previous scen-ario, SEIR Dynamics (red). Symptomatic disease, which previously was 100% smear positive, isnow distributed among smear positive, smear negative and extrapulmonary. The overall outbreakspreadsmore slowly because smear negative and extrapulmonary individuals have reduced infectiv-ity.
Figure 6: Longer Presymptomatic Phase Slows the Speed of Outbreak
©Copyright 2015 IntellectualVenturesManagement, LLC (IV)AllRightsReserved.EMOD is licensed under the Creative CommonsAttribution-Noncommercial-ShareAlike 4.0 License.
14 Tuberculosis (TB) Tutorials
In the previous figure, the introduction of a longer presymptomatic phase (blue) slows the spread ofthe outbreak compared to SEIR Dynamics (red).
Active Disease Presentation: Exploring the ModelAdjust TB_Smear_Negative_Infectivity_Multiplier to lower values, and observe thedecrease in cumulative infections.
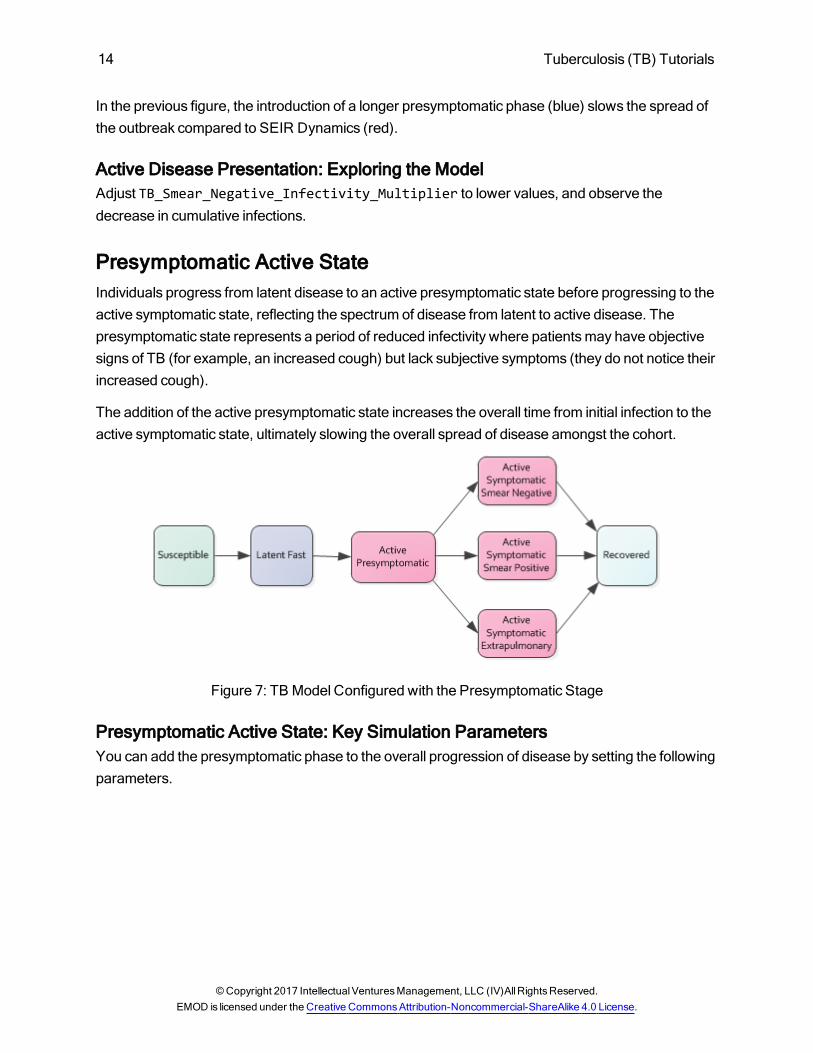
Presymptomatic Active StateIndividuals progress from latent disease to an active presymptomatic state before progressing to theactive symptomatic state, reflecting the spectrum of disease from latent to active disease. Thepresymptomatic state represents a period of reduced infectivity where patientsmay have objectivesigns of TB (for example, an increased cough) but lack subjective symptoms (they do not notice theirincreased cough).
The addition of the active presymptomatic state increases the overall time from initial infection to theactive symptomatic state, ultimately slowing the overall spread of disease amongst the cohort.
Figure 7: TB Model Configured with the Presymptomatic Stage
Presymptomatic Active State: Key Simulation ParametersYou can add the presymptomatic phase to the overall progression of disease by setting the followingparameters.
©Copyright 2017 IntellectualVenturesManagement, LLC (IV)AllRightsReserved.EMOD is licensed under the Creative CommonsAttribution-Noncommercial-ShareAlike 4.0 License.
Tuberculosis (TB) Tutorials 15
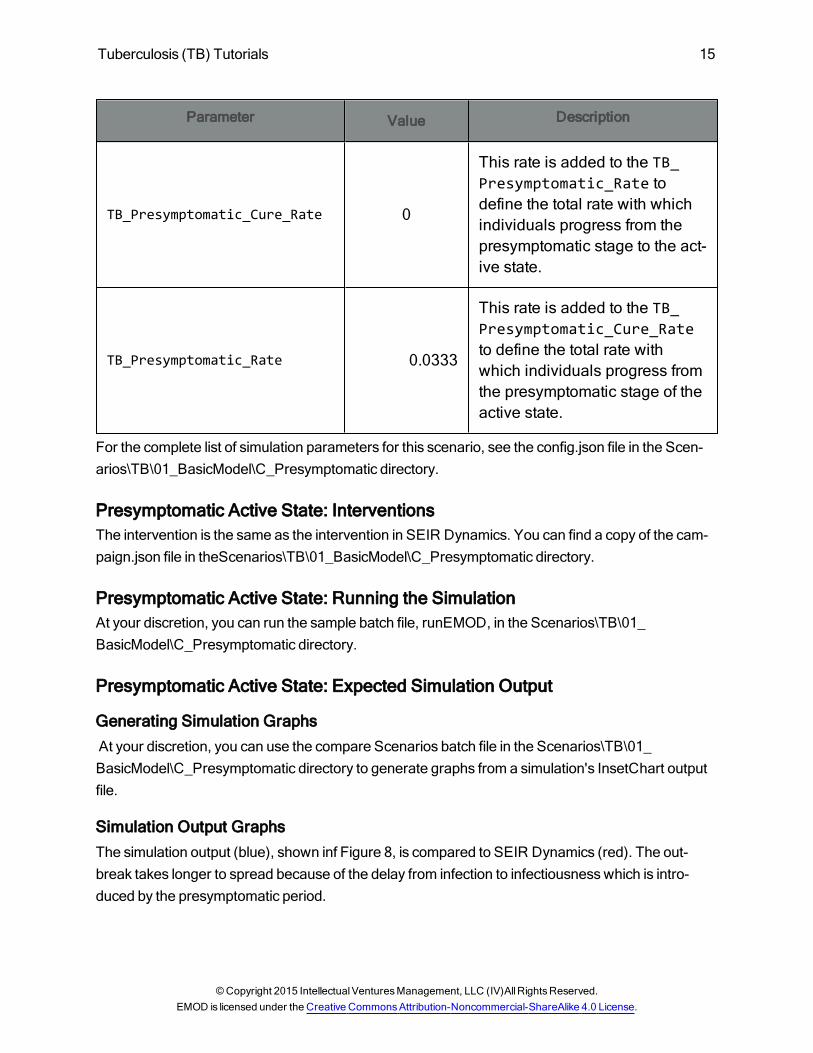
Parameter Value Description
TB_Presymptomatic_Cure_Rate 0
This rate is added to the TB_Presymptomatic_Rate todefine the total rate with whichindividuals progress from thepresymptomatic stage to the act-ive state.
TB_Presymptomatic_Rate 0.0333
This rate is added to the TB_Presymptomatic_Cure_Rateto define the total rate withwhich individuals progress fromthe presymptomatic stage of theactive state.
For the complete list of simulation parameters for this scenario, see the config.json file in the Scen-arios\TB\01_BasicModel\C_Presymptomatic directory.
Presymptomatic Active State: InterventionsThe intervention is the same as the intervention in SEIR Dynamics. You can find a copy of the cam-paign.json file in theScenarios\TB\01_BasicModel\C_Presymptomatic directory.
Presymptomatic Active State: Running the SimulationAt your discretion, you can run the sample batch file, runEMOD, in the Scenarios\TB\01_BasicModel\C_Presymptomatic directory.
Presymptomatic Active State: Expected Simulation Output
Generating Simulation GraphsAt your discretion, you can use the compare Scenarios batch file in the Scenarios\TB\01_BasicModel\C_Presymptomatic directory to generate graphs from a simulation's InsetChart outputfile.
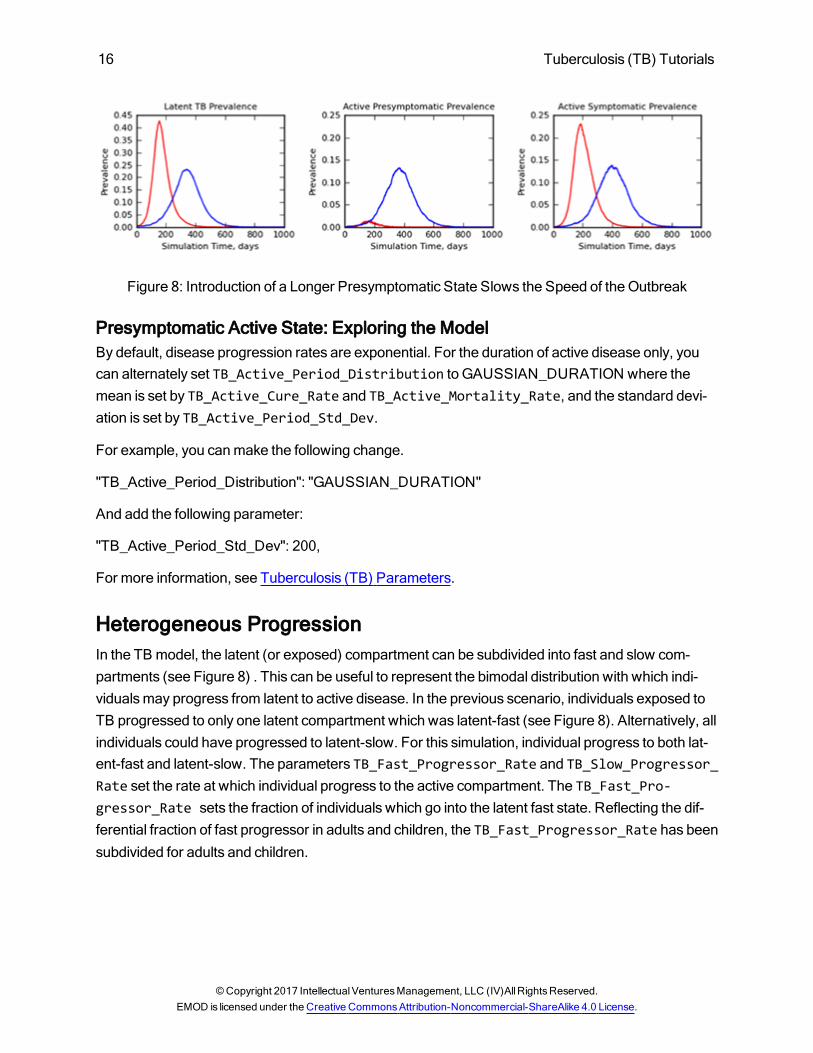
Simulation Output GraphsThe simulation output (blue), shown inf Figure 8, is compared to SEIR Dynamics (red). The out-break takes longer to spread because of the delay from infection to infectiousnesswhich is intro-duced by the presymptomatic period.
©Copyright 2015 IntellectualVenturesManagement, LLC (IV)AllRightsReserved.EMOD is licensed under the Creative CommonsAttribution-Noncommercial-ShareAlike 4.0 License.
16 Tuberculosis (TB) Tutorials
Figure 8: Introduction of a Longer Presymptomatic State Slows the Speed of the Outbreak
Presymptomatic Active State: Exploring the ModelBy default, disease progression rates are exponential. For the duration of active disease only, youcan alternately set TB_Active_Period_Distribution to GAUSSIAN_DURATION where themean is set by TB_Active_Cure_Rate and TB_Active_Mortality_Rate, and the standard devi-ation is set by TB_Active_Period_Std_Dev.
For example, you canmake the following change.
"TB_Active_Period_Distribution": "GAUSSIAN_DURATION"
And add the following parameter:
"TB_Active_Period_Std_Dev": 200,
For more information, see Tuberculosis (TB) Parameters.
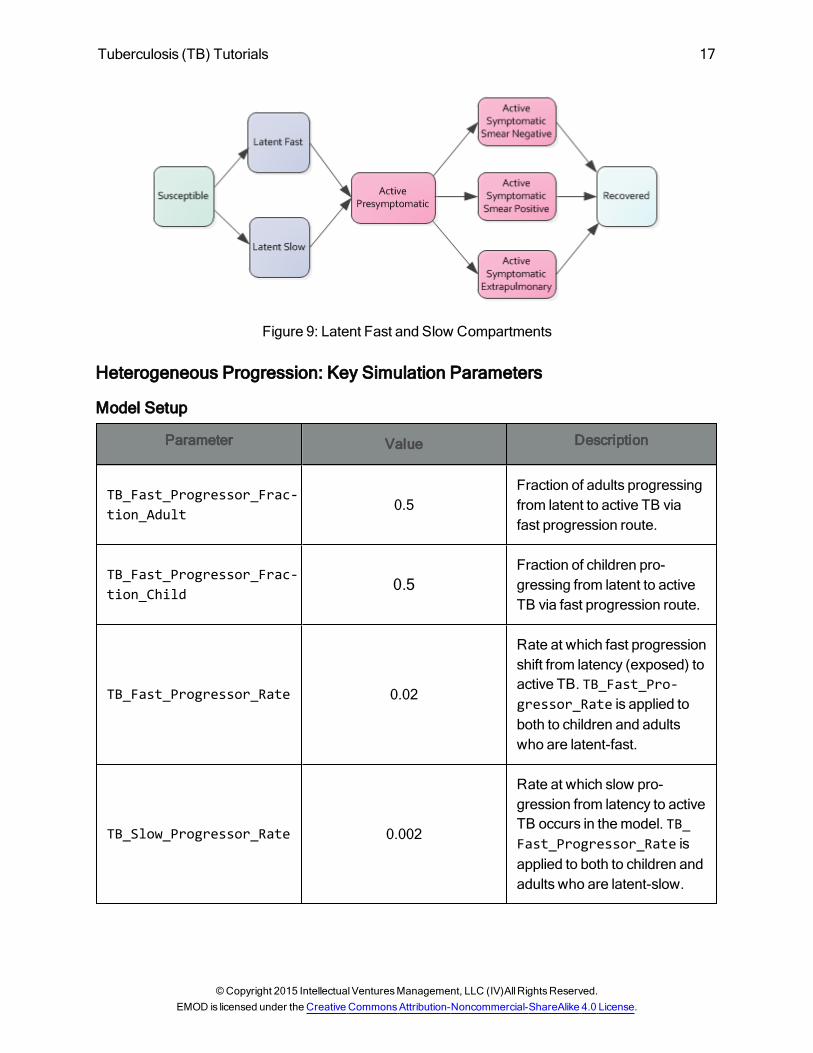
Heterogeneous ProgressionIn the TB model, the latent (or exposed) compartment can be subdivided into fast and slow com-partments (see Figure 8) . This can be useful to represent the bimodal distribution with which indi-vidualsmay progress from latent to active disease. In the previous scenario, individuals exposed toTB progressed to only one latent compartment which was latent-fast (see Figure 8). Alternatively, allindividuals could have progressed to latent-slow. For this simulation, individual progress to both lat-ent-fast and latent-slow. The parameters TB_Fast_Progressor_Rate and TB_Slow_Progressor_Rate set the rate at which individual progress to the active compartment. The TB_Fast_Pro-gressor_Rate sets the fraction of individuals which go into the latent fast state. Reflecting the dif-ferential fraction of fast progressor in adults and children, the TB_Fast_Progressor_Rate has beensubdivided for adults and children.
©Copyright 2017 IntellectualVenturesManagement, LLC (IV)AllRightsReserved.EMOD is licensed under the Creative CommonsAttribution-Noncommercial-ShareAlike 4.0 License.
Tuberculosis (TB) Tutorials 17
Figure 9: Latent Fast and Slow Compartments
Heterogeneous Progression: Key Simulation Parameters
Model Setup
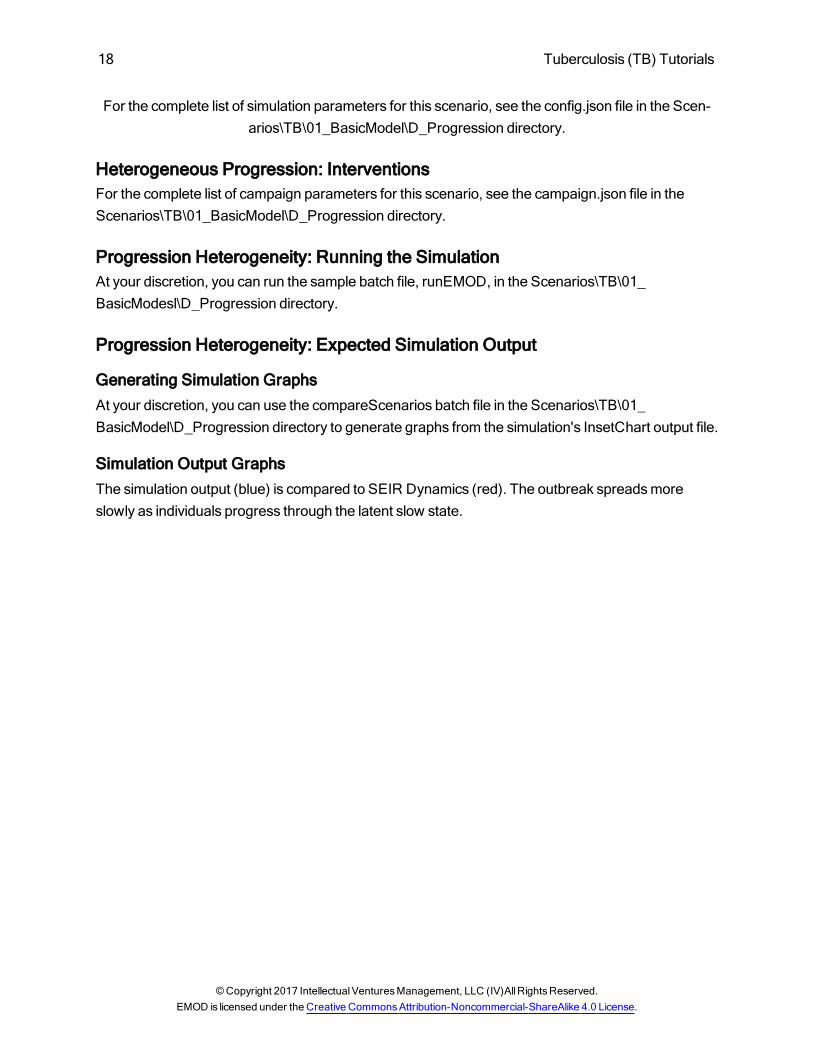
Parameter Value Description
TB_Fast_Progressor_Frac-tion_Adult
0.5Fraction of adults progressingfrom latent to active TB viafast progression route.
TB_Fast_Progressor_Frac-tion_Child 0.5
Fraction of children pro-gressing from latent to activeTB via fast progression route.
TB_Fast_Progressor_Rate 0.02
Rate at which fast progressionshift from latency (exposed) toactive TB. TB_Fast_Pro-gressor_Rate is applied toboth to children and adultswho are latent-fast.
TB_Slow_Progressor_Rate 0.002
Rate at which slow pro-gression from latency to activeTB occurs in themodel. TB_Fast_Progressor_Rate isapplied to both to children andadults who are latent-slow.
©Copyright 2015 IntellectualVenturesManagement, LLC (IV)AllRightsReserved.EMOD is licensed under the Creative CommonsAttribution-Noncommercial-ShareAlike 4.0 License.
18 Tuberculosis (TB) Tutorials
For the complete list of simulation parameters for this scenario, see the config.json file in the Scen-arios\TB\01_BasicModel\D_Progression directory.
Heterogeneous Progression: InterventionsFor the complete list of campaign parameters for this scenario, see the campaign.json file in theScenarios\TB\01_BasicModel\D_Progression directory.
Progression Heterogeneity: Running the SimulationAt your discretion, you can run the sample batch file, runEMOD, in the Scenarios\TB\01_BasicModesl\D_Progression directory.
Progression Heterogeneity: Expected Simulation Output
Generating Simulation GraphsAt your discretion, you can use the compareScenarios batch file in the Scenarios\TB\01_BasicModel\D_Progression directory to generate graphs from the simulation's InsetChart output file.
Simulation Output GraphsThe simulation output (blue) is compared to SEIR Dynamics (red). The outbreak spreadsmoreslowly as individuals progress through the latent slow state.
©Copyright 2017 IntellectualVenturesManagement, LLC (IV)AllRightsReserved.EMOD is licensed under the Creative CommonsAttribution-Noncommercial-ShareAlike 4.0 License.
Tuberculosis (TB) Tutorials 19
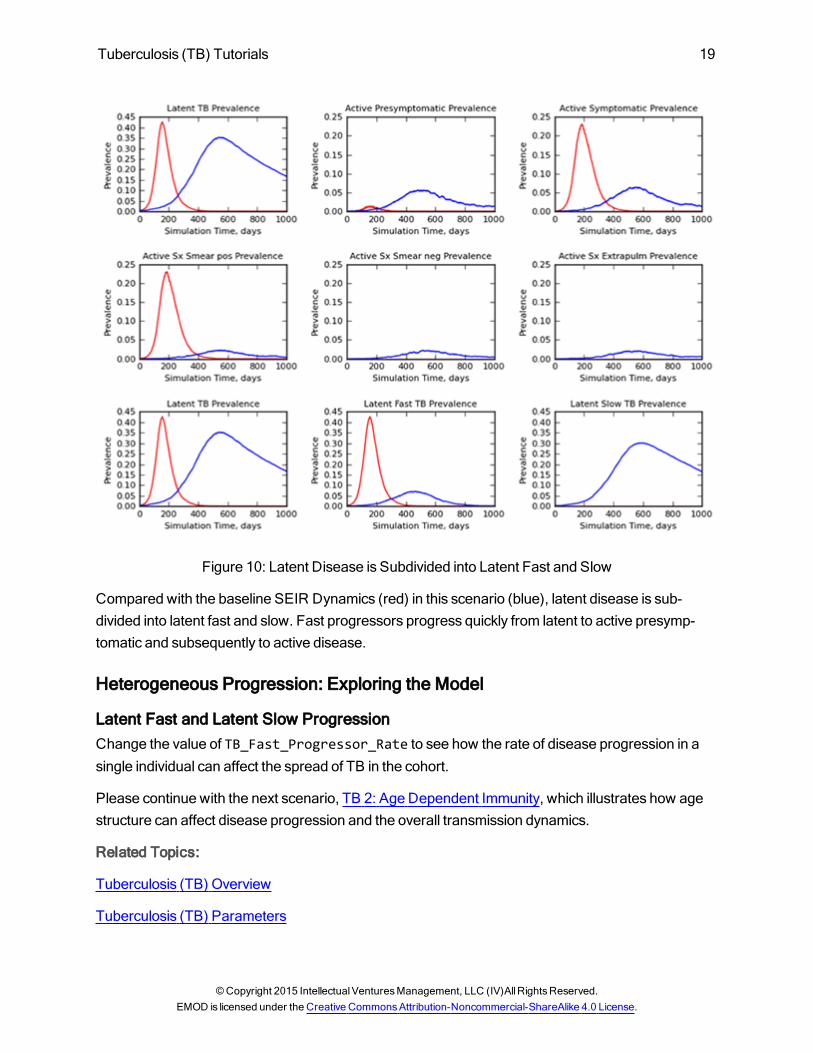
Figure 10: Latent Disease is Subdivided into Latent Fast and Slow
Compared with the baseline SEIR Dynamics (red) in this scenario (blue), latent disease is sub-divided into latent fast and slow. Fast progressors progress quickly from latent to active presymp-tomatic and subsequently to active disease.
Heterogeneous Progression: Exploring the Model
Latent Fast and Latent Slow ProgressionChange the value of TB_Fast_Progressor_Rate to see how the rate of disease progression in asingle individual can affect the spread of TB in the cohort.
Please continue with the next scenario, TB 2: Age Dependent Immunity, which illustrates how agestructure can affect disease progression and the overall transmission dynamics.
Related Topics:
Tuberculosis (TB) Overview
Tuberculosis (TB) Parameters
©Copyright 2015 IntellectualVenturesManagement, LLC (IV)AllRightsReserved.EMOD is licensed under the Creative CommonsAttribution-Noncommercial-ShareAlike 4.0 License.
20 Tuberculosis (TB) Tutorials
TB 2: Age Dependent ImmunityThis tutorial assumes that you have read TB 1: Basic Tuberculosis (TB) Model.
The Age Dependent Immunity tutorial illustrates how tomodel realistic age demographics andmod-ulate population immunity using vaccination and post-TB infection immunity. Two age groups aredefined:
Adults: ≥ 15 years old
Children: < 15 years old
Adults and children can have different fast progressor fractionswhen in the latent phase. In the act-ive phase, adults and children can have different relative proportions of smear-positive, smear-neg-ative and extrapulmonary disease presentations. The parameters for the susceptibility to infectionand the rates of disease progression from one disease state to another are the same for both adultsand children.
There are three scenarios that explore how TB immunity can bemodulated by past infection or a TBvaccine.
Life-long Immunity: After an initial TB outbreak, all individuals retain 100% immunity. Ongoingnew births are TB naive and get infected during a second TB outbreak.
Waning Immunity: After the initial TB outbreak, all individuals have waning immunity, whichwanes to zero protection in ten years. In a second TB outbreak, the entire population of adultsand children get infected.
Childhood Vaccines: BCG vaccinations are provided for all new births. The vaccinationprovides 100% protection from TB infection for 15 years. After the initial TB infection, all indi-viduals have waning immunity. At the time of the second outbreak, vaccinated children are pro-tected from infection while adults, whose immunity haswaned, get infected.
Demographics InputsThe demographics file specifies the initial population age structure and the population fertility andmortality rates. This simulation uses a simple fixed birth rate with zero backgroundmortality so thepopulation is growing over the duration of the simulation.
Age DistributionTo specify an age distribution, use the AgeDistribution structure in the demographics file. AgeDis-tribution defines cumulative distribution of the population across a range of ages. The age ranges
©Copyright 2017 IntellectualVenturesManagement, LLC (IV)AllRightsReserved.EMOD is licensed under the Creative CommonsAttribution-Noncommercial-ShareAlike 4.0 License.
Tuberculosis (TB) Tutorials 21
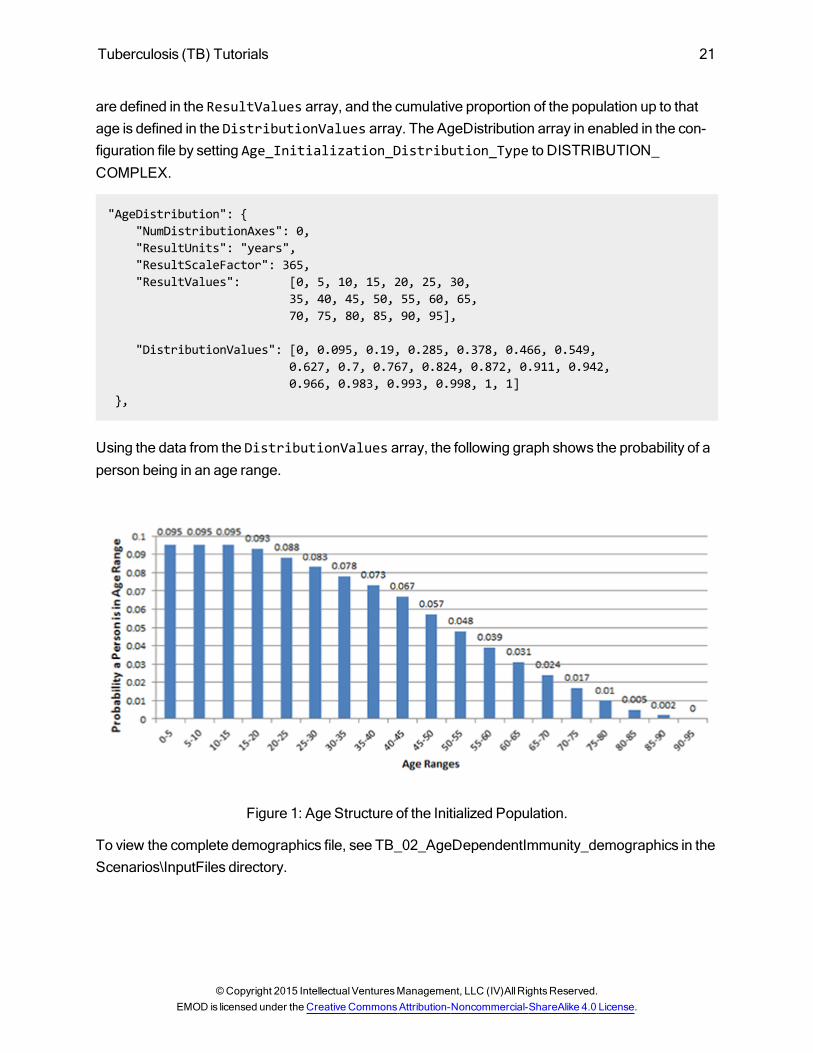
are defined in the ResultValues array, and the cumulative proportion of the population up to thatage is defined in the DistributionValues array. The AgeDistribution array in enabled in the con-figuration file by setting Age_Initialization_Distribution_Type to DISTRIBUTION_COMPLEX.
"AgeDistribution": {"NumDistributionAxes": 0,"ResultUnits": "years","ResultScaleFactor": 365,"ResultValues": [0, 5, 10, 15, 20, 25, 30,
35, 40, 45, 50, 55, 60, 65,70, 75, 80, 85, 90, 95],
"DistributionValues": [0, 0.095, 0.19, 0.285, 0.378, 0.466, 0.549,0.627, 0.7, 0.767, 0.824, 0.872, 0.911, 0.942,0.966, 0.983, 0.993, 0.998, 1, 1]
},
Using the data from the DistributionValues array, the following graph shows the probability of aperson being in an age range.
Figure 1: Age Structure of the Initialized Population.
To view the complete demographics file, see TB_02_AgeDependentImmunity_demographics in theScenarios\InputFiles directory.
©Copyright 2015 IntellectualVenturesManagement, LLC (IV)AllRightsReserved.EMOD is licensed under the Creative CommonsAttribution-Noncommercial-ShareAlike 4.0 License.
22 Tuberculosis (TB) Tutorials
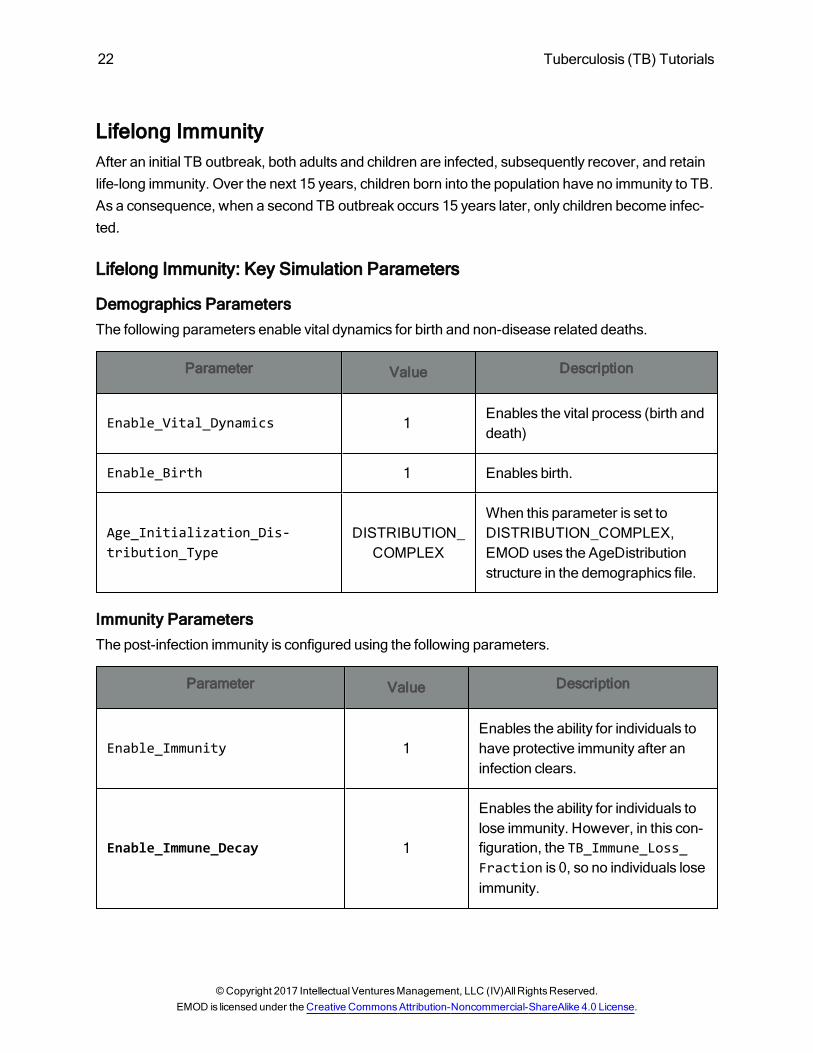
Lifelong ImmunityAfter an initial TB outbreak, both adults and children are infected, subsequently recover, and retainlife-long immunity. Over the next 15 years, children born into the population have no immunity to TB.As a consequence, when a second TB outbreak occurs 15 years later, only children become infec-ted.
Lifelong Immunity: Key Simulation Parameters
Demographics ParametersThe following parameters enable vital dynamics for birth and non-disease related deaths.
Parameter Value Description
Enable_Vital_Dynamics 1Enables the vital process (birth anddeath)
Enable_Birth 1 Enables birth.
Age_Initialization_Dis-tribution_Type
DISTRIBUTION_COMPLEX
When this parameter is set toDISTRIBUTION_COMPLEX,EMOD uses the AgeDistributionstructure in the demographics file.
Immunity ParametersThe post-infection immunity is configured using the following parameters.
Parameter Value Description
Enable_Immunity 1Enables the ability for individuals tohave protective immunity after aninfection clears.
Enable_Immune_Decay 1
Enables the ability for individuals tolose immunity. However, in this con-figuration, the TB_Immune_Loss_Fraction is 0, so no individuals loseimmunity.
©Copyright 2017 IntellectualVenturesManagement, LLC (IV)AllRightsReserved.EMOD is licensed under the Creative CommonsAttribution-Noncommercial-ShareAlike 4.0 License.
Tuberculosis (TB) Tutorials 23
Parameter Value Description
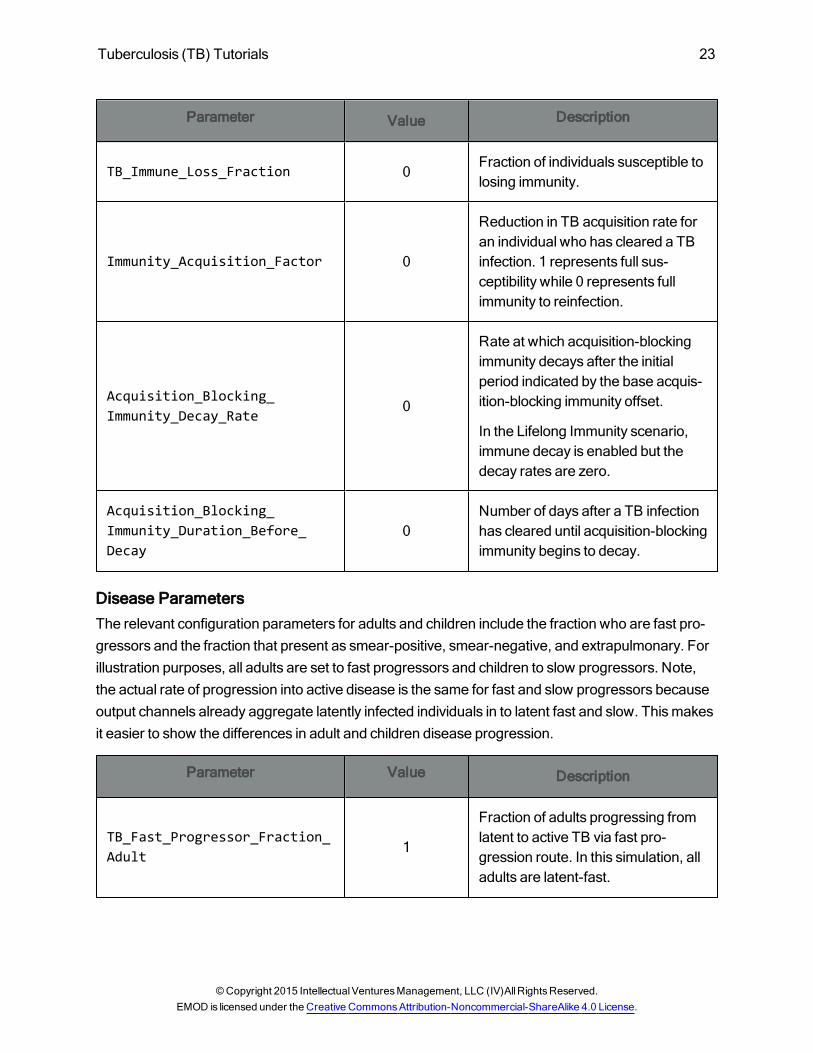
TB_Immune_Loss_Fraction 0Fraction of individuals susceptible tolosing immunity.
Immunity_Acquisition_Factor 0
Reduction in TB acquisition rate foran individual who has cleared a TBinfection. 1 represents full sus-ceptibility while 0 represents fullimmunity to reinfection.
Acquisition_Blocking_Immunity_Decay_Rate
0
Rate at which acquisition-blockingimmunity decays after the initialperiod indicated by the base acquis-ition-blocking immunity offset.
In the Lifelong Immunity scenario,immune decay is enabled but thedecay rates are zero.
Acquisition_Blocking_Immunity_Duration_Before_Decay
0Number of days after a TB infectionhas cleared until acquisition-blockingimmunity begins to decay.
Disease ParametersThe relevant configuration parameters for adults and children include the fraction who are fast pro-gressors and the fraction that present as smear-positive, smear-negative, and extrapulmonary. Forillustration purposes, all adults are set to fast progressors and children to slow progressors. Note,the actual rate of progression into active disease is the same for fast and slow progressors becauseoutput channels already aggregate latently infected individuals in to latent fast and slow. Thismakesit easier to show the differences in adult and children disease progression.
Parameter Value Description
TB_Fast_Progressor_Fraction_Adult
1
Fraction of adults progressing fromlatent to active TB via fast pro-gression route. In this simulation, alladults are latent-fast.
©Copyright 2015 IntellectualVenturesManagement, LLC (IV)AllRightsReserved.EMOD is licensed under the Creative CommonsAttribution-Noncommercial-ShareAlike 4.0 License.
24 Tuberculosis (TB) Tutorials
Parameter Value Description
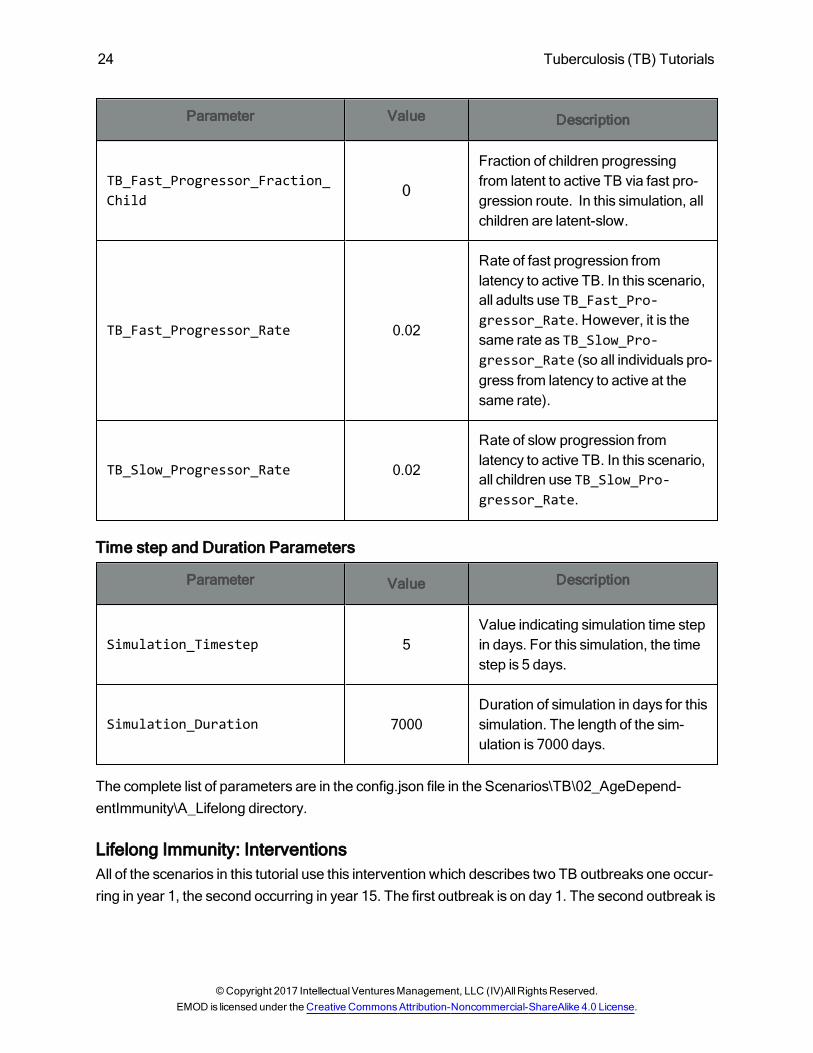
TB_Fast_Progressor_Fraction_Child 0
Fraction of children progressingfrom latent to active TB via fast pro-gression route. In this simulation, allchildren are latent-slow.
TB_Fast_Progressor_Rate 0.02
Rate of fast progression fromlatency to active TB. In this scenario,all adults use TB_Fast_Pro-gressor_Rate. However, it is thesame rate as TB_Slow_Pro-gressor_Rate (so all individuals pro-gress from latency to active at thesame rate).
TB_Slow_Progressor_Rate 0.02
Rate of slow progression fromlatency to active TB. In this scenario,all children use TB_Slow_Pro-gressor_Rate.
Time step and Duration Parameters
Parameter Value Description
Simulation_Timestep 5Value indicating simulation time stepin days. For this simulation, the timestep is 5 days.
Simulation_Duration 7000Duration of simulation in days for thissimulation. The length of the sim-ulation is 7000 days.
The complete list of parameters are in the config.json file in the Scenarios\TB\02_AgeDepend-entImmunity\A_Lifelong directory.
Lifelong Immunity: InterventionsAll of the scenarios in this tutorial use this intervention which describes two TB outbreaks one occur-ring in year 1, the second occurring in year 15. The first outbreak is on day 1. The second outbreak is
©Copyright 2017 IntellectualVenturesManagement, LLC (IV)AllRightsReserved.EMOD is licensed under the Creative CommonsAttribution-Noncommercial-ShareAlike 4.0 License.
Tuberculosis (TB) Tutorials 25
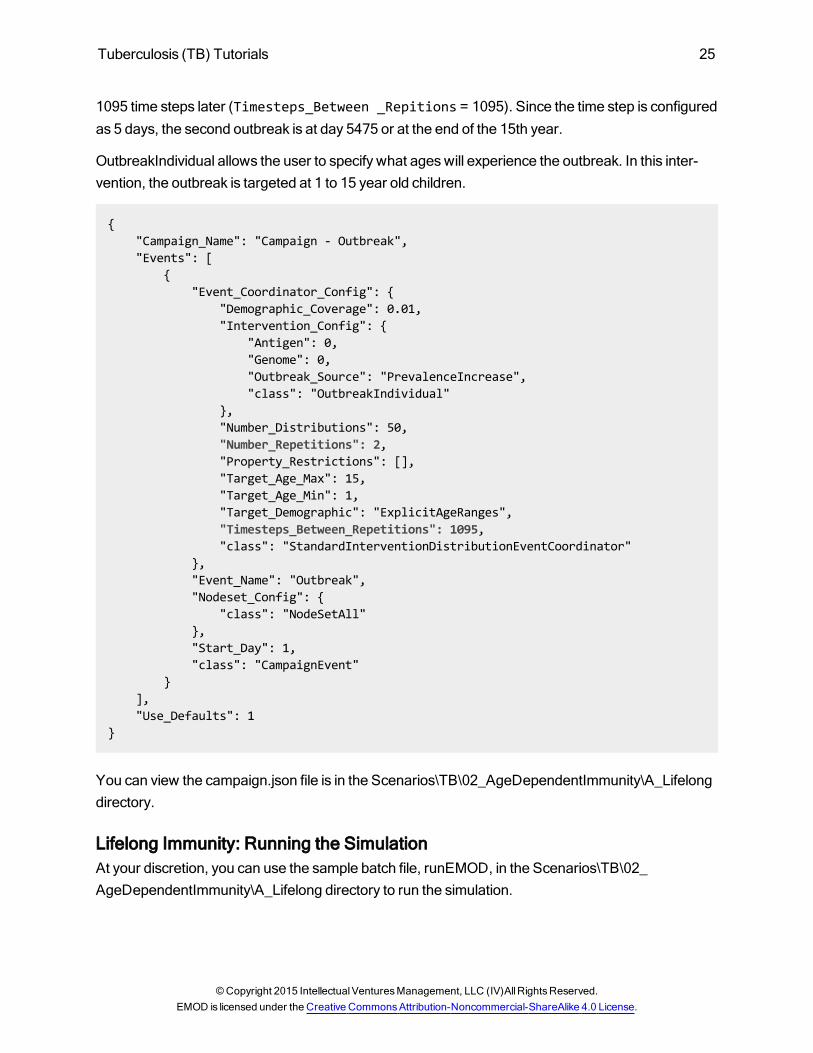
1095 time steps later (Timesteps_Between _Repitions = 1095). Since the time step is configuredas 5 days, the second outbreak is at day 5475 or at the end of the 15th year.
OutbreakIndividual allows the user to specify what ageswill experience the outbreak. In this inter-vention, the outbreak is targeted at 1 to 15 year old children.
{"Campaign_Name": "Campaign - Outbreak","Events": [
{"Event_Coordinator_Config": {
"Demographic_Coverage": 0.01,"Intervention_Config": {
"Antigen": 0,"Genome": 0,"Outbreak_Source": "PrevalenceIncrease","class": "OutbreakIndividual"
},"Number_Distributions": 50,"Number_Repetitions": 2,"Property_Restrictions": [],"Target_Age_Max": 15,"Target_Age_Min": 1,"Target_Demographic": "ExplicitAgeRanges","Timesteps_Between_Repetitions": 1095,"class": "StandardInterventionDistributionEventCoordinator"
},"Event_Name": "Outbreak","Nodeset_Config": {
"class": "NodeSetAll"},"Start_Day": 1,"class": "CampaignEvent"
}],"Use_Defaults": 1
}
You can view the campaign.json file is in the Scenarios\TB\02_AgeDependentImmunity\A_Lifelongdirectory.
Lifelong Immunity: Running the SimulationAt your discretion, you can use the sample batch file, runEMOD, in the Scenarios\TB\02_AgeDependentImmunity\A_Lifelong directory to run the simulation.
©Copyright 2015 IntellectualVenturesManagement, LLC (IV)AllRightsReserved.EMOD is licensed under the Creative CommonsAttribution-Noncommercial-ShareAlike 4.0 License.
26 Tuberculosis (TB) Tutorials
Lifelong Immunity: Expected Simulation Output
Generating Simulation GraphsAt your discretion, you can use the sample command script, plotResults, in the Scenarios\TB\02_AgeDependentImmunity\A_Lifelong directory to generate graphs from the simulation's InsetChartoutput file.
Simulation Output GraphsAn initial outbreak in the population results in lifelong immunity. Individuals born during the simulationget infected during the second outbreak.
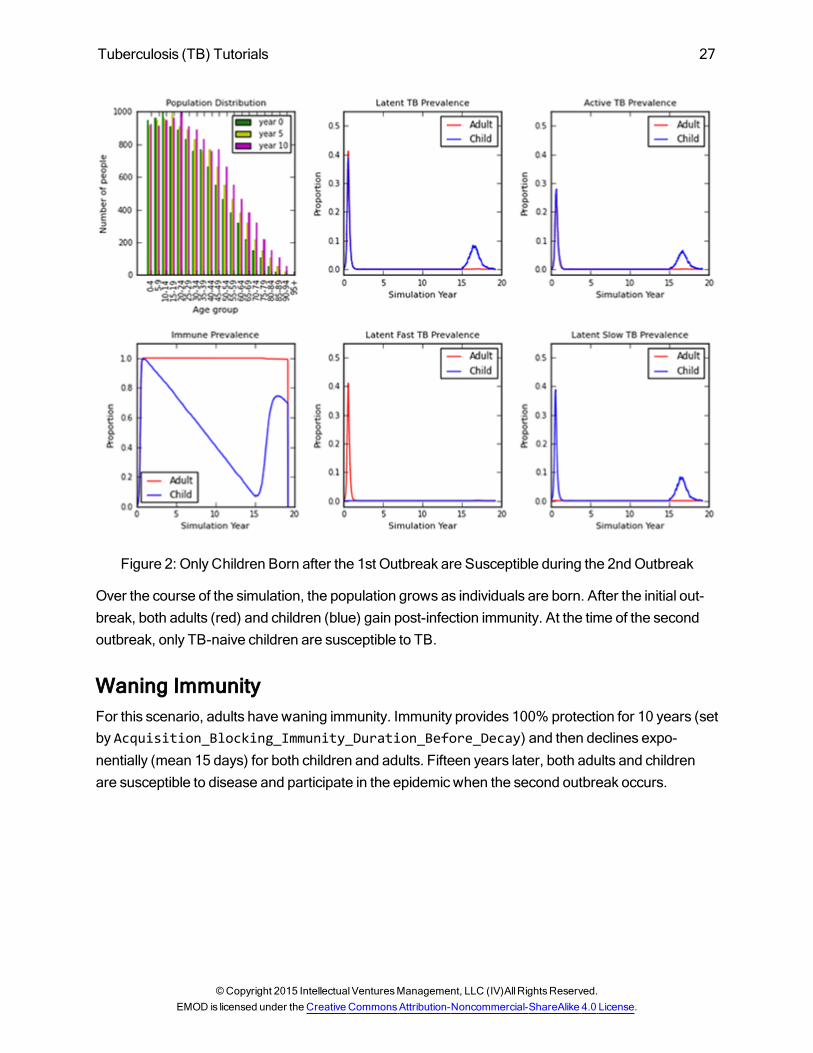
In the following figure, the top left graph (Population Distribution) shows the population age structureat time 0, year 5 and year 10 of the simulation. Because no deaths are allowed in themodel, eachage group simply ages up to the next age group after five years while new births populate the 0-4age bin.
The initial TB outbreak resolves as all individuals self-cure and experience lifelong immunity. Theimmunity in the child group falls from year 0 to year 15 as immune children age into the adult groupwhile children born during the simulation are TB naive. At the time of the second outbreak at year 15,only children whowere born during the simulation get infected.
NOTE: Because the EMODmodel is stochastic, your graphs may appear slightly different from thosegiven below.
©Copyright 2017 IntellectualVenturesManagement, LLC (IV)AllRightsReserved.EMOD is licensed under the Creative CommonsAttribution-Noncommercial-ShareAlike 4.0 License.
Tuberculosis (TB) Tutorials 27
Figure 2: Only Children Born after the 1st Outbreak are Susceptible during the 2ndOutbreak
Over the course of the simulation, the population grows as individuals are born. After the initial out-break, both adults (red) and children (blue) gain post-infection immunity. At the time of the secondoutbreak, only TB-naive children are susceptible to TB.
Waning ImmunityFor this scenario, adults have waning immunity. Immunity provides 100% protection for 10 years (setby Acquisition_Blocking_Immunity_Duration_Before_Decay) and then declines expo-nentially (mean 15 days) for both children and adults. Fifteen years later, both adults and childrenare susceptible to disease and participate in the epidemic when the second outbreak occurs.
©Copyright 2015 IntellectualVenturesManagement, LLC (IV)AllRightsReserved.EMOD is licensed under the Creative CommonsAttribution-Noncommercial-ShareAlike 4.0 License.
28 Tuberculosis (TB) Tutorials
Waning Immunity: Key Simulation Parameters
Immunity Parameters
Parameter Value Description
Acquisition_Blocking_Immunity_Decay_Rate
0.05
Rate at which acquisition-blockingimmunity decays after the initialperiod indicated by the base acquis-ition-blocking immunity offset.
Acquisition_Blocking_Immunity_Duration_Before_Decay
3650Number of days after a TB infectionhas cleared until acquisition-blockingimmunity begins to decay.
The complete config.json file is in the Scenarios\TB\02_AgeDependentImmunity\B_Waning dir-ectory.
Waning Immunity: InterventionsThis scenario has the same interventions as Life-Long Immunity. You can view the campaign.jsonfile in the Scenarios\TB\02_AgeDependentImmunity\B_Waning directory.
Waning Immunity: Running the SimulationAt your discretion, you can use the sample batch file, runEMOD, in the Scenarios\TB\02_AgeDependentImmunity\B_Waning directory to run the simulation.
Waning Immunity: Expected Simulation Output
Generating Simulation GraphsAt your discretion, you can use the sample command script, plotResults, in the Scenarios\TB\02_AgeDependentImmunity\Waining directory to generate graphs from the simulation's InsetChart out-put file.
Simulation Output GraphsThe initial outbreak in the population results in immunity which provides protection for 10 yearsbefore waning quickly to zero. All individuals are susceptible to the second outbreak that occurs 15years later.
©Copyright 2017 IntellectualVenturesManagement, LLC (IV)AllRightsReserved.EMOD is licensed under the Creative CommonsAttribution-Noncommercial-ShareAlike 4.0 License.
Tuberculosis (TB) Tutorials 29
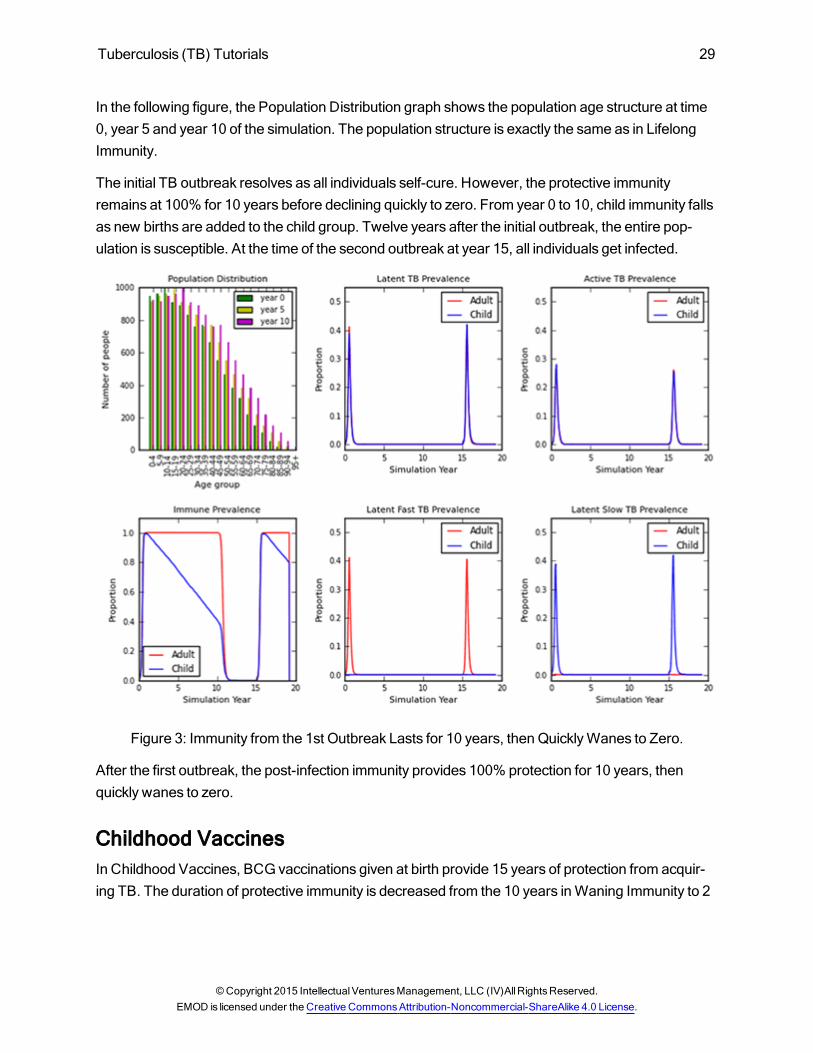
In the following figure, the Population Distribution graph shows the population age structure at time0, year 5 and year 10 of the simulation. The population structure is exactly the same as in LifelongImmunity.
The initial TB outbreak resolves as all individuals self-cure. However, the protective immunityremains at 100% for 10 years before declining quickly to zero. From year 0 to 10, child immunity fallsas new births are added to the child group. Twelve years after the initial outbreak, the entire pop-ulation is susceptible. At the time of the second outbreak at year 15, all individuals get infected.
Figure 3: Immunity from the 1st Outbreak Lasts for 10 years, thenQuicklyWanes to Zero.
After the first outbreak, the post-infection immunity provides 100% protection for 10 years, thenquickly wanes to zero.
Childhood VaccinesIn Childhood Vaccines, BCGvaccinations given at birth provide 15 years of protection from acquir-ing TB. The duration of protective immunity is decreased from the 10 years inWaning Immunity to 2
©Copyright 2015 IntellectualVenturesManagement, LLC (IV)AllRightsReserved.EMOD is licensed under the Creative CommonsAttribution-Noncommercial-ShareAlike 4.0 License.
30 Tuberculosis (TB) Tutorials
years. At the time of the second outbreak at year 15, only adults, who all experienced waningimmunity after the first outbreak, participate in the second outbreak.
Childhood Vaccines: Key Simulation ParametersThis scenario has the same configuration file asWaning Immunity. The complete list of parametersare in the config.json file in the Scenarios\TB\02_AgeDependentImmunity\C_Vaccines directory.
Childhood Vaccines: InterventionsThis scenario uses the interventions as in the previous scenarios. However, an additional vaccineintervention is added. It models a simple vaccine with 100% protection for 15 years.
For additional information about how to parameterize vaccines, seeGeneric 2: SIR - Targeted Vac-cination Campaigns.
. . ."Intervention_Config": {
"Actual_IndividualIntervention_Config": {"Cost_To_Consumer": 1,"Durability_Time_Profile": "BOXDURABILITY","Primary_Decay_Time_Constant": 5475,"Reduced_Acquire": 1,"Vaccine_Take": 1,"Vaccine_Take_Age_Decay_Rate": 0,"Vaccine_Type": "AcquisitionBlocking","class": "BCGVaccine"
},"Trigger_Condition": "Births","class": "NodeLevelHealthTriggeredIV"
},. . .
You can view the campaign.json file in the Scenarios\TB\02_AgeDependentImmunity\C_Vaccinesdirectory.
Childhood Vaccines: Running the SimulationAt your discretion, you can use the sample batch file, runEMOD, in the Scenarios\TB\02_AgeDependentImmunity\C_Vaccines directory to run the simulation.
©Copyright 2017 IntellectualVenturesManagement, LLC (IV)AllRightsReserved.EMOD is licensed under the Creative CommonsAttribution-Noncommercial-ShareAlike 4.0 License.
Tuberculosis (TB) Tutorials 31
Childhood Vaccines: Expected Simulation Output
Generating Simulation GraphsAt your discretion, you can use the sampleWindowsCommand script to create graphs. From theEMODQuick Start commandwindow, navigate to this scenario's directory and enter plotResults.
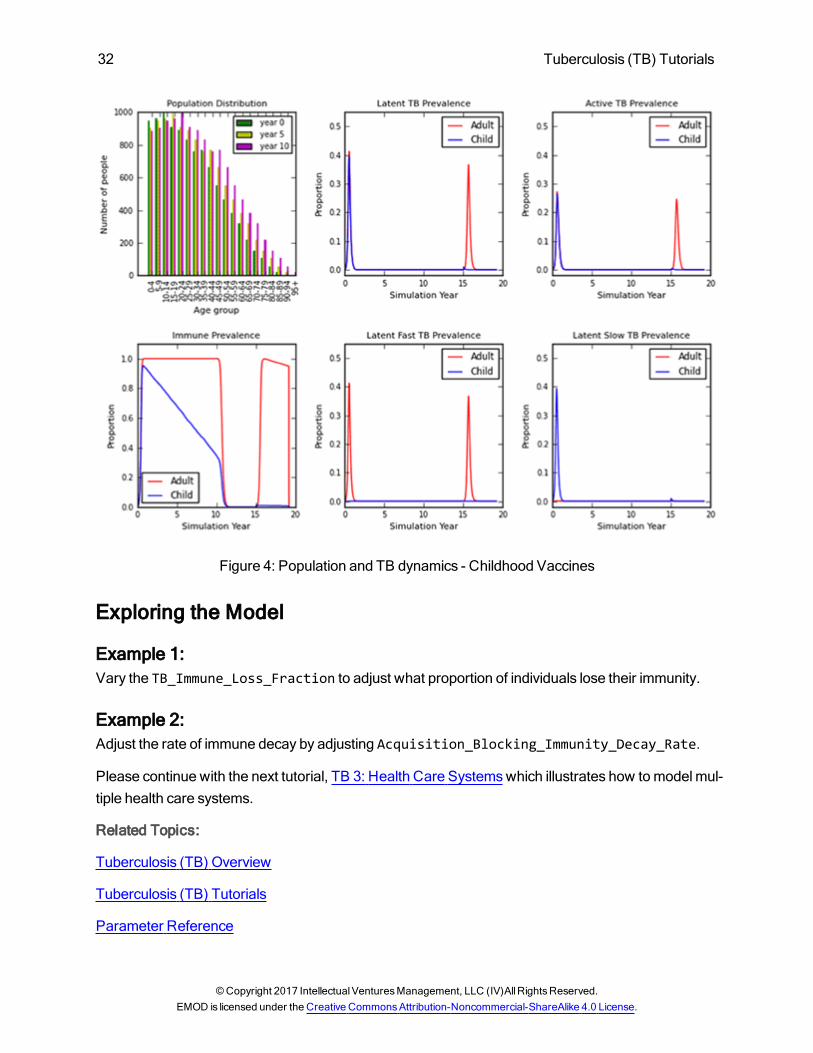
Simulation Output GraphsAn initial outbreak in the population results in immunity which provides protection for two yearsbefore waning quickly to zero. All individuals are susceptible to the second outbreak that occurs 15years later.
The population age structure remains the same as in the first two scenarios. The protective immunityremains at 100% for only two years before declining quickly to zero. The population immunity fallsslightly in children as new TB-naive births are added to the child group, Fifteen years after the initialoutbreak, the entire adult population is susceptible and all children are protected by vaccine derivedimmunity. At the time of the second outbreak at year 15, all adults get infected.
Note: The plotted immunity represents only disease-acquired immunity and does not include thevaccine derived immunity.
©Copyright 2015 IntellectualVenturesManagement, LLC (IV)AllRightsReserved.EMOD is licensed under the Creative CommonsAttribution-Noncommercial-ShareAlike 4.0 License.
32 Tuberculosis (TB) Tutorials
Figure 4: Population and TB dynamics - Childhood Vaccines
Exploring the Model
Example 1:Vary the TB_Immune_Loss_Fraction to adjust what proportion of individuals lose their immunity.
Example 2:Adjust the rate of immune decay by adjusting Acquisition_Blocking_Immunity_Decay_Rate.
Please continue with the next tutorial, TB 3: Health Care Systemswhich illustrates how tomodelmul-tiple health care systems.
Related Topics:
Tuberculosis (TB) Overview
Tuberculosis (TB) Tutorials
Parameter Reference
©Copyright 2017 IntellectualVenturesManagement, LLC (IV)AllRightsReserved.EMOD is licensed under the Creative CommonsAttribution-Noncommercial-ShareAlike 4.0 License.
Tuberculosis (TB) Tutorials 33
TB 3: Health Care SystemsThis tutorial assumes that you have read TB 2: Age Distribution and Childhood Immunity.
The Health Care Systems tutorial illustrates how tomodelmultiple health care systems. It cat-egorizes patients into those who receive no care, those who receive care in the private health caresystem, and those who receive care in the public health care system. The scenario also illustrateshow to dynamically change the quality of care within a health care system during the simulation.
There are four scenarios in this tutorial. The first scenario, Multiple Systems, demonstrates how toconfiguremultiple health care systems. Each of the three subsequent scenarios build uponMultipleSystems by adding interventions that improve either individual's access to care, or the quality of carewithin a health system.
In general, public health systems have been found to offer more effective treatment with higher curerates than private health systems, as seen in China and India. For purposes of illustration, these dif-ferences are exaggerated in the scenarios: all in public care get cured, while all in private care returnto latent disease but relapse to active disease.
Multiple Systems: Individuals are equally divided into three health care systems. All individualsare infected at the beginning of the simulation. One hundred days after TB activation, indi-viduals who have private and public health care receive treatment with the quality of caredependent on the health care system.
NoCare to Public Health Care: Infected individuals who do not have access to health care areshifted to the public health system on day 750. On day 850 they receive curative treatment.
Private to Public Health Care: Individuals in the private health system receive a treatment andsubsequently relapse to active disease.When they relapse, they immediately shift from theprivate to the public health system. One hundred days after the shift, they receive curative treat-ment in the public health system.
Private Health Care Improvement: At day 75, the quality of care in the private health care sys-tem is improved such that all treatments in the private health system provided after day 75 arecurative treatments.
Demographics Inputs
IndividualPropertiesUse IndividualProperties to divide individuals into three health care groups (None, Private andPublic) which are treated differently in the simulation using targeted interventions.
©Copyright 2015 IntellectualVenturesManagement, LLC (IV)AllRightsReserved.EMOD is licensed under the Creative CommonsAttribution-Noncommercial-ShareAlike 4.0 License.
34 Tuberculosis (TB) Tutorials
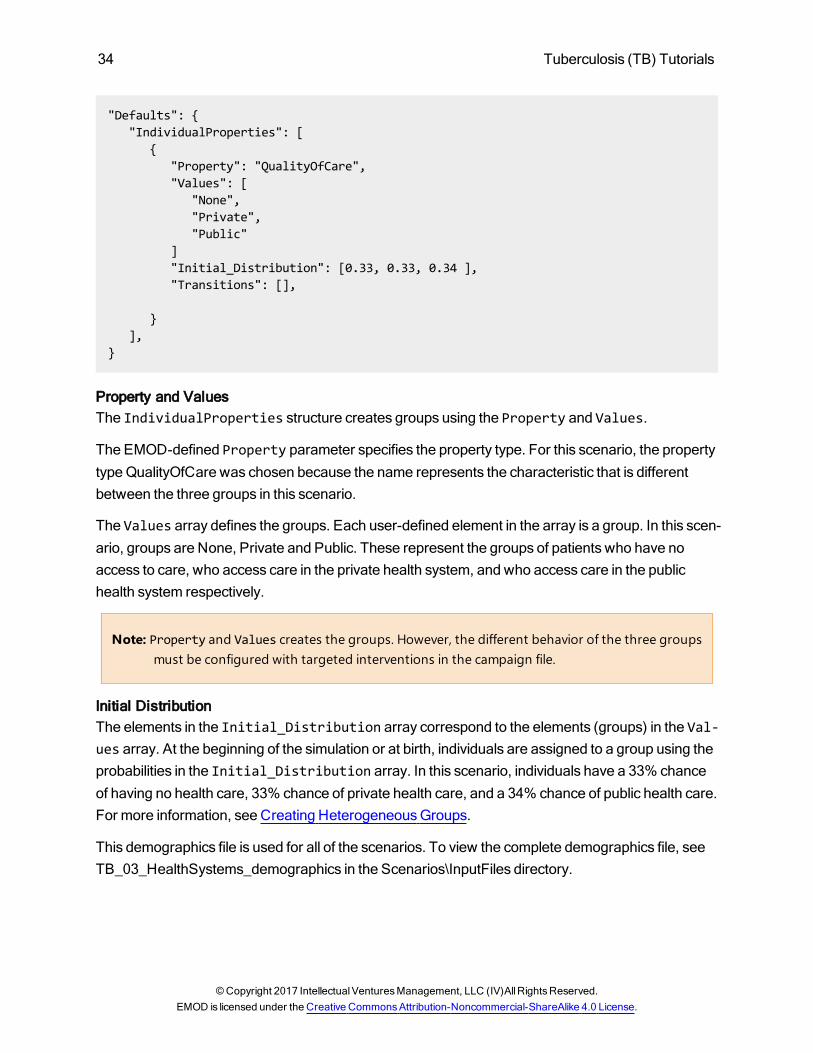
"Defaults": {"IndividualProperties": [
{"Property": "QualityOfCare","Values": [
"None","Private","Public"
]"Initial_Distribution": [0.33, 0.33, 0.34 ],"Transitions": [],
}],
}
Property and ValuesThe IndividualProperties structure creates groups using the Property and Values.
The EMOD-defined Property parameter specifies the property type. For this scenario, the propertytypeQualityOfCare was chosen because the name represents the characteristic that is differentbetween the three groups in this scenario.
The Values array defines the groups. Each user-defined element in the array is a group. In this scen-ario, groups are None, Private and Public. These represent the groups of patients who have noaccess to care, who access care in the private health system, and who access care in the publichealth system respectively.
Note: Property and Values creates the groups. However, the different behavior of the three groupsmust be configured with targeted interventions in the campaign file.
Initial DistributionThe elements in the Initial_Distribution array correspond to the elements (groups) in the Val-ues array. At the beginning of the simulation or at birth, individuals are assigned to a group using theprobabilities in the Initial_Distribution array. In this scenario, individuals have a 33% chanceof having no health care, 33% chance of private health care, and a 34% chance of public health care.For more information, see Creating HeterogeneousGroups.
This demographics file is used for all of the scenarios. To view the complete demographics file, seeTB_03_HealthSystems_demographics in the Scenarios\InputFiles directory.
©Copyright 2017 IntellectualVenturesManagement, LLC (IV)AllRightsReserved.EMOD is licensed under the Creative CommonsAttribution-Noncommercial-ShareAlike 4.0 License.
Tuberculosis (TB) Tutorials 35
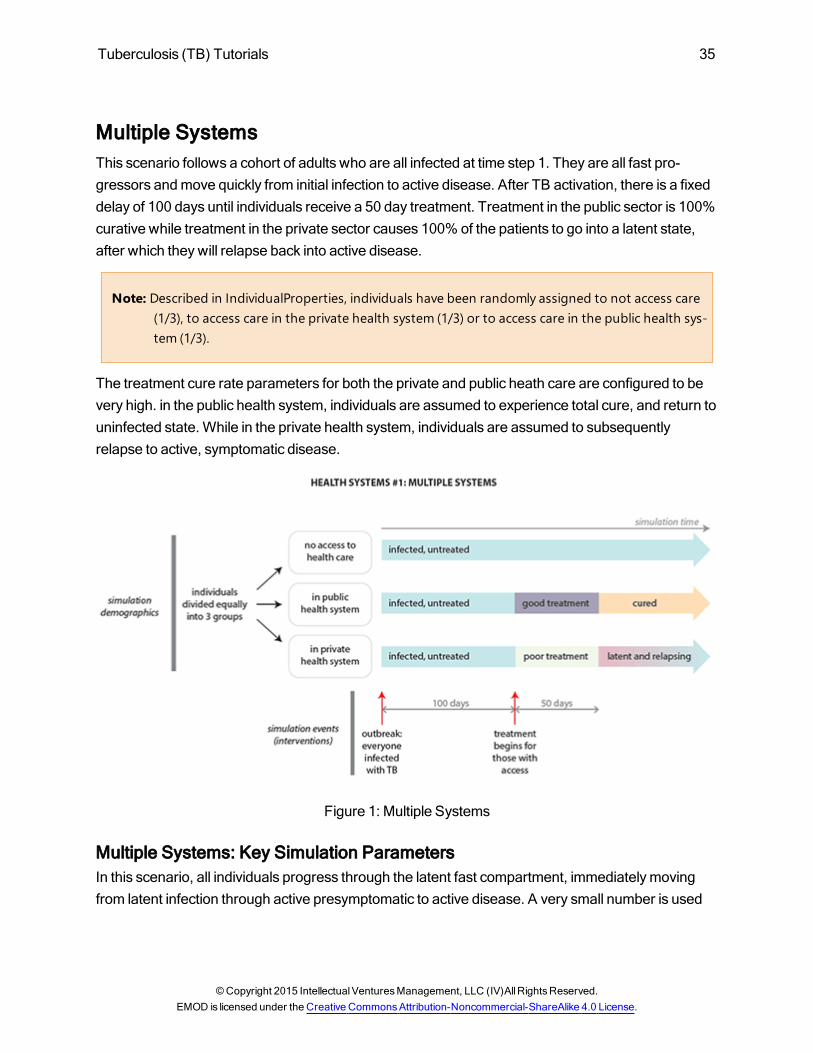
Multiple SystemsThis scenario follows a cohort of adults who are all infected at time step 1. They are all fast pro-gressors andmove quickly from initial infection to active disease. After TB activation, there is a fixeddelay of 100 days until individuals receive a 50 day treatment. Treatment in the public sector is 100%curative while treatment in the private sector causes 100% of the patients to go into a latent state,after which theywill relapse back into active disease.
Note: Described in IndividualProperties, individuals have been randomly assigned to not access care(1/3), to access care in the private health system (1/3) or to access care in the public health sys-tem (1/3).
The treatment cure rate parameters for both the private and public heath care are configured to bevery high. in the public health system, individuals are assumed to experience total cure, and return touninfected state. While in the private health system, individuals are assumed to subsequentlyrelapse to active, symptomatic disease.
Figure 1: Multiple Systems
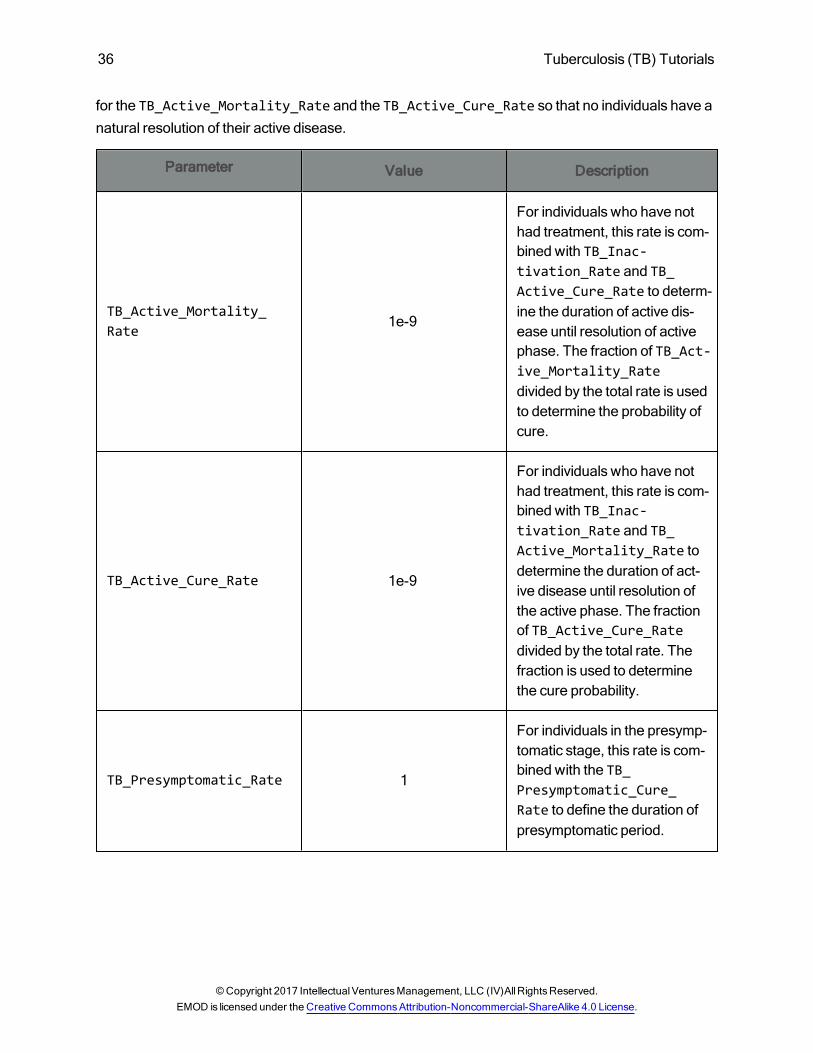
Multiple Systems: Key Simulation ParametersIn this scenario, all individuals progress through the latent fast compartment, immediatelymovingfrom latent infection through active presymptomatic to active disease. A very small number is used
©Copyright 2015 IntellectualVenturesManagement, LLC (IV)AllRightsReserved.EMOD is licensed under the Creative CommonsAttribution-Noncommercial-ShareAlike 4.0 License.
36 Tuberculosis (TB) Tutorials
for the TB_Active_Mortality_Rate and the TB_Active_Cure_Rate so that no individuals have anatural resolution of their active disease.
Parameter Value Description
TB_Active_Mortality_Rate
1e-9
For individuals who have nothad treatment, this rate is com-bined with TB_Inac-tivation_Rate and TB_Active_Cure_Rate to determ-ine the duration of active dis-ease until resolution of activephase. The fraction of TB_Act-ive_Mortality_Ratedivided by the total rate is usedto determine the probability ofcure.
TB_Active_Cure_Rate 1e-9
For individuals who have nothad treatment, this rate is com-bined with TB_Inac-tivation_Rate and TB_Active_Mortality_Rate todetermine the duration of act-ive disease until resolution ofthe active phase. The fractionof TB_Active_Cure_Ratedivided by the total rate. Thefraction is used to determinethe cure probability.
TB_Presymptomatic_Rate 1
For individuals in the presymp-tomatic stage, this rate is com-bined with the TB_Presymptomatic_Cure_Rate to define the duration ofpresymptomatic period.
©Copyright 2017 IntellectualVenturesManagement, LLC (IV)AllRightsReserved.EMOD is licensed under the Creative CommonsAttribution-Noncommercial-ShareAlike 4.0 License.
Tuberculosis (TB) Tutorials 37
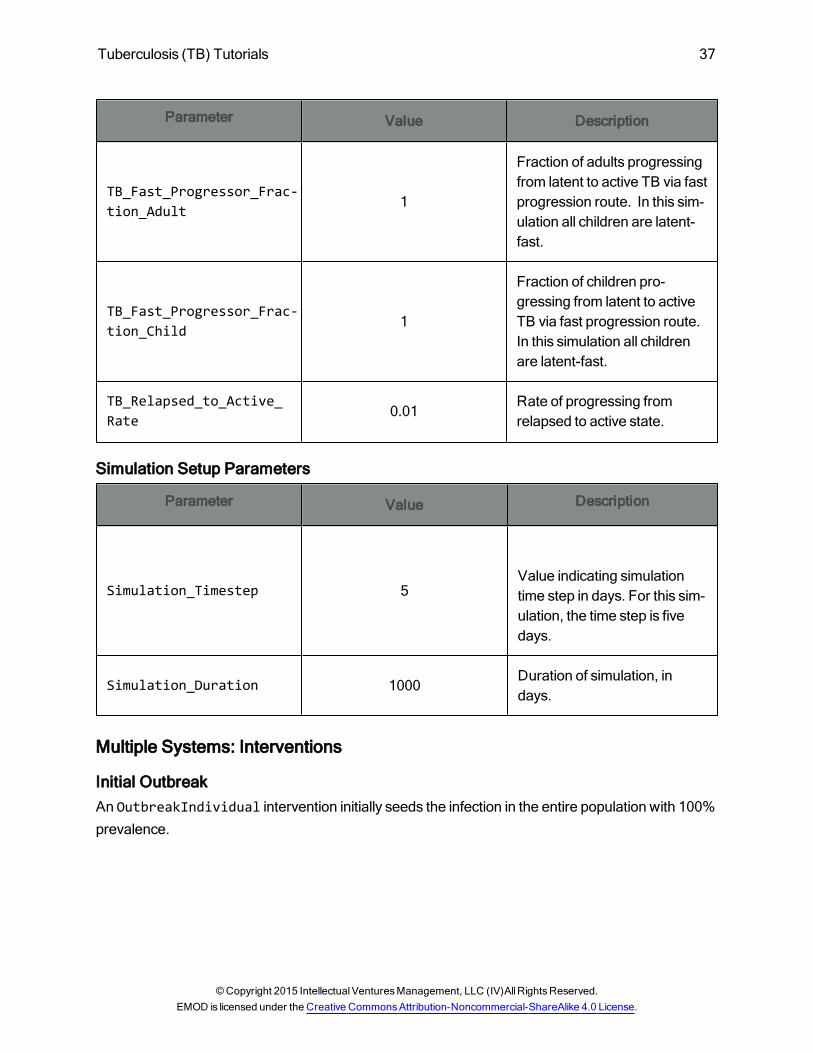
Parameter Value Description
TB_Fast_Progressor_Frac-tion_Adult
1
Fraction of adults progressingfrom latent to active TB via fastprogression route. In this sim-ulation all children are latent-fast.
TB_Fast_Progressor_Frac-tion_Child
1
Fraction of children pro-gressing from latent to activeTB via fast progression route.In this simulation all childrenare latent-fast.
TB_Relapsed_to_Active_Rate
0.01Rate of progressing fromrelapsed to active state.
Simulation Setup Parameters
Parameter Value Description
Simulation_Timestep 5Value indicating simulationtime step in days. For this sim-ulation, the time step is fivedays.
Simulation_Duration 1000Duration of simulation, indays.
Multiple Systems: Interventions
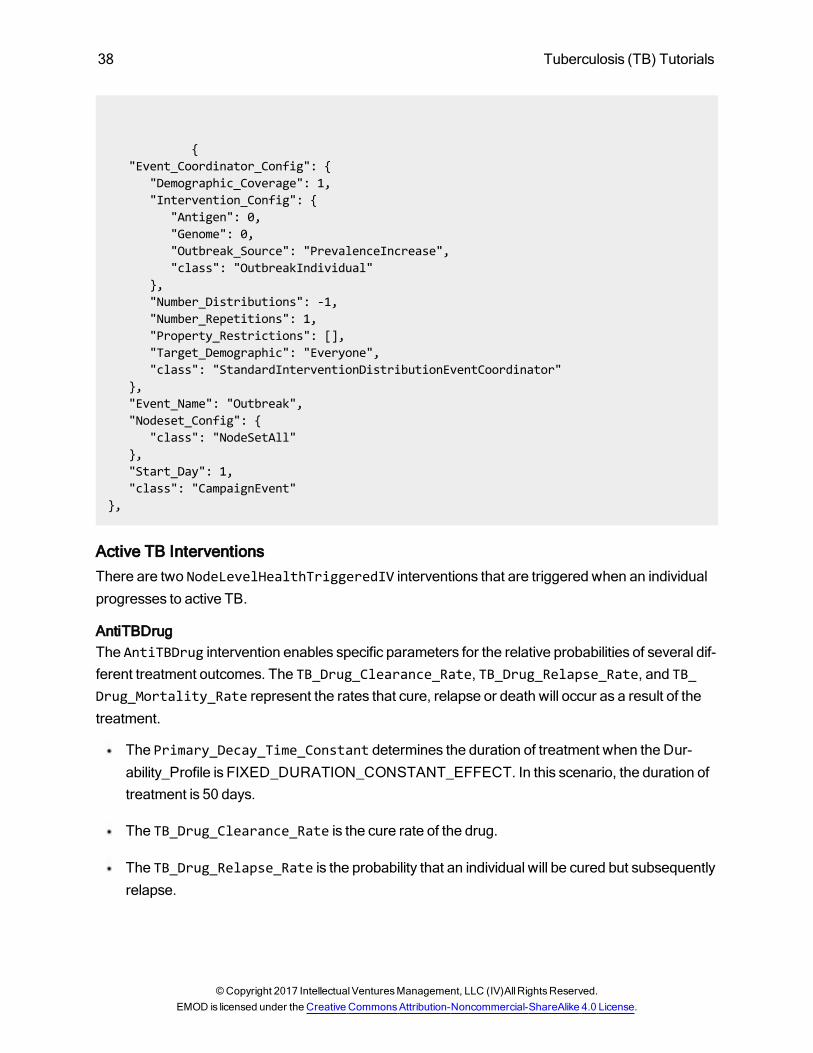
Initial OutbreakAn OutbreakIndividual intervention initially seeds the infection in the entire population with 100%prevalence.
©Copyright 2015 IntellectualVenturesManagement, LLC (IV)AllRightsReserved.EMOD is licensed under the Creative CommonsAttribution-Noncommercial-ShareAlike 4.0 License.
38 Tuberculosis (TB) Tutorials
{"Event_Coordinator_Config": {
"Demographic_Coverage": 1,"Intervention_Config": {
"Antigen": 0,"Genome": 0,"Outbreak_Source": "PrevalenceIncrease","class": "OutbreakIndividual"
},"Number_Distributions": -1,"Number_Repetitions": 1,"Property_Restrictions": [],"Target_Demographic": "Everyone","class": "StandardInterventionDistributionEventCoordinator"
},"Event_Name": "Outbreak","Nodeset_Config": {
"class": "NodeSetAll"},"Start_Day": 1,"class": "CampaignEvent"
},
Active TB InterventionsThere are two NodeLevelHealthTriggeredIV interventions that are triggered when an individualprogresses to active TB.
AntiTBDrugThe AntiTBDrug intervention enables specific parameters for the relative probabilities of several dif-ferent treatment outcomes. The TB_Drug_Clearance_Rate, TB_Drug_Relapse_Rate, and TB_Drug_Mortality_Rate represent the rates that cure, relapse or death will occur as a result of thetreatment.
The Primary_Decay_Time_Constant determines the duration of treatment when the Dur-ability_Profile is FIXED_DURATION_CONSTANT_EFFECT. In this scenario, the duration oftreatment is 50 days.
The TB_Drug_Clearance_Rate is the cure rate of the drug.
The TB_Drug_Relapse_Rate is the probability that an individual will be cured but subsequentlyrelapse.
©Copyright 2017 IntellectualVenturesManagement, LLC (IV)AllRightsReserved.EMOD is licensed under the Creative CommonsAttribution-Noncommercial-ShareAlike 4.0 License.
Tuberculosis (TB) Tutorials 39
In themodel, clearance represents a true cure, that is, a return to the uninfected state, while relapserepresents an infection which is initially appears cured but subsequently relapses to active symp-tomatic disease. Rates for clearance, relapse, andmortality are used to determine the weightedprobability each of these eventsmight occur during each time step. Only a single event can occur forthe duration of a single treatment, and the probabilities are held fixed during the entire treatment.Thus, it is the combination of these rates and the total duration of treatment which determines theoverall cure/relapse/mortality rate of a treatment episode. If no event occurs during the treatment,then the individual is categorized as having failed treatment.
The TB_Drug_Resistance_Rate is an independent probability that a drug sensitive person willacquire drug resistance. This primarily pertains to failed patients.
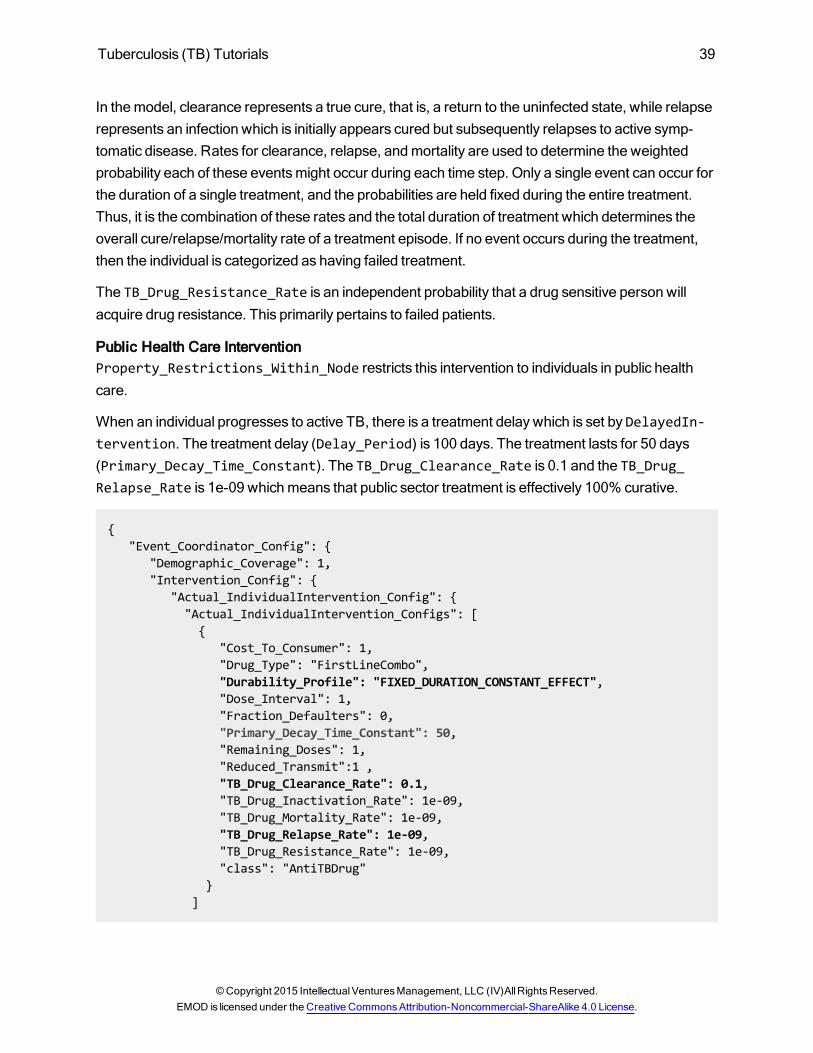
Public Health Care InterventionProperty_Restrictions_Within_Node restricts this intervention to individuals in public healthcare.
When an individual progresses to active TB, there is a treatment delay which is set by DelayedIn-tervention. The treatment delay (Delay_Period) is 100 days. The treatment lasts for 50 days(Primary_Decay_Time_Constant). The TB_Drug_Clearance_Rate is 0.1 and the TB_Drug_Relapse_Rate is 1e-09 whichmeans that public sector treatment is effectively 100% curative.
{"Event_Coordinator_Config": {
"Demographic_Coverage": 1,"Intervention_Config": {
"Actual_IndividualIntervention_Config": {"Actual_IndividualIntervention_Configs": [{
"Cost_To_Consumer": 1,"Drug_Type": "FirstLineCombo","Durability_Profile": "FIXED_DURATION_CONSTANT_EFFECT","Dose_Interval": 1,"Fraction_Defaulters": 0,"Primary_Decay_Time_Constant": 50,"Remaining_Doses": 1,"Reduced_Transmit":1 ,"TB_Drug_Clearance_Rate": 0.1,"TB_Drug_Inactivation_Rate": 1e-09,"TB_Drug_Mortality_Rate": 1e-09,"TB_Drug_Relapse_Rate": 1e-09,"TB_Drug_Resistance_Rate": 1e-09,"class": "AntiTBDrug"
}]
©Copyright 2015 IntellectualVenturesManagement, LLC (IV)AllRightsReserved.EMOD is licensed under the Creative CommonsAttribution-Noncommercial-ShareAlike 4.0 License.
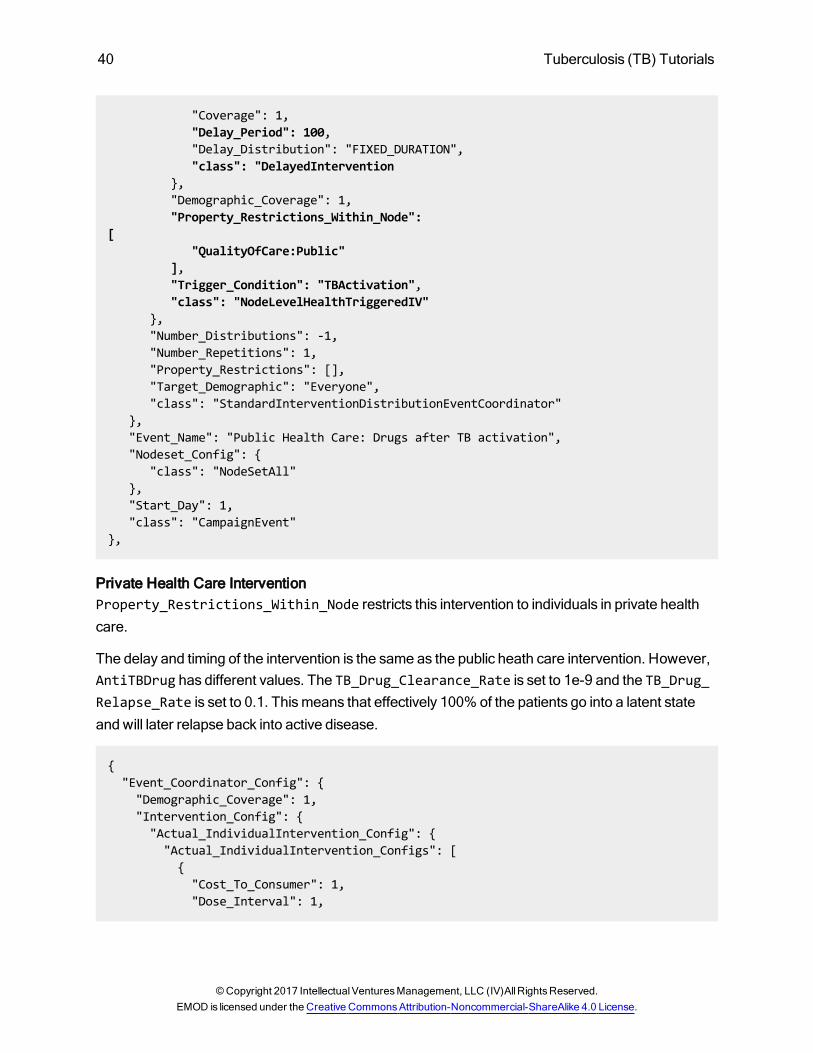
40 Tuberculosis (TB) Tutorials
"Coverage": 1,"Delay_Period": 100,"Delay_Distribution": "FIXED_DURATION","class": "DelayedIntervention
},"Demographic_Coverage": 1,"Property_Restrictions_Within_Node":
["QualityOfCare:Public"
],"Trigger_Condition": "TBActivation","class": "NodeLevelHealthTriggeredIV"
},"Number_Distributions": -1,"Number_Repetitions": 1,"Property_Restrictions": [],"Target_Demographic": "Everyone","class": "StandardInterventionDistributionEventCoordinator"
},"Event_Name": "Public Health Care: Drugs after TB activation","Nodeset_Config": {
"class": "NodeSetAll"},"Start_Day": 1,"class": "CampaignEvent"
},
Private Health Care InterventionProperty_Restrictions_Within_Node restricts this intervention to individuals in private healthcare.
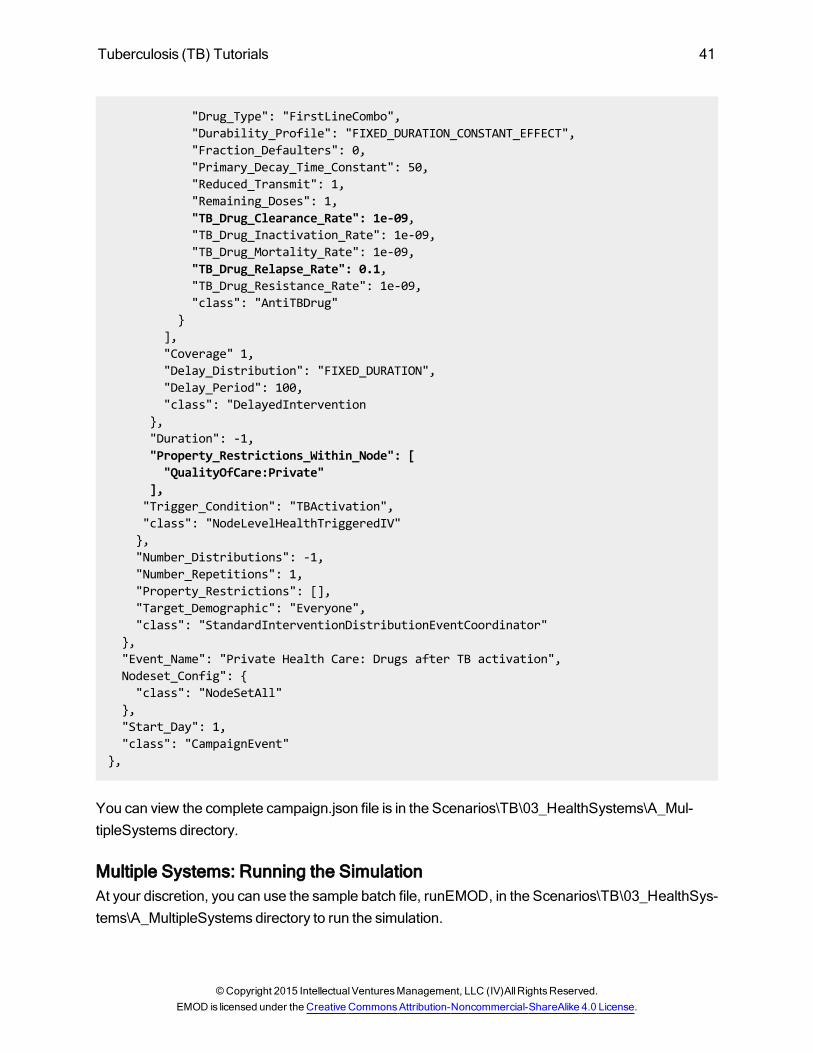
The delay and timing of the intervention is the same as the public heath care intervention. However,AntiTBDrug has different values. The TB_Drug_Clearance_Rate is set to 1e-9 and the TB_Drug_Relapse_Rate is set to 0.1. Thismeans that effectively 100% of the patients go into a latent stateand will later relapse back into active disease.
{"Event_Coordinator_Config": {"Demographic_Coverage": 1,"Intervention_Config": {"Actual_IndividualIntervention_Config": {"Actual_IndividualIntervention_Configs": [{"Cost_To_Consumer": 1,"Dose_Interval": 1,
©Copyright 2017 IntellectualVenturesManagement, LLC (IV)AllRightsReserved.EMOD is licensed under the Creative CommonsAttribution-Noncommercial-ShareAlike 4.0 License.
Tuberculosis (TB) Tutorials 41
"Drug_Type": "FirstLineCombo","Durability_Profile": "FIXED_DURATION_CONSTANT_EFFECT","Fraction_Defaulters": 0,"Primary_Decay_Time_Constant": 50,"Reduced_Transmit": 1,"Remaining_Doses": 1,"TB_Drug_Clearance_Rate": 1e-09,"TB_Drug_Inactivation_Rate": 1e-09,"TB_Drug_Mortality_Rate": 1e-09,"TB_Drug_Relapse_Rate": 0.1,"TB_Drug_Resistance_Rate": 1e-09,"class": "AntiTBDrug"
}],"Coverage" 1,"Delay_Distribution": "FIXED_DURATION","Delay_Period": 100,"class": "DelayedIntervention
},"Duration": -1,"Property_Restrictions_Within_Node": ["QualityOfCare:Private"
],"Trigger_Condition": "TBActivation","class": "NodeLevelHealthTriggeredIV"},"Number_Distributions": -1,"Number_Repetitions": 1,"Property_Restrictions": [],"Target_Demographic": "Everyone","class": "StandardInterventionDistributionEventCoordinator"
},"Event_Name": "Private Health Care: Drugs after TB activation",Nodeset_Config": {"class": "NodeSetAll"
},"Start_Day": 1,"class": "CampaignEvent"
},
You can view the complete campaign.json file is in the Scenarios\TB\03_HealthSystems\A_Mul-tipleSystems directory.
Multiple Systems: Running the SimulationAt your discretion, you can use the sample batch file, runEMOD, in the Scenarios\TB\03_HealthSys-tems\A_MultipleSystems directory to run the simulation.
©Copyright 2015 IntellectualVenturesManagement, LLC (IV)AllRightsReserved.EMOD is licensed under the Creative CommonsAttribution-Noncommercial-ShareAlike 4.0 License.
42 Tuberculosis (TB) Tutorials
Multiple Systems: Expected Simulation Output
Generating Simulation GraphsAt your discretion, you can use the sample script file, plotResuts, in the Scenarios\TB\03_HealthSys-tems\A_MultipleSystems directory to generate graphs from a simulation's InsetChart output file.
Simulation Output GraphsAfter the initial infection of the cohort, all individuals progress quickly through latent to active disease.Individuals who have no access to care remain in the active state. For individuals in the private andpublic sector, there is a 100-day delay until all individuals receive a 50-day treatment.
Public Health CareIndividuals in the public sector receive curative treatment and are no longer active. See the decline inthe green curve in the Active TB Population.
Private Health CareIndividuals eventually progress back to active disease.
Individuals who receive private care receive non-curative treatment and progress to a latentstate. See the blue line in Latent TB Population and Latent Pending Relapse Population.
After relapse, individuals progress to Active TB Population PostRelapse.
No Health CareIndividuals with no health care remain in the active state. See the red in Active TB Population.
NOTE: Because the EMODmodel is stochastic, your graphs may appear slightly different from thosegiven below.
©Copyright 2017 IntellectualVenturesManagement, LLC (IV)AllRightsReserved.EMOD is licensed under the Creative CommonsAttribution-Noncommercial-ShareAlike 4.0 License.
Tuberculosis (TB) Tutorials 43
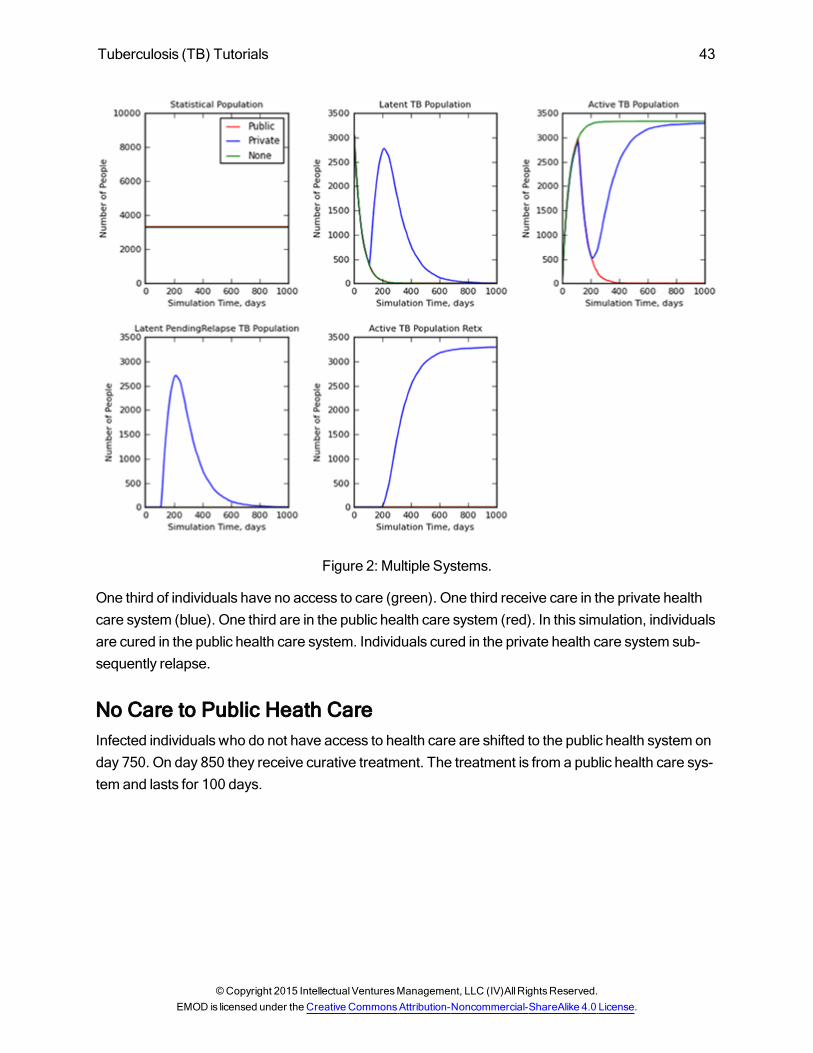
Figure 2: Multiple Systems.
One third of individuals have no access to care (green). One third receive care in the private healthcare system (blue). One third are in the public health care system (red). In this simulation, individualsare cured in the public health care system. Individuals cured in the private health care system sub-sequently relapse.
No Care to Public Heath CareInfected individuals who do not have access to health care are shifted to the public health system onday 750. On day 850 they receive curative treatment. The treatment is from a public health care sys-tem and lasts for 100 days.
©Copyright 2015 IntellectualVenturesManagement, LLC (IV)AllRightsReserved.EMOD is licensed under the Creative CommonsAttribution-Noncommercial-ShareAlike 4.0 License.
44 Tuberculosis (TB) Tutorials
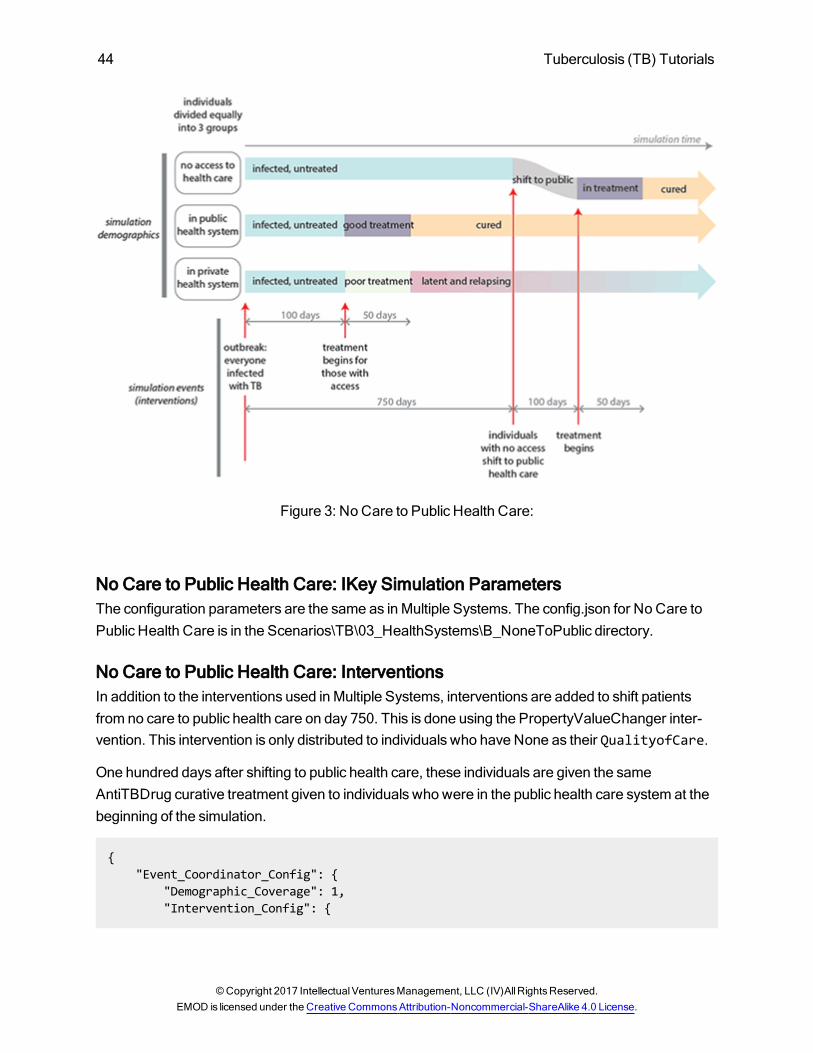
Figure 3: No Care to Public Health Care:
No Care to Public Health Care: IKey Simulation ParametersThe configuration parameters are the same as inMultiple Systems. The config.json for No Care toPublic Health Care is in the Scenarios\TB\03_HealthSystems\B_NoneToPublic directory.
No Care to Public Health Care: InterventionsIn addition to the interventions used inMultiple Systems, interventions are added to shift patientsfrom no care to public health care on day 750. This is done using the PropertyValueChanger inter-vention. This intervention is only distributed to individuals who have None as their QualityofCare.
One hundred days after shifting to public health care, these individuals are given the sameAntiTBDrug curative treatment given to individuals who were in the public health care system at thebeginning of the simulation.
{"Event_Coordinator_Config": {
"Demographic_Coverage": 1,"Intervention_Config": {
©Copyright 2017 IntellectualVenturesManagement, LLC (IV)AllRightsReserved.EMOD is licensed under the Creative CommonsAttribution-Noncommercial-ShareAlike 4.0 License.
Tuberculosis (TB) Tutorials 45
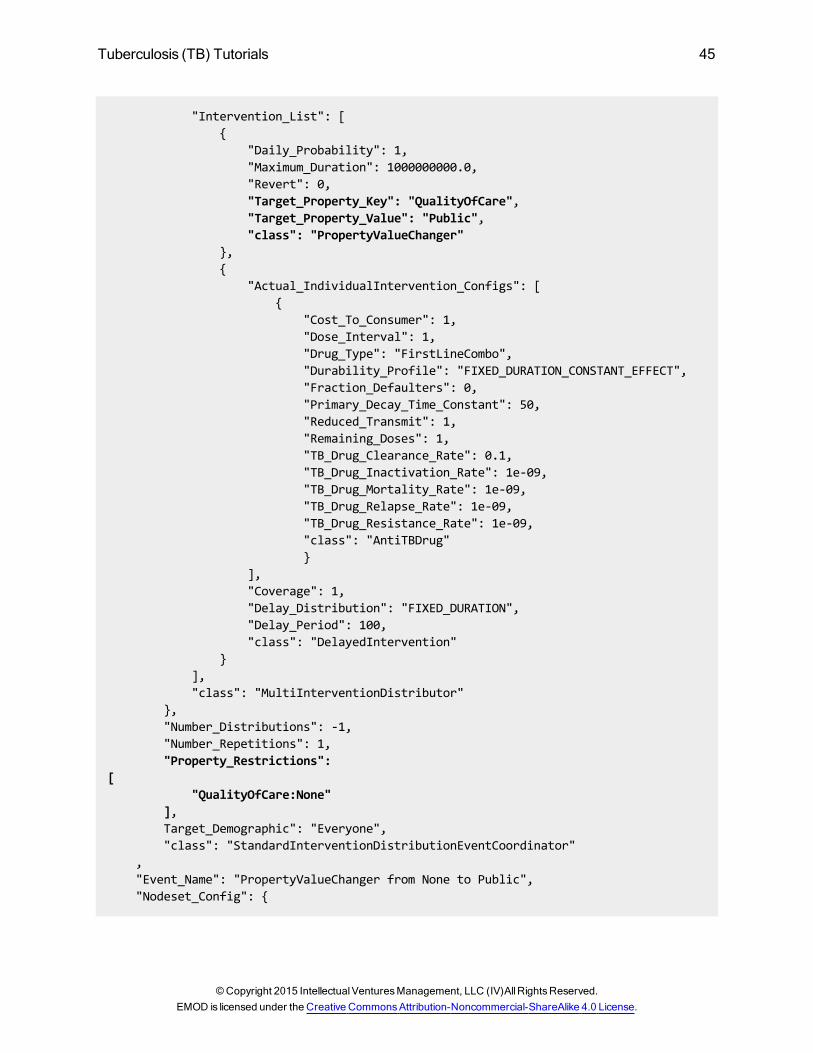
"Intervention_List": [{
"Daily_Probability": 1,"Maximum_Duration": 1000000000.0,"Revert": 0,"Target_Property_Key": "QualityOfCare","Target_Property_Value": "Public","class": "PropertyValueChanger"
},{
"Actual_IndividualIntervention_Configs": [{
"Cost_To_Consumer": 1,"Dose_Interval": 1,"Drug_Type": "FirstLineCombo","Durability_Profile": "FIXED_DURATION_CONSTANT_EFFECT","Fraction_Defaulters": 0,"Primary_Decay_Time_Constant": 50,"Reduced_Transmit": 1,"Remaining_Doses": 1,"TB_Drug_Clearance_Rate": 0.1,"TB_Drug_Inactivation_Rate": 1e-09,"TB_Drug_Mortality_Rate": 1e-09,"TB_Drug_Relapse_Rate": 1e-09,"TB_Drug_Resistance_Rate": 1e-09,"class": "AntiTBDrug"}
],"Coverage": 1,"Delay_Distribution": "FIXED_DURATION","Delay_Period": 100,"class": "DelayedIntervention"
}],"class": "MultiInterventionDistributor"
},"Number_Distributions": -1,"Number_Repetitions": 1,"Property_Restrictions":
["QualityOfCare:None"
],Target_Demographic": "Everyone","class": "StandardInterventionDistributionEventCoordinator"
,"Event_Name": "PropertyValueChanger from None to Public","Nodeset_Config": {
©Copyright 2015 IntellectualVenturesManagement, LLC (IV)AllRightsReserved.EMOD is licensed under the Creative CommonsAttribution-Noncommercial-ShareAlike 4.0 License.
46 Tuberculosis (TB) Tutorials
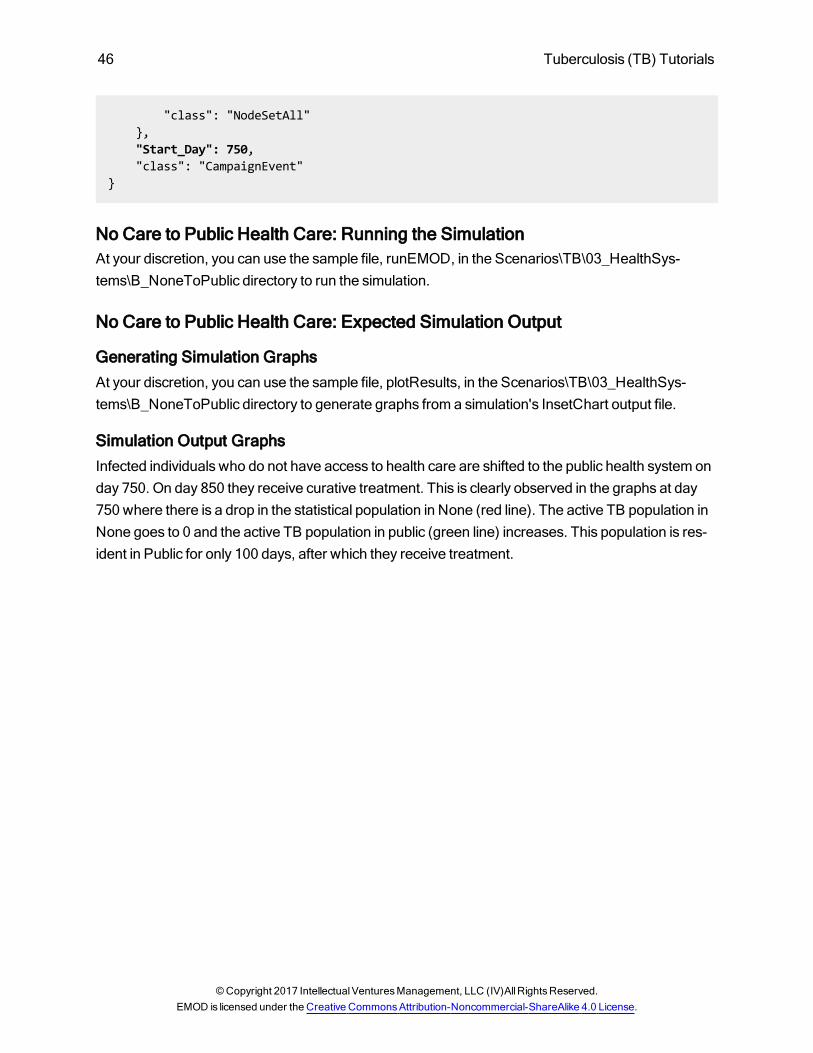
"class": "NodeSetAll"},"Start_Day": 750,"class": "CampaignEvent"
}
No Care to Public Health Care: Running the SimulationAt your discretion, you can use the sample file, runEMOD, in the Scenarios\TB\03_HealthSys-tems\B_NoneToPublic directory to run the simulation.
No Care to Public Health Care: Expected Simulation Output
Generating Simulation GraphsAt your discretion, you can use the sample file, plotResults, in the Scenarios\TB\03_HealthSys-tems\B_NoneToPublic directory to generate graphs from a simulation's InsetChart output file.
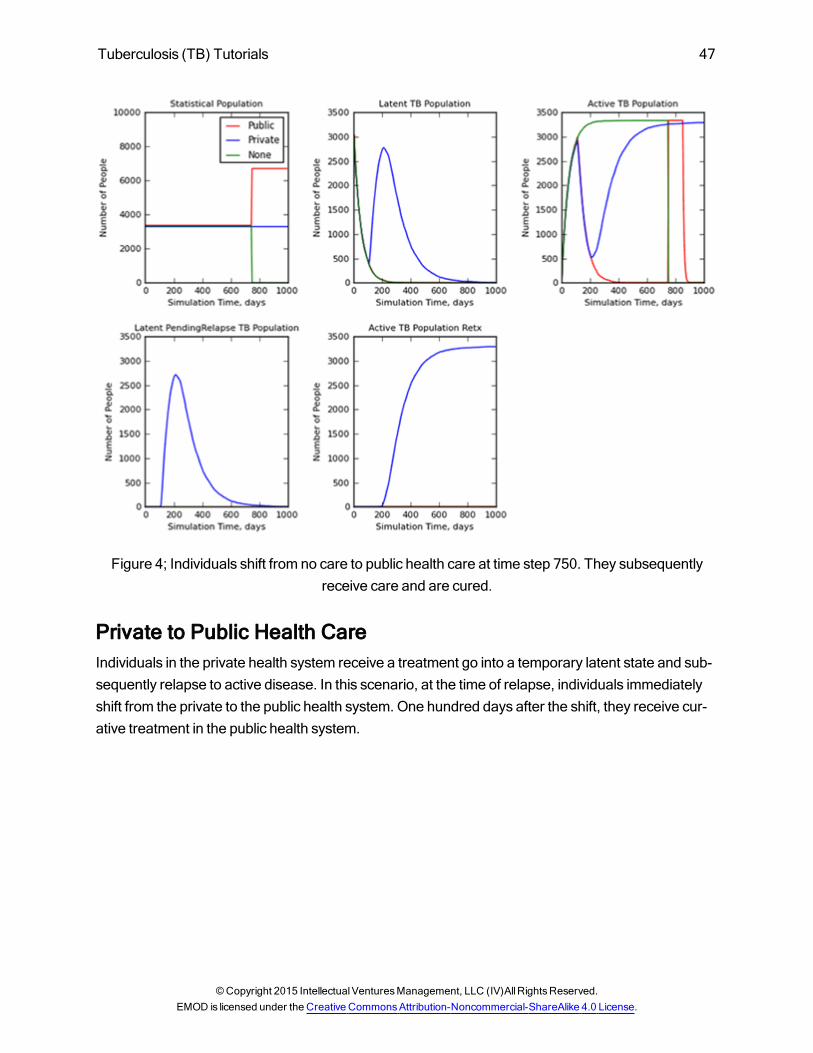
Simulation Output GraphsInfected individuals who do not have access to health care are shifted to the public health system onday 750. On day 850 they receive curative treatment. This is clearly observed in the graphs at day750 where there is a drop in the statistical population in None (red line). The active TB population inNone goes to 0 and the active TB population in public (green line) increases. This population is res-ident in Public for only 100 days, after which they receive treatment.
©Copyright 2017 IntellectualVenturesManagement, LLC (IV)AllRightsReserved.EMOD is licensed under the Creative CommonsAttribution-Noncommercial-ShareAlike 4.0 License.
Tuberculosis (TB) Tutorials 47
Figure 4; Individuals shift from no care to public health care at time step 750. They subsequentlyreceive care and are cured.
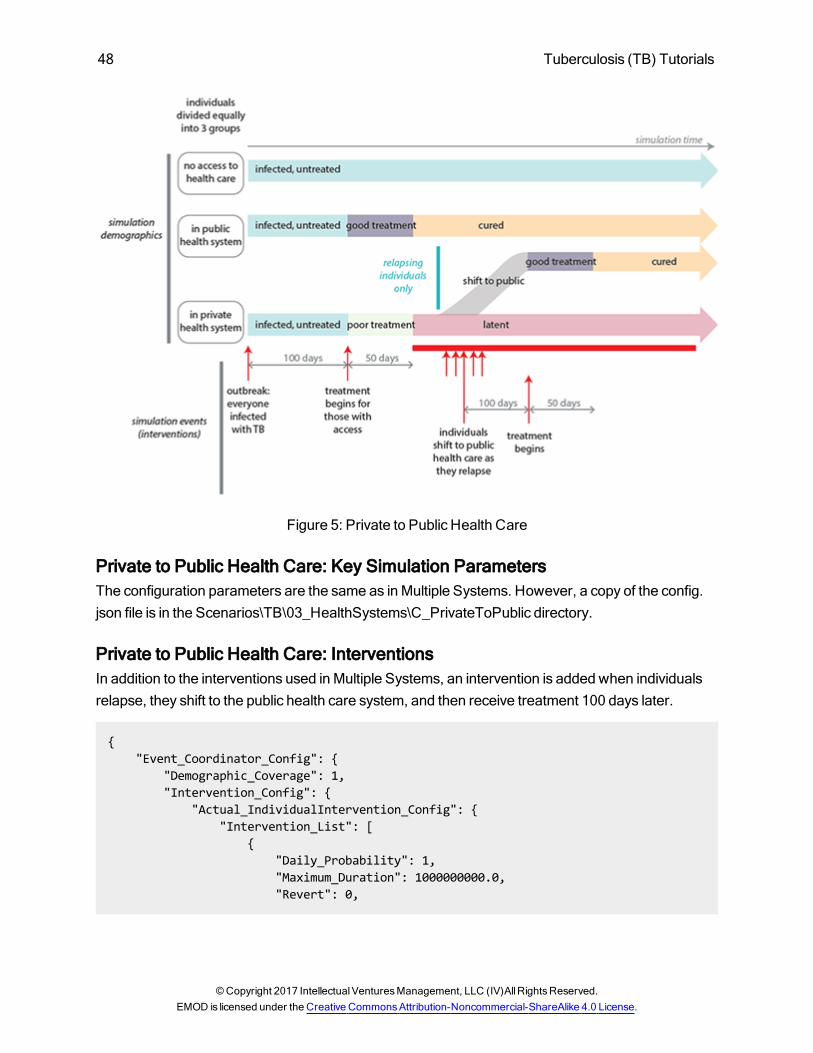
Private to Public Health CareIndividuals in the private health system receive a treatment go into a temporary latent state and sub-sequently relapse to active disease. In this scenario, at the time of relapse, individuals immediatelyshift from the private to the public health system. One hundred days after the shift, they receive cur-ative treatment in the public health system.
©Copyright 2015 IntellectualVenturesManagement, LLC (IV)AllRightsReserved.EMOD is licensed under the Creative CommonsAttribution-Noncommercial-ShareAlike 4.0 License.
48 Tuberculosis (TB) Tutorials
Figure 5: Private to Public Health Care
Private to Public Health Care: Key Simulation ParametersThe configuration parameters are the same as inMultiple Systems. However, a copy of the config.json file is in the Scenarios\TB\03_HealthSystems\C_PrivateToPublic directory.
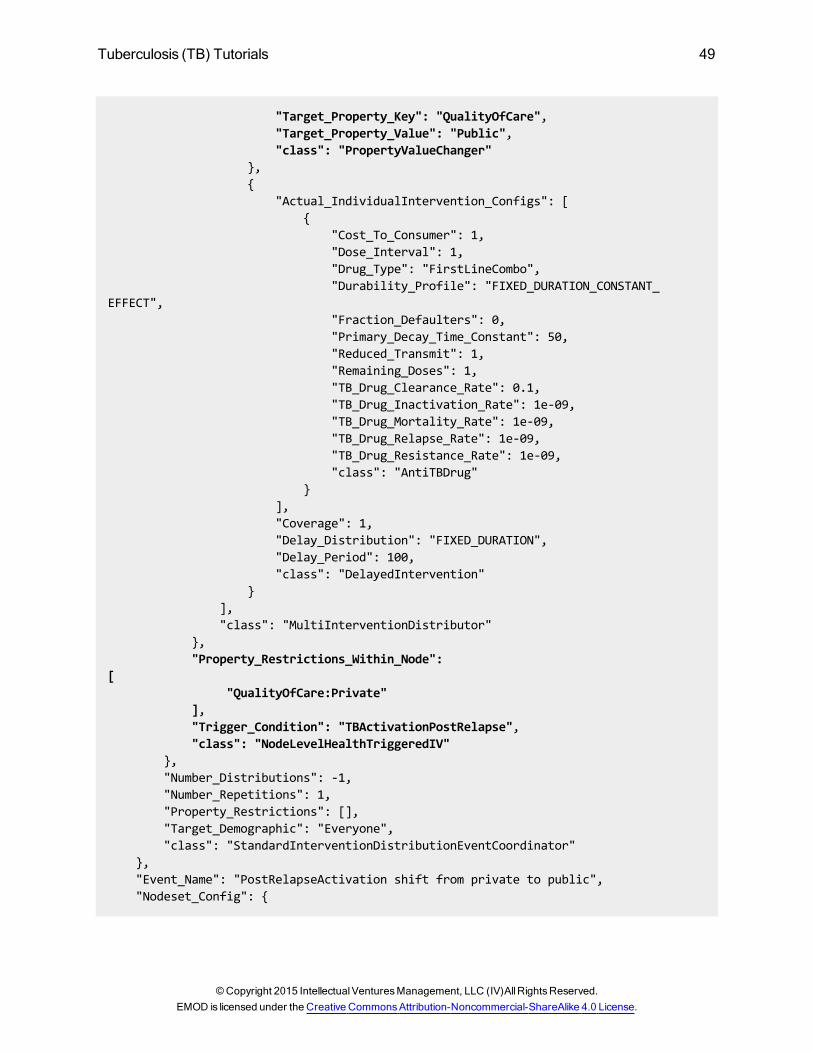
Private to Public Health Care: InterventionsIn addition to the interventions used inMultiple Systems, an intervention is added when individualsrelapse, they shift to the public health care system, and then receive treatment 100 days later.
{"Event_Coordinator_Config": {
"Demographic_Coverage": 1,"Intervention_Config": {
"Actual_IndividualIntervention_Config": {"Intervention_List": [
{"Daily_Probability": 1,"Maximum_Duration": 1000000000.0,"Revert": 0,
©Copyright 2017 IntellectualVenturesManagement, LLC (IV)AllRightsReserved.EMOD is licensed under the Creative CommonsAttribution-Noncommercial-ShareAlike 4.0 License.
Tuberculosis (TB) Tutorials 49
"Target_Property_Key": "QualityOfCare","Target_Property_Value": "Public","class": "PropertyValueChanger"
},{
"Actual_IndividualIntervention_Configs": [{
"Cost_To_Consumer": 1,"Dose_Interval": 1,"Drug_Type": "FirstLineCombo","Durability_Profile": "FIXED_DURATION_CONSTANT_
EFFECT","Fraction_Defaulters": 0,"Primary_Decay_Time_Constant": 50,"Reduced_Transmit": 1,"Remaining_Doses": 1,"TB_Drug_Clearance_Rate": 0.1,"TB_Drug_Inactivation_Rate": 1e-09,"TB_Drug_Mortality_Rate": 1e-09,"TB_Drug_Relapse_Rate": 1e-09,"TB_Drug_Resistance_Rate": 1e-09,"class": "AntiTBDrug"
}],"Coverage": 1,"Delay_Distribution": "FIXED_DURATION","Delay_Period": 100,"class": "DelayedIntervention"
}],"class": "MultiInterventionDistributor"
},"Property_Restrictions_Within_Node":
["QualityOfCare:Private"
],"Trigger_Condition": "TBActivationPostRelapse","class": "NodeLevelHealthTriggeredIV"
},"Number_Distributions": -1,"Number_Repetitions": 1,"Property_Restrictions": [],"Target_Demographic": "Everyone","class": "StandardInterventionDistributionEventCoordinator"
},"Event_Name": "PostRelapseActivation shift from private to public","Nodeset_Config": {
©Copyright 2015 IntellectualVenturesManagement, LLC (IV)AllRightsReserved.EMOD is licensed under the Creative CommonsAttribution-Noncommercial-ShareAlike 4.0 License.
50 Tuberculosis (TB) Tutorials
"class": "NodeSetAll"},"Start_Day": 1,"class": "CampaignEvent"
}
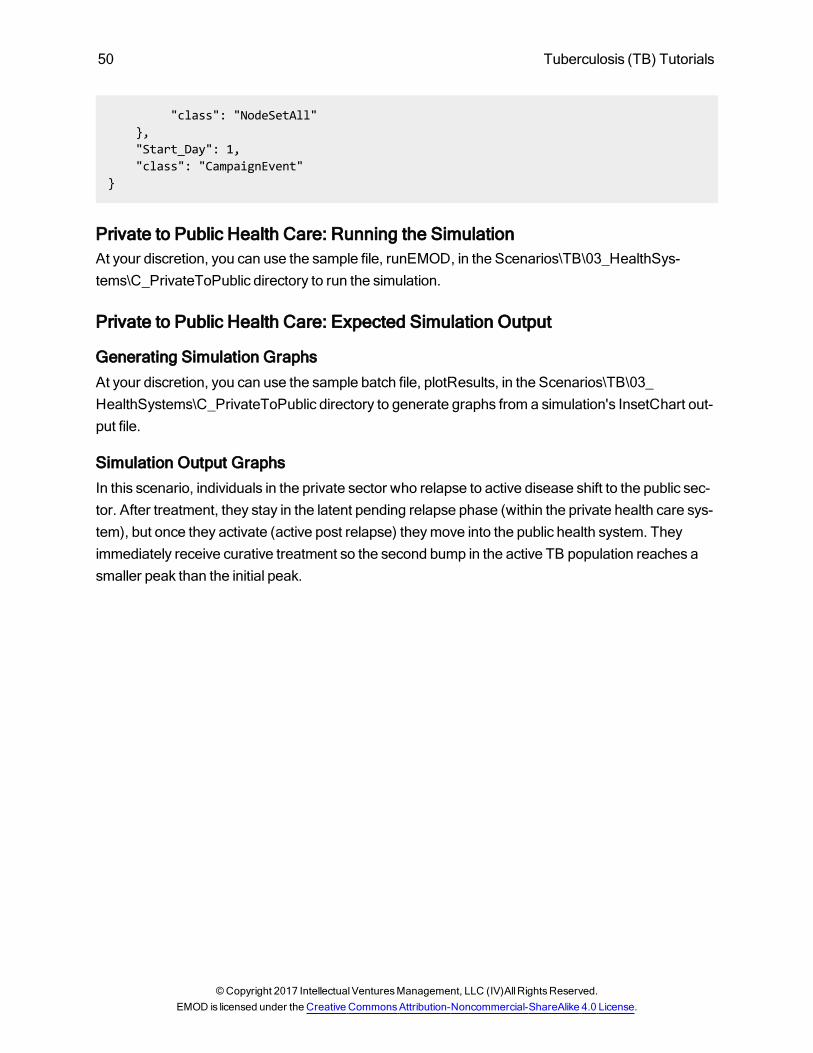
Private to Public Health Care: Running the SimulationAt your discretion, you can use the sample file, runEMOD, in the Scenarios\TB\03_HealthSys-tems\C_PrivateToPublic directory to run the simulation.
Private to Public Health Care: Expected Simulation Output
Generating Simulation GraphsAt your discretion, you can use the sample batch file, plotResults, in the Scenarios\TB\03_HealthSystems\C_PrivateToPublic directory to generate graphs from a simulation's InsetChart out-put file.
Simulation Output GraphsIn this scenario, individuals in the private sector who relapse to active disease shift to the public sec-tor. After treatment, they stay in the latent pending relapse phase (within the private health care sys-tem), but once they activate (active post relapse) theymove into the public health system. Theyimmediately receive curative treatment so the second bump in the active TB population reaches asmaller peak than the initial peak.
©Copyright 2017 IntellectualVenturesManagement, LLC (IV)AllRightsReserved.EMOD is licensed under the Creative CommonsAttribution-Noncommercial-ShareAlike 4.0 License.
Tuberculosis (TB) Tutorials 51
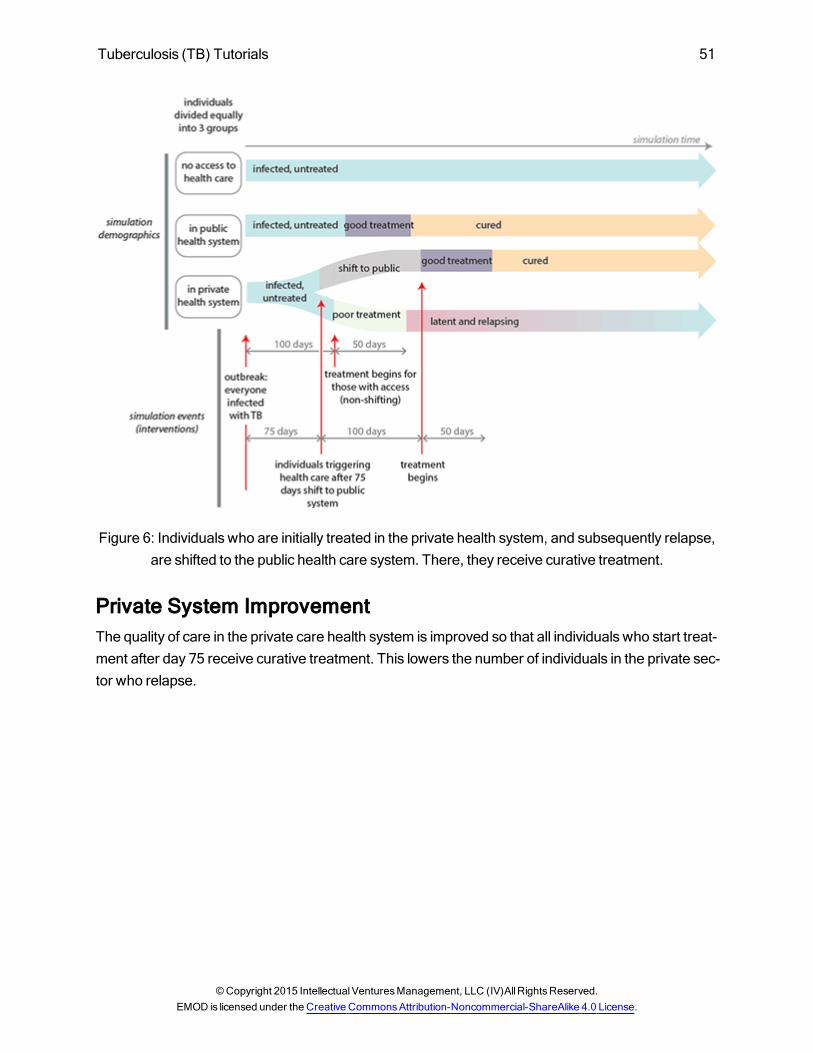
Figure 6: Individuals who are initially treated in the private health system, and subsequently relapse,are shifted to the public health care system. There, they receive curative treatment.
Private System ImprovementThe quality of care in the private care health system is improved so that all individuals who start treat-ment after day 75 receive curative treatment. This lowers the number of individuals in the private sec-tor who relapse.
©Copyright 2015 IntellectualVenturesManagement, LLC (IV)AllRightsReserved.EMOD is licensed under the Creative CommonsAttribution-Noncommercial-ShareAlike 4.0 License.
52 Tuberculosis (TB) Tutorials
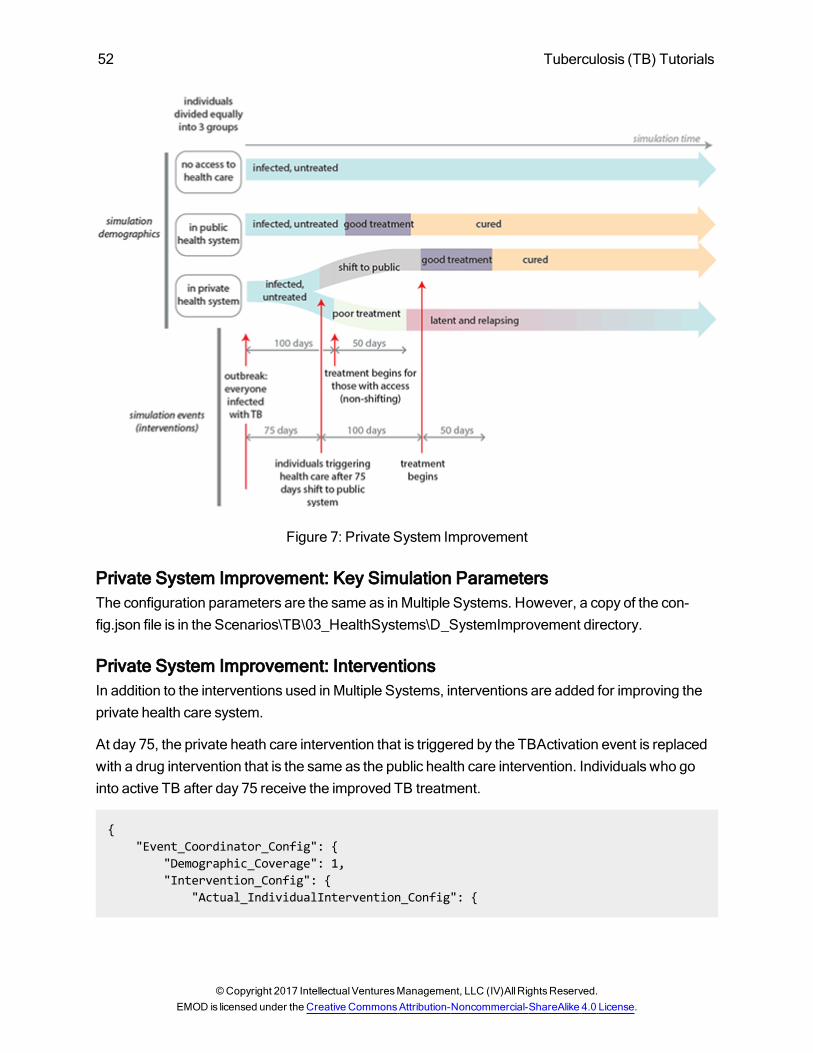
Figure 7: Private System Improvement
Private System Improvement: Key Simulation ParametersThe configuration parameters are the same as inMultiple Systems. However, a copy of the con-fig.json file is in the Scenarios\TB\03_HealthSystems\D_SystemImprovement directory.
Private System Improvement: InterventionsIn addition to the interventions used inMultiple Systems, interventions are added for improving theprivate health care system.
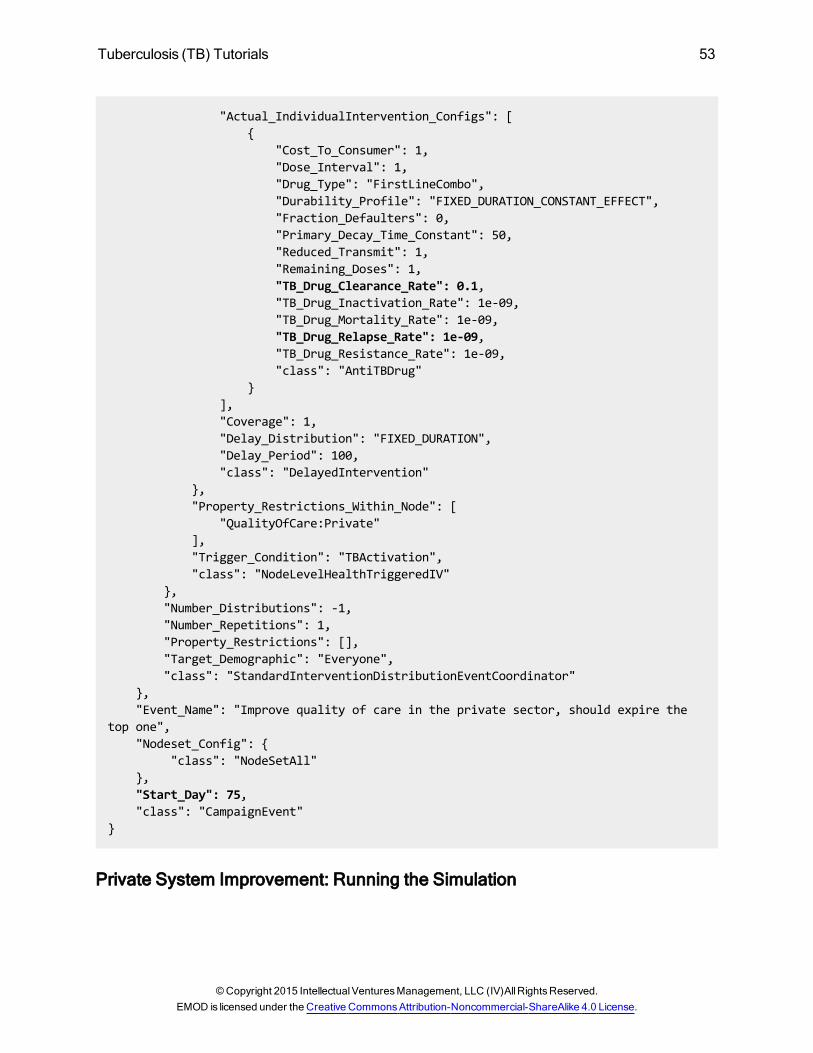
At day 75, the private heath care intervention that is triggered by the TBActivation event is replacedwith a drug intervention that is the same as the public health care intervention. Individuals who gointo active TB after day 75 receive the improved TB treatment.
{"Event_Coordinator_Config": {
"Demographic_Coverage": 1,"Intervention_Config": {
"Actual_IndividualIntervention_Config": {
©Copyright 2017 IntellectualVenturesManagement, LLC (IV)AllRightsReserved.EMOD is licensed under the Creative CommonsAttribution-Noncommercial-ShareAlike 4.0 License.
Tuberculosis (TB) Tutorials 53
"Actual_IndividualIntervention_Configs": [{
"Cost_To_Consumer": 1,"Dose_Interval": 1,"Drug_Type": "FirstLineCombo","Durability_Profile": "FIXED_DURATION_CONSTANT_EFFECT","Fraction_Defaulters": 0,"Primary_Decay_Time_Constant": 50,"Reduced_Transmit": 1,"Remaining_Doses": 1,"TB_Drug_Clearance_Rate": 0.1,"TB_Drug_Inactivation_Rate": 1e-09,"TB_Drug_Mortality_Rate": 1e-09,"TB_Drug_Relapse_Rate": 1e-09,"TB_Drug_Resistance_Rate": 1e-09,"class": "AntiTBDrug"
}],"Coverage": 1,"Delay_Distribution": "FIXED_DURATION","Delay_Period": 100,"class": "DelayedIntervention"
},"Property_Restrictions_Within_Node": [
"QualityOfCare:Private"],"Trigger_Condition": "TBActivation","class": "NodeLevelHealthTriggeredIV"
},"Number_Distributions": -1,"Number_Repetitions": 1,"Property_Restrictions": [],"Target_Demographic": "Everyone","class": "StandardInterventionDistributionEventCoordinator"
},"Event_Name": "Improve quality of care in the private sector, should expire the
top one","Nodeset_Config": {
"class": "NodeSetAll"},"Start_Day": 75,"class": "CampaignEvent"
}
Private System Improvement: Running the Simulation
©Copyright 2015 IntellectualVenturesManagement, LLC (IV)AllRightsReserved.EMOD is licensed under the Creative CommonsAttribution-Noncommercial-ShareAlike 4.0 License.
54 Tuberculosis (TB) Tutorials
At your discretion, you can use the sample batch file, runEMOD, in the Scenarios\TB\03_HealthSys-tems\D_SystemImprovement directory to run the simulation.
Private System Improvement: Expected Simulation Output
Generating Simulation GraphsAt your discretion, you can use the sample batch file, plotResults, in the Scenarios\TB\03_HealthSystems\D_SystemImprovement directory to generate graphs.
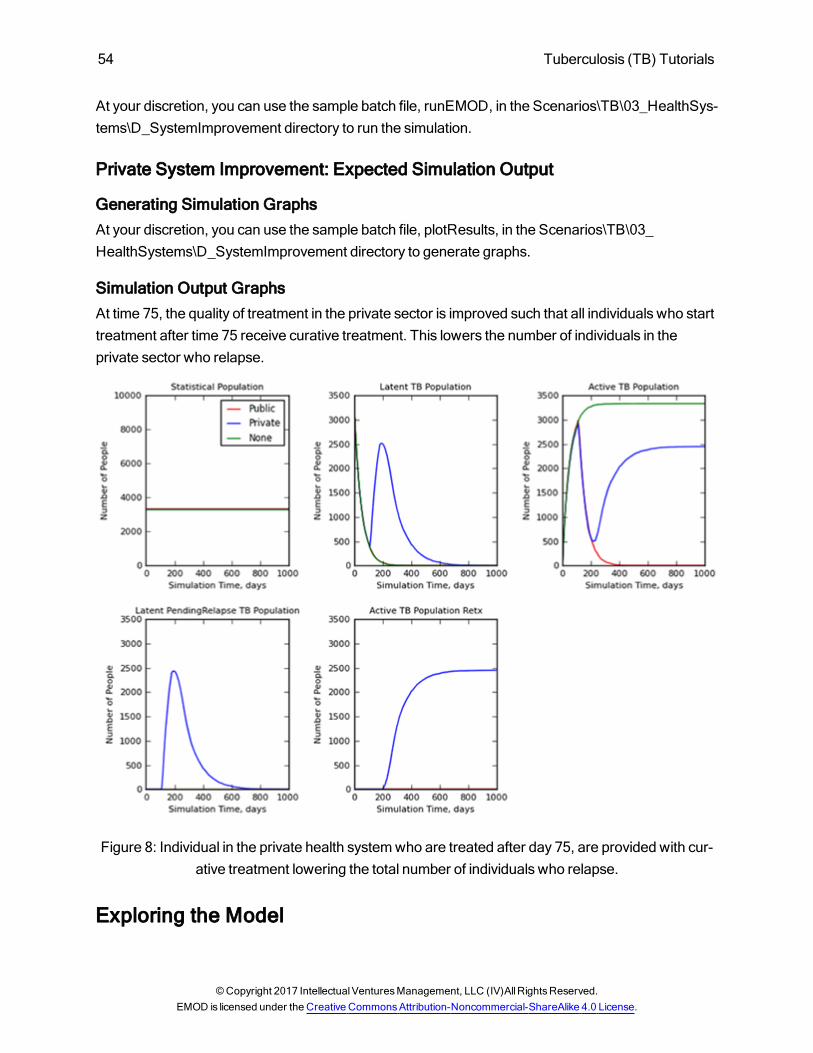
Simulation Output GraphsAt time 75, the quality of treatment in the private sector is improved such that all individuals who starttreatment after time 75 receive curative treatment. This lowers the number of individuals in theprivate sector who relapse.
Figure 8: Individual in the private health systemwho are treated after day 75, are provided with cur-ative treatment lowering the total number of individuals who relapse.
Exploring the Model
©Copyright 2017 IntellectualVenturesManagement, LLC (IV)AllRightsReserved.EMOD is licensed under the Creative CommonsAttribution-Noncommercial-ShareAlike 4.0 License.
Tuberculosis (TB) Tutorials 55
Simultaneously increase the quality of care in the private sector and shift individuals from no care tothe private health system.
Please continue with the next scenario, TB 4: Cascade of Care which demonstrates the effect of thecascade of care on the disease outcome of individuals who received treatment for TB.
Related Topics:
Tuberculosis (TB) Overview
Tuberculosis (TB) Tutorials
Parameter Reference
©Copyright 2015 IntellectualVenturesManagement, LLC (IV)AllRightsReserved.EMOD is licensed under the Creative CommonsAttribution-Noncommercial-ShareAlike 4.0 License.
56 Tuberculosis (TB) Tutorials
TB 4: Cascade of CareTheCascade of Care tutorial assumes that you have read TB 3: Health Care Systems.
This tutorial demonstrates how the cascade of care can be represented in EMOD, using a series ofdependent interventions. It illustrates the use of model “events”, which occur at the time of a statetransition, and are used to link dependent interventions together into a care cascade. Examples ofevents include when an individual progresses from one disease state to another (NewInfectionEventwhen an individual goes from susceptible to latent) or specific steps in the care cascade (Pro-viderOrdersTBTest when an individual visits a health care provider). The use of events also enablesa simple computational interface for dynamically changing the cascade of care during the course ofthe simulation. Detailed reporting within the cascade of care can add insight into why patients ulti-mately do or do not receive curative treatment.
There are two scenarios in this tutorial:
Passive Case Finding: Symptomatic individualsmust present themselves to health care pro-viders, who subsequently order a TB test. Individualsmust return to get their test results beforethey can receive treatment.
Active Case Finding (ACF): After the cohort progresses through passive case finding, indi-viduals who are treatment experienced and initial defaulters are brought back to the clinic for asecond provider visit
Demographics InputsAt the beginning of the simulation, all individuals are 20 years old (7300 days). There are no birthsand deaths
"Nodes": [{
"IndividualAttributes": {"AgeDistribution1": 7300,"AgeDistribution2": 0,"AgeDistributionFlag": 0,
. . ."MortalityDistribution": {
. . ."ResultUnits": "annual deaths per 1000 individuals","ResultValues": [
[ 0 ],[ 0 ]
]
©Copyright 2017 IntellectualVenturesManagement, LLC (IV)AllRightsReserved.EMOD is licensed under the Creative CommonsAttribution-Noncommercial-ShareAlike 4.0 License.
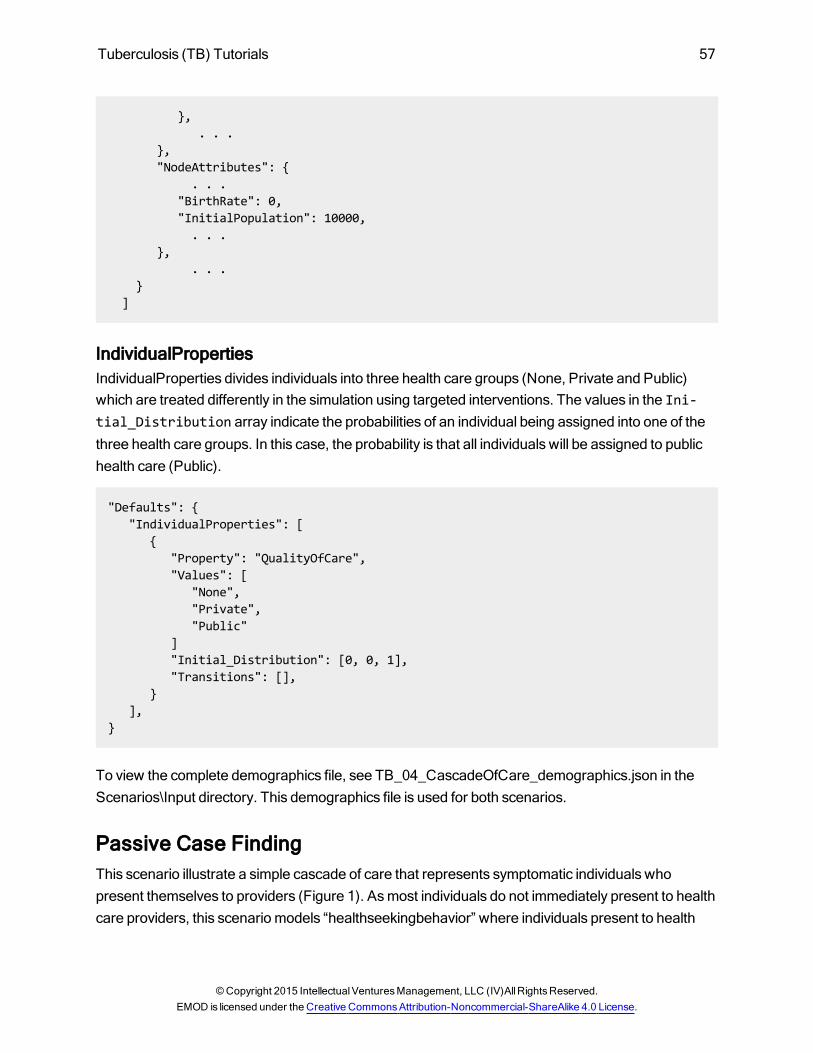
Tuberculosis (TB) Tutorials 57
},. . .
},"NodeAttributes": {
. . ."BirthRate": 0,"InitialPopulation": 10000,. . .
},. . .
}]
IndividualPropertiesIndividualProperties divides individuals into three health care groups (None, Private and Public)which are treated differently in the simulation using targeted interventions. The values in the Ini-tial_Distribution array indicate the probabilities of an individual being assigned into one of thethree health care groups. In this case, the probability is that all individuals will be assigned to publichealth care (Public).
"Defaults": { "IndividualProperties": [
{"Property": "QualityOfCare","Values": [
"None","Private","Public"
]"Initial_Distribution": [0, 0, 1],"Transitions": [],
}],
}
To view the complete demographics file, see TB_04_CascadeOfCare_demographics.json in theScenarios\Input directory. This demographics file is used for both scenarios.
Passive Case FindingThis scenario illustrate a simple cascade of care that represents symptomatic individuals whopresent themselves to providers (Figure 1). Asmost individuals do not immediately present to healthcare providers, this scenario models “healthseekingbehavior” where individuals present to health
©Copyright 2015 IntellectualVenturesManagement, LLC (IV)AllRightsReserved.EMOD is licensed under the Creative CommonsAttribution-Noncommercial-ShareAlike 4.0 License.
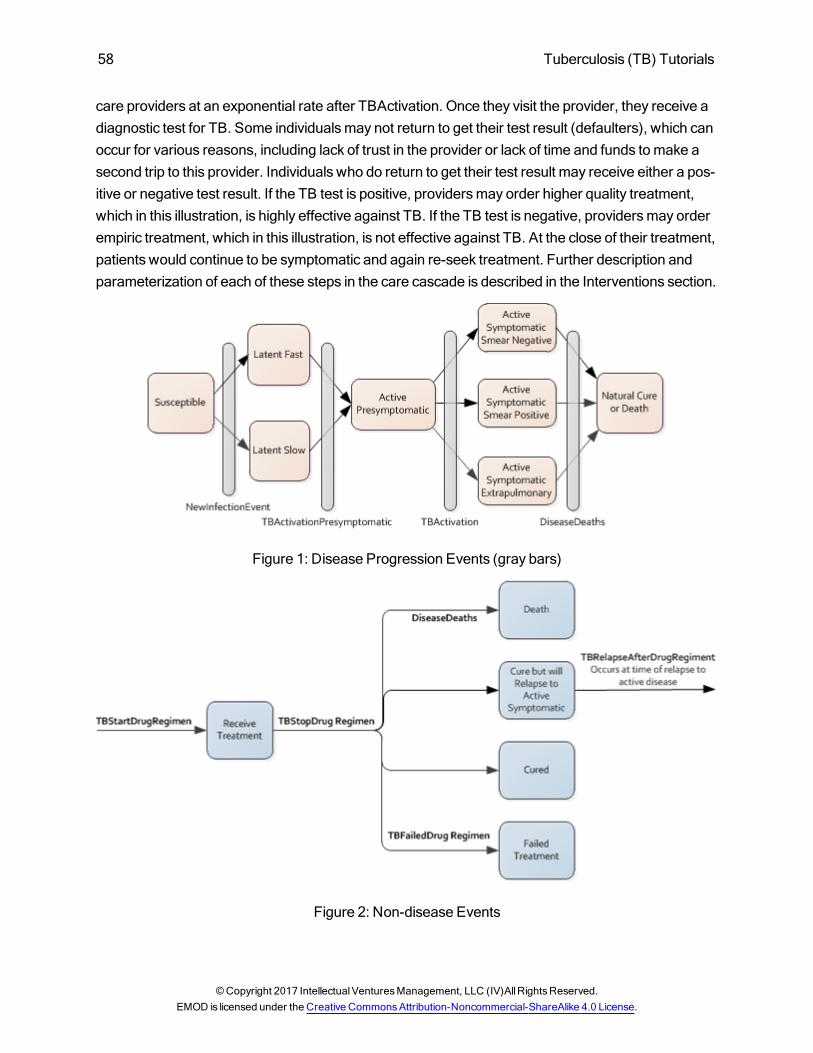
58 Tuberculosis (TB) Tutorials
care providers at an exponential rate after TBActivation. Once they visit the provider, they receive adiagnostic test for TB. Some individualsmay not return to get their test result (defaulters), which canoccur for various reasons, including lack of trust in the provider or lack of time and funds tomake asecond trip to this provider. Individuals who do return to get their test result may receive either a pos-itive or negative test result. If the TB test is positive, providersmay order higher quality treatment,which in this illustration, is highly effective against TB. If the TB test is negative, providersmay orderempiric treatment, which in this illustration, is not effective against TB. At the close of their treatment,patients would continue to be symptomatic and again re-seek treatment. Further description andparameterization of each of these steps in the care cascade is described in the Interventions section.
Figure 1: Disease Progression Events (gray bars)
Figure 2: Non-disease Events
©Copyright 2017 IntellectualVenturesManagement, LLC (IV)AllRightsReserved.EMOD is licensed under the Creative CommonsAttribution-Noncommercial-ShareAlike 4.0 License.
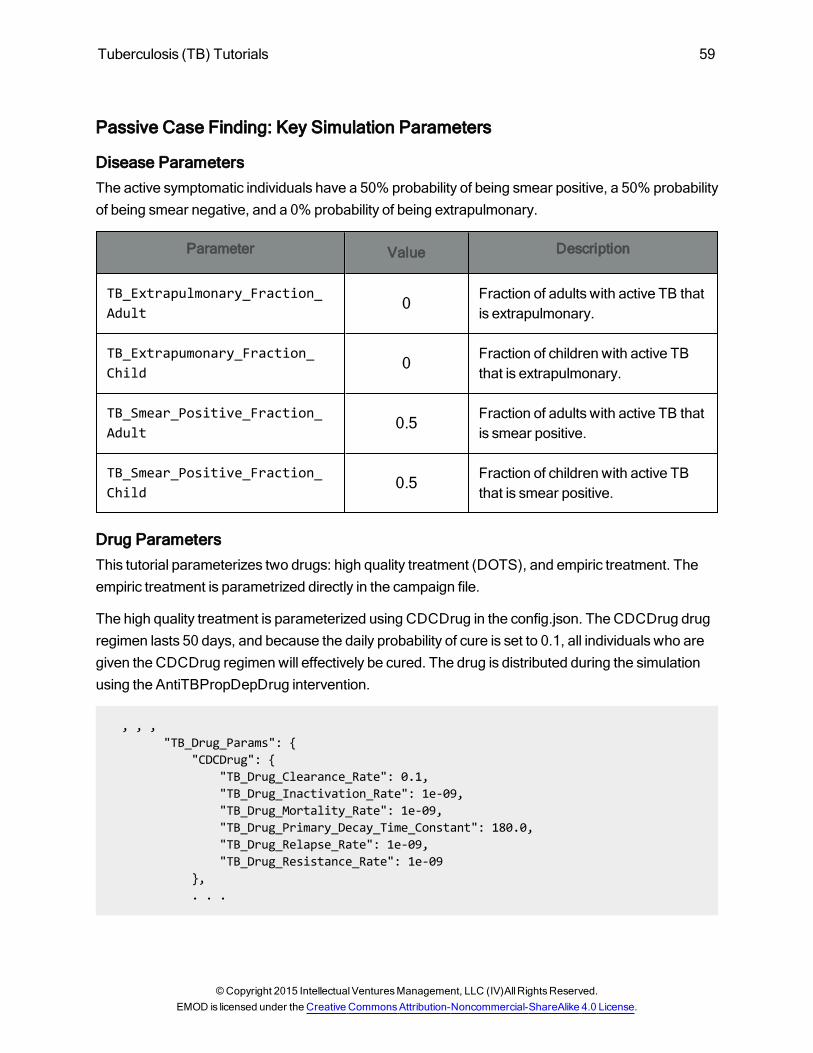
Tuberculosis (TB) Tutorials 59
Passive Case Finding: Key Simulation Parameters
Disease ParametersThe active symptomatic individuals have a 50% probability of being smear positive, a 50% probabilityof being smear negative, and a 0% probability of being extrapulmonary.
Parameter Value Description
TB_Extrapulmonary_Fraction_Adult 0
Fraction of adults with active TB thatis extrapulmonary.
TB_Extrapumonary_Fraction_Child 0
Fraction of children with active TBthat is extrapulmonary.
TB_Smear_Positive_Fraction_Adult 0.5
Fraction of adults with active TB thatis smear positive.
TB_Smear_Positive_Fraction_Child 0.5
Fraction of children with active TBthat is smear positive.
Drug ParametersThis tutorial parameterizes two drugs: high quality treatment (DOTS), and empiric treatment. Theempiric treatment is parametrized directly in the campaign file.
The high quality treatment is parameterized using CDCDrug in the config.json. The CDCDrug drugregimen lasts 50 days, and because the daily probability of cure is set to 0.1, all individuals who aregiven the CDCDrug regimenwill effectively be cured. The drug is distributed during the simulationusing the AntiTBPropDepDrug intervention.
, , ,"TB_Drug_Params": {
"CDCDrug": {"TB_Drug_Clearance_Rate": 0.1,"TB_Drug_Inactivation_Rate": 1e-09,"TB_Drug_Mortality_Rate": 1e-09,"TB_Drug_Primary_Decay_Time_Constant": 180.0,"TB_Drug_Relapse_Rate": 1e-09,"TB_Drug_Resistance_Rate": 1e-09
},. . .
©Copyright 2015 IntellectualVenturesManagement, LLC (IV)AllRightsReserved.EMOD is licensed under the Creative CommonsAttribution-Noncommercial-ShareAlike 4.0 License.
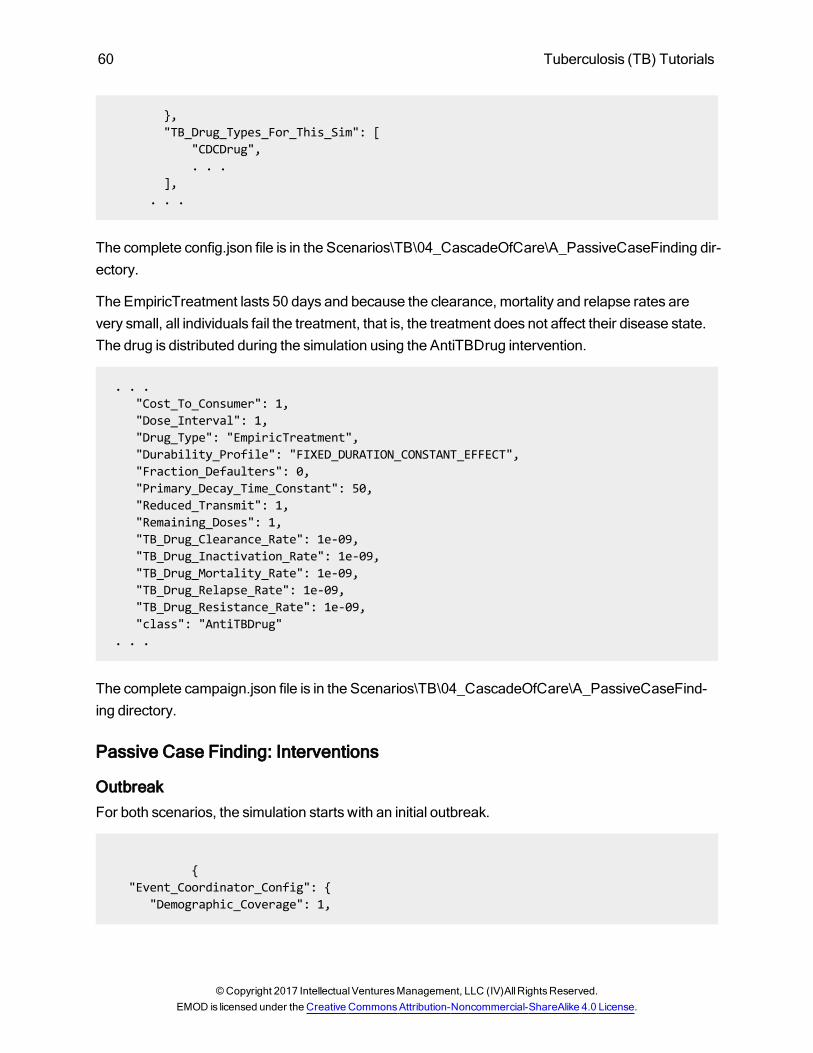
60 Tuberculosis (TB) Tutorials
},"TB_Drug_Types_For_This_Sim": [
"CDCDrug",. . .
],. . .
The complete config.json file is in the Scenarios\TB\04_CascadeOfCare\A_PassiveCaseFinding dir-ectory.
The EmpiricTreatment lasts 50 days and because the clearance, mortality and relapse rates arevery small, all individuals fail the treatment, that is, the treatment does not affect their disease state.The drug is distributed during the simulation using the AntiTBDrug intervention.
. . ."Cost_To_Consumer": 1,"Dose_Interval": 1,"Drug_Type": "EmpiricTreatment","Durability_Profile": "FIXED_DURATION_CONSTANT_EFFECT","Fraction_Defaulters": 0,"Primary_Decay_Time_Constant": 50,"Reduced_Transmit": 1,"Remaining_Doses": 1,"TB_Drug_Clearance_Rate": 1e-09,"TB_Drug_Inactivation_Rate": 1e-09,"TB_Drug_Mortality_Rate": 1e-09,"TB_Drug_Relapse_Rate": 1e-09,"TB_Drug_Resistance_Rate": 1e-09,"class": "AntiTBDrug"
. . .
The complete campaign.json file is in the Scenarios\TB\04_CascadeOfCare\A_PassiveCaseFind-ing directory.
Passive Case Finding: Interventions
OutbreakFor both scenarios, the simulation starts with an initial outbreak.
{"Event_Coordinator_Config": {
"Demographic_Coverage": 1,
©Copyright 2017 IntellectualVenturesManagement, LLC (IV)AllRightsReserved.EMOD is licensed under the Creative CommonsAttribution-Noncommercial-ShareAlike 4.0 License.
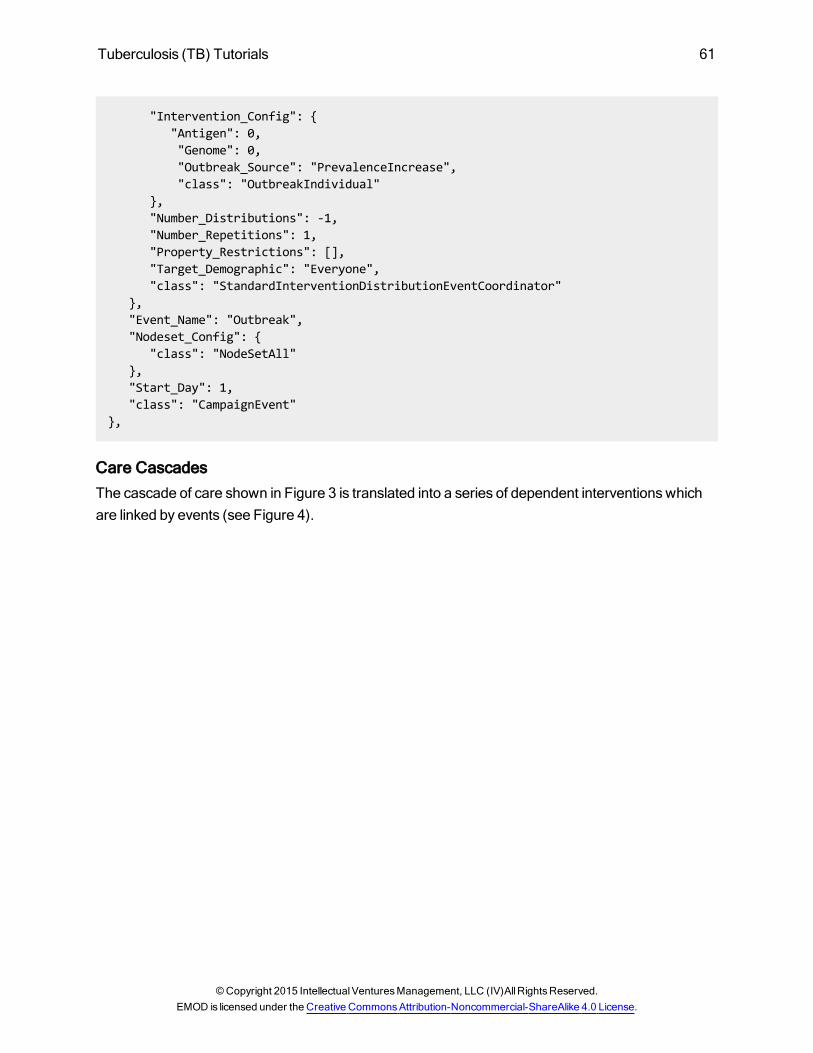
Tuberculosis (TB) Tutorials 61
"Intervention_Config": {"Antigen": 0,"Genome": 0,"Outbreak_Source": "PrevalenceIncrease","class": "OutbreakIndividual"
},"Number_Distributions": -1,"Number_Repetitions": 1,"Property_Restrictions": [],"Target_Demographic": "Everyone","class": "StandardInterventionDistributionEventCoordinator"
},"Event_Name": "Outbreak","Nodeset_Config": {
"class": "NodeSetAll"},"Start_Day": 1,"class": "CampaignEvent"
},
Care CascadesThe cascade of care shown in Figure 3 is translated into a series of dependent interventionswhichare linked by events (see Figure 4).
©Copyright 2015 IntellectualVenturesManagement, LLC (IV)AllRightsReserved.EMOD is licensed under the Creative CommonsAttribution-Noncommercial-ShareAlike 4.0 License.
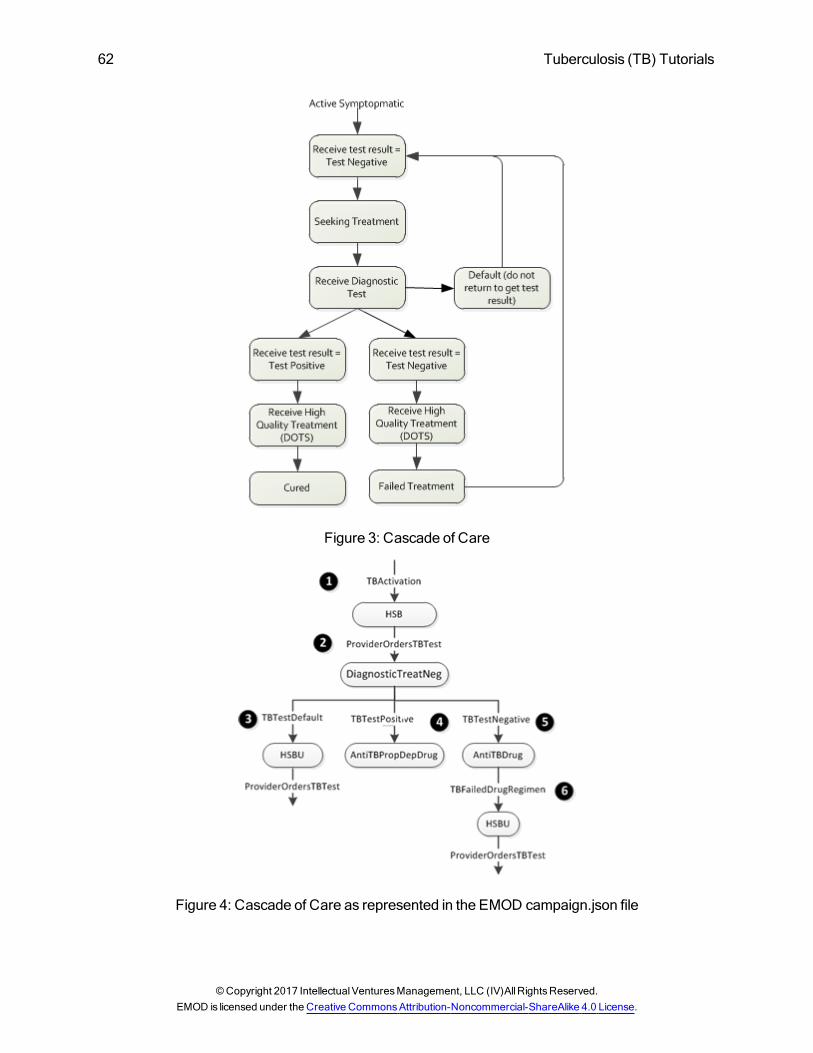
62 Tuberculosis (TB) Tutorials
Figure 3: Cascade of Care
Figure 4: Cascade of Care as represented in the EMOD campaign.json file
©Copyright 2017 IntellectualVenturesManagement, LLC (IV)AllRightsReserved.EMOD is licensed under the Creative CommonsAttribution-Noncommercial-ShareAlike 4.0 License.
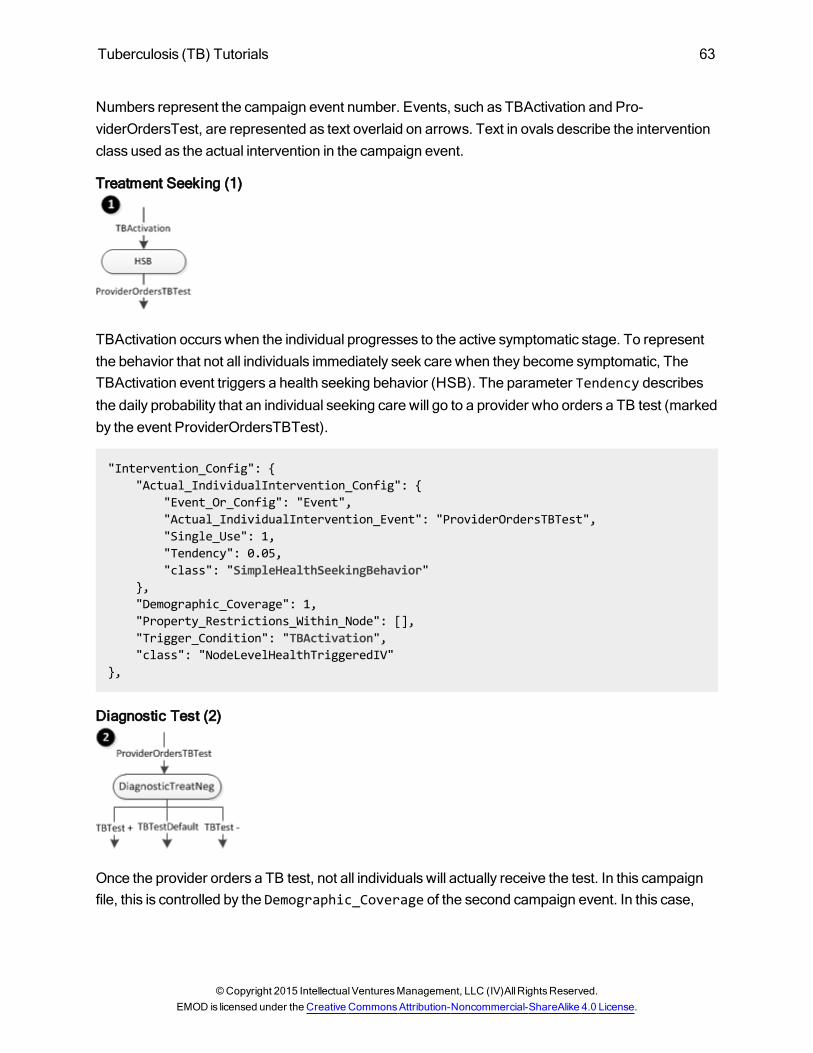
Tuberculosis (TB) Tutorials 63
Numbers represent the campaign event number. Events, such as TBActivation and Pro-viderOrdersTest, are represented as text overlaid on arrows. Text in ovals describe the interventionclass used as the actual intervention in the campaign event.
Treatment Seeking (1)
TBActivation occurs when the individual progresses to the active symptomatic stage. To representthe behavior that not all individuals immediately seek care when they become symptomatic, TheTBActivation event triggers a health seeking behavior (HSB). The parameter Tendency describesthe daily probability that an individual seeking care will go to a provider who orders a TB test (markedby the event ProviderOrdersTBTest).
"Intervention_Config": {"Actual_IndividualIntervention_Config": {
"Event_Or_Config": "Event","Actual_IndividualIntervention_Event": "ProviderOrdersTBTest","Single_Use": 1,"Tendency": 0.05,"class": "SimpleHealthSeekingBehavior"
},"Demographic_Coverage": 1,"Property_Restrictions_Within_Node": [],"Trigger_Condition": "TBActivation","class": "NodeLevelHealthTriggeredIV"
},
Diagnostic Test (2)
Once the provider orders a TB test, not all individuals will actually receive the test. In this campaignfile, this is controlled by the Demographic_Coverage of the second campaign event. In this case,
©Copyright 2015 IntellectualVenturesManagement, LLC (IV)AllRightsReserved.EMOD is licensed under the Creative CommonsAttribution-Noncommercial-ShareAlike 4.0 License.
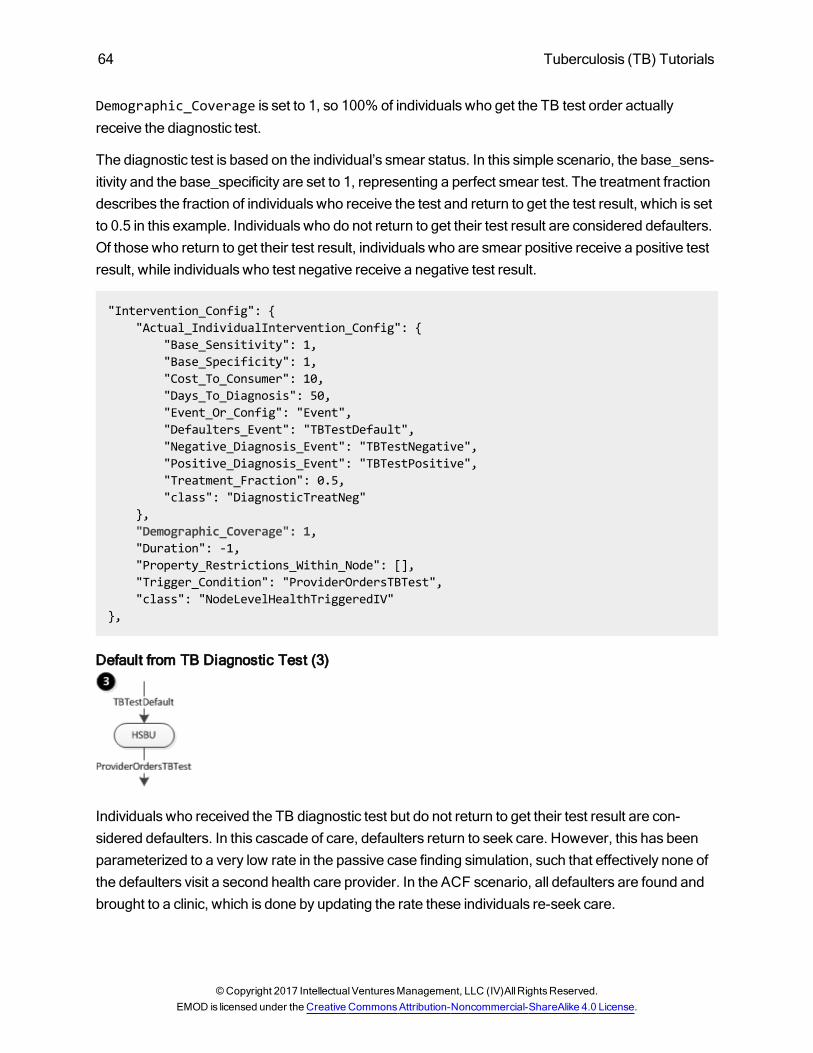
64 Tuberculosis (TB) Tutorials
Demographic_Coverage is set to 1, so 100% of individuals who get the TB test order actuallyreceive the diagnostic test.
The diagnostic test is based on the individual’s smear status. In this simple scenario, the base_sens-itivity and the base_specificity are set to 1, representing a perfect smear test. The treatment fractiondescribes the fraction of individuals who receive the test and return to get the test result, which is setto 0.5 in this example. Individuals who do not return to get their test result are considered defaulters.Of those who return to get their test result, individuals who are smear positive receive a positive testresult, while individuals who test negative receive a negative test result.
"Intervention_Config": {"Actual_IndividualIntervention_Config": {
"Base_Sensitivity": 1,"Base_Specificity": 1,"Cost_To_Consumer": 10,"Days_To_Diagnosis": 50,"Event_Or_Config": "Event","Defaulters_Event": "TBTestDefault","Negative_Diagnosis_Event": "TBTestNegative","Positive_Diagnosis_Event": "TBTestPositive","Treatment_Fraction": 0.5,"class": "DiagnosticTreatNeg"
},"Demographic_Coverage": 1,"Duration": -1,"Property_Restrictions_Within_Node": [],"Trigger_Condition": "ProviderOrdersTBTest","class": "NodeLevelHealthTriggeredIV"
},
Default from TB Diagnostic Test (3)
Individuals who received the TB diagnostic test but do not return to get their test result are con-sidered defaulters. In this cascade of care, defaulters return to seek care. However, this has beenparameterized to a very low rate in the passive case finding simulation, such that effectively none ofthe defaulters visit a second health care provider. In the ACF scenario, all defaulters are found andbrought to a clinic, which is done by updating the rate these individuals re-seek care.
©Copyright 2017 IntellectualVenturesManagement, LLC (IV)AllRightsReserved.EMOD is licensed under the Creative CommonsAttribution-Noncommercial-ShareAlike 4.0 License.
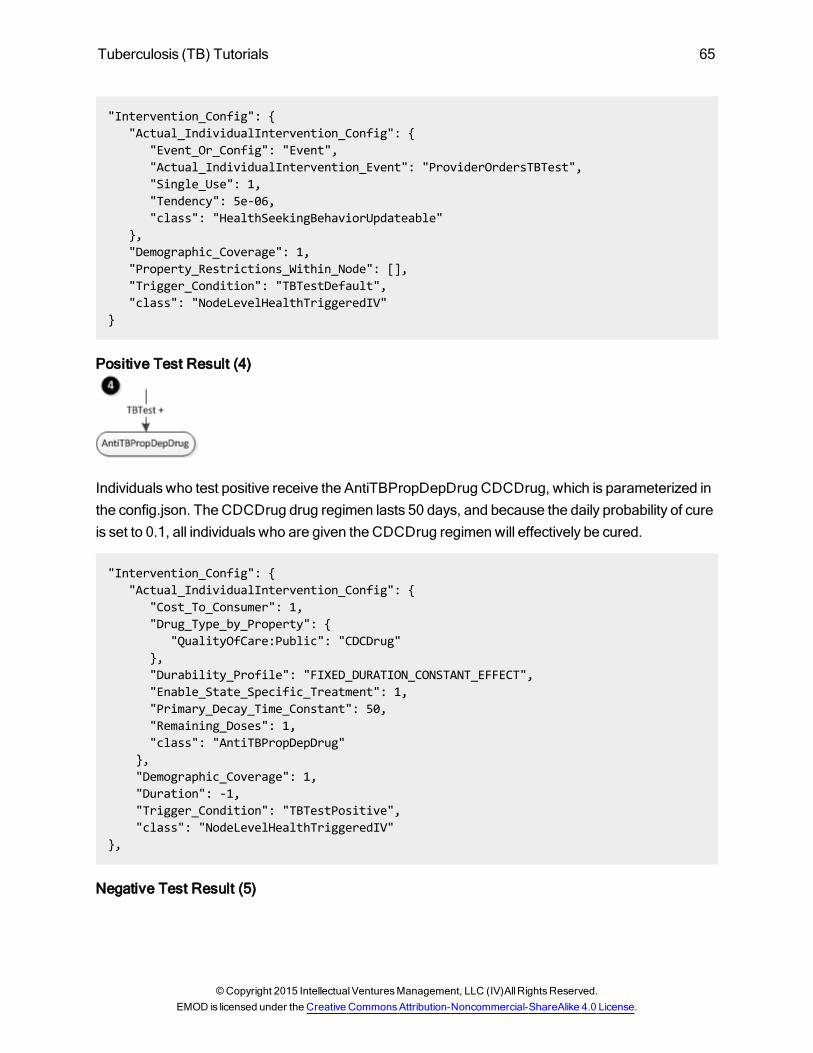
Tuberculosis (TB) Tutorials 65
"Intervention_Config": {"Actual_IndividualIntervention_Config": {
"Event_Or_Config": "Event","Actual_IndividualIntervention_Event": "ProviderOrdersTBTest","Single_Use": 1,"Tendency": 5e-06,"class": "HealthSeekingBehaviorUpdateable"
},"Demographic_Coverage": 1,"Property_Restrictions_Within_Node": [],"Trigger_Condition": "TBTestDefault","class": "NodeLevelHealthTriggeredIV"
}
Positive Test Result (4)
Individuals who test positive receive the AntiTBPropDepDrug CDCDrug, which is parameterized inthe config.json. The CDCDrug drug regimen lasts 50 days, and because the daily probability of cureis set to 0.1, all individuals who are given the CDCDrug regimenwill effectively be cured.
"Intervention_Config": {"Actual_IndividualIntervention_Config": {
"Cost_To_Consumer": 1,"Drug_Type_by_Property": {
"QualityOfCare:Public": "CDCDrug"},"Durability_Profile": "FIXED_DURATION_CONSTANT_EFFECT","Enable_State_Specific_Treatment": 1,"Primary_Decay_Time_Constant": 50,"Remaining_Doses": 1,"class": "AntiTBPropDepDrug"
},"Demographic_Coverage": 1,"Duration": -1,"Trigger_Condition": "TBTestPositive","class": "NodeLevelHealthTriggeredIV"
},
Negative Test Result (5)
©Copyright 2015 IntellectualVenturesManagement, LLC (IV)AllRightsReserved.EMOD is licensed under the Creative CommonsAttribution-Noncommercial-ShareAlike 4.0 License.
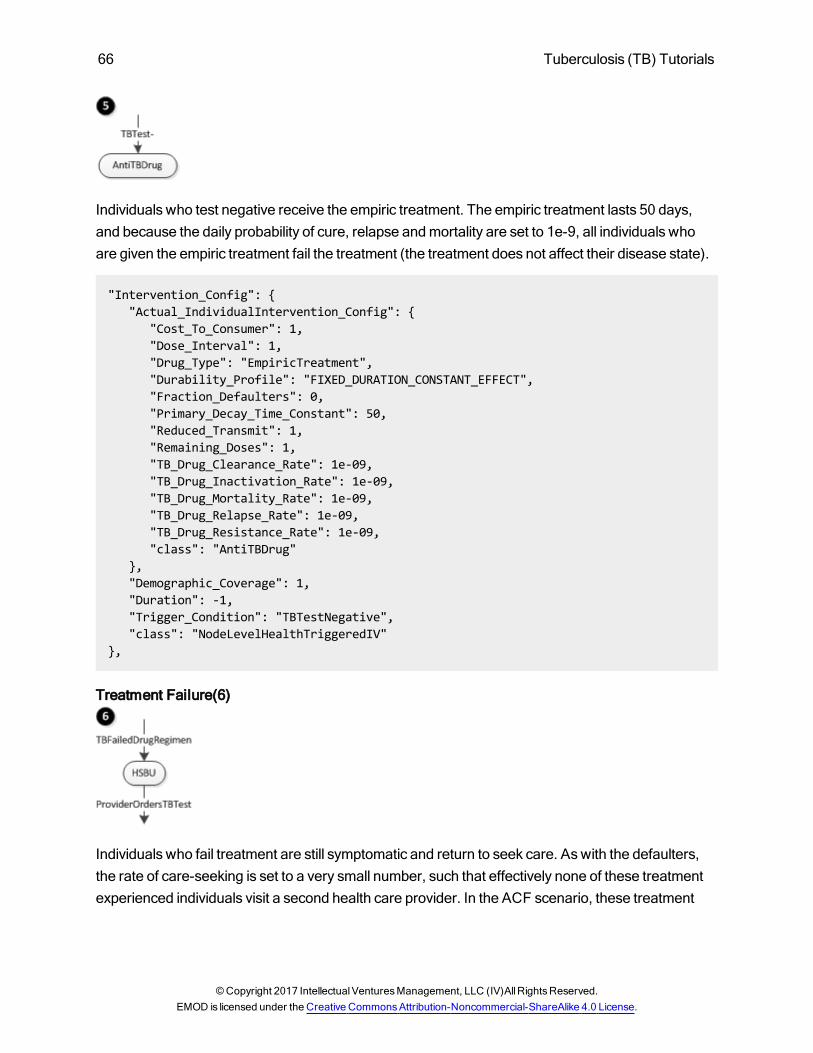
66 Tuberculosis (TB) Tutorials
Individuals who test negative receive the empiric treatment. The empiric treatment lasts 50 days,and because the daily probability of cure, relapse andmortality are set to 1e-9, all individuals whoare given the empiric treatment fail the treatment (the treatment does not affect their disease state).
"Intervention_Config": {"Actual_IndividualIntervention_Config": {
"Cost_To_Consumer": 1,"Dose_Interval": 1,"Drug_Type": "EmpiricTreatment","Durability_Profile": "FIXED_DURATION_CONSTANT_EFFECT","Fraction_Defaulters": 0,"Primary_Decay_Time_Constant": 50,"Reduced_Transmit": 1,"Remaining_Doses": 1,"TB_Drug_Clearance_Rate": 1e-09,"TB_Drug_Inactivation_Rate": 1e-09,"TB_Drug_Mortality_Rate": 1e-09,"TB_Drug_Relapse_Rate": 1e-09,"TB_Drug_Resistance_Rate": 1e-09,"class": "AntiTBDrug"
},"Demographic_Coverage": 1,"Duration": -1,"Trigger_Condition": "TBTestNegative","class": "NodeLevelHealthTriggeredIV"
},
Treatment Failure(6)
Individuals who fail treatment are still symptomatic and return to seek care. Aswith the defaulters,the rate of care-seeking is set to a very small number, such that effectively none of these treatmentexperienced individuals visit a second health care provider. In the ACF scenario, these treatment
©Copyright 2017 IntellectualVenturesManagement, LLC (IV)AllRightsReserved.EMOD is licensed under the Creative CommonsAttribution-Noncommercial-ShareAlike 4.0 License.
Tuberculosis (TB) Tutorials 67
experienced individuals are found and brought to the clinic, which is done by updating the rate theseindividuals re-seek care.
"Intervention_Config": {"Actual_IndividualIntervention_Config": {
"Actual_IndividualIntervention_Event": "ProviderOrdersTBTest","Event_Or_Config": "Event","Single_Use": 1,"Tendency": 5e-06,"class": "HealthSeekingBehaviorUpdateable"
},"Demographic_Coverage": 1,"Property_Restrictions_Within_Node": [],"Trigger_Condition": "TBFailedDrugRegimen","class": "NodeLevelHealthTriggeredIV"
},
You can view the campaign.json file is in the Scenarios\TB\04_CascadeOfCare\A_PassiveCaseFinding directory.
Passive Case Finding: Running the SimulationAt your discretion, you can use the sample batch file runEMOD, in the Scenarios\TB\04_Cas-cadeOfCare\A_PassiveCaseFinding directory to run the simulation.
Passive Case Finding: Expected Simulation Output
Generating Simulation GraphsYou can use the sample file, plotResults, in the Scenarios\TB\04_CascadeOfCare\A_PassiveCaseFinding directory to generate graphs.
Simulation Output GraphsIn this simple example, 50% of the active symptomatic cohort are smear positive and 50% are smearnegative. After the first provider visit, 100% of the population is tested, but 50% of the cohort doesnot return to get their test result. The half of the smear positive individuals who did not default (25%of the total cohort) get cured while the smear negative individuals who did not default get empirictreatment, which leads to treatment failure.
NOTE: Because the EMODmodel is stochastic, your graphs may appear slightly different from thosegiven below.
©Copyright 2015 IntellectualVenturesManagement, LLC (IV)AllRightsReserved.EMOD is licensed under the Creative CommonsAttribution-Noncommercial-ShareAlike 4.0 License.
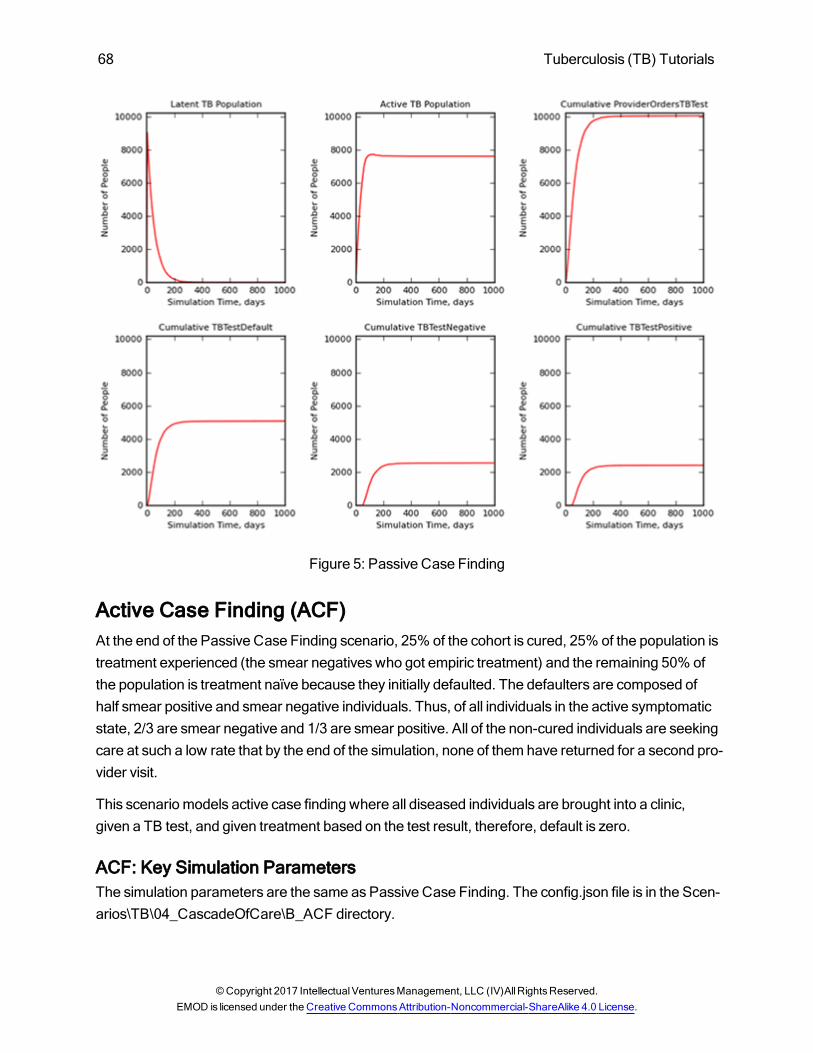
68 Tuberculosis (TB) Tutorials
Figure 5: Passive Case Finding
Active Case Finding (ACF)At the end of the Passive Case Finding scenario, 25% of the cohort is cured, 25% of the population istreatment experienced (the smear negativeswho got empiric treatment) and the remaining 50% ofthe population is treatment naïve because they initially defaulted. The defaulters are composed ofhalf smear positive and smear negative individuals. Thus, of all individuals in the active symptomaticstate, 2/3 are smear negative and 1/3 are smear positive. All of the non-cured individuals are seekingcare at such a low rate that by the end of the simulation, none of them have returned for a second pro-vider visit.
This scenario models active case finding where all diseased individuals are brought into a clinic,given a TB test, and given treatment based on the test result, therefore, default is zero.
ACF: Key Simulation ParametersThe simulation parameters are the same as Passive Case Finding. The config.json file is in the Scen-arios\TB\04_CascadeOfCare\B_ACF directory.
©Copyright 2017 IntellectualVenturesManagement, LLC (IV)AllRightsReserved.EMOD is licensed under the Creative CommonsAttribution-Noncommercial-ShareAlike 4.0 License.
Tuberculosis (TB) Tutorials 69
ACF: InterventionsThe simulation starts with a TB outbreak at TB Activation.
Add ACFAll individuals are brought into the clinic immediately at time 500. In this example, Tendency isupdated to 1 in the HSB of the treatment experienced and defaulters.
{"Event_Coordinator_Config": {
"Demographic_Coverage": 1,"Intervention_Config": {
"New_Tendency": 1,"class": "HealthSeekingBehaviorUpdate"
},"Property_Restrictions": [],"class": "StandardInterventionDistributionEventCoordinator"
},"Event_Name": "ACF","Nodeset_Config": {
"class": "NodeSetAll"},"Start_Day": 500,"class": "CampaignEvent"
},
To dynamically change the care cascade during the simulation, set a fixed duration to the originalintervention in the care cascade and introduce the new intervention at the desired time.
{"Event_Coordinator_Config": {
"Intervention_Config": {"Actual_IndividualIntervention_Config": {
"Base_Sensitivity": 1,"Base_Specificity": 1,"Cost_To_Consumer": 10,"Days_To_Diagnosis": 50,"Event_Or_Config": "Event","Defaulters_Event": "TBTestDefault","Negative_Diagnosis_Event": "TBTestNegative","Positive_Diagnosis_Event": "TBTestPositive","Treatment_Fraction": 0.5,"class": "DiagnosticTreatNeg"
},
©Copyright 2015 IntellectualVenturesManagement, LLC (IV)AllRightsReserved.EMOD is licensed under the Creative CommonsAttribution-Noncommercial-ShareAlike 4.0 License.
70 Tuberculosis (TB) Tutorials
"Duration": 500,"Property_Restrictions_Within_Node": [],"Trigger_Condition": "ProviderOrdersTBTest","class": "NodeLevelHealthTriggeredIV"
},"Property_Restrictions": [],"class": "StandardInterventionDistributionEventCoordinator"
},"Event_Name": "when a provider orders a test, the patient can default or get the
intervention appropriate to test result","Nodeset_Config": {
"class": "NodeSetAll"},"Start_Day": 1,"class": "CampaignEvent"
},
To reduce default at time 500, set the duration to 500 for the high default test and introduce the zerodefault test at time 500.
{"Event_Coordinator_Config": {
"Demographic_Coverage": 1,"Intervention_Config": {
"Actual_IndividualIntervention_Config": {"Base_Sensitivity": 1,"Base_Specificity": 1,"Cost_To_Consumer": 10,"Days_To_Diagnosis": 50,"Event_Or_Config": "Event","Defaulters_Event": "TBTestDefault","Negative_Diagnosis_Event": "TBTestNegative","Positive_Diagnosis_Event": "TBTestPositive","Treatment_Fraction": 1,"class": "DiagnosticTreatNeg"
},"Demographic_Coverage": 1,"Duration": -1,"Property_Restrictions_Within_Node": [],"Trigger_Condition": "ProviderOrdersTBTest","class": "NodeLevelHealthTriggeredIV"
},"Property_Restrictions": [],"class": "StandardInterventionDistributionEventCoordinator"
},"Event_Name": "new: when a provider orders a test, the patient gets mdr testing
©Copyright 2017 IntellectualVenturesManagement, LLC (IV)AllRightsReserved.EMOD is licensed under the Creative CommonsAttribution-Noncommercial-ShareAlike 4.0 License.
Tuberculosis (TB) Tutorials 71
and smear","Nodeset_Config": {
"class": "NodeSetAll"},"Start_Day": 500,"class": "CampaignEvent"
}
You can see all of the interventions in the campaign.json file is in the Scenarios\TB\04_Cas-cadeofCare\B_ACF directory.
ACF: Running the SimulationAt your discretion, you can use the sample batch file, runEmod, in the Scenarios\TB\04_Cas-cadeofCare\B_ACF directory to run the simulation.
ACF: Expected Simulation Output
Generating Simulation GraphsAt your discretion, you can use the sample batch file, plotResults, in the Scenarios\TB\04_Cas-cadeofCare\B_ACF directory to generate graphs from a simulation's InsetChart output file.
Simulation Output GraphsAfter the initial round of passive case finding, ACF is introduced to the cohort at time 500. The indi-viduals who remain in the active symptomatic state are 2/3 smear negative and 1/3 smear positive.All diseased individuals are brought into the clinic, given a TB test, and receive their results (default iszero). Smear negative individuals (2/3) receive a negative test, followed by empiric treatment, whilesmear positive individuals (1/3) receive a positive test and curative treatment.
©Copyright 2015 IntellectualVenturesManagement, LLC (IV)AllRightsReserved.EMOD is licensed under the Creative CommonsAttribution-Noncommercial-ShareAlike 4.0 License.
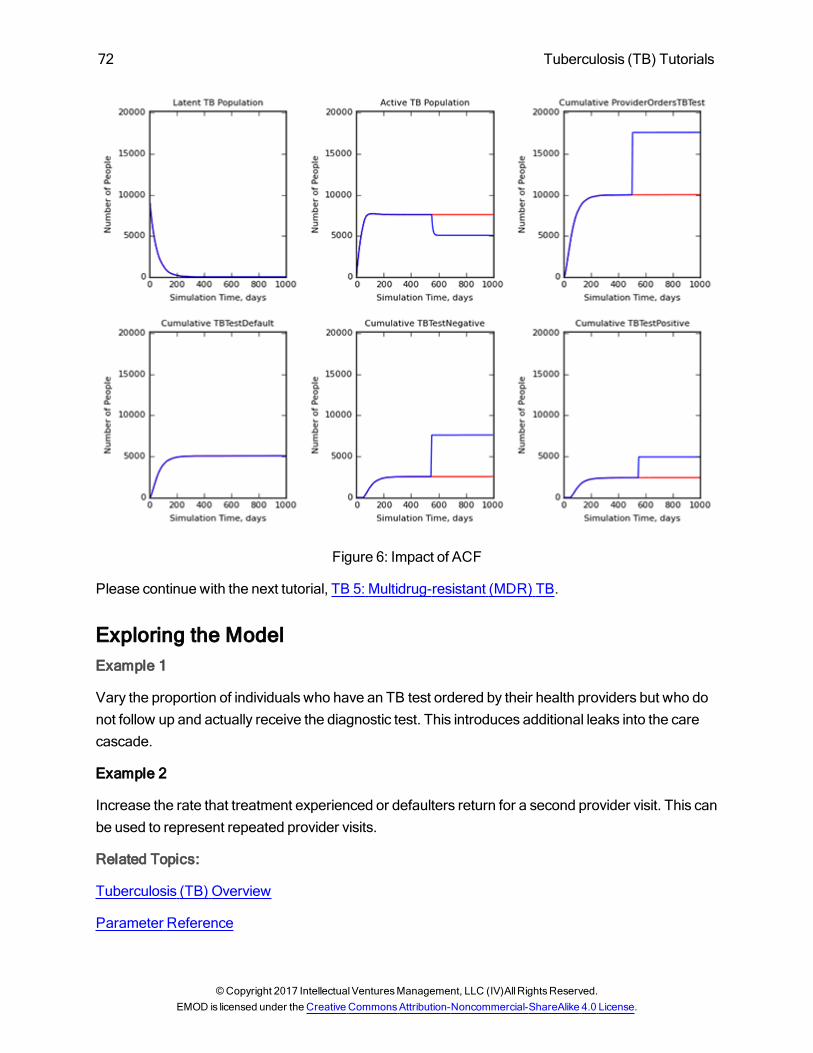
72 Tuberculosis (TB) Tutorials
Figure 6: Impact of ACF
Please continue with the next tutorial, TB 5: Multidrug-resistant (MDR) TB.
Exploring the ModelExample 1
Vary the proportion of individuals who have an TB test ordered by their health providers but who donot follow up and actually receive the diagnostic test. This introduces additional leaks into the carecascade.
Example 2
Increase the rate that treatment experienced or defaulters return for a second provider visit. This canbe used to represent repeated provider visits.
Related Topics:
Tuberculosis (TB) Overview
Parameter Reference
©Copyright 2017 IntellectualVenturesManagement, LLC (IV)AllRightsReserved.EMOD is licensed under the Creative CommonsAttribution-Noncommercial-ShareAlike 4.0 License.
Tuberculosis (TB) Tutorials 73
TB 5: Multidrug-Resistant (MDR) TBTheMultidrug-resistant TsB tutorial assumes that you have read TB 4: Cascade of Care.
Multidrug-resistant TB (MDR-TB) is disease involving a strain of M. tuberculosis that is resistant to atleast two of the four drugs in the standard first-line regimen, isoniazid (INH) and rifampicin (RIF).While such strains are believed to occur naturally during infection at low frequencies, the use of fourdrugs in the standard first-line regimen, each with a different mode of action, typically ensures thatsuch strains do not replicate to high frequencies in an infected individual.
Drug resistance arises through inappropriate treatment which undermines the efficacy of first-linetreatment. When this occurs, M. tuberculosis strains resistant to one or more drugsmay replicate tohigh frequencies and become the predominant strain in an infected individual. From an epi-demiological point of view, this presents two difficulties: Not only are individuals who have acquired adrug-resistant M. tuberculosis strain more difficult to treat, but theymay also transmit the drug-res-istant strain to others. Resistance to INH and RIF commonly co-occurs in the same individual,accounting for the inclusion of these drugs in the definition of MDR-TB.
The scenarios in this tutorial demonstrate various aspects of MDR-TB in TB model:
AcquiredMDR-TB: Individuals are originally infected with drug-sensitive straint but treatment isineffective and individuals acquireMDR-TB. In this scenario all individuals acquireMDR-TB sothere is no transmittedMDR-TB.
TransmittedMDR-TB: Individuals who acquireMDR-TB through ineffective treatment infectsusceptible individuals.
Ineffective Treatment: Inappropriate use of first-line regimen to treat MDR-TB.
Effective Treatment: Use of MDR-TB diagnostics and regimen to treat MDR-TB.
Demographics InputsThis tutorial utilizes a population of 10,000 individuals identical to the demographics used in TB 1:Basic Tuberculosis (TB) Model and TB 3: Health Care Systems. To view the complete demo-graphics file, see TB_05_MDR_demographics in the Scenarios\InputFiles directory.
Key MDR ParametersThe various TB drug-specific parameters in the campaign file (such as TB_Drug_Clearance_Rateand TB_Drug_Inactivation_Rate) follow a special nomenclature where the third word refers to achange of state in the individual’s infection (for example, from active TB to cleared TB or latent TB,
©Copyright 2015 IntellectualVenturesManagement, LLC (IV)AllRightsReserved.EMOD is licensed under the Creative CommonsAttribution-Noncommercial-ShareAlike 4.0 License.
74 Tuberculosis (TB) Tutorials
respectively), not to a change to the drug itself (for example, frommetabolically active drug to a drugcleared from the body). From active TB, several next states are possible: clearance (uninfected),inactivation (latent TB), mortality, and resistance (of the TB strain, still with active infection). Ratesare specified as a probability per time step.
Simulation Parameters
Parameter Values Description
Number_Basestrains 1
Number of base strains in the sim-ulation (seeGeneral Disease). ForTB, the closest analogue is the dif-ferent TB lineages, for example,East Asian, Euro-American. For afriendly introduction to TB lineages,see Lehrman 2013. Scientific Amer-ican 309:80.
Number_Substrains 2
Number of substrains in the sim-ulations (seeGeneral Disease).ForTB, The value is set to 2 for the pur-poses of simulating drug-sensitiveand drug-resistant strains.
TB_MDR_Fitness_Multiplier 0 to 1Relative infectiousness of MDRstrains
The complete list of simulation parameters is in the config.json file which is located in each of thetutorial directories at Scenarios\TB\05_MDR.
Intervention ParametersThese parameters are used in OutbreakIndividual.
©Copyright 2017 IntellectualVenturesManagement, LLC (IV)AllRightsReserved.EMOD is licensed under the Creative CommonsAttribution-Noncommercial-ShareAlike 4.0 License.
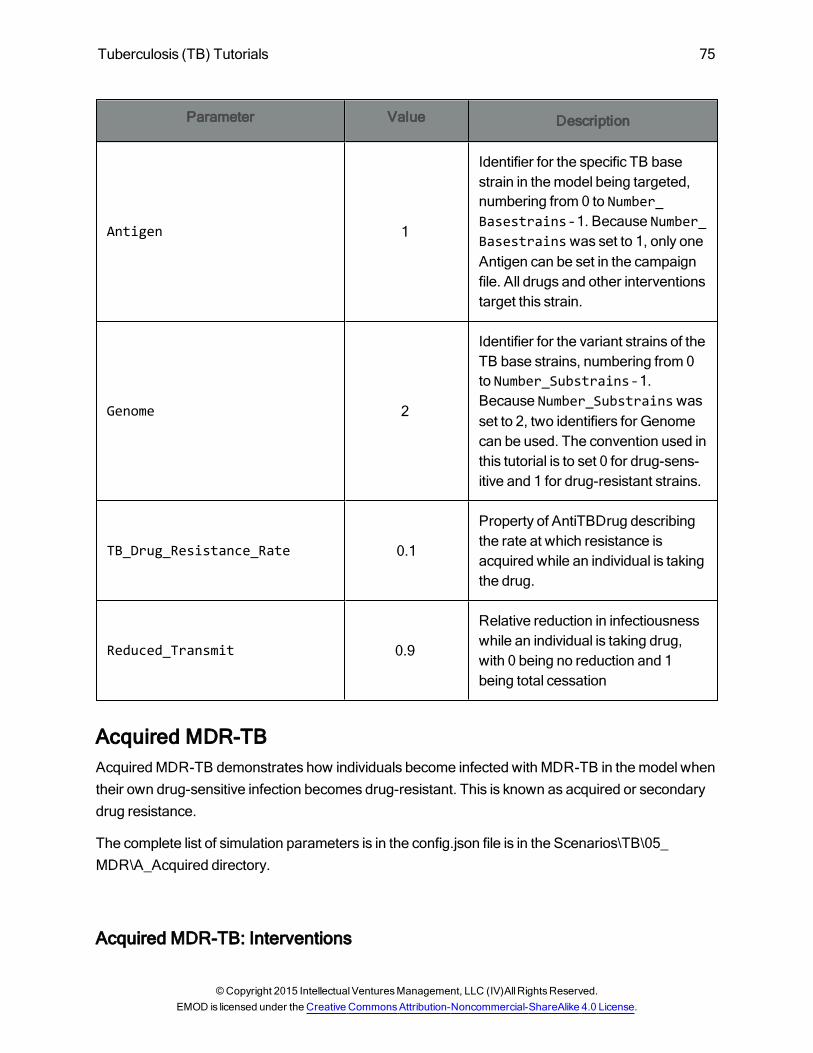
Tuberculosis (TB) Tutorials 75
Parameter Value Description
Antigen 1
Identifier for the specific TB basestrain in themodel being targeted,numbering from 0 to Number_Basestrains – 1. Because Number_Basestrainswas set to 1, only oneAntigen can be set in the campaignfile. All drugs and other interventionstarget this strain.
Genome 2
Identifier for the variant strains of theTB base strains, numbering from 0to Number_Substrains – 1.Because Number_Substrainswasset to 2, two identifiers for Genomecan be used. The convention used inthis tutorial is to set 0 for drug-sens-itive and 1 for drug-resistant strains.
TB_Drug_Resistance_Rate 0.1
Property of AntiTBDrug describingthe rate at which resistance isacquired while an individual is takingthe drug.
Reduced_Transmit 0.9
Relative reduction in infectiousnesswhile an individual is taking drug,with 0 being no reduction and 1being total cessation
Acquired MDR-TBAcquiredMDR-TB demonstrates how individuals become infected with MDR-TB in themodel whentheir own drug-sensitive infection becomes drug-resistant. This is known as acquired or secondarydrug resistance.
The complete list of simulation parameters is in the config.json file is in the Scenarios\TB\05_MDR\A_Acquired directory.
Acquired MDR-TB: Interventions
©Copyright 2015 IntellectualVenturesManagement, LLC (IV)AllRightsReserved.EMOD is licensed under the Creative CommonsAttribution-Noncommercial-ShareAlike 4.0 License.
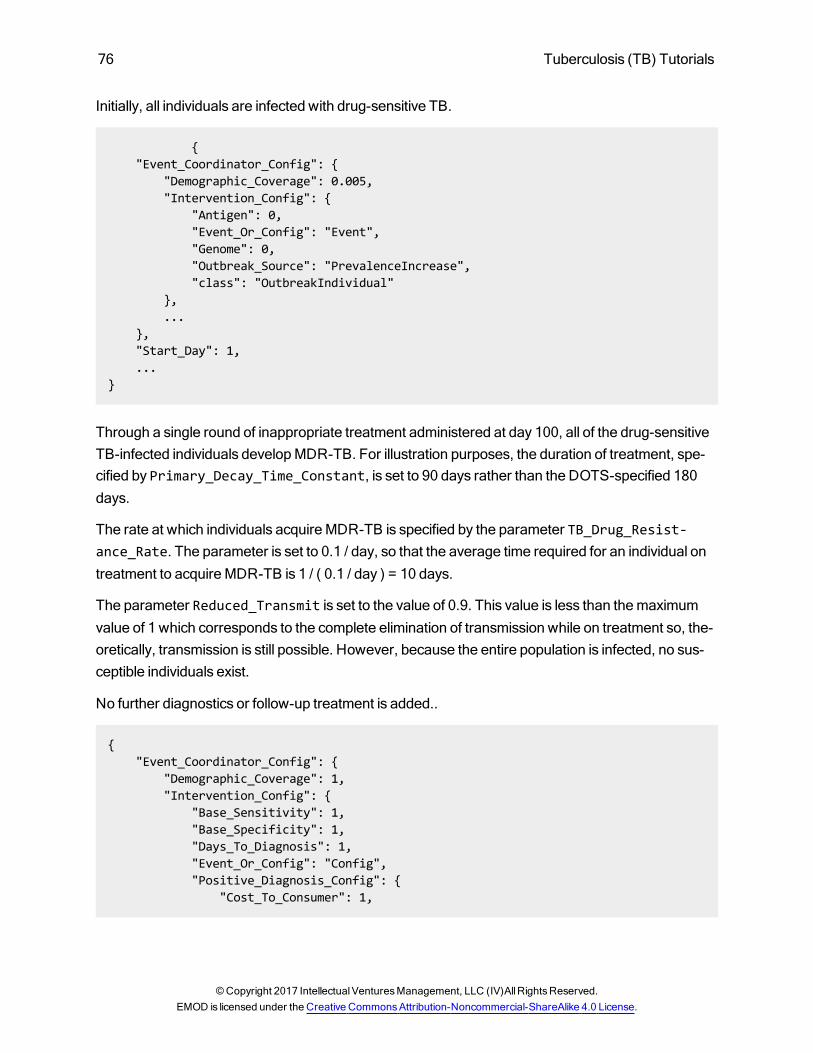
76 Tuberculosis (TB) Tutorials
Initially, all individuals are infected with drug-sensitive TB.
{"Event_Coordinator_Config": {
"Demographic_Coverage": 0.005,"Intervention_Config": {
"Antigen": 0,"Event_Or_Config": "Event","Genome": 0,"Outbreak_Source": "PrevalenceIncrease","class": "OutbreakIndividual"
},...
},"Start_Day": 1,...
}
Through a single round of inappropriate treatment administered at day 100, all of the drug-sensitiveTB-infected individuals developMDR-TB. For illustration purposes, the duration of treatment, spe-cified by Primary_Decay_Time_Constant, is set to 90 days rather than the DOTS-specified 180days.
The rate at which individuals acquireMDR-TB is specified by the parameter TB_Drug_Resist-ance_Rate. The parameter is set to 0.1 / day, so that the average time required for an individual ontreatment to acquireMDR-TB is 1 / ( 0.1 / day ) = 10 days.
The parameter Reduced_Transmit is set to the value of 0.9. This value is less than themaximumvalue of 1 which corresponds to the complete elimination of transmission while on treatment so, the-oretically, transmission is still possible. However, because the entire population is infected, no sus-ceptible individuals exist.
No further diagnostics or follow-up treatment is added..
{"Event_Coordinator_Config": {
"Demographic_Coverage": 1,"Intervention_Config": {
"Base_Sensitivity": 1,"Base_Specificity": 1,"Days_To_Diagnosis": 1,"Event_Or_Config": "Config","Positive_Diagnosis_Config": {
"Cost_To_Consumer": 1,
©Copyright 2017 IntellectualVenturesManagement, LLC (IV)AllRightsReserved.EMOD is licensed under the Creative CommonsAttribution-Noncommercial-ShareAlike 4.0 License.
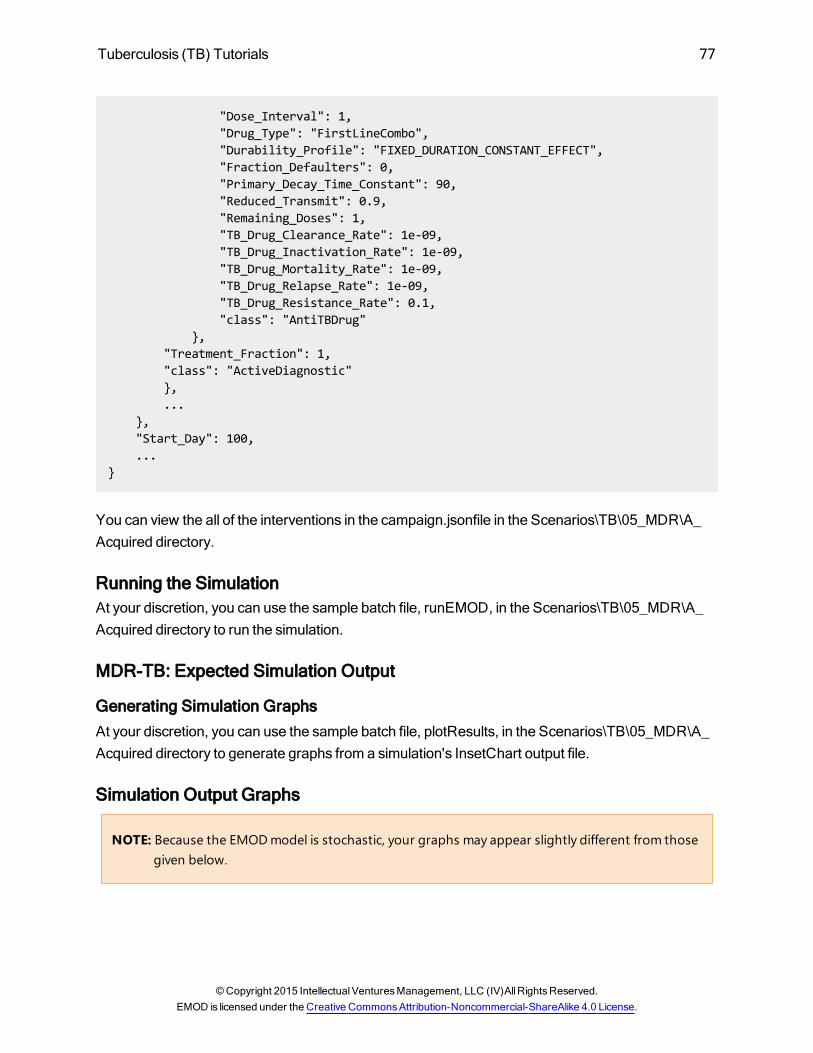
Tuberculosis (TB) Tutorials 77
"Dose_Interval": 1,"Drug_Type": "FirstLineCombo","Durability_Profile": "FIXED_DURATION_CONSTANT_EFFECT","Fraction_Defaulters": 0,"Primary_Decay_Time_Constant": 90,"Reduced_Transmit": 0.9,"Remaining_Doses": 1,"TB_Drug_Clearance_Rate": 1e-09,"TB_Drug_Inactivation_Rate": 1e-09,"TB_Drug_Mortality_Rate": 1e-09,"TB_Drug_Relapse_Rate": 1e-09,"TB_Drug_Resistance_Rate": 0.1,"class": "AntiTBDrug"
},"Treatment_Fraction": 1,"class": "ActiveDiagnostic"},...
},"Start_Day": 100,...
}
You can view the all of the interventions in the campaign.jsonfile in the Scenarios\TB\05_MDR\A_Acquired directory.
Running the SimulationAt your discretion, you can use the sample batch file, runEMOD, in the Scenarios\TB\05_MDR\A_Acquired directory to run the simulation.
MDR-TB: Expected Simulation Output
Generating Simulation GraphsAt your discretion, you can use the sample batch file, plotResults, in the Scenarios\TB\05_MDR\A_Acquired directory to generate graphs from a simulation's InsetChart output file.
Simulation Output Graphs
NOTE: Because the EMODmodel is stochastic, your graphs may appear slightly different from thosegiven below.
©Copyright 2015 IntellectualVenturesManagement, LLC (IV)AllRightsReserved.EMOD is licensed under the Creative CommonsAttribution-Noncommercial-ShareAlike 4.0 License.
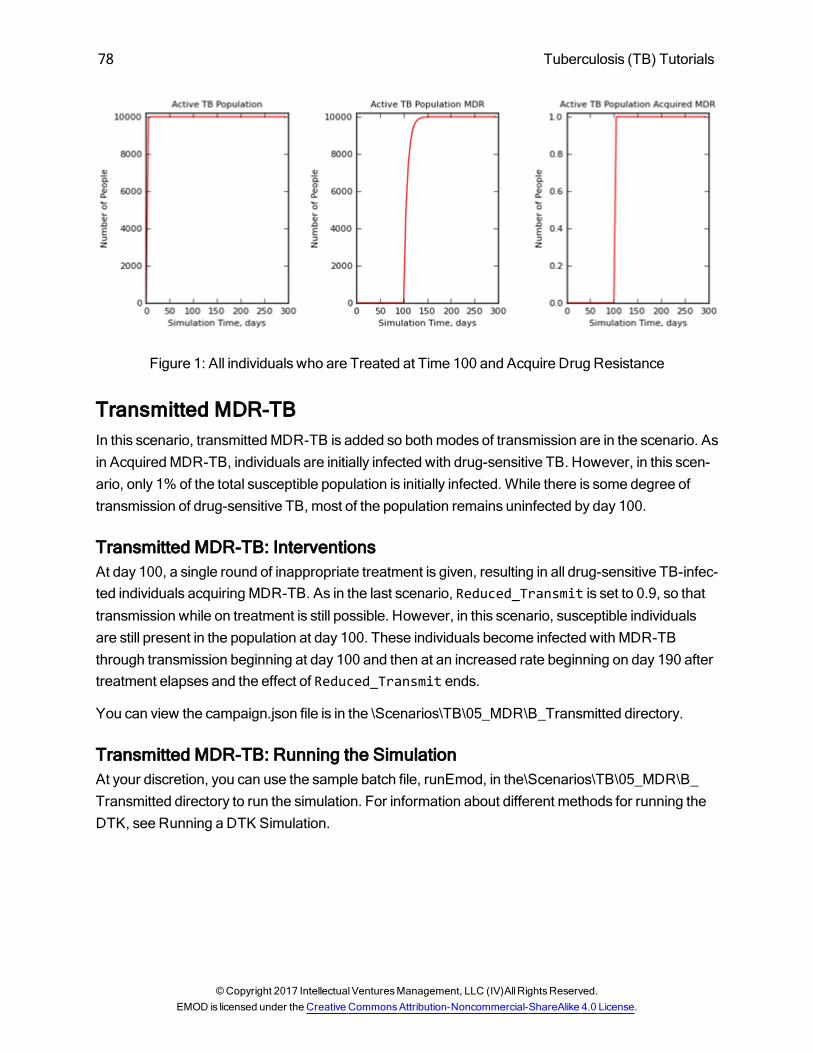
78 Tuberculosis (TB) Tutorials
Figure 1: All individuals who are Treated at Time 100 and Acquire Drug Resistance
Transmitted MDR-TBIn this scenario, transmittedMDR-TB is added so bothmodes of transmission are in the scenario. Asin AcquiredMDR-TB, individuals are initially infected with drug-sensitive TB. However, in this scen-ario, only 1% of the total susceptible population is initially infected.While there is some degree oftransmission of drug-sensitive TB, most of the population remains uninfected by day 100.
Transmitted MDR-TB: InterventionsAt day 100, a single round of inappropriate treatment is given, resulting in all drug-sensitive TB-infec-ted individuals acquiringMDR-TB. As in the last scenario, Reduced_Transmit is set to 0.9, so thattransmission while on treatment is still possible. However, in this scenario, susceptible individualsare still present in the population at day 100. These individuals become infected with MDR-TBthrough transmission beginning at day 100 and then at an increased rate beginning on day 190 aftertreatment elapses and the effect of Reduced_Transmit ends.
You can view the campaign.json file is in the \Scenarios\TB\05_MDR\B_Transmitted directory.
Transmitted MDR-TB: Running the SimulationAt your discretion, you can use the sample batch file, runEmod, in the\Scenarios\TB\05_MDR\B_Transmitted directory to run the simulation. For information about different methods for running theDTK, see Running a DTK Simulation.
©Copyright 2017 IntellectualVenturesManagement, LLC (IV)AllRightsReserved.EMOD is licensed under the Creative CommonsAttribution-Noncommercial-ShareAlike 4.0 License.
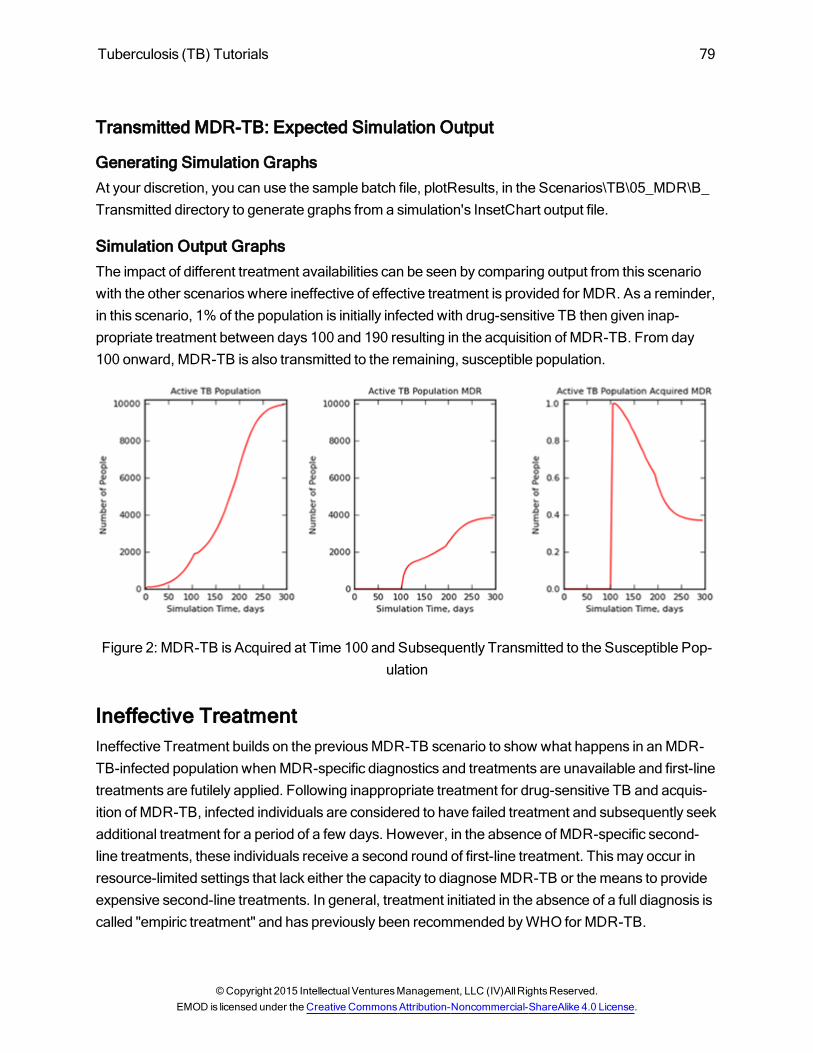
Tuberculosis (TB) Tutorials 79
Transmitted MDR-TB: Expected Simulation Output
Generating Simulation GraphsAt your discretion, you can use the sample batch file, plotResults, in the Scenarios\TB\05_MDR\B_Transmitted directory to generate graphs from a simulation's InsetChart output file.
Simulation Output GraphsThe impact of different treatment availabilities can be seen by comparing output from this scenariowith the other scenarios where ineffective of effective treatment is provided for MDR. As a reminder,in this scenario, 1% of the population is initially infected with drug-sensitive TB then given inap-propriate treatment between days 100 and 190 resulting in the acquisition of MDR-TB. From day100 onward, MDR-TB is also transmitted to the remaining, susceptible population.
Figure 2: MDR-TB is Acquired at Time 100 and Subsequently Transmitted to the Susceptible Pop-ulation
Ineffective TreatmentIneffective Treatment builds on the previousMDR-TB scenario to show what happens in anMDR-TB-infected population whenMDR-specific diagnostics and treatments are unavailable and first-linetreatments are futilely applied. Following inappropriate treatment for drug-sensitive TB and acquis-ition of MDR-TB, infected individuals are considered to have failed treatment and subsequently seekadditional treatment for a period of a few days. However, in the absence of MDR-specific second-line treatments, these individuals receive a second round of first-line treatment. Thismay occur inresource-limited settings that lack either the capacity to diagnoseMDR-TB or themeans to provideexpensive second-line treatments. In general, treatment initiated in the absence of a full diagnosis iscalled "empiric treatment" and has previously been recommended byWHO for MDR-TB.
©Copyright 2015 IntellectualVenturesManagement, LLC (IV)AllRightsReserved.EMOD is licensed under the Creative CommonsAttribution-Noncommercial-ShareAlike 4.0 License.
80 Tuberculosis (TB) Tutorials
Ineffective Treatment: InterventionsA failure outcome from a TB drug regimen, which in real life is usually associated with MDR-TB thatwas either already present at the beginning of treatment or developed during the course of treat-ment, is used to trigger an additional round of treatment. The classNodeLevelHealthTriggeredIV isused with the Trigger_Condition specified as TBFailedDrugRegimen. However, as stated pre-viously in this tutorial only first-line treatment is available.
First-line treatment is assumed to have a relatively benign effect onMDR-TB: the infected indi-vidual's outcome does not change but transmission is reduced while on treatment. (The defaultvalue of Reduced_Transmit is used, 0.9) Even in this best-case situation, the effect on the epidemicisminimal. Compared to the output from TransmittedMDR-TB, the number of individuals in the act-iveMDR-TB population is reduced only slightly, while the fraction of MDR-TB cases that areacquired is increased slightly, reflecting reduced transmission. Under more conservative assump-tions -- for example, if first-line treatment was assumed to be less effective in reducing the trans-mission of MDR-TB than of drug-sensitive TB and the value of Reduced_Transmit was set closer to0 -- the output would resemble that of TransmittedMDR-TB scenario evenmore closely.
{"Event_Coordinator_Config": {
"Demographic_Coverage": 1,"Intervention_Config": {
"Actual_IndividualIntervention_Config": {"Actual_IndividualIntervention_Configs": [
{"Cost_To_Consumer": 1,"Dose_Interval": 1,"Drug_Type": "EmpiricTreatment","Durability_Profile": "FIXED_DURATION_CONSTANT_EFFECT","Fraction_Defaulters": 0,"Primary_Decay_Time_Constant": 90,"Reduced_Transmit": 0.9,"Remaining_Doses": 1,"TB_Drug_Clearance_Rate": 1e-09,"TB_Drug_Inactivation_Rate": 1e-09,"TB_Drug_Mortality_Rate": 1e-09,"TB_Drug_Relapse_Rate": 1e-09,"TB_Drug_Resistance_Rate": 0.1,"class": "AntiTBDrug"
}],"Coverage": 1,
©Copyright 2017 IntellectualVenturesManagement, LLC (IV)AllRightsReserved.EMOD is licensed under the Creative CommonsAttribution-Noncommercial-ShareAlike 4.0 License.
Tuberculosis (TB) Tutorials 81
"Delay_Distribution": "FIXED_DURATION","Delay_Period": 10,"class": "DelayedIntervention"
},"Property_Restrictions_Within_Node": [],"Trigger_Condition": "TBFailedDrugRegimen","class": "NodeLevelHealthTriggeredIV"
},"Number_Distributions": -1,"Number_Repetitions": 1,"Property_Restrictions": [],"Target_Demographic": "Everyone","class": "StandardInterventionDistributionEventCoordinator"
},"Event_Name": "Failed people get an ineffective re-treatment after time delay","Nodeset_Config": {
"class": "NodeSetAll"},"Start_Day": 1,"class": "CampaignEvent"
},...[remainder identical to MDR scenario (1c)]
You can view the all of the interventions in the campaign.jsonfile in the Scenarios\TB\05_MDR\C_Ineffective Treatment.
Ineffective Treatment: Running the SimulationAt your discretion, you can use the sample batch file, runEMOD, in the Scenarios\TB\05_MDR\C_Ineffective Treatment directory to run the simulation.
Ineffective Treatment: Expected Simulation Output
Generating Simulation GraphsAt your discretion, you can use the sample batch file, plotResults, in the Scenarios\TB\05_MDR\C_Ineffective Treatment. directory to generate graphs from a simulation's InsetChart output file.
Simulation Output GraphsThe impact of attempting to treat MDR-TB (TransmittedMDR scenario) using first-line drugs isobserved.When the same set of output channels as those from Figure 2 (transmittedMDR) are plot-ted, the futility of this course of action is readily observed. Small effects are seen inMDR-TB prevalence and the fraction of MDR-TB that is acquired, but the dynamics of the epidemic areessentially unchanged.
©Copyright 2015 IntellectualVenturesManagement, LLC (IV)AllRightsReserved.EMOD is licensed under the Creative CommonsAttribution-Noncommercial-ShareAlike 4.0 License.
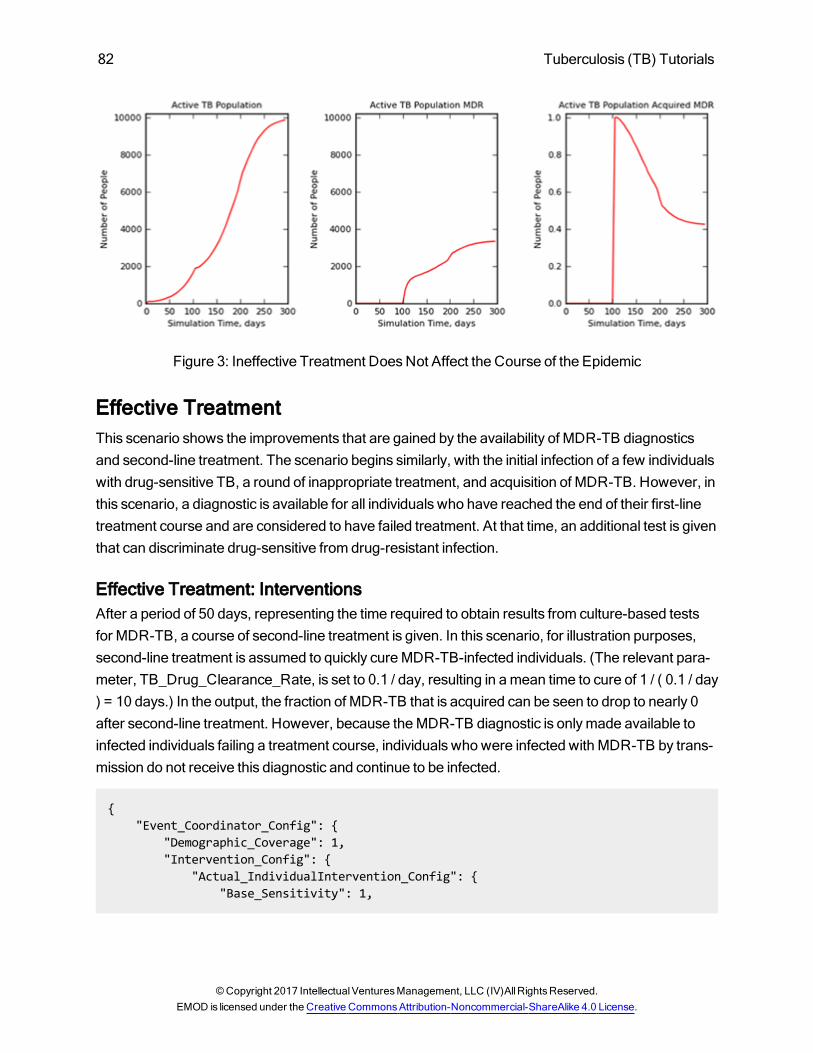
82 Tuberculosis (TB) Tutorials
Figure 3: Ineffective Treatment DoesNot Affect the Course of the Epidemic
Effective TreatmentThis scenario shows the improvements that are gained by the availability of MDR-TB diagnosticsand second-line treatment. The scenario begins similarly, with the initial infection of a few individualswith drug-sensitive TB, a round of inappropriate treatment, and acquisition of MDR-TB. However, inthis scenario, a diagnostic is available for all individuals who have reached the end of their first-linetreatment course and are considered to have failed treatment. At that time, an additional test is giventhat can discriminate drug-sensitive from drug-resistant infection.
Effective Treatment: InterventionsAfter a period of 50 days, representing the time required to obtain results from culture-based testsfor MDR-TB, a course of second-line treatment is given. In this scenario, for illustration purposes,second-line treatment is assumed to quickly cureMDR-TB-infected individuals. (The relevant para-meter, TB_Drug_Clearance_Rate, is set to 0.1 / day, resulting in amean time to cure of 1 / ( 0.1 / day) = 10 days.) In the output, the fraction of MDR-TB that is acquired can be seen to drop to nearly 0after second-line treatment. However, because theMDR-TB diagnostic is onlymade available toinfected individuals failing a treatment course, individuals who were infected with MDR-TB by trans-mission do not receive this diagnostic and continue to be infected.
{"Event_Coordinator_Config": {
"Demographic_Coverage": 1,"Intervention_Config": {
"Actual_IndividualIntervention_Config": {"Base_Sensitivity": 1,
©Copyright 2017 IntellectualVenturesManagement, LLC (IV)AllRightsReserved.EMOD is licensed under the Creative CommonsAttribution-Noncommercial-ShareAlike 4.0 License.
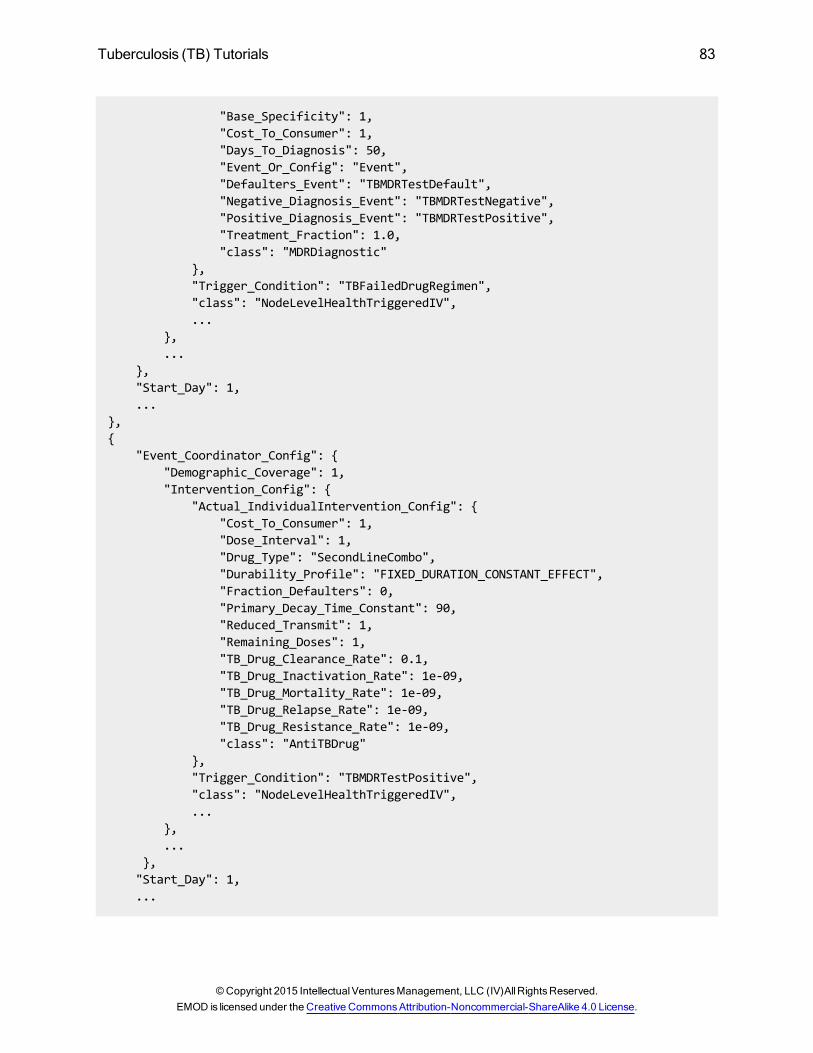
Tuberculosis (TB) Tutorials 83
"Base_Specificity": 1,"Cost_To_Consumer": 1,"Days_To_Diagnosis": 50,"Event_Or_Config": "Event","Defaulters_Event": "TBMDRTestDefault","Negative_Diagnosis_Event": "TBMDRTestNegative","Positive_Diagnosis_Event": "TBMDRTestPositive","Treatment_Fraction": 1.0,"class": "MDRDiagnostic"
},"Trigger_Condition": "TBFailedDrugRegimen","class": "NodeLevelHealthTriggeredIV",...
},...
},"Start_Day": 1,...
},{
"Event_Coordinator_Config": {"Demographic_Coverage": 1,"Intervention_Config": {
"Actual_IndividualIntervention_Config": {"Cost_To_Consumer": 1,"Dose_Interval": 1,"Drug_Type": "SecondLineCombo","Durability_Profile": "FIXED_DURATION_CONSTANT_EFFECT","Fraction_Defaulters": 0,"Primary_Decay_Time_Constant": 90,"Reduced_Transmit": 1,"Remaining_Doses": 1,"TB_Drug_Clearance_Rate": 0.1,"TB_Drug_Inactivation_Rate": 1e-09,"TB_Drug_Mortality_Rate": 1e-09,"TB_Drug_Relapse_Rate": 1e-09,"TB_Drug_Resistance_Rate": 1e-09,"class": "AntiTBDrug"
},"Trigger_Condition": "TBMDRTestPositive","class": "NodeLevelHealthTriggeredIV",...
},...
},"Start_Day": 1,...
©Copyright 2015 IntellectualVenturesManagement, LLC (IV)AllRightsReserved.EMOD is licensed under the Creative CommonsAttribution-Noncommercial-ShareAlike 4.0 License.
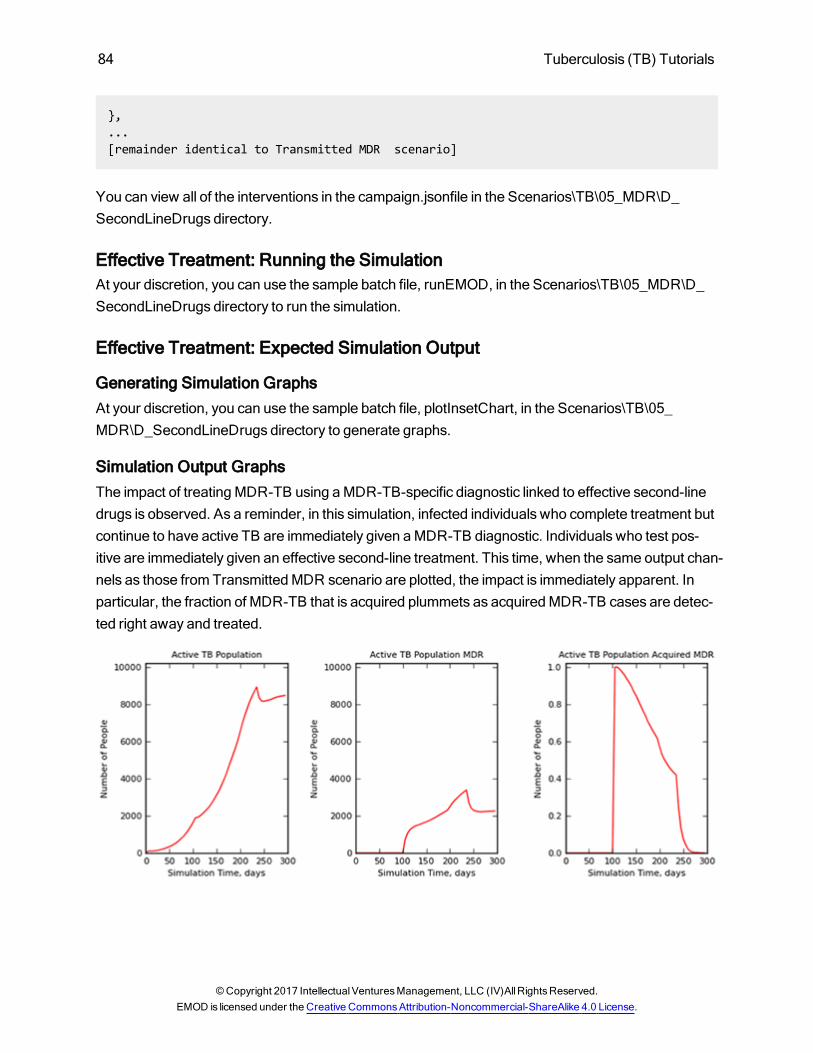
84 Tuberculosis (TB) Tutorials
},...[remainder identical to Transmitted MDR scenario]
You can view all of the interventions in the campaign.jsonfile in the Scenarios\TB\05_MDR\D_SecondLineDrugs directory.
Effective Treatment: Running the SimulationAt your discretion, you can use the sample batch file, runEMOD, in the Scenarios\TB\05_MDR\D_SecondLineDrugs directory to run the simulation.
Effective Treatment: Expected Simulation Output
Generating Simulation GraphsAt your discretion, you can use the sample batch file, plotInsetChart, in the Scenarios\TB\05_MDR\D_SecondLineDrugs directory to generate graphs.
Simulation Output GraphsThe impact of treatingMDR-TB using aMDR-TB-specific diagnostic linked to effective second-linedrugs is observed. As a reminder, in this simulation, infected individuals who complete treatment butcontinue to have active TB are immediately given aMDR-TB diagnostic. Individuals who test pos-itive are immediately given an effective second-line treatment. This time, when the same output chan-nels as those from TransmittedMDR scenario are plotted, the impact is immediately apparent. Inparticular, the fraction of MDR-TB that is acquired plummets as acquiredMDR-TB cases are detec-ted right away and treated.
©Copyright 2017 IntellectualVenturesManagement, LLC (IV)AllRightsReserved.EMOD is licensed under the Creative CommonsAttribution-Noncommercial-ShareAlike 4.0 License.
Tuberculosis (TB) Tutorials 85
Exploring the ModelExample 1: Vary infectiousness during empiric treatment and second-line treatment.
As suggested in Ineffective Treatment, the effect of various treatments on the infectiousness ofMDR-TB cases (for example, the number of viable bacilli expectorated per cough while on treat-ment) is largely unknown. Explore the effect of different assumptions on the change in infec-tiousnesswhile on treatment in themodel. To change the infectiousnesswhile on treatment, vary theAntiTBDrug campaign parameter, Reduced_Transmit.
Example 2: MDR Fitness
One config parameter specific to MDR-TB is the fitness of MDR-TB strains, called TB_MDR_Fit-ness_Multiplier. In themodel, this parameter works by setting the infectiousness of MDR-TB.(The AntiTBDrug intervention parameter, Reduced_Transmit, does something similar, but only dur-ing the drug treatment itself.) For all of the scenarios in this section, the value of this parameter hasbeen set to 1, givingMDR-TB an equal infectiousness to drug-sensitive TB. However, in general,drug-resistant strains of any pathogen (including those for TB) are assumed to have a lower fitnessand infectiousness than wild-type, drug-sensitive strains, especially in the absence of drug pressure.Explore the effect of settingMDR fitness in themodel to values less than 1 to represent the reducedfitness of MDR-TB strains. Compare the total number of active TB cases over time, aswell as thenumber of MDR-TB cases.
Related Topics:
Tuberculosis (TB) Overview
Tuberculosis (TB) Tutorials
Parameter Reference
©Copyright 2015 IntellectualVenturesManagement, LLC (IV)AllRightsReserved.EMOD is licensed under the Creative CommonsAttribution-Noncommercial-ShareAlike 4.0 License.
86 Tuberculosis (TB) Tutorials
TB 6: Population Burn-inThis tutorial assumes that you have read and understand the first five tutorials as it uses conceptsand configuration examples from them.
Population Burn-in implements amore realistic simulation with a larger population where TB isendemic but present at a low absolute prevalence. To accomplish this, the tutorial utilizes two keyfeatures:
A larger population size that allows a small number of infected individuals to be represented.Nevertheless, the population is sampled, so that an individualmay represent more than one per-son in the population. The population age distribution remains constant throughout the scenarioby the application of a fixed birth rate and an age-dependent mortality rate.
Simulation burn-in is amodeling concept borrowed from the electronics industry where the firstitems produced by amanufacturing process are discarded before the process is applied. Forsoftwaremodeling, the points of a simulation are discarded before the simulation is usefullyapplied.
Two scenarios within this tutorial demonstrate using burn-in with a large population and how to use asimulation after burn-in:
Steady State: At the start of the simulation, 50% of the population is initialized with TB, resultingin an initial peak of active disease. The simulation is run until steady-state dynamics areobserved, showing that disease endemicity has been reached. A steady state in the disease isobserved after approximately a 100-year burn-in period where latent disease ismore highly pre-valent in older individuals and incidence results from a combination of new transmissions andreactivation from latent disease. The simulation continues past the burn-in period with littlechange in the epidemic aside from stochastic noise.
Private to Public Health Care: An intervention is applied after the burn-in period whichmoves50% of the population to higher quality care. The simulation is run for an additional 10 years toobserve the impact of improving the quality of care.
Demographics InputsTo view the complete demographics file, see TB_06_PopulationBurnIn_demographic in the Scen-arios\InputFiles directory.
©Copyright 2017 IntellectualVenturesManagement, LLC (IV)AllRightsReserved.EMOD is licensed under the Creative CommonsAttribution-Noncommercial-ShareAlike 4.0 License.
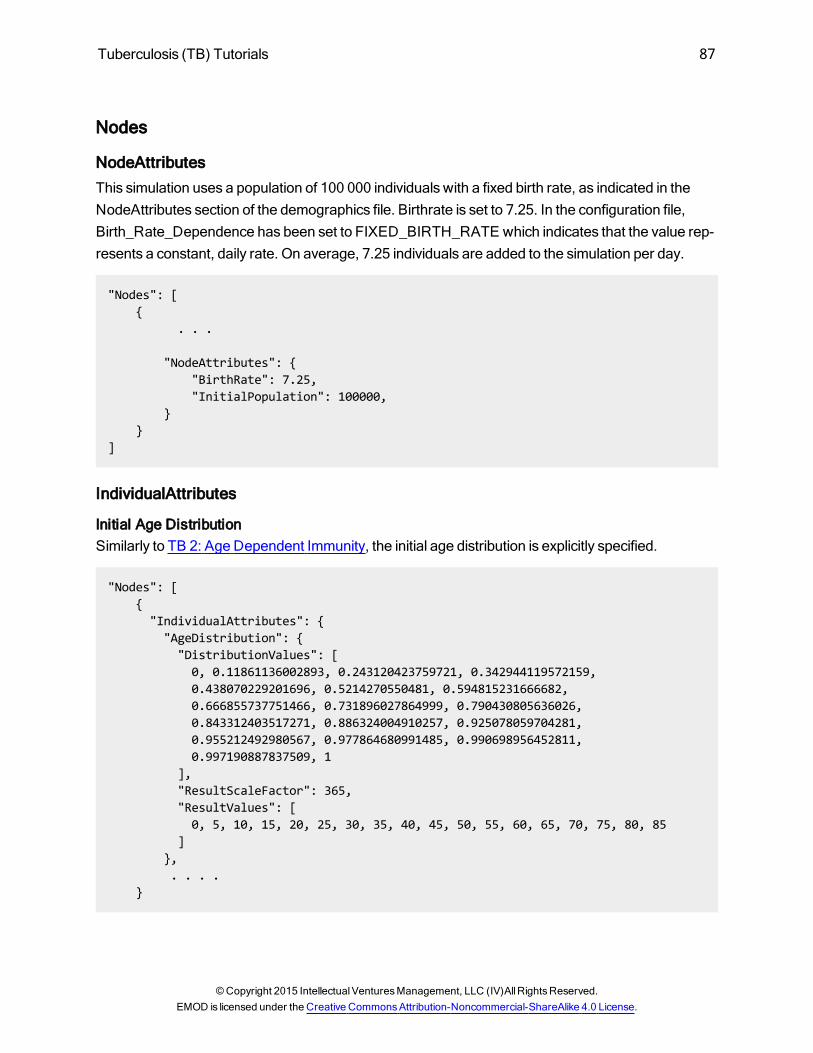
Tuberculosis (TB) Tutorials 87
Nodes
NodeAttributesThis simulation uses a population of 100 000 individuals with a fixed birth rate, as indicated in theNodeAttributes section of the demographics file. Birthrate is set to 7.25. In the configuration file,Birth_Rate_Dependence has been set to FIXED_BIRTH_RATE which indicates that the value rep-resents a constant, daily rate. On average, 7.25 individuals are added to the simulation per day.
"Nodes": [{
. . .
"NodeAttributes": {"BirthRate": 7.25,"InitialPopulation": 100000,
}}
]
IndividualAttributes
Initial Age DistributionSimilarly to TB 2: Age Dependent Immunity, the initial age distribution is explicitly specified.
"Nodes": [{"IndividualAttributes": {"AgeDistribution": {"DistributionValues": [0, 0.11861136002893, 0.243120423759721, 0.342944119572159,0.438070229201696, 0.5214270550481, 0.594815231666682,0.666855737751466, 0.731896027864999, 0.790430805636026,0.843312403517271, 0.886324004910257, 0.925078059704281,0.955212492980567, 0.977864680991485, 0.990698956452811,0.997190887837509, 1
],"ResultScaleFactor": 365,"ResultValues": [0, 5, 10, 15, 20, 25, 30, 35, 40, 45, 50, 55, 60, 65, 70, 75, 80, 85
]},. . . .
}
©Copyright 2015 IntellectualVenturesManagement, LLC (IV)AllRightsReserved.EMOD is licensed under the Creative CommonsAttribution-Noncommercial-ShareAlike 4.0 License.
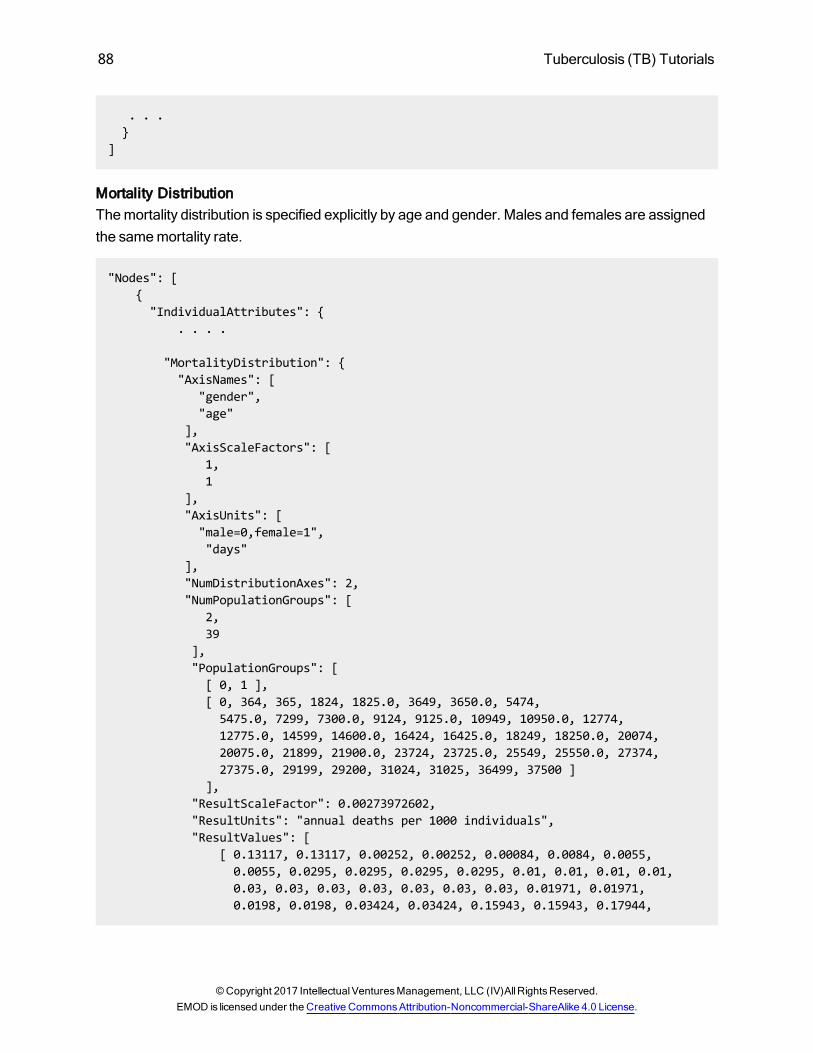
88 Tuberculosis (TB) Tutorials
. . .}
]
Mortality DistributionThemortality distribution is specified explicitly by age and gender. Males and females are assignedthe samemortality rate.
"Nodes": [{"IndividualAttributes": {
. . . .
"MortalityDistribution": {"AxisNames": [
"gender","age"
],"AxisScaleFactors": [
1,1
],"AxisUnits": ["male=0,female=1","days"
],"NumDistributionAxes": 2,"NumPopulationGroups": [
2,39
],"PopulationGroups": [[ 0, 1 ],[ 0, 364, 365, 1824, 1825.0, 3649, 3650.0, 5474,5475.0, 7299, 7300.0, 9124, 9125.0, 10949, 10950.0, 12774,12775.0, 14599, 14600.0, 16424, 16425.0, 18249, 18250.0, 20074,20075.0, 21899, 21900.0, 23724, 23725.0, 25549, 25550.0, 27374,27375.0, 29199, 29200, 31024, 31025, 36499, 37500 ]
],"ResultScaleFactor": 0.00273972602,"ResultUnits": "annual deaths per 1000 individuals","ResultValues": [
[ 0.13117, 0.13117, 0.00252, 0.00252, 0.00084, 0.0084, 0.0055,0.0055, 0.0295, 0.0295, 0.0295, 0.0295, 0.01, 0.01, 0.01, 0.01,0.03, 0.03, 0.03, 0.03, 0.03, 0.03, 0.03, 0.01971, 0.01971,0.0198, 0.0198, 0.03424, 0.03424, 0.15943, 0.15943, 0.17944,
©Copyright 2017 IntellectualVenturesManagement, LLC (IV)AllRightsReserved.EMOD is licensed under the Creative CommonsAttribution-Noncommercial-ShareAlike 4.0 License.
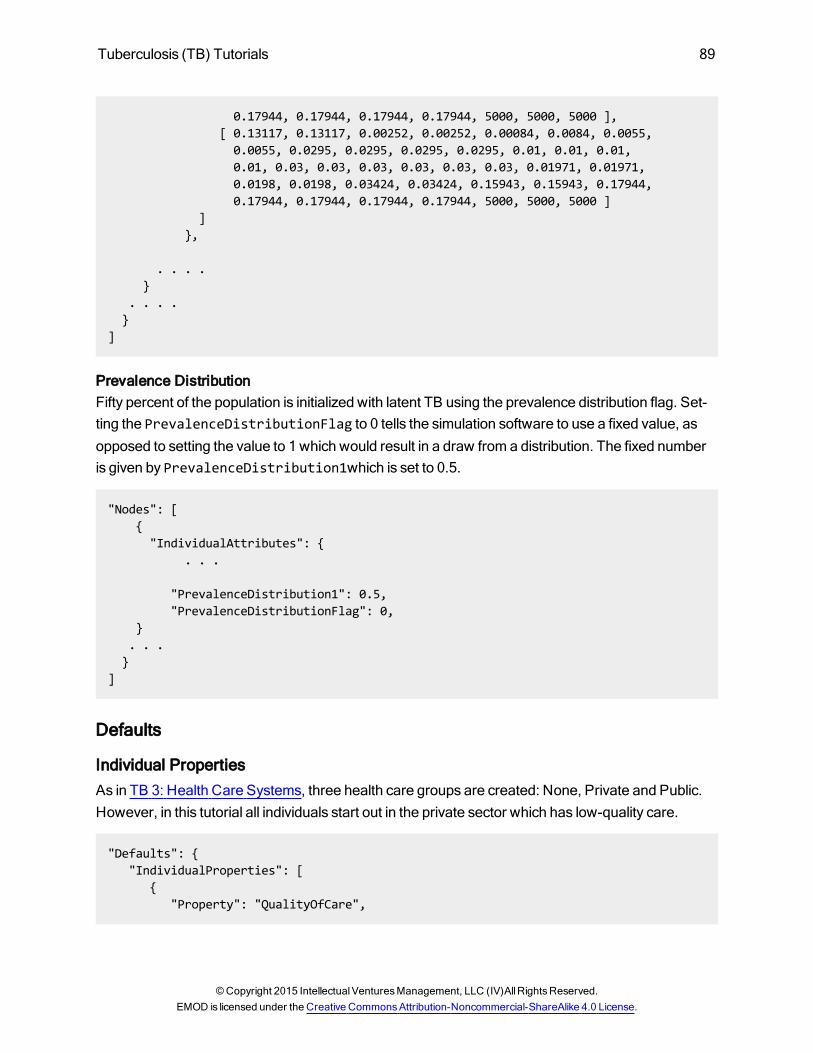
Tuberculosis (TB) Tutorials 89
0.17944, 0.17944, 0.17944, 0.17944, 5000, 5000, 5000 ],[ 0.13117, 0.13117, 0.00252, 0.00252, 0.00084, 0.0084, 0.0055,0.0055, 0.0295, 0.0295, 0.0295, 0.0295, 0.01, 0.01, 0.01,0.01, 0.03, 0.03, 0.03, 0.03, 0.03, 0.03, 0.01971, 0.01971,0.0198, 0.0198, 0.03424, 0.03424, 0.15943, 0.15943, 0.17944,0.17944, 0.17944, 0.17944, 0.17944, 5000, 5000, 5000 ]
]},
. . . .}
. . . .}
]
Prevalence DistributionFifty percent of the population is initialized with latent TB using the prevalence distribution flag. Set-ting the PrevalenceDistributionFlag to 0 tells the simulation software to use a fixed value, asopposed to setting the value to 1 which would result in a draw from a distribution. The fixed numberis given by PrevalenceDistribution1which is set to 0.5.
"Nodes": [{"IndividualAttributes": {
. . .
"PrevalenceDistribution1": 0.5,"PrevalenceDistributionFlag": 0,
}. . .}
]
Defaults
Individual PropertiesAs in TB 3: Health Care Systems, three health care groups are created: None, Private and Public.However, in this tutorial all individuals start out in the private sector which has low-quality care.
"Defaults": {"IndividualProperties": [
{"Property": "QualityOfCare",
©Copyright 2015 IntellectualVenturesManagement, LLC (IV)AllRightsReserved.EMOD is licensed under the Creative CommonsAttribution-Noncommercial-ShareAlike 4.0 License.
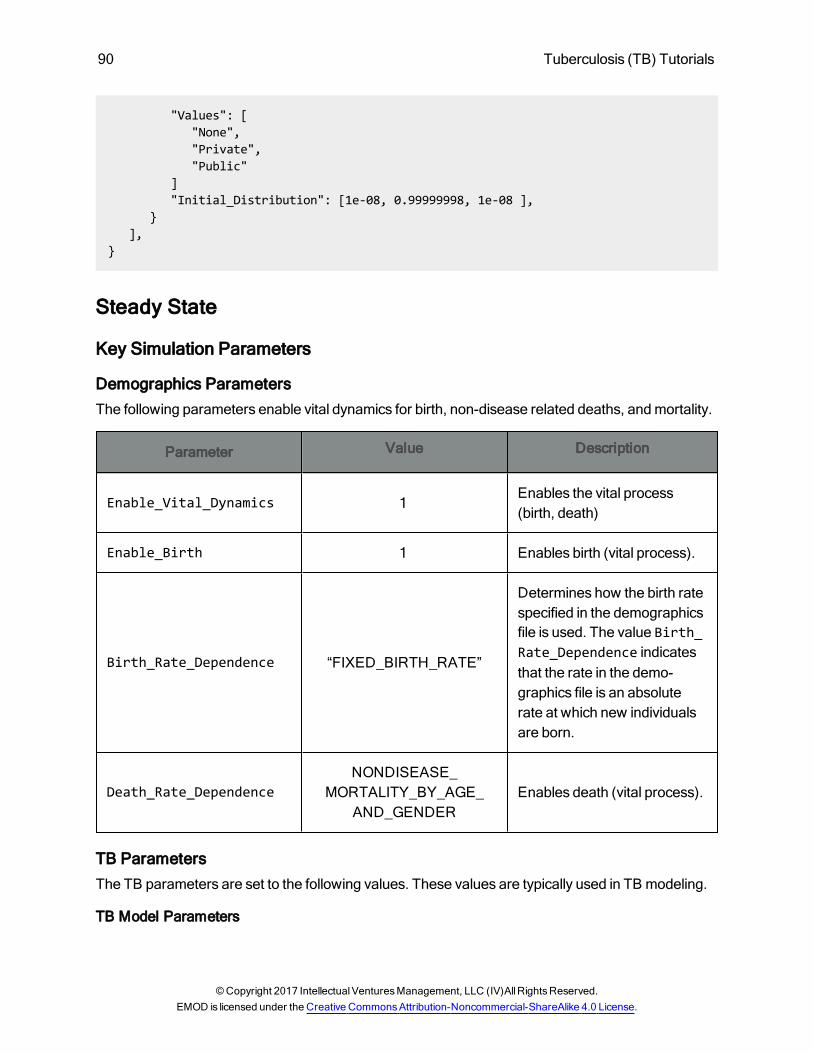
90 Tuberculosis (TB) Tutorials
"Values": ["None","Private","Public"
]"Initial_Distribution": [1e-08, 0.99999998, 1e-08 ],
}],
}
Steady State
Key Simulation Parameters
Demographics ParametersThe following parameters enable vital dynamics for birth, non-disease related deaths, andmortality.
Parameter Value Description
Enable_Vital_Dynamics 1Enables the vital process(birth, death)
Enable_Birth 1 Enables birth (vital process).
Birth_Rate_Dependence “FIXED_BIRTH_RATE”
Determines how the birth ratespecified in the demographicsfile is used. The value Birth_Rate_Dependence indicatesthat the rate in the demo-graphics file is an absoluterate at which new individualsare born.
Death_Rate_DependenceNONDISEASE_
MORTALITY_BY_AGE_AND_GENDER
Enables death (vital process).
TB ParametersThe TB parameters are set to the following values. These values are typically used in TB modeling.
TB Model Parameters
©Copyright 2017 IntellectualVenturesManagement, LLC (IV)AllRightsReserved.EMOD is licensed under the Creative CommonsAttribution-Noncommercial-ShareAlike 4.0 License.
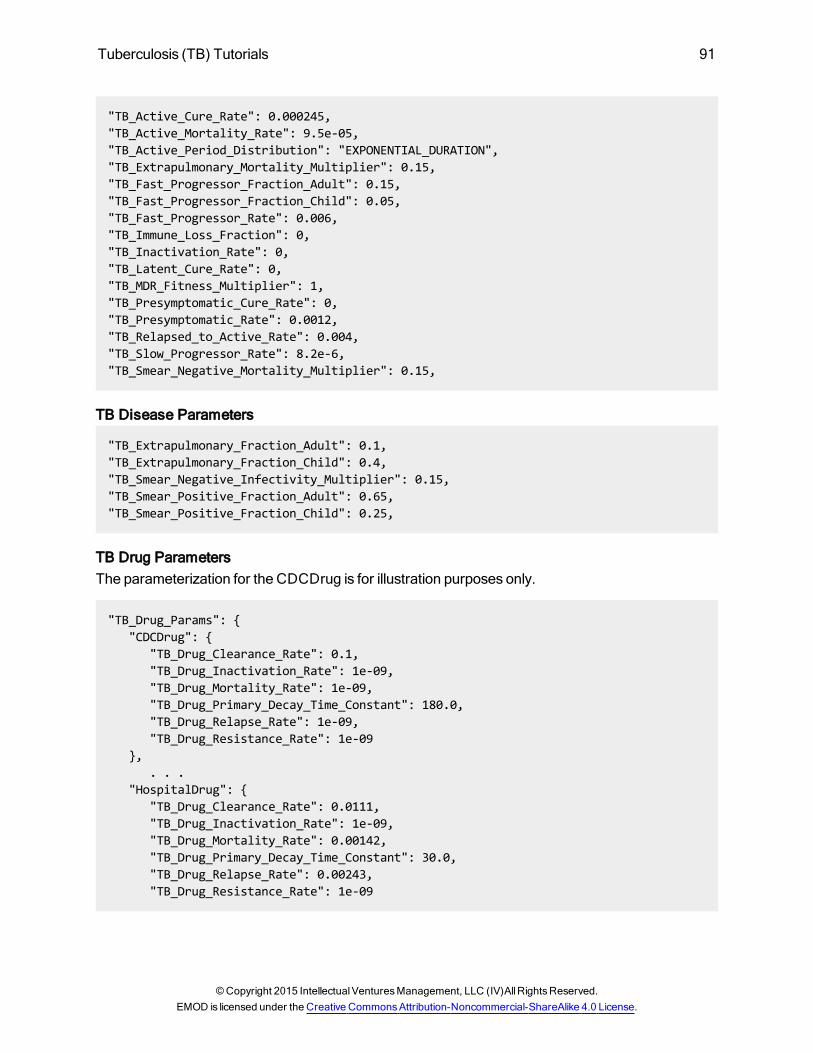
Tuberculosis (TB) Tutorials 91
"TB_Active_Cure_Rate": 0.000245,"TB_Active_Mortality_Rate": 9.5e-05,"TB_Active_Period_Distribution": "EXPONENTIAL_DURATION","TB_Extrapulmonary_Mortality_Multiplier": 0.15,"TB_Fast_Progressor_Fraction_Adult": 0.15,"TB_Fast_Progressor_Fraction_Child": 0.05,"TB_Fast_Progressor_Rate": 0.006,"TB_Immune_Loss_Fraction": 0,"TB_Inactivation_Rate": 0,"TB_Latent_Cure_Rate": 0,"TB_MDR_Fitness_Multiplier": 1,"TB_Presymptomatic_Cure_Rate": 0,"TB_Presymptomatic_Rate": 0.0012,"TB_Relapsed_to_Active_Rate": 0.004,"TB_Slow_Progressor_Rate": 8.2e-6,"TB_Smear_Negative_Mortality_Multiplier": 0.15,
TB Disease Parameters
"TB_Extrapulmonary_Fraction_Adult": 0.1,"TB_Extrapulmonary_Fraction_Child": 0.4,"TB_Smear_Negative_Infectivity_Multiplier": 0.15,"TB_Smear_Positive_Fraction_Adult": 0.65,"TB_Smear_Positive_Fraction_Child": 0.25,
TB Drug ParametersThe parameterization for the CDCDrug is for illustration purposes only.
"TB_Drug_Params": {"CDCDrug": {
"TB_Drug_Clearance_Rate": 0.1,"TB_Drug_Inactivation_Rate": 1e-09,"TB_Drug_Mortality_Rate": 1e-09,"TB_Drug_Primary_Decay_Time_Constant": 180.0,"TB_Drug_Relapse_Rate": 1e-09,"TB_Drug_Resistance_Rate": 1e-09
},. . .
"HospitalDrug": {"TB_Drug_Clearance_Rate": 0.0111,"TB_Drug_Inactivation_Rate": 1e-09,"TB_Drug_Mortality_Rate": 0.00142,"TB_Drug_Primary_Decay_Time_Constant": 30.0,"TB_Drug_Relapse_Rate": 0.00243,"TB_Drug_Resistance_Rate": 1e-09
©Copyright 2015 IntellectualVenturesManagement, LLC (IV)AllRightsReserved.EMOD is licensed under the Creative CommonsAttribution-Noncommercial-ShareAlike 4.0 License.
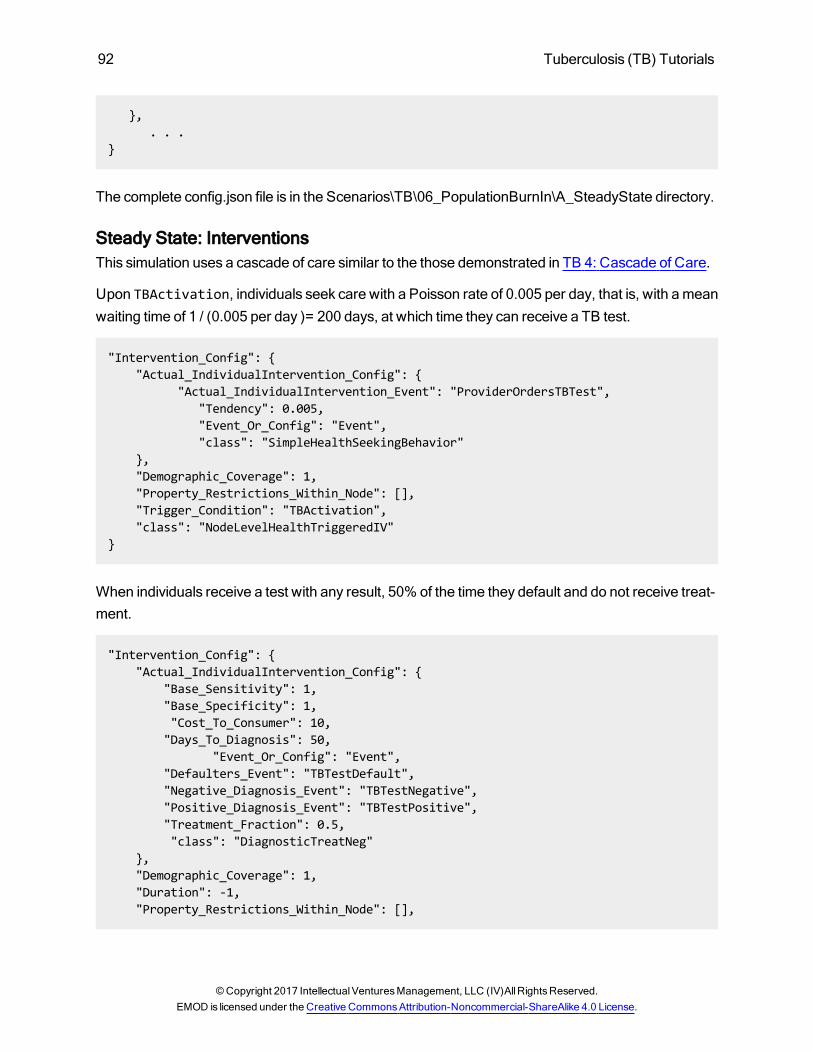
92 Tuberculosis (TB) Tutorials
},. . .
}
The complete config.json file is in the Scenarios\TB\06_PopulationBurnIn\A_SteadyState directory.
Steady State: InterventionsThis simulation uses a cascade of care similar to the those demonstrated in TB 4: Cascade of Care.
Upon TBActivation, individuals seek care with a Poisson rate of 0.005 per day, that is, with ameanwaiting time of 1 / (0.005 per day )= 200 days, at which time they can receive a TB test.
"Intervention_Config": {"Actual_IndividualIntervention_Config": {
"Actual_IndividualIntervention_Event": "ProviderOrdersTBTest","Tendency": 0.005,"Event_Or_Config": "Event","class": "SimpleHealthSeekingBehavior"
},"Demographic_Coverage": 1,"Property_Restrictions_Within_Node": [],"Trigger_Condition": "TBActivation","class": "NodeLevelHealthTriggeredIV"
}
When individuals receive a test with any result, 50% of the time they default and do not receive treat-ment.
"Intervention_Config": {"Actual_IndividualIntervention_Config": {
"Base_Sensitivity": 1,"Base_Specificity": 1,"Cost_To_Consumer": 10,"Days_To_Diagnosis": 50,
"Event_Or_Config": "Event","Defaulters_Event": "TBTestDefault","Negative_Diagnosis_Event": "TBTestNegative","Positive_Diagnosis_Event": "TBTestPositive","Treatment_Fraction": 0.5,"class": "DiagnosticTreatNeg"
},"Demographic_Coverage": 1,"Duration": -1,"Property_Restrictions_Within_Node": [],
©Copyright 2017 IntellectualVenturesManagement, LLC (IV)AllRightsReserved.EMOD is licensed under the Creative CommonsAttribution-Noncommercial-ShareAlike 4.0 License.
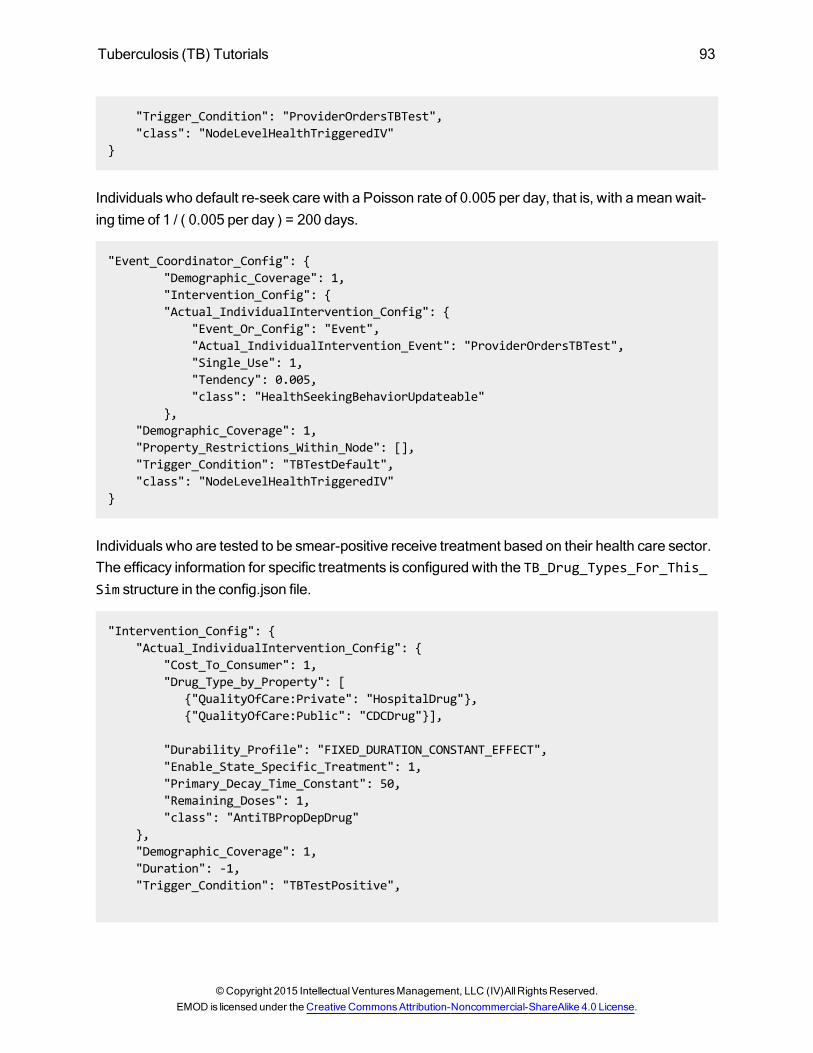
Tuberculosis (TB) Tutorials 93
"Trigger_Condition": "ProviderOrdersTBTest","class": "NodeLevelHealthTriggeredIV"
}
Individuals who default re-seek care with a Poisson rate of 0.005 per day, that is, with ameanwait-ing time of 1 / ( 0.005 per day ) = 200 days.
"Event_Coordinator_Config": {"Demographic_Coverage": 1,"Intervention_Config": {"Actual_IndividualIntervention_Config": {
"Event_Or_Config": "Event","Actual_IndividualIntervention_Event": "ProviderOrdersTBTest","Single_Use": 1,"Tendency": 0.005,"class": "HealthSeekingBehaviorUpdateable"
},"Demographic_Coverage": 1,"Property_Restrictions_Within_Node": [],"Trigger_Condition": "TBTestDefault","class": "NodeLevelHealthTriggeredIV"
}
Individuals who are tested to be smear-positive receive treatment based on their health care sector.The efficacy information for specific treatments is configured with the TB_Drug_Types_For_This_Sim structure in the config.json file.
"Intervention_Config": {"Actual_IndividualIntervention_Config": {
"Cost_To_Consumer": 1,"Drug_Type_by_Property": [
{"QualityOfCare:Private": "HospitalDrug"},{"QualityOfCare:Public": "CDCDrug"}],
"Durability_Profile": "FIXED_DURATION_CONSTANT_EFFECT","Enable_State_Specific_Treatment": 1,"Primary_Decay_Time_Constant": 50,"Remaining_Doses": 1,"class": "AntiTBPropDepDrug"
},"Demographic_Coverage": 1,"Duration": -1,"Trigger_Condition": "TBTestPositive",
©Copyright 2015 IntellectualVenturesManagement, LLC (IV)AllRightsReserved.EMOD is licensed under the Creative CommonsAttribution-Noncommercial-ShareAlike 4.0 License.
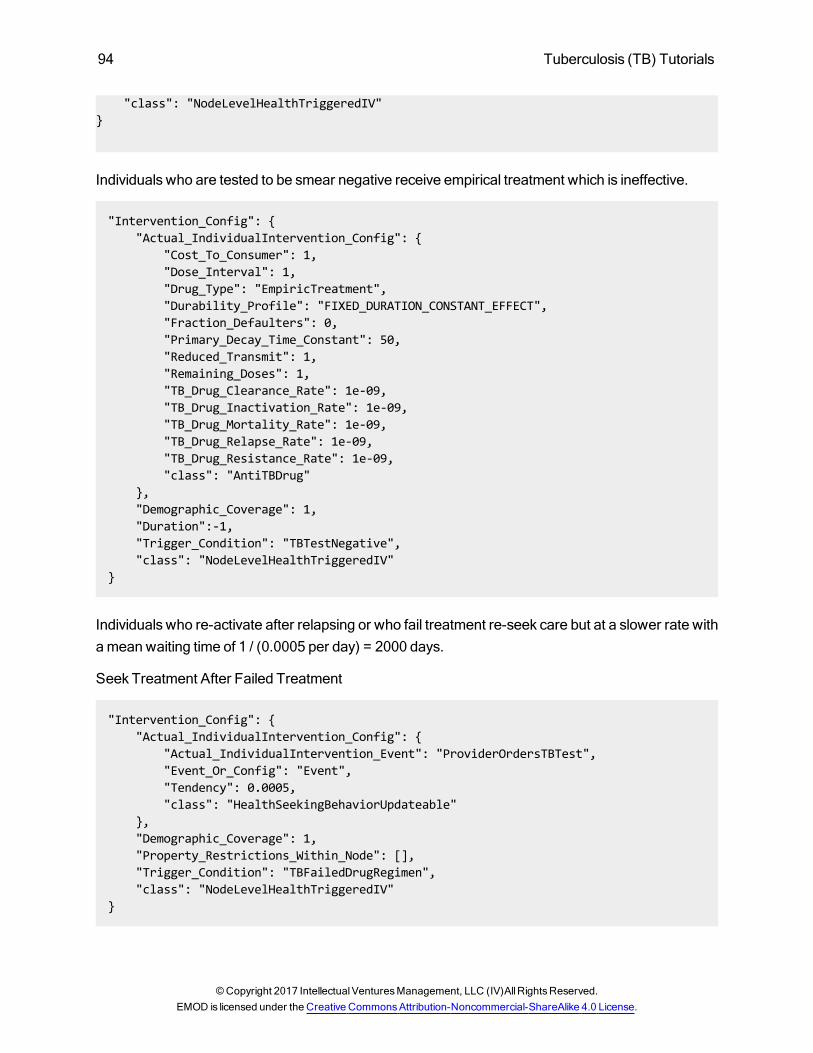
94 Tuberculosis (TB) Tutorials
"class": "NodeLevelHealthTriggeredIV"}
Individuals who are tested to be smear negative receive empirical treatment which is ineffective.
"Intervention_Config": {"Actual_IndividualIntervention_Config": {
"Cost_To_Consumer": 1,"Dose_Interval": 1,"Drug_Type": "EmpiricTreatment","Durability_Profile": "FIXED_DURATION_CONSTANT_EFFECT","Fraction_Defaulters": 0,"Primary_Decay_Time_Constant": 50,"Reduced_Transmit": 1,"Remaining_Doses": 1,"TB_Drug_Clearance_Rate": 1e-09,"TB_Drug_Inactivation_Rate": 1e-09,"TB_Drug_Mortality_Rate": 1e-09,"TB_Drug_Relapse_Rate": 1e-09,"TB_Drug_Resistance_Rate": 1e-09,"class": "AntiTBDrug"
},"Demographic_Coverage": 1,"Duration":-1,"Trigger_Condition": "TBTestNegative","class": "NodeLevelHealthTriggeredIV"
}
Individuals who re-activate after relapsing or who fail treatment re-seek care but at a slower rate withameanwaiting time of 1 / (0.0005 per day) = 2000 days.
Seek Treatment After Failed Treatment
"Intervention_Config": {"Actual_IndividualIntervention_Config": {
"Actual_IndividualIntervention_Event": "ProviderOrdersTBTest","Event_Or_Config": "Event","Tendency": 0.0005,"class": "HealthSeekingBehaviorUpdateable"
},"Demographic_Coverage": 1,"Property_Restrictions_Within_Node": [],"Trigger_Condition": "TBFailedDrugRegimen","class": "NodeLevelHealthTriggeredIV"
}
©Copyright 2017 IntellectualVenturesManagement, LLC (IV)AllRightsReserved.EMOD is licensed under the Creative CommonsAttribution-Noncommercial-ShareAlike 4.0 License.
Tuberculosis (TB) Tutorials 95
Seek Treatment after Relapse
"Intervention_Config": {"Actual_IndividualIntervention_Config": {
"Actual_IndividualIntervention_Event": "ProviderOrdersTBTest","Event_Or_Config": "Event","Tendency": 0.0005,"class": "HealthSeekingBehaviorUpdateable"
},"Demographic_Coverage": 1,"Property_Restrictions_Within_Node": [],"Trigger_Condition": "TBActivationPostRelapse","class": "NodeLevelHealthTriggeredIV"
}
You can view the campaign.json file is in the Scenarios\TB\06_PopulationBurnIn\A_SteadyState dir-ectory.
Steady State: Running the SimulationAt your discretion, you can use the sample batch file, runEMOD, in the Scenarios\TB\06_Pop-ulationBurnIn\A_SteadyState directory to run the simulation.
Steady State: Expected Simulation Output
Generating Simulation GraphsAt your discretion, you can use the sample batch file, plotResults, in the Scenarios\TB\06_Pop-ulationBurnIn\A_SteadyState directory to generate graphs from a simulation's InsetChart output file.
Simulation Output GraphsAfter the burn-in period there is little change in the epidemic aside from stochastic noise.
NOTE: Because the EMODmodel is stochastic, your graphs may appear slightly different from thosegiven below.
©Copyright 2015 IntellectualVenturesManagement, LLC (IV)AllRightsReserved.EMOD is licensed under the Creative CommonsAttribution-Noncommercial-ShareAlike 4.0 License.
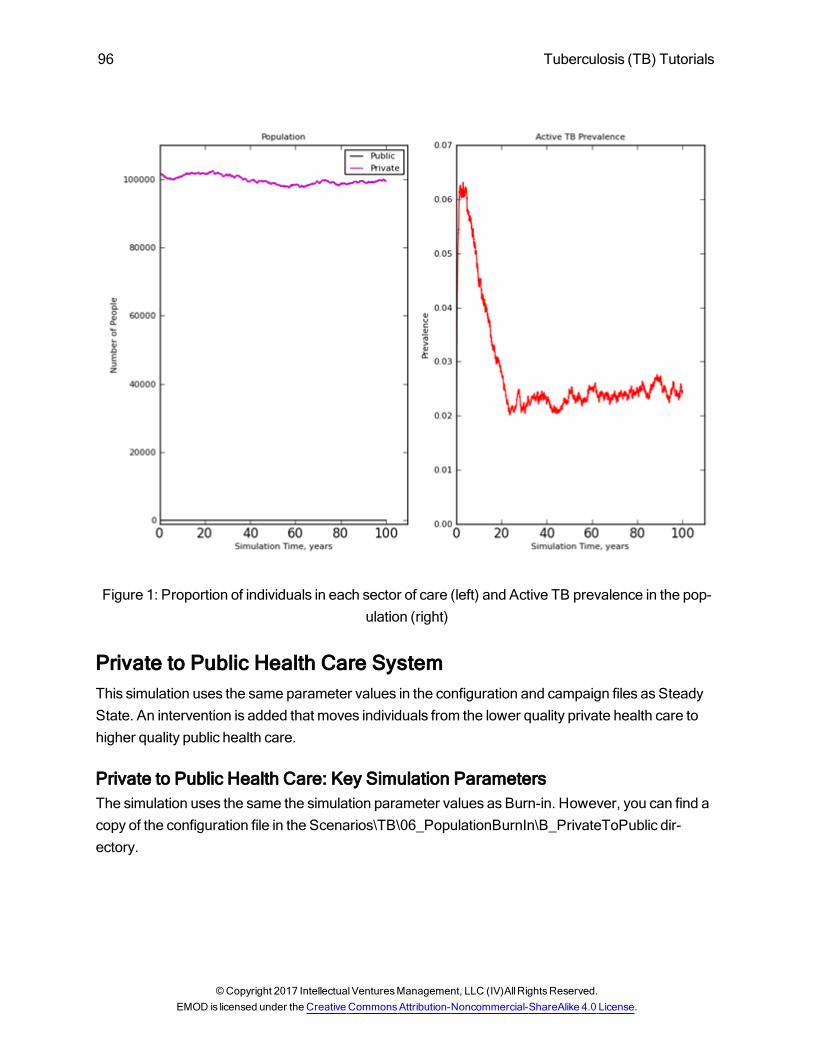
96 Tuberculosis (TB) Tutorials
Figure 1: Proportion of individuals in each sector of care (left) and Active TB prevalence in the pop-ulation (right)
Private to Public Health Care SystemThis simulation uses the same parameter values in the configuration and campaign files as SteadyState. An intervention is added that moves individuals from the lower quality private health care tohigher quality public health care.
Private to Public Health Care: Key Simulation ParametersThe simulation uses the same the simulation parameter values as Burn-in. However, you can find acopy of the configuration file in the Scenarios\TB\06_PopulationBurnIn\B_PrivateToPublic dir-ectory.
©Copyright 2017 IntellectualVenturesManagement, LLC (IV)AllRightsReserved.EMOD is licensed under the Creative CommonsAttribution-Noncommercial-ShareAlike 4.0 License.
Tuberculosis (TB) Tutorials 97
Private to Public Health Care: InterventionsIndividuals who have access to inferior private care system are shifted over to the public health careafter the 80-year burn-in period.
{"Event_Coordinator_Config": {
"Demographic_Coverage": 1,"Intervention_Config": {
"Distribution_Rate": 1,"Target_Property_Key": "QualityOfCare","Target_Property_Value": "Public","class": "PropertyValueChanger"
},"Number_Distributions": -1,"Number_Repetitions": -1,"Timesteps_Between_Repetitions": 73,"Property_Restrictions": [
"QualityOfCare:Private"],"Target_Demographic": "Everyone","class": "StandardInterventionDistributionEventCoordinator"
},"Event_Name": " shift from private to public","Nodeset_Config": {
"class": "NodeSetAll"},"Start_Day": 29200,"class": "CampaignEvent"
}
You can view the campaign.json file is in the \Scenarios\TB\06_PopulationBurnIn\B_Priv-ateToPublic directory.
Private to Public Health Care: Running the SimulationAt your discretion, you can use the sample batch file, runEMOD, in the Scenarios\TB\06_Pop-ulationBurnIn\B_PrivateToPublic directory to run the simulation.
©Copyright 2015 IntellectualVenturesManagement, LLC (IV)AllRightsReserved.EMOD is licensed under the Creative CommonsAttribution-Noncommercial-ShareAlike 4.0 License.
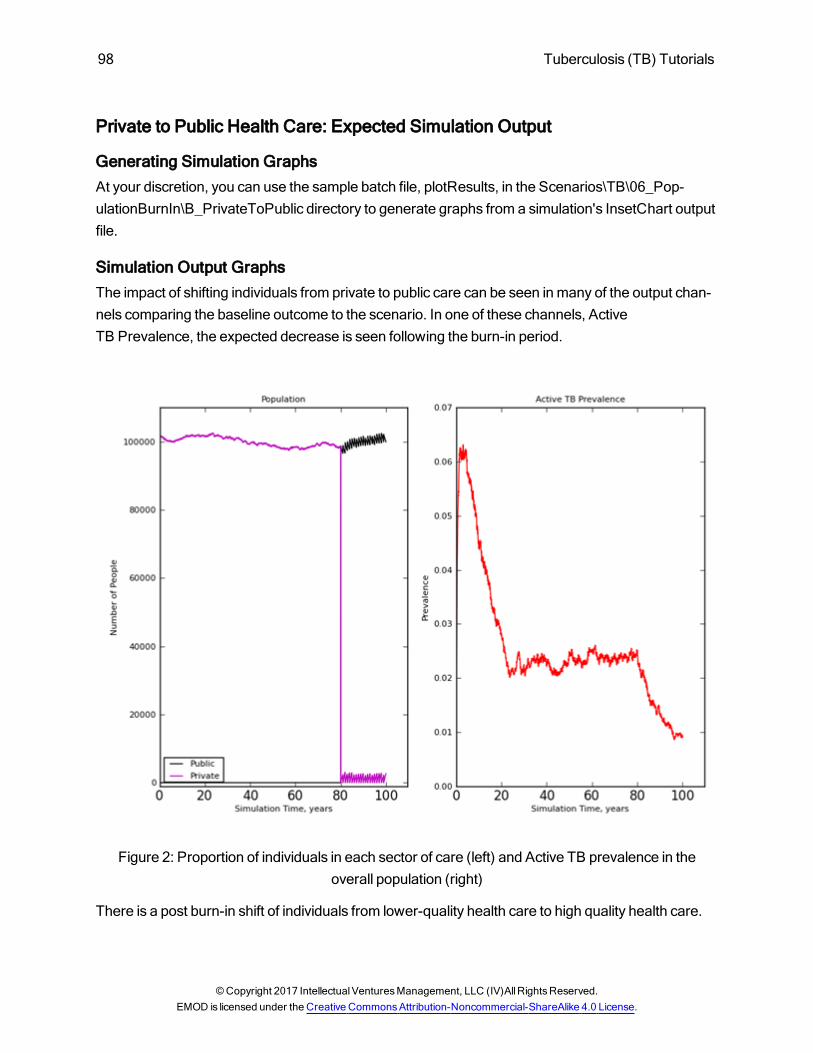
98 Tuberculosis (TB) Tutorials
Private to Public Health Care: Expected Simulation Output
Generating Simulation GraphsAt your discretion, you can use the sample batch file, plotResults, in the Scenarios\TB\06_Pop-ulationBurnIn\B_PrivateToPublic directory to generate graphs from a simulation's InsetChart outputfile.
Simulation Output GraphsThe impact of shifting individuals from private to public care can be seen inmany of the output chan-nels comparing the baseline outcome to the scenario. In one of these channels, ActiveTB Prevalence, the expected decrease is seen following the burn-in period.
Figure 2: Proportion of individuals in each sector of care (left) and Active TB prevalence in theoverall population (right)
There is a post burn-in shift of individuals from lower-quality health care to high quality health care.
©Copyright 2017 IntellectualVenturesManagement, LLC (IV)AllRightsReserved.EMOD is licensed under the Creative CommonsAttribution-Noncommercial-ShareAlike 4.0 License.
Tuberculosis (TB) Tutorials 99
Related Topics:
Tuberculosis (TB) Overview
Tuberculosis (TB) Tutorials
Parameter Reference
©Copyright 2015 IntellectualVenturesManagement, LLC (IV)AllRightsReserved.EMOD is licensed under the Creative CommonsAttribution-Noncommercial-ShareAlike 4.0 License.