tui group investor presentation · leading leisure hotel and club brands around the world;...
TRANSCRIPT

TUI Group Investor Presentation
June 2020

2 TUI GROUP | Investor Presentation | June 2020
FORWARD-LOOKING STATEMENTSThis presentation contains a number of statements
related to the future development of TUI. These
statements are based both on assumptions and
estimates. Although we are convinced that these
future-related statements are realistic, we cannot
guarantee them, for our assumptions involve risks and
uncertainties which may give rise to situations in which
the actual results differ substantially from the expected
ones. The potential reasons for such differences include
market fluctuations, the development of world market
fluctuations, the development of world market
commodity prices, the development of exchange rates
or fundamental changes in the economic environment.
TUI does not intend or assume any obligation to
update any forward-looking statement to reflect events
or circumstances after the date of these materials.

OVERVIEW
TUI GROUP | Investor Presentation | June 2020
4 TUI GROUP | Investor Presentation | June 2020
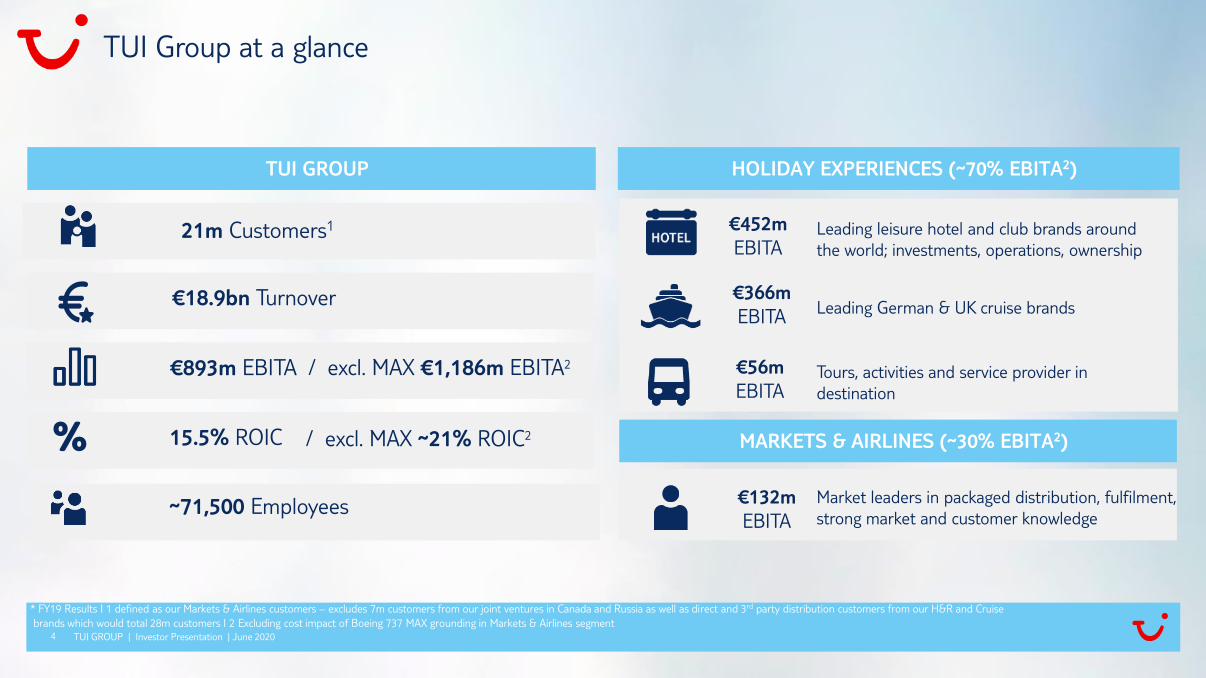
* FY19 Results I 1 defined as our Markets & Airlines customers – excludes 7m customers from our joint ventures in Canada and Russia as well as direct and 3rd party distribution customers from our H&R and Cruise
brands which would total 28m customers I 2 Excluding cost impact of Boeing 737 MAX grounding in Markets & Airlines segment4
TUI Group at a glance
TUI GROUP HOLIDAY EXPERIENCES (~70% EBITA2)
MARKETS & AIRLINES (~30% EBITA2)
€452m
EBITALeading leisure hotel and club brands around
the world; investments, operations, ownership
€366m
EBITALeading German & UK cruise brands
€56m
EBITATours, activities and service provider in
destination
€132m
EBITA
Market leaders in packaged distribution, fulfilment,
strong market and customer knowledge
21m Customers1
€18.9bn Turnover
€893m EBITA
15.5% ROIC
~71,500 Employees
%
/ excl. MAX €1,186m EBITA2
/ excl. MAX ~21% ROIC2
5
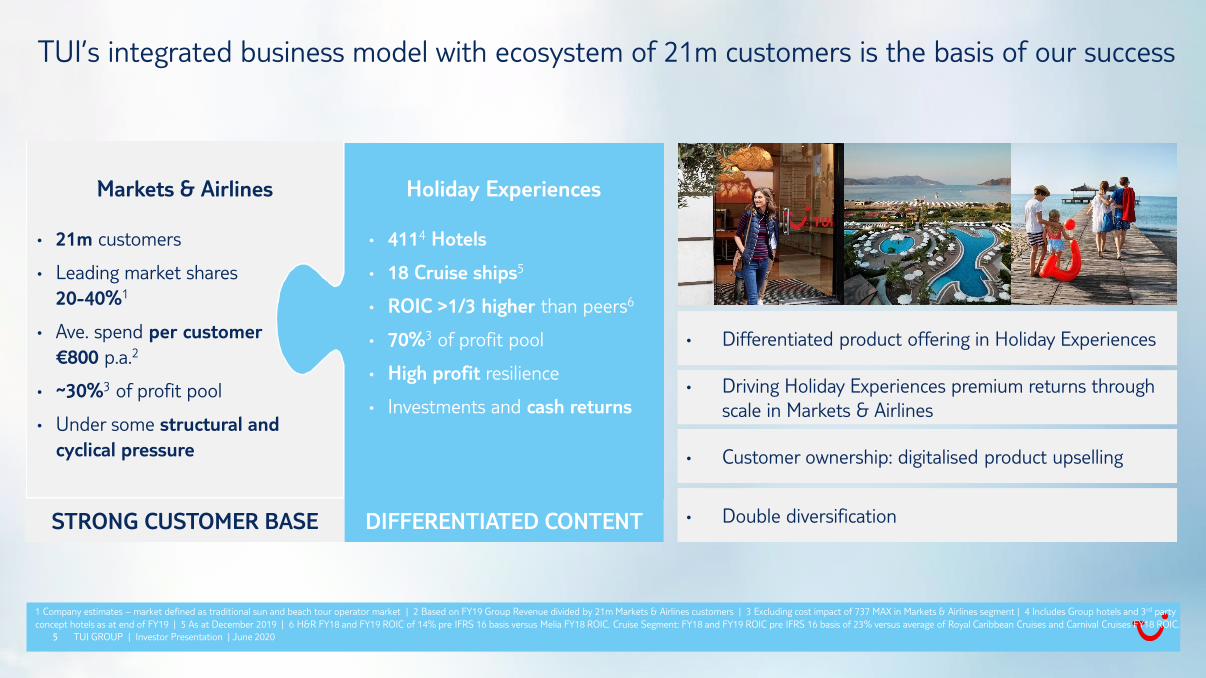
TUI’s integrated business model with ecosystem of 21m customers is the basis of our success
TUI GROUP | Investor Presentation | June 2020
• 21m customers
• Leading market shares
20-40%1
• Ave. spend per customer
€800 p.a.2
• ~30%3 of profit pool
• Under some structural and
cyclical pressure
Markets & Airlines
• 4114 Hotels
• 18 Cruise ships5
• ROIC >1/3 higher than peers6
• 70%3 of profit pool
• High profit resilience
• Investments and cash returns
Holiday Experiences
1 Company estimates – market defined as traditional sun and beach tour operator market | 2 Based on FY19 Group Revenue divided by 21m Markets & Airlines customers | 3 Excluding cost impact of 737 MAX in Markets & Airlines segment | 4 Includes Group hotels and 3rd party
concept hotels as at end of FY19 | 5 As at December 2019 | 6 H&R FY18 and FY19 ROIC of 14% pre IFRS 16 basis versus Melia FY18 ROIC. Cruise Segment: FY18 and FY19 ROIC pre IFRS 16 basis of 23% versus average of Royal Caribbean Cruises and Carnival Cruises FY18 ROIC.
• Driving Holiday Experiences premium returns through
scale in Markets & Airlines
• Customer ownership: digitalised product upselling
• Differentiated product offering in Holiday Experiences
• Double diversificationSTRONG CUSTOMER BASE DIFFERENTIATED CONTENT
6
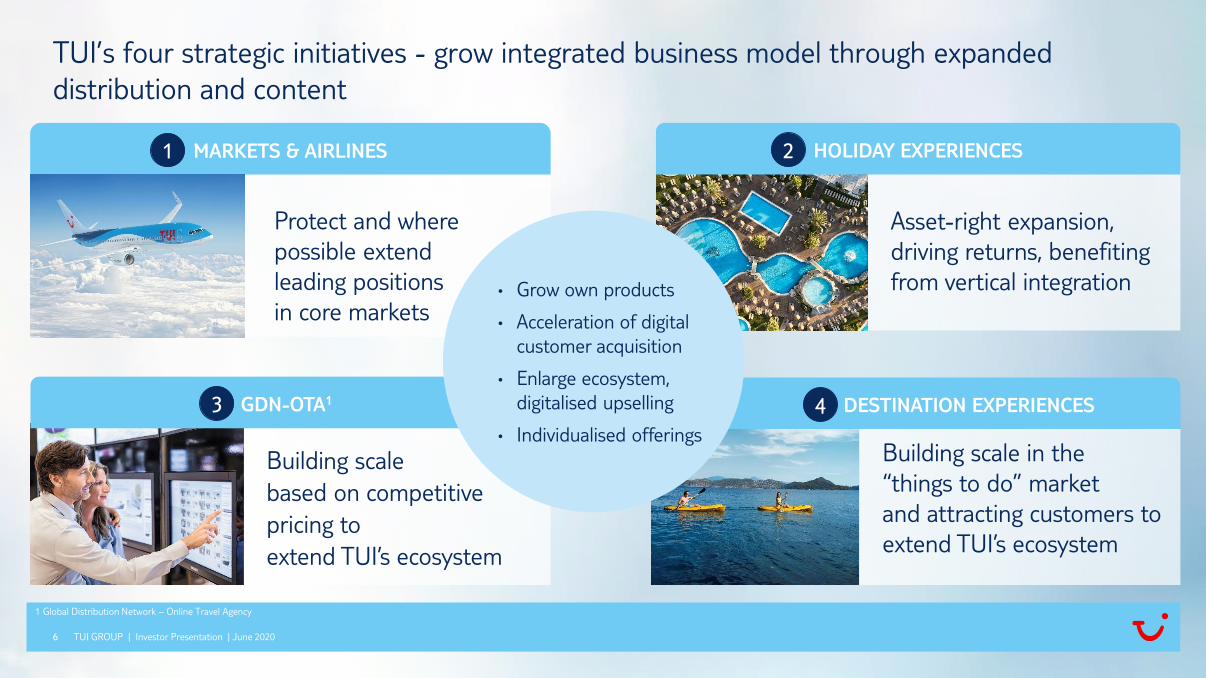
TUI’s four strategic initiatives - grow integrated business model through expanded
distribution and content
TUI GROUP | Investor Presentation | June 2020
1 Global Distribution Network – Online Travel Agency
Building scale
based on competitive
pricing to
extend TUI’s ecosystem
MARKETS & AIRLINES1
Asset-right expansion,
driving returns, benefiting
from vertical integration
DESTINATION EXPERIENCESGDN-OTA1
• Grow own products
• Acceleration of digital
customer acquisition
• Enlarge ecosystem,
digitalised upselling
• Individualised offerings
HOLIDAY EXPERIENCES
3
2
4
Building scale in the
“things to do” market
and attracting customers to
extend TUI’s ecosystem
Protect and where
possible extend
leading positions
in core markets
7
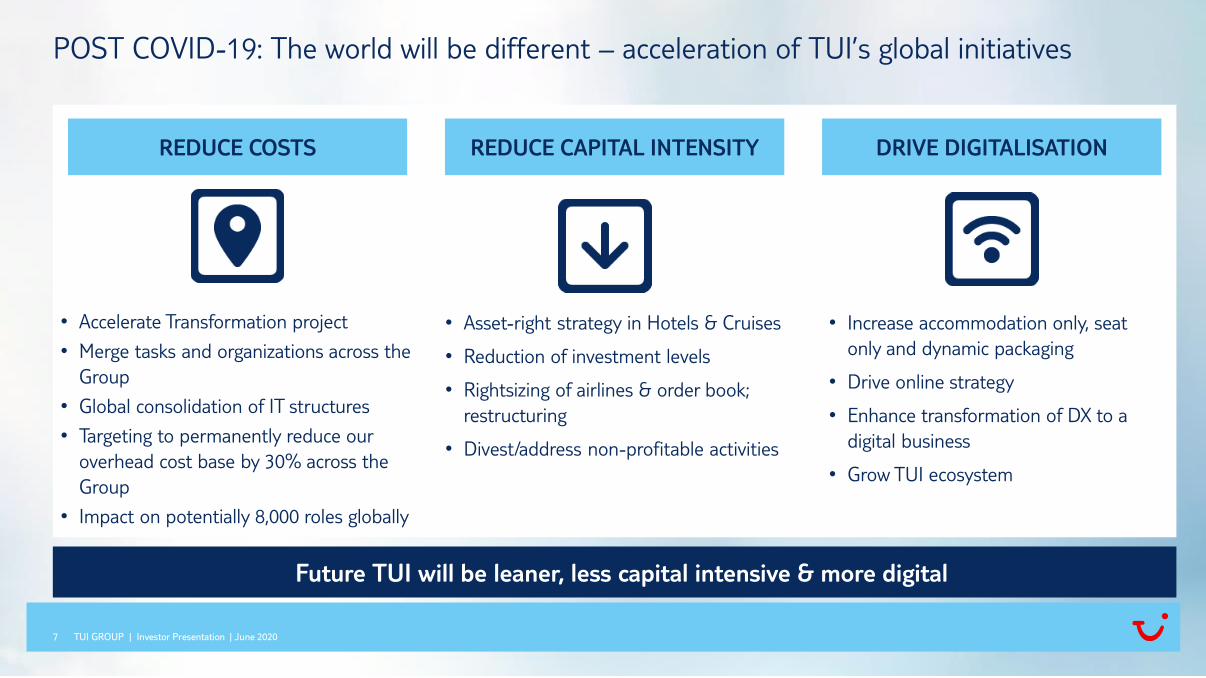
POST COVID-19: The world will be different – acceleration of TUI’s global initiatives
TUI GROUP | Investor Presentation | June 2020
DRIVE DIGITALISATIONREDUCE COSTS
• Increase accommodation only, seat
only and dynamic packaging
• Drive online strategy
• Enhance transformation of DX to a
digital business
• Grow TUI ecosystem
• Accelerate Transformation project
• Merge tasks and organizations across the
Group
• Global consolidation of IT structures
• Targeting to permanently reduce our
overhead cost base by 30% across the
Group
• Impact on potentially 8,000 roles globally
REDUCE CAPITAL INTENSITY
• Asset-right strategy in Hotels & Cruises
• Reduction of investment levels
• Rightsizing of airlines & order book;
restructuring
• Divest/address non-profitable activities
Future TUI will be leaner, less capital intensive & more digital

TUI GROUP | Investor Presentation | June 2020
COVID-19 UPDATE
9
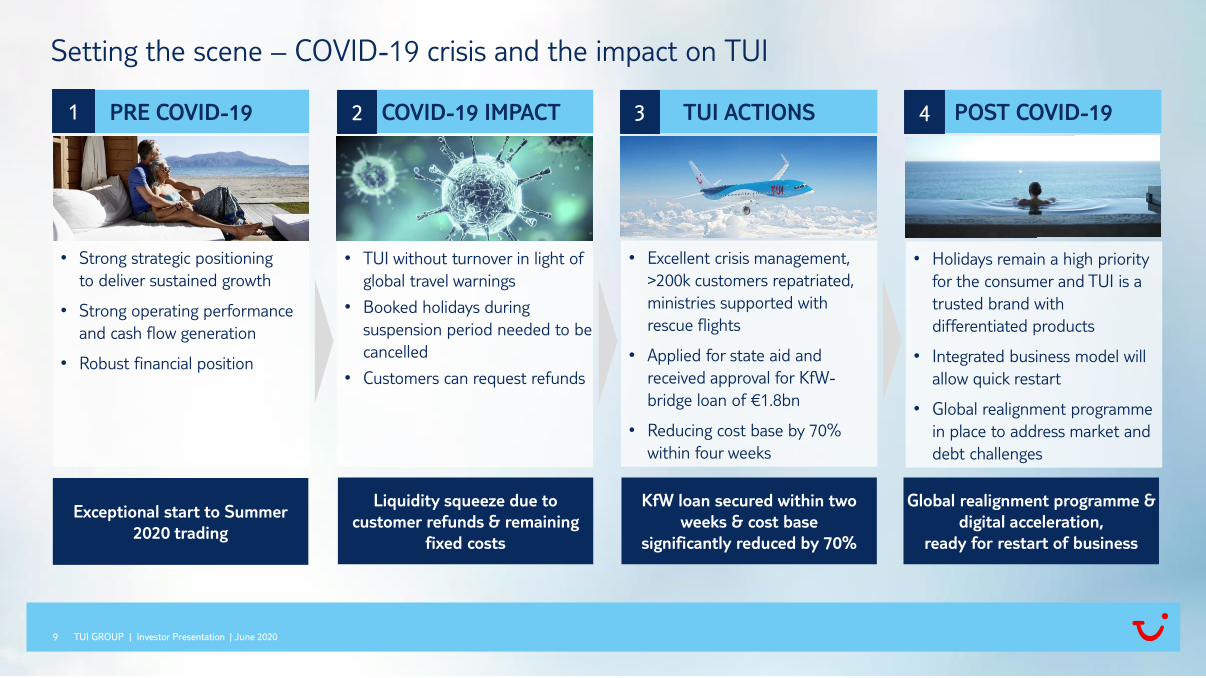
Setting the scene – COVID-19 crisis and the impact on TUI
TUI GROUP | Investor Presentation | June 2020
PRE COVID-19
• Strong strategic positioning
to deliver sustained growth
• Strong operating performance
and cash flow generation
• Robust financial position
COVID-19 IMPACT TUI ACTIONS POST COVID-19
• TUI without turnover in light of
global travel warnings
• Booked holidays during
suspension period needed to be
cancelled
• Customers can request refunds
• Excellent crisis management,
>200k customers repatriated,
ministries supported with
rescue flights
• Applied for state aid and
received approval for KfW-
bridge loan of €1.8bn
• Reducing cost base by 70%
within four weeks
• Holidays remain a high priority
for the consumer and TUI is a
trusted brand with
differentiated products
• Integrated business model will
allow quick restart
• Global realignment programme
in place to address market and
debt challenges
•
1 2 3 4
Exceptional start to Summer
2020 trading
Liquidity squeeze due to
customer refunds & remaining
fixed costs
KfW loan secured within two
weeks & cost base
significantly reduced by 70%
Global realignment programme &
digital acceleration,
ready for restart of business
10
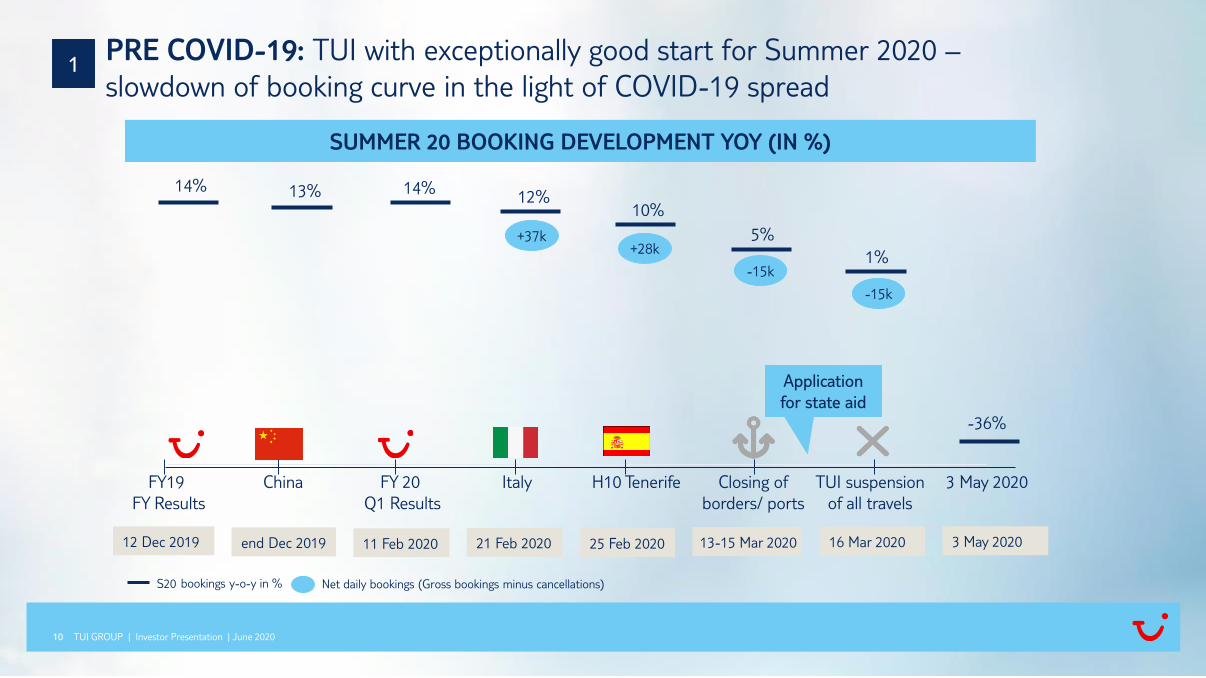
PRE COVID-19: TUI with exceptionally good start for Summer 2020 –
slowdown of booking curve in the light of COVID-19 spread
TUI GROUP | Investor Presentation | June 2020
SUMMER 20 BOOKING DEVELOPMENT YOY (IN %)
FY19
FY Results
TUI suspension
of all travels
China ItalyFY 20
Q1 Results
H10 Tenerife Closing of
borders/ ports
3 May 2020
12 Dec 2019 end Dec 2019 21 Feb 2020 25 Feb 2020 13-15 Mar 2020 16 Mar 202011 Feb 2020 3 May 2020
+37k+28k
-15k
Net daily bookings (Gross bookings minus cancellations)
1
-15k
-36%
14% 13% 14%12%
10%
5%
1%
S20 bookings y-o-y in %
Application
for state aid
11
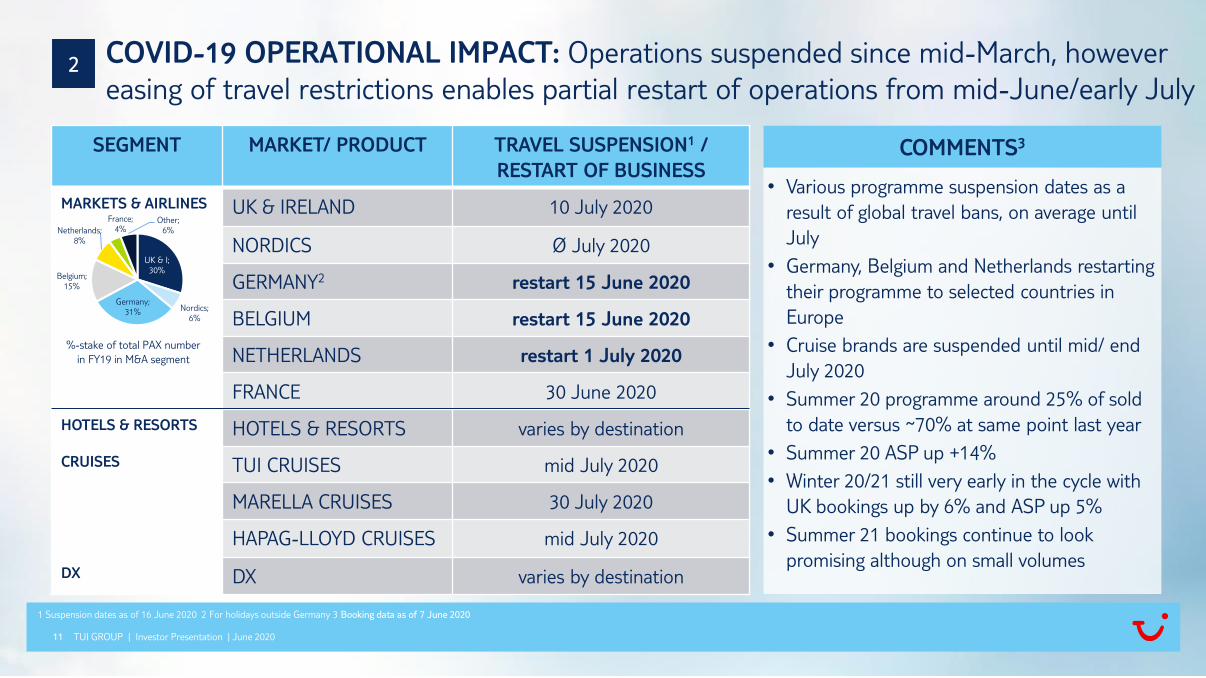
COVID-19 OPERATIONAL IMPACT: Operations suspended since mid-March, however
easing of travel restrictions enables partial restart of operations from mid-June/early July
TUI GROUP | Investor Presentation | June 2020
• Various programme suspension dates as a
result of global travel bans, on average until
July
• Germany, Belgium and Netherlands restarting
their programme to selected countries in
Europe
• Cruise brands are suspended until mid/ end
July 2020
• Summer 20 programme around 25% of sold
to date versus ~70% at same point last year
• Summer 20 ASP up +14%
• Winter 20/21 still very early in the cycle with
UK bookings up by 6% and ASP up 5%
• Summer 21 bookings continue to look
promising although on small volumes
COMMENTS3SEGMENT MARKET/ PRODUCT TRAVEL SUSPENSION1 /
RESTART OF BUSINESS
MARKETS & AIRLINES UK & IRELAND 10 July 2020
NORDICS Ø July 2020
GERMANY2 restart 15 June 2020
BELGIUM restart 15 June 2020
NETHERLANDS restart 1 July 2020
FRANCE 30 June 2020
HOTELS & RESORTS HOTELS & RESORTS varies by destination
CRUISES TUI CRUISES mid July 2020
MARELLA CRUISES 30 July 2020
HAPAG-LLOYD CRUISES mid July 2020
DX DX varies by destination
%-stake of total PAX number
in FY19 in M&A segment
UK & I;
30%
Nordics;
6%
Germany;
31%
Belgium;
15%
Netherlands;
8%
France;
4%Other;
6%
2
1 Suspension dates as of 16 June 2020 2 For holidays outside Germany 3 Booking data as of 7 June 2020
12 TUI GROUP | Investor Presentation | June 2020
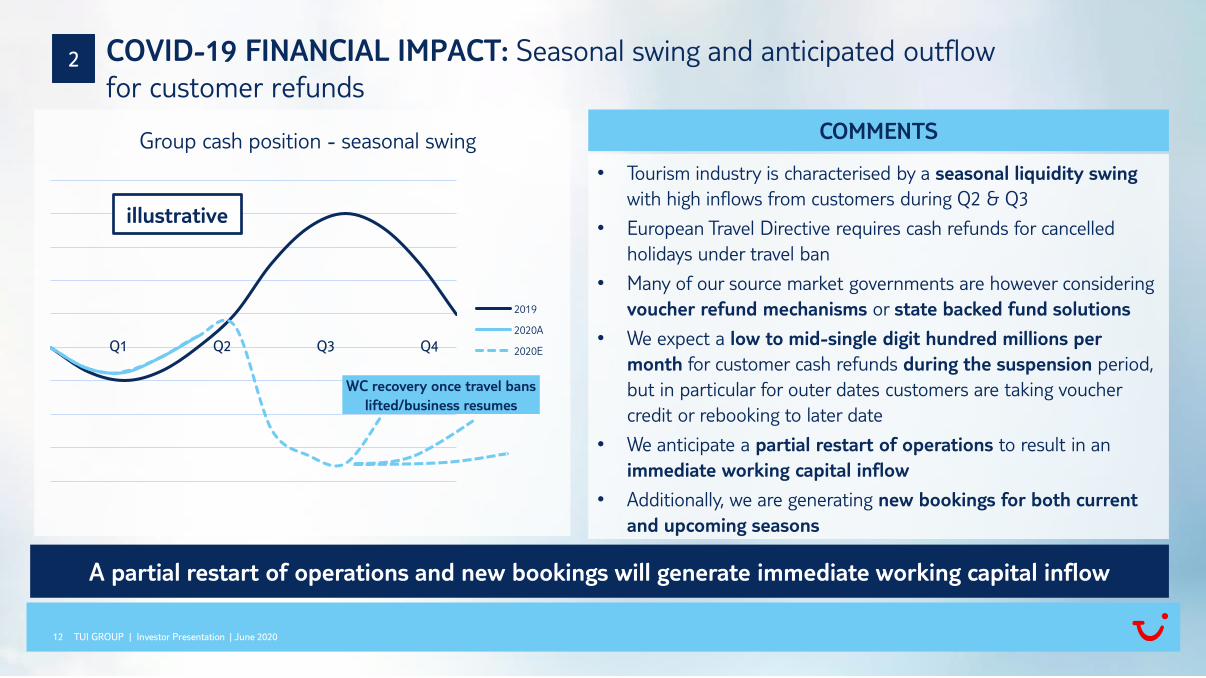
COVID-19 FINANCIAL IMPACT: Seasonal swing and anticipated outflow
for customer refunds
• Tourism industry is characterised by a seasonal liquidity swing
with high inflows from customers during Q2 & Q3
• European Travel Directive requires cash refunds for cancelled
holidays under travel ban
• Many of our source market governments are however considering
voucher refund mechanisms or state backed fund solutions
• We expect a low to mid-single digit hundred millions per
month for customer cash refunds during the suspension period,
but in particular for outer dates customers are taking voucher
credit or rebooking to later date
• We anticipate a partial restart of operations to result in an
immediate working capital inflow
• Additionally, we are generating new bookings for both current
and upcoming seasons
Group cash position - seasonal swing
2019
2020A
2020EQ1 Q2 Q3 Q4
illustrative
2
COMMENTS
WC recovery once travel bans
lifted/business resumes
A partial restart of operations and new bookings will generate immediate working capital inflow
13
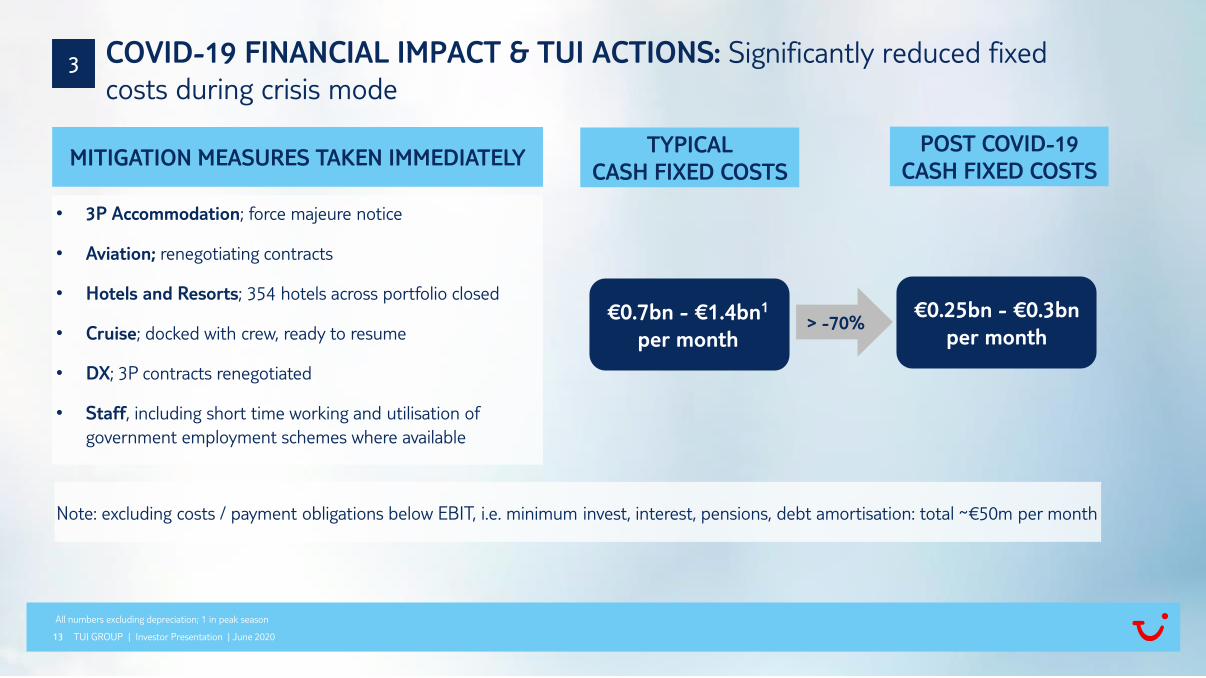
> -70%
COVID-19 FINANCIAL IMPACT & TUI ACTIONS: Significantly reduced fixed
costs during crisis mode
TUI GROUP | Investor Presentation | June 2020
TYPICAL
CASH FIXED COSTS
POST COVID-19
CASH FIXED COSTS
€0.25bn - €0.3bn
per month
MITIGATION MEASURES TAKEN IMMEDIATELY
• 3P Accommodation; force majeure notice
• Aviation; renegotiating contracts
• Hotels and Resorts; 354 hotels across portfolio closed
• Cruise; docked with crew, ready to resume
• DX; 3P contracts renegotiated
• Staff, including short time working and utilisation of
government employment schemes where available
€0.7bn - €1.4bn1
per month
3
All numbers excluding depreciation; 1 in peak season
Note: excluding costs / payment obligations below EBIT, i.e. minimum invest, interest, pensions, debt amortisation: total ~€50m per month
14
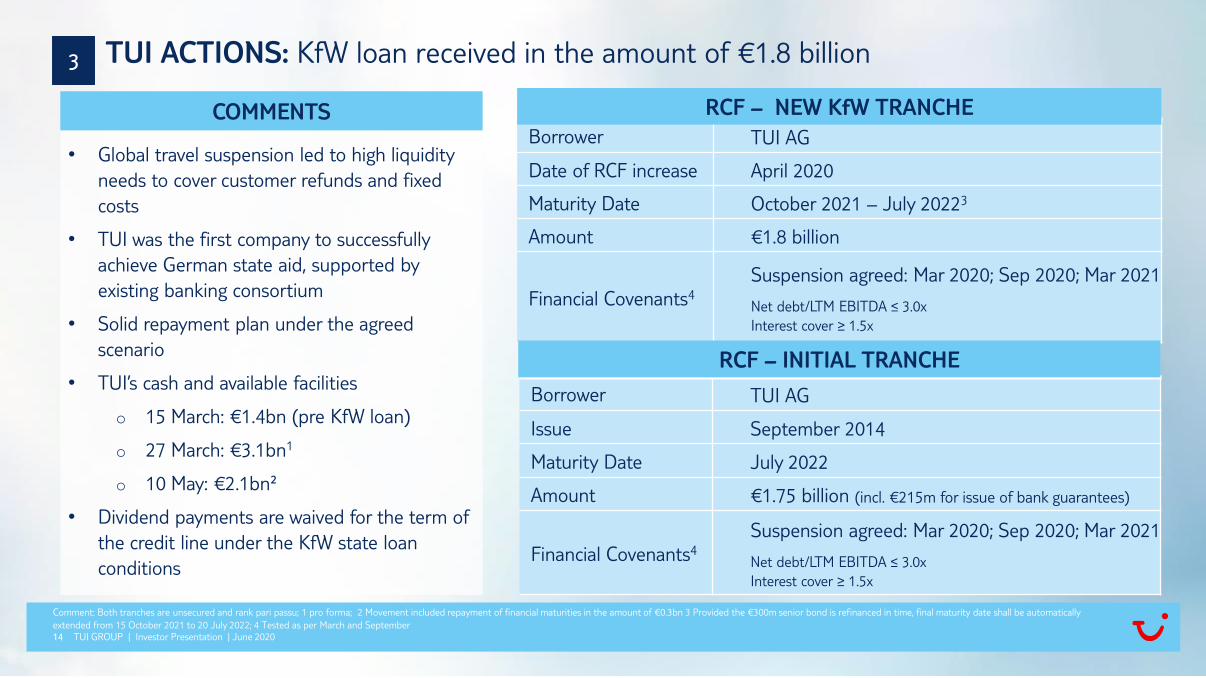
TUI ACTIONS: KfW loan received in the amount of €1.8 billion
TUI GROUP | Investor Presentation | June 2020
• Global travel suspension led to high liquidity
needs to cover customer refunds and fixed
costs
• TUI was the first company to successfully
achieve German state aid, supported by
existing banking consortium
• Solid repayment plan under the agreed
scenario
• TUI’s cash and available facilities
o 15 March: €1.4bn (pre KfW loan)
o 27 March: €3.1bn1
o 10 May: €2.1bn²
• Dividend payments are waived for the term of
the credit line under the KfW state loan
conditions
COMMENTS
Comment: Both tranches are unsecured and rank pari passu; 1 pro forma; 2 Movement included repayment of financial maturities in the amount of €0.3bn 3 Provided the €300m senior bond is refinanced in time, final maturity date shall be automatically
extended from 15 October 2021 to 20 July 2022; 4 Tested as per March and September
Borrower TUI AG
Date of RCF increase April 2020
Maturity Date October 2021 – July 20223
Amount €1.8 billion
Financial Covenants4
Suspension agreed: Mar 2020; Sep 2020; Mar 2021
Net debt/LTM EBITDA ≤ 3.0x
Interest cover ≥ 1.5x
RCF – NEW KfW TRANCHE
Borrower TUI AG
Issue September 2014
Maturity Date July 2022
Amount €1.75 billion (incl. €215m for issue of bank guarantees)
Financial Covenants4
Suspension agreed: Mar 2020; Sep 2020; Mar 2021
Net debt/LTM EBITDA ≤ 3.0x
Interest cover ≥ 1.5x
RCF – INITIAL TRANCHE
3
15
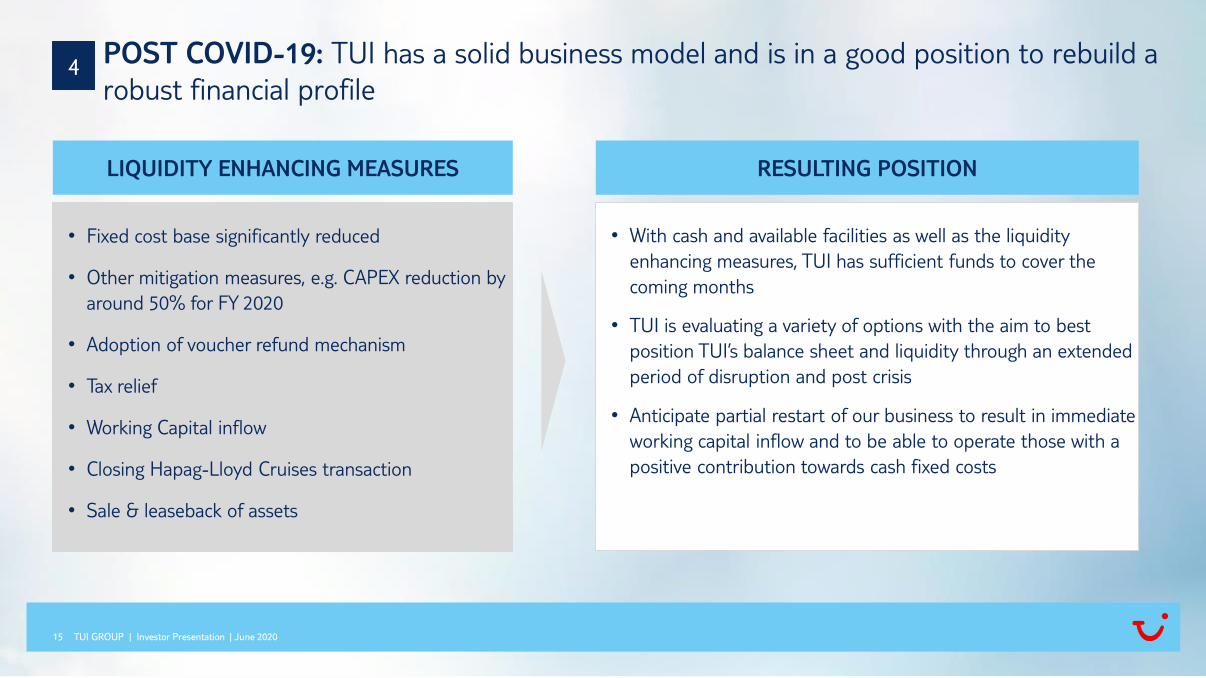
POST COVID-19: TUI has a solid business model and is in a good position to rebuild a
robust financial profile
TUI GROUP | Investor Presentation | June 2020
4
LIQUIDITY ENHANCING MEASURES
• Fixed cost base significantly reduced
• Other mitigation measures, e.g. CAPEX reduction by
around 50% for FY 2020
• Adoption of voucher refund mechanism
• Tax relief
• Working Capital inflow
• Closing Hapag-Lloyd Cruises transaction
• Sale & leaseback of assets
RESULTING POSITION
• With cash and available facilities as well as the liquidity
enhancing measures, TUI has sufficient funds to cover the
coming months
• TUI is evaluating a variety of options with the aim to best
position TUI’s balance sheet and liquidity through an extended
period of disruption and post crisis
• Anticipate partial restart of our business to result in immediate
working capital inflow and to be able to operate those with a
positive contribution towards cash fixed costs
16
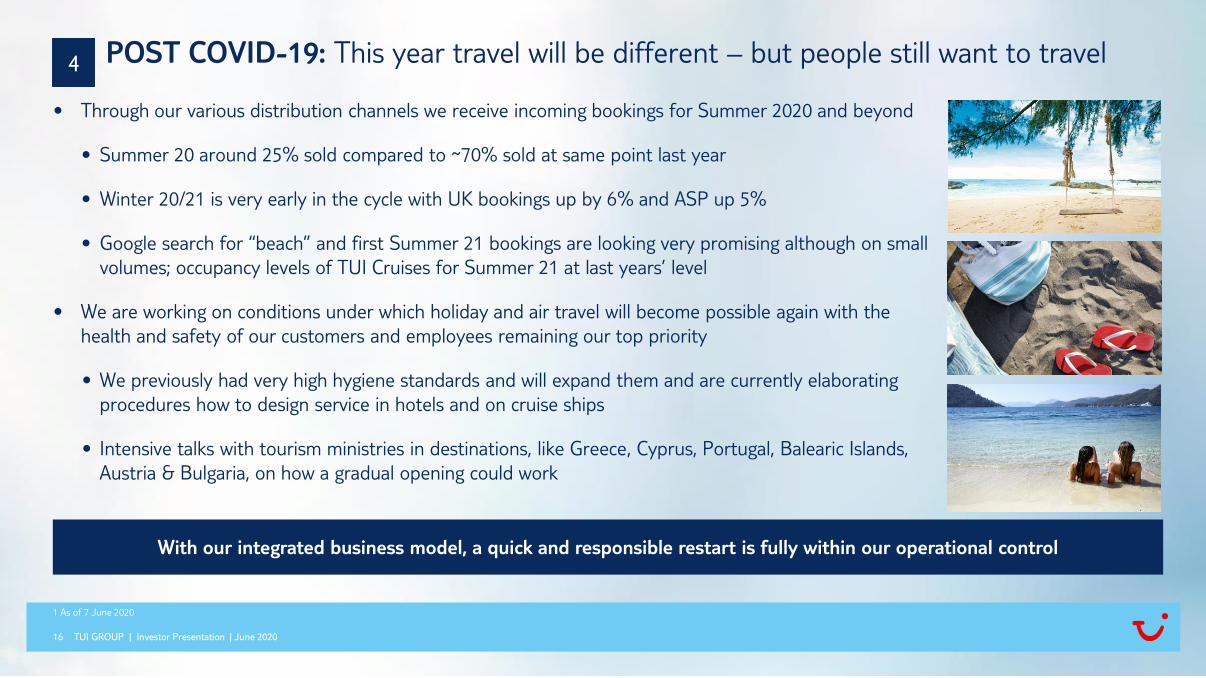
POST COVID-19: This year travel will be different – but people still want to travel
TUI GROUP | Investor Presentation | June 2020
• Through our various distribution channels we receive incoming bookings for Summer 2020 and beyond
• Summer 20 around 25% sold compared to ~70% sold at same point last year
• Winter 20/21 is very early in the cycle with UK bookings up by 6% and ASP up 5%
• Google search for “beach” and first Summer 21 bookings are looking very promising although on small
volumes; occupancy levels of TUI Cruises for Summer 21 at last years’ level
• We are working on conditions under which holiday and air travel will become possible again with the
health and safety of our customers and employees remaining our top priority
• We previously had very high hygiene standards and will expand them and are currently elaborating
procedures how to design service in hotels and on cruise ships
• Intensive talks with tourism ministries in destinations, like Greece, Cyprus, Portugal, Balearic Islands,
Austria & Bulgaria, on how a gradual opening could work
4
With our integrated business model, a quick and responsible restart is fully within our operational control
1 As of 7 June 2020
Flights In Destination
Cruises
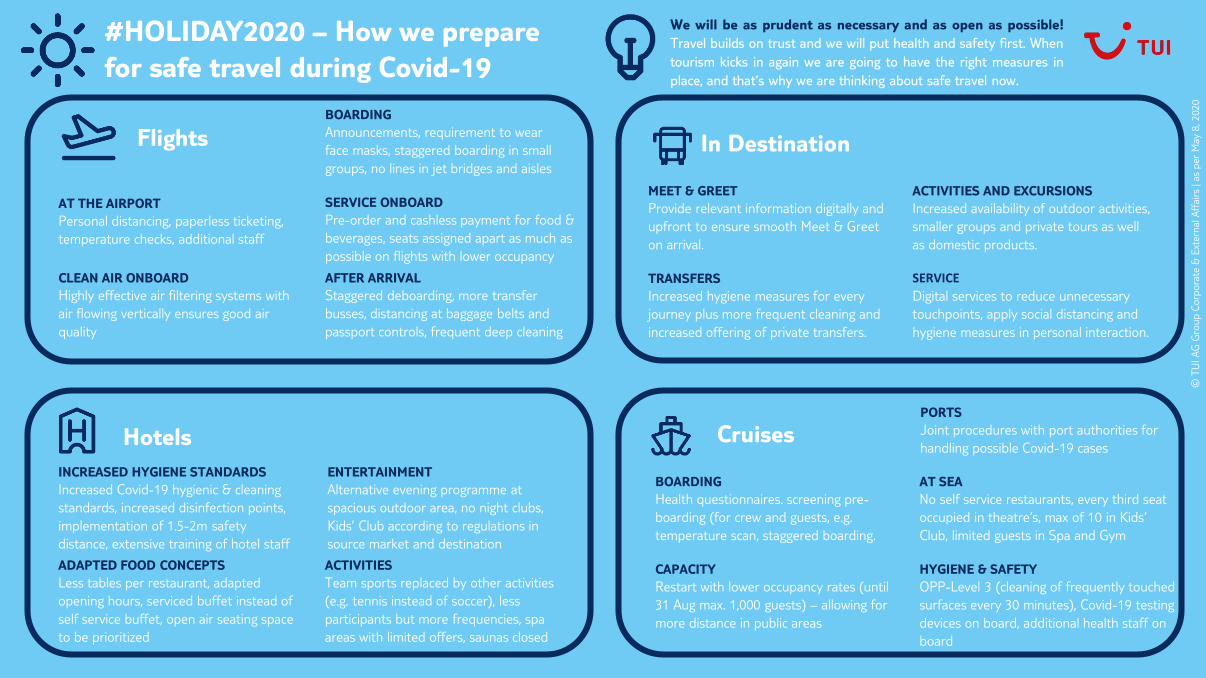
#HOLIDAY2020 – How we prepare
for safe travel during Covid-19
MEET & GREET
Provide relevant information digitally and
upfront to ensure smooth Meet & Greet
on arrival.
TRANSFERS
Increased hygiene measures for every
journey plus more frequent cleaning and
increased offering of private transfers.
ACTIVITIES AND EXCURSIONS
Increased availability of outdoor activities,
smaller groups and private tours as well
as domestic products.
SERVICE
Digital services to reduce unnecessary
touchpoints, apply social distancing and
hygiene measures in personal interaction.
BOARDING
Health questionnaires. screening pre-
boarding (for crew and guests, e.g.
temperature scan, staggered boarding.
CAPACITY
Restart with lower occupancy rates (until
31 Aug max. 1,000 guests) – allowing for
more distance in public areas
AT SEA
No self service restaurants, every third seat
occupied in theatre‘s, max of 10 in Kids‘
Club, limited guests in Spa and Gym
HYGIENE & SAFETY
OPP-Level 3 (cleaning of frequently touched
surfaces every 30 minutes), Covid-19 testing
devices on board, additional health staff on
board
We will be as prudent as necessary and as open as possible!
Travel builds on trust and we will put health and safety first. When
tourism kicks in again we are going to have the right measures in
place, and that‘s why we are thinking about safe travel now.
PORTS
Joint procedures with port authorities for
handling possible Covid-19 casesHotels
INCREASED HYGIENE STANDARDS
Increased Covid-19 hygienic & cleaning
standards, increased disinfection points,
implementation of 1.5-2m safety
distance, extensive training of hotel staff
ADAPTED FOOD CONCEPTS
Less tables per restaurant, adapted
opening hours, serviced buffet instead of
self service buffet, open air seating space
to be prioritized
ENTERTAINMENT
Alternative evening programme at
spacious outdoor area, no night clubs,
Kids’ Club according to regulations in
source market and destination
ACTIVITIES
Team sports replaced by other activities
(e.g. tennis instead of soccer), less
participants but more frequencies, spa
areas with limited offers, saunas closed
© T
UI A
G G
roup C
orp
ora
te &
Ext
ern
alA
ffair
s| as
per
May
8, 2020
AT THE AIRPORT
Personal distancing, paperless ticketing,
temperature checks, additional staff
CLEAN AIR ONBOARD
Highly effective air filtering systems with
air flowing vertically ensures good air
quality
BOARDING
Announcements, requirement to wear
face masks, staggered boarding in small
groups, no lines in jet bridges and aisles
AFTER ARRIVAL
Staggered deboarding, more transfer
busses, distancing at baggage belts and
passport controls, frequent deep cleaning
SERVICE ONBOARD
Pre-order and cashless payment for food &
beverages, seats assigned apart as much as
possible on flights with lower occupancy

FY20 H1 Results
TUI GROUP | Investor Presentation | June 2020

19
H1 performance: Strong operating result for 5M, March acutely impacted by COVID-19
travel suspension
TUI GROUP | Investor Presentation | June 2020
• 5M turnover up 6% at constant currency reflecting
strength of trading pre COVID-19 impact
• Strong start into FY20 – 5M underlying EBIT (excl. Boeing
/ one-offs) improved by €62m1 versus prior year
• H1 underlying EBIT declined by €512m1
• March lost contribution and costs incurred as a result of
COVID-19 travel suspension combined with 737 MAX
costs totals €470m
• FY20 guidance withdrawn on 15 March 2020 in view of
the current unpredictable situation
5M YTD TURNOVER
€6.0bn1
+6%1
5M YTD UND. EBIT
-€240m1,2
+21%1,2
H1 TURNOVER
€6.6bn1
-1%1
H1 UND. EBIT
-€813m1
-€512m1 vs. PY
Figures based on a pro-forma calculation according to IAS 17 | 1 At constant currency | 2 Excluding one-off impact from opex in digital platforms, PY Hedging gain of €29m and Boeing 737 MAX impact of €66m
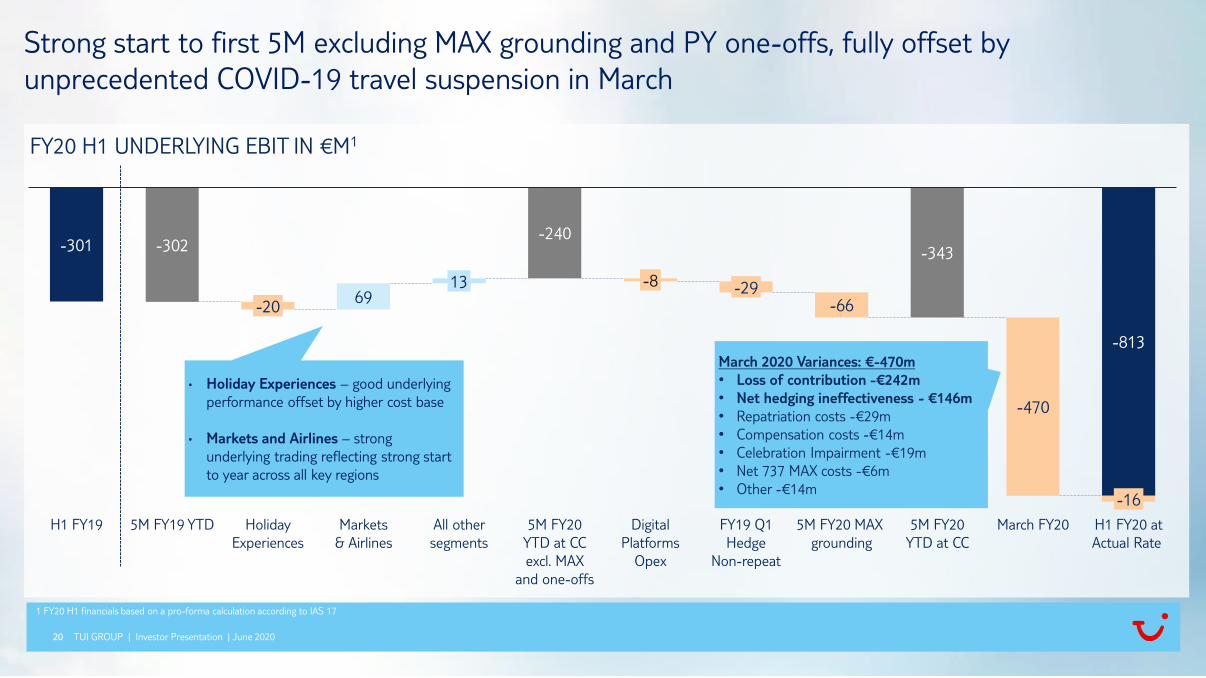
20 TUI GROUP | Investor Presentation | June 2020
FY20 H1 UNDERLYING EBIT IN €M1
-301 -302-240
-343
-66
-470
-813
-29
H1 FY19
13 -8
5M FY19 YTD
-20
All other
segments
69
Holiday
Experiences
Markets
& Airlines
5M FY20
YTD at CC
excl. MAX
and one-offs
Digital
Platforms
Opex
FY19 Q1
Hedge
Non-repeat
5M FY20 MAX
grounding
5M FY20
YTD at CC
March FY20
-16
H1 FY20 at
Actual Rate
1 FY20 H1 financials based on a pro-forma calculation according to IAS 17
Strong start to first 5M excluding MAX grounding and PY one-offs, fully offset by
unprecedented COVID-19 travel suspension in March
• Holiday Experiences – good underlying
performance offset by higher cost base
• Markets and Airlines – strong
underlying trading reflecting strong start
to year across all key regions
March 2020 Variances: €-470m
• Loss of contribution -€242m
• Net hedging ineffectiveness - €146m
• Repatriation costs -€29m
• Compensation costs -€14m
• Celebration Impairment -€19m
• Net 737 MAX costs -€6m
• Other -€14m
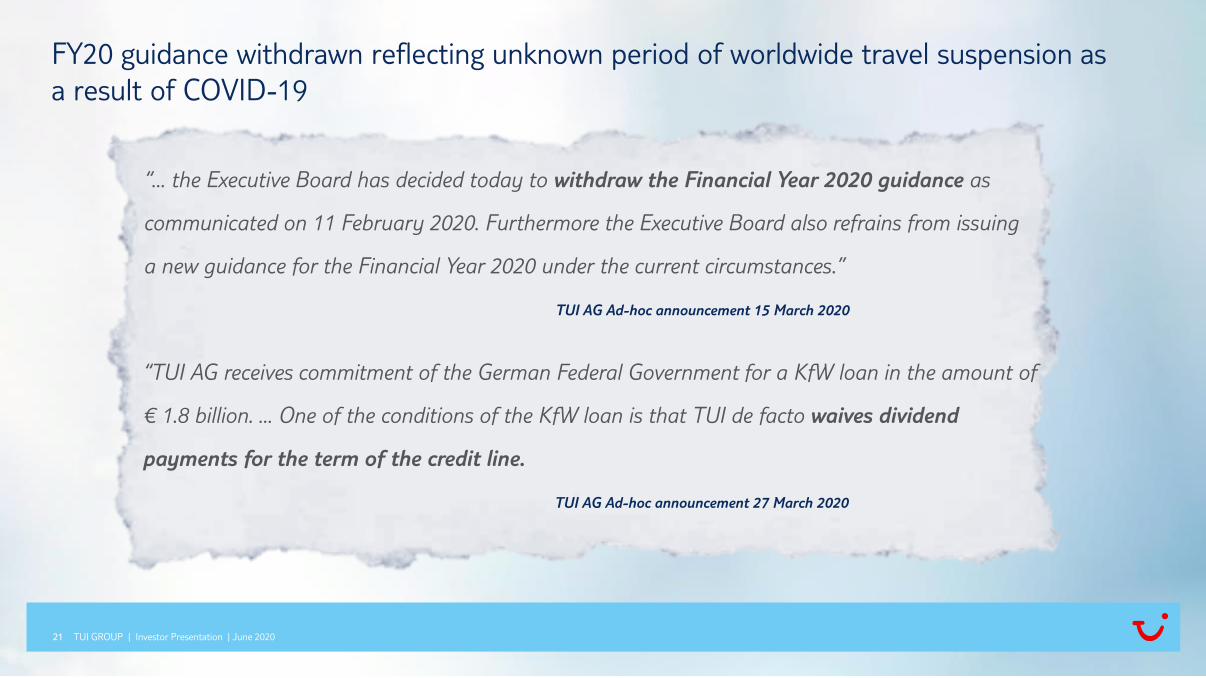
21
FY20 guidance withdrawn reflecting unknown period of worldwide travel suspension as
a result of COVID-19
TUI GROUP | Investor Presentation | June 2020
“… the Executive Board has decided today to withdraw the Financial Year 2020 guidance as
communicated on 11 February 2020. Furthermore the Executive Board also refrains from issuing
a new guidance for the Financial Year 2020 under the current circumstances.”
TUI AG Ad-hoc announcement 15 March 2020
“TUI AG receives commitment of the German Federal Government for a KfW loan in the amount of
€ 1.8 billion. … One of the conditions of the KfW loan is that TUI de facto waives dividend
payments for the term of the credit line.
TUI AG Ad-hoc announcement 27 March 2020

SUMMARY
TUI GROUP | Investor Presentation | June 2020
23
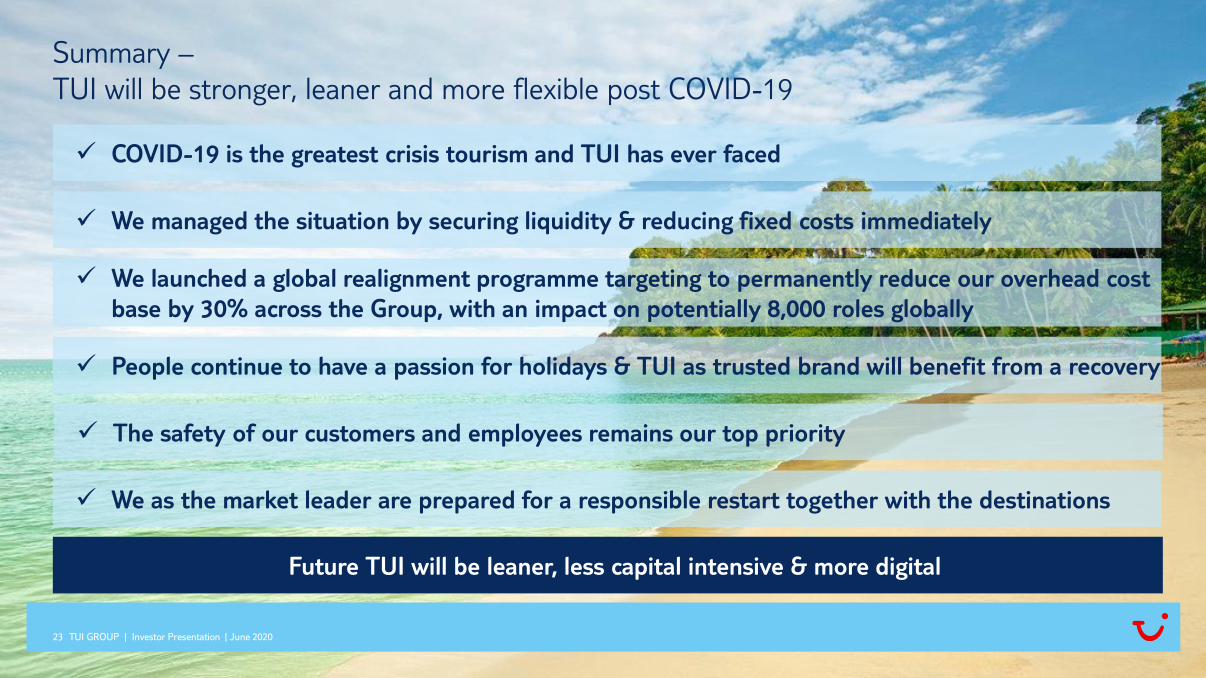
Summary –
TUI will be stronger, leaner and more flexible post COVID-19
TUI GROUP | Investor Presentation | June 2020
COVID-19 is the greatest crisis tourism and TUI has ever faced
We managed the situation by securing liquidity & reducing fixed costs immediately
We launched a global realignment programme targeting to permanently reduce our overhead cost
base by 30% across the Group, with an impact on potentially 8,000 roles globally
People continue to have a passion for holidays & TUI as trusted brand will benefit from a recovery
We as the market leader are prepared for a responsible restart together with the destinations
Future TUI will be leaner, less capital intensive & more digital
The safety of our customers and employees remains our top priority
TUI GROUP | Investor Presentation | June 2020
APPENDIX – FY20 H1 RESULTS
25
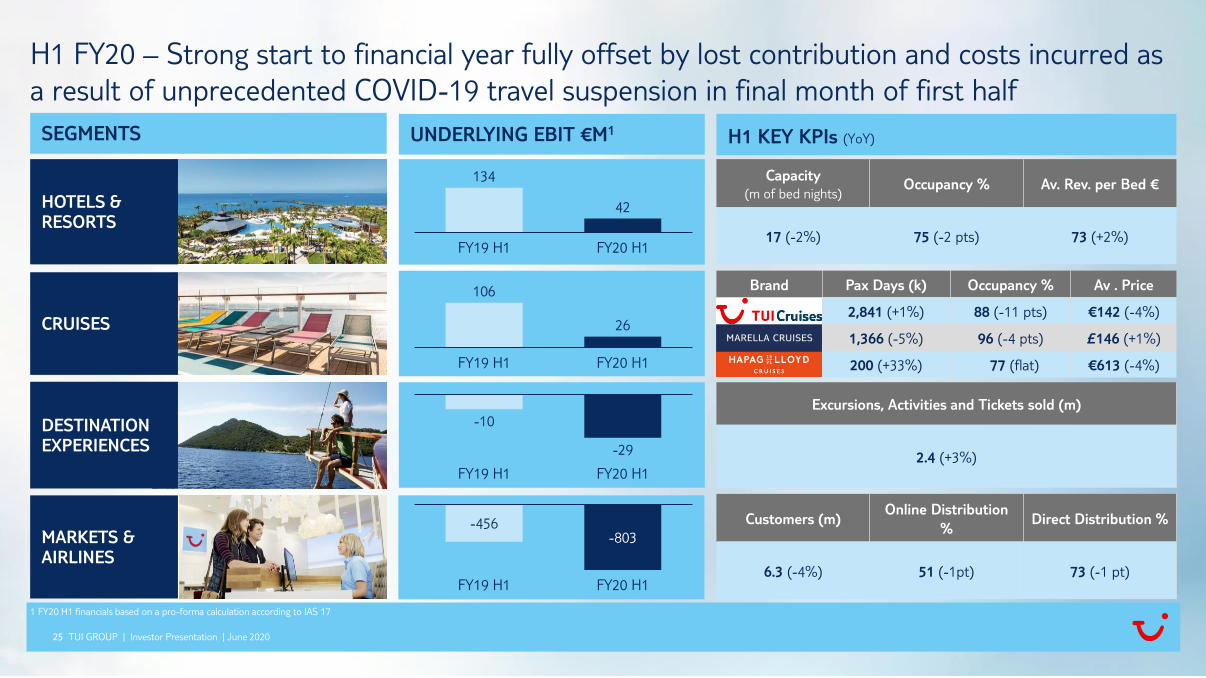
H1 FY20 – Strong start to financial year fully offset by lost contribution and costs incurred as
a result of unprecedented COVID-19 travel suspension in final month of first half
TUI GROUP | Investor Presentation | June 2020
UNDERLYING EBIT €M1 H1 KEY KPIs (YoY)
HOTELS & RESORTS
DESTINATION EXPERIENCES
CRUISES
MARKETS & AIRLINES
Capacity
(m of bed nights)Occupancy % Av. Rev. per Bed €
17 (-2%) 75 (-2 pts) 73 (+2%)
Brand Pax Days (k) Occupancy % Av . Price
2,841 (+1%) 88 (-11 pts) €142 (-4%)
Marella 1,366 (-5%) 96 (-4 pts) £146 (+1%)
HPLC 200 (+33%) 77 (flat) €613 (-4%)
Excursions, Activities and Tickets sold (m)
2.4 (+3%)
Customers (m)Online Distribution
%Direct Distribution %
6.3 (-4%) 51 (-1pt) 73 (-1 pt)
1 FY20 H1 financials based on a pro-forma calculation according to IAS 17
SEGMENTS
134
42
FY20 H1FY19 H1
106
26
FY20 H1FY19 H1
-10
-29
FY19 H1 FY20 H1
-456-803
FY19 H1 FY20 H1
26
1 FY20 H1 financials based on a pro-forma calculation according to IAS 17
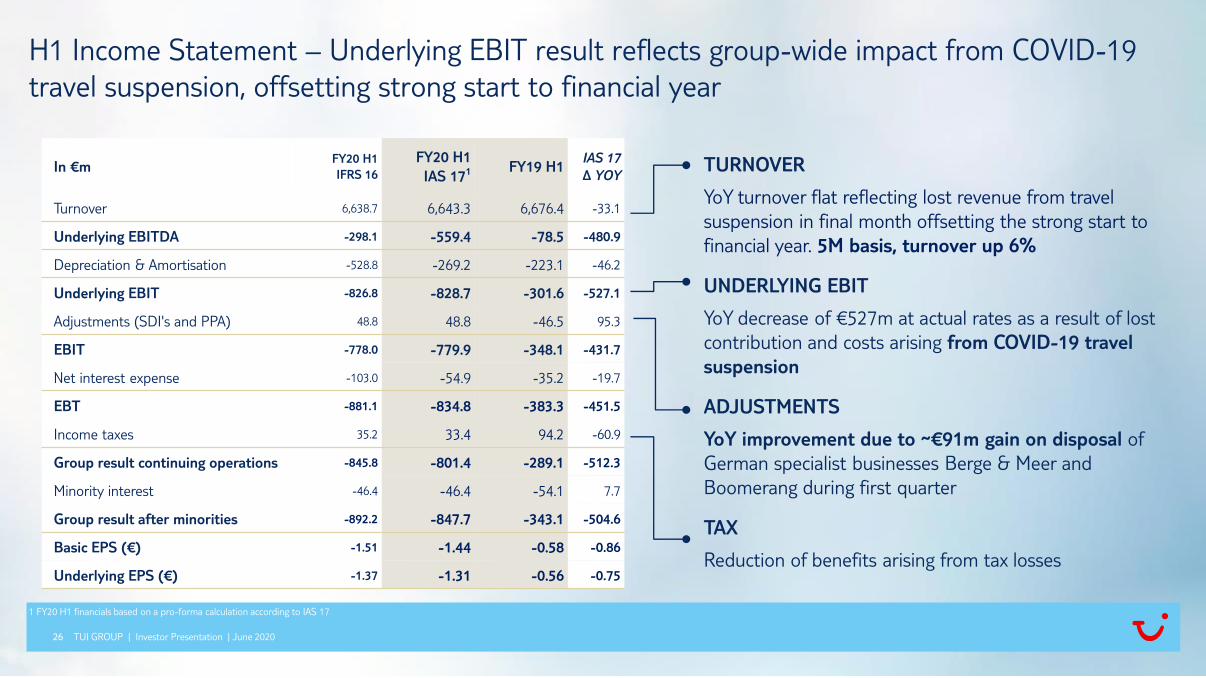
In €mFY20 H1
IFRS 16
FY20 H1
IAS 171 FY19 H1IAS 17
∆ YOY
Turnover 6,638.7 6,643.3 6,676.4 -33.1
Underlying EBITDA -298.1 -559.4 -78.5 -480.9
Depreciation & Amortisation -528.8 -269.2 -223.1 -46.2
Underlying EBIT -826.8 -828.7 -301.6 -527.1
Adjustments (SDI's and PPA) 48.8 48.8 -46.5 95.3
EBIT -778.0 -779.9 -348.1 -431.7
Net interest expense -103.0 -54.9 -35.2 -19.7
EBT -881.1 -834.8 -383.3 -451.5
Income taxes 35.2 33.4 94.2 -60.9
Group result continuing operations -845.8 -801.4 -289.1 -512.3
Minority interest -46.4 -46.4 -54.1 7.7
Group result after minorities -892.2 -847.7 -343.1 -504.6
Basic EPS (€) -1.51 -1.44 -0.58 -0.86
Underlying EPS (€) -1.37 -1.31 -0.56 -0.75
H1 Income Statement – Underlying EBIT result reflects group-wide impact from COVID-19
travel suspension, offsetting strong start to financial year
TUI GROUP | Investor Presentation | June 2020
TURNOVER
YoY turnover flat reflecting lost revenue from travel
suspension in final month offsetting the strong start to
financial year. 5M basis, turnover up 6%
UNDERLYING EBIT
YoY decrease of €527m at actual rates as a result of lost
contribution and costs arising from COVID-19 travel
suspension
ADJUSTMENTS
YoY improvement due to ~€91m gain on disposal of
German specialist businesses Berge & Meer and
Boomerang during first quarter
TAX
Reduction of benefits arising from tax losses
27
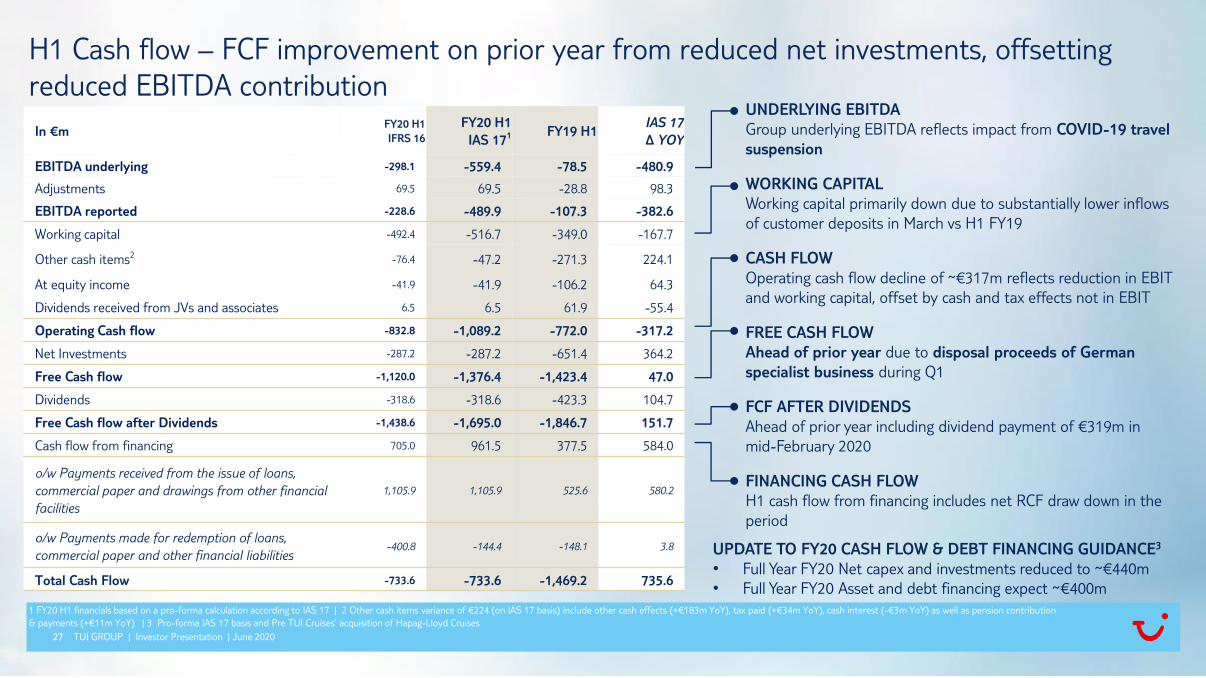
1 FY20 H1 financials based on a pro-forma calculation according to IAS 17 | 2 Other cash items variance of €224 (on IAS 17 basis) include other cash effects (+€183m YoY), tax paid (+€34m YoY), cash interest (-€3m YoY) as well as pension contribution
& payments (+€11m YoY) | 3 Pro-forma IAS 17 basis and Pre TUI Cruises’ acquisition of Hapag-Lloyd Cruises
TUI GROUP | Investor Presentation | June 2020
H1 Cash flow – FCF improvement on prior year from reduced net investments, offsetting
reduced EBITDA contributionUNDERLYING EBITDA
Group underlying EBITDA reflects impact from COVID-19 travel
suspension
WORKING CAPITAL
Working capital primarily down due to substantially lower inflows
of customer deposits in March vs H1 FY19
CASH FLOW
Operating cash flow decline of ~€317m reflects reduction in EBIT
and working capital, offset by cash and tax effects not in EBIT
FREE CASH FLOW
Ahead of prior year due to disposal proceeds of German
specialist business during Q1
FCF AFTER DIVIDENDS
Ahead of prior year including dividend payment of €319m in
mid-February 2020
FINANCING CASH FLOW
H1 cash flow from financing includes net RCF draw down in the
period
In €mFY20 H1
IFRS 16
FY20 H1
IAS 171 FY19 H1IAS 17
∆ YOY
EBITDA underlying -298.1 -559.4 -78.5 -480.9
Adjustments 69.5 69.5 -28.8 98.3
EBITDA reported -228.6 -489.9 -107.3 -382.6
Working capital -492.4 -516.7 -349.0 -167.7
Other cash items2-76.4 -47.2 -271.3 224.1
At equity income -41.9 -41.9 -106.2 64.3
Dividends received from JVs and associates 6.5 6.5 61.9 -55.4
Operating Cash flow -832.8 -1,089.2 -772.0 -317.2
Net Investments -287.2 -287.2 -651.4 364.2
Free Cash flow -1,120.0 -1,376.4 -1,423.4 47.0
Dividends -318.6 -318.6 -423.3 104.7
Free Cash flow after Dividends -1,438.6 -1,695.0 -1,846.7 151.7
Cash flow from financing 705.0 961.5 377.5 584.0
o/w Payments received from the issue of loans,
commercial paper and drawings from other financial
facilities
1,105.9 1,105.9 525.6 580.2
o/w Payments made for redemption of loans,
commercial paper and other financial liabilities-400.8 -144.4 -148.1 3.8
Total Cash Flow -733.6 -733.6 -1,469.2 735.6
UPDATE TO FY20 CASH FLOW & DEBT FINANCING GUIDANCE3
• Full Year FY20 Net capex and investments reduced to ~€440m
• Full Year FY20 Asset and debt financing expect ~€400m
28
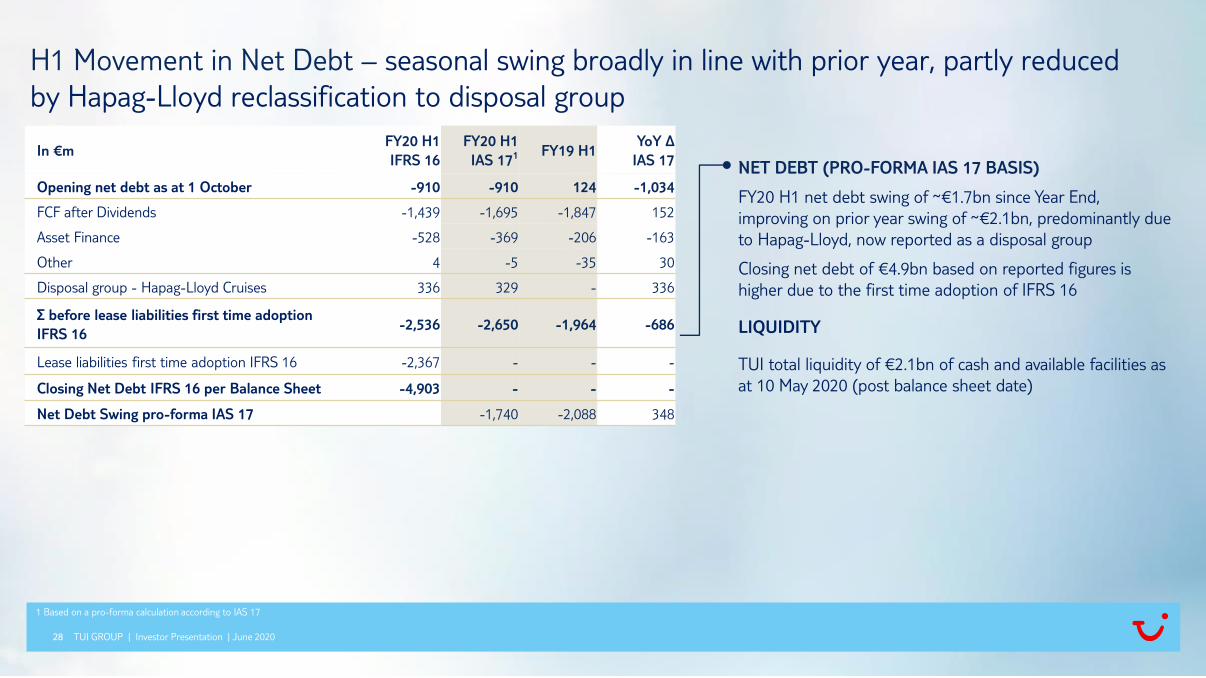
In €mFY20 H1
IFRS 16
FY20 H1
IAS 171 FY19 H1YoY ∆
IAS 17
Opening net debt as at 1 October -910 -910 124 -1,034
FCF after Dividends -1,439 -1,695 -1,847 152
Asset Finance -528 -369 -206 -163
Other 4 -5 -35 30
Disposal group - Hapag-Lloyd Cruises 336 329 - 336
∑ before lease liabilities first time adoption
IFRS 16-2,536 -2,650 -1,964 -686
Lease liabilities first time adoption IFRS 16 -2,367 - - -
Closing Net Debt IFRS 16 per Balance Sheet -4,903 - - -
Net Debt Swing pro-forma IAS 17 -1,740 -2,088 348
H1 Movement in Net Debt – seasonal swing broadly in line with prior year, partly reduced
by Hapag-Lloyd reclassification to disposal group
TUI GROUP | Investor Presentation | June 2020
1 Based on a pro-forma calculation according to IAS 17
NET DEBT (PRO-FORMA IAS 17 BASIS)
FY20 H1 net debt swing of ~€1.7bn since Year End,
improving on prior year swing of ~€2.1bn, predominantly due
to Hapag-Lloyd, now reported as a disposal group
Closing net debt of €4.9bn based on reported figures is
higher due to the first time adoption of IFRS 16
LIQUIDITY
TUI total liquidity of €2.1bn of cash and available facilities as
at 10 May 2020 (post balance sheet date)
29
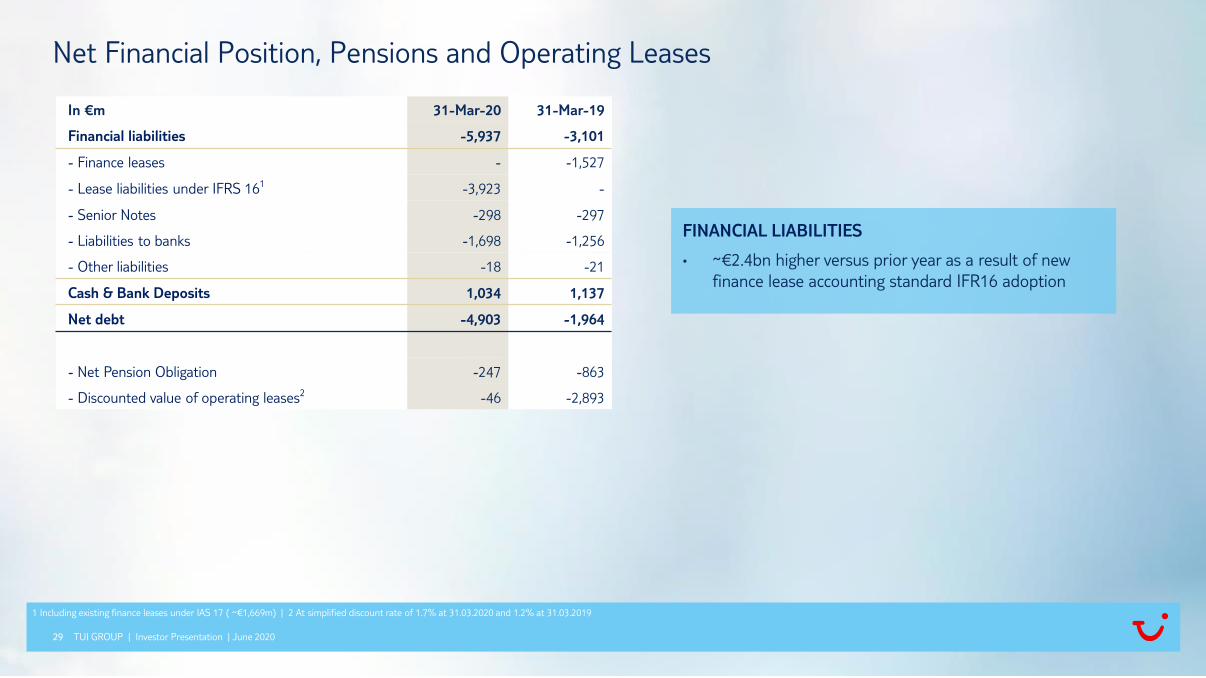
In €m 31-Mar-20 31-Mar-19
Financial liabilities -5,937 -3,101
- Finance leases - -1,527
- Lease liabilities under IFRS 161 -3,923 -
- Senior Notes -298 -297
- Liabilities to banks -1,698 -1,256
- Other liabilities -18 -21
Cash & Bank Deposits 1,034 1,137
Net debt -4,903 -1,964
- Net Pension Obligation -247 -863
- Discounted value of operating leases2 -46 -2,893
FINANCIAL LIABILITIES
• ~€2.4bn higher versus prior year as a result of new
finance lease accounting standard IFR16 adoption
Net Financial Position, Pensions and Operating Leases
TUI GROUP | Investor Presentation | June 2020
1 Including existing finance leases under IAS 17 ( ~€1,669m) | 2 At simplified discount rate of 1.7% at 31.03.2020 and 1.2% at 31.03.2019

30
In €m FY20 H1 IFRS 16 FY20 H1 IAS 171 FY19 H1 Change vs IAS 17 IAS 17 FXChange vs IAS 17
ex FX
Hotels & Resorts 300.2 300.2 271.0 29.2 2.4 26.8
- Riu 228.4 228.4 200.7 27.7 1.1 26.6
- Robinson 36.2 36.2 42.6 -6.4 0.2 -6.5
- Blue Diamond - - - - - -
- Other 35.5 35.5 27.7 7.8 1.1 6.7
Cruises 481.6 481.6 424.6 57.0 8.1 48.9
- TUI Cruises - - - - - -
- Marella Cruises 288.6 288.6 274.7 13.9 8.1 5.8
- Hapag-Lloyd Cruises 193.0 193.0 149.9 43.1 0.0 43.1
Destination Experiences 300.4 300.4 302.8 -2.4 4.4 -6.8
Holiday Experiences 1,082.2 1,082.2 998.4 83.7 14.9 68.8
- Northern Region 2,187.0 2,189.3 2,123.8 65.5 29.8 35.6
- Central Region 2,209.9 2,210.8 2,224.9 -14.1 5.4 -19.5
- Western Region 1,075.1 1,076.4 1,057.4 19.1 0.2 18.9
Markets & Airlines 5,471.9 5,476.6 5,406.2 70.4 35.4 35.0
All other segments 84.5 84.5 271.8 -187.3 0.0 -187.3
TUI Group 6,638.7 6,643.3 6,676.4 -33.1 50.4 -83.5
FY20 H1 Turnover by Segment
(excludes Intra-Group Turnover and JVs/associates)*
TUI GROUP | Investor Presentation | June 2020
* Table contains rounding effects | 1 FY20 H1 financials based on a pro-forma calculation according to IAS 17

31
In €m FY20 H1 IFRS 16 FY20 H1 IAS 171 FY19 H1 Change vs IAS 17 IAS 17 FXChange vs IAS 17
ex FX
Hotels & Resorts 124.3 101.9 185.1 -83.2 -16.9 -66.3
- Riu 167.0 160.5 178.7 -18.2 1.7 -19.9
- Robinson 12.0 7.8 11.4 -3.6 0.8 -4.4
- Blue Diamond** -0.2 -0.2 17.8 -18.0 0.0 -18.1
- Other -54.5 -66.2 -22.8 -43.4 -19.5 -23.9
Cruises 101.0 100.4 146.5 -46.1 2.3 -48.4
- TUI Cruises** 42.1 42.1 54.0 -11.9 0.0 -11.9
- Marella Cruises 26.3 26.3 62.2 -35.8 2.3 -38.1
- Hapag-Lloyd Cruises 32.6 32.0 30.4 1.6 0.0 1.6
Destination Experiences -15.3 -18.9 -2.6 -16.3 0.4 -16.6
Holiday Experiences 210.0 183.5 329.0 -145.5 -14.2 -131.3
- Northern Region -247.8 -362.5 -134.5 -228.1 -1.6 -226.4
- Central Region -103.5 -153.6 -96.8 -56.8 0.4 -57.2
- Western Region -99.5 -167.3 -130.1 -37.2 0.8 -38.0
Markets & Airlines -450.7 -683.4 -361.4 -322.1 -0.4 -321.7
All other segments -57.4 -59.5 -46.2 -13.3 0.2 -13.5
TUI Group -298.1 -559.4 -78.5 -480.9 -14.4 -466.5
FY20 H1 Underlying EBITDA by Segment*
TUI GROUP | Investor Presentation | June 2020
*Table contains rounding effects | **Equity result | 1 FY20 H1 financials based on a pro-forma calculation according to IAS 17

32
In €m FY20 H1 IFRS 16 FY20 H1 IAS 171 FY19 H1 Change vs IAS 17 IAS 17 FXChange vs IAS 17
ex FX
Hotels & Resorts 24.0 42.1 134.5 -92.4 -16.9 -75.5
- Riu 129.6 128.8 149.6 -20.8 1.6 -22.4
- Robinson -7.1 -7.4 -0.3 -7.1 0.9 -7.9
- Blue Diamond** -0.2 -0.2 17.8 -18.0 0.0 -18.1
- Other -98.3 -79.1 -32.7 -46.4 -19.4 -27.0
Cruises 26.9 26.5 106.4 -80.0 2.1 -82.0
- TUI Cruises** 42.1 42.1 54.0 -11.9 0.0 -11.9
- Marella Cruises -37.4 -37.4 30.2 -67.6 2.1 -69.7
- Hapag-Lloyd Cruises 22.2 21.7 22.2 -0.5 0.0 -0.5
Destination Experiences -28.9 -29.4 -10.4 -19.1 0.3 -19.4
Holiday Experiences 22.1 39.1 230.5 -191.4 -14.5 -176.9
- Northern Region -415.1 -424.8 -183.9 -240.9 -1.9 -239.0
- Central Region -179.5 -183.5 -119.6 -63.9 0.1 -64.1
- Western Region -189.6 -194.6 -152.6 -42.0 0.5 -42.5
Markets & Airlines -784.3 -802.9 -456.1 -346.8 -1.2 -345.6
All other segments -64.6 -64.9 -76.0 11.1 0.4 10.7
TUI Group -826.8 -828.7 -301.6 -527.1 -15.3 -511.8
FY20 H1 Underlying EBIT by Segment*
TUI GROUP | Investor Presentation | June 2020
*Table contains rounding effects | **Equity result | 1 FY20 H1 financials based on a pro-forma calculation according to IAS 17
33
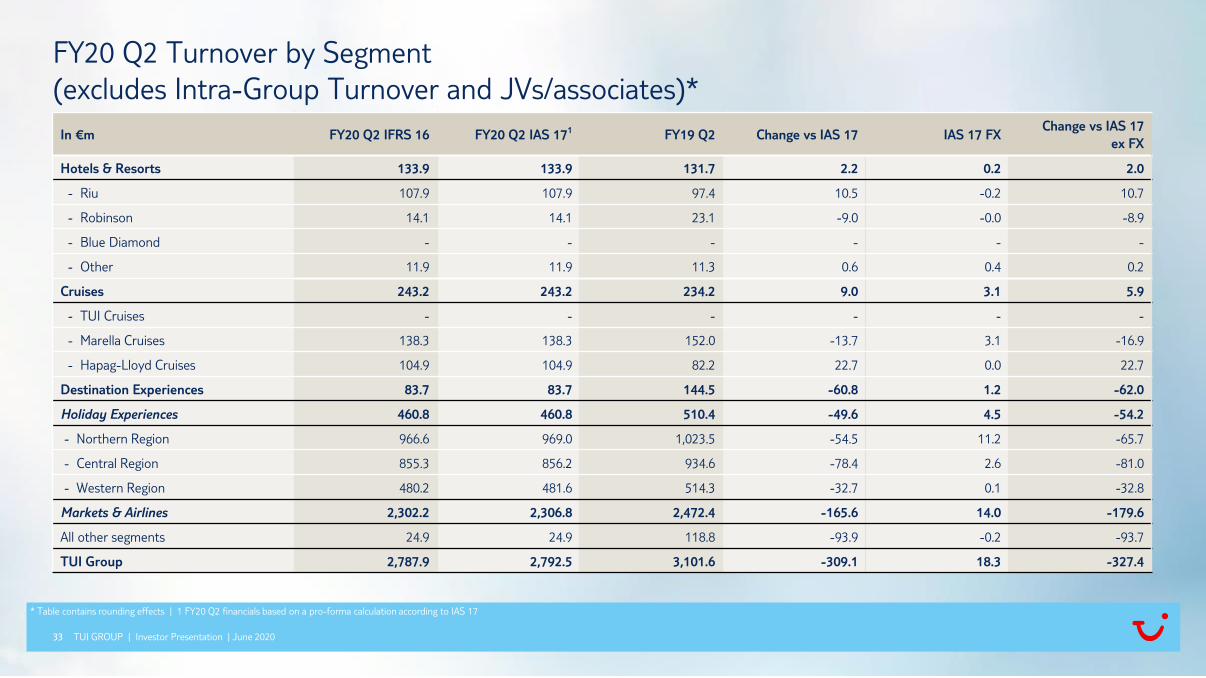
In €m FY20 Q2 IFRS 16 FY20 Q2 IAS 171 FY19 Q2 Change vs IAS 17 IAS 17 FXChange vs IAS 17
ex FX
Hotels & Resorts 133.9 133.9 131.7 2.2 0.2 2.0
- Riu 107.9 107.9 97.4 10.5 -0.2 10.7
- Robinson 14.1 14.1 23.1 -9.0 -0.0 -8.9
- Blue Diamond - - - - - -
- Other 11.9 11.9 11.3 0.6 0.4 0.2
Cruises 243.2 243.2 234.2 9.0 3.1 5.9
- TUI Cruises - - - - - -
- Marella Cruises 138.3 138.3 152.0 -13.7 3.1 -16.9
- Hapag-Lloyd Cruises 104.9 104.9 82.2 22.7 0.0 22.7
Destination Experiences 83.7 83.7 144.5 -60.8 1.2 -62.0
Holiday Experiences 460.8 460.8 510.4 -49.6 4.5 -54.2
- Northern Region 966.6 969.0 1,023.5 -54.5 11.2 -65.7
- Central Region 855.3 856.2 934.6 -78.4 2.6 -81.0
- Western Region 480.2 481.6 514.3 -32.7 0.1 -32.8
Markets & Airlines 2,302.2 2,306.8 2,472.4 -165.6 14.0 -179.6
All other segments 24.9 24.9 118.8 -93.9 -0.2 -93.7
TUI Group 2,787.9 2,792.5 3,101.6 -309.1 18.3 -327.4
FY20 Q2 Turnover by Segment
(excludes Intra-Group Turnover and JVs/associates)*
TUI GROUP | Investor Presentation | June 2020
* Table contains rounding effects | 1 FY20 Q2 financials based on a pro-forma calculation according to IAS 17
34
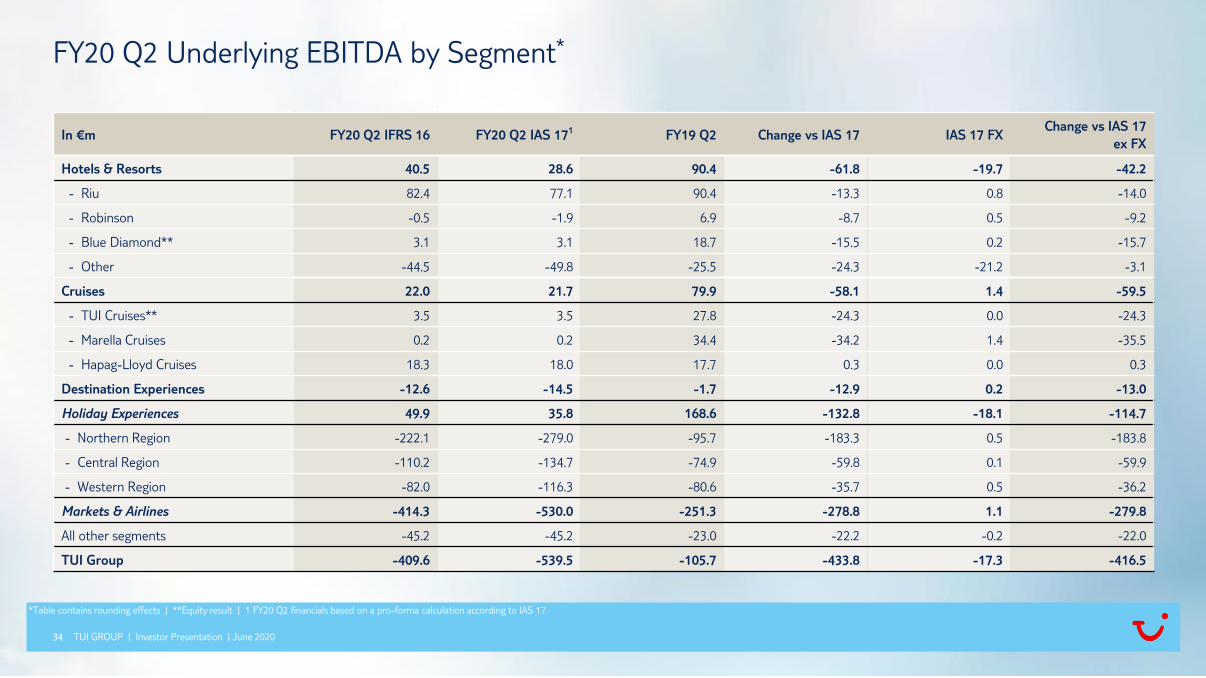
In €m FY20 Q2 IFRS 16 FY20 Q2 IAS 171 FY19 Q2 Change vs IAS 17 IAS 17 FXChange vs IAS 17
ex FX
Hotels & Resorts 40.5 28.6 90.4 -61.8 -19.7 -42.2
- Riu 82.4 77.1 90.4 -13.3 0.8 -14.0
- Robinson -0.5 -1.9 6.9 -8.7 0.5 -9.2
- Blue Diamond** 3.1 3.1 18.7 -15.5 0.2 -15.7
- Other -44.5 -49.8 -25.5 -24.3 -21.2 -3.1
Cruises 22.0 21.7 79.9 -58.1 1.4 -59.5
- TUI Cruises** 3.5 3.5 27.8 -24.3 0.0 -24.3
- Marella Cruises 0.2 0.2 34.4 -34.2 1.4 -35.5
- Hapag-Lloyd Cruises 18.3 18.0 17.7 0.3 0.0 0.3
Destination Experiences -12.6 -14.5 -1.7 -12.9 0.2 -13.0
Holiday Experiences 49.9 35.8 168.6 -132.8 -18.1 -114.7
- Northern Region -222.1 -279.0 -95.7 -183.3 0.5 -183.8
- Central Region -110.2 -134.7 -74.9 -59.8 0.1 -59.9
- Western Region -82.0 -116.3 -80.6 -35.7 0.5 -36.2
Markets & Airlines -414.3 -530.0 -251.3 -278.8 1.1 -279.8
All other segments -45.2 -45.2 -23.0 -22.2 -0.2 -22.0
TUI Group -409.6 -539.5 -105.7 -433.8 -17.3 -416.5
FY20 Q2 Underlying EBITDA by Segment*
TUI GROUP | Investor Presentation | June 2020
*Table contains rounding effects | **Equity result | 1 FY20 Q2 financials based on a pro-forma calculation according to IAS 17
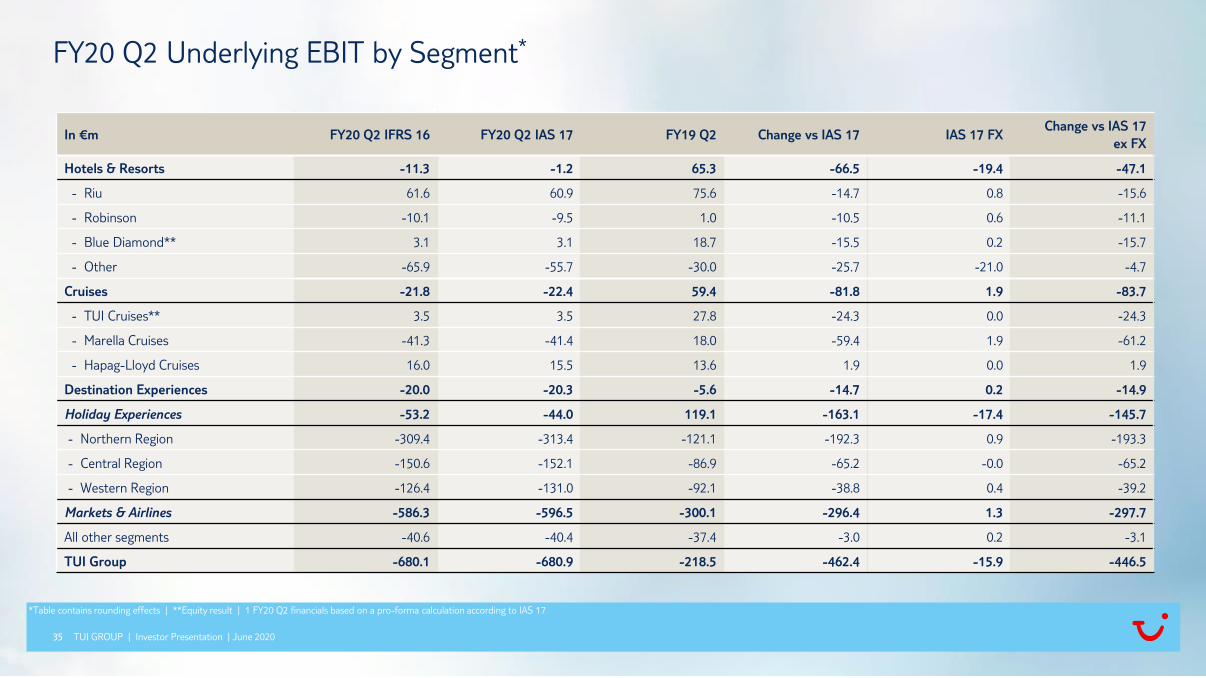
35
In €m FY20 Q2 IFRS 16 FY20 Q2 IAS 17 FY19 Q2 Change vs IAS 17 IAS 17 FXChange vs IAS 17
ex FX
Hotels & Resorts -11.3 -1.2 65.3 -66.5 -19.4 -47.1
- Riu 61.6 60.9 75.6 -14.7 0.8 -15.6
- Robinson -10.1 -9.5 1.0 -10.5 0.6 -11.1
- Blue Diamond** 3.1 3.1 18.7 -15.5 0.2 -15.7
- Other -65.9 -55.7 -30.0 -25.7 -21.0 -4.7
Cruises -21.8 -22.4 59.4 -81.8 1.9 -83.7
- TUI Cruises** 3.5 3.5 27.8 -24.3 0.0 -24.3
- Marella Cruises -41.3 -41.4 18.0 -59.4 1.9 -61.2
- Hapag-Lloyd Cruises 16.0 15.5 13.6 1.9 0.0 1.9
Destination Experiences -20.0 -20.3 -5.6 -14.7 0.2 -14.9
Holiday Experiences -53.2 -44.0 119.1 -163.1 -17.4 -145.7
- Northern Region -309.4 -313.4 -121.1 -192.3 0.9 -193.3
- Central Region -150.6 -152.1 -86.9 -65.2 -0.0 -65.2
- Western Region -126.4 -131.0 -92.1 -38.8 0.4 -39.2
Markets & Airlines -586.3 -596.5 -300.1 -296.4 1.3 -297.7
All other segments -40.6 -40.4 -37.4 -3.0 0.2 -3.1
TUI Group -680.1 -680.9 -218.5 -462.4 -15.9 -446.5
FY20 Q2 Underlying EBIT by Segment*
TUI GROUP | Investor Presentation | June 2020
*Table contains rounding effects | **Equity result | 1 FY20 Q2 financials based on a pro-forma calculation according to IAS 17

TUI GROUP | Investor Presentation | June 2020
APPENDIX – FY19 RESULTS
37
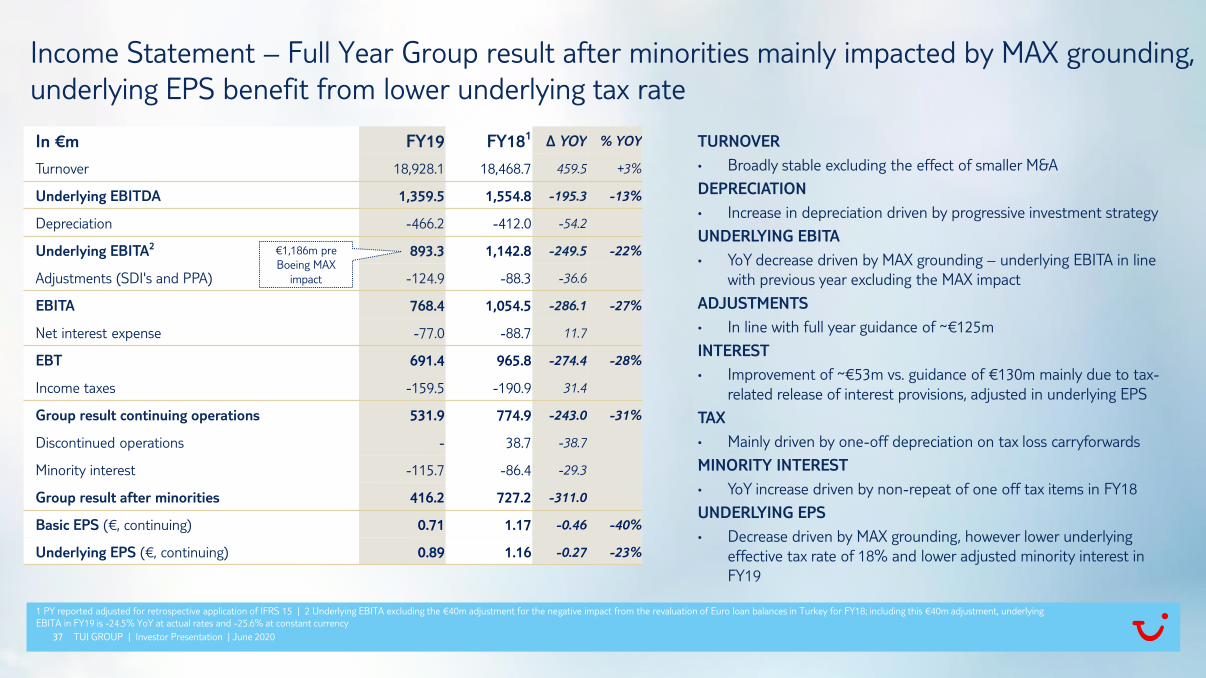
In €m FY19 FY181 ∆ YOY % YOY
Turnover 18,928.1 18,468.7 459.5 +3%
Underlying EBITDA 1,359.5 1,554.8 -195.3 -13%
Depreciation -466.2 -412.0 -54.2
Underlying EBITA2 893.3 1,142.8 -249.5 -22%
Adjustments (SDI's and PPA) -124.9 -88.3 -36.6
EBITA 768.4 1,054.5 -286.1 -27%
Net interest expense -77.0 -88.7 11.7
EBT 691.4 965.8 -274.4 -28%
Income taxes -159.5 -190.9 31.4
Group result continuing operations 531.9 774.9 -243.0 -31%
Discontinued operations - 38.7 -38.7
Minority interest -115.7 -86.4 -29.3
Group result after minorities 416.2 727.2 -311.0
Basic EPS (€, continuing) 0.71 1.17 -0.46 -40%
Underlying EPS (€, continuing) 0.89 1.16 -0.27 -23%
TURNOVER
• Broadly stable excluding the effect of smaller M&A
DEPRECIATION
• Increase in depreciation driven by progressive investment strategy
UNDERLYING EBITA
• YoY decrease driven by MAX grounding – underlying EBITA in line
with previous year excluding the MAX impact
ADJUSTMENTS
• In line with full year guidance of ~€125m
INTEREST
• Improvement of ~€53m vs. guidance of €130m mainly due to tax-
related release of interest provisions, adjusted in underlying EPS
TAX
• Mainly driven by one-off depreciation on tax loss carryforwards
MINORITY INTEREST
• YoY increase driven by non-repeat of one off tax items in FY18
UNDERLYING EPS
• Decrease driven by MAX grounding, however lower underlying
effective tax rate of 18% and lower adjusted minority interest in
FY19
Income Statement – Full Year Group result after minorities mainly impacted by MAX grounding,
underlying EPS benefit from lower underlying tax rate
TUI GROUP | Investor Presentation | June 2020
1 PY reported adjusted for retrospective application of IFRS 15 | 2 Underlying EBITA excluding the €40m adjustment for the negative impact from the revaluation of Euro loan balances in Turkey for FY18; including this €40m adjustment, underlying
EBITA in FY19 is -24.5% YoY at actual rates and -25.6% at constant currency
€1,186m pre
Boeing MAX
impact
38
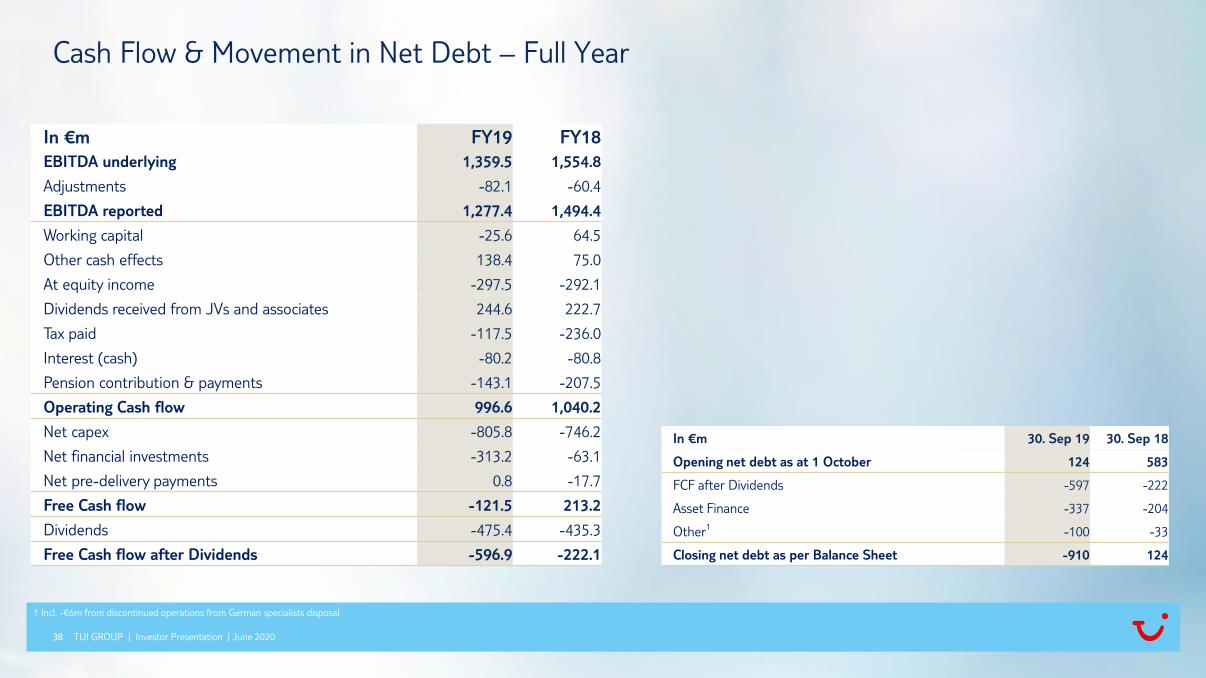
Cash Flow & Movement in Net Debt – Full Year
TUI GROUP | Investor Presentation | June 2020
In €m FY19 FY18
EBITDA underlying 1,359.5 1,554.8
Adjustments -82.1 -60.4
EBITDA reported 1,277.4 1,494.4
Working capital -25.6 64.5
Other cash effects 138.4 75.0
At equity income -297.5 -292.1
Dividends received from JVs and associates 244.6 222.7
Tax paid -117.5 -236.0
Interest (cash) -80.2 -80.8
Pension contribution & payments -143.1 -207.5
Operating Cash flow 996.6 1,040.2
Net capex -805.8 -746.2
Net financial investments -313.2 -63.1
Net pre-delivery payments 0.8 -17.7
Free Cash flow -121.5 213.2
Dividends -475.4 -435.3
Free Cash flow after Dividends -596.9 -222.1
In €m 30. Sep 19 30. Sep 18
Opening net debt as at 1 October 124 583
FCF after Dividends -597 -222
Asset Finance -337 -204
Other1 -100 -33
Closing net debt as per Balance Sheet -910 124
1 Incl. -€6m from discontinued operations from German specialists disposal
39
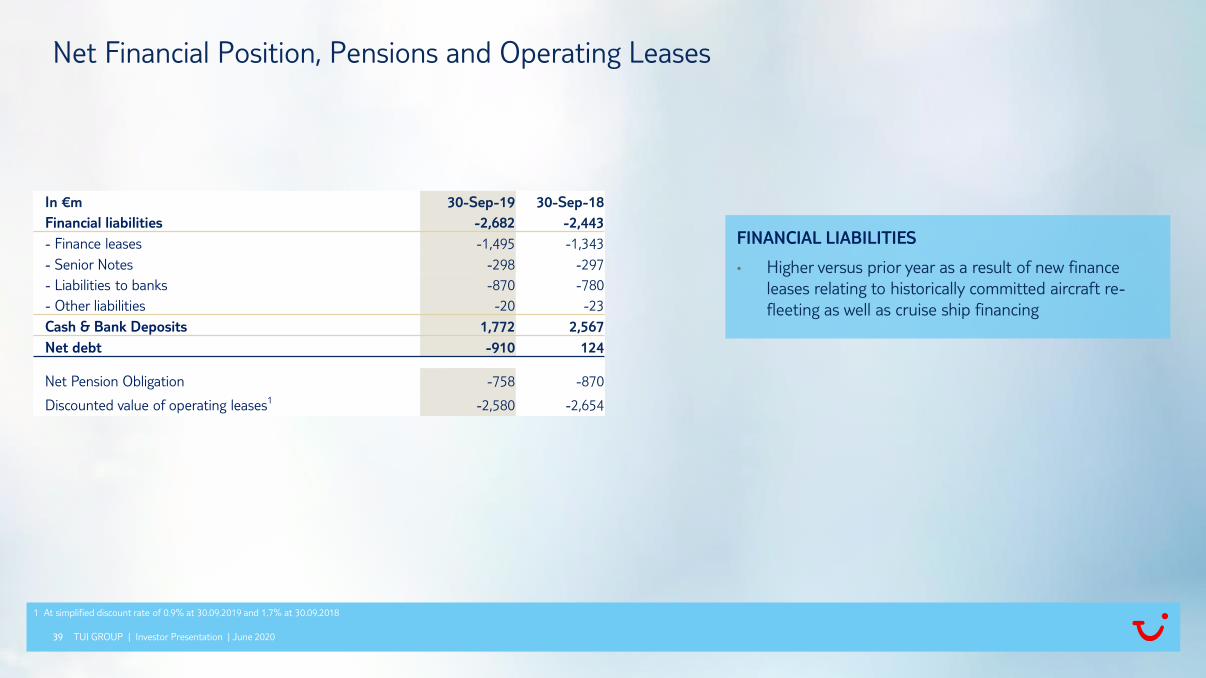
Net Financial Position, Pensions and Operating Leases
TUI GROUP | Investor Presentation | June 2020
1 At simplified discount rate of 0.9% at 30.09.2019 and 1.7% at 30.09.2018
FINANCIAL LIABILITIES
• Higher versus prior year as a result of new finance
leases relating to historically committed aircraft re-
fleeting as well as cruise ship financing
In €m 30-Sep-19 30-Sep-18
Financial liabilities -2,682 -2,443
- Finance leases -1,495 -1,343
- Senior Notes -298 -297
- Liabilities to banks -870 -780
- Other liabilities -20 -23
Cash & Bank Deposits 1,772 2,567
Net debt -910 124
Net Pension Obligation -758 -870
Discounted value of operating leases1 -2,580 -2,654
40
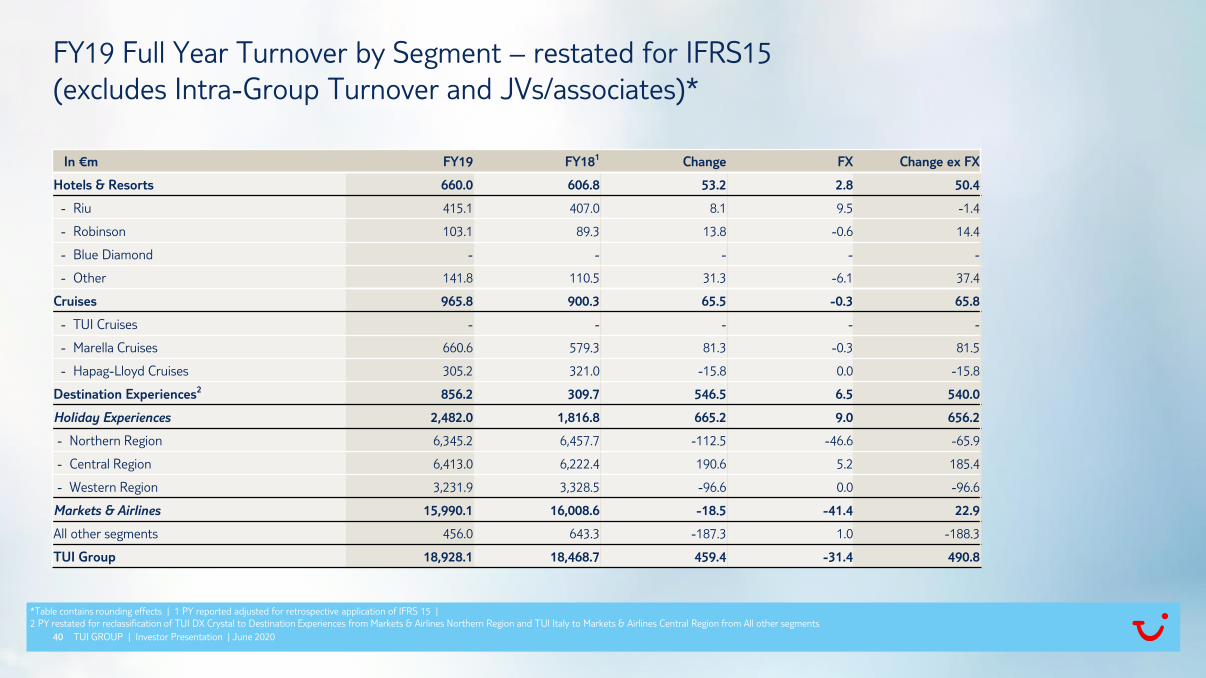
FY19 Full Year Turnover by Segment – restated for IFRS15
(excludes Intra-Group Turnover and JVs/associates)*
TUI GROUP | Investor Presentation | June 2020
*Table contains rounding effects | 1 PY reported adjusted for retrospective application of IFRS 15 |
2 PY restated for reclassification of TUI DX Crystal to Destination Experiences from Markets & Airlines Northern Region and TUI Italy to Markets & Airlines Central Region from All other segments
In €m FY19 FY181 Change FX Change ex FX
Hotels & Resorts 660.0 606.8 53.2 2.8 50.4
- Riu 415.1 407.0 8.1 9.5 -1.4
- Robinson 103.1 89.3 13.8 -0.6 14.4
- Blue Diamond - - - - -
- Other 141.8 110.5 31.3 -6.1 37.4
Cruises 965.8 900.3 65.5 -0.3 65.8
- TUI Cruises - - - - -
- Marella Cruises 660.6 579.3 81.3 -0.3 81.5
- Hapag-Lloyd Cruises 305.2 321.0 -15.8 0.0 -15.8
Destination Experiences2 856.2 309.7 546.5 6.5 540.0
Holiday Experiences 2,482.0 1,816.8 665.2 9.0 656.2
- Northern Region 6,345.2 6,457.7 -112.5 -46.6 -65.9
- Central Region 6,413.0 6,222.4 190.6 5.2 185.4
- Western Region 3,231.9 3,328.5 -96.6 0.0 -96.6
Markets & Airlines 15,990.1 16,008.6 -18.5 -41.4 22.9
All other segments 456.0 643.3 -187.3 1.0 -188.3
TUI Group 18,928.1 18,468.7 459.4 -31.4 490.8
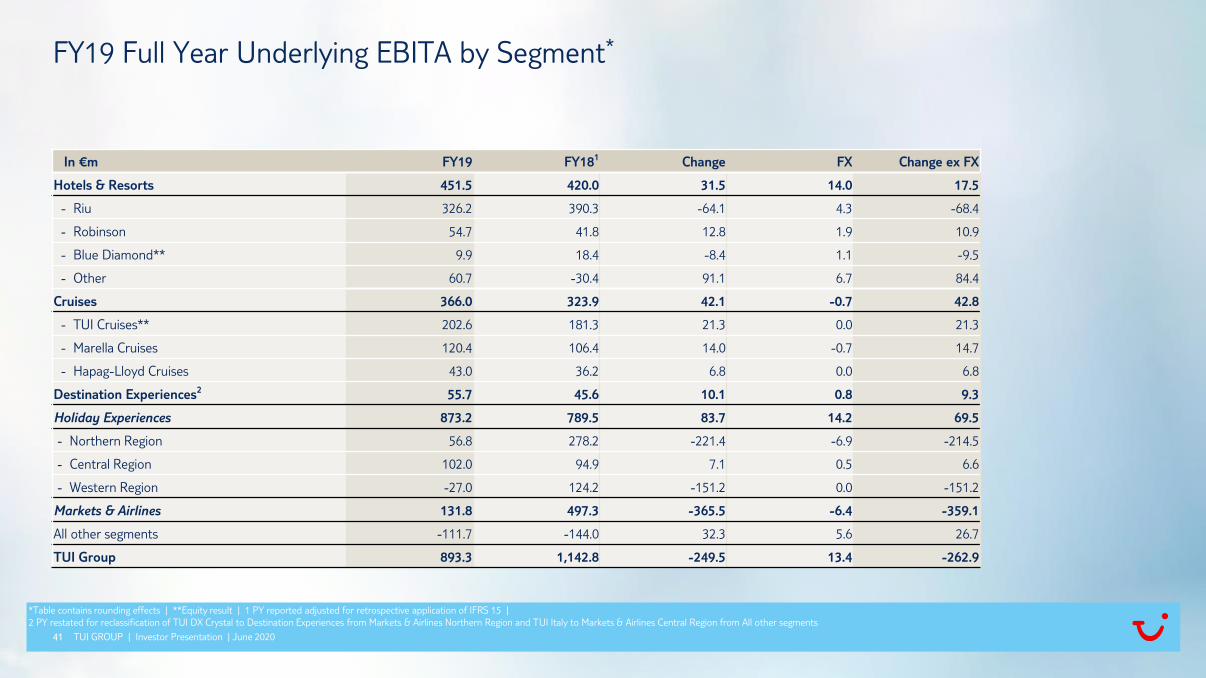
41
In €m FY19 FY181 Change FX Change ex FX
Hotels & Resorts 451.5 420.0 31.5 14.0 17.5
- Riu 326.2 390.3 -64.1 4.3 -68.4
- Robinson 54.7 41.8 12.8 1.9 10.9
- Blue Diamond** 9.9 18.4 -8.4 1.1 -9.5
- Other 60.7 -30.4 91.1 6.7 84.4
Cruises 366.0 323.9 42.1 -0.7 42.8
- TUI Cruises** 202.6 181.3 21.3 0.0 21.3
- Marella Cruises 120.4 106.4 14.0 -0.7 14.7
- Hapag-Lloyd Cruises 43.0 36.2 6.8 0.0 6.8
Destination Experiences2 55.7 45.6 10.1 0.8 9.3
Holiday Experiences 873.2 789.5 83.7 14.2 69.5
- Northern Region 56.8 278.2 -221.4 -6.9 -214.5
- Central Region 102.0 94.9 7.1 0.5 6.6
- Western Region -27.0 124.2 -151.2 0.0 -151.2
Markets & Airlines 131.8 497.3 -365.5 -6.4 -359.1
All other segments -111.7 -144.0 32.3 5.6 26.7
TUI Group 893.3 1,142.8 -249.5 13.4 -262.9
FY19 Full Year Underlying EBITA by Segment*
TUI GROUP | Investor Presentation | June 2020
*Table contains rounding effects | **Equity result | 1 PY reported adjusted for retrospective application of IFRS 15 |
2 PY restated for reclassification of TUI DX Crystal to Destination Experiences from Markets & Airlines Northern Region and TUI Italy to Markets & Airlines Central Region from All other segments
TUI GROUP | Investor Presentation | June 2020
APPENDIX - SUSTAINABILITY
43
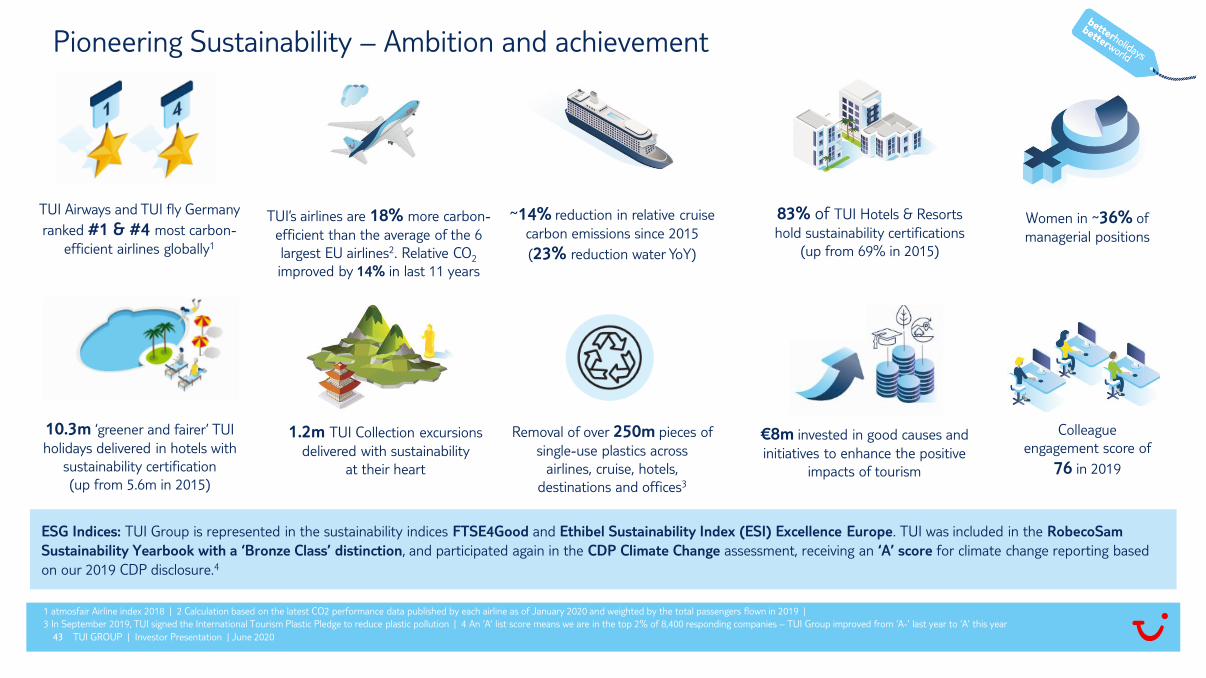
Pioneering Sustainability – Ambition and achievement
1 atmosfair Airline index 2018 | 2 Calculation based on the latest CO2 performance data published by each airline as of January 2020 and weighted by the total passengers flown in 2019 |
3 In September 2019, TUI signed the International Tourism Plastic Pledge to reduce plastic pollution | 4 An ‘A’ list score means we are in the top 2% of 8,400 responding companies – TUI Group improved from ‘A-’ last year to ‘A’ this year
TUI GROUP | Investor Presentation | June 2020
TUI Airways and TUI fly Germany
ranked #1 & #4 most carbon-
efficient airlines globally1
~14% reduction in relative cruise
carbon emissions since 2015
(23% reduction water YoY)
Removal of over 250m pieces of
single-use plastics across
airlines, cruise, hotels,
destinations and offices3
TUI’s airlines are 18% more carbon-
efficient than the average of the 6
largest EU airlines2. Relative CO2
improved by 14% in last 11 years
83% of TUI Hotels & Resorts
hold sustainability certifications
(up from 69% in 2015)
1.2m TUI Collection excursions
delivered with sustainability
at their heart
€8m invested in good causes and
initiatives to enhance the positive
impacts of tourism
10.3m ‘greener and fairer’ TUI
holidays delivered in hotels with
sustainability certification
(up from 5.6m in 2015)
ESG Indices: TUI Group is represented in the sustainability indices FTSE4Good and Ethibel Sustainability Index (ESI) Excellence Europe. TUI was included in the RobecoSam
Sustainability Yearbook with a ‘Bronze Class’ distinction, and participated again in the CDP Climate Change assessment, receiving an ‘A’ score for climate change reporting based
on our 2019 CDP disclosure.4
Women in ~36% of
managerial positions
Colleague
engagement score of
76 in 2019

ContactANALYST AND INVESTOR ENQUIRIES
Mathias Kiep, Group Director Investor Relations and Corporate Finance Tel: +44 (0)1293 645 925
+49 (0)511 566 1425
Nicola Gehrt, Director, Head of Group Investor Relations Tel: +49 (0)511 566 1435
Contacts for Analysts and Investors in UK, Ireland and Americas
Hazel Chung, Senior Investor Relations Manager Tel: +44 (0)1293 645 823
Corvin Martens, Senior Investor Relations Manager Tel: +49 (0)170 566 2321
Contacts for Analysts and Investors in Continental Europe, Middle East and Asia
Ina Klose, Senior Investor Relations Manager Tel: +49 (0)511 566 1318
Jessica Blinne, Junior Investor Relations Manager Tel: +49 (0)511 566 1442