tuition discounting: - trends in higher education - college board
TRANSCRIPT
The College Board
The College Board is a not-for-profit membership association whose mission is to connect students to college success and opportunity. Founded in 1900, the association is composed of more than 5,700 schools, colleges, universities and other educational organizations. Each year, the College Board serves seven million students and their parents, 23,000 high schools, and 3,800 colleges through major programs and services in college readiness, college admission, guidance, assessment, financial aid and enrollment. Among its widely recognized programs are the SAT®, the PSAT/NMSQT®, the Advanced Placement Program® (AP®), SpringBoard and ACCUPLACER. The College Board is committed to the principles of excellence and equity, and that commitment is embodied in all of its programs, services, activities and concerns.
For further information, visit www.collegeboard.com.
College Board Advocacy
Advocacy is central to the work of the College Board. Working with members, policymakers and the education community, we promote programs, policies and practices that increase college access and success for all students. In a world of growing complexity and competing demands, we advocate to ensure that education comes first.www.collegeboard.com/advocacy
Contact Information for the Authors:Sandy Baum, [email protected] Lapovsky, [email protected] Ma, [email protected]
© 2010 The College Board. College Board, ACCUPLACER, Advanced Placement, Advanced Placement Program, AP, CollegeEd, SpringBoard and the acorn logo are registered trademarks of the College Board. College Board Standards for College Success, CollegeKeys Compact and Standards for College Success are trademarks owned by the College Board. All other products and services may be trademarks of their respective owners. Visit the College Board on the Web: www.collegeboard.com.
1
Colleges and universities are the largest source of grant aid to students. In 2008-09, institutions provided about $24 billion in grants to undergraduate students. Institutional grants increased from 34% of total undergraduate grant aid in 1990-91 to 40% in 2000-01, and were 39% of the total in 2008-09. The federal government provided 36%, state governments provided 13%, and the remaining 12% of grant aid came from other private sources (College Board, 2009b).
Institutional grant aid makes it possible for students to enroll in colleges and universities they could not otherwise afford. However, providing access is not the only goal. This aid, which is a discount from the published price, is also used strategically to help colleges and universities fill seats that would otherwise be empty, to improve the academic profile of their student bodies, to build winning athletic teams, and to shape their classes in other ways.
The different motives underlying institutional aid policies can lead to different distributional patterns. An institution that easily meets its enrollment targets and is satisfied with its reputation and the quality of its student body may focus on using financial aid to increase access and diversity. It will provide grants to help meet the financial need of students who would probably be unable to enroll without these subsidies. In contrast, an institution that is struggling to fill its class or is eager to increase its graduation rate or move up in the rankings is likely to provide discounts to students who might be able to pay the published price, but who, without the lure of a merit award, are likely to choose another institution. These institutions may be less generous in their awards to low-income students, and under these circumstances, students from middle- and upper-income families may well receive larger discounts than those with more financial need.
Discounting is certainly not the only strategy colleges and universities use to attract and retain the optimal number and type of students. They establish and articulate their missions, develop the curriculum, design co-curricular activities, enhance physical facilities, tailor learning opportunities, and constantly seek new ways to meet the needs of students. They also use a variety of tactics to market and brand their institutions. Decisions about pricing and discounting or financial aid policies are not only about generating the revenues needed to provide appropriate educational opportunities and providing access to students from varied financial circumstances, but also about image and competition for desirable students.
This study examines the undergraduate institutional aid patterns in public two-year and four-year, as well as private not-for-profit four-year colleges and universities, from 2000-01 through 2007-08 and, where possible, 2008-09.1 Using data from the College Board’s Annual Survey of Colleges combined with information from the 2008 National Postsecondary Student Aid Study (NPSAS), we look at grant aid provided by individual institutions and compare it to published tuition and fee prices to calculate institutional discount rates.2 We focus not on the motives for awarding aid as reflected in the labels “need-based” and “non-need-based” or “merit” aid, but on whether the aid awarded helps to meet recipients’ financial need.3 We look separately at athletic awards and at tuition waivers, which may be awarded based either on institutional policy or on criteria specified by state governments. We find that the overall discount rate has been relatively stable over the decade in the public sector, but it continues to rise in the private sector. While there is considerable variation across institutions within sectors, the reality is that, despite an environment where college prices are rising rapidly but family incomes are not, a significant portion of institutional aid is being awarded to students who do not have financial need.
The remainder of the paper is structured as follows: In Section 1, we provide some background information on grant aid and net prices. Section 2 presents an overview of tuition discount patterns over time. In sections 3 through 5, we discuss detailed results on discount rates for the private four-year, public four-year, and public two-year sectors. Concluding remarks are in Section 6.
1. In the Annual Survey of Colleges, institutions can choose to report financial aid data for the current academic year or the previous academic year. The latest Annual Survey of Colleges data used in this study were from the 2008-09 collection period. As a result, we have some data from 2008-09. But the number of schools reporting is much smaller than for earlier years. We report data for public and private not-for-profit four-year institutions in 2008-09 as preliminary, but the data for public two-year colleges are not adequate to report. The data available for the for-profit sector are inadequate to allow us to include this sector in any of our analyses.
2. We also rely on endowment data from the National Association of College and University Business Officers (NACUBO) and Commonfund.
3. The Common Data Set instructions, which are incorporated in the Annual Survey of Colleges, the source of data for this study, specify that “Aid that is non-need-based but that was used to meet need should be reported in the need-based aid column.” Financial need may be based either on Federal Methodology or the “institution’s own standards.”
2
Section 1: Background on Grant Aid and Net Prices
Colleges and universities are concerned about the characteristics of their student bodies for a variety of reasons. Diversity in socioeconomic status, race/ethnicity, gender, geographical origins, academic interests, and athletic and artistic talents contributes to a more vibrant community. Many students are aware of the importance of the peers with whom they will be in school when they apply to colleges. And of course, national rankings are improved by enrolling students with better academic credentials. Focusing only on assisting the needy is not likely to strengthen an institution’s bottom line and may not provide it with the net revenues required to finance the educational mission. Many colleges, particularly in the private not-for-profit sector, would find it impossible to attract the number of students they need at their published price, and thus they must discount to operate at or near capacity.
With this combination of motives, colleges and universities are appealing to two sets of students with their discounts: those who are unable to afford the price and those who are unwilling to pay the price. Data from the 2008 NPSAS show that the proportion of grant aid awarded on the basis of financial circumstances decreases as family income increases. For example, in the public four-year sector, about one-third of the institutional grant aid was distributed on the basis of financial need in 2007-08. This proportion was 57% for the lowest-income students and 19% for the highest-income students (College Board, 2009b).
Net Price
The prevalence of tuition discounting makes the net prices that students pay to institutions quite different from the published prices. From the student perspective, finding the net price requires subtracting not only institutional discounts but also grants from federal, state and other private sources. Because of growth in total grant aid, net prices have risen more slowly over time than have published prices. In the public two-year and public four-year sectors, estimated average net tuition and fees in 2009-10 are lower than those in 1999-2000 after adjusting for inflation. In the private four-year sector, estimated average net tuition and fees in 2009-10 are about the same as those in 1999-2000 (College Board, 2009a).
Variation in levels of institutional aid, which is most generous in the private not-for-profit sector, changes the profile of college prices quite a bit. For example, for all but the most affluent students, average net price is actually higher at for-profit colleges than at private not-for-profit colleges, which have higher published prices.4 While some colleges and universities announce the criteria for receiving grant aid up front so that students can estimate before they apply how much financial aid they will receive, other institutions decide only after reviewing the entire applicant pool. In most cases, students do not know the actual price they will pay at least until they receive their acceptance letter, and frequently weeks later. As of August 2011, the federal government will require that all institutions include a net price calculator on their websites. These calculators will make it easier for many students to estimate in advance how much they will have to pay, but there will still be many last-minute surprises.
In this paper, we focus on the published price net of only institutional grant aid. We do not examine grant aid from other sources that reduces net prices for students but does not reduce net institutional revenues.
Defining Tuition Discounting
Tuition discounts have several components. The largest component is general institutional grant aid, which may be allocated either on the basis of financial circumstances or according to other criteria. Some of this aid is funded through restricted endowment income or restricted gifts. However, much of the aid is unfunded and is derived from the general revenues of the college, which are composed primarily of student tuition and fees, unrestricted endowment income or gifts, and in the case of public institutions, state and local funds.
4. See College Board, 2009a, for examples of net price estimates.
3
Two other components of tuition discounts are athletic awards and tuition waivers. Institutions may have some control over tuition waivers; however, for public institutions, they are frequently mandated by the state. Active duty military, National Guard members, senior citizens, and foster children receive waivers in many states. In California, where about 21% of all public two-year college students are enrolled,5 all low-income students receive fee (tuition) waivers in this sector. In North Carolina and other states, police officers, firefighters, and EMTs receive tuition waivers at community colleges. State employees, displaced workers, disabled students, and a variety of other categories of students are exempt from paying the published charges at public colleges in many states. In most cases these awards are granted without regard to financial circumstances, but nonetheless benefit many low- and moderate-income students. Many institutions award tuition waivers to faculty and staff and their dependents. Although these waivers may be viewed as part of compensation, they reduce the price the student pays just as any other discount does.
We define the discount rate as:6
or the equivalent:
It is important to note that we calculate the discount rate relative to only tuition and fee prices. Because grant aid may be awarded to cover room, board, and other living costs in addition to tuition and fees, the discount rate at institutions where living expenses constitute a larger proportion of the total cost of attendance may be biased upward by this definition. However, because room and board charges contribute to institutional revenues only for on-campus students, it is not feasible to use a different base — particularly for public two-year institutions, where virtually all students are commuters.
5. National Center for Education Statistics, Digest of Education Statistics 2008, Table 220. This figure is based on full-time equivalent enrollments.
6. This definition is consistent with that used by NACUBO in its annual reports on tuition discounting.
Aid is commonly divided into the two categories: “need-based” and “non-need-based,” but there are two very different meanings attached to these categories. Some discussions follow the definition embodied in the NPSAS and other sources, relying on the reason the aid was awarded. Any aid awarded without regard to financial circumstances is “non-need-based” by this definition. In contrast, our primary data source, the College Board’s Annual Survey of Colleges, follows the practice of the Common Data Set,7 defining any aid that goes to meet need as “need-based.” Only aid that is awarded to students without documented financial need or that exceeds the amount of a student’s measured need is considered “non-need-based.” In order to diminish ambiguity, we modify the standard terminology and describe discounts as either “aid that meets need” or “aid beyond need.”8
Because of data reporting inconsistencies, we are not able to divide either athletic awards or tuition waivers into these two categories. We include them in our calculation of the total discount rate, but we discuss them separately. Most schools play in an athletic conference, and the rules of awarding athletic scholarships are controlled by their conference. The National Collegiate Athletic Association Division III Conference does not permit the awarding of any athletic scholarships.
To calculate average discount rates, we weight individual institutions by their full-time equivalent enrollment. A simple average across institutions would provide a view of institutional practices, but it would provide a less accurate view of the tuition discounting practices to which typical students are subject. Unless otherwise specified, large colleges have a greater effect on the averages we report than do small colleges.98
7. The Common Data Set is a joint effort of the College Board, U.S. News & World Report, and Peterson’s to agree on common definitions and questions for their surveys of colleges and universities.
8. An individual student might receive more grant aid than the amount required to fill his or her need. In this case, the student would be the recipient of both “aid that meets need” and “aid beyond need.”
9. For example, there might be one college with 10,000 FTE students and a discount rate of 10% and two smaller colleges, each with 1,000 students and 20% discount rates. The simple (unweighted) average discount rate would be (10%+20%+20%)/3 = 16.7%. Our weighted average would be ((10,000*10%) + (1,000*20%) + (1,000*20%))/12,000 = 11.7%. The lower discount rate at the large institution that enrolls most of the students affects the average more than it would without weighting.
Average institutional aid per studentPublished tuition and required fee rate
Tuition Discount Rate
=
Tuition Discount Rate
Total institutional grant aidTotal gross tuition and required fee revenue
=
4
Section 2: Overview of Tuition Discounting Patterns Over Time
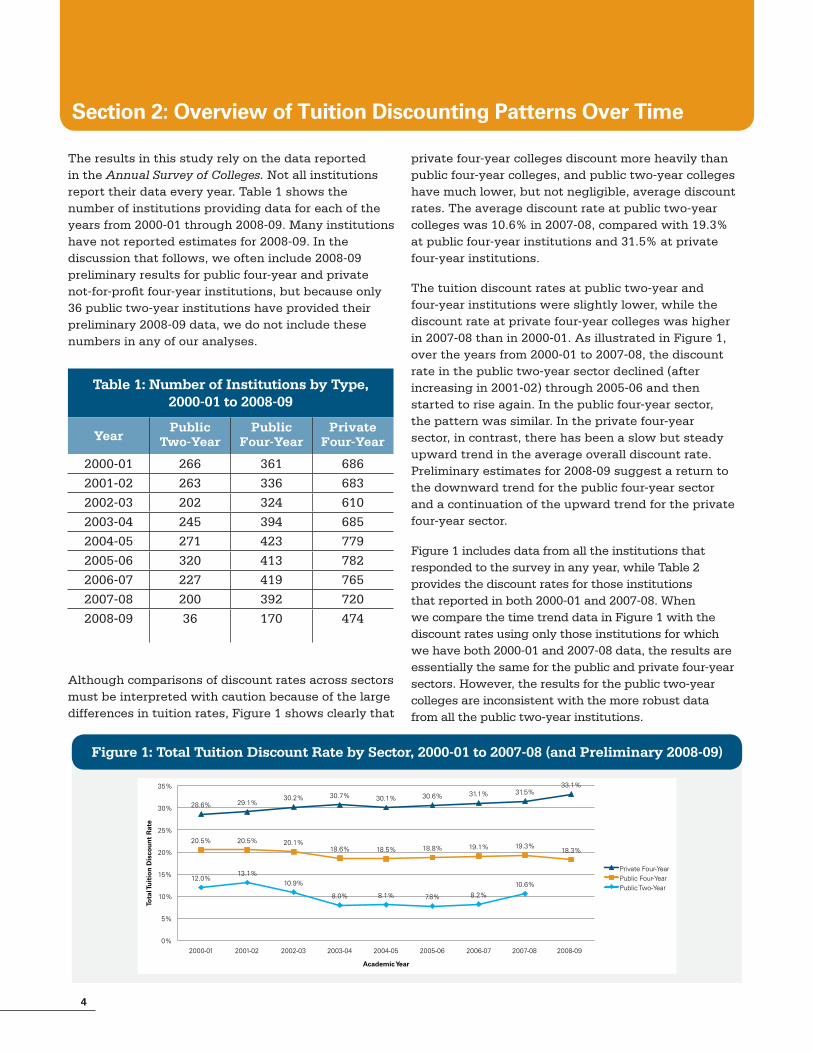
The results in this study rely on the data reported in the Annual Survey of Colleges. Not all institutions report their data every year. Table 1 shows the number of institutions providing data for each of the years from 2000-01 through 2008-09. Many institutions have not reported estimates for 2008-09. In the discussion that follows, we often include 2008-09 preliminary results for public four-year and private not-for-profit four-year institutions, but because only 36 public two-year institutions have provided their preliminary 2008-09 data, we do not include these numbers in any of our analyses.
Table 1: Number of Institutions by Type, 2000-01 to 2008-09
YearPublic
Two-YearPublic
Four-YearPrivate
Four-Year
2000-01 266 361 686
2001-02 263 336 683
2002-03 202 324 610
2003-04 245 394 685
2004-05 271 423 779
2005-06 320 413 782
2006-07 227 419 765
2007-08 200 392 720
2008-09 36 170 474
Although comparisons of discount rates across sectors must be interpreted with caution because of the large differences in tuition rates, Figure 1 shows clearly that
private four-year colleges discount more heavily than public four-year colleges, and public two-year colleges have much lower, but not negligible, average discount rates. The average discount rate at public two-year colleges was 10.6% in 2007-08, compared with 19.3% at public four-year institutions and 31.5% at private four-year institutions.
The tuition discount rates at public two-year and four-year institutions were slightly lower, while the discount rate at private four-year colleges was higher in 2007-08 than in 2000-01. As illustrated in Figure 1, over the years from 2000-01 to 2007-08, the discount rate in the public two-year sector declined (after increasing in 2001-02) through 2005-06 and then started to rise again. In the public four-year sector, the pattern was similar. In the private four-year sector, in contrast, there has been a slow but steady upward trend in the average overall discount rate. Preliminary estimates for 2008-09 suggest a return to the downward trend for the public four-year sector and a continuation of the upward trend for the private four-year sector.
Figure 1 includes data from all the institutions that responded to the survey in any year, while Table 2 provides the discount rates for those institutions that reported in both 2000-01 and 2007-08. When we compare the time trend data in Figure 1 with the discount rates using only those institutions for which we have both 2000-01 and 2007-08 data, the results are essentially the same for the public and private four-year sectors. However, the results for the public two-year colleges are inconsistent with the more robust data from all the public two-year institutions.
0%
5%
10%
15%
20%
25%
30%
35%
12.0% 13.1%
10.9%
8.0% 8.1% 7.8% 8.2%
10.6%
20.5% 20.5% 20.1% 18.6% 18.5% 18.8% 19.1% 19.3%
18.3%
28.6% 29.1% 30.2% 30.7% 30.1% 30.6% 31.1% 31.5%
33.1%
2000-01 2001-02 2002-03 2003-04 2004-05 2005-06 2006-07 2007-08 2008-09
Tota
l Tu
itio
n D
isco
un
t R
ate
Academic Year
Public Four-Year Private Four-Year
Public Two-Year
Figure 1: Total Tuition Discount Rate by Sector, 2000-01 to 2007-08 (and Preliminary 2008-09)
5
Table 2: Comparison of Average Discount Rates All Institutions vs. Same Set of Institutions, 2000-01 and 2007-08
Public Two-Year Public Four-Year Private Four-YearSame
InstitutionsAll
InstitutionsSame
InstitutionsAll
InstitutionsSame
InstitutionsAll
Institutions
2000-01 12.1% 9.0% 20.5% 20.4% 28.6% 28.8%
2007-08 10.5% 9.9% 19.3% 19.2% 31.5% 31.0%
Number of Institutions
2000-01 70 266 275 361 507 686
2007-08 70 200 275 392 507 720
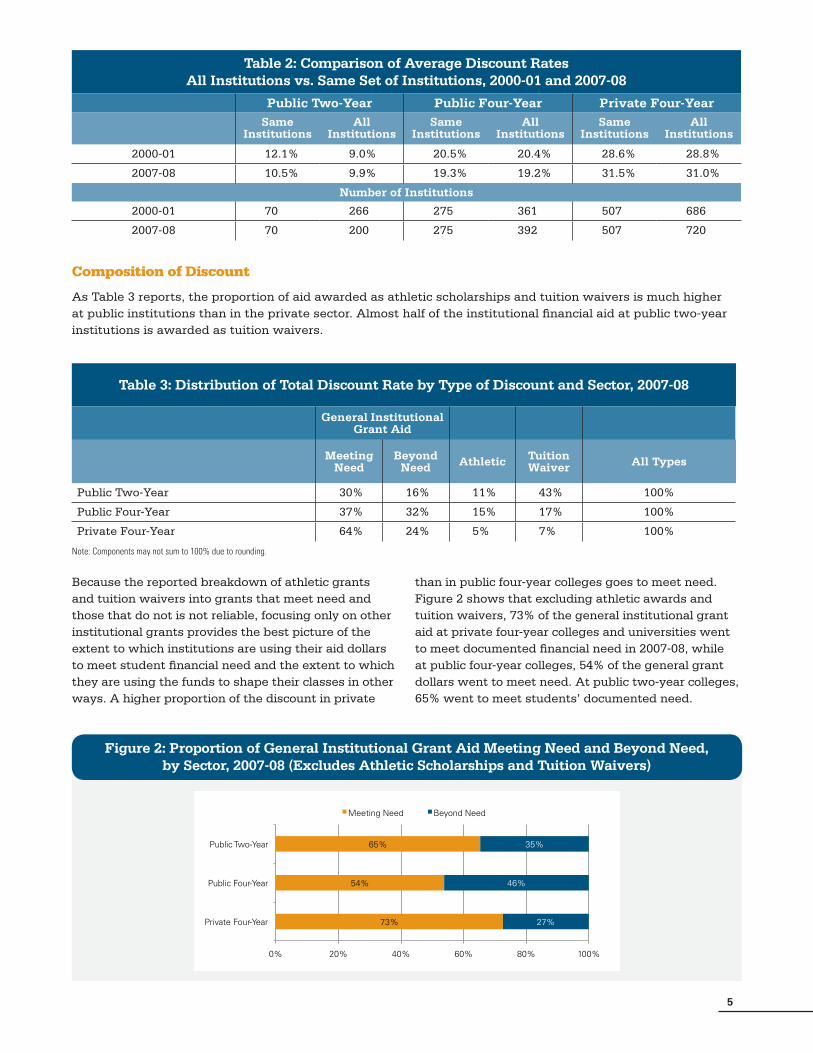
Composition of Discount
As Table 3 reports, the proportion of aid awarded as athletic scholarships and tuition waivers is much higher at public institutions than in the private sector. Almost half of the institutional financial aid at public two-year institutions is awarded as tuition waivers.
Table 3: Distribution of Total Discount Rate by Type of Discount and Sector, 2007-08
General Institutional Grant Aid
Meeting Need
Beyond Need Athletic Tuition
Waiver All Types
Public Two-Year 30% 16% 11% 43% 100%
Public Four-Year 37% 32% 15% 17% 100%
Private Four-Year 64% 24% 5% 7% 100% Note: Components may not sum to 100% due to rounding.
Because the reported breakdown of athletic grants and tuition waivers into grants that meet need and those that do not is not reliable, focusing only on other institutional grants provides the best picture of the extent to which institutions are using their aid dollars to meet student financial need and the extent to which they are using the funds to shape their classes in other ways. A higher proportion of the discount in private
than in public four-year colleges goes to meet need. Figure 2 shows that excluding athletic awards and tuition waivers, 73% of the general institutional grant aid at private four-year colleges and universities went to meet documented financial need in 2007-08, while at public four-year colleges, 54% of the general grant dollars went to meet need. At public two-year colleges, 65% went to meet students’ documented need.
Figure 2: Proportion of General Institutional Grant Aid Meeting Need and Beyond Need, by Sector, 2007-08 (Excludes Athletic Scholarships and Tuition Waivers)
73%
54%
65%
27%
46%
35%
0% 20% 40% 60% 80% 100%
Private Four-Year
Public Four-Year
Public Two-Year
Meeting Need Beyond Need
6
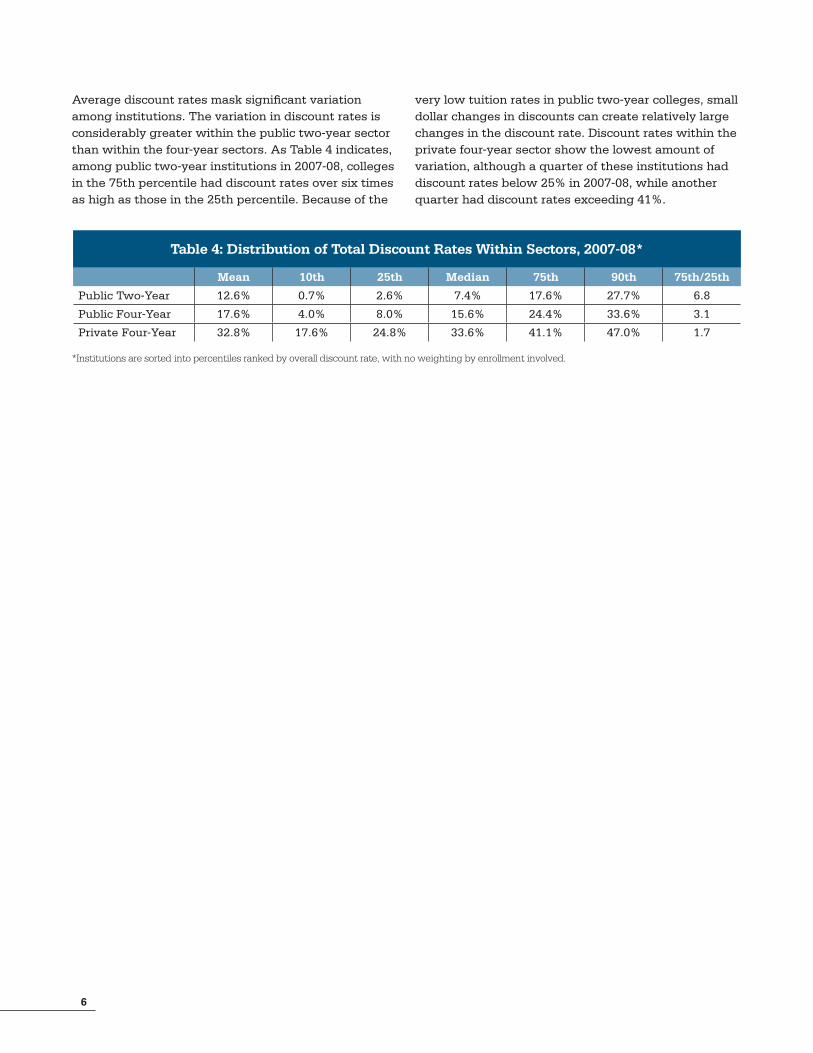
Average discount rates mask significant variation among institutions. The variation in discount rates is considerably greater within the public two-year sector than within the four-year sectors. As Table 4 indicates, among public two-year institutions in 2007-08, colleges in the 75th percentile had discount rates over six times as high as those in the 25th percentile. Because of the
very low tuition rates in public two-year colleges, small dollar changes in discounts can create relatively large changes in the discount rate. Discount rates within the private four-year sector show the lowest amount of variation, although a quarter of these institutions had discount rates below 25% in 2007-08, while another quarter had discount rates exceeding 41%.
Table 4: Distribution of Total Discount Rates Within Sectors, 2007-08*
Mean 10th 25th Median 75th 90th 75th/25th
Public Two-Year 12.6% 0.7% 2.6% 7.4% 17.6% 27.7% 6.8
Public Four-Year 17.6% 4.0% 8.0% 15.6% 24.4% 33.6% 3.1
Private Four-Year 32.8% 17.6% 24.8% 33.6% 41.1% 47.0% 1.7
*Institutions are sorted into percentiles ranked by overall discount rate, with no weighting by enrollment involved.
7
Section 3: Private Four-Year Colleges and Universities
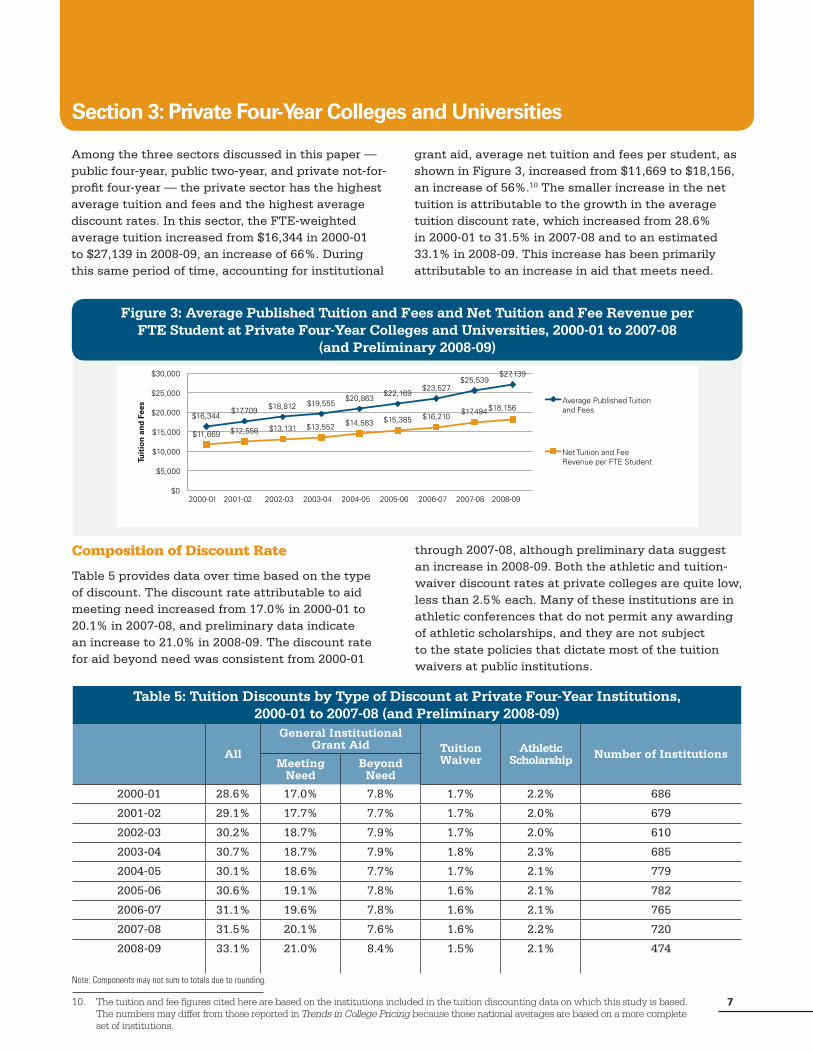
Among the three sectors discussed in this paper — public four-year, public two-year, and private not-for-profit four-year — the private sector has the highest average tuition and fees and the highest average discount rates. In this sector, the FTE-weighted average tuition increased from $16,344 in 2000-01 to $27,139 in 2008-09, an increase of 66%. During this same period of time, accounting for institutional
grant aid, average net tuition and fees per student, as shown in Figure 3, increased from $11,669 to $18,156, an increase of 56%.10 The smaller increase in the net tuition is attributable to the growth in the average tuition discount rate, which increased from 28.6% in 2000-01 to 31.5% in 2007-08 and to an estimated 33.1% in 2008-09. This increase has been primarily attributable to an increase in aid that meets need.
Composition of Discount Rate
Table 5 provides data over time based on the type of discount. The discount rate attributable to aid meeting need increased from 17.0% in 2000-01 to 20.1% in 2007-08, and preliminary data indicate an increase to 21.0% in 2008-09. The discount rate for aid beyond need was consistent from 2000-01
through 2007-08, although preliminary data suggest an increase in 2008-09. Both the athletic and tuition- waiver discount rates at private colleges are quite low, less than 2.5% each. Many of these institutions are in athletic conferences that do not permit any awarding of athletic scholarships, and they are not subject to the state policies that dictate most of the tuition waivers at public institutions.
10. The tuition and fee figures cited here are based on the institutions included in the tuition discounting data on which this study is based. The numbers may differ from those reported in Trends in College Pricing because those national averages are based on a more completeset of institutions.
Table 5: Tuition Discounts by Type of Discount at Private Four-Year Institutions, 2000-01 to 2007-08 (and Preliminary 2008-09)
All
General Institutional Grant Aid Tuition
WaiverAthletic
Scholarship Number of InstitutionsMeeting
NeedBeyond
Need
2000-01 28.6% 17.0% 7.8% 1.7% 2.2% 686
2001-02 29.1% 17.7% 7.7% 1.7% 2.0% 679
2002-03 30.2% 18.7% 7.9% 1.7% 2.0% 610
2003-04 30.7% 18.7% 7.9% 1.8% 2.3% 685
2004-05 30.1% 18.6% 7.7% 1.7% 2.1% 779
2005-06 30.6% 19.1% 7.8% 1.6% 2.1% 782
2006-07 31.1% 19.6% 7.8% 1.6% 2.1% 765
2007-08 31.5% 20.1% 7.6% 1.6% 2.2% 720
2008-09 33.1% 21.0% 8.4% 1.5% 2.1% 474
Note: Components may not sum to totals due to rounding.
Figure 3: Average Published Tuition and Fees and Net Tuition and Fee Revenue per FTE Student at Private Four-Year Colleges and Universities, 2000-01 to 2007-08
(and Preliminary 2008-09)
$16,344 $17,709 $18,812 $19,555
$20,863 $22,169
$23,527 $25,539
$27,139
$11,669 $12,556 $13,131 $13,552 $14,583 $15,385 $16,210 $17,494 $18,156
$0
$5,000
$10,000
$15,000
$20,000
$25,000
$30,000
2000-01 2001-02 2002-03 2003-04 2004-05 2005-06 2006-07 2007-08 2008-09
Tuit
ion
an
d F
ees Average Published Tuition
and Fees
Net Tuition and Fee Revenue per FTE Student
8
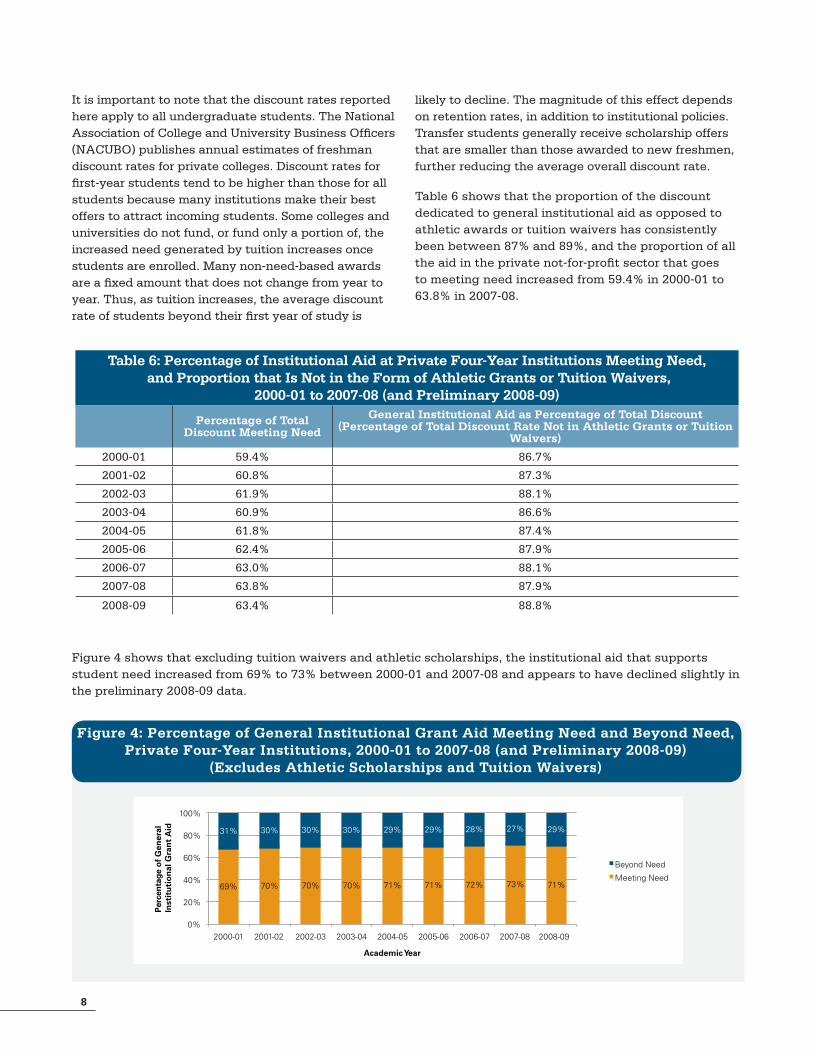
Figure 4: Percentage of General Institutional Grant Aid Meeting Need and Beyond Need, Private Four-Year Institutions, 2000-01 to 2007-08 (and Preliminary 2008-09)
(Excludes Athletic Scholarships and Tuition Waivers)
It is important to note that the discount rates reported here apply to all undergraduate students. The National Association of College and University Business Officers (NACUBO) publishes annual estimates of freshman discount rates for private colleges. Discount rates for first-year students tend to be higher than those for all students because many institutions make their best offers to attract incoming students. Some colleges and universities do not fund, or fund only a portion of, the increased need generated by tuition increases once students are enrolled. Many non-need-based awards are a fixed amount that does not change from year to year. Thus, as tuition increases, the average discount rate of students beyond their first year of study is
likely to decline. The magnitude of this effect depends on retention rates, in addition to institutional policies. Transfer students generally receive scholarship offers that are smaller than those awarded to new freshmen, further reducing the average overall discount rate.
Table 6 shows that the proportion of the discount dedicated to general institutional aid as opposed to athletic awards or tuition waivers has consistently been between 87% and 89%, and the proportion of all the aid in the private not-for-profit sector that goes to meeting need increased from 59.4% in 2000-01 to 63.8% in 2007-08.
Table 6: Percentage of Institutional Aid at Private Four-Year Institutions Meeting Need, and Proportion that Is Not in the Form of Athletic Grants or Tuition Waivers,
2000-01 to 2007-08 (and Preliminary 2008-09) Percentage of Total
Discount Meeting Need
General Institutional Aid as Percentage of Total Discount (Percentage of Total Discount Rate Not in Athletic Grants or Tuition
Waivers)
2000-01 59.4% 86.7%
2001-02 60.8% 87.3%
2002-03 61.9% 88.1%
2003-04 60.9% 86.6%
2004-05 61.8% 87.4%
2005-06 62.4% 87.9%
2006-07 63.0% 88.1%
2007-08 63.8% 87.9%
2008-09 63.4% 88.8%
Figure 4 shows that excluding tuition waivers and athletic scholarships, the institutional aid that supports student need increased from 69% to 73% between 2000-01 and 2007-08 and appears to have declined slightly in the preliminary 2008-09 data.
69% 70% 70% 70% 71% 71% 72% 73% 71%
31% 30% 30% 30% 29% 29% 28% 27% 29%
0%
20%
40%
60%
80%
100%
2000-01 2001-02 2002-03 2003-04 2004-05 2005-06 2006-07 2007-08 2008-09
Per
cent
age
of
Gen
eral
In
stit
uti
on
al G
ran
t A
id
Academic Year
Beyond Need
Meeting Need
9
It is not possible for us to determine how much of this shift toward meeting need is the result of institutional policy changes and how much is attributable to a combination of different growth rates in grant aid at institutions focused on meeting need as opposed to institutions focused on other uses of aid, or of increases in measured need resulting from rising prices and stagnant family incomes.
By Tuition Level
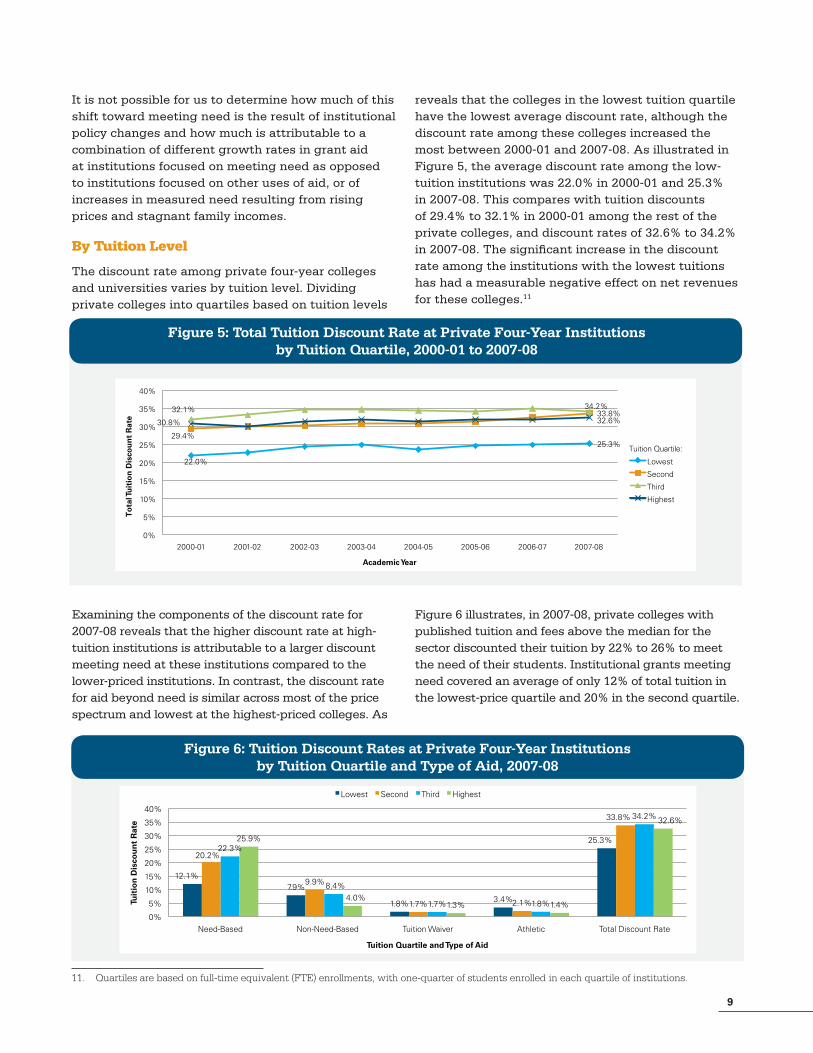
The discount rate among private four-year colleges and universities varies by tuition level. Dividing private colleges into quartiles based on tuition levels
reveals that the colleges in the lowest tuition quartile have the lowest average discount rate, although the discount rate among these colleges increased the most between 2000-01 and 2007-08. As illustrated in Figure 5, the average discount rate among the low-tuition institutions was 22.0% in 2000-01 and 25.3% in 2007-08. This compares with tuition discounts of 29.4% to 32.1% in 2000-01 among the rest of the private colleges, and discount rates of 32.6% to 34.2% in 2007-08. The significant increase in the discount rate among the institutions with the lowest tuitions has had a measurable negative effect on net revenues for these colleges.11
Examining the components of the discount rate for 2007-08 reveals that the higher discount rate at high-tuition institutions is attributable to a larger discount meeting need at these institutions compared to the lower-priced institutions. In contrast, the discount rate for aid beyond need is similar across most of the price spectrum and lowest at the highest-priced colleges. As
Figure 6 illustrates, in 2007-08, private colleges with published tuition and fees above the median for the sector discounted their tuition by 22% to 26% to meet the need of their students. Institutional grants meeting need covered an average of only 12% of total tuition in the lowest-price quartile and 20% in the second quartile.
11. Quartiles are based on full-time equivalent (FTE) enrollments, with one-quarter of students enrolled in each quartile of institutions.
Figure 5: Total Tuition Discount Rate at Private Four-Year Institutions by Tuition Quartile, 2000-01 to 2007-08
22.0%
25.3% 29.4%
33.8% 32.1% 34.2%
30.8% 32.6%
0%
5%
10%
15%
20%
25%
30%
35%
40%
2000-01 2001-02 2002-03 2003-04 2004-05 2005-06 2006-07 2007-08
To
tal T
uit
ion
Dis
cou
nt
Rat
e
Academic Year
Lowest
Tuition Quartile:
Second
Third
Highest
Figure 6: Tuition Discount Rates at Private Four-Year Institutions by Tuition Quartile and Type of Aid, 2007-08
12.1% 7.9%
1.8% 3.4%
25.3%
20.2%
9.9%
1.7% 2.1%
33.8%
22.3%
8.4%
1.7% 1.8%
34.2%
25.9%
4.0% 1.3% 1.4%
32.6%
0%
5%
10%
15%
20%
25%
30%
35%
40%
Need-Based Non-Need-Based Tuition Waiver Athletic Total Discount Rate
Tuit
ion
Dis
cou
nt
Rat
e
Tuition Quartile and Type of Aid
Lowest Second Third Highest
10
Table 7 reports that at the highest-priced private colleges, 79% of the total discount rate and 87% of the general grant aid went to meeting need in 2007-08. At the lowest-priced private colleges, these proportions were just 48% and 61%, respectively.
Table 7: Composition of Discount Rate at Private Four-Year Institutions by Level of Tuition and Fees, 2007-08
Lowest Tuition Lower-Middle Tuition
Upper-Middle Tuition
Highest Tuition
Total Discount Rate 25.3% 33.8% 34.2% 32.6%
% of Total Meeting Need 47.8% 59.8% 65.2% 79.4%
% of General Aid Meeting Need (Excluding Athletic Aid and Waivers)
60.5% 67.1% 72.6% 86.6%
Figure 7: Total Tuition Discount Rates at Private Four-Year Institutions by Carnegie Classification, 2000-01 to 2007-08 (and Preliminary 2008-09)
32.1%
27.1%
32.0% 35.3%
0%
5%
10%
15%
20%
25%
30%
35%
40%
2000-01 2001-02 2002-03 2003-04 2004-05 2005-06 2006-07 2007-08 2008-09
Tuit
ion
Dis
cou
nt
Rat
e
Academic Year
Doctorate-Granting
Master's
Baccalaureate
The discount rate for athletic aid is most important for schools in the lowest tuition quartile, accounting for more than 10% of their institutional aid in both 2000-01 (not shown) and 2007-08.
Carnegie Classification
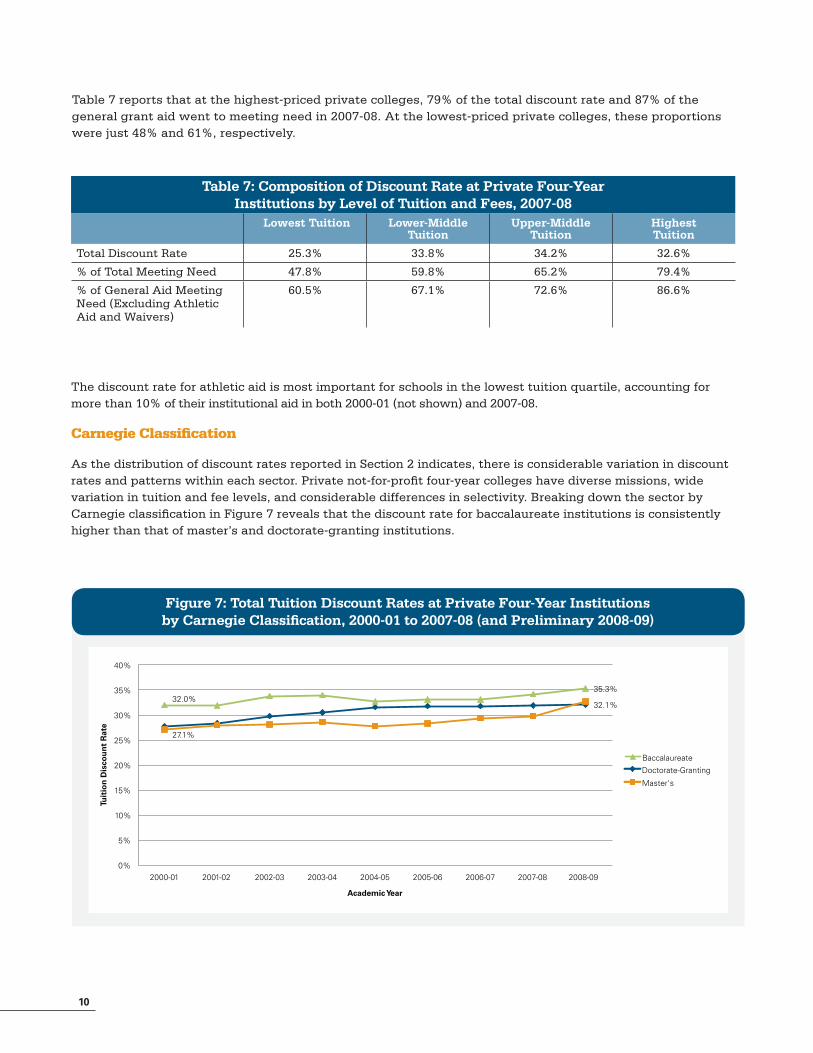
As the distribution of discount rates reported in Section 2 indicates, there is considerable variation in discount rates and patterns within each sector. Private not-for-profit four-year colleges have diverse missions, wide variation in tuition and fee levels, and considerable differences in selectivity. Breaking down the sector by Carnegie classification in Figure 7 reveals that the discount rate for baccalaureate institutions is consistently higher than that of master’s and doctorate-granting institutions.
11
The discount rate at private doctorate-granting institutions rose most rapidly from 2000-01 to 2007-08, although preliminary data suggest a large increase for master’s institutions in 2008-09. Still, the discount rates at institutions in these two categories remain lower than those at baccalaureate institutions.
Even within Carnegie categories, there is considerable variation in discount rates across institutions. In each of the three types of institutions, as indicated in Table 8, the overall discount rate in the 75th percentile is about 1.5 times as high as the discount rate in the 25th percentile. Twenty-five percent of baccalaureate institutions discounted by less than 27.3% in 2007-08, while 10% of them discounted by less than 18.8%.
Table 8: Distribution of Tuition Discount Rate by Carnegie Classification at Private Four-Year Institutions, 2007-08*
Mean 10th 25th Median 75th 90th N Average Full-Time Equivalent Students
Doctorate-Granting 32.9% 21.6% 27.3% 33.2% 39.6% 45.0% 85 5,570
Master’s 31.6% 18.7% 24.5% 31.6% 38.4% 44.4% 246 2,280
Baccalaureate 35.5% 18.8% 27.3% 36.2% 43.6% 50.1% 324 1,401
*Institutions are sorted into percentiles ranked by overall discount rate. Ten percent of the institutions are in each decile, with no weighting by enrollments involved.
Note: Components may not sum to 100% due to rounding.
Selectivity
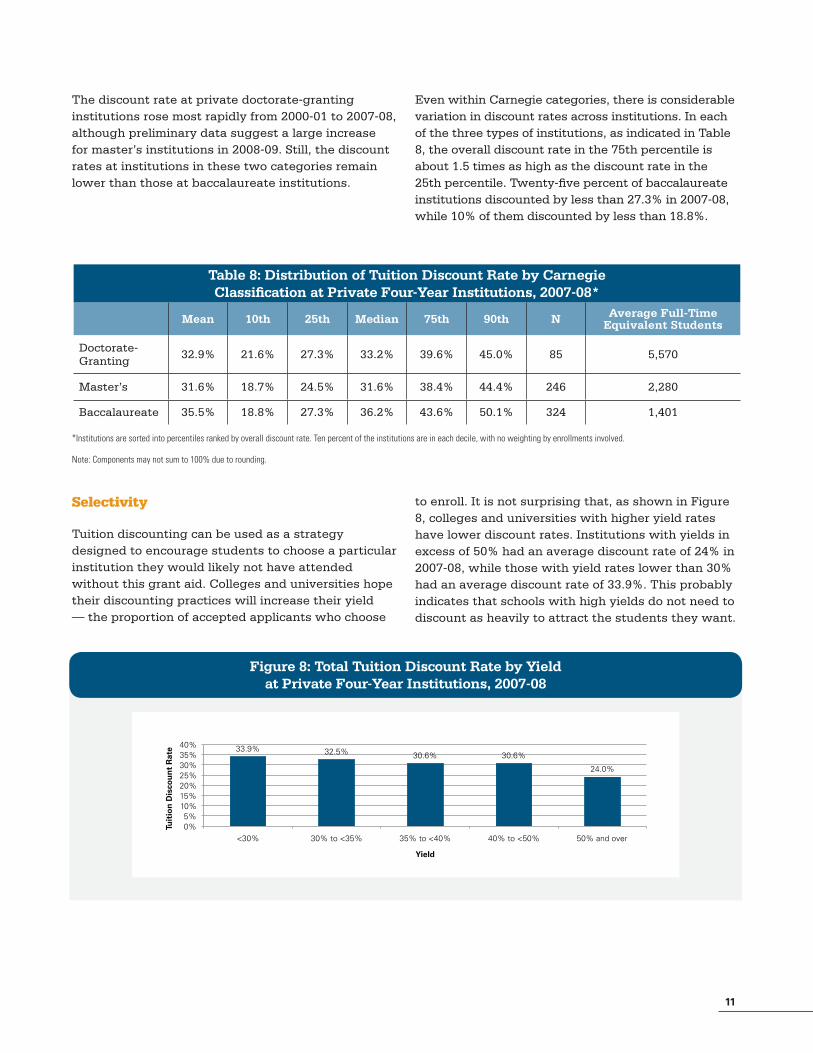
Tuition discounting can be used as a strategy designed to encourage students to choose a particular institution they would likely not have attended without this grant aid. Colleges and universities hope their discounting practices will increase their yield — the proportion of accepted applicants who choose
to enroll. It is not surprising that, as shown in Figure 8, colleges and universities with higher yield rates have lower discount rates. Institutions with yields in excess of 50% had an average discount rate of 24% in 2007-08, while those with yield rates lower than 30% had an average discount rate of 33.9%. This probably indicates that schools with high yields do not need to discount as heavily to attract the students they want.
Figure 8: Total Tuition Discount Rate by Yield at Private Four-Year Institutions, 2007-08
33.9% 32.5% 30.6% 30.6%
24.0%
0% 5%
10% 15% 20% 25% 30% 35% 40%
<30% 30% to <35% 35% to <40% 40% to <50% 50% and over
Tuit
ion
Dis
cou
nt
Rat
e
Yield
12
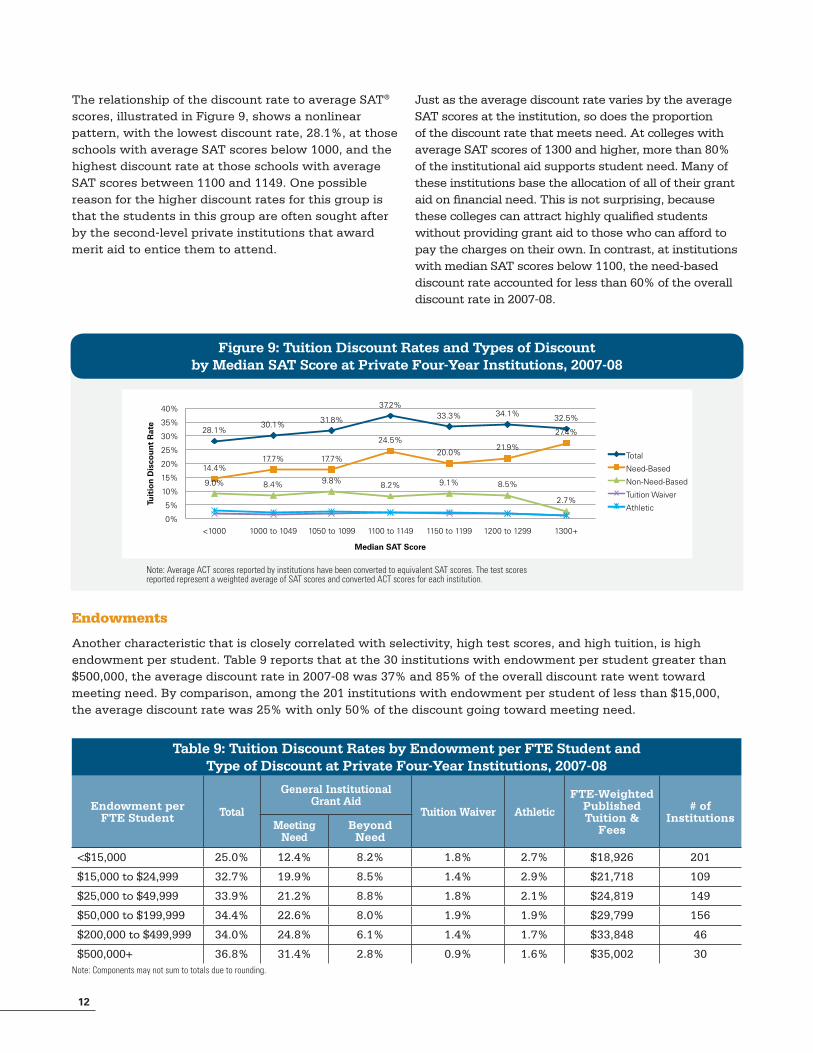
The relationship of the discount rate to average SAT® scores, illustrated in Figure 9, shows a nonlinear pattern, with the lowest discount rate, 28.1%, at those schools with average SAT scores below 1000, and the highest discount rate at those schools with average SAT scores between 1100 and 1149. One possible reason for the higher discount rates for this group is that the students in this group are often sought after by the second-level private institutions that award merit aid to entice them to attend.
Just as the average discount rate varies by the average SAT scores at the institution, so does the proportion of the discount rate that meets need. At colleges with average SAT scores of 1300 and higher, more than 80% of the institutional aid supports student need. Many of these institutions base the allocation of all of their grant aid on financial need. This is not surprising, because these colleges can attract highly qualified students without providing grant aid to those who can afford to pay the charges on their own. In contrast, at institutions with median SAT scores below 1100, the need-based discount rate accounted for less than 60% of the overall discount rate in 2007-08.
Endowments
Another characteristic that is closely correlated with selectivity, high test scores, and high tuition, is high endowment per student. Table 9 reports that at the 30 institutions with endowment per student greater than $500,000, the average discount rate in 2007-08 was 37% and 85% of the overall discount rate went toward meeting need. By comparison, among the 201 institutions with endowment per student of less than $15,000, the average discount rate was 25% with only 50% of the discount going toward meeting need.
Table 9: Tuition Discount Rates by Endowment per FTE Student and Type of Discount at Private Four-Year Institutions, 2007-08
Endowment per FTE Student Total
General Institutional Grant Aid
Tuition Waiver Athletic
FTE-Weighted Published Tuition &
Fees
# of Institutions
Meeting Need
Beyond Need
<$15,000 25.0% 12.4% 8.2% 1.8% 2.7% $18,926 201
$15,000 to $24,999 32.7% 19.9% 8.5% 1.4% 2.9% $21,718 109
$25,000 to $49,999 33.9% 21.2% 8.8% 1.8% 2.1% $24,819 149
$50,000 to $199,999 34.4% 22.6% 8.0% 1.9% 1.9% $29,799 156
$200,000 to $499,999 34.0% 24.8% 6.1% 1.4% 1.7% $33,848 46
$500,000+ 36.8% 31.4% 2.8% 0.9% 1.6% $35,002 30Note: Components may not sum to totals due to rounding.
Figure 9: Tuition Discount Rates and Types of Discount by Median SAT Score at Private Four-Year Institutions, 2007-08
28.1% 30.1% 31.8%
37.2% 33.3% 34.1% 32.5%
14.4% 17.7% 17.7%
24.5%
20.0% 21.9%
27.4%
9.0% 8.4% 9.8% 8.2% 9.1% 8.5%
2.7%
0%
5%
10%
15%
20%
25%
30%
35%
40%
<1000 1000 to 1049 1050 to 1099 1100 to 1149 1150 to 1199 1200 to 1299 1300+
Tuit
ion
Dis
cou
nt
Rat
e
Median SAT Score
Total
Need-Based
Non-Need-Based
Tuition Waiver
Athletic
Note: Average ACT scores reported by institutions have been converted to equivalent SAT scores. The test scores reported represent a weighted average of SAT scores and converted ACT scores for each institution.
13
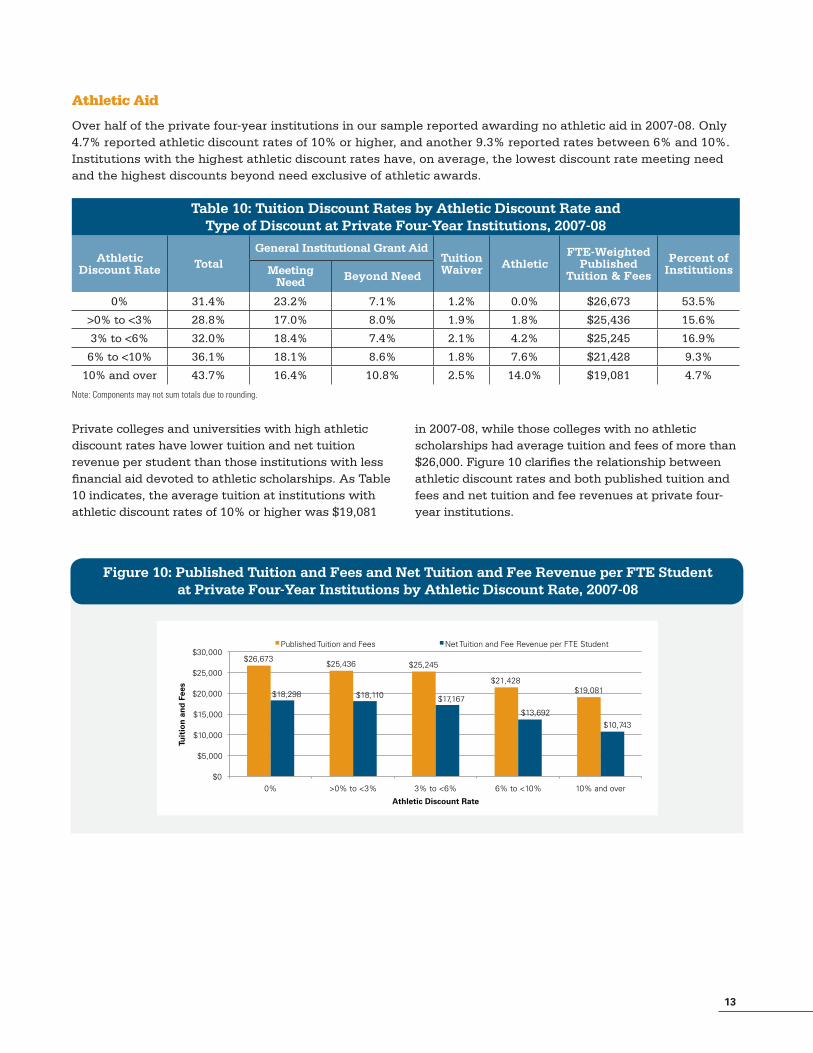
Athletic Aid
Over half of the private four-year institutions in our sample reported awarding no athletic aid in 2007-08. Only 4.7% reported athletic discount rates of 10% or higher, and another 9.3% reported rates between 6% and 10%. Institutions with the highest athletic discount rates have, on average, the lowest discount rate meeting need and the highest discounts beyond need exclusive of athletic awards.
Table 10: Tuition Discount Rates by Athletic Discount Rate and Type of Discount at Private Four-Year Institutions, 2007-08
Athletic Discount Rate Total
General Institutional Grant AidTuition Waiver Athletic
FTE-Weighted Published
Tuition & Fees
Percent of InstitutionsMeeting
Need Beyond Need
0% 31.4% 23.2% 7.1% 1.2% 0.0% $26,673 53.5%
>0% to <3% 28.8% 17.0% 8.0% 1.9% 1.8% $25,436 15.6%
3% to <6% 32.0% 18.4% 7.4% 2.1% 4.2% $25,245 16.9%
6% to <10% 36.1% 18.1% 8.6% 1.8% 7.6% $21,428 9.3%
10% and over 43.7% 16.4% 10.8% 2.5% 14.0% $19,081 4.7% Note: Components may not sum totals due to rounding.
Private colleges and universities with high athletic discount rates have lower tuition and net tuition revenue per student than those institutions with less financial aid devoted to athletic scholarships. As Table 10 indicates, the average tuition at institutions with athletic discount rates of 10% or higher was $19,081
in 2007-08, while those colleges with no athletic scholarships had average tuition and fees of more than $26,000. Figure 10 clarifies the relationship between athletic discount rates and both published tuition and fees and net tuition and fee revenues at private four-year institutions.
Figure 10: Published Tuition and Fees and Net Tuition and Fee Revenue per FTE Student at Private Four-Year Institutions by Athletic Discount Rate, 2007-08
$26,673 $25,436 $25,245
$21,428 $19,081 $18,298 $18,110 $17,167
$13,692 $10,743
$0
$5,000
$10,000
$15,000
$20,000
$25,000
$30,000
0% >0% to <3% 3% to <6% 6% to <10% 10% and over
Tuit
ion
an
d F
ees
Athletic Discount Rate
Published Tuition and Fees Net Tuition and Fee Revenue per FTE Student
14
Section 4: Public Four-Year Institutions
Public four-year colleges and universities typically have much lower tuition prices than private institutions, and they do not discount as heavily. Out-of-state students face higher charges than in-state residents, and many institutions have different aid policies for in-state and out-of-state students. Unfortunately, we are not able to accurately divide the institutional grants between these two groups of students and are therefore unable to calculate separate discount rates.
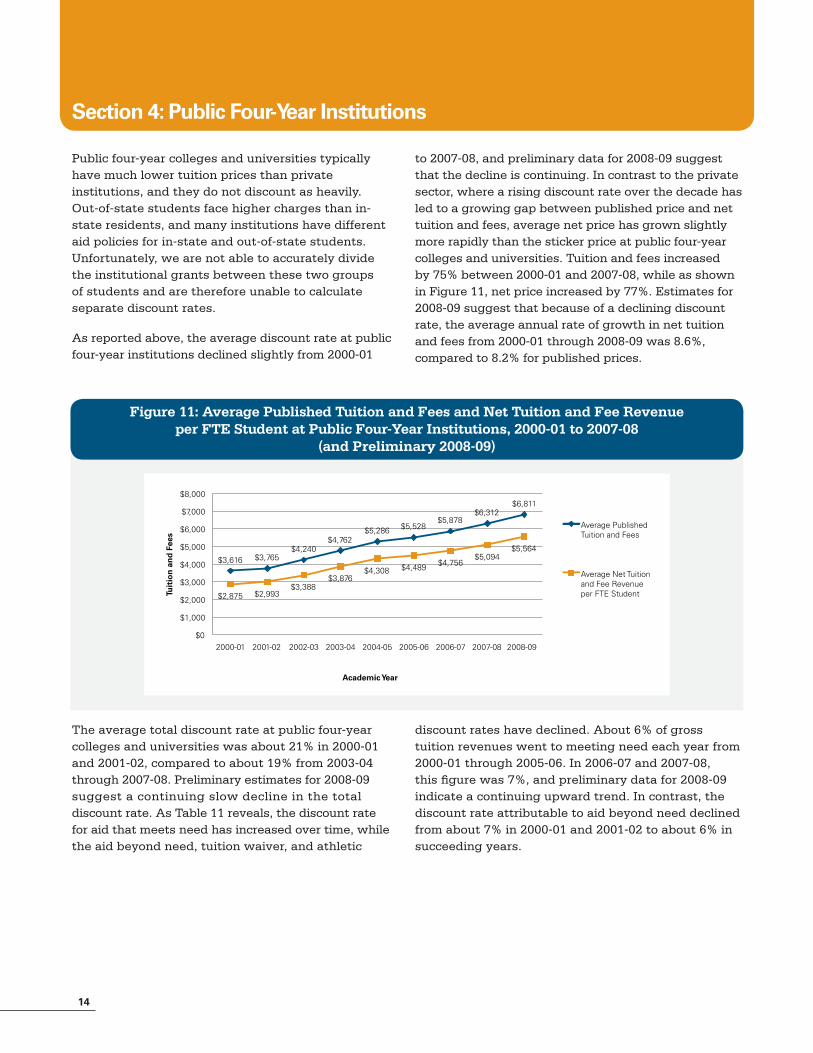
As reported above, the average discount rate at public four-year institutions declined slightly from 2000-01
to 2007-08, and preliminary data for 2008-09 suggest that the decline is continuing. In contrast to the private sector, where a rising discount rate over the decade has led to a growing gap between published price and net tuition and fees, average net price has grown slightly more rapidly than the sticker price at public four-year colleges and universities. Tuition and fees increased by 75% between 2000-01 and 2007-08, while as shown in Figure 11, net price increased by 77%. Estimates for 2008-09 suggest that because of a declining discount rate, the average annual rate of growth in net tuition and fees from 2000-01 through 2008-09 was 8.6%, compared to 8.2% for published prices.
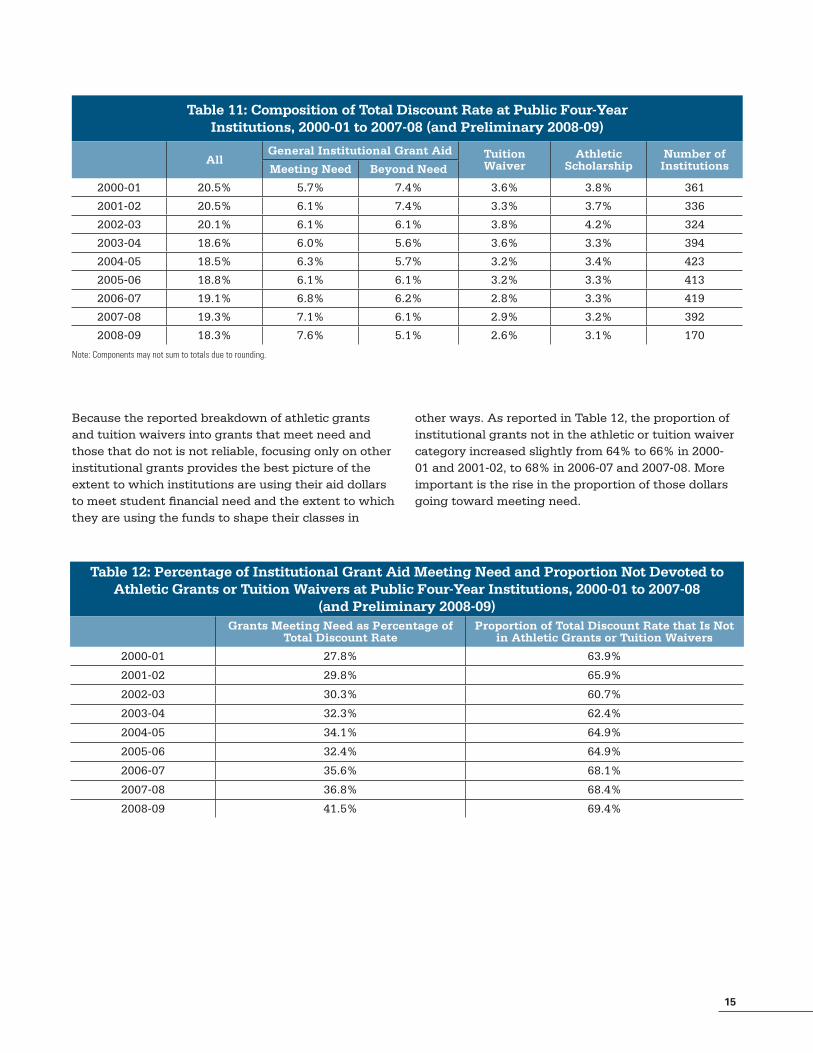
The average total discount rate at public four-year colleges and universities was about 21% in 2000-01 and 2001-02, compared to about 19% from 2003-04 through 2007-08. Preliminary estimates for 2008-09 suggest a continuing slow decline in the total discount rate. As Table 11 reveals, the discount rate for aid that meets need has increased over time, while the aid beyond need, tuition waiver, and athletic
discount rates have declined. About 6% of gross tuition revenues went to meeting need each year from 2000-01 through 2005-06. In 2006-07 and 2007-08, this figure was 7%, and preliminary data for 2008-09 indicate a continuing upward trend. In contrast, the discount rate attributable to aid beyond need declined from about 7% in 2000-01 and 2001-02 to about 6% in succeeding years.
Figure 11: Average Published Tuition and Fees and Net Tuition and Fee Revenue per FTE Student at Public Four-Year Institutions, 2000-01 to 2007-08
(and Preliminary 2008-09)
$3,616 $3,765 $4,240
$4,762 $5,286 $5,528
$5,878 $6,312
$6,811
$2,875 $2,993 $3,388
$3,876 $4,308 $4,489 $4,756
$5,094 $5,564
$0
$1,000
$2,000
$3,000
$4,000
$5,000
$6,000
$7,000
$8,000
2000-01 2001-02 2002-03 2003-04 2004-05 2005-06 2006-07 2007-08 2008-09
Tuit
ion
an
d F
ees
Academic Year
Average Published Tuition and Fees
Average Net Tuition and Fee Revenue per FTE Student
15
Table 11: Composition of Total Discount Rate at Public Four-Year Institutions, 2000-01 to 2007-08 (and Preliminary 2008-09)
AllGeneral Institutional Grant Aid Tuition
WaiverAthletic
ScholarshipNumber of InstitutionsMeeting Need Beyond Need
2000-01 20.5% 5.7% 7.4% 3.6% 3.8% 361
2001-02 20.5% 6.1% 7.4% 3.3% 3.7% 336
2002-03 20.1% 6.1% 6.1% 3.8% 4.2% 324
2003-04 18.6% 6.0% 5.6% 3.6% 3.3% 394
2004-05 18.5% 6.3% 5.7% 3.2% 3.4% 423
2005-06 18.8% 6.1% 6.1% 3.2% 3.3% 413
2006-07 19.1% 6.8% 6.2% 2.8% 3.3% 419
2007-08 19.3% 7.1% 6.1% 2.9% 3.2% 392
2008-09 18.3% 7.6% 5.1% 2.6% 3.1% 170
Note: Components may not sum to totals due to rounding.
Table 12: Percentage of Institutional Grant Aid Meeting Need and Proportion Not Devoted to Athletic Grants or Tuition Waivers at Public Four-Year Institutions, 2000-01 to 2007-08
(and Preliminary 2008-09) Grants Meeting Need as Percentage of
Total Discount RateProportion of Total Discount Rate that Is Not
in Athletic Grants or Tuition Waivers
2000-01 27.8% 63.9%
2001-02 29.8% 65.9%
2002-03 30.3% 60.7%
2003-04 32.3% 62.4%
2004-05 34.1% 64.9%
2005-06 32.4% 64.9%
2006-07 35.6% 68.1%
2007-08 36.8% 68.4%
2008-09 41.5% 69.4%
Because the reported breakdown of athletic grants and tuition waivers into grants that meet need and those that do not is not reliable, focusing only on other institutional grants provides the best picture of the extent to which institutions are using their aid dollars to meet student financial need and the extent to which they are using the funds to shape their classes in
other ways. As reported in Table 12, the proportion of institutional grants not in the athletic or tuition waiver category increased slightly from 64% to 66% in 2000-01 and 2001-02, to 68% in 2006-07 and 2007-08. More important is the rise in the proportion of those dollars going toward meeting need.
16
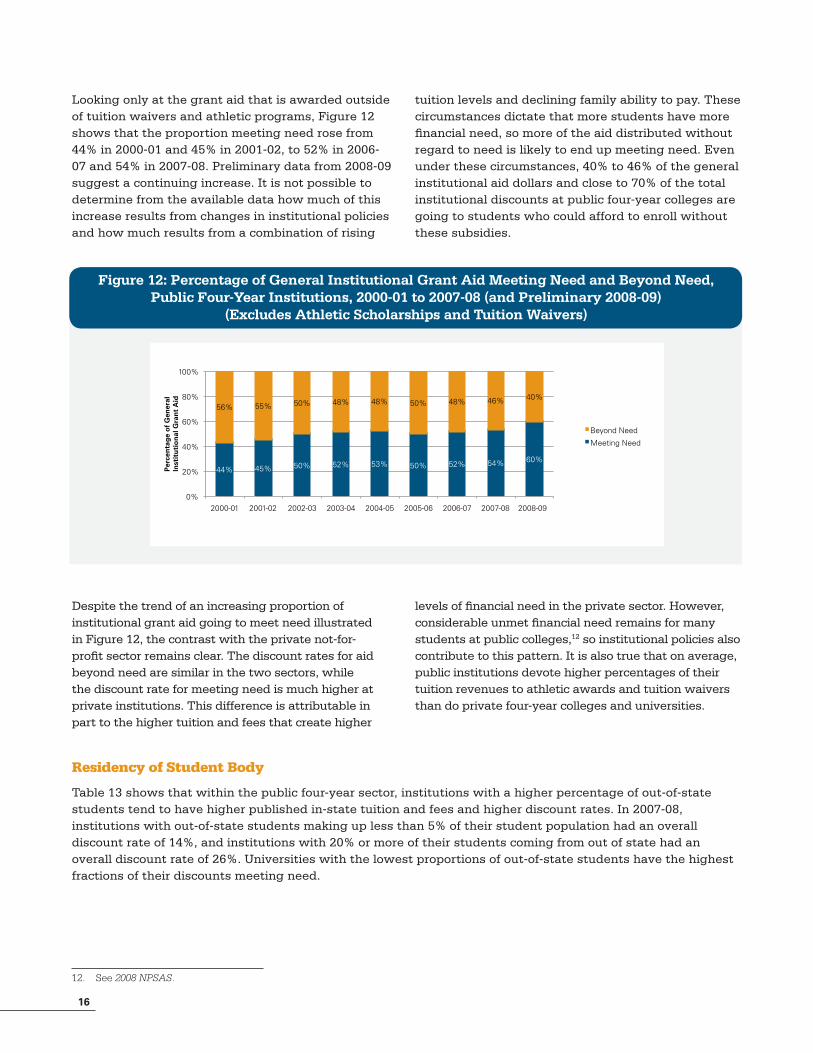
Looking only at the grant aid that is awarded outside of tuition waivers and athletic programs, Figure 12 shows that the proportion meeting need rose from 44% in 2000-01 and 45% in 2001-02, to 52% in 2006-07 and 54% in 2007-08. Preliminary data from 2008-09 suggest a continuing increase. It is not possible to determine from the available data how much of this increase results from changes in institutional policies and how much results from a combination of rising
tuition levels and declining family ability to pay. These circumstances dictate that more students have more financial need, so more of the aid distributed without regard to need is likely to end up meeting need. Even under these circumstances, 40% to 46% of the general institutional aid dollars and close to 70% of the total institutional discounts at public four-year colleges are going to students who could afford to enroll without these subsidies.
Despite the trend of an increasing proportion of institutional grant aid going to meet need illustrated in Figure 12, the contrast with the private not-for-profit sector remains clear. The discount rates for aid beyond need are similar in the two sectors, while the discount rate for meeting need is much higher at private institutions. This difference is attributable in part to the higher tuition and fees that create higher
levels of financial need in the private sector. However, considerable unmet financial need remains for many students at public colleges,12 so institutional policies also contribute to this pattern. It is also true that on average, public institutions devote higher percentages of their tuition revenues to athletic awards and tuition waivers than do private four-year colleges and universities.
Residency of Student Body
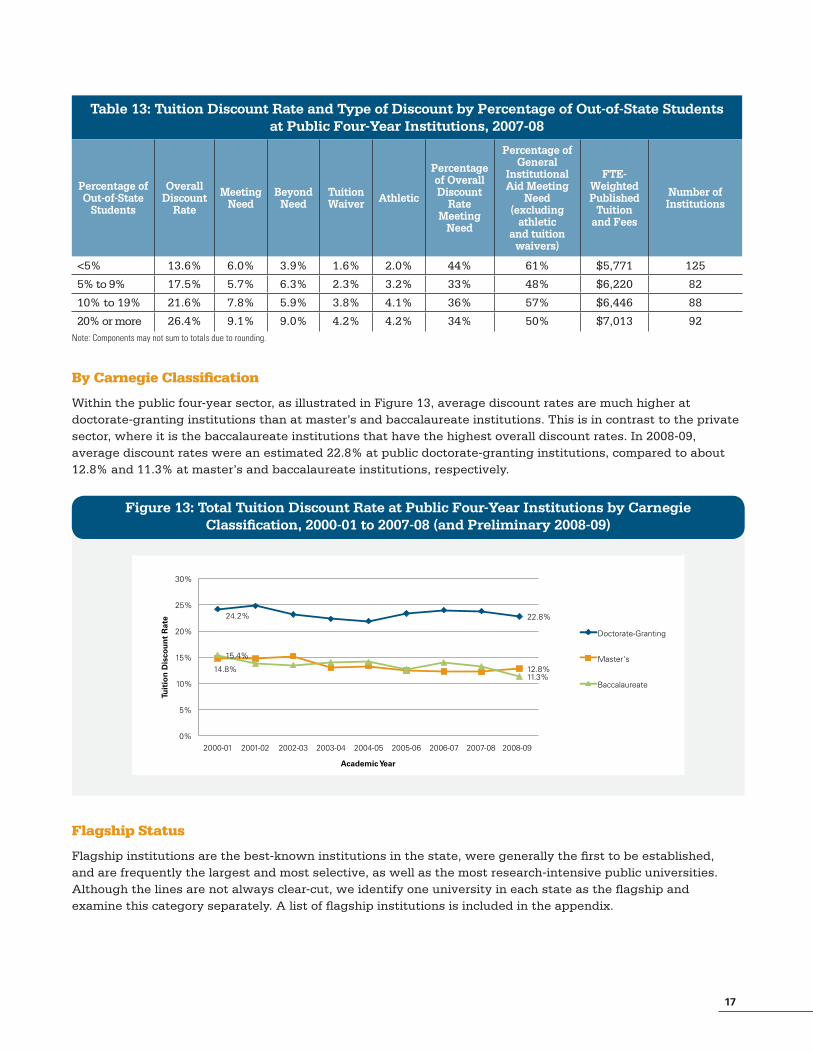
Table 13 shows that within the public four-year sector, institutions with a higher percentage of out-of-state students tend to have higher published in-state tuition and fees and higher discount rates. In 2007-08, institutions with out-of-state students making up less than 5% of their student population had an overall discount rate of 14%, and institutions with 20% or more of their students coming from out of state had an overall discount rate of 26%. Universities with the lowest proportions of out-of-state students have the highest fractions of their discounts meeting need.
12. See 2008 NPSAS.
Figure 12: Percentage of General Institutional Grant Aid Meeting Need and Beyond Need, Public Four-Year Institutions, 2000-01 to 2007-08 (and Preliminary 2008-09)
(Excludes Athletic Scholarships and Tuition Waivers)
44% 45% 50% 52% 53% 50% 52% 54% 60%
56% 55% 50% 48% 48% 50% 48% 46% 40%
0%
20%
40%
60%
80%
100%
2000-01 2001-02 2002-03 2003-04 2004-05 2005-06 2006-07 2007-08 2008-09
Beyond Need
Meeting Need
Per
cen
tag
e o
f G
ener
alIn
stit
uti
on
al G
ran
t A
id
17
Table 13: Tuition Discount Rate and Type of Discount by Percentage of Out-of-State Students at Public Four-Year Institutions, 2007-08
Percentage of Out-of-State
Students
Overall Discount
Rate
Meeting Need
Beyond Need
Tuition Waiver Athletic
Percentage of Overall Discount
Rate Meeting
Need
Percentage of General
Institutional Aid Meeting
Need (excluding
athletic and tuition waivers)
FTE-Weighted Published
Tuition and Fees
Number of Institutions
<5% 13.6% 6.0% 3.9% 1.6% 2.0% 44% 61% $5,771 125
5% to 9% 17.5% 5.7% 6.3% 2.3% 3.2% 33% 48% $6,220 82
10% to 19% 21.6% 7.8% 5.9% 3.8% 4.1% 36% 57% $6,446 88
20% or more 26.4% 9.1% 9.0% 4.2% 4.2% 34% 50% $7,013 92Note: Components may not sum to totals due to rounding.
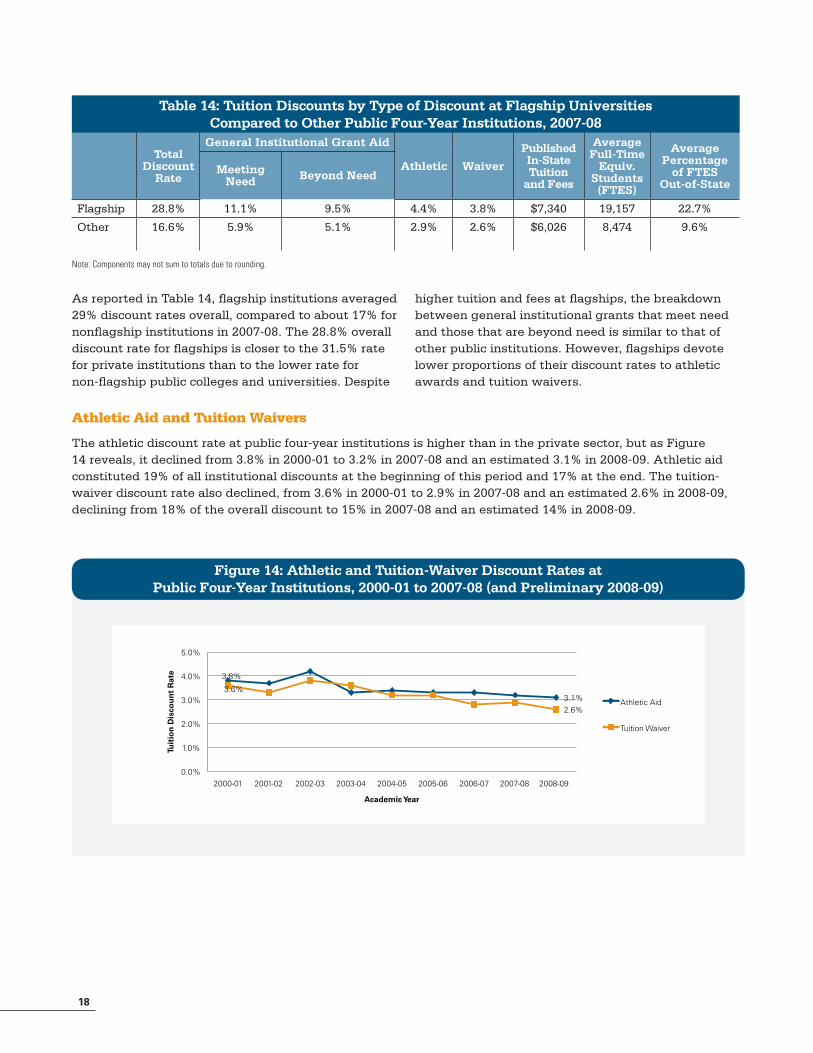
By Carnegie Classification
Within the public four-year sector, as illustrated in Figure 13, average discount rates are much higher at doctorate-granting institutions than at master’s and baccalaureate institutions. This is in contrast to the private sector, where it is the baccalaureate institutions that have the highest overall discount rates. In 2008-09, average discount rates were an estimated 22.8% at public doctorate-granting institutions, compared to about 12.8% and 11.3% at master’s and baccalaureate institutions, respectively.
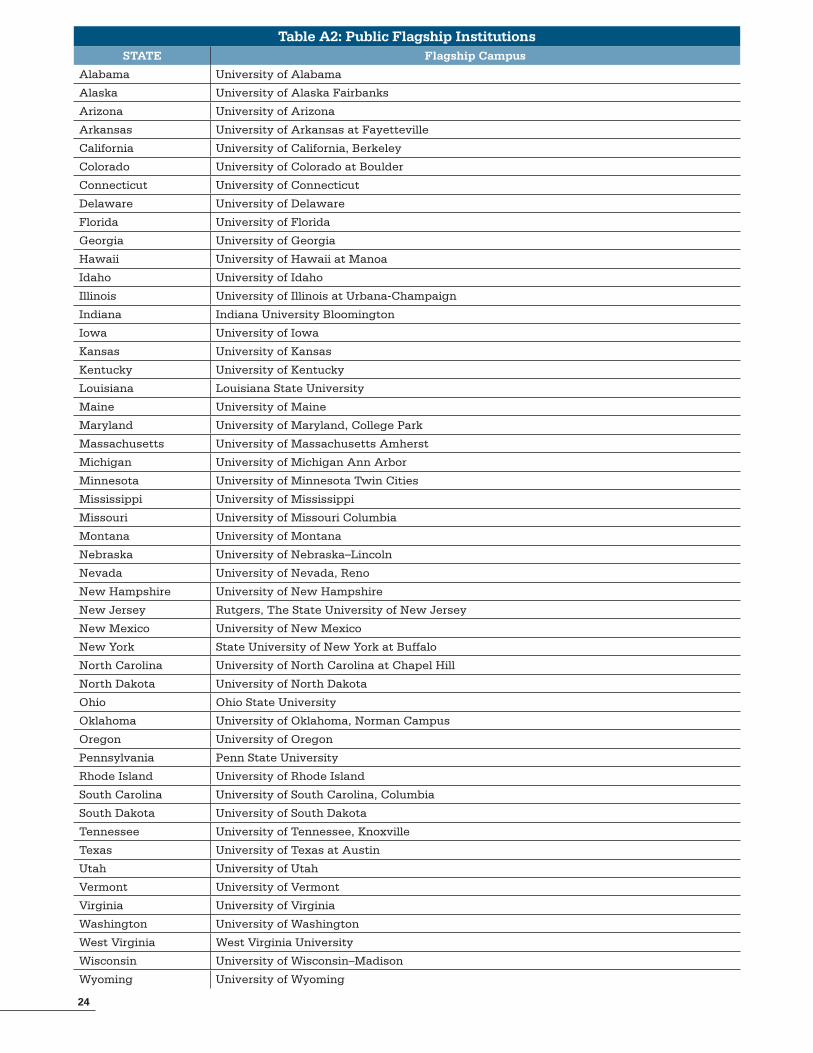
Flagship Status
Flagship institutions are the best-known institutions in the state, were generally the first to be established, and are frequently the largest and most selective, as well as the most research-intensive public universities. Although the lines are not always clear-cut, we identify one university in each state as the flagship and examine this category separately. A list of flagship institutions is included in the appendix.
Figure 13: Total Tuition Discount Rate at Public Four-Year Institutions by Carnegie Classification, 2000-01 to 2007-08 (and Preliminary 2008-09)
24.2% 22.8%
14.8% 12.8%
15.4%
11.3%
0%
5%
10%
15%
20%
25%
30%
2000-01 2001-02 2002-03 2003-04 2004-05 2005-06 2006-07 2007-08 2008-09
Tuit
ion
Dis
cou
nt
Rat
e
Academic Year
Doctorate-Granting
Master's
Baccalaureate
18
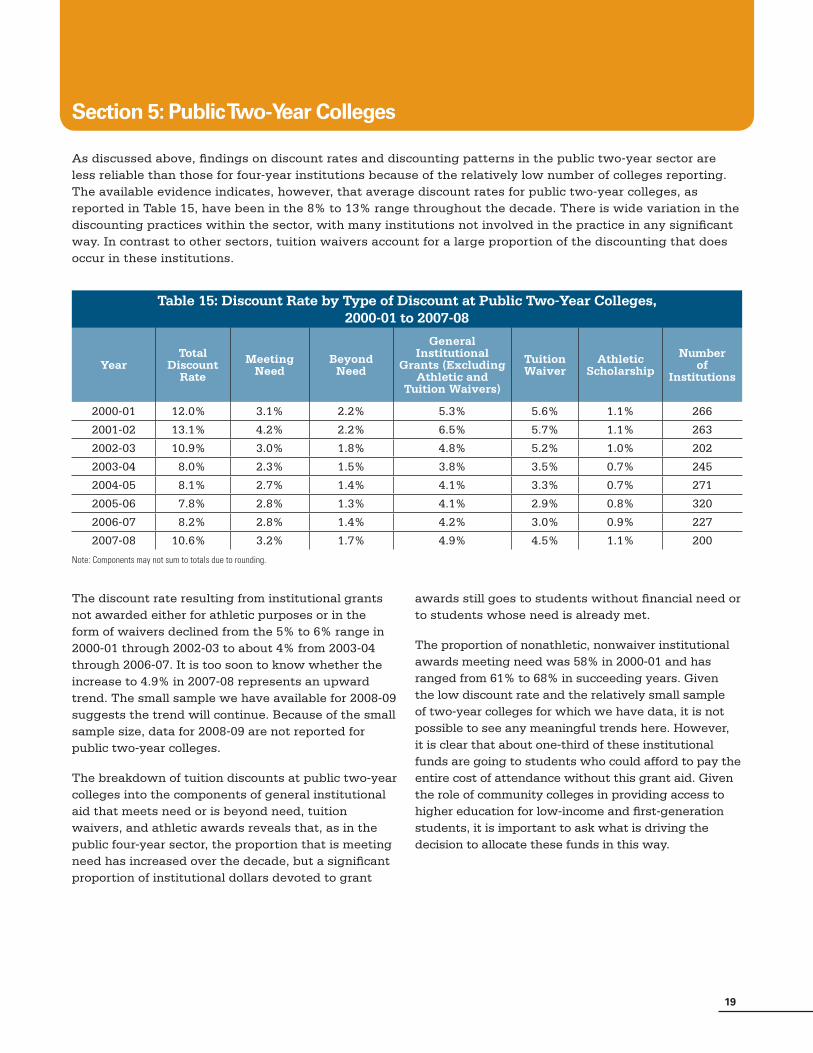
Table 14: Tuition Discounts by Type of Discount at Flagship Universities Compared to Other Public Four-Year Institutions, 2007-08
Total Discount
Rate
General Institutional Grant Aid
Athletic Waiver
Published In-State Tuition
and Fees
Average Full-Time
Equiv. Students (FTES)
Average Percentage
of FTES Out-of-State
Meeting Need Beyond Need
Flagship 28.8% 11.1% 9.5% 4.4% 3.8% $7,340 19,157 22.7%
Other 16.6% 5.9% 5.1% 2.9% 2.6% $6,026 8,474 9.6%
Note: Components may not sum to totals due to rounding.
As reported in Table 14, flagship institutions averaged 29% discount rates overall, compared to about 17% for nonflagship institutions in 2007-08. The 28.8% overall discount rate for flagships is closer to the 31.5% rate for private institutions than to the lower rate for non-flagship public colleges and universities. Despite
higher tuition and fees at flagships, the breakdown between general institutional grants that meet need and those that are beyond need is similar to that of other public institutions. However, flagships devote lower proportions of their discount rates to athletic awards and tuition waivers.
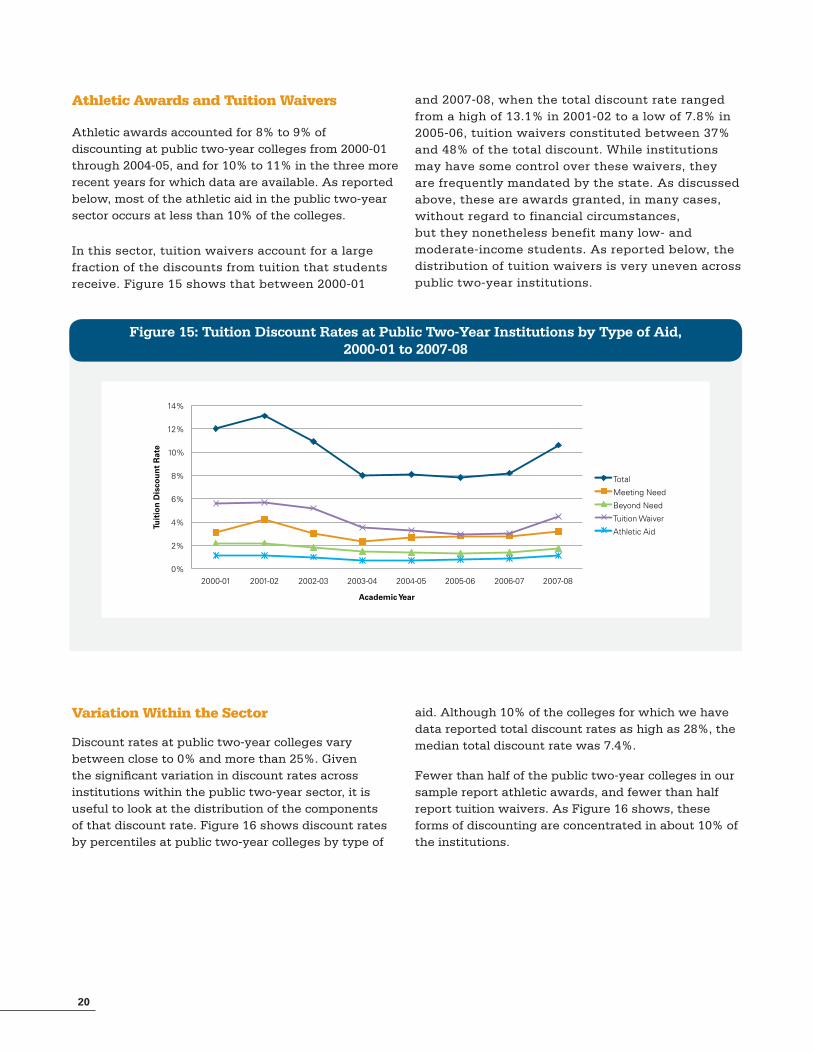
Athletic Aid and Tuition Waivers
The athletic discount rate at public four-year institutions is higher than in the private sector, but as Figure 14 reveals, it declined from 3.8% in 2000-01 to 3.2% in 2007-08 and an estimated 3.1% in 2008-09. Athletic aid constituted 19% of all institutional discounts at the beginning of this period and 17% at the end. The tuition-waiver discount rate also declined, from 3.6% in 2000-01 to 2.9% in 2007-08 and an estimated 2.6% in 2008-09, declining from 18% of the overall discount to 15% in 2007-08 and an estimated 14% in 2008-09.
Figure 14: Athletic and Tuition-Waiver Discount Rates at Public Four-Year Institutions, 2000-01 to 2007-08 (and Preliminary 2008-09)
3.6% 3.1%
3.8%
2.6%
0.0%
1.0%
2.0%
3.0%
4.0%
5.0%
2000-01 2001-02 2002-03 2003-04 2004-05 2005-06 2006-07 2007-08 2008-09
Tuit
ion
Dis
cou
nt
Rat
e
Academic Year
Athletic Aid
Tuition Waiver
19
Section 5: Public Two-Year Colleges
As discussed above, findings on discount rates and discounting patterns in the public two-year sector are less reliable than those for four-year institutions because of the relatively low number of colleges reporting. The available evidence indicates, however, that average discount rates for public two-year colleges, as reported in Table 15, have been in the 8% to 13% range throughout the decade. There is wide variation in the discounting practices within the sector, with many institutions not involved in the practice in any significant way. In contrast to other sectors, tuition waivers account for a large proportion of the discounting that does occur in these institutions.
Table 15: Discount Rate by Type of Discount at Public Two-Year Colleges, 2000-01 to 2007-08
YearTotal
Discount Rate
Meeting Need
Beyond Need
General Institutional
Grants (Excluding Athletic and
Tuition Waivers)
Tuition Waiver
Athletic Scholarship
Number of
Institutions
2000-01 12.0% 3.1% 2.2% 5.3% 5.6% 1.1% 266
2001-02 13.1% 4.2% 2.2% 6.5% 5.7% 1.1% 263
2002-03 10.9% 3.0% 1.8% 4.8% 5.2% 1.0% 202
2003-04 8.0% 2.3% 1.5% 3.8% 3.5% 0.7% 245
2004-05 8.1% 2.7% 1.4% 4.1% 3.3% 0.7% 271
2005-06 7.8% 2.8% 1.3% 4.1% 2.9% 0.8% 320
2006-07 8.2% 2.8% 1.4% 4.2% 3.0% 0.9% 227
2007-08 10.6% 3.2% 1.7% 4.9% 4.5% 1.1% 200
Note: Components may not sum to totals due to rounding.
The discount rate resulting from institutional grants not awarded either for athletic purposes or in the form of waivers declined from the 5% to 6% range in 2000-01 through 2002-03 to about 4% from 2003-04 through 2006-07. It is too soon to know whether the increase to 4.9% in 2007-08 represents an upward trend. The small sample we have available for 2008-09 suggests the trend will continue. Because of the small sample size, data for 2008-09 are not reported for public two-year colleges.
The breakdown of tuition discounts at public two-year colleges into the components of general institutional aid that meets need or is beyond need, tuition waivers, and athletic awards reveals that, as in the public four-year sector, the proportion that is meeting need has increased over the decade, but a significant proportion of institutional dollars devoted to grant
awards still goes to students without financial need or to students whose need is already met.
The proportion of nonathletic, nonwaiver institutional awards meeting need was 58% in 2000-01 and has ranged from 61% to 68% in succeeding years. Given the low discount rate and the relatively small sample of two-year colleges for which we have data, it is not possible to see any meaningful trends here. However, it is clear that about one-third of these institutional funds are going to students who could afford to pay the entire cost of attendance without this grant aid. Given the role of community colleges in providing access to higher education for low-income and first-generation students, it is important to ask what is driving the decision to allocate these funds in this way.
20
Athletic Awards and Tuition Waivers
Athletic awards accounted for 8% to 9% of discounting at public two-year colleges from 2000-01 through 2004-05, and for 10% to 11% in the three more recent years for which data are available. As reported below, most of the athletic aid in the public two-year sector occurs at less than 10% of the colleges.
In this sector, tuition waivers account for a large fraction of the discounts from tuition that students receive. Figure 15 shows that between 2000-01
and 2007-08, when the total discount rate ranged from a high of 13.1% in 2001-02 to a low of 7.8% in 2005-06, tuition waivers constituted between 37% and 48% of the total discount. While institutions may have some control over these waivers, they are frequently mandated by the state. As discussed above, these are awards granted, in many cases, without regard to financial circumstances, but they nonetheless benefit many low- and moderate-income students. As reported below, the distribution of tuition waivers is very uneven across public two-year institutions.
Variation Within the Sector
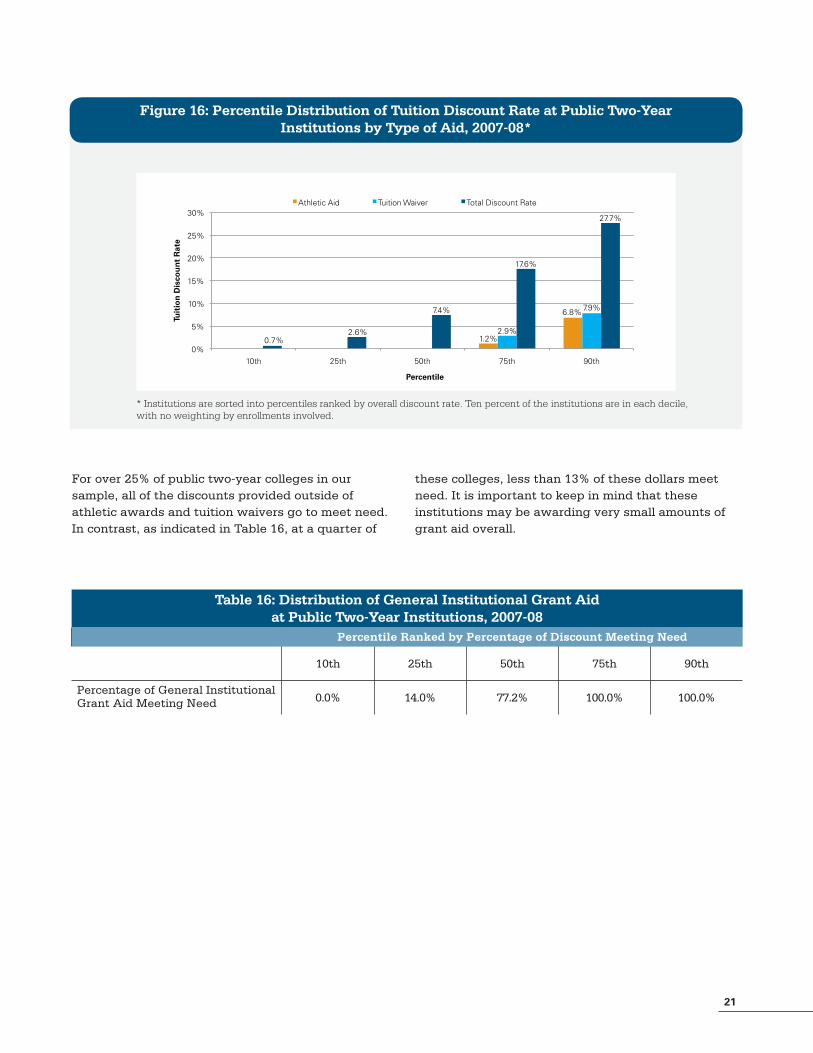
Discount rates at public two-year colleges vary between close to 0% and more than 25%. Given the significant variation in discount rates across institutions within the public two-year sector, it is useful to look at the distribution of the components of that discount rate. Figure 16 shows discount rates by percentiles at public two-year colleges by type of
aid. Although 10% of the colleges for which we have data reported total discount rates as high as 28%, the median total discount rate was 7.4%.
Fewer than half of the public two-year colleges in our sample report athletic awards, and fewer than half report tuition waivers. As Figure 16 shows, these forms of discounting are concentrated in about 10% of the institutions.
Figure 15: Tuition Discount Rates at Public Two-Year Institutions by Type of Aid, 2000-01 to 2007-08
0%
2%
4%
6%
8%
10%
12%
14%
2000-01 2001-02 2002-03 2003-04 2004-05 2005-06 2006-07 2007-08
Tuit
ion
Dis
cou
nt
Rat
e
Academic Year
Total
Meeting Need
Beyond Need
Tuition Waiver
Athletic Aid
21
For over 25% of public two-year colleges in our sample, all of the discounts provided outside of athletic awards and tuition waivers go to meet need. In contrast, as indicated in Table 16, at a quarter of
these colleges, less than 13% of these dollars meet need. It is important to keep in mind that these institutions may be awarding very small amounts of grant aid overall.
Table 16: Distribution of General Institutional Grant Aid at Public Two-Year Institutions, 2007-08
Percentile Ranked by Percentage of Discount Meeting Need
10th 25th 50th 75th 90th
Percentage of General Institutional Grant Aid Meeting Need 0.0% 14.0% 77.2% 100.0% 100.0%
Figure 16: Percentile Distribution of Tuition Discount Rate at Public Two-Year Institutions by Type of Aid, 2007-08*
1.2%
6.8%
2.9%
7.9%
0.7% 2.6%
7.4%
17.6%
27.7%
0%
5%
10%
15%
20%
25%
30%
10th 25th 50th 75th 90th
Tuit
ion
Dis
cou
nt
Rat
e
Percentile
Athletic Aid Tuition Waiver Total Discount Rate
* Institutions are sorted into percentiles ranked by overall discount rate. Ten percent of the institutions are in each decile, with no weighting by enrollments involved.
22
Section 6: Conclusion
Tuition discounting is pervasive in higher education. Prices net of institutional grants and tuition waivers average about 10% below the published price at public two-year colleges, about 20% below the published price at public four-year institutions, and about 33% below the published price at private not-for-profit four-year colleges and universities. There is considerable variation in discount rates across institutions within sectors, and even the average net price at a particular institution tells individual students little about the price the student would pay to enroll. This complex pricing strategy has a number of advantages for institutions, which can charge different prices to selected students depending on their financial circumstances or the academic, athletic, or other characteristics that make them either particularly attractive or relatively unattractive to the institution. From a broader social perspective, being able to differentiate by ability to pay is compelling. Even if college prices were to be frozen today — and in fact even if they were to fall dramatically — there would be many students for whom college would be out of reach without financial aid. Because providing education is costly, and someone must pay those costs, it is arguably both equitable and efficient to target subsidies specifically at those with inadequate financial means.
From a social perspective, then, the breakdown of institutional discounts between those that help to meet the financial need of students and those that simply subsidize students who could afford to enroll without them is critical. Our findings reveal that at public four-year colleges and universities, as indicated in Table 11, these pure subsidies amount to about 5% to 6% of gross tuition revenues, compared to 7% to 8% devoted to meeting need. About another 6% goes to a combination of athletic awards and tuition waivers. Table 5 reports that at private not-for-profit four-year institutions, these pure subsidies amount to about 8% of gross tuition revenues, compared to 20% to 21% devoted to meeting need. Athletic awards account for about 4% of the gross tuition revenues. Relatively larger proportions of grant aid go to purposes beyond need at private colleges with low tuition and at those with low endowments. The same groups of colleges tend to devote significant resources to enrolling athletes. These institutions, which enroll larger
proportions of low- and moderate-income students than do better-financed colleges, face the greatest challenges in filling their classes and in generating revenues. Still, the discounting pattern is reflected in high levels of unmet need and probably higher debt levels for students with financial need than would otherwise be the case.
In the public sector, the proportion of aid dollars going to subsidize those who can afford to pay is an issue that should be addressed in public policy discussions. Whether the funds are from public or private sources, their allocation helps to determine the profile of the student body and the effective mission of public higher education. In an era of unusually constrained finances, it is particularly important to ensure that available dollars are distributed both equitably and efficiently.
It is encouraging that the percentage of the discount that is going to meet need is rising over time. This will make a positive difference if it is the result of institutional policies. But to the extent that it reflects rising tuition prices and greater financial need among the student body, the ratio will have to change more rapidly in order to ensure access to public higher education for as many students as possible.
Aid that meets need and helps provide access to college for low- and moderate-income students is vital, but we believe that both institutions and public policymakers should give serious consideration to reducing the awarding of characteristic-based aid to students without financial need. In addition to targeting subsidies at the students who need them most and whose college enrollment patterns are most sensitive to price, this change could result in net prices among colleges and universities that are more predictable. Supplemented by the net price calculators soon to be required on institutional websites, this simplified pricing strategy would provide students with better information up front as to what they would be likely to pay at the schools among which they are choosing. Further simplification in the process for allocating federal need-based aid would also make aid and net prices more predictable for students.

23
College Board. (2009a). Trends in college pricing 2009. Retrieved from www.trends-collegeboard.com/college_pricing/
College Board. (2009b). Trends in student aid 2009. Retrieved from www.trends-collegeboard.com/student_aid/
National Association of College and University Business Officers. (2009). NACUBO tuition discounting study. Retrieved from http://www.nacubo.org/Research/NACUBO_Tuition_Discounting_Study.html
National Center for Educational Statistics. (2008). 2008 National postsecondary student aid study. Retrieved from http://nces.ed.gov/pubsearch/pubsinfo.asp?pubid=200801
Appendix
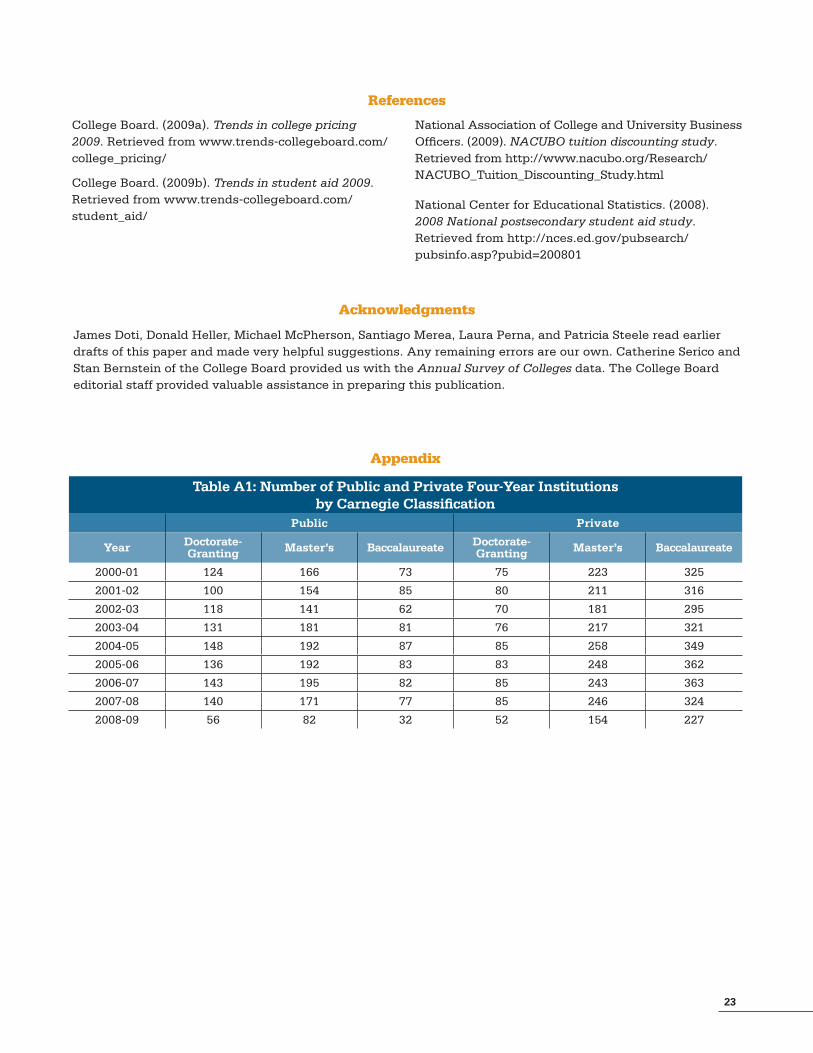
Table A1: Number of Public and Private Four-Year Institutions by Carnegie Classification
Public Private
Year Doctorate-Granting Master’s Baccalaureate Doctorate-
Granting Master’s Baccalaureate
2000-01 124 166 73 75 223 325
2001-02 100 154 85 80 211 316
2002-03 118 141 62 70 181 295
2003-04 131 181 81 76 217 321
2004-05 148 192 87 85 258 349
2005-06 136 192 83 83 248 362
2006-07 143 195 82 85 243 363
2007-08 140 171 77 85 246 324
2008-09 56 82 32 52 154 227
References
Acknowledgments
James Doti, Donald Heller, Michael McPherson, Santiago Merea, Laura Perna, and Patricia Steele read earlier drafts of this paper and made very helpful suggestions. Any remaining errors are our own. Catherine Serico and Stan Bernstein of the College Board provided us with the Annual Survey of Colleges data. The College Board editorial staff provided valuable assistance in preparing this publication.

24
Table A2: Public Flagship InstitutionsSTATE Flagship Campus
Alabama University of Alabama
Alaska University of Alaska Fairbanks
Arizona University of Arizona
Arkansas University of Arkansas at Fayetteville
California University of California, Berkeley
Colorado University of Colorado at Boulder
Connecticut University of Connecticut
Delaware University of Delaware
Florida University of Florida
Georgia University of Georgia
Hawaii University of Hawaii at Manoa
Idaho University of Idaho
Illinois University of Illinois at Urbana-Champaign
Indiana Indiana University Bloomington
Iowa University of Iowa
Kansas University of Kansas
Kentucky University of Kentucky
Louisiana Louisiana State University
Maine University of Maine
Maryland University of Maryland, College Park
Massachusetts University of Massachusetts Amherst
Michigan University of Michigan Ann Arbor
Minnesota University of Minnesota Twin Cities
Mississippi University of Mississippi
Missouri University of Missouri Columbia
Montana University of Montana
Nebraska University of Nebraska–Lincoln
Nevada University of Nevada, Reno
New Hampshire University of New Hampshire
New Jersey Rutgers, The State University of New Jersey
New Mexico University of New Mexico
New York State University of New York at Buffalo
North Carolina University of North Carolina at Chapel Hill
North Dakota University of North Dakota
Ohio Ohio State University
Oklahoma University of Oklahoma, Norman Campus
Oregon University of Oregon
Pennsylvania Penn State University
Rhode Island University of Rhode Island
South Carolina University of South Carolina, Columbia
South Dakota University of South Dakota
Tennessee University of Tennessee, Knoxville
Texas University of Texas at Austin
Utah University of Utah
Vermont University of Vermont
Virginia University of Virginia
Washington University of Washington
West Virginia West Virginia University
Wisconsin University of Wisconsin–Madison
Wyoming University of Wyoming


10b-1976