tuning the nature of defect states in black tio2
TRANSCRIPT

American University in Cairo American University in Cairo
AUC Knowledge Fountain AUC Knowledge Fountain
Theses and Dissertations Student Research
2-1-2018
Tuning the nature of defect states in black TiO2 nanostructures Tuning the nature of defect states in black TiO2 nanostructures
Moamen Mohamed Soliman
Follow this and additional works at: https://fount.aucegypt.edu/etds
Recommended Citation Recommended Citation
APA Citation Soliman, M. (2018).Tuning the nature of defect states in black TiO2 nanostructures [Master's Thesis, the American University in Cairo]. AUC Knowledge Fountain. https://fount.aucegypt.edu/etds/716
MLA Citation Soliman, Moamen Mohamed. Tuning the nature of defect states in black TiO2 nanostructures. 2018. American University in Cairo, Master's Thesis. AUC Knowledge Fountain. https://fount.aucegypt.edu/etds/716
This Master's Thesis is brought to you for free and open access by the Student Research at AUC Knowledge Fountain. It has been accepted for inclusion in Theses and Dissertations by an authorized administrator of AUC Knowledge Fountain. For more information, please contact [email protected].
The American University in Cairo
The Graduate School
The Nanotechnology Program
Tuning the Nature of Defect States in Black TiO2 Nanostructures
A Thesis in
Nanotechnology
By
Moamen Mohamed Soliman
Submitted in partial fulfillment of
the requirements of the degree of
Masters of Science in Nanotechnology
©2017 Moamen Mohamed Soliman
August 2017

2

3
ABSTRACT
Black TiO2 is being widely investigated due to its superior optical activity. Herein, the
limitations of the hydrogenation process are unraveled by exploiting the fundamental tradeoffs
affecting the overall efficiency of the water splitting process. Different reduction rates are applied
to sub-100 nm TiO2 highly efficient short nanotubes. X-ray photoelectron spectroscopy reveals
changes in the stoichiometry of TiO2 with the reduction rate. UV-Vis and Raman spectra reveal
that high reduction rates promote the formation of the rutile phase in TiO2, which is inactive
towards water splitting. The electrochemical analysis discloses that low reduction rates induce
higher concentration of localized electronic defect states that hinder the water splitting
performance. Finally, incident photon-to-current conversion efficiency (IPCE) points out to the
optimum reduction rate that attains relatively lower defects concentration as well as lower rutile
content, thereby achieving the highest conversion efficiency.

4
The thesis of Moamen Mohamed Soliman was reviewed and approved* by the following:
Nageh K. Allam
Associate Professor,
Physics Department,
Energy of Materials Laboratory (EML),
The American University in Cairo,
Thesis Advisor,
Committee Chair.
Mohammad T. AlFiky
Assistant Professor,
Physics Department,
The American University in Cairo,
Internal Examiner.
Aiat Hegazy
Assistant Professor,
Solar Energy Department,
National Research Center,
External Examiner.
Adel M. Awad
Professor
Physics Department,
The American University in Cairo,
Moderator
*Signatures are on file in the Graduate School.

5
Table of Contents
ABSTRACT ...................................................................................................................................................... 3
List of Figures ................................................................................................................................................ 7
Acknowledgement ...................................................................................................................................... 10
Chapter 1: Introduction and Scope of the Thesis ....................................................................................... 11
1.1 Energy Demand ........................................................................................................................... 11
1.2 Objectives and Scope of the Thesis ............................................................................................ 15
References .............................................................................................................................................. 16
Chapter 2: Scientific Background ........................................................................................................ 17
2.1 Water Splitting Process ............................................................................................................... 17
2.2 Electrode Characteristics ............................................................................................................ 19
2.2.1 Band Gap Width......................................................................................................................... 20
2.2.2 Band Edge Position .................................................................................................................... 21
2.2.3 Charge Carrier Dynamics ........................................................................................................... 23
References .............................................................................................................................................. 24
Chapter 3: Literature Survey ............................................................................................................... 25
3.1 Straddling and Stability ............................................................................................................... 25
3.2 Improving Charge Dynamics ....................................................................................................... 25
3.3 Reducing the Band Gap ............................................................................................................... 26
3.4 Disordered Surface Structure: .................................................................................................... 27
3.5 Ti3+ and Oxygen Vacancies .......................................................................................................... 28
3.6 Ti-OH and Ti-H Groups ................................................................................................................ 29
3.7 Optical Absorption ...................................................................................................................... 29
3.8 Theoretical Calculation ............................................................................................................... 30
3.9 Charge Carrier Transfer Property ................................................................................................ 31
3.10 Black TiO2 review ........................................................................................................................ 31
References .............................................................................................................................................. 38
Chapter 4: Experimental Methods and Materials .............................................................................. 46
4.1 Electrode Synthesis: .................................................................................................................... 46
4.2 Electrodes Characterization ........................................................................................................ 47
4.3 Photoelectrochemical Analysis ................................................................................................... 48
References .............................................................................................................................................. 50
Chapter 5: Results and discussion ....................................................................................................... 51

6
5.1 Chemical Analysis ........................................................................................................................ 51
5.2 Optical Characterization ............................................................................................................. 58
5.3 Photoelectrochemical Analysis ................................................................................................... 63
References .............................................................................................................................................. 68
Future Work ................................................................................................................................................ 73
• Thin Nanotubes ............................................................................................................................... 73
• Metal Doped Hydrogenated TiO2 .................................................................................................... 73
Publication .................................................................................................................................................. 74

7
List of Figures
Figure 1.1: Primary energy sources and their use in hydrogen production [9]. ............................ 14
Figure 2.1: Structure of photo-electrochemical cell for water splitting [1]. ................................. 18
Figure 2.2: Schematic diagram of PEC presenting the dynamics of water splitting reaction [1] . 19
Figure 2.3: Water redox potentials shown relative to the band gaps of different semiconductors [3]
....................................................................................................................................................... 21
Figure 2.4: Decomposition potentials of different semiconductors drawn wrt water redox potentials
[4]. ................................................................................................................................................. 22
Figure 3.1: High-angle annular dark-field image (left) and schematic of the black TiO2 surface
(right). ........................................................................................................................................... 28
Figure 3.2: Full Density of States of the three polymorphs of TiO2 anatase, brookite and rutile for
(a) intrinsic, (b) interstitial and (c) substitutional hydrogen [8].................................................... 33
Figure 3.3: Proposed energy band diagram for black TiO2 [12]. .................................................. 34
Figure 3.4: Proposed energy band diagram model for hydrogenated TiO2 [24]. ....................... 35
Figure 3.5:(a) IPCE of TiO2 treated at different temperatures (b) Proposed energy band diagram
of hydrogen treated TiO2 [13]. ...................................................................................................... 36
Figure 3.6: (a) Energy band diagram model (b) Density of states of white and black TiO2 [10]. 36
Figure 3.7: Energy band gap diagram of reduced TiO2 Vs. white TiO2 [11]. .............................. 37
Figure 4.1: Anodization setup. ...................................................................................................... 47
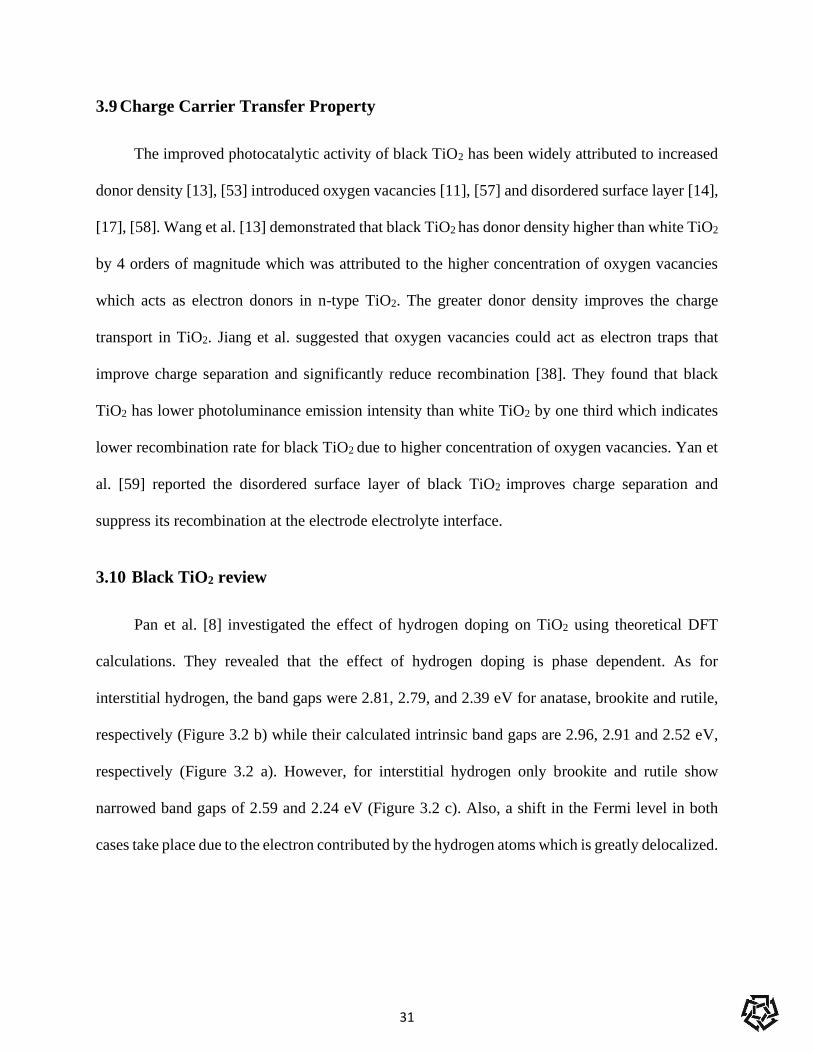
Figure 4.2: a) SEM, b) TEM, and c) HR-TEM images of the as-anodized samples while (d) SEM,
(e) TEM, and (f) HR- TEM images of the samples annealed at 400 oC. ...................................... 48
Figure 4.3: Photo-electrochemical cell connected to potientiostat. .............................................. 49
Figure 5.1: XPS core spectra of Ti 2p (right) and O 1s (left) for oxygen annealed samples ........ 53
8
Figure 5.2: XPS core spectra of Ti 2p (right) and O 1s (left) for air annealed samples ............... 54
Figure 5.3: XPS core spectra of Ti 2p (right) and O 1s (left) for H50.......................................... 55
Figure 5.4: XPS core spectra of Ti 2p (right) and O 1s (left) for H100........................................ 56
Figure 5.5: XPS core spectra of Ti 2p (right) and O 1s (left) for H150........................................ 57
Figure 5.6: Uv-vis absorbance spectra of different annealing conditions .................................... 60
Figure 5.7: Raman spectra of Air (yellow) and H50 (green) samples. The inset in shows the Raman
spectra of the O (red), H100 (cayan) and H150 (Blue) samples. .................................................. 62
Figure 5.8: (a) J-V plots for sub-100 nm 1D TiO2 structures annealed under different atmospheres
with the lower inset presents defect sensitivity factor of different samples, and (b) Donor density
of different samples on the left axis and the flat band potential shown on the right axis. ............ 64
Figure 5.9: SEM image of sub-100 nm TiO2 nanotubes as anodized at the left while H100 sub-100
nm TiO2 nanotubes are at the right................................................................................................ 66
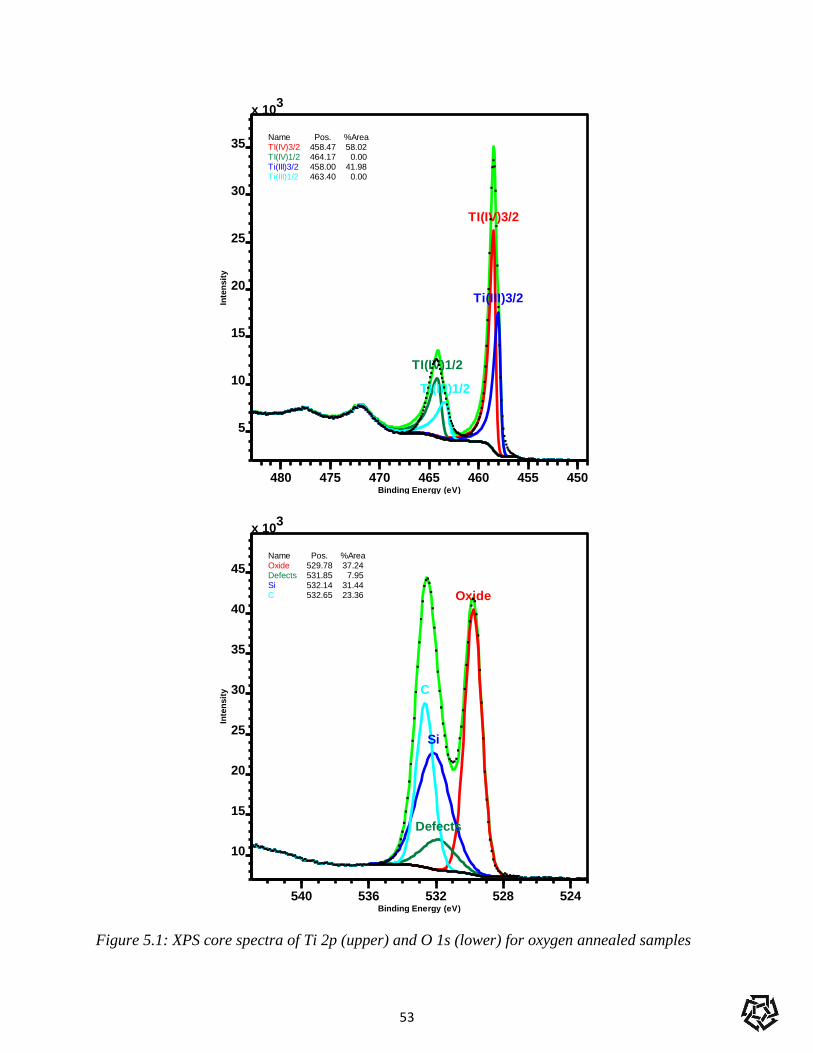
Figure 5.10: Incident Photon to current conversion efficiency of the samples annealed under
different annealing conditions ....................................................................................................... 67

9
List of Tables
Table 1.1: Global oil demand (mb/d), 2015-21 [1] ....................................................................... 11
Table 5.1: Calculated band gap for every annealing atmosphere of different samples. ............... 59
Table 5.2: Rutile to anatase ratio of different samples ................................................................. 62

10
Acknowledgement
Allah rendered great people to be behind me finishing this work. Dr. Nageh inspired me a lot as a
role model on the personal as well as the academic side. He provided me with the knowledge and
lab equipment necessary to finish this work.
Another key person who provided me with significant support is Ahmad Waleed. He has a
charming, yet leadership character that gets the best out of everyone. Waleed helped me planning
and finalizing this work. I would like to thank also, Menna Samir who taught me anodization 101
class, Ahmed Hamouda who was responsible for PL, Raman and UV.Vis analysis. Basamat
Shaheen who did the XPS.
I hope to continue the journey of life and afterlife with my EML peers Ali, Waleed, Moustafa,
Ganzoury, Hamouda, Ibrahim and Biby. They are my life friends who I knew during the last two
years of my master’s study.

11
Chapter 1: Introduction and Scope of the Thesis
1.1 Energy Demand
With the restrain in natural resources rising as a worldwide emergency, humankind is
confronted with its hardest test yet. All through mankind's history, war has been the prominent
answer for such natural resources conflicts. Be that as it may, advancement remained the safe
house to which we regularly shielded as an asylum from undesired occasions. Subsequently, as far
back as fire was found, people have grown a propensity for managing issues just as open doors for
building achievements. Furnished with such learned energy, our race stays in a regularly creating
state towards the more propelled, better prepared, and above all, really moral human
advancements. Today, the emergency of reducing resources is most sensational in the energy
business: the rest of the life-line to which people are holding, petroleum derivatives, may not be
around before the finish of the 21st century.
Worldwide oil demand will increase by 7.2 million barrels per day (mb/d) in the conjecture time
frame 2015-21, at a yearly average rise rate of 1.2% as detailed in table 1.1, from 94.4 mb/d in
2015, demand will hit 101.6 mb/d by 2021 [1].
Table 1.1: Global oil demand (mb/d), 2015-21 [1]
Year 2015 2016 2017 2018 2019 2020 2021 15-21
World demand (mb/d) 94.4 95.6 96.9 98.2 99.3 100.5 101.6 7.2%
On the other side of reality, the Association for the Study of Peak Oil and Gas (ASPO),
utilizing a changed Klass model, anticipated the lifetime of the 2008 oil and gas reserves to be 35
and 37 years, respectively, while coal was expected to keep going for a more 107 years [2]. To

12
sum up, by 2112, none of the three nonrenewable energy sources would exist. This hypothesis,
predicts a conceivable emergency when the new century rolled over.
Air quality concerns and worldwide climate affect constitute two noteworthy issues with
our dependence on fossil fuel. Over a century back, Arrhenius explained the greenhouse effect
induced by gasses, such as, CO2 from petroleum product combustion that make the earth warm
due to the rise trapping ability of infrared [3]. The relations between consuming non-renewable
energy sources and environmental changes are ending up better understood [4]. The count of CO2
has come to an extraordinary 400 ppm in 2016, it is relied upon to pass 550 ppm this century [5].
Climate models show that 550 ppm CO2 gathering, if maintained, could in the long run outcome
in an Earth-wide temperature boost practically identical in greatness (yet inverse in sign) to the
worldwide cooling of the last Ice Age [5]. The results could be erratically cataclysmic and grievous
as late tsunamis and hurricanes point out.
From the previously mentioned challenges the bottleneck of the energy crisis. Humankind's
present reserve of fossil fuel are in effect immediately drained, leaving no stock for those will be
living on this planet when earth comes up short of non-renewable energy sources. Besides, the
planet's climate is being changed by people consuming fossil fuel for energy. It is, in this manner,
a worldwide final offer to devise new renewable sources and additionally methods for creating
energy, to end the dangerous climate change.
Hydrogen unique attributes has placed it amongst the top replacements of fossil fuel. Its
global availability [6] and high mass to energy density made it more favorable than conventional
non-renewable energy sources. When ignited in the presence of oxygen, one gram of hydrogen
would produce triple the amount of energy produced by one gram of natural gas or crude oil [6].
Actually, hydrogen has the highest energy to mass ratio compared to alternative fuel resources [7].

13
Adding to that, hydrogen is 8 times lighter than methane which facilitates transport and storage
[6]. Considering combustion wastes, unlike fossil fuel which produces CO2 that contribute to
greenhouse effect, the combustion of hydrogen almost produces pure water. Thus, the light gas
resembles one of the best renewable energy sources.
As per current technology, the production of hydrogen gas has many routes some of which
are shown in Figure 1.1. Although, 71% of our planet is water which is composed of hydrogen,
the electrolysis of water to produce hydrogen constitute only 3.9% of the total hydrogen
production. Such a process involves the breakdown of water molecule using electricity releasing
oxygen and hydrogen. Indeed, water electrolysis has the potential to dominate hydrogen
production techniques due to the great abundance of hydrogen and relatively low running cost of
the process. The electricity needed for the splitting can come from sun, wind, tidal, hydro and
nuclear energy sources.
The sun is a main sustainable energy source on earth. It has been radiating power of 3.9x1026
W for billions of years [8]. The nuclear fusion reaction inside the sun consumes around 637 million
tons of hydrogen per second to produce 632 million tons of helium. The 5 million tons of mass
defect is transformed into heat energy following the equation E=Mc2 raising the surface
temperature of the sun to 6000K [8]. The radiated energy gives rise to dynamic solar irradiance of
variable intensity. Along these lines, an appropriate energy carrier for storage and transport of
energy is required. To this end, hydrogen is believed to be a perfect energy carrier. To reduce the
carbon footprint, it is suggested that the generation of hydrogen using solar energy seems to be a
clean source.

14
Figure 1.1: Primary energy sources and their use in hydrogen production [9].

15
1.2 Objectives and Scope of the Thesis
Hydrogenation has always been thought of as the process that enhances the photocatalytic
activity of TiO2 by improving light absorption and increasing carrier concentration. However, in
this thesis we show that extensive hydrogenation could result in the promotion of rutile phase in
TiO2 which is inactive towards water splitting. We finally point out that there is an optimum
hydrogenation rate at which the photo-conversion efficiency is maximum. The thesis will be
organized as follows:
Chapter 2: Presents some background about the water splitting process as well as some criteria
to evaluate efficient electrodes that include:
• Band gap matched to solar spectrum
• Band edges that favors water splitting reaction
• Facile charge dynamics
Chapter 3: Is a current literature survey of state of the art papers describing up to date
contributions of different groups in black TiO2
Chapter 4: Describes the experimental procedures followed along with the chemicals used to
synthesize, anneal and characterize the nanostructures and evaluate their performance.
Chapter 5: Explains our main contribution of the thesis which is how different reduction rates
for TiO2 can be used to tune its defect nature.
Chapter 6: Concludes our work
Chapter 7: Sheds some light on future work that may further improve the photocatalytic activity
of TiO2 in water splitting process.

16
References
[1] IEA Secretariat, “Medium-Term Oil Market Report 2012,” IEA Mark. Rep., p. 144, 2012.
[2] S. Shafiee and E. Topal, “When will fossil fuel reserves be diminished?,” Energy Policy,
vol. 37, no. 1, pp. 181–189, 2009.
[3] S. Arrhenius, “On the Influence of Carbonic Acid in the Air upon the Temperature of the
Ground,” Philos. Mag. J. Sci., vol. 41, no. page 270, pp. 237–279, 1896.
[4] B. O’Neill, “Planning for Future Energy Resources,” Science, vol. 300, October, p. 581b–
584, 2003.
[5] World Meteorological Organization, “WMO Greenhouse Gas Bulletin,” WMO Bull., vol.
2015, pp. 1–4, 2015.
[6] DOE, “Alternative Fuels Data Center: Hydrogen,” Alternative Fuels Data Center, 2015.
[Online]. Available: http://www.afdc.energy.gov/fuels/hydrogen.html. [Accessed: 06-Aug-
2017].
[7] R. d. M. J.Hord and H.M.Roder, “Selected properties of Hydrogen.”, Final report, National
Engineering Lab (NBS), Boulder, CO (USA), vol 81, pp. 211492,1981.
[8] D. T. Suzuki, A. Mason, and A. McConnell, “The sacred balance : rediscovering our place
in nature, updated & expanded.” Greystone Books, 2007.

17
Chapter 2: Scientific Background
2.1 Water Splitting Process
Basically, the water splitting process involves the breakdown of water molecule into its
initial constituents of hydrogen and oxygen using electricity in a cell of two electrodes merged in
aqueous electrolyte. The cell is called photoelectrochemical cell (PEC) with at least one of the
two electrodes made of semiconductor. So we end up with one of three possible electrode
configurations
• Photoanode made of an n-type semiconductor and a metal cathode
• p-type semiconductor photocathode and a metal anode
• An n-type photoanode along with a p-type photocathode.
On the electronic level, the operation of n-type semiconductor PEC involves several
processes within the electrodes and through the electrode/electrolyte interface (Figure 2.1) that
includes [1]:
• Incident light absorbed by the semiconductor resulting in the creation of electron-hole
pairs
• The holes move to the electrode/electrolyte interface oxidizing water molecules into
oxygen and hydrogen ion while electrons move through the bulk of the semiconducting
anode to the cathode through the external circuit.
• H+ moves through the electrolyte from the n-type photo-anode to the metal cathode to get
reduced by the externally migrating electrons.

18
Figure 2.1: Structure of photo-electrochemical cell for water splitting [1].
When light falls on the photoanode, it results in the ionization of the n-type semiconductor,
electrons are excited to the conduction band while holes remain at the valence band.
2hv →2e’ +2h. 2.1
where h is Planck’s constant, v is the frequency of radiation, e’ is the electron and h. is the hole.
An external electric field is required to prevent the recombination of those electron hole pairs.
For the excitons to get separated the incident photon energy should be greater than or equal the
band gap of the semiconductor. The separated electron hole pairs cause the oxidation of water
molecule splitting it into oxygen and hydrogen ions.
2h· + H2O (liquid) → 2O2 (gas) + 2H+ 2.2
The oxidation/reduction process takes place at the electrode/electrolyte interface. Simultaneously,
the light-generated electrons travel through the external circuit to the cathode to reduce hydrogen
ions that traveled through the electrolyte from anode to cathode.
2H+ +2e’ → H2 (gas) 2.3

19
Thus, the overall water splitting reaction (shown in Figure 2.1) can be written as
2hv + H2O (liquid) → 2O2 (gas) +H2 (gas) 2.4
This reaction can only take place if the energy of the absorbed photon is greater than or equal the
threshold energy Et. The water splitting reaction energy is given by:
Ei= 𝛥𝐺(𝐻2𝑂)
𝑜
2𝑁𝐴 2.5
where 𝛥𝐺(𝐻2𝑂)𝑜 is the standard free enthalpy per mole of the water splitting reaction which is
237.141 kJ/mol and NA is Avogadro’s number equal to 6.022×10²³ mol−1. Thus, the water splitting
reaction energy is 1.23 eV, which must be provided by light or external bias in order for the
reaction to take place.
Figure 2.2: Schematic diagram of PEC presenting the dynamics of water splitting reaction [1]
2.2 Electrode Characteristics
For the water splitting reaction to take place, the n-type photo-anode must satisfy some
criteria that include [2]:

20
• Band Gap Width: The semiconductor band gap must be matched to absorb most of the
solar spectrum [3].
• Band Edge Positions: The valence band minimum and the conduction band maximum
must straddle the water redox potential.
• Stability of the Electrodes: The free enthalpies of oxidation and reduction must be
matched to the valence band maximum and conduction band minimum, to prevent
photocorrosion.
• Charge Carrier Dynamics: The electrode structure must allow for efficient charge
separation.
2.2.1 Band Gap Width
The band gap of the semiconductor must be matched to absorb solar radiation of which
60% are concentrated around wavelengths of 400nm to 700nm. The solar energy can be written
in terms of wavelength as
E = ℎ𝑐
𝜆 2.6
where c is the speed of light and 𝜆 is the wavelength. Thus, it might be energy efficient to use a
semiconductor with a band gap energy Eg in range of 1.7 eV < Eg < 3.1 eV such that most of the
solar radiation energy is utilized.

21
2.2.2 Band Edge Position
Along with the matched band gap of the semiconductor to solar spectrum comes an equally
important criterion, that the semiconducting electrode should satisfy is the straddling of its band
gap with water reduction and oxidation potentials. Figure 2.3 shows the positions of the valence
band maximum and the conduction band minimum of different semiconductors along with the
water oxidation and reduction potentials versus the normal hydrogen electrode (NHE) reference.
In order for the water splitting reaction to take place, the water redox potentials should fall inside
the band gap of the semiconductor. In other words, the valence band maximum of the
semiconductor should be lower (more anodic) that the oxidation potential of water such that facile
diffusion of holes from the semiconductor to the electrolyte can take place resulting in the splitting
of water. Adding to that, the semiconductor conduction band minimum should be greater (more
cathodic) than the reduction potential of hydrogen ions such that the externally migrated electrons
in the PEC would favor to reduce the hydrogen collected at the cathode.
Figure 2.3: Water redox potentials shown relative to the band gaps of different semiconductors [3]

22
For the semiconductor to be stable in the electrolyte under illumination, the light induced
electron hole pairs should favor to oxidize water and reduce hydrogen in the electrolyte rather than
oxidizing the semiconductor itself causing its decomposition. Gerischer [4] suggested a
quantitative metric that can be used to test the stability of the semiconductor as shown in Figure
2.4. The oxidation and reduction free enthalpies of the semiconductor namely Ep,d and En,d should
be straddling with the water oxidation and reduction potentials.
• The oxidation potential of water should be lower (more anodic) than Ep,d
• The reduction potential of hydrogen should be greater (more cathodic) than En,d
Such that the generated carriers would favor to interact with the electrolyte rather than
decomposing the electrodes.
Figure 2.4: Decomposition potentials of different semiconductors drawn relative to water
redox potentials [4].
23
2.2.3 Charge Carrier Dynamics
After the generation of electron hole pairs in the semiconductor photo-anode with the aid
of light, the opposite charges should migrate in different directions. Holes are required to migrate
to the anode/electrolyte interface to oxidize water while electrons are required to migrate to the
cathode/electrolyte interface to reduce hydrogen. However, there are some factors that may result
in the trapping of charge carriers preventing them from reaching the electrolyte through different
electrodes. These factors include [5]:
• Bulk defects such as vacancies, interstitials, and grain boundaries that result in defect
states that which trap the electrons.
• Trap states that lie on the surface, due to dangling bonds, or adsorbed electrolyte
species that act as electron sinks.
Thus, electrons and holes have limited mobility inside the semiconductor before
recombination will eventually take place. The average distance a charge carrier can move inside
the electrolyte before recombining is called Debye diffusion length [6] and is given by:
𝜆𝐷 = (𝐾𝑇𝜀𝜀𝑟
𝑁𝐷𝑒2 )1/2
2.7
where K is Boltzman constant, T is the material temperature, 𝜀 is the permittivity of free space,
𝜀𝑟 is the relative permittivity of the material, ND is the carrier concentration and finally e is the
electronic charge.

24
References
[1] T. Bak, J. Nowotny, M. Rekas, and C. Sorrell, “Photo-electrochemical hydrogen generation
from water using solar energy. Materials-related aspects,” Int. J. Hydrogen Energy, vol. 27,
no. 10, pp. 991–1022, 2002.
[2] B. S. Shaheen, H. G. Salem, M. A. El-sayed, and N. K. Allam, “Thermal / Electrochemical
Growth and Characterization of One-Dimensional ZnO/TiO2 Hybrid Nanoelectrodes for
Solar Fuel Production,” J. Phys. Chem. C, Vol 117 (36), pp 18502–18509, 2013.
[3] T. Minemoto, Y. Nakada, H. Takahashi, and H. Takakura, “Uniqueness verification of solar
spectrum index of average photon energy for evaluating outdoor performance of
photovoltaic modules,” Sol. Energy, vol. 83, no. 8, pp. 1294–1299, 2009.
[4] H. Gerischer, “4. Solar Photoelectrolysis with Semiconductor Electrodes.” , Solar Energy
Conversion, pp. 115-172, 1979
[5] N. K. Allam, “An investigation into the doping and crystallinity of anodically fabricated
TiO2 nanotube arrays: Towards an efficient material for solar energy applications,” PhD
thesis, The Pennsylvania State University, 2009.
[6] G. Hautier, A. Miglio, G. Ceder, G.-M. Rignanese, and X. Gonze, “Identification and design
principles of low hole effective mass p-type transparent conducting oxides.,” Nat.
Commun., vol. 4, p. 2292, 2013.

25
Chapter 3: Literature Survey
3.1 Straddling and Stability
As shown in Figures 3.1 and 3.2, the band gap of TiO2 straddles with the water oxidation
and reduction potentials which suggests that TiO2 might be a suitable candidate for water splitting
as its band gap is 3.1 eV, which could easily energize the water splitting reaction. What makes
TiO2 more promising is its high stability. It fulfills the stability requirements by having oxidation
and reduction free enthalpies that straddle with water redox potentials.
3.2 Improving Charge Dynamics
With the advancement of high-precision structural and spectroscopic characterization tools,
the ability to accurately control the structure of nanomaterials has been enabled. Amongst the
markets most benefited by these capabilities is that of nanostructured photocatalysis, where the
large surface area-to-volume ratio maximizes the number of active sites onto which reactions may
take place [1]. Consequently, efforts to create thinner films, [2] smaller nanoparticles, and shorter
nanotubes [3], [4] for photocatalytic applications, such as photoelectrochemical cells, have boosted
in the past couple of years. Such endeavors pave the way towards developing the most efficient
photocatalyst structures. Structure, however, is not the only variable in the question of efficient
photocatalysis, optical and electronic properties are as critical. With TiO2 being one of the most-
studied photocatalysts for water splitting, [5] researchers have been attempting to get the most out
of this relatively-cheap catalyst [6]. Today, after more than 45 years of development, efforts still
show promise in TiO2 photocatalysis.

26
To this end, our group has recently devised a one-step synthesis route to one-dimensional
(1D), sub-100 nm TiO2 nanostructures, which have demonstrated higher efficiencies compared to
regular, long TiO2 nanotubes [7]. Such enhancement was attributed to the decrease in electron
pathway, leading to optimized charge collection.
3.3 Reducing the Band Gap
Our optimized structures, however, still face the ever-challenging optical absorption
deficiency of the wide band gap semiconductor. That being said, annealing under different
atmospheres has proven to be one of the cheapest routes towards adjustment of electronic
properties [8]. In particular, H2-annealing has seen special attention owing to promising traits
of the resulting black TiO2 [9]–[17]. Studies have reported visible light absorption, [18] increased
charge carrier density, [19] and enhanced charge separation in the UV region [13]. Experimentally,
electron paramagnetic resonance (EPR) studies throughout the literature [9]–[11], [20] proved the
presence of Ti3+ in the bulk of black TiO2. Those Ti3+ states were thought to be the reason behind
the observed enhancements, where a defect band is created below the CBM, increasing electron
density and effectively reducing the optical band gap of TiO2 [12], [21]–[23]. Other studies [16],
[17], [24] attributed the visible light-absorption to the effective rise of the valence band minimum
(VBM) via the incorporation of hydrogen states above the O 2p VBM. On the theoretical side,
density functional theory (DFT) calculations confirmed both views [9], [25]–[33] However,
numerous DFT studies infer that the nature of the created defect states may not always make them
beneficial.[13] Ling et al. [12] reported the creation of deep trap states, that are localized in real
space, within the band gap of black TiO2 as a result of H2-annealing. Confirming
Ling’s conclusions, Ataei et al. [34] presented a relation between that phenomenon and the

27
position of the hydrogen atom inside the lattice of TiO2. On the scale of lab experiments, however,
these observations are yet to be confirmed.
Indeed, the difference between deep and shallow defect states has been suggested to lie
within the so-called cross-section of the defect inside the lattice [35]. Roughly, a cross-section
greater than 10-15 cm2 would be strongly attractive to electrons passing by towards the CBM. The
effective radius of a defect (rd) has been suggested to follow the relation [36]:
𝑟𝑑 =𝑧𝑞2
𝜀𝑘𝐵𝑇 3.1
where q and z are the electron and defect charges, respectively. Trap states may take cross-sections
up to 10-9 cm2, making them strongly attractive to electrons. Effectively, being delocalized in
reciprocal space, such states can ‘capture’ carriers with different values of momenta, increasing
the probability of trapping, compared to shallow defect states that may only take up certain values
of momenta in reciprocal space [35]. Throughout the following discussion, the real space notation
would be used instead: localized for deep trap states, and delocalized for shallow donor states. To
the authors’ best knowledge, a discussion of both natures of defect states within the framework of
black TiO2 is lacking in literature. Indeed, a synthesis route that proves to be selective when it
comes to both types of defect states would be critical if black TiO2 catalysts are to be used on an
industrial scale.
3.4 Disordered Surface Structure:
The chemical, atomic and electronic structure of disordered shell was studied in black TiO2
by Tian et al. [37] using advanced transmission electron microscopy methods. Figure 3.1 presents
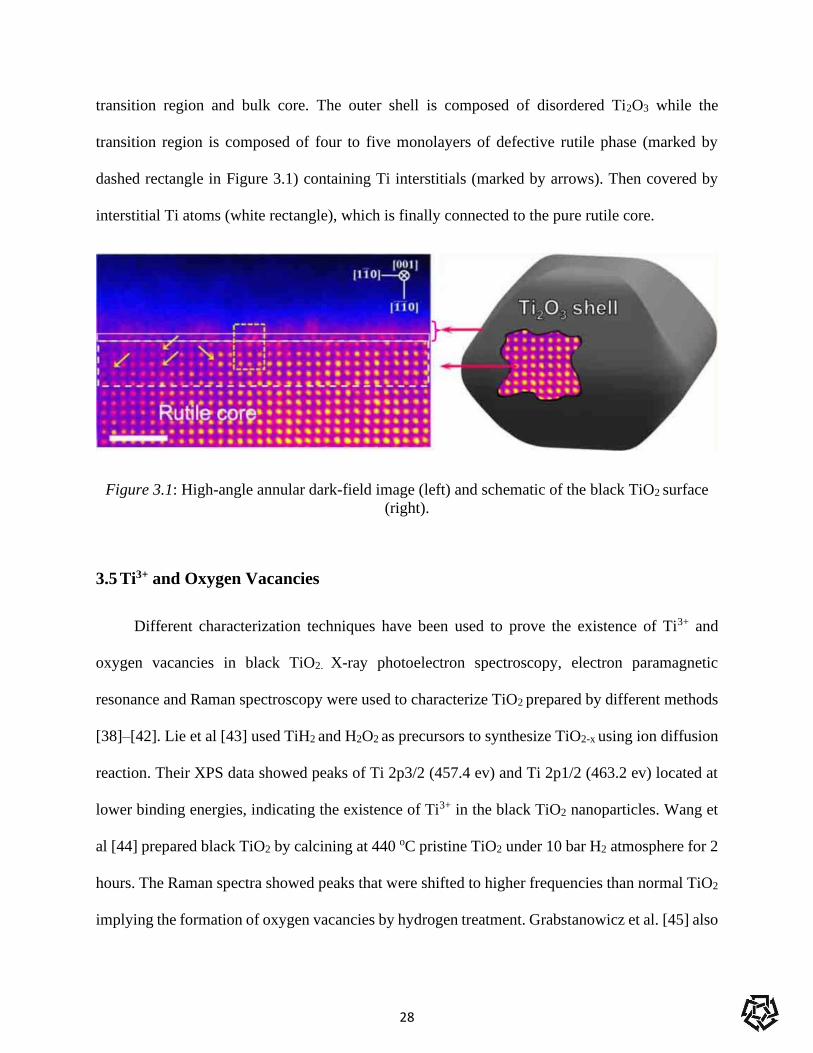
the crystal structure of hydrogenated TiO2 which is comprised of three parts namely: outer shell,
28
transition region and bulk core. The outer shell is composed of disordered Ti2O3 while the
transition region is composed of four to five monolayers of defective rutile phase (marked by
dashed rectangle in Figure 3.1) containing Ti interstitials (marked by arrows). Then covered by
interstitial Ti atoms (white rectangle), which is finally connected to the pure rutile core.
Figure 3.1: High-angle annular dark-field image (left) and schematic of the black TiO2 surface
(right).
3.5 Ti3+ and Oxygen Vacancies
Different characterization techniques have been used to prove the existence of Ti3+ and
oxygen vacancies in black TiO2. X-ray photoelectron spectroscopy, electron paramagnetic
resonance and Raman spectroscopy were used to characterize TiO2 prepared by different methods
[38]–[42]. Lie et al [43] used TiH2 and H2O2 as precursors to synthesize TiO2-x using ion diffusion
reaction. Their XPS data showed peaks of Ti 2p3/2 (457.4 ev) and Ti 2p1/2 (463.2 ev) located at
lower binding energies, indicating the existence of Ti3+ in the black TiO2 nanoparticles. Wang et
al [44] prepared black TiO2 by calcining at 440 oC pristine TiO2 under 10 bar H2 atmosphere for 2
hours. The Raman spectra showed peaks that were shifted to higher frequencies than normal TiO2
implying the formation of oxygen vacancies by hydrogen treatment. Grabstanowicz et al. [45] also

29
oxidized TiH2 in H2O2 followed by Argon annealing at 630 OC then used electron paramagnetic
resonance to prove the existence of Ti3+ in black TiO2.
3.6 Ti-OH and Ti-H Groups
Ti-OH and Ti-H groups were often found in hydrogenated TiO2 nanostructures [13], [17],
[46]–[48]. Chen et al. [17] reported a shoulder peak in the O 1s XPS core spectra which was
attributed to Ti-OH. Similar studies have also revealed the same results for nanotubes [49] and
nanowires [13]. Also, Wang et al. [10] characterized Ti-OH groups using Fourier Transform
Infrared Spectra. Several peaks were observed at 3710, 3685, 3670 and 3645 cm-1. The first peak
corresponds to terminal OH group while the last three correspond vacancies. The presence of Ti-
OH groups was confirmed using 1H nuclear magnetic resonance (NMR) spectra.
3.7 Optical Absorption
Chen et al. [17] found that the optical band gap of TiO2 was significantly narrowed by
hydrogenation resulting in a red shift in the absorption spectra to 1200 nm which corresponds to
1.0 eV band gap. It was also shown that the valence band maximum was blue shifted towards the
vacuum level. Thus, the optical transition from the raised valence band to the conduction band
tails induced structural disorders is responsible for the band gap narrowing. Other groups have also
reported similar shifts in the band gap [9], [11], [24], [50]. Fan et la. [51] demonstrated that
hydroxyl groups reduce the band gap of black TiO2 by inducing localized band bending.
Furthermore, Liu et al. [22] revealed that oxygen vacancies and Ti3+ induce defect states that are
responsible for visible light absorption. Tian et al. [52] used pulsed laser vaporization to prepare
black TiO2 that exhibited visible light absorption.

30
3.8 Theoretical Calculation
It is widely known that hydrogenation of TiO2 introduce shallow defect states in the band
gap that result in enhanced optical activity [9], [11], [17], [24],[53]. Chen et al. [17] demonstrated
that when hydrogen atoms were bonded to O and Ti, two band gap states appear at about 1.8 and
3.0 eV. The higher energy group resulted from the interaction of H 1s with Ti 3d, while the lower
energy group resulted from the interaction of H 1s hybridized with hybridized O 2p and Ti 3d
orbitals. Raghunath et al. [54] revealed that mid gap state at 1.2 eV below the conduction band
minimum existed as a result of interaction of H 1s with Ti 3d. Those H atoms acted as electro
donors leading to the shift of fermi level of TiO2 towards the conduction band. Also, Deng et al.
[32] showed the formation of states at 0.7 eV above the valence band minimum as a result of Ti-
H bond. While Pan et al. [8] demonstrated that substitutional hydrogen reduces the band gap of
rutile and brookite and interstitial narrows the band gap of anatase, rutile and brookite. DFT
calculations also revealed that hydrogenation induces lattice disorder to the surface of nanophase
anatase which contributes to mid band gap states[55]. Chen et al. [56] compared two large TiO2
clusters Ti210O420H12 representing white TiO2 nanocrystal and Ti218O436H70 as black TiO2. The
black TiO2 showed band gap states extending from the valence band maximum to 1.2 ev above the
valence band. Also, mid band gap states have been observed at about 1.8 ev above the valence
band maximum. Liu et al. [14] showed that distortion in the Ti sublattice results in red shift in the
conduction band minimum and blue shift to the valence band maximum. While O sublattice
distortion only leads to blue shift to the valence band maximum. Taking that in to consideration,
there are more Ti-O bond fixed with Ti more than O, more energy is required to distort the Ti
sublattice than O sublattice. Therefore, O sublattice disorder is more likely to take place, which is
in line with experimental observation that hydrogenation raises the valence band maximum.
31
3.9 Charge Carrier Transfer Property
The improved photocatalytic activity of black TiO2 has been widely attributed to increased
donor density [13], [53] introduced oxygen vacancies [11], [57] and disordered surface layer [14],
[17], [58]. Wang et al. [13] demonstrated that black TiO2 has donor density higher than white TiO2
by 4 orders of magnitude which was attributed to the higher concentration of oxygen vacancies
which acts as electron donors in n-type TiO2. The greater donor density improves the charge
transport in TiO2. Jiang et al. suggested that oxygen vacancies could act as electron traps that
improve charge separation and significantly reduce recombination [38]. They found that black
TiO2 has lower photoluminance emission intensity than white TiO2 by one third which indicates
lower recombination rate for black TiO2 due to higher concentration of oxygen vacancies. Yan et
al. [59] reported the disordered surface layer of black TiO2 improves charge separation and
suppress its recombination at the electrode electrolyte interface.
3.10 Black TiO2 review
Pan et al. [8] investigated the effect of hydrogen doping on TiO2 using theoretical DFT
calculations. They revealed that the effect of hydrogen doping is phase dependent. As for
interstitial hydrogen, the band gaps were 2.81, 2.79, and 2.39 eV for anatase, brookite and rutile,
respectively (Figure 3.2 b) while their calculated intrinsic band gaps are 2.96, 2.91 and 2.52 eV,
respectively (Figure 3.2 a). However, for interstitial hydrogen only brookite and rutile show
narrowed band gaps of 2.59 and 2.24 eV (Figure 3.2 c). Also, a shift in the Fermi level in both
cases take place due to the electron contributed by the hydrogen atoms which is greatly delocalized.

32

33
Figure 3.2: Full density of states of the three polymorphs of TiO2 anatase, brookite and rutile for
(a) intrinsic, (b) interstitial and (c) substitutional hydrogen[8].
Damon et al. [12] used time-resolved fluorescence to investigate ultrafast relaxation dynamics of
hydrogenated TiO2. They illuminated TiO2 samples with ultraviolet and visible light and
summarized their findings in Figure 3.3.
• There is an intrinsic defect state located at 0.3 eV below the conduction band minimum of
TiO2.
• Oxygen vacancies create defect states located at 0.75 eV below the conduction band
minimum of TiO2.
• Hydrogen treatment introduces nonflorescent mid-band gap states located below the
oxygen vacancy level.
• Naldoni et al. [24] domenstrated experimentally that black TiO2 has a narrowed band gap
of 1.85 eV due to valence band tailing as a result surface disorder created by hydrogen

34
treatment which also induces oxygen vacancies as shown in Figure 3.4. Such vacancies are
located at 0.7-1.0 eV below the conduction band minimum. The authors also attributed the
black color of hydrogenated TiO2 to the transitions between the valence band tail and the
oxygen vacancy defect state. Finally, it was revealed that there are no defect states in the
band gap introduced by hydrogen bonding with TiO2 as shown in Figure 3.4.
Figure 3.3: Proposed energy band diagram for black TiO2 [12].

35
Figure 3.4: Proposed energy band diagram model for hydrogenated TiO2 [24].
Wang et al. [13] studied hydrogenated TiO2 at different temperatures. They revealed that
as the hydrogenation temperature increases the incident photon to current conversion efficiency
degrades as shown in Figure 3.5 a. Also, some important facts regarding how hydrogenation affects
the band structure of hydrogenated TiO2 include:
• Ti-OH groups form energy states at 0.7-2.6 eV below the valence band minimum as shown
in Figure, which should not lead to visible light absorption as shown in Figure 3.5 b.
• Oxygen vacancies induce mid band gap states 0.7-1.0 eV below the conduction band
minimum.
• Hydrogen treatment promote oxygen vacancies which increases the donor density in TiO2

36
Figure 3.5:(a) IPCE of TiO2 treated at different temperatures, and (b) proposed energy band
diagram of hydrogen treated TiO2 [13].
Wang et al. [10] revealed that hydrogenation induces band gap defects located at 0.92 −
1.37 eV below the conduction band minimum as shown in Figure 3.6 a. Adding to that, band tailing
was observed at the conduction band minimum which reduces the band gap by 0.8 eV as shown
in Figure 3.6 b. The electronic transitions between valence band, intermediate band gap states and
conduction band tail have allowed the absorption of UV, visible and IR light.
Figure 3.6: (a) Energy band diagram model (b) Density of states of white and black TiO2 [10].

37
Kang et al. [11] revealed that hydrogenation process induces valence band tailing which
reduces the band gap by 0.5 eV as depicted in Figure 3.7. However, hydrogenation doesn’t affect
the conduction band. Also, conventional mid band gap defect states at 0.75-1.18 eV were also
reported.
Figure 3.7: Energy band gap diagram of reduced TiO2 Vs. white TiO2 [11].

38
References
[1] E. Roduner, “Size matters: why nanomaterials are different,” Chem. Soc. Rev., vol. 35, no.
7, p. 583, 2006.
[2] D. G. Schlom, L. Q. Chen, X. Pan, A. Schmehl, and M. A. Zurbuchen, “A thin film approach
to engineering functionality into oxides,” J. Am. Ceram. Soc., vol. 91, no. 8, pp. 2429–2454,
2008.
[3] Y. Liu, B. Zhou, J. Li, X. Gan, J. Bai, and W. Cai, “Preparation of short, robust and highly
ordered TiO2 nanotube arrays and their applications as electrode,” Appl. Catal. B Environ.,
vol. 92, no. 3–4, pp. 326–332, 2009.
[4] X. Gao et al., “Enhanced photovoltaic performance of perovskite CH₃NH₃PbI₃ solar cells
with freestanding TiO₂ nanotube array films.,” Chem. Commun. (Camb)., vol. 50, no. 48,
pp. 6368–71, 2014.
[5] X. Chen and S. S. Mao, “Titanium dioxide nanomaterials: Synthesis, properties,
modifications and applications,” Chem. Rev., vol. 107, no. 7, pp. 2891–2959, 2007.
[6] K. Hashimoto, H. Irie, and A. Fujishima, “A Historical Overview and Future Prospects,”
AAPPS Bull., vol. 17, no. 6, pp. 12–28, 2007.
[7] M. Samir, M. Salama, and N. K. Allam, “Sub-100 nm TiO 2 tubular architectures for
efficient solar energy conversion,” J. Mater. Chem. A, vol. 4, no. 24, pp. 9375–9380, 2016.
[8] H. Pan, Y. Zhang, V. B. Shenoy, and H. Gao, “Effects of H- , N- , and ( H , N ) -Doping on
the Photocatalytic Activity of TiO 2,” J. Phys. Chem. C, vol. 115, pp. 12224–12231, 2011.
[9] M. M. Khan et al., “Band gap engineered TiO2 nanoparticles for visible light induced

39
photoelectrochemical and photocatalytic studies,” J. Mater. Chem. A, vol. 2, no. 3, pp. 637–
644, 2014.
[10] Z. Wang et al., “H-doped black titania with very high solar absorption and excellent
photocatalysis enhanced by localized surface plasmon resonance,” Adv. Funct. Mater., vol.
23, no. 43, pp. 5444–5450, 2013.
[11] Q. Kang, J. Cao, Y. Zhang, L. Liu, H. Xu, and J. Ye, “Reduced TiO2 nanotube arrays for
photoelectrochemical water splitting,” J. Mater. Chem. A, vol. 1, no. 18, p. 5766, 2013.
[12] D. A. Wheeler et al., “Probing the nature of bandgap states in hydrogen-treated TiO2
nanowires,” J. Phys. Chem. C, vol. 117, no. 50, pp. 26821–26830, 2013.
[13] G. Wang et al., “Hydrogen-treated TiO2 nanowire arrays for photoelectrochemical water
splitting,” Nano Lett., vol. 11, no. 7, pp. 3026–3033, 2011.
[14] L. Liu, P. Y. Yu, X. Chen, S. S. Mao, and D. Z. Shen, “Hydrogenation and disorder in
engineered black TiO2,” Phys. Rev. Lett., vol. 111, no. 6, pp. 1–5, 2013.
[15] Y. H. Hu, “A highly efficient photocatalyst-hydrogenated black TiO2 for the photocatalytic
splitting of water,” Angew. Chemie - Int. Ed., vol. 51, no. 50, pp. 12410–12412, 2012.
[16] X. Chen et al., “Properties of disorder-engineered black titanium dioxide nanoparticles
through hydrogenation.,” Sci. Rep., vol. 3, pp. 1510-1-1510–7, 2013.
[17] X. Chen, L. Liu, P. Y. Yu, and S. S. Mao, “Increasing solar absorption for photocatalysis
with black hydrogenated titanium dioxide nanocrystals.,” Science, vol. 331, no. 6018, pp.
746–50, 2011.
[18] R. Asahi, T. Morikawa, T. Ohwaki, and Y. Taga, “Visible-Light Photocatalysis in Nitrogen-

40
Doped Titanium Oxides,” Science vol. 293, no. 5528, pp. 269–271, 2001.
[19] G. Wang et al., “Supporting Information Hydrogen-Treated TiO2 Nanowire Arrays for
Photoelectrochemical Water Splitting,” Nano Lett., vol. 11, no. 7, pp. 1–10, 2011.
[20] R. F. Howe and M. Gratzel, “EPR Observation of Trapped Electrons In Colloidal TiO2,” J.
Phys. Chem., vol. 89, no. 21, pp. 4495–4499, 1985.
[21] B. Li, Z. Zhao, Q. Zhou, B. Meng, X. Meng, and J. Qiu, “Highly efficient low-temperature
plasma-assisted modification of TiO2 nanosheets with exposed {001} facets for enhanced
visible-light photocatalytic activity,” Chem. - A Eur. J., vol. 20, no. 45, pp. 14763–14770,
2014.
[22] L. Liu et al., “Engineering Coexposed {001} and {101} Facets in Oxygen-Deficient TiO2
Nanocrystals for Enhanced CO2 Photoreduction under Visible Light,” ACS Catal., vol. 6,
no. 2, pp. 1097–1108, 2016.
[23] S. Hoang, S. P. Berglund, N. T. Hahn, A. J. Bard, and C. B. Mullins, “Enhancing visible
light photo-oxidation of water with TiO2 nanowire arrays via cotreatment with H2 and NH3:
synergistic effects between Ti3+ and N.,” J. Am. Chem. Soc., vol. 134, no. 8, pp. 3659–62,
2012.
[24] A. Naldoni et al., “Effect of nature and location of defects on bandgap narrowing in black
TiO2 nanoparticles,” J. Am. Chem. Soc., vol. 134, no. 18, pp. 7600–7603, 2012.
[25] J. Stausholm-Møller, H. H. Kristoffersen, B. Hinnemann, G. K. H. Madsen, and B.
Hammer, “DFT+U study of defects in bulk rutile TiO2,” J. Chem. Phys., vol. 133, no. 14,
2010.

41
[26] M. V. Koudriachova, S. W. de Leeuw, and N. M. Harrison, “First-principles study of H
intercalation in rutile TiO2,” Phys. Rev. B, vol. 70, no. 16, p. 165421, 2004.
[27] C. Di Valentin, G. Pacchioni, and A. Selloni, “Electronic structure of defect states in
hydroxylated and reduced rutile TiO2(110) surfaces,” Phys. Rev. Lett., vol. 97, no. 16, p.
166803 - 166807, 2006.
[28] S. Na-Phattalung et al., “First-principles study of native defects in anatase TiO2,” Phys. Rev.
B - Condens. Matter Mater. Phys., vol. 73, no. 12, pp. 1–6, 2006.
[29] A. Amore Bonapasta, F. Filippone, G. Mattioli, and P. Alippi, “Oxygen vacancies and OH
species in rutile and anatase TiO2 polymorphs,” Catal. Today, vol. 144, no. 1–2, pp. 177–
182, 2009.
[30] T. S. Bjørheim, S. Stølen, and T. Norby, “Ab initio studies of hydrogen and acceptor defects
in rutile TiO2,” Phys. Chem. Chem. Phys., vol. 12, no. 25, p. 6817, 2010.
[31] H. Kamisaka and K. Yamashita, “Theoretical Study of the Interstitial Oxygen Atom in
Anatase and Rutile TiO2: Electron Trapping and Elongation of the r (O− O) Bond,” J. Phys.
Chem. C, vol. 115, pp. 8265–8273, 2011.
[32] H.-X. Deng, S.-S. Li, J. Li, and S.-H. Wei, “Effect of hydrogen passivation on the electronic
structure of ionic semiconductor nanostructures,” Phys. Rev. B, vol. 85, no. 19, pp. 1–5,
2012.
[33] X. Liu, G. Zhu, X. Wang, X. Yuan, T. Lin, and F. Huang, “Progress in Black Titania: A
New Material for Advanced Photocatalysis,” Adv. Energy Mater., vol. 6, no. 17, pp.
1600452, 2016.

42
[34] S. S. Ataei, M. R. Mohammadizadeh, and N. Seriani, “Ab Initio Simulation of the Effects
of Hydrogen Concentration on Anatase TiO2,” J. Phys. Chem. C, vol. 120, no. 16, pp. 8421–
8427, 2016.
[35] A. Rockett, The materials science of semiconductors. McGraw-Hill , 2008.
[36] R. H. Bube and H. E. MacDonald, “Effect of photoexcitation on the mobility in
photoconducting insulators,” Phys. Rev., vol. 121, no. 2, pp. 473–483, 1961.
[37] D. C. Hurum, a G. Agrios, K. a Gray, T. Rajh, and M. C. Thurnauer, “Explaining the
enhanced photocatalytic activity of Degussa P25 mixed-phase TiO2 using EPR,” J. Phys.
Chem. B, vol. 107, no. 19, pp. 4545–4549, 2003.
[38] X. Jiang et al., “Characterization of Oxygen Vacancies Associates within the Hydrogenated
TiO2 : a Positron Annihilation Study Characterization of Oxygen Vacancies Associates
within the Hydrogenated TiO2 : a Positron Annihilation Study,” J. Phys.Chem.C, vol. 116,
pp. 22619–22624, 2012.
[39] H. Yin et al., “Gray TiO2 nanowires synthesized by aluminum-mediated reduction and their
excellent photocatalytic activity for water cleaning,” Chem. - A Eur. J., vol. 19, no. 40, pp.
13313–13316, 2013.
[40] L. R. Grabstanowicz et al., “Facile Oxidative Conversion of TiH2 to High-Concentration
Ti3+-Self- Doped Rutile TiO2 with Visible-Light Photoactivity,” Inorg. Chem., vol. 52, p.
3884−3890, 2013.
[41] F. M. Pesci, G. Wang, D. R. Klug, Y. Li, and A. J. Cowan, “Efficient Suppression of
Electron − Hole Recombination in Oxygen- Deficient Hydrogen-Treated TiO2 Nanowires

43
for Photoelectrochemical Water Splitting,” J. Phys. Chem. C, vol. 117, p. 25837, 2013.
[42] J. Dong et al., “Defective black TiO2 synthesized via anodization for visible-light
photocatalysis,” ACS Appl. Mater. Interfaces, vol. 6, no. 3, pp. 1385–1388, 2014.
[43] X. Liu et al., “Ti3+ self-doped TiO2-x anatase nanoparticles via oxidation of TiH2 in H2O2,”
Catal. Today, vol. 225, pp. 80–89, 2014.
[44] W. Wei, N. Yaru, L. Chunhua, and X. Zhongzi, “Hydrogenation of TiO2 nanosheets with
exposed {001} facets for enhanced photocatalytc activity,” RSC Adv., vol. 2, no. 22, pp.
8286–8288, 2012.
[45] L. R. Grabstanowicz et al., “Facile oxidative conversion of TiH2 to high-concentration Ti3+-
self-doped rutile TiO2 with visible-light photoactivity,” Inorg. Chem., vol. 52, no. 7, pp.
3884–3890, 2013.
[46] C. Zhang et al., “Supported noble metals on hydrogen-treated TiO2 nanotube arrays as
highly ordered electrodes for fuel cells,” ChemSusChem, vol. 6, no. 4, pp. 659–666, 2013.
[47] H. Guo, W. Wang, L. Liu, Y. He, C. Li, and Y. Wang, “Shape-controlled synthesis of Ag
TiO2 cage-bell hybrid structure with enhanced photocatalytic activity and superior lithium
storage,” Green Chem., vol. 15, no. 10, p. 2810, 2013.
[48] Z. Zheng et al., “Hydrogenated titania: synergy of surface modification and morphology
improvement for enhanced photocatalytic activity,” Chem. Commun., vol. 48, no. 46, p.
5733, 2012.
[49] M. Z. Jacobson et al., “Hydrogenated TiO2 Nanotube Arrays for Supercapacitors,” Energy
Environ. Sci., vol. 8, no. 7, pp. 2093–2117, 2015.

44
[50] C. Yang et al., “Core-shell nanostructured ‘black’ Rutile Titania as excellent catalyst for
hydrogen production enhanced by sulfur doping,” J. Am. Chem. Soc., vol. 135, no. 47, pp.
17831–17838, 2013.
[51] C. Fan et al., “Black Hydroxylated Titanium Dioxide Prepared via Ultrasonication with
Enhanced Photocatalytic Activity,” Sci Rep, vol. 5, no. July, p. 11712, 2015.
[52] M. Tian et al., “Structure and Formation Mechanism of Black TiO2 Nanoparticles,” ACS
Nano, no. 10, pp. 10482–10488, 2015.
[53] H. Cui et al., “Black TiO2 nanotube arrays for high-efficiency photoelectrochemical water-
splitting,” J. Mater. Chem. A, vol. 2, no. 23, pp. 8612–8616, 2014.
[54] P. Raghunath, W. F. Huang, and M. C. Lin, “Quantum chemical elucidation of the
mechanism for hydrogenation of TiO2 anatase crystals,” J. Chem. Phys., vol. 138, no. 15,
2013.
[55] J. Lu, Y. Dai, H. Jin, and B. Huang, “Effective increasing of optical absorption and energy
conversion efficiency of anatase TiO2 nanocrystals by hydrogenation.,” Phys. Chem. Chem.
Phys., vol. 13, no. 40, pp. 18063–8, 2011.
[56] J. Chen and W. Wang, “Carrier transport processes in dye sensitized solar cells based on
Zn2SnO4 nanostructures studied by intensity modulated photocurrent/photovoltage
spectroscopy,” Appl. Phys. Lett., vol. 102, no. 21, p. 213904, 2013.
[57] F. Zuo, L. Wang, T. Wu, Z. Zhang, D. Borchardt, and P. Feng, “Supporting information
Self-doped Ti3+ Enhanced Photocatalyst For Hydrogen Production Under Visible-light,” J.
Am. Chem. Soc., vol. 132, pp. 11856–11857, 2010.

45
[58] D. Kumar Behara et al., “Coupled optical absorption, charge carrier separation, and surface
electrochemistry in surface disordered/hydrogenated TiO2 for enhanced PEC water splitting
reaction,” Phys. Chem. Chem. Phys. Phys. Chem. Chem. Phys. Accept. Manuscr., vol. 18,
pp. 8364–8377, 2016.
[59] P. Yan et al., “Photoelectrochemical water splitting promoted with a disordered surface
layer created by electrochemical reduction,” ACS Appl. Mater. Interfaces, vol. 7, no. 6, pp.
3791–3796, 2015.

46
Chapter 4: Experimental Methods and Materials
4.1 Electrode Synthesis:
Nanotubes are known of their directional charge transfer which allow for better charge
collection [1], while nanospheres are known of their high surface area to volume ratio which speed
up the catalytic reactions. We may combine both advantages of directional charge transfer and
high surface area in an oval shaped sub 100 nm nanotubular structure [2]. Briefly, pure titanium
foil samples were ultrasonically cleaned in acetone, ethanol, and then water. Anodization of the
foils was carried out in two-electrode cells, with the titanium foils as the working electrode and
platinum foil as the counter electrode as shown in Figure 4.1. The electrolyte was prepared by
mixing 1% NH4F (Sigma-Aldrich, $ 98%) with 1.1 wt% polyvinylpyrrolidone (MW ~40 000,
Loba Chemie) and 0.75 wt% H2O in a formamide-based electrolyte using a galvanostatic
anodization method for 2.5 h at 0 ℃. The pH of the electrolyte was controlled by the addition of
0.1 M acetic acid to the solution. Prior to anodization, the electrolyte was stirred for 1.15 h at 100
℃. The As-anodized samples were annealed in air, Hydrogen, and Oxygen using a Thermo-
Scientific LINDBURG/BLUE M TF55030C tube furnace at 450 °C for 2 h, with up/down rates of
1 °C/min.

47
Figure 4.1: Anodization setup.
4.2 Electrodes Characterization
The fabricated nanotubes have a diameter of 20 ± 3 nm as shown in Figure 4.2a and d with
an average length of 70 ± 10 nm. To further ensure the tubular nature of the structure, the nanotubes
were peeled of the Ti foil and examined under TEM as shown in Figures 4.2 b and e. Figure 4.2c
shows the HR-TEM which reveals the partial crystallinity of TiO2 while the inset in Figure 4.2f
presents the lattice distance of the structure which is 0.4 nm corresponding to anatase.
X-ray photoelectron spectroscopy (XPS) was performed in an ultrahigh vacuum chamber
(UHV) equipped with a monochromatic Al Kα (1486.6eV), X-Ray source and a SPHERA U7
hemispherical analyzer. The total energy resolution of the X-ray source was equal to 0.1 eV. While
for acquiring the survey spectrum and the high resolution core level peaks for the various elements,
the X-ray Source was tuned to be 40 and 20 eV, respectively. A Shimadzu UV-3600 UV-Vis- NIR
spectrophotometer with integrated sphere was used for optical characterization. The phase and
local structural details of TiO2 were obtained from the Raman spectroscopy with a 532 nm
excitation wavelength laser beam.
48
Figure 4.2: a) SEM, b) TEM, and c) HR-TEM images of the as-anodized samples while (d) SEM,
(e) TEM, and (f) HR- TEM images of the samples annealed at 400 oC. [2]
4.3 Photoelectrochemical Analysis
Photoelectrochemical properties of the samples were investigated using a three-electrode
configuration, with the TiO2 nanotube array photo anode as a working electrode, saturated Calomel
as a reference electrode, and platinum foil as a cathode as shown in Figure 4.3. To measure dark
and illuminated currents at a scan rate of 0.05 Vs-1, a scanning potentiostat (Biologic SP-200) was
used with an applied bias from 0 V to 1.2 V vs SCE supplied to the anode. Sunlight was simulated
using a 300 W ozone-free xenon lamp and AM 1.5G filter at 100 mW cm-2. Impedance spectra
were measured at different applied potentials versus SCE and fitted to equivalent circuits using Z-

49
fit software. The IPCE experiments were conducted in a two- electrode cell under no applied bias
with the nanotube film as the working photoelectrode and platinum foil as the counter electrode in
1.0 M KOH solution.
Figure.4.3: Photo-electrochemical cell connected to potientiostat.

50
References
[1] Y. Liu, B. Zhou, J. Li, X. Gan, J. Bai, and W. Cai, “Preparation of short, robust and highly
ordered TiO2 nanotube arrays and their applications as electrode,” Appl. Catal. B Environ.,
vol. 92, no. 3–4, pp. 326–332, 2009.
[2] M. Samir, M. Salama, and N. K. Allam, “Sub-100 nm TiO2 tubular architectures for
efficient solar energy conversion,” J. Mater. Chem. A, vol. 4, no. 24, pp. 9375–9380, 2016.

51
Chapter 5: Results and discussion
5.1 Chemical Analysis
It is well-known that, aside from cases of very low oxygen partial pressures where interstitial
Tin+ ions dominate, oxygen vacancies are the major type of donating defects in TiO2 [1]. Thus,
oxygen-deficiency within the lattice of TiO2 has been extensively used as evidence for the increase
in donor density [2], [3]. To understand the extent of oxygen-deficiency within our samples, XPS
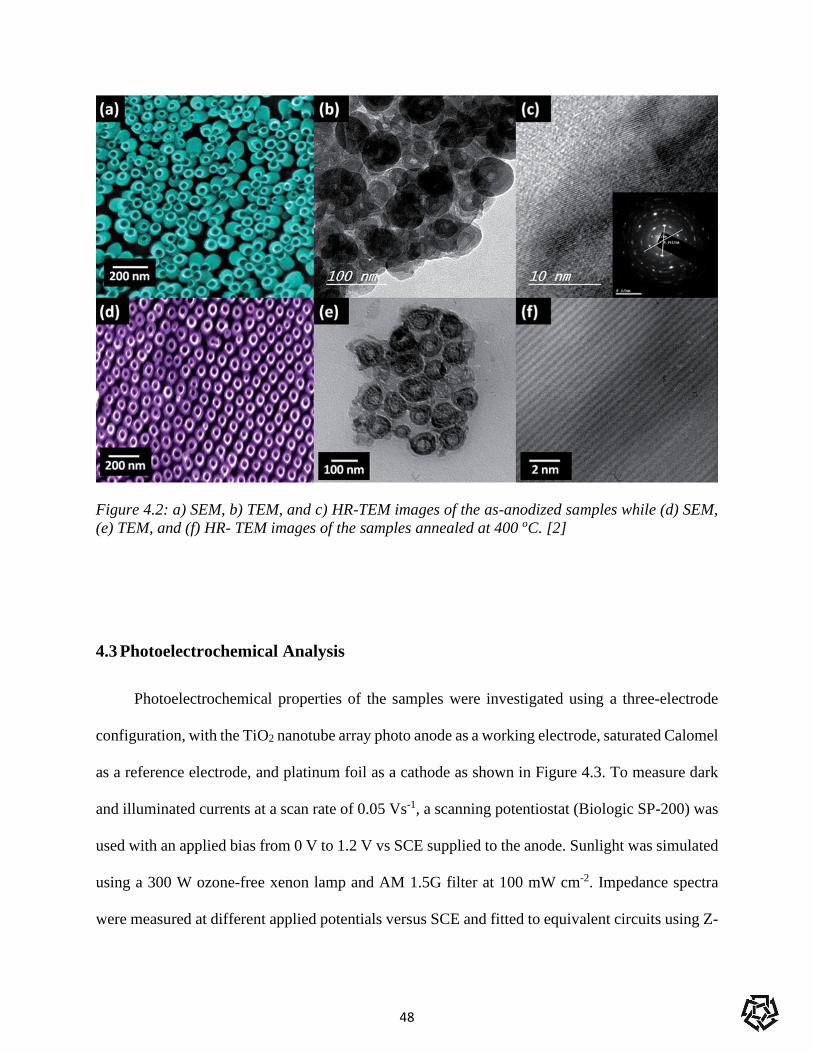
core spectra were collected. Figures 5.1- 5.5 show Ti 2p and O 1s core spectra, respectively. As
shown, red and blue shifts in the Ti 2p and O 1s spectra, respectively, can be observed in all
hydrogen-annealed samples. This can be related to the increase in oxygen-vacancies, where Ti4+
ions gain back some of their electrons forming Tin+ (n<4), which should have lower binding
energies. On the other hand, oxygen ions exhibit more competitiveness over its electrons due to
their increased deficiency, which would result in higher electron binding energies. Focusing on Ti
2p spectra, all samples show doublet peaks (464.2-6 eV for 2p1/2 and 458.5-9 eV for 2p3/2) within
range of standard data, [4] although the red shifts in the hydrogen-annealed samples lead to binding
energies (<458.6 eV) that were attributed before to Ti3+ states close to oxygen vacancies [5].
Turning to O 1s spectra, air- and oxygen-annealed samples exhibited peaks centered at 529.7 eV,
characteristic of lattice oxygen [4], [6] with stoichiometries of TiO1.9 and TiO2 respectively. As
expected, oxygen annealing has neutralized most of the oxygen vacancies in the crystal lattice
increasing the concentration of Ti4+ and reducing the donor density. One can observe a strong peak
in the oxygen-annealed sample centered at 532.5 eV which is assigned to the full oxidation of
adventitious carbon species [7] deposited on the sample’s surface during anodization in an organic
electrolyte, handling of the samples and cleaning using ethanol [8]. Considering hydrogen

52
annealed samples, the reducing atmosphere created by hydrogen gas induced structural defects in
the form of increased concentration of oxygen vacancies [9]–[13] which is inferred when
observing the stoichiometry resulting from different hydrogen flow rates. For H2 50 and H2 100,
the calculated stoichiometries were nearly the same TiO1.7 while for H2 150 the stoichiometry was
TiO1.4.
53
Figure 5.1: XPS core spectra of Ti 2p (upper) and O 1s (lower) for oxygen annealed samples
oxgn_ti2p.txt
TI(IV)3/2
TI(IV)1/2
Ti(III)3/2
Ti(III)1/2
NameTI(IV)3/2TI(IV)1/2Ti(III)3/2Ti(III)1/2
Pos.458.47464.17458.00463.40
%Area58.02
0.0041.98
0.00
x 103
5
10
15
20
25
30
35
Inte
nsit
y
480 475 470 465 460 455 450Binding Energy (eV)
O O1s
Oxide
Defects
Si
C
NameOxideDefectsSiC
Pos.529.78531.85532.14532.65
%Area37.24
7.9531.4423.36
x 103
10
15
20
25
30
35
40
45
Inte
nsit
y
540 536 532 528 524Binding Energy (eV)

54
Figure 5.2: XPS core spectra of Ti 2p (upper) and O 1s (lower) for air annealed samples
air ti2p.txt
TI(IV)3/2
TI(IV)1/2
Ti(III)3/2
Ti(III)1/2
NameTI(IV)3/2TI(IV)1/2Ti(III)3/2Ti(III)1/2
Pos.458.41464.11457.97463.37
%Area47.94
0.0052.06
0.00
x 103
5
10
15
20
25
30
35
40
45
Inte
nsit
y
480 475 470 465 460 455 450Binding Energy (eV)
air o1s.txt
Oxide
Defects
Si
C
NameOxideDefectsSiC
Pos.529.69530.70532.43532.90
%Area54.5515.4826.62
3.36
x 103
10
15
20
25
30
35
40
45
50
55
Inte
nsit
y
540 536 532 528 524Binding Energy (eV)

55
Figure 5.3: XPS core spectra of Ti 2p (upper) and O 1s (lower) for H50
h50 ti2p.txt
TI(IV)3/2
TI(IV)1/2
Ti(III)3/2
Ti(III)1/2
NameTI(IV)3/2TI(IV)1/2Ti(III)3/2Ti(III)1/2
Pos.458.50464.20458.00463.40
%Area65.20
0.0034.80
0.00
x 103
10
20
30
40
50
60
Inte
nsit
y
480 475 470 465 460 455 450Binding Energy (eV)
h50 o1s.txt
Oxide
DefectsSi
C
NameOxideDefectsSiC
Pos.529.77530.30532.00532.85
%Area56.7518.4521.41
3.38
x 103
10
20
30
40
50
60
70
Inte
nsit
y
540 536 532 528 524Binding Energy (eV)

56
Figure 5.4: XPS core spectra of Ti 2p (upper) and O 1s (lower) for H100
h100 ti2p.txt
TI(IV)3/2
TI(IV)1/2
Ti(III)3/2
Ti(III)1/2
NameTI(IV)3/2TI(IV)1/2Ti(III)3/2Ti(III)1/2
Pos.458.43464.13458.00463.40
%Area57.23
0.0042.77
0.00
x 103
5
10
15
20
25
30
35
40
45
50
Inte
nsit
y
480 475 470 465 460 455 450Binding Energy (eV)
h100 o1s.txt
Oxide
DefectsSi
C
NameOxideDefectsSiC
Pos.529.64530.25532.00532.72
%Area50.7818.9521.72
8.55
x 103
10
15
20
25
30
35
40
45
50
55
60
Inte
nsit
y
540 536 532 528 524Binding Energy (eV)

57
Figure 5.5: XPS core spectra of Ti 2p (upper) and O 1s (lower) for H150
h150 ti2p.txt
TI(IV)3/2
TI(IV)1/2Ti(III)3/2
Ti(III)1/2
NameTI(IV)3/2TI(IV)1/2Ti(III)3/2Ti(III)1/2
Pos.458.63464.33458.00463.40
%Area77.71
0.0022.29
0.00
x 103
5
10
15
20
25
30
35
Inte
nsit
y
480 475 470 465 460 455 450Binding Energy (eV)
h150 o1s.txt
Oxide
Defects
Si
C
NameOxideDefectsSiC
Pos.530.01530.38532.00533.03
%Area36.8323.6417.4222.11
x 103
10
15
20
25
30
35
40
45
Inte
nsit
y
540 536 532 528 524Binding Energy (eV)

58
5.2 Optical Characterization
The position of defect states inside black TiO2 can greatly affect its band gap, making
optical characterization a primary tool in mapping defect chemistry of semiconductors. As such,
UV-Vis and Raman spectra were collected for all samples. As shown in Figure 5.6, air and oxygen-
annealed samples exhibited sharp drops in absorption close to the fundamental band gap of TiO2.
Notable is the slow rise in absorbance of the Air-annealed samples alone towards lower photon
energies, which was previously attributed to inter-band gap defects [14]. Without a shift in the
absorption edge, H50 samples exhibited a sharper rise towards higher wavelengths, indicative of
abundance of defect states. Interestingly, H100 and H150 samples showed a similar, yet much-
later rise in absorbance (not displayed here) starting at 550-600 nm. This was preceded by a
broader absorption edge that fully decayed in the 500-550 nm range, clearly indicating visible-
light absorption of these samples. Comparison of the latter decay with the observed rise of
absorbance in the H50 samples, within the exact same range of energies, implies different natures
of defect states in these samples, where deep trap states attract electrons, thus possibly showing
low energy absorption peaks. This phenomenon seems to be absent in the H100 and H150 samples.
Table 5.1 lists the Tauc analysis data, presenting the band gaps of different samples. The
reduction in band gap has been attributed before to the creation of conduction and valence band
tails due to surface distortion as a result of annealing in heavily-reducing atmospheres [15] like
those exhibited in high flow rates of H2 gas during annealing. The question of the nature of this
defect band being different than, for instance, discrete defect states present in the H50 samples is
still un-answered.

59
Table 5.1: Calculated band gap for every annealing atmosphere of different samples.
Annealing atmosphere Bandgap (ev)
Air 3.34
O2 3.37
H50 3.31
H100 2.41
H150 2.45
Figure 5.7 shows the Raman spectra of the annealed samples. Note the difference in
intensities between Air and H50 samples compared to the O2, H100, and H150 set of samples. The
reason maybe the difference in phases between both sets of samples, with the Air and H50 samples
showing pure anatase structure, while rutile phase appears in the other three conditions,
diminishing the intensity of anatase peaks. More importantly are the phonon lifetimes, shown in
the left inset of Figure 5.7, where long phonon lifetimes in H50 samples are a direct indication of
increased scattering of electrons [16]. The origin of this observation can be the presence of
structural defects inside the lattice that hinder charge diffusion. In contrast, H100 and H150
samples showed the shortest phonon lifetimes, with the latter having slightly longer-living phonons
than the former. Although this seems to be in line with the conclusion drawn above about a change
in the nature of defects in black TiO2 nanostructures, the conclusion that more reducing
atmospheres lead to less lattice distortion seems contradicting with the literature.

60
Figure 5.6: UV-Vis absorbance spectra of different annealing conditions
However, a thorough analysis of the Raman spectra can resolve this discrepancy. The
calculated rutile/anatase phase ratios for all 5 sub-100 nm TiO2 array samples are listed in Table
5.2. Oxygen-annealed samples were mostly rutile, given the relatively high annealing temperature
for such short nanotubes, [17] coupled with the highly-oxidizing atmosphere, which should assist
in rutile crystallite growth as previously reported [18]. Regarding the hydrogen-annealed samples,
Bak et al. [19] have predicted that, although both types of defects generally arise, Ti3+ interstitials
are the dominant donor defect type in TiO2 under heavily-reducing atmospheres, not oxygen
vacancies. These interstitial ions were said to hinder atomic transport in anatase TiO2, [20] leading
to a delayed anatase-to-rutile transformation. On the other hand, it has also been reported that

61
anatase-to-rutile phase transformation starts at oxygen vacancies, where the energy needed to
reorder the atoms is relatively small [21], [18]. With the abundance of oxygen vacancies being one
of the main outcomes of hydrogen-annealing of TiO2, [9]–[13] anatase-to-rutile transformation
dynamics is perturbed. The larger structural disturbance in the H50 samples, as evident from the
longest phonon lifetimes, should have suppressed the anatase-to-rutile transformation, even at
these high temperatures. Increasing the extent of reduction, although expected to increase Ti3+
interstitials according to the model proposed by Bak et al. [19] leads to an increase of the density
of oxygen vacancies to an extent that allow rutile nucleation and growth. The latter process should
result in re-ordering of the lattice, and thus allowing for better charge transport, as evident from
the shortest phonon lifetime. Note that this transformation was not accompanied by loss of visible-
light absorption as that with oxygen-annealed samples. Optical characterization shows the
abundance of structural defects in anatase H50 samples that may act as trap states, while H100 and
H150 samples show extended visible-light absorption and less structural distortion. From tables
4.1 and 4.2 H150 has slightly larger band gap as well as rutile/anatase ratio compared to H100
which further confirms that anatase to rutile transformation reduces structural defects and thereby,
decreases conduction and valence band tailing resulting in a wider band gap. The deduced relation
between the increase in rutile phase content with increasing reduction of annealing atmosphere,
and the decrease in trap state density is yet to be confirmed.

62
Table 5.2: Rutile-to- anatase ratio of different samples
Annealing atmosphere Rutile/Anatase
Air 0.0
O2 16.0
H50 0.0
H100 3.1
H150 4.8
Figure 5.7: Raman spectra of Air (yellow) and H50 (green) samples. The inset in shows the
Raman spectra of the O (red), H100 (cayan) and H150 (Blue) samples.

63
5.3 Photoelectrochemical Analysis
As the ultimate effect of trap states in a material is the deterioration of its photocatalytic
performance, the photocurrent characteristics of the materials were investigated. Figure 5.8a shows
J-V plots for sub-100 nm 1D TiO2 structures annealed under different atmospheres. The air-
annealed samples exhibited the least photocurrent, followed by oxygen-annealed counterpart.
Annealing under different flow rates of H2 leads to an initial increase in photocurrent reaching ~2
orders of magnitude for samples annealed under 100 sccm H2 compared to the air-annealed
counterparts. Note that the dark currents show almost the same trend, see the top inset in Figure
5.8a. Increasing the flow rate till 150 sccm leads to a substantial loss of both dark and
photocurrents. A thorough analysis of the photocurrent behavior of H2-annealed samples indicates
a delay in the onset potential, implying the need for more potential to separate all charge carriers
within the space charge layer [22]. This may be a direct indication of increased donor states with
increasing H2 flow rate. Furthermore, Allam et al. [23] showed that an increase in dark currents
surpassing that in photocurrents may indicate, aside from diminished photoactivity, the abundance
of trap states compared to their shallow donor counterparts. They had also suggested a defect
sensitivity factor (S) describing this phenomenon that can be expressed as: [23]
𝑆 = 𝐶𝑑𝑎𝑟𝑘
𝐶𝑙𝑖𝑔ℎ𝑡 5.1
where C is the current density shift term, comparing the dark/photocurrent of samples annealed
under certain gas, to those annealed under air [23]. Calculating this factor for our samples (bottom
inset in Figure 5.8a, the H100 samples showed the least amount of trap states, followed by H50
samples. The H150 samples showed the greatest increase in dark currents versus that in
photocurrents compared to air-annealed samples. Note that oxygen-annealed samples showed
Figures less than 1 owing to the decrease in defect density (e.g. oxygen vacancies) in the highly-

64
oxidizing atmosphere. This trend explains, to some extent, the observed photocurrent behavior,
where the decreased abundance of localized trap states in H100 samples allowed for the highest
charge collection as compared to the H50 and H150 counterparts. Also, the photocurrents of all
hydrogen-annealed samples, being higher than that for oxygen samples, dictate that such trap states
are accompanied by the creation of beneficial donor states under hydrogen-rich atmosphere. These
observation are in agreement with the conclusions drawn from the optical characterization for
H100 samples. There remains now to explain the diminished behavior of samples annealed under
150 sccm H2 flow compared to their H50 counterparts.
Figure 5.8: (a) J-V plots for sub-100 nm 1D TiO2 structures annealed under different atmospheres
with the lower inset presents defect sensitivity factor of different samples, and (b) Donor density
of different samples on the left axis and the flat band potential shown on the right axis.
To this end, Mott-Schottky plots were extracted from the electrochemical impedance
spectroscopy measurements in order to understand the defect distribution in the samples. Figure
5.8b shows the variation of flat band potential (VFB) and the donor density (ND) of the samples
annealed in different atmospheres. Note that air-annealed samples showed the most anodic VFB,
which was expected given the widely-known position of oxygen vacancy defect states (0.7-1.2 eV

65
below the CBM) [3], [24]–[28]. It is expected that the Fermi level would be situated around such
donor states. Oxygen annealing, on the other hand, shifted the Fermi level towards the CBM owing
to the annihilation of oxygen vacancies. This aside, the behavior of hydrogen-annealed samples
showed the same trend in ND and VFB, where H50 samples showed the highest density of donor
states, as well as the most cathodic Fermi level, followed by H100 samples, then H150. These
results closely fit the arguments presented above. Firstly, with the abundance of defect states in
the H50 sample, many of which must be donating electrons to the CBM as evident from the high
photocurrent, which would shift the Fermi level upward (more cathodic potentials versus NHE).
Secondly, with the heavily-reducing atmospheres of the H100 and H150 samples, as discussed
before, rutile phase nucleation and growth occurred, lowering the CBM of anatase and re-arranging
the atoms inside the lattice to give less defect density and better charge transport. However, the
extended anatase-to-rutile transformation in H150 samples leads to a deterioration in the
photocatalytic performance, owing to the less-activity of rutile phase towards solar water splitting
[29]. This explains the lowest VFB, as well as the relatively low photocurrent, and relatively high
dark current. Another reason for the diminishing performance of H150 samples can be explained
in terms of the position from which rutile phases nucleate. Allam et al. [20] have previously proved
that rutile phases originate from the metal substrate moving upwards towards the oxide nanotube
arrays. Similar to our observations, initial increase in rutile/anatase ratios of their samples
enhanced photocatalytic performance, followed by photocurrent deterioration at high rutile
contents. They explained that phenomenon via the densification of the rutile crystallites beneath
the TiO2 nanotubes, which may have blocked charge carriers trying to reach the metal electrode
[18]. However, note that our samples did not show any structural damage as can be seen from the
SEM images of the sub-100 nm structures before and after annealing in the different atmospheres

66
(Figure 5.9). Consequently, it is safe to conclude that anatase-to-rutile transformation can play an
important role in decreasing the density of trap states, without greatly annihilating beneficial
shallow donor states. However, high rutile contents can deteriorate the effect of those donor states
for one or more of the following: 1) either through extended annihilation of these shallow states,
or 2) through creating charge carrier traps at the interface of substrate and the oxide, or 3) simply
due to the less-activity of the rutile phase towards water splitting.
Figure 5.9: SEM image of as-anodized (left) and H100 (right) sub-100 nm TiO2 nanotubes
Finally, with the optimized electrode dimensions of the sub-100 nm TiO2 structures, and
the optimized electronic characteristics of the H100 modification scheme, 2-electrode incident
photon to current efficiency (IPCE) analysis was performed to investigate the charge collection
characteristics, Figure 5.10. The H100 samples showed the highest IPCE values (~30%) followed
by H150 samples (~ 23%) and finally the H50 samples. The hydrogen annealed samples super
pass the air-annealed counterparts as a result of excess oxygen vacancies induced by annealing in
a reducing atmosphere. Those vacancies are responsible for the increased number of free carriers
that promote water splitting reaction. However, when TiO2 is subject to heavily reducing
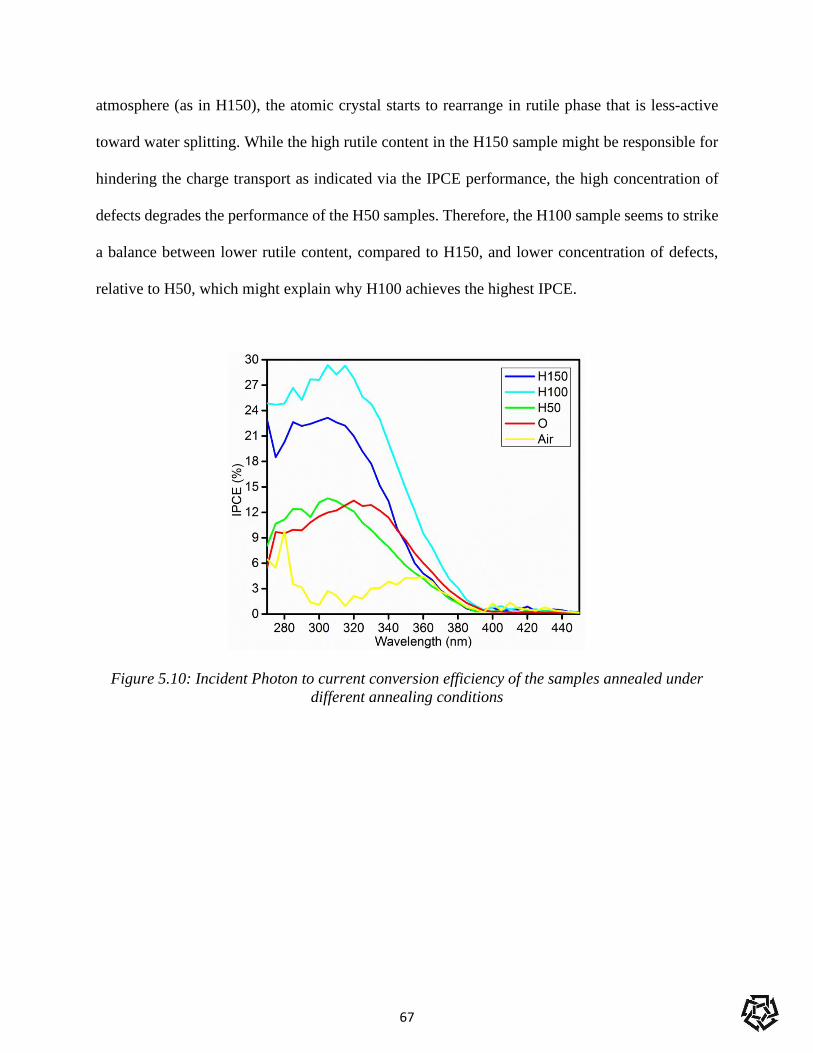
67
atmosphere (as in H150), the atomic crystal starts to rearrange in rutile phase that is less-active
toward water splitting. While the high rutile content in the H150 sample might be responsible for
hindering the charge transport as indicated via the IPCE performance, the high concentration of
defects degrades the performance of the H50 samples. Therefore, the H100 sample seems to strike
a balance between lower rutile content, compared to H150, and lower concentration of defects,
relative to H50, which might explain why H100 achieves the highest IPCE.
Figure 5.10: Incident Photon to current conversion efficiency of the samples annealed under
different annealing conditions

68
References
[1] T. Bak, J. Nowotny, M. Rekas, and C. C. Sorrell, “Defect chemistry and semiconducting
properties of titanium dioxide: I. Intrinsic electronic equilibrium,” J. Phys. Chem. Solids,
vol. 64, no. 7, pp. 1043–1056, 2003.
[2] H. Cui et al., “Black TiO2 nanotube arrays for high-efficiency photoelectrochemical water-
splitting,” J. Mater. Chem. A, vol. 2, no. 23, pp. 8612–8616, 2014.
[3] G. Wang et al., “Hydrogen-treated TiO2 nanowire arrays for photoelectrochemical water
splitting,” Nano Lett., vol. 11, no. 7, pp. 3026–3033, 2011.
[4] J. R. Rumble, D. M. Bickham, and C. J. Powell, “The NIST x-ray photoelectron
spectroscopy database,” Surf. Interface Anal., vol. 19, no. 1–12, pp. 241–246, Jun. 1992.
[5] R. P. Antony, T. Mathews, S. Dash, A. K. Tyagi, and B. Raj, “X-ray photoelectron
spectroscopic studies of anodically synthesized self aligned TiO2 nanotube arrays and the
effect of electrochemical parameters on tube morphology,” Mater. Chem. Phys., vol. 132,
no. 2–3, pp. 957–966, 2012.
[6] L. Chen, F. He, Y. Huang, Y. Meng, and R. Guo, “Hydrogenated nanoporous TiO2 film on
Ti-25Nb-3Mo-2Sn-3Zr alloy with enhanced photocatalytic and sterilization activities
driven by visible light,” J. Alloys Compd., vol. 678, pp. 5–11, 2016.
[7] D. Beamson, G.; Briggs, High-Resolution Spectra of Organic Polymers: The Scienta
ESCA300 Database. Chichester [England] ; Wiley, 1992.
[8] G. Ketteler et al., “The Nature of Water Nucleation Sites on TiO 2 ( 110 ) Surfaces Revealed
by Ambient Pressure X-ray Photoelectron Spectroscopy,” J. Phys. Chem. C, vol. 2, no. 110,

69
pp. 8278–8282, 2007.
[9] F. M. Pesci, G. Wang, D. R. Klug, Y. Li, and A. J. Cowan, “Efficient Suppression of
Electron − Hole Recombination in Oxygen- Deficient Hydrogen-Treated TiO2 Nanowires
for Photoelectrochemical Water Splitting,” J. Phys. Chem. C, vol. 117, p. 25837, 2013.
[10] J. Dong et al., “Defective black TiO2 synthesized via anodization for visible-light
photocatalysis,” ACS Appl. Mater. Interfaces, vol. 6, no. 3, pp. 1385–1388, 2014.
[11] X. Jiang et al., “Characterization of Oxygen Vacancies Associates within the Hydrogenated
TiO2 : a Positron Annihilation Study Characterization of Oxygen Vacancies Associates
within the Hydrogenated TiO2 : a Positron Annihilation Study,” J.Phys.Chem.C, vol. 116,
pp. 22619–22624, 2012.
[12] L. R. Grabstanowicz et al., “Facile oxidative conversion of TiH2 to high-concentration
Ti3+-self-doped rutile TiO2 with visible-light photoactivity,” Inorg. Chem., vol. 52, no. 7,
pp. 3884–3890, 2013.
[13] H. Yin et al., “Gray TiO2 nanowires synthesized by aluminum-mediated reduction and their
excellent photocatalytic activity for water cleaning,” Chem. - A Eur. J., vol. 19, no. 40, pp.
13313–13316, 2013.
[14] T. L. Thompson and J. T. Yates, “Surface science studies of the photoactivation of
TiO[dw]2[/dw] -- new photochemical processes,” Chem. Rev., vol. 106, no. 412, pp. 4428–
4453, 2006.
[15] M. M. Khan et al., “Band gap engineered TiO2 nanoparticles for visible light induced
photoelectrochemical and photocatalytic studies,” J. Mater. Chem. A, vol. 2, no. 3, pp. 637–

70
644, 2014.
[16] E. Hendry, F. Wang, J. Shan, T. F. Heinz, and M. Bonn, “Electron transport in TiO2 probed
by THz time-domain spectroscopy,” Phys. Rev. B, vol. 69, no. 8, p. 81101, 2004.
[17] O. K. Varghese, D. Gong, M. Paulose, C. a. Grimes, and E. C. Dickey, “Crystallization and
high-temperature structural stability of titanium oxide nanotube arrays,” J. Mater. Res., vol.
18, no. 1, pp. 156–165, 2003.
[18] F. Hardcastle, “Raman Spectroscopy of Titania (TiO2) Nanotubular Water-Splitting
Catalysts,” J. Ark. Acad. Sci., vol. 65, pp. 43–48, 2011.
[19] T. Bak, J. Nowotny, M. Rekas, and C. C. Sorrell, “Defect chemistry and semiconducting
properties of titanium dioxide: II. Defect diagrams,” J. Phys. Chem. Solids, vol. 64, no. 7,
pp. 1057–1067, 2003.
[20] N. Allam and M. El-Sayed, “Photoelectrochemical water oxidation characteristics of
anodically fabricated TiO2 nanotube arrays: structural and optical properties,” J. Phys.
Chem. C, vol. 114, pp. 12024–12029, 2010.
[21] Y. Wang, L. Zhang, K. Deng, X. Chen, and Z. Zou, “Low Temperature Synthesis and
Photocatalytic Activity of Rutile TiO2 Nanorod Superstructures,” J. Phys. Chem. C, vol.
111, no. October, pp. 2709–2714, 2007.
[22] A. W. Amer, M. A. El-Sayed, and N. K. Allam, “Tuning the Photoactivity of Zirconia
Nanotubes-Based Photoanodes via Ultrathin Layers of ZrN: An Effective Approach toward
Visible-Light Water Splitting,” J. Phys. Chem. C, vol. 120, no. 13, pp. 7025–7032, 2016.
[23] A. M. Mohamed, A. W. Amer, S. Y. AlQaradawi, and N. K. Allam, “On the nature of defect

71
states in tungstate nanoflake arrays as promising photoanodes in solar fuel cells,” Phys.
Chem. Chem. Phys., vol. 18, no. 32, pp. 22217–22223, 2016.
[24] A. Naldoni et al., “Effect of nature and location of defects on bandgap narrowing in black
TiO2 nanoparticles,” J. Am. Chem. Soc., vol. 134, no. 18, pp. 7600–7603, 2012.
[25] L. Liu, P. Y. Yu, X. Chen, S. S. Mao, and D. Z. Shen, “Hydrogenation and disorder in
engineered black TiO2,” Phys. Rev. Lett., vol. 111, no. 6, pp. 1–5, 2013.
[26] X. Chen, L. Liu, P. Y. Yu, and S. S. Mao, “Increasing solar absorption for photocatalysis
with black hydrogenated titanium dioxide nanocrystals.,” Science, vol. 331, no. 6018, pp.
746–50, 2011.
[27] X. Chen et al., “Properties of disorder-engineered black titanium dioxide nanoparticles
through hydrogenation.,” Sci. Rep., vol. 3, pp. 1510-1-1510–7, 2013.
[28] Y. H. Hu, “A highly efficient photocatalyst-hydrogenated black TiO2 for the photocatalytic
splitting of water,” Angew. Chemie - Int. Ed., vol. 51, no. 50, pp. 12410–12412, 2012.
[29] D. C. Hurum, a G. Agrios, K. a Gray, T. Rajh, and M. C. Thurnauer, “Explaining the
enhanced photocatalytic activity of Degussa P25 mixed-phase TiO2 using EPR,” J. Phys.
Chem. B, vol. 107, no. 19, pp. 4545–4549, 2003.

72
CONCLUSIONS
The hydrogenation of TiO2 nanostructures was optimized by varying the hydrogen flow
rate during the annealing process. XPS analysis showed that changing the flow rate resulted in the
formation of different stoichiometric oxides. Raman and UV-Vis spectroscopy analyses were used
to study the effect of the anatase-to-rutile ratio on the optical and structural properties of the
material. The electrochemical analysis revealed how the anatase-to-rutile ratio affected the
concentration of defects and donor density of the samples annealed in different atmospheres and
at different flow rates. The low flow rate was found to be insufficient to promote rutile phase
formation but could induce deeper trap states and higher density of donor states. On the other hand,
high flow rate induced rutile transformation, which decreased the density of deep trap states.
Finally, we concluded that there exists an optimum reduction rate that utilizes the high donor
density, with relatively low concentration of deep traps and rutile content, to achieve the highest
photoconversion efficiency.

73
Future Work
• Thin Nanotubes
Our work involved the use of optimized short tubular structures which can help to deliver
more electrons to the metal contact as a result of photo-excitation resulting in higher collection
efficiency of electrons. However, the wall thickness of the tubes is still uncontrolled. It is of great
importance to reduce the wall thickness of the nanotubes since the hole diffusion length is the
bottle neck of the charge transport. Thus, controlling the water content in the anodization process
has proven to control the tube diameter and its wall thickness.
• Metal Doped Hydrogenated TiO2
Adding to that, pure TiO2 got reduced to increase its solar absorption efficiency by
hydrogenation. However, doped TiO2 has shown improved charge transport properties over pure
one as well as reduced band gap. It is of great importance to try to hydrogenate metal doped TiO2
such as Cu, Fe, Wn doped TiO2. Such process may increase the carrier concentration inside the
bulk allowing higher water splitting reaction rate.

74
Publication
Moamen M. Soliman, Mohamed H. Al Haron, Menna Samir, Basamat S. Shaheen, Ahmed W.
Amer, Sarah A. Tolba, Omar F. Mohammed, Nageh K. Allam, Tunable nature of defect states in
black TiO2 nanostructures, Submitted.