tunisia country program evaluation...
TRANSCRIPT

VOLUME 2 | APPENDIXES
Tunisia Country Program EvaluationFY2005–13
EVALUATION OF THE WORLD BANK GROUP PROGR AM

Tunisia Country Program Evaluation, FY05-13
Volume II: Appendixes
April 16, 2014

iii
Contents
APPENDIXES
ABBREVIATIONS ................................................................................................................................... V
APPENDIX A. SUMMARY OF WORLD BANK GROUP PROGRAM OUTCOME RATINGS .................. 1
APPENDIX B. GUIDE TO THE INDEPENDENT EVALUATION GROUP’S COUNTRY PROGRAM EVALUATION METHODOLOGY .......................................................................................................... 13
APPENDIX C. STATISTICAL SUPPLEMENT ON BANK ACTIVITIES ................................................. 19
APPENDIX D. TUNISIA DONORS’ COLLABORATION OVER 1990-2013 .......................................... 31
APPENDIX E. DESCRIPTION OF THE WORLD BANK GROUP STRATEGY AND PROGRAM OVER FY05-13 ................................................................................................................................................ 35
APPENDIX F. SUPPLEMENTARY INFORMATION ON PILLAR 1 ....................................................... 45
APPENDIX G. SUPPLEMENTARY INFORMATION ON PILLAR 2 ...................................................... 71
APPENDIX H. SUPPLEMENTARY INFORMATION ON PILLAR 3 ...................................................... 83
APPENDIX I. SUPPLEMENTARY INFORMATION ON PILLAR 4 ........................................................ 93
APPENDIX J. ANALYSIS OF SOCIAL MEDIA OUTREACH .............................................................. 101
APPENDIX K. STATISTICAL SUPPLEMENT ..................................................................................... 105
APPENDIX L. GENDER ...................................................................................................................... 115
APPENDIX M. PERSONS INTERVIEWED ......................................................................................... 123
Evaluation Managers
Caroline Heider Director-General, Evaluation
Nick York Director, IEGCC
Geeta Batra Manager
Florence Charlier Task Manager


v
Abbreviations AAA Analytical and Advisory Activities AFD Agence Française de Développement AfDB African Development Bank ALMP Active Labor Market Program ANETI Agence Nationale pour l’Emploi et le Travail Indépendant APL Adaptable Program Loan ASSP Agriculture Support Services Project BOT Build-Operate-Transfer CAS Country Assistance Strategy CASPR Country Assistance Strategy Progress Report CASCR Country Assistance Strategy Completion Report CDD Community Driven Development CFAA Country Financial Accountability Assessment CFNCE Chambre Nationale Des Femmes Chefs D’ Entreprises CPAR Country Procurement Assessment Report CPE Country Program Evaluation CPR Congress for the Republic CPS Country Program Strategy CSO Civil Society Organization DP Development Partner DPL Development Policy Lending DPR Detailed Project Report EBRD European Bank for Reconstruction and Development FSAP Financial Sector Assessment Program GDP Gross Domestic Product GEF Global environment Facility GTZ German Organization for Technical Cooperation ECAL IV Fourth Economic Competitiveness Development Policy Loan ESW Economic Sector work EU European Union FDI Foreign Direct Investment GBO Grassroots Business Organization GDP Gross Domestic Product GO DPL Governance and Opportunity Development Policy Loan GOJ DPL Governance Opportunity and Jobs Development Policy Loan GTZ Deutsche Gesellschaft fur Internationale Zusammenarbeit HIPC Higher Procurement Commission IBRD International Bank of Reconstruction and Development ICL Integration and Competitiveness Development Policy Loan ICR Implementation Completion Report ICRR Implementation Completion Report Review ICT Information and Communications Technology IDF Institutional Development Fund IDB Islamic Development Bank IEG Independent Evaluation Group IFC International Finance Cooperation IFI International Financial Institution IMF International Monetary Fund

ABBREVIATIONS
vi
INS National Institute for Statistics ISN Interim Strategy Notes ISR Implementation Status Report JSDF Japan Social Development Fund LMD License (often called Bachelor) Master Doctorate M&E Monitoring and Evaluation MDG Millennium Development Goals MENA Middle East and North Africa MIGA Multilateral Investment Guaranty Agency MOF Ministry of Finance MTEF Medium Term Expenditure Framework MVTE Ministry of Vocational Training and Employment NGO Non-governmental organization NPL non-performing loans NRM Natural Resource Management Project ODA Official Development Assistance OECD/DAC Organization for Economic Cooperation and Development/Development Assistance
Committee OED Operations Evaluation Department ONAS Office National de l’Assainissement PHRD Japanese Policy and Human Resources Development Fund PBB Performance-based Budgeting PEFA Public Expenditure and Financial Accountability PFM Public Finance Management PPP Public Private Partnership PSD Public Sector Development QAG Quality Assurance Group RCD Constitutional Democratic Assembly SME Small and Medium-sized Enterprise SONEDE Société Nationale d’Exploitation et de Distribution des Eaux TA Technical Assistance TT Tunisie Télécom UNICEF United Nations Children’s Fund VAT Value Added Tax WHO World Health Organization

1
Appendix A. Summary of World Bank Group Program Outcome Ratings
1. The evaluation criteria for Tunisia are the same as for other Country
Program Evaluations (CPEs) conducted by the Independent Evaluation Group
(IEG). CPEs assess and rate the outcomes of World Bank Group country programs
relative to their objectives. This differs from rating the country outcomes achieved
as part of the relevant government’s planning process, and also differs from rating
the actual performance of the government or the World Bank Group itself. The
central question underlying the table that follows is: to what extent did the World
Bank Group program achieve the outcomes that it set out to achieve?
2. Distinct ratings and sub-ratings are typically assigned to each “pillar” or set
of strategic goals set out in relevant World Bank Group strategy documents. For
Tunisia, the strategic goals are based on the Country Assistance Strategy (CAS) for
FY05-08, the Country Program Strategy (CPS) for FY10-13 (which was cancelled
after the revolution), and the Interim Strategy Note (ISN) for FY13-14, which is
ongoing. As the CPS is in train, it is not possible to assess outcomes over that
period; instead, the rating for the achievement of outcomes is limited to an
assessment of strategy FY05-10. Appendix B elaborates on IEG’s rating
methodology.
ACHIEVEMENT OF RESULTS ASSOCIATED WITH WORLD BANK
GROUP OBJECTIVES (2005-2013)
WORLD BANK GROUP CONTRIBUTION TO RESULTS (2005-2013)
WORLD BANK GROUP RATING
(2005-2010)
PILLAR 1: STRENGTHENING THE BUSINESS ENVIRONMENT, IMPROVING THE COMPETITIVENESS, AND DEEPENING INTEGRATION OF THE TUNISIAN ECONOMY
World Bank Group objective: Maintaining macro-economic stability
Macro-economic performance was satisfactory. Despite adverse external shocks, there was moderate economic growth and macro stability was preserved:
Inflation was moderate. Despite the strains in recent years,
the budget and current account deficits remain within manageable limits.
Public debt and external debt, though high by international standards, were within acceptable bounds.
The Bank’s analytical work, especially the development policy reviews (DPRs), was a useful input into the government’s development planning. The Bank made several policy-based loans (ECAL4, ICL, GO DPL, GOJ DPL) that were premised on a mutually agreed upon macro framework. Fiscal consolidation, development of a medium term fiscal framework, and improved debt management were specific areas of focus in which some progress was made. The Bank’s direct financial contribution to the financing of the budget and the co-financing it attracted helped maintain macro-stability in times of financial crisis.
Satisfactory
World Bank Group Objective: Deepening integration into the world economy
Satisfactory progress was made in dismantling tariff and non-tariff barriers
The Bank provided support to deepening global integration. Policy interventions supported by the Bank focused on
Moderately
APPENDIX A SUMMARY OF WORLD BANK GROUP PROGRAM OUTCOME RATINGS
2
ACHIEVEMENT OF RESULTS ASSOCIATED WITH WORLD BANK
GROUP OBJECTIVES (2005-2013)
WORLD BANK GROUP CONTRIBUTION TO RESULTS (2005-2013)
WORLD BANK GROUP RATING
(2005-2010)
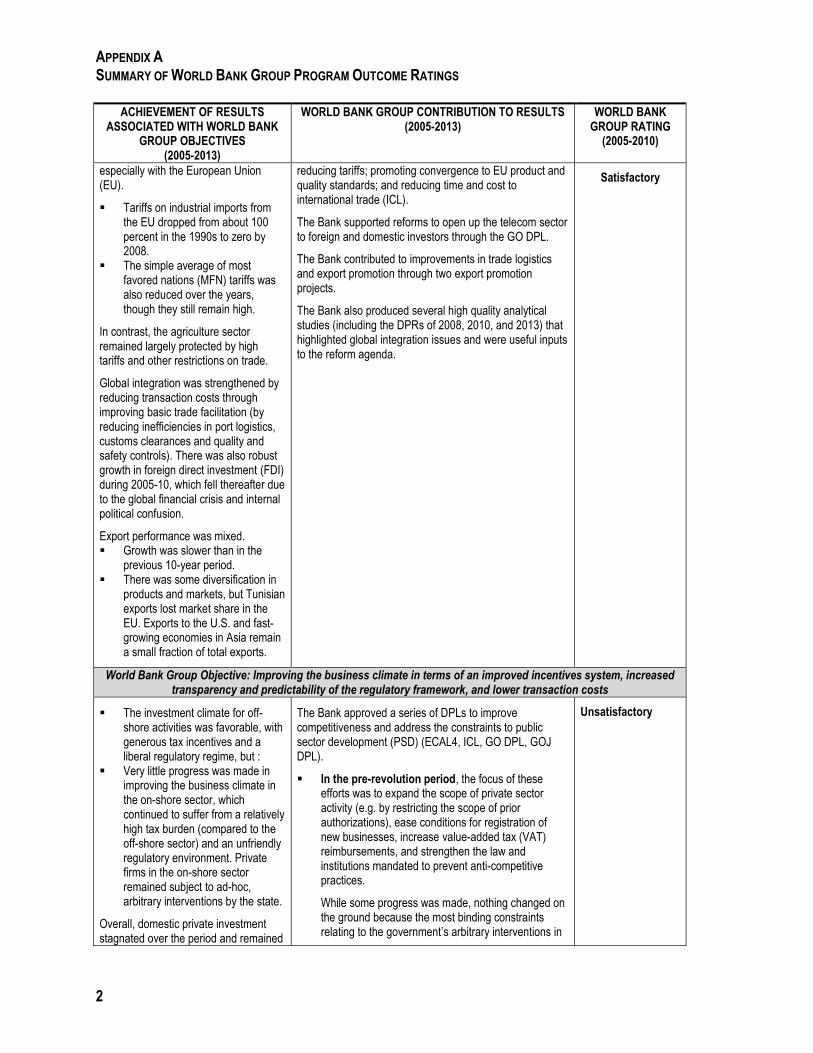
especially with the European Union (EU).
Tariffs on industrial imports from the EU dropped from about 100 percent in the 1990s to zero by 2008.
The simple average of most favored nations (MFN) tariffs was also reduced over the years, though they still remain high.
In contrast, the agriculture sector remained largely protected by high tariffs and other restrictions on trade.
Global integration was strengthened by reducing transaction costs through improving basic trade facilitation (by reducing inefficiencies in port logistics, customs clearances and quality and safety controls). There was also robust growth in foreign direct investment (FDI) during 2005-10, which fell thereafter due to the global financial crisis and internal political confusion.
Export performance was mixed. Growth was slower than in the
previous 10-year period. There was some diversification in
products and markets, but Tunisian exports lost market share in the EU. Exports to the U.S. and fast-growing economies in Asia remain a small fraction of total exports.
reducing tariffs; promoting convergence to EU product and quality standards; and reducing time and cost to international trade (ICL).
The Bank supported reforms to open up the telecom sector to foreign and domestic investors through the GO DPL.
The Bank contributed to improvements in trade logistics and export promotion through two export promotion projects.
The Bank also produced several high quality analytical studies (including the DPRs of 2008, 2010, and 2013) that highlighted global integration issues and were useful inputs to the reform agenda.
Satisfactory
World Bank Group Objective: Improving the business climate in terms of an improved incentives system, increased transparency and predictability of the regulatory framework, and lower transaction costs
The investment climate for off-shore activities was favorable, with generous tax incentives and a liberal regulatory regime, but :
Very little progress was made in improving the business climate in the on-shore sector, which continued to suffer from a relatively high tax burden (compared to the off-shore sector) and an unfriendly regulatory environment. Private firms in the on-shore sector remained subject to ad-hoc, arbitrary interventions by the state.
Overall, domestic private investment stagnated over the period and remained
The Bank approved a series of DPLs to improve competitiveness and address the constraints to public sector development (PSD) (ECAL4, ICL, GO DPL, GOJ DPL).
In the pre-revolution period, the focus of these efforts was to expand the scope of private sector activity (e.g. by restricting the scope of prior authorizations), ease conditions for registration of new businesses, increase value-added tax (VAT) reimbursements, and strengthen the law and institutions mandated to prevent anti-competitive practices.
While some progress was made, nothing changed on the ground because the most binding constraints relating to the government’s arbitrary interventions in
Unsatisfactory

APPENDIX A SUMMARY OF WORLD BANK GROUP PROGRAM OUTCOME RATINGS
3
ACHIEVEMENT OF RESULTS ASSOCIATED WITH WORLD BANK
GROUP OBJECTIVES (2005-2013)
WORLD BANK GROUP CONTRIBUTION TO RESULTS (2005-2013)
WORLD BANK GROUP RATING
(2005-2010)
around a low 14 percent of GDP. the on-shore sector were not addressed.
After the revolution, governance issues were supported through DPLs notably to reduce the regulatory burden and revise the investment code, competition law, and bankruptcy framework to improve the overall business environment. But no progress has been made so far.
The International Finance Corporation (IFC) complemented these loans by specific investments in support of the private sector in infrastructure, oil, and gas exploration; electrical engineering; and the health sector. While it is still too early to assess their results, some of these investments are adversely affected by the European recession and the continuing uncertainty and policy paralysis.
IFC is providing useful technical assistance in developing a new Investment code and in simplifying the regulatory regime for private investors. Results are awaited.
World Bank Group Objective: Improving the efficiency of the financial sector.
Many of the key planned reforms to strengthen the banking system and promote the non-bank financial sector were not implemented, or only partially implemented:
Despite repeated efforts to reduce the portfolio of non-performing loans (NPLs) since the late 1990s, their share of total loans outstanding declined marginally during the period (from 19 percent in 2006 to 18 percent in 2011).
Provisioning targets were not met. Progress in product innovation and
quality service was generally low, even if the situation varied across banks.
The regulatory framework did not provide a level playing field across banks (some banks were allowed to carry out their activities without meeting risk-management standards and key regulatory requirements).
Competition in banking was distorted by the heavy and discretionary involvement of the state.
The banking sector failed to meet the twin development objectives of increasing domestic savings and channeling more credit to the private sector. The role of capital markets and non-bank financial institutions in mobilizing resources remained limited.
IBRD
Together with the International Monetary Fund (IMF), two Financial Sector Assessment Programs (FSAPs) were prepared in 2006 and 2012 reviewing progress in reforms and laying out the agenda for the future. Only a small part of the recommendations of the 2006 report had been implemented.
Financial sector reforms were supported by the Bank through a series of policy-based loans (ECAL4, ICL) and after 2011 (GO DPL, GOJ DPL).
Banking sector
By and large these operations focused on reducing the NPLs of the banking system, improving their provisioning, strengthening banking sector regulations, enhancing the capacity of the Central Bank of Tunisia (CBT) improving corporate governance in private banks, deepening the stock market, and strengthening other non-bank financial institutions’ capacity to mobilize resources.
The gains were modest. The volume of NPLs was marginally reduced; provisioning improved but well below targets; new prudential regulations were put in place but their implementation in state banks is not consistent.
It is still too early to tell what impact new directives on corporate governance will have on banks.
In the insurance sector, foreign investors were allowed to become majority owners and the autonomy of the insurance supervisor was strengthened.
Capital market: New laws were passed to strengthen the securities market and venture capital firms.
IFC
Unsatisfactory

APPENDIX A SUMMARY OF WORLD BANK GROUP PROGRAM OUTCOME RATINGS
4
ACHIEVEMENT OF RESULTS ASSOCIATED WITH WORLD BANK
GROUP OBJECTIVES (2005-2013)
WORLD BANK GROUP CONTRIBUTION TO RESULTS (2005-2013)
WORLD BANK GROUP RATING
(2005-2010)
IFC complemented these efforts by providing: Equity to selected private banks to enable them to
expand their lending to the private sector. Technical assistance to the banks to improve their
risk management and other business practices. Funding and advisory support to the microfinance
sector which enabled a substantial increase in its client base, which includes a large proportion of women and vulnerable populations.
World Bank Group Objective: Modernize infrastructure services (information and communications technology , transport, water, and sanitation)
to increase quality and efficiency.
Information and Communications Technology (ICT) sector :
Global licenses were awarded to three operators (fixed line and mobile telephony and internet). The government divested 25 percent of its shares in a state telecom company. Since 2011, enterprises with their own fiber optic installations were allowed to make these services available publicly; registering and hosting of websites was simplified; and internet access liberalized.
These reforms contributed to :
a boom in mobile telephony and internet services. Fixed and mobile penetration reached 118 percent in 2010, up from 32 percent in 2003, and higher than the target of 109 percent that year.
Private investment rose from 35.2 percent of ICT sector investment in 2003 to 72 percent in 2010.
Tariffs on international communications remain high, however, due to the high prices charged by Tunisie Telecom to access cables for international telecommunications.
In the transport sector:
Little progress was achieved
Ports: The monopoly of longshoremen was abolished, the port landlord model was adopted at Radès port, and its container terminal was concessioned to the state-owned STAM company. Some competition and private sector role was introduced in stevedoring services. The introduction of online, computerized
ICT sector :
The Bank supported ICT sector reforms through: ICT sector project GO DPL and the GOJ DPL.
The Bank’s support enabled the creation of important infrastructure, and helped strengthen institutions.
Creation of a national back-up center, a Computer Emergency Response Team (CERT), and two e-government portals.
Provision of training to regulatory authority on topics ranging from tariff regulation to new 3G technologies and cost accounting.
Assisting the Government of Tunisia in (i) granting eight licenses to three operators; (ii) Simplifying procedures for the registration and hosting of internet websites; (iii) Opening access to the landing stations of international communications cables to more operators in addition to Tunisie Telecom; (iv) Abolishing the obligation of Internet providers to route Internet Protocol (IP) traffic through ATI (the national internet agency). The last 3 measures were supported by the 2011 and 2012 DPLs.
But the reform agenda is incomplete and has not yet had an impact on tariffs
In the transport sector:
The only on-going Bank transport project during the CPE period was the TSI Adaptable Program Loan (2 phases), which focused on : Phase 1: Restructuring port services, promoting
private investments, and supporting new port facilities under a (BOT) scheme, giving the railways' financial autonomy, and promoting the use of lead gasoline and cleaner diesel to reduce pollution.
Phase 2: Improving the sector’s institutional framework and its infrastructure and financing investments to improve the rail carriage of phosphates, a key export.
While the APL program helped upgrade the quality of transport infrastructure and services, it failed in its other
Moderately
Unsatisfactory

APPENDIX A SUMMARY OF WORLD BANK GROUP PROGRAM OUTCOME RATINGS
5
ACHIEVEMENT OF RESULTS ASSOCIATED WITH WORLD BANK
GROUP OBJECTIVES (2005-2013)
WORLD BANK GROUP CONTRIBUTION TO RESULTS (2005-2013)
WORLD BANK GROUP RATING
(2005-2010)
import documentation improved logistics efficiency.
Railways : There was no progress in making railways more autonomous and there was no improvement in their productivity.
Urban transport : There was some effort at sub-contracting of services but these are being reversed. Subsidies to urban transport companies did not decline.
objective to reduce the sector’s financial burden on the state. Since the closing of its second phase in 2009, the World Bank Group has only been engaged in analytical and advisory activities (AAA).
World Bank Group Objective: Improved competitiveness of agriculture through further liberalization, improved extension and research, better use of irrigation and other inputs
There was very little progress in the liberalization of the sector.
The Cereal Office (Office des Céréales -OC) remains the sole importer of cereals except for barley. It controls all prices and margins from farm production to final sale.
Prices of non-cereal agricultural products are subject to some kind of informal and ad-hoc controls.
Strong protection of agricultural goods at the border (beef, lamb/mutton, and wheat).
Domestic price controls for agricultural goods (cereals, milk, sugar beets, and tobacco).
Subsidies on agricultural inputs (chemical fertilizers, pesticides, and water).
Productivity of major commodities remains low and for decades there have been no significant long term upward trends in cereals yields (which fluctuate sharply depending on timely and sufficient availability of rains).
Despite the importance of the sector, the Bank did not play a major role. One project, the Agriculture Support Services Project (ASSP) (FY01) that closed in FY08 was designed solely to address agriculture sector issues.
The ASSP did not do much to improve the quality of agricultural services (agricultural research, extension services, plant and seed protection and certification, and livestock and animal health) delivered by public and private institutions and producer organizations, although some positive results were achieved.
Quality standards and laboratory upgrades enhanced Tunisia’s capacity to meet international standards for export, control the quality of agriculture inputs, and improve animal health diagnostic capacity. But EU accreditation is not yet in place
Improvements in the coverage of livestock vaccinations and the animal identification system.
The project did not succeed in achieving one of its main objectives, namely developing viable organizational structures capable of representing the needs and interests of farmers.
The Bank undertook four pieces of analytical and advisory work during this review period. These included the Agricultural Policy Review (2006), two updates in 2009, and an Agriculture Finance Study in 2012. These reports made the case for further liberalization of the sector and investment in research and extension, coupled with food assistance targeted to the poor and vulnerable and a food reserve. They have had no impact on policy thus far.
Unsatisfactory
PILLAR 2 : EDUCATION
World Bank Group objective: Improving basic and secondary education

APPENDIX A SUMMARY OF WORLD BANK GROUP PROGRAM OUTCOME RATINGS
6
ACHIEVEMENT OF RESULTS ASSOCIATED WITH WORLD BANK
GROUP OBJECTIVES (2005-2013)
WORLD BANK GROUP CONTRIBUTION TO RESULTS (2005-2013)
WORLD BANK GROUP RATING
(2005-2010)
Improved enrollment in both basic and secondary education.
Improved completion rates in primary education, but high drop-out and repetition in second cycle of basic education especially for boys remain.
Completion rates in secondary education are below target and declined over the period due in part to change in baccalaureate.
Efforts in promoting inclusive education (Priority school, kindergarten, integration of disabled children), but no sound M&E to assess the impact of these programs on learning outcomes.
The pedagogic reform program (skill-based approach) encountered resistance from teachers and was never extended at the secondary level. The diversification of secondary-level curricula to develop more learning tracks with links to technical and vocational training in line with private sector needs had very limited applications.
Lack of progress in improving school management. Reluctance of teachers and inspectors to involve communities in the design of school management plans.
The Bank provided a rich analysis, but lending placed too much emphasis on infrastructure and pedagogic reforms at the expense of policy measures to improve the overall education governance framework. The lack of progress on the institutional dimension (including incentives framework, M&E) explain in part why most other measures didn’t lead to the expected outcome.
Field interviews noted a number of flaws in the design of a program to promote inclusive education and the introduction of the skill-based approach (APC).
The Priority school grant program was successful in involving the community in designing a school-based improvement plan, but was not sustained at project closure.
Lack of national assessment prevented the Bank from measuring the impact of supported reforms and fine-tuning policy decisions.
Moderately Unsatisfactory
World Bank Group objective: Improving tertiary education
Introduction of the LMD system (Bachelor-master-doctorate) in line with the Bologna Process. Efficiency improved with the introduction of the new degree structure.
Introduction of professional degrees jointly developed with the private sector, but the private sector quickly encountered difficulties working with universities, which lack incentives and overall flexibility to adequately manage the joint development of curricula.
Protracted delay in setting-up the evaluation agency called for by the 2008 law on higher education.
Tunisia universities continue to lag
The Bank assisted through the second higher education reform project (2006) and good quality AAA
The introduction of the LMD system was done rapidly, without providing for accompanying measures. The Bank is now providing support to groups of teachers to develop pedagogical skills in parallel with the introduction of new course and curriculae (e.g. entrepreneurship, soft skills).
GOJ DPL supported the implementation of the higher education agency which should be operational in early 2014.
Some progress to build capacity on performance-based budgeting in the Ministry of Higher Education in the preparation phase (not yet in budget execution).
Successful introduction of a new resources transfer mechanism (PAC) at the university level to help improve academic quality and institutional performance. Too early
Moderately Unsatisfactory

APPENDIX A SUMMARY OF WORLD BANK GROUP PROGRAM OUTCOME RATINGS
7
ACHIEVEMENT OF RESULTS ASSOCIATED WITH WORLD BANK
GROUP OBJECTIVES (2005-2013)
WORLD BANK GROUP CONTRIBUTION TO RESULTS (2005-2013)
WORLD BANK GROUP RATING
(2005-2010)
behind in the region in terms of the autonomy, participation, and accountability of universities.
to assess overall impact, but this led to various innovative proposals.
Lack of progress to promote more autonomy to universities. The Bank is relaunching the dialogue based on recent regional surveys on university governance.
PILLAR 3: PROMOTING SOCIAL AND ECONOMIC INCLUSION
World Bank Group objective: Improving the coverage, quality, and financial sustainability of social protection and pension systems
Poverty
Significant reductions in poverty from 2000-10 (by, on average, 7.1 percent per year).
Growth benefitted the poor relatively more, especially in the second half of the decade.
But there were sharp regional variations, with poverty significantly higher in rural areas compared to urban areas.
The poverty gap between rich and poor regions has persisted and widened for some of the poorest regions during the period.
Social Protection Program
An extensive social protection program was introduced, including untargeted subsidies, cash transfers to the poor, pensions, subsidized health care etc.
But it was biased towards the rich:
Some of the fastest growing subsidies (e.g., energy) benefit mostly the rich.
Unconditional cash transfers to the poor are 0.4 percent of GDP) and not allocated in a transparent way. 42% percent of the poorest households are not getting any transfers, while some of the richest are.
The pension schemes are too generous in terms of eligibility and contributions. They discourage work and are facing serious financial sustainability problems.
Poverty
The Bank’s contribution to poverty reduction was through :
Support to promoting faster economic growth led by the private sector in a competitive, market-friendly environment: minor impact on business environment and no improvement in domestic investment.
Rural development projects positive, but small, impact in the target area.
The Bank is providing technical assistance to the National Statistical Office (INS) to improve its institutional capacity to measure and analyze trends in poverty. This contributed to revised poverty estimates and a better understanding of regional disparities and the profile of the poor as well as improved capacity of the INS.
Social Protection Program
The Bank did not play much of a role in designing or implementing the social safety net or pension systems.
However, in recent months the Bank and the IMF are providing technical assistance to help design an effective cash compensation program for the poor to protect them from proposed energy price increases.
Moderately Unsatisfactory

APPENDIX A SUMMARY OF WORLD BANK GROUP PROGRAM OUTCOME RATINGS
8
ACHIEVEMENT OF RESULTS ASSOCIATED WITH WORLD BANK
GROUP OBJECTIVES (2005-2013)
WORLD BANK GROUP CONTRIBUTION TO RESULTS (2005-2013)
WORLD BANK GROUP RATING
(2005-2010)
World Bank Group objective: Job creation and strengthening active labor market programs to assist the unemployed.
Despite the high priority placed on job creation, unemployment continued to increase throughout the period. By 2011, unemployment had peaked at 19 percent, before declining to 16.7 percent in 2012.
To improve the effectiveness of government programs to assist the unemployed, many ALMP programs were consolidated and re-designed. In 2011, a new program to assist the educated unemployed and unskilled unemployed was initiated (AMAL).
However, implementation of ALMPs was patchy, and suffered from weaknesses in design and institutional capacity. The loose eligibility criteria, and resulting large number of program beneficiaries, turned the AMAL program de facto into an unconditional allowance program for unemployed graduates. The AMAL program for low-skilled workers was shelved because of insufficient institutional capacity in ANETI, the implementing agency.
No reforms were implemented to reduce rigidities in the labor market.
Creating jobs was among the highest priority objectives of the Bank ‘program, and a series of DPLs and sector and investment loans were made in support of this objective.
Prior to 2010, the Bank’s contribution was essentially programmatic analytical and advisory assistance (PAAA), technical assistance, and capacity building.
In FY11, the Bank approved an employment DPL. Post revolution, ALM reforms were pursued through
the 2011 GO and 2012 GOJ DPLs.
The Bank has invested heavily through technical assistance to increase institutional capacity of the MVTE to deliver ALMP. Thus far, Bank-supported interventions have had a marginal impact on the ground, at best. The AMAL program (supported by GO DPL) was unsuccessful (see results section).The bulk of the unemployed, who are unskilled, were left out of these schemes. The pilot of the two (formerly five) new streamlined ALMPs designed to support training and first-time employment has yet to begin. Institutional capacities at all levels lagged.
The Bank is supporting a regional employment program through a JSDF grant that finances labour-intensive public works for rural youth to provide income to low-skilled and long-term unemployed citizens. It is too early to assess the impact of the program, which started in late 2012.
The Bank’s program has not yet addressed other important issues that prevent firms from hiring, such as the rigidities in the Labor Code and the high level of taxes and contributions associated with hiring labor.
Unsatisfactory
World Bank Group objective: Promote reforms in the health sector to increase its coverage, improve the quality of care, and ensure financial sustainability of health care financing.
Tunisia continued to make good progress in terms of health outcomes over 2004-10.
However, there continues to be wide regional disparities in health outcomes, reflecting continuing inequities in health care facilities between rural and urban areas, and between the rich and the poor. There is no evidence that the quality of health services, especially those provided by the public sector has improved.
The World Bank Group played a very limited role. Its contribution mainly took the form of:
Analytical work on health sector issues and technical assistance to strengthen institutional capacities and hospital accreditation.
The Bank did not fund a project in the sector, but health sector reforms were included in the 2011 GO and 2012 GOJ DPL.
IFC contributed equity to a private company for building and running high quality health clinics, including some in under-served areas.(too early to assess impact on the ground)
Moderately Unsatisfactory

APPENDIX A SUMMARY OF WORLD BANK GROUP PROGRAM OUTCOME RATINGS
9
ACHIEVEMENT OF RESULTS ASSOCIATED WITH WORLD BANK
GROUP OBJECTIVES (2005-2013)
WORLD BANK GROUP CONTRIBUTION TO RESULTS (2005-2013)
WORLD BANK GROUP RATING
(2005-2010)
No progress was made in improving health care financing during the period, either to make the system financially more viable or to make it more accessible. The private sector continues to shoulder a large share (45 percent in 2011) of this spending. Poorer households still spend a significantly higher proportion of their income on health care compared to wealthier households.
The Bank’s AAA was of good quality and laid out the agenda for reforms in the sector, but recommendations were largely ignored.
To improve health care quality, a decree was passed in May 2011 that created an institutional framework for empowering citizens and civil society to participate in monitoring the implementation of social programs, including health care services.
To promote the accreditation of hospitals, an auditing, evaluation, and certification system of quality in the health sector using standards set by international accreditation bodies was instituted in 2012. An autonomous national authority for managing the evaluation and accreditation of health services delivery was established but is not yet operational.
To expand free access to care in underserved governorates, a national outreach services policy was introduced in 2011 through services provided outside of traditional fixed facilities and in local community areas. Additional personnel were recruited for outreach services. However, institutional constraints and a lack in leadership have hindered the expansion of services and access to health care in underserved areas
World Bank Group objective: Improving access to basic infrastructure services (water, sanitation, telephones, rural roads) in rural and remote parts of the country and
improving quality of services as a means to reduce regional disparities in living standards.
In the water and sanitation sector :
Access to safe water and sanitation services expanded for the population in rural and urban areas though sanitation services in rural areas still lag considerably behind urban areas. Tunisia is on track to meet the MDG targets for access to improved drinking water.
Good progress in the treatment of waste-water. During 2005-2012, the percentage of wastewater treated in the areas served by the national utility, ONAS, was consistently above 90 percent which places Tunisia at the top of the countries in the region. The quality of treated water is also substantially better than before.
A tariff freeze during the last years of the Ben Ali regime which put ONEDE and ONAS in a difficult financial situation. A tariff adjustment plan is being implemented since end 2010.
Little progress in effecting institutional
In the water and sanitation sector :
The Bank also played a leading role in articulating and supporting sectoral reform issues. Six water projects financed by the Bank were active during the review period and covered a wide range of activities (four are still underway). A significant part of the portfolio supported extending
the coverage and quality of the urban water supply and sanitation.
A smaller part focused on rural water and sanitation.
As a result of these projects :
Water and sanitation infrastructure was usefully augmented, which helped to expand the reach of these services in rural and urban areas.
Some institutional measures were also implemented to improve water management, and the capacity of state agencies was enhanced through training.
However, for most of the review period, there were sharp differences in views between the government and the Bank on reform priorities, including the role of the private sector, and the pace of tariff adjustments. These differences slowed down the implementation of water projects, diminishing the relevance of the interventions.

APPENDIX A SUMMARY OF WORLD BANK GROUP PROGRAM OUTCOME RATINGS
10
ACHIEVEMENT OF RESULTS ASSOCIATED WITH WORLD BANK
GROUP OBJECTIVES (2005-2013)
WORLD BANK GROUP CONTRIBUTION TO RESULTS (2005-2013)
WORLD BANK GROUP RATING
(2005-2010)
reforms to increase private sector participation. The private sector’s role is currently limited to five-year management contracts for maintenance of about 20-25 percent of ONAS’ facilities
Rural Roads: Very little investments went into rural roads to improve connectivity of the under-served regions.
ICT: Significant improvement in access to telephone (mobile) and Internet in the rural areas over the last five to 10 years, but prices remain high
Regional Projects
Improving access to basic infrastructure (including roads and water) was addressed in Bank loans dedicated to improving living conditions in underserved areas: the Northwest Area Mountainous and Forestry Development projects and the Natural Resource Management projects.
Access to water and rural roads was improved under the regional projects that closed during this period. The on-going projects are still at early stages of implementation and there are no results on the ground as of 2012.
In the ICT sector, rapid growth of mobile and Internet services throughout the country, including in rural areas, but this has not led to a reduction in prices due to the high prices charge by Tunisia Telecom to access cables for international communication.
World Bank Group objective: Improving management of scarce natural resources (water, land) to prevent over-exploitation and to ensure sustainable improvement of living standards for future generations.
There is no evidence that the process of over-exploitation of water and land resources and the attendant degradation has been reversed.
About 50percent of Tunisia’s arable lands are eroded, up from 47 percent in the early 2000s, and conditions in some regions are much worse.
Water resources, particularly in the center and south , are at risk from salinity
No progress has been made over the last four years to raise tariffs (extremely low). Since the revolution, the situation has worsened by the current disarray of most irrigation users.
Major inefficiency in water uses by farmers.
The Bank contributed to efforts to improve the management of natural resources mainly through :
Projects in the water sector CDD projects for rural development (including in
remote mountainous areas) that dealt, in part, with land conservation and water management.
AAA: ESW in water and agriculture to identify constraints and policy priorities and technical assistance to build institutional capacity for managing scarce resources, and addressing environmental factors such as climate change.
These interventions had a positive impact locally:
Forest and vegetation cover was increased. Soil and water conservation works were
implemented to reduce soil erosion. Strengthened local institutional capacity to undertake
soil and water conservation works.
However, it is still too early to tell if these changes have actually reduced soil erosion or dam siltation or improved other ecological parameters.
Irrigation: Despite technical assistance, water tariffs remain low and infrastructure is provided free of charge to farmers. No evidence that irrigation efficiency has improved, or wasteful use of water has declined.
PILLAR 4 : IMPROVING GOVERNANCE – PUBLIC FINANCIAL MANAGEMENT AND VOICE/TRANSPARENCY/ACCOUNTABILITY
World Bank Group objective: Support the implementation of performance based budgeting to improve the quality of services through enhanced efficiency of public expenditures
Institutional framework set-up in pilot ministries and Ministry of Finance to monitor the reform since
Before the revolution
Extensive and high-quality technical assistance helped to:
Moderately Unsatisfactory

APPENDIX A SUMMARY OF WORLD BANK GROUP PROGRAM OUTCOME RATINGS
11
ACHIEVEMENT OF RESULTS ASSOCIATED WITH WORLD BANK
GROUP OBJECTIVES (2005-2013)
WORLD BANK GROUP CONTRIBUTION TO RESULTS (2005-2013)
WORLD BANK GROUP RATING
(2005-2010)
2009
First four pilot ministries presented their budget with the classical and programmatic classification to Parliament in 2010 and since then have prepared annual performance project (PAP) and report (RAP). Yet, has so far remained a theoretical exercise and led to some fatigue in pilot ministries as no organizational changes were introduced to allow more flexibility in exchange for greater levels of managerial accountability.
Since 2012, the Government of Tunisia took some decisions to work on exception-based changes of the legal framework and management procedures to allow for actual experimentation with PBB.
Less than expected progress in :
New organic budget law (now prepared) but not yet adopted to allow full implementation of the PBB reform.
Implementation of large-scale sensitization and training actions to middle staff beyond those concerned in pilot ministries.
Adapting the existing computerized information and management system to PBB.
Reforms of internal controls and audit have lagged although this is critical to increase managers’ flexibility and accountability (some immediate measures are to be implemented in 2013).
Deconcentration process to extend the PBB approach to semi-autonomous agencies and regional branch offices.
Provide guidance to the Ministry of Finance and pilot ministries to develop a master plan for PBB reform on central and sector MTEF, program structure, performance, and management dialogue.
Enhance capacity building of dedicated staff that benefited from the technical assistance (though the Government of Tunisia didn’t follow-up by a substantive overall training program to foster the understanding and adhesion to the reform of a larger number of civil servants).
What the Bank was unable to do prior to the revolution (no specific assistance beyond PBB)
Strengthen transparency and accountability of current budget procedures (both in the preparation phase and in the implementation and reporting phases).
Conduct public expenditure reviews to assess the efficiency of public spending, notably in the social sectors.
Since 2011
The DPL helped to:
Start improving budget transparency and accountability (publication of the budget prior to its submission to parliament, open budget initiative, and citizen budget, publication of the Audit Court reports, some immediate measure to simplify ex-ante controls).
The Bank no longer provides technical assistance for the PBB reform – support now provided by the EU and the French Cooperation.
World Bank Group objective: Strengthen and modernize the public procurement framework, systems, and processes to increase transparency and accountability of institutions
Before the revolution Procurement system remained overly bureaucratic, lengthy, and lacking
AAA (procurement review and technical assistance) undertaken in 2004 planted the seeds of the reform
Moderately

APPENDIX A SUMMARY OF WORLD BANK GROUP PROGRAM OUTCOME RATINGS
12
ACHIEVEMENT OF RESULTS ASSOCIATED WITH WORLD BANK
GROUP OBJECTIVES (2005-2013)
WORLD BANK GROUP CONTRIBUTION TO RESULTS (2005-2013)
WORLD BANK GROUP RATING
(2005-2010)
transparency (evidenced by the slow implementation of the stimulus package in 2009 and 2011). The system failed to prevent political interference and a high level of corruption.
Since 2011 The government adopted a set of immediate, temporary measures that helped cut by half the average time needed to award a contract. Mandatory online publication has improved transparency. The government has conducted a self-assessment of its procurement system (based on OECD/DAC methodology) and adopted an action plan to reform its system over the medium term (under implementation).
undertaken after the revolution.
The 2011 government DPL supported temporary emergency measures to help adopt emergency measures aimed at cutting down the time for procurement decisions and improving transparency.
On-going technical assistance is now providing support to implement the action plan, in particular, to revise the procurement code (GOJ 2 prior action).
Unsatisfactory
World Bank Group objective: Increase voice, transparency, and accountability
Post revolution agenda — Too early to report on overall achievement (preliminary results that followed the implementation of some measures are reported in Chapter 6)
Post revolution agenda supported by the GO and GOJ DPL, as well as targeted technical assistance done by the
World Bank and IFC
OVERALL WORLD BANK GROUP PROGRAM OUTCOME RATING OVER 2005-10:
Unsatisfactory: The assistance program did not make acceptable progress toward most of its major relevant objectives.

13
Appendix B. Guide to the Independent Evaluation Group’s Country Program Evaluation Methodology
1. This methodological note describes the key elements of the Independent
Evaluation Group’s (IEG) Country Program Evaluation (CPE) methodology1
2. CPEs rate the outcomes of World Bank Group assistance programs, not the
country’s overall development progress.
3. A Bank Group assistance program needs to be assessed on how well it met
its particular objectives, which are typically a subset of the country’s development
objectives. If a Bank Group assistance program is large in relation to the country’s
total development effort, the program outcome will be similar to the country’s
overall development progress. However, most Bank Group assistance programs
provide only a fraction of the total resources devoted to a country’s development
by development partners, stakeholders, and the government itself. In CPEs, IEG
rates only the outcome of the Bank Group’s program, not the country’s overall
development outcome, although the latter is clearly relevant for judging the
program’s outcome.
4. The experience gained in CPEs confirms that Bank Group program outcomes
sometimes diverge significantly from the country’s overall development progress.
CPEs have identified Bank Group assistance programs which had:
Satisfactory outcomes matched by good country development;
Unsatisfactory outcomes in countries that achieved good overall
development results, notwithstanding a weak Bank Group program; and,
Satisfactory outcomes in countries that did not achieve satisfactory overall
results during the period of program implementation.
Assessments of assistance program outcome and Bank Group performance are not
the same
5. By the same token, an unsatisfactory Bank Group assistance program
outcome does not always mean that Bank Group performance was also
unsatisfactory, and vice-versa. This becomes clearer once we consider that the Bank
Group’s contribution to the outcome of its assistance program is only part of the
story. The assistance program’s outcome is determined by the joint impact of four
agents: (a) the country; (b) the Bank Group; (c) partners and other stakeholders; and

APPENDIX B GUIDE TO IEG COUNTRY PROGRAM EVALUATION METHODOLOGY
14
(d) exogenous forces (e.g., events of nature, international economic shocks, etc.).
Under the right circumstances, a negative contribution from any one agent might
overwhelm the positive contributions from the other three, and lead to an
unsatisfactory outcome.
6. IEG measures Bank Group performance primarily on the basis of
contributory actions the Bank Group directly controlled. Judgments regarding Bank
Group performance typically consider the relevance and implementation of the
strategy; the design and supervision of the Bank Group’s lending and financial
support interventions; the scope, quality, and follow-up of diagnostic work and
other analytic and advisory activities (AAA); the consistency of the Bank Group’s
lending and financial support with its non-lending work and with its safeguard
policies; and the Bank Group’s partnership activities.
Rating Assistance Program Outcome
7. In rating the outcome (expected development impact) of an assistance
program, IEG gauges the extent to which major strategic objectives were relevant
and achieved, without any shortcomings. In other words, did the Bank Group do
the right thing, and did it do it right. Programs typically express their goals in terms
of higher-order objectives, such as poverty reduction. The country assistance
strategy (CAS) may also establish intermediate goals, such as improved targeting of
social services or promotion of integrated rural development, and specify how they
are expected to contribute toward achieving the higher-order objective. IEG’s task is
then to validate whether the intermediate objectives were the right ones and
whether they produced satisfactory net benefits, and whether the results chain
specified in the CAS was valid. Where causal linkages were not fully specified in
the CAS, it is the evaluator’s task to reconstruct this causal chain from the available
evidence, and assess relevance, efficacy, and outcome with reference to the
intermediate and higher-order objectives.
8. For each of the main objectives, the CPE evaluates the relevance of the
objective, the relevance of the Bank Group’s strategy toward meeting the objective,
including the balance between lending and non-lending instruments, the efficacy
with which the strategy was implemented, and the results achieved. This is done in
two steps. The first is a top-down review of whether the Bank Group’s program
achieved a particular Bank Group objective or planned outcome and had a
substantive impact on the country’s development. The second step is a bottom-up
review of the Bank Group’s products and services (lending, analytical and advisory
services, and aid coordination) used to achieve the objective. Together these two

APPENDIX B GUIDE TO IEG COUNTRY PROGRAM EVALUATION METHODOLOGY
15
steps test the consistency of findings from the products and services and the
development impact dimensions. Subsequently, an assessment is made of the
relative contribution to the results achieved by the Bank Group, other development
partners, the government, and exogenous factors.
9. Evaluators also assess the degree of country ownership of international
development priorities, such as the Millennium Development Goals, and Bank
Group corporate advocacy priorities, such as safeguards. Ideally, any differences on
dealing with these issues would be identified and resolved by the CAS, enabling
the evaluator to focus on whether the trade-offs adopted were appropriate.
However, in other instances, the strategy may be found to have glossed over certain
conflicts, or avoided addressing key country development constraints. In either
case, the consequences could include a diminution of program relevance, a loss of
country ownership, and/or unwelcome side-effects, such as safeguard violations,
all of which must be taken into account in judging program outcome.
Ratings Scale
10. IEG utilizes six rating categories for outcomes, ranging from highly
satisfactory to highly unsatisfactory:
Highly Satisfactory: The assistance program achieved at least acceptable progress toward all major relevant objectives, and had best practice development impact on one or more of them. No major shortcomings were identified.
Satisfactory: The assistance program achieved acceptable progress toward all major relevant objectives. No best practice achievements or major shortcomings were identified.
Moderately Satisfactory: The assistance program achieved acceptable progress toward most of its major relevant objectives. No major shortcomings were identified.
Moderately Unsatisfactory: The assistance program did not make acceptable progress toward most of its major relevant objectives, or made acceptable progress on all of them, but either (a) did not take into adequate account a key development constraint or (b) produced a major shortcoming, such as a safeguard violation.
Unsatisfactory: The assistance program did not make acceptable progress toward most of its major relevant objectives, and either (a) did not take into adequate account a key development constraint or (b) produced a major shortcoming, such as a safeguard violation.
Highly Unsatisfactory: The assistance program did not make acceptable progress toward any of its major relevant objectives and did not take into adequate account a key development constraint, while also producing at least one major shortcoming, such as a safeguard violation.
11. The institutional development impact (IDI) can be rated at the project level
as: high, substantial, modest, or negligible. IDI measures the extent to which the

APPENDIX B GUIDE TO IEG COUNTRY PROGRAM EVALUATION METHODOLOGY
16
program bolstered the country’s ability to make more efficient, equitable, and
sustainable use of its human, financial, and natural resources. Examples of areas
included in judging the institutional development impact of the program are:
the soundness of economic management;
the structure of the public sector, and, in particular, the civil service;
the institutional soundness of the financial sector;
the soundness of legal, regulatory, and judicial systems;
the extent of monitoring and evaluation systems;
the effectiveness of aid coordination;
the degree of financial accountability;
the extent of building capacity in nongovernmental organizations; and,
the level of social and environmental capital.
12. IEG is, however, increasingly factoring IDI impact ratings into program
outcome ratings, rather than rating them separately.
13. Sustainability can be rated at the project level as highly likely, likely, unlikely,
highly unlikely, or, if available information is insufficient, non-evaluable.
Sustainability measures the resilience to risk of the development benefits of the
country program over time, taking into account eight factors:
technical resilience;
financial resilience (including policies on cost recovery);
economic resilience;
social support (including conditions subject to safeguard policies);
environmental resilience;
ownership by governments and other key stakeholders;
institutional support (including a supportive legal/regulatory framework,
and organizational and management effectiveness); and, resilience to
exogenous effects, such as international economic shocks or changes in the
political and security environments.
14. At the program level, IEG is increasingly factoring sustainability into
program outcome ratings, rather than rating them separately.
15. Risk to Development Outcome. According to the 2006 harmonized
guidelines, sustainability has been replaced with a “risk to development outcome,”
defined as the risk, at the time of evaluation, that development outcomes (or
expected outcomes) of a project or program will not be maintained (or realized).

APPENDIX B GUIDE TO IEG COUNTRY PROGRAM EVALUATION METHODOLOGY
17
The risk to development outcome can be rated at the project level as high, significant,
moderate, negligible to low, or non-evaluable.
Box B.1 Understanding the ratings of World Bank Group program over 2005-10.
What does the standard IEG CPE methodology rate?
The rating of the outcome of the Bank assistance program in Tunisia gauges the extent to which major strategic objectives were relevant and achieved.
IEG considered the relevance and implementation of the strategy; the design and supervision of the World Bank Group’s lending and financial support; the scope, quality, and follow-up of diagnostic work and other analytic and advisory activities; the consistency of World Bank Group lending and financial support with its AAA work; and the World Bank Group’s partnership activities.
For each of the main objectives (set-out from strategic documents), the CPE evaluates the relevance of the objective, the relevance of the Bank Group’s strategy toward meeting the objective, including the balance between lending and non-lending instruments, the efficacy with which the strategy was implemented and the results achieved. In short, the report reviews whether the Bank Group did the right thing and did it right.
This evidence-based analysis and the relative contribution to the results achieved by the World Bank Group is provided for each pillar in chapters 3 to 6. The analysis draws on (i) desk review based in particular on CASPR, CASCR, ICR, ICRR, ISR and Aide memoire and (ii) field interviews.
What does the standard IEG CPE methodology not rate?
The evaluation rates neither the client’s overall development progress based on its strategic plans nor does it rate World Bank Group performance per se. CPEs rate the outcome of World Bank Group assistance programs which depend on the joint impact of the Bank Group with the country, partners, and other stakeholders, and exogenous factors.
Can the standard IEG CPE methodology account for World Bank Group programs that are modest in terms of size (as in many middle-income countries)?
Most World Bank Group programs provide only a fraction of the total resources devoted to a client’s overall development by development partners, stakeholders, and the government itself.
Bank objectives need to be commensurate to the size of the program. This should be well taken into account at the time the country team define targeted objectives in the CAS/CPS.
How does the standard IEG CPE methodology account for a difficult external authorizing environment?
IEG takes into account the difficult environment in as much as the country team was keen to analyze it and take it into account in setting or revising its objectives and targeted outcome. Indeed, it is good practice for Bank Group programs to conduct political economy analysis in particular in difficult environments with instability and political resistance to reforms. This analysis on top of macro and sector analytical work would help the country team to set initially and/or review in the course of the strategy, relevant and credible objectives that take into account the difficult environment. If the country team fails to do so and honestly reports on the difficulties encountered, IEG will take into account the failure to do so in its overall rating.
How does the standard IEG CPE methodology differ from the “sum of the parts” approach?
There are no inconsistencies in finding discrepancies between CPE assessment and the average ratings of former IEG project or strategy reviews. Indeed, the CPE methodology doesn’t derive the overall rating of the Bank Group outcome program as the sum of individual ratings of the Bank

APPENDIX B GUIDE TO IEG COUNTRY PROGRAM EVALUATION METHODOLOGY
18
and the quality of the overall analytical program. First, the methodology gauges the relevance of the projects to realize the objectives set-out at the strategic level. Hence, good projects ratings alone are not enough. Second, ratings based on CASCR reviews and ICRRs are desk reviews conducted at project closure or at the end of strategy periods. By contrast, the CPE assessment is based on the achievement of outcomes based on new evidence (updated quantitative data and qualitative information) gathered during field missions several years after project or strategy closure. Hence, the CPE ratings can better capture the “sustainability” dimension of World Bank Group interventions.

19
Appendix C. Statistical Supplement on Bank Activities
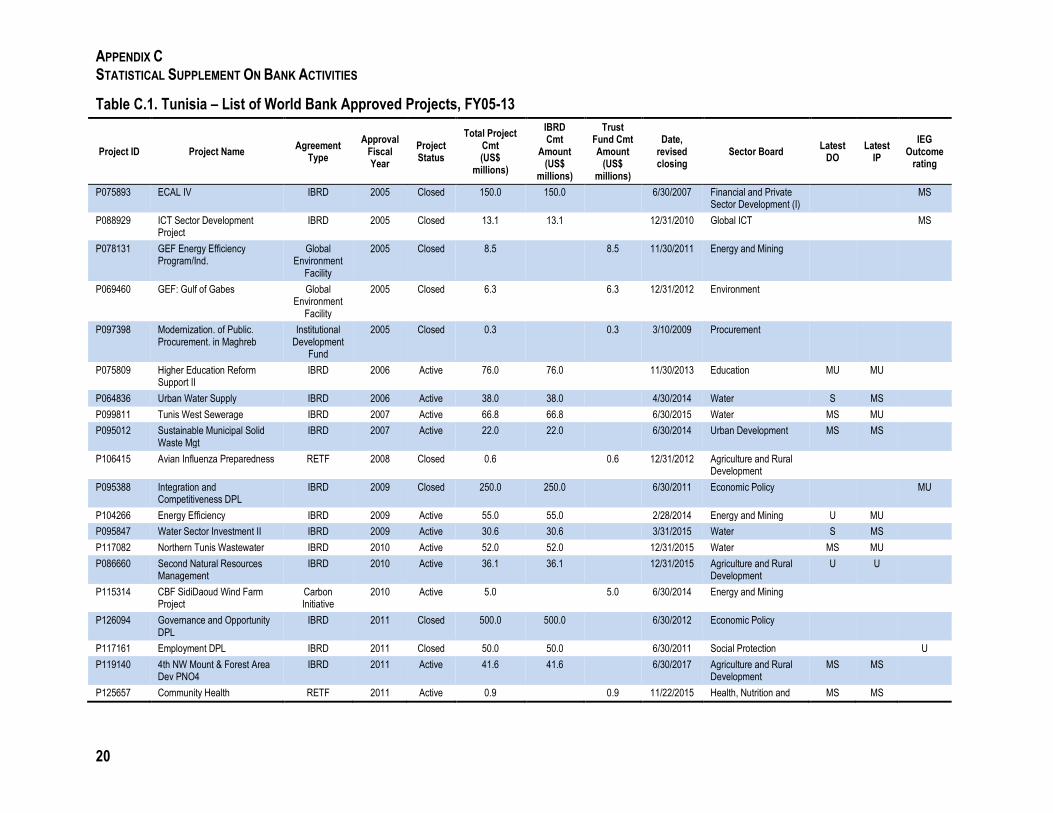
APPENDIX TABLE C.1. TUNISIA – LIST OF WORLD BANK APPROVED PROJECTS, FY05-13
APPENDIX TABLE C.2. TUNISIA – LIST OF WORLD BANK APPROVED PROJECTS PRIOR TO FY05- CLOSED DURING FY05-13
APPENDIX TABLE C.3. TUNISIA- NUMBER AND TOTAL COMMITMENT AMOUNT (US$M) OF IBRD/GRANT COMMITMENTS, FY05-13
APPENDIX TABLE C.4. PROJECT RATINGS FOR TUNISIA AND COMPARATORS, EXIT FY05-FY13
APPENDIX TABLE C.5. PROJECT RATINGS BY IEG FOR TUNISIA, EXIT FY05-FY13
APPENDIX TABLE C.6. BANK BUDGET BY COST STRUCTURE CATEGORY, FY05-13 (IN US$ THOUSANDS AND PERCENT)
APPENDIX TABLE C.7. TOTAL NET DISBURSEMENTS OF OFFICIAL DEVELOPMENT ASSISTANCE AND OFFICIAL AID, 2002-2011 (US$M)
APPENDIX TABLE C.8. TUNISIA – LIST OF WORLD BANK AAA, FY05-13
APPENDIX C STATISTICAL SUPPLEMENT ON BANK ACTIVITIES
20
Table C.1. Tunisia – List of World Bank Approved Projects, FY05-13
Project ID Project Name Agreement
Type
Approval Fiscal Year
Project Status
Total Project Cmt (US$
millions)
IBRD Cmt
Amount (US$
millions)
Trust Fund Cmt Amount
(US$ millions)
Date, revised closing
Sector Board Latest
DO Latest
IP
IEG Outcome
rating
P075893 ECAL IV IBRD 2005 Closed 150.0 150.0 6/30/2007 Financial and Private Sector Development (I)
MS
P088929 ICT Sector Development Project
IBRD 2005 Closed 13.1 13.1 12/31/2010 Global ICT MS
P078131 GEF Energy Efficiency Program/Ind.
Global Environment
Facility
2005 Closed 8.5 8.5 11/30/2011 Energy and Mining
P069460 GEF: Gulf of Gabes Global Environment
Facility
2005 Closed 6.3 6.3 12/31/2012 Environment
P097398 Modernization. of Public. Procurement. in Maghreb
Institutional Development
Fund
2005 Closed 0.3 0.3 3/10/2009 Procurement
P075809 Higher Education Reform Support II
IBRD 2006 Active 76.0 76.0 11/30/2013 Education MU MU
P064836 Urban Water Supply IBRD 2006 Active 38.0 38.0 4/30/2014 Water S MS
P099811 Tunis West Sewerage IBRD 2007 Active 66.8 66.8 6/30/2015 Water MS MU
P095012 Sustainable Municipal Solid Waste Mgt
IBRD 2007 Active 22.0 22.0 6/30/2014 Urban Development MS MS
P106415 Avian Influenza Preparedness RETF 2008 Closed 0.6 0.6 12/31/2012 Agriculture and Rural Development
P095388 Integration and Competitiveness DPL
IBRD 2009 Closed 250.0 250.0 6/30/2011 Economic Policy MU
P104266 Energy Efficiency IBRD 2009 Active 55.0 55.0 2/28/2014 Energy and Mining U MU
P095847 Water Sector Investment II IBRD 2009 Active 30.6 30.6 3/31/2015 Water S MS
P117082 Northern Tunis Wastewater IBRD 2010 Active 52.0 52.0 12/31/2015 Water MS MU
P086660 Second Natural Resources Management
IBRD 2010 Active 36.1 36.1 12/31/2015 Agriculture and Rural Development
U U
P115314 CBF SidiDaoud Wind Farm Project
Carbon Initiative
2010 Active 5.0 5.0 6/30/2014 Energy and Mining
P126094 Governance and Opportunity DPL
IBRD 2011 Closed 500.0 500.0 6/30/2012 Economic Policy
P117161 Employment DPL IBRD 2011 Closed 50.0 50.0 6/30/2011 Social Protection U
P119140 4th NW Mount & Forest Area Dev PNO4
IBRD 2011 Active 41.6 41.6 6/30/2017 Agriculture and Rural Development
MS MS
P125657 Community Health RETF 2011 Active 0.9 0.9 11/22/2015 Health, Nutrition and MS MS

APPENDIX C STATISTICAL SUPPLEMENT ON BANK ACTIVITIES
21
Project ID Project Name Agreement
Type
Approval Fiscal Year
Project Status
Total Project Cmt (US$
millions)
IBRD Cmt
Amount (US$
millions)
Trust Fund Cmt Amount
(US$ millions)
Date, revised closing
Sector Board Latest
DO Latest
IP
IEG Outcome
rating
Collaborative JSDF Population
P124341 MSME Financing Faciltiy IBRD 2012 Active 50.0 50.0 1/31/2017 Financial and Private Sector Development (I)
S S
P127212 Participatory Service Delivery Reint
RETF 2012 Active 5.0 5.0 3/31/2014 Social Protection S S
P128427 Community Works/ Local Participation
RETF 2012 Active 3.0 3.0 6/18/2016 Social Protection MS MS
P120233 JSDF Emergency Support for Youth
RETF 2012 Active 2.8 2.8 2/28/2014 Social Development MU MS
P128843 Modernization of Tunisia Public Proc
Institutional Development
Fund
2012 Active 0.3 0.3 4/20/2015 Procurement MS MU
P128251 Governance Opportunities & Jobs DPL
IBRD 2013 Closed 500.0 500.0 12/31/2013 Economic Policy
P100478 GEF Managing Healthcare Waste and PCB
Global Environment
Facility
2013 Active 5.5 5.5 5/31/2017 Environment MS MS
P120561 Ecotourism and B. Conservation
Global Environment
Facility
2013 Active 4.3 4.3 7/31/2018 Environment S S
Total 1973.7
Source: World Bank BW database as of August 2013. Note: MS= Moderately satisfactory; MU= Moderately unsatisfactory; S= Satisfactory; U= Unsatisfactory

APPENDIX C STATISTICAL SUPPLEMENT ON BANK ACTIVITIES
22
Table C.2. Tunisia- Number and Total Commitment Amount (US$M) of IBRD/Grant Commitments, FY05-13
FY05 FY06 FY07 FY08 FY09 FY10 FY11 FY12 FY13 TOTAL
Sector Board No. Amt No. Amt No. Amt No. Amt No. Amt No. Amt No. Amt No. Amt No. Amt No. Amt
Agriculture and Rural Development 1 0.6 1 36.1 1 41.6 3 78.3
Economic Policy 1 250.0 1 500.0 1 500.0 3 1,250.0
Education 1 76.0 1 76.0
Energy and Mining 1 8.5 1 55.0 1 5.0 3 68.5
Environment 1 6.3 1 9.7 2 9.8 4 25.8
Financial and Private Sector Development 1 150.0 1 6.0 1 50.0 3 206.0
Global ICT 1 13.1 1 13.1
Health, Nutrition and Population 1 0.9 1 0.9
Procurement 1 0.3 1 0.3 2 0.6
Social Development 1 2.8 1 2.8
Social Protection 1 50.0 2 8.0 3 58.0
Urban Development 1 22.0 1 22.0
Water 1 38.0 1 66.8 1 30.6 2 60.0 5 195.5
TOTAL 5 178.3 2 114.0 2 88.8 2 6.6 3 335.6 5 110.9 4 592.5 5 61.0 3 509.8 31 1,997.4
Source: World Bank BW database as of August 2013 (includes supplements).
Table C.3. Project Ratings for Tunisia and Comparators, Exit FY05-FY13
Total Evaluated Outcome (% moderately
satisfactory or better) Risks to Development Outcomes
(% moderate or lower) Institutional Development
Impact (% substantial or higher) Sustainability (% likely or highly
likely)
$M No $M % $M % $M % $M %
Iran, Islamic R 1,235.0 8 325.0 25 632.0 50 - - - -
Jordan 636.7 11 252.0 45 164.7 27 - - 67.0 18
Lebanon 349.5 7 172.9 57 80.0 14 19.9 14 50.9 29
Malaysia 244.0 1 244.0 100 - - 244.0 100 244.0 100
Peru 1,140.9 20 950.7 75 858.6 70 185.0 10 194.6 15
Thailand 184.4 3 184.4 100 - - 184.4 100 184.4 100
Tunisia 1,197.1 16 859.5 81 669.1 44 85.0 13 225.0 25
Turkey 6,926.2 21 6,140.2 86 4,677.1 67 250.0 5 263.1 10
MNA Region 10,170.4 155 6,943.0 66 4,425.8 32 547.0 8 1,076.7 17
Total 11,913.8 87.0 9,128.7 70 7,081.5 49 968.3 11 1,229.0 20
Source: World Bank BW database as of August 2013.

APPENDIX C STATISTICAL SUPPLEMENT ON BANK ACTIVITIES
23
Table C.4. Project Ratings by IEG for Tunisia, Exit FY05-FY13
# Exit FY Proj ID Project Name Commitment Amount ($M)
Approval FY
IEG Outcome
IEG Risk to development
objective rating
IEG Sustainability a
IEG Institutional
Development Impact
1 2005 P055814 Export Development 35.0 1999 Satisfactory #b Highly Likely High
2 2005 P005741 Higher Education Reform Support I 80.0 1998 Satisfactory # Likely Modest
3 2006 P043700 Transport Sector Investment Project 50.0 1998 Moderately
Satisfactory # Likely Substantial
4 2006 P005731 Greater Tunis Sewerage 60.0 1997 Satisfactory # Likely Modest
5 2007 P075893 ECAL IV 150.0 2005 Moderately
Satisfactory Negligible To
Low # #
6 2007 P050945 Education PAQSET I 99.0 2000 Moderately
Satisfactory Moderate # #
7 2008 P035707 Water Sector Investment 103.0 2000 Moderately
Satisfactory Significant # #
8 2009 P048315 Protected Areas Management Project 5.3 2002 Moderately
Satisfactory Moderate # #
9 2009 P005750 Agricultural Support Services 21.3 2001 Moderately
Satisfactory Moderate # #
10 2010 P074398 Municipal Development III 78.4 2003 Moderately
Satisfactory Significant # #
11 2010 P072317 NW Mountainous And For. Areas Dev. 34.0 2003 Moderately
Satisfactory Significant # #
12 2010 P064082 Transport Sector Project II 37.6 2001 Moderately
Unsatisfactory Significant # #
13 2011 P117161 Employment DPL 50.0 2011 Unsatisfactory Significant # #
14 2011 P095388 Integration And Competitiveness DPL 250.0 2009 Moderately
Unsatisfactory Moderate # #
15 2011 P088929 ICT Sector Development Project 13.1 2005 Moderately
Satisfactory Negligible To
Low # #
16 2011 P082999 Education PAQSET II 130.3 2004 Moderately
Satisfactory Moderate # #
Result 1197.1
Source: World Bank BW database as of August 2013. a. Sustainability and institutional development impact were rated until FY06; risk to development objective is rated for projects from FY07 onward. b. # stands for no rating.
APPENDIX C STATISTICAL SUPPLEMENT ON BANK ACTIVITIES
24

APPENDIX C STATISTICAL SUPPLEMENT ON BANK ACTIVITIES
25
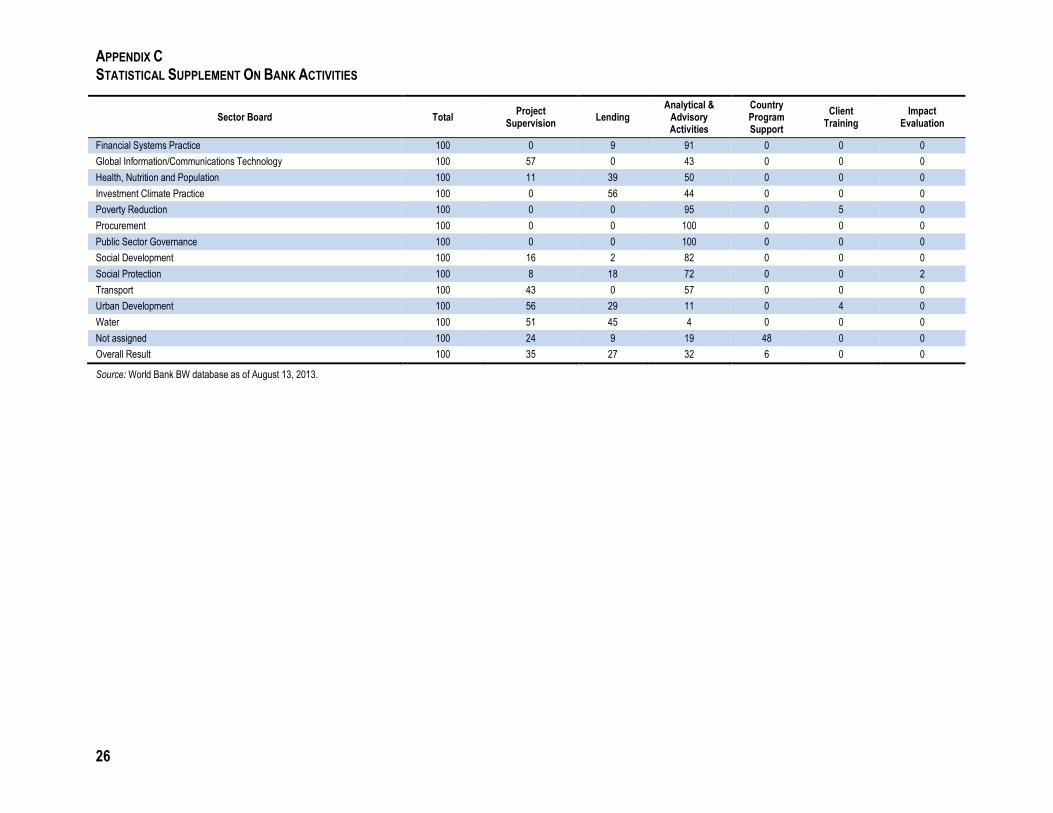
Table C.5. Bank Budget by Cost Structure Category, FY05-13 (in US$ thousands and percent)
Sector Board Total Project
Supervision Lending
Analytical & Advisory Activities
Country Program Support
Client Training
Impact Evaluation
Cost structure (US$)
Agriculture and Rural Development 5,608 2,971 1,392 1,245
Competitive Industries Practice 342 342
Education 3,322 1,777 1,349 186 10
Energy and Mining 2,889 973 1,064 853
Environment 4,088 2,213 1,439 436
Economic Policy 4,525 414 1,947 2,165
Financial Management 14 14
Financial and Private Sector Development (I) 3,233 1,513 723 997
Financial Systems Practice 749 71 678
Global Information/Communications Technology 1,188 672 0 515
Health, Nutrition and Population 872 95 338 439
Investment Climate Practice 664 0 375 289
Poverty Reduction 649 618 31
Procurement (1) (1)
Public Sector Governance 1,235 1,235
Social Development 786 126 16 644
Social Protection 3,379 262 618 2,436 63
Transport 1,301 558 0 744
Urban Development 3,333 1,873 965 358 137
Water 3,700 1,881 1,674 145
Not assigned 6,005 1,444 545 1,122 2,894
Overall Result 47,881 16,772 12,856 15,118 2,894 177 63
Cost structure (percent)
Agriculture and Rural Development 100 53 25 22 0 0 0
Competitive Industries Practice 100 0 100 0 0 0 0
Education 100 53 41 6 0 0 0
Energy and Mining 100 34 37 30 0 0 0
Environment 100 54 35 11 0 0 0
Economic Policy 100 9 43 48 0 0 0
Financial Management 100 0 0 100 0 0 0
Financial and Private Sector Development (I) 100 47 22 31 0 0 0
APPENDIX C STATISTICAL SUPPLEMENT ON BANK ACTIVITIES
26
Sector Board Total Project
Supervision Lending
Analytical & Advisory Activities
Country Program Support
Client Training
Impact Evaluation
Financial Systems Practice 100 0 9 91 0 0 0
Global Information/Communications Technology 100 57 0 43 0 0 0
Health, Nutrition and Population 100 11 39 50 0 0 0
Investment Climate Practice 100 0 56 44 0 0 0
Poverty Reduction 100 0 0 95 0 5 0
Procurement 100 0 0 100 0 0 0
Public Sector Governance 100 0 0 100 0 0 0
Social Development 100 16 2 82 0 0 0
Social Protection 100 8 18 72 0 0 2
Transport 100 43 0 57 0 0 0
Urban Development 100 56 29 11 0 4 0
Water 100 51 45 4 0 0 0
Not assigned 100 24 9 19 48 0 0
Overall Result 100 35 27 32 6 0 0
Source: World Bank BW database as of August 13, 2013.

APPENDIX C STATISTICAL SUPPLEMENT ON BANK ACTIVITIES
27
Table C.6. Total Net Disbursements of Official Development Assistance and Official Aid, 2002-2011 (US$m)
Donor 2002 2003 2004 2005 2006 2007 2008 2009 2010 2011 Average 2002-11
Cumulative 2002-11
Percentage of total
disbursed 2002-11
All Donors, total 220.9 299.8 352.3 362.4 431.4 321.2 375.0 502.8 550.4 918.3 433.4 4334.3 100
DAC Countries, total 144.9 207.9 232.1 268.2 286.1 193.6 250.6 349.5 355.3 490.8 277.9 2779.0 64.1
Multilateral, Total 81.8 94.6 120.2 101.2 153.8 137.2 133.1 159.1 192.2 410.5 158.4 1583.8 36.5
EU Institutions 77.0 94.8 89.9 96.6 149.3 130.1 83.0 108.1 92.3 442.3 136.3 1363.3 31.5
France 96.6 107.6 141.4 181.8 176.3 127.9 160.5 170.0 126.8 304.4 159.3 1593.2 36.8
Spain 7.4 12.6 9.7 5.6 15.9 21.3 16.2 124.1 158.0 82.9 45.4 453.6 10.5
Japan 63.3 85.5 59.7 51.1 18.6 20.6 54.0 14.4 35.9 25.0 42.8 428.0 9.9
Germany -5.2 11.68 12.26 29.03 39.61 27.47 27.42 30.8 23.86 31.13 22.8 228.1 5.3
Arab Fund (AFESD) .. .. .. .. .. .. 43.37 29.7 87.01 -36.49 30.9 123.6 2.9
GEF 5.81 0.2 25.44 0.19 0.85 .. 2.88 13.5 6.97 .. 7.0 55.8 1.3
United Kingdom .. .. .. 21.23 16.49 0.12 1.46 3.82 2.5 6 7.4 51.6 1.2
Belgium -0.13 1.08 1.5 2.44 9.55 6.71 8.22 0.89 -0.07 6.77 3.7 37.0 0.9
Italy 1.07 2.21 20 -9.24 20.83 0.48 -16.79 3.23 8.65 2.94 33.38 33.4 0.8
Switzerland 1.63 1.47 0.8 0.71 1.3 0.56 2.11 1.44 0.96 10.96 21.94 21.9 0.5
OFID -0.91 -0.03 4.33 3.22 4.61 5.25 3.99 -0.06 -1.87 -0.65 17.88 17.9 0.4
Global Fund .. .. .. .. .. 4.79 1.44 2.91 7.04 1.47 17.65 17.7 0.4
United Arab Emirates 0.27 4.87 7.79 1.35 1.03 -2.49 -1.54 -2.12 -2.13 7.87 14.9 14.9 0.3
Luxembourg 2.34 2.88 1.58 0.81 1.39 1.02 1.34 0.61 .. 0.13 12.1 12.1 0.3
Source: Organization for Economic Co-operation and Development (OECD). Data extracted on 14 Aug 2013 13:49 UTC (GMT) from OECD.Stat

APPENDIX C STATISTICAL SUPPLEMENT ON BANK ACTIVITIES
28
Table C.7. Tunisia – List of World Bank AAA, FY05-13
# Product ID Proj Name Approval
FY Delivered to client (FY)
AAA Type
Project Status
Sector Board Output Type Cost of
product (US$ '000)
1 P087058 Tunisia Health Sector Review 2005 FY05 ESW Closed Health, Nutrition and Population Report 323.9
2 P086046 Tunisia Employment Strategy Capacity bul 2005 FY05 NLTA Closed Social Protection "How-To" Guidance 239.3
3 P080203 Tunisia Higher Education Strategy 2005 FY05 ESW Closed Education Policy Note 114.5
4 P089876 Tunisia Knowledge Economy TA 2005 FY05 NLTA Closed Financial and Private Sector Development
Institutional Development Plan
41.3
5 P089551 TN-Environment and Social Sageguards 2005 FY05 NLTA Closed Environment Knowledge-Sharing
Forum 40.6
6 P089047 TN-Agriculture Policy Review 2006 FY06 ESW Closed Agriculture and Rural Development
Report 827.3
7 P099317 FSAP Update Tunisia 2006 FY06 ESW Closed Financial and Private Sector Development
Report 228.7
8 P094359 TN-Performance-Based Budgeting Reform 2006 FY06 NLTA Closed Public Sector Governance Institutional
Development Plan 138.1
9 P095803 TN-Public Financial Management 2006 FY06 NLTA Closed Public Sector Governance Institutional
Development Plan 136.2
10 P095723 TN-PESW Employment Strategy 2006 FY06 NLTA Closed Social Protection "How-To" Guidance 122.2
11 P099553 AML/CFT ASSESSMENT TUNISIA 2006 FY06 ESW Closed Financial and Private Sector Development
Report 120.1
12 P096986 TN-Use of Country Systems in Safeguards 2006 FY06 NLTA Closed Environment Knowledge-Sharing
Forum 22.6
13 P103909 TN Skills Dev/Soc. Ins and Employment 2007 FY07 NLTA Closed Social Protection "How-To" Guidance 335.8
14 P076448 TN-SME STUDY 2007 FY07 ESW Closed Financial and Private Sector Development
Report 313.0
15 P101225 Tunisia Public Fin. Mgt (MTEF) 2007 FY07 NLTA Closed Public Sector Governance "How-To" Guidance 76.8
16 P067503 CDM TA for Tunisia 2007 FY07 NLTA Closed Environment "How-To" Guidance 65.8
17 P101267 TN: Use of Country System Environment 2007 FY07 NLTA Closed Environment Knowledge-Sharing
Forum 37.0
18 P099094 TN-Cost Assessment of Water Degradation 2007 FY07 ESW Closed Environment Policy Note 26.2
19 P089681 TN-Global Integration Study 2008 FY08 ESW Closed Economic Policy Report 294.9
20 P107684 TN: Skills Development/Social Insurance 2008 FY08 NLTA Closed Social Protection "How-To" Guidance 149.0
21 P089416 TN-Water & Wastewater Strategy 2008 FY08 ESW Closed Water Policy Note 144.6
22 P110073 TN: Assessment of Hospital Performance 2008 FY08 NLTA Closed Health, Nutrition and Population Institutional
Development Plan 134.8
23 P104948 TN-Dev of Logistics Services &Infrastr 2008 FY08 NLTA Closed Transport "How-To" Guidance 94.4
24 P107086 TN: Budget Management Reform 2008 FY08 NLTA Closed Public Sector Governance "How-To" Guidance 88.9

APPENDIX C STATISTICAL SUPPLEMENT ON BANK ACTIVITIES
29
# Product ID Proj Name Approval
FY Delivered to client (FY)
AAA Type
Project Status
Sector Board Output Type Cost of
product (US$ '000)
25 P104800 ESMAP: TN-Review of Energy Mgt Policy 2009 FY09 ESW Closed Energy and Mining Report 467.2
26 P102795 TN-Agricultural Sector Review Update 2009 FY09 NLTA Closed Agriculture and Rural Development
"How-To" Guidance 240.3
27 P112605 TN - Performance Based Budgeting 2009 FY09 NLTA Closed Public Sector Governance "How-To" Guidance 124.6
28 P113339 TN-Health Services Improvement TA 2009 FY09 NLTA Closed Health, Nutrition and Population "How-To" Guidance 93.4
29 P101282 TN- Tunis Urban Transport Efficiency TA 2009 FY09 NLTA Closed Transport "How-To" Guidance 38.4
30 P107054 TN-Development Policy Review 2010 FY10 ESW Closed Economic Policy Report 457.1
31 P111813 TN-TF ALMP/E2W Pilots and Impact Eval. 2010 FY10 NLTA Closed Social Protection Client Document
Review 271.9
32 P108077 TN-SME Finance Policy Note 2010 FY10 ESW Closed Financial and Private Sector Development
Policy Note 161.9
33 P112434 TN-Competitiveness Poles 2010 FY10 ESW Closed Urban Development Policy Note 154.8
34 P117400 TN-Performance-Based Budgeting PESW 2010 FY10 NLTA Closed Public Sector Governance "How-To" Guidance 103.3
35 P119393 TN-Public Expenditure and Financial Mgmt 2010 FY10 ESW Closed Public Sector Governance Report 67.7
36 P116108 TN-Impl. Logistics Action Plan TA 2011 FY11 NLTA Closed Transport "How-To" Guidance 203.2
37 P119399 TN Growth & Macro Management 2011 FY11 NLTA Closed Economic Policy Knowledge-Sharing
Forum 202.5
38 P121196 TN-Agricultural Finance 2011 FY11 ESW Closed Agriculture and Rural Development
Policy Note 194.4
39 P114161 TN-ESMAP Low Carbon Transport Strategy 2011 FY11 NLTA Closed Transport "How-To" Guidance 182.4
40 P107160 Tunisia- Trade Integration TA 2011 FY11 NLTA Active Economic Policy "How-To" Guidance 73.0
41 P122705 TN Performance Based Budgeting PESW FY11 2011 FY11 NLTA Closed Public Sector Governance "How-To" Guidance 36.3
42 P128946 FSAP Update Tunisia 2012 FY12 ESW Closed Financial Systems Practice Report 275.4
43 P113857 TN-Clean Energy 2012 FY12 ESW Closed Energy and Mining Policy Note 186.1
44 P122552 TN-ALMP/E2W Pilots and Impact Eval.- Ph2 2012 FY12 NLTA Closed Social Protection TA/IAR 174.2
45 P123106 TN-FINANCIAL SECTOR REFORM 2012 FY12 NLTA Closed Financial and Private Sector Development
TA/IAR 164.1
46 P128637 StAR - Tunisia 2012 FY12 NLTA Closed Financial Systems Practice Institutional
Development Plan 158.8
47 P122874 TN - Public Sector Reform TA 2012 FY12 NLTA Active Public Sector Governance TA/IAR 127.6
48 P127794 TN-Public Sector Governance 2012 FY12 NLTA Active Public Sector Governance TA/IAR 99.0
49 P128244 TN -Poverty PESW 2013 FY13 ESW Closed Poverty Reduction EW/Not assigned 276.7
50 P132264 Asset Recovery in Tunisia 2013 FY13 NLTA Closed Financial Systems Practice TA/IAR 207.0
51 P129349 TN - Tourism Sector Debt Restructuring 2013 FY13 ESW Closed Financial Systems Practice EW/Not assigned 164.6
52 P130139 ICT Collaboration for Civic Engagement 2013 FY13 NLTA Closed Global Information/Communications Technology
TA/IAR 135.9

APPENDIX C STATISTICAL SUPPLEMENT ON BANK ACTIVITIES
30
# Product ID Proj Name Approval
FY Delivered to client (FY)
AAA Type
Project Status
Sector Board Output Type Cost of
product (US$ '000)
53 P132540 Tunisia SABER WfD 2013 FY13 NLTA Closed Education TA/IAR 34.5
54 P126475* TN ICT Service Delivery Health Sector 2013 TBD NLTA Active Global ICT TA/IAR 0.0
55 P126485* TN-Employment TA Package 2013 TBD NLTA Active Social Protection TA/IAR 0.0
56 P128254* TN - Development Policy Review 2013 TBD ESW Active Economic Policy Report 0.0
57 P128545* TN-Governance in Social Sectors TA 2013 TBD NLTA Active Social Protection TA/IAR 0.0
9192.2
Source: World Bank BW database as of August 2013. Note: * denotes projects that are yet to be delivered to the client and for which there are no complete costs of products.
NLTA : Non lending Technical Assistance ESW: Economic and Sector Work

31
Appendix D. Tunisia Donors’ Collaboration over 1990-2013
Donor Collaboration FY90-03
1. The last Country Assistance Evaluation for Tunisia (OED 2004) refers to the
wide range of development partners at work in the country between 1990 and 2003.
During that period, the World Bank and the International Monetary Fund (IMF)
worked closely to support government efforts to maintain macroeconomic stability
and implement structural reforms. The IMF and the Bank jointly conducted a
financial assessment and cooperated in a number of areas to provide technical
advice, most notably in respect to the financial sector and debt management.
2. The Bank also worked closely with the European Union (EU), which had a
particularly strong partnership relationship with Tunisia. The Bank and the EU co-
funded a program of structural adjustment through the economic and
competitiveness adjustment loan series (ECALs). The EU also provided significant
loans in support of other sectors such as infrastructure, environmental protection,
and private sector development and modernization. The Bank and the EU had a
shared analysis of economic developments in Tunisia, rating the country highly for
macroeconomic stabilization and structural adjustment, but stressing the need to
accelerate the implementation of policies that would increase competitiveness.
3. Along with the French Development Agency( AFD) and KfW, the EU has
also been an important partner in the Bank’s rural development program. AFD has
been a major player in development in Tunisia since 1992, concentrating on sectors
such as employment, rural development, and the environment.
4. Between 1990 and 2003, loan commitments from the African Development
Bank (AfDB) prioritized electrification, roads, railways, water resources, agriculture
and rural development, and small and medium enterprise (SME) development. The
AfDB prioritized structural adjustment and supported the three ECALs, working
closely with the Bank in that regard. The IDB assistance otherwise focused on
public utilities (mainly water and sewerage), agriculture and integrated rural
development, and social sectors.
DONOR COLLABORATION FY05-10
5. The country assistance strategy (CAS) FY05-08 commits to enhanced levels
of cooperation on assistance strategies, joint analytical work, and to greater

APPENDIX D TUNISIA DONOR’S COLLABORATION OVER 1990-2013
32
harmonization of procedures to minimize the cost and burden of government
borrowing2. In 2005, the World Bank opened a liaison office in Tunis. This
constituted an important step, allowing the Bank the opportunity to scale up its
outreach and communication efforts with academics, the business community, and
the media as well as allowing for enhanced cooperation with other donors. The
completion review of CAS FY05-08 references close cooperation achieved between
the Bank, the EU, and the AfDB, particularly in the provision of support under
ECAL IV, as well as work between Bank teams and bilateral donors (e.g., with AFD
and KFW in the water sector, and informal dialogue with GTZ on environmental
issues). The Bank also organized a joint conference (with the EU and United
Nations, 2007) on access to development information (see Table D.1 for co-financing
activities during the CAS).
6. However, the CAS completion report (CASCR) notes that the government’s
preference for bilateral relationships with each donor did not provide the
opportunity to develop joint analytical work and harmonize financing procedures
as initially envisaged.
Table D.1. Co-financing Activities in Tunisia FY05-09
7. The country program strategy
(CPS) FY10-13 notes the deepening
levels of collaboration between the
Bank, the EU, and the AfDB, the latter
two being the largest donors operating
in Tunisia, followed by AFD, Japan,
and the World Bank. But the document
noted government reluctance to share information and to work in concert with
stakeholders and the donor community, posing serious obstacles to effective donor
partnership prior to 2011. The report also recognizes that, increasingly, the Bank
may be asked to play to its comparative advantage in Tunisia through the adoption
of a convening rather than a financing role.
8. The CPS notes joint work between the EU, AfDB, and World Bank in the
provision of budget support for Tunisia’s integration and competitiveness program.
The Bank and the EU continued to work closely on performance-based budgeting,
PEFA, employment, and education. The CPS suggests the Bank, AfDB, and AFD
were collaborating well in sectors such as water, energy, agriculture, municipal
development, and cultural heritage management.
Project Co-financiers
Water Sector Investment ECAL III Municipal Development III ECAL IV Water Sector Investment II Integration and Competitiveness DPL Skills Development
KFW, AFD, AfDB AfDB, EU AFD AfDB, EU AFD, AfDB AfDB, EU EU
Source: CASCR June 2004-March 2009.

APPENDIX D TUNISIA DONOR’S COLLABORATION OVER 1990-2013
33
9. The CPS also suggests the International Finance Corporation (IFC) was
actively collaborating with other international financing institutions (IFIs) (e.g., IFC
helped bring in the AfDB, Proparco, and the European Investment Bank as co-
financiers for the Enfidha Airport project).
DONOR COLLABORATION SINCE “THE REVOLUTION”
10. Following the revolution, many development organizations either
strengthened their presence in Tunisia or became new partners, reflecting the
intent of the Deauville Partnership. World Bank Group engagement and field
presence grew significantly after the revolution. The Bank upgraded the Tunis
Liaison Office to a country office and appointed a country manager in early 2011,
while IFC established a field presence in Tunis in 2012. The IDB concluded an
memorandum of understanding (MOU) with potential areas of cooperation for
2012-14 in sectors such as basic infrastructure, agriculture, regional development,
tertiary education, employment, and private sector development. Initial IDB
support included new financing for rural development and unemployed university
graduates. The UN and associated humanitarian agencies also established new
programs, in particular to respond to needs related to refugees from Libya. Tunisia
became a member of European Bank for Reconstruction and Development (EBRD)
in 2012. Other support was provided by Qatar, the United States, and the EBRD. In
addition, an IFI Coordination Platform was created under the Deauville Partnership
to ensure coordination and to reduce the risk of overlap.
11. In the post-revolution period, the Bank worked closely with the first Interim
government, the AfDB, the EU, and AFD to support the process of reform. The
Bank prepared joint analytical work, technical assistance, and co-financing notably
to provide fast-disbursing support through the post-revolution development policy
loans (2011 Governance and Opportunity (GO) and 2012 Governance Opportunity
and Job (GOJ) DPLs). ISN FY12-13 states that, in addition to the GEF, the Bank has
mobilized support from the IDF, JSDF, PHRD and SPF and may also leverage
financing from the Clean Technology Fund, as well as other development partners
whose financing and technical assistance complements the Bank's programs (see
table D.2.)
Table D.2. Trust Funds Administered or Funded by the World Bank
Start Year Project (US$m) Total (US$m)
FY12-13 JSDF Community Healthcare Outreach (1) JSDF Emergency Support for Youth (3) IDF Procurement Capacity (0.25)
4.25
FY13-14 JSDF Community Works and Local Participation (3) SPF Participatory Services Delivery and Reintegration (5)
30.30
APPENDIX D TUNISIA DONOR’S COLLABORATION OVER 1990-2013
34
GEF Ecotourism and Conservation (4.3) Clean Technology Fund (18)

35
Appendix E. Description of the World Bank Group Strategy and Program over FY05-13
World Bank Group Strategy
1. The pillars of the International Bank for Reconstruction and
Development’s (IBRD) strategy under country assistance strategy (CAS) FY05-08
were directly related to the three goals set out under Tunisia’s 10th Economic
Development Plan (2002-06). The CAS FY05-08 sought to help address three
challenges: (i) strengthen the business environment to support the development of
a more competitive, internationally integrated private sector, and to improve the
competitiveness of the Tunisian economy; (ii) enhance the skills and employability
of graduates and the labor force in a knowledge economy; and (iii) improve the
quality of social services through enhanced efficiency in public expenditure. The
base case range of the flexible lending program set out in the CAS was US$200-300
million per year.
2. The pillars of the country program strategy (CPS) FY10-13 reflect priorities
set out in Tunisia’s ambitious 11th National Development Plan (NDP, 2007)3, which
was drawn-up following Tunisia’s achievement of Investment Grade Status. The
CPS FY10-13 aimed to support Tunisia’s strategy of generating employment by
establishing a knowledge-based economy with an emphasis on human
development, and comprised three pillars: (i) growth, competitiveness and
employment; (ii) sustainable development and climate change; and (iii) improving
the quality of public services. While sustainable development was not an explicit
pillar of the FY05-08 CAS, numerous Bank activities under pillar 1 of that strategy
were linked to water, energy, and agriculture and focused on environmental issues,
such as renewable energy and natural resource management projects. The CPS
FY10-13 outlines a lending program of up to $280 million for FY10 (of which 25
percent was earmarked for development policy lending), but, as earlier noted, the
FY10-13 CPS only saw one year of implementation.
3. Immediately after the revolution, the Bank Group sought to signal a break
with the past by supporting the changed priorities of the new government. The
interim government’s immediate challenges were to promote shared economic
recovery and respond to demands for greater citizen voice, transparency, and
accountability of the state in order to ensure a successful systemic political
transition. To support these priorities and the overarching objective of employment
creation, the Bank Group framed its ISN FY13-14 under three pillars: (a) laying
the foundation for renewed sustainable growth and job creation; (b) promoting

APPENDIX E DESCRIPTION OF WBG STRATEGY AND PROGRAM OVER FY05-13
36
social and economic inclusion; and (c) strengthening governance through
improvements in voice, transparency, and accountability. The ISN forecasts policy-
based and investment lending of $950 million for FY13 and notes that subsequent
funding will be determined taking into account FY13 performance, requests from
the borrower, and IBRD’s overall capital position. International Finance
Corporation’s (IFC) program will be adaptable and tailored to support economic
recovery and restore investor confidence.
Table E.1. Strategic Pillars in the FY05-08 CAS, FY10-13 CPS, and FY13-14 ISN
World Bank Group strategy documents
Pillar 1 Pillar 2 Pillar 3
CAS (FY05-08) Strengthen the business environment
Enhance skills and employability of graduates and labor force
Improve the quality of social services through enhanced efficiency of public expenditure
CPS (FY10-13) (canceled in 2011)
Growth, competitiveness and employment
Sustainable development and climate change
Improving the quality of public services
ISN (FY13-14) Laying the foundation for renewed sustainable growth and job creation
Promoting social and economic inclusion
Strengthening governance : Voice, transparency and accountability
World Bank Group Operational Program
4. This section describes the main trends and sector allocations in the World
Bank Group’s portfolio over the evaluation period and discusses the performance
of Bank operations as well as the overall portfolio risk over that timeframe.
WORLD BANK GROUP TRENDS IN LENDING
5. Between FY05-13, the World Bank Group committed $2,491 million of its
own resources in Tunisia comprising $1,997 million (80 percent) in IBRD loans,
$267 million (11 percent) in IFC net commitments, and $227 million (9 percent) in
MIGA issued guarantees. Lending was complemented by an extensive program of
World Bank AAA and a lesser amount of IFC Advisory Services. During the period
reviewed, 35 percent of the Bank administrative budget was spent on project
supervision, 27 percent on lending and 32 percent on AAA.
6. World Bank Group investment was volatile across the evaluation period.
The level of Bank lending was low during the early years of the evaluation period
but picked up in later years with the introduction of significant budget support
operations (see figure E.1). In 2007, Tunisia achieved Investment Grade status and
was able to access financing on the global market for its development strategy. This

APPENDIX E DESCRIPTION OF WBG STRATEGY AND PROGRAM OVER FY05-13
37
resulted in a steady decline in demand for World Bank financing FY05-10 with the
exception of the FY09 development policy loan (DPL) designed to help the
government cope with the effects of the global financial crisis. Annual average
lending commitments for FY05-09—excepting the 2009 DPL—were $95 million, or
around $9 per capita per year, compared with an average $20 per capita in the
period 1990-03 (OED, 2005). Investment lending increased significantly in 2009 and
2010 and overall lending commitments, driven by development policy lending,
have risen sharply since 2009 to meet government needs during the financial crisis
and in the aftermath of the revolution, reversing the negative trends in net transfers
that had prevailed since the early 1990s.
7. After the World Bank provided budget support during the financial crisis
(disbursed FY10-11), net transfers turned positive (see figureE.1). Subsequent to
the revolution, Tunisia’s access to external financing was limited due to the
decision by rating agencies to downgrade its sovereign debt rating. The level of
Bank Group support grew significantly in response to the increase in demand that
ensued, notably through two governance DPLs (disbursed respectively in FY12 and
FY13 for $500m each). Both constituted part of a broader package of budget support
in association with the African Development Bank, the European Union (EU,) and
the French Agency for Development4. IBRD’s total commitment ($1,163.3m) across
twelve operations since the start of FY11 represents almost 60 percent of its lending
across the entire evaluation period. Table E.2 illustrates the ebb and flow of
commitments and disbursements over the evaluation period.
Figure E.1. IBRD, IDA, Grants: Commitments, Net Disbursements, Net Transfers, FY05-13
Source: WB data Warehouse
-200
0
200
400
600
800
FY05 FY06 FY07 FY08 FY09 FY10 FY11 FY12 FY13
US
$ M
illi
on
s
Fiscal Year Commitments Net disbursements Net transfers

APPENDIX E DESCRIPTION OF WBG STRATEGY AND PROGRAM OVER FY05-13
38
Table E.2. IBRD Proposed and Actual Lending to Tunisia (FY05-13)
CAS FY05-08 FY09
CPS FY10-13 (canceled Jan11)
FY10 (as of Jan 11) to
FY 12 ISN FY13-14
Proposed Actual Actual Proposed Actual Actual
Proposed in ISN FY13-
14
Actual (ongoing)
Loan commitments (US$ million at current price)
Total during period
765-1079 387.7 335.6 950 202.5 561.9 1900 509.8
Average annual
200-300 97 335.6 250 NA 281 950 NA
Percentage of total commitment
DPL 46 39 75 77 25 89 90 98
Other 54 61 25 23 75 11 10 2
Source: WB data Warehouse
8. IFC and the Multilateral Investment Guarantee Agency (MIGA) engagement
in Tunisia is limited throughout the evaluation period, but similar to the Bank, the
rate and level of engagement has increased in the post-revolution period.
Table E.3. IFC disbursements and Net Commitments to Tunisia (FY05-13)
Fiscal Year
Annual Net Commitments ($ millions)
Annual Disbursements ($ millions)
Disbursement / Commitment Ratio (%)
2008 237.1 17.7 7.5
2009 -10.8 108.7 -1009.6
2010 -0.1 89.4 -76129.8
2011 2.0 0.4 21.5
2012 27.6 15.6 56.7
2013 11.6 19.6 168.4
Total 267.4 251.4 94.0
Source: IFC Data Note: A single IFC investment in 2008 accounted for about 212 million in net commitments.
WORLD BANK GROUP PORTFOLIO ALLOCATIONS AT SECTORAL LEVEL
IBRD portfolio allocations at sectoral level
9. Before the revolution, IBRD resources were allocated across pillars with
an emphasis on private sector and financial projects, water related projects,
including irrigation and social protection, notably active labor market policies5.
Portfolio structure at sector level over the evaluation period was similar to that
pertaining FY90-03. After 2011, budget support operations supported reforms to
strengthen voice, accountability and transparency.
10. IBRD’s actual lending volume under CAS FY05-08 was $387.7 million (19
percent of all IBRD lending FY05-13) significantly lower than the minimum
proposed allocation ($765 million) set out in the CAS baseline scenario. Eleven
projects were approved, eight of which reached implementation (including projects
addressing urban water supply, higher education reform, competitiveness and
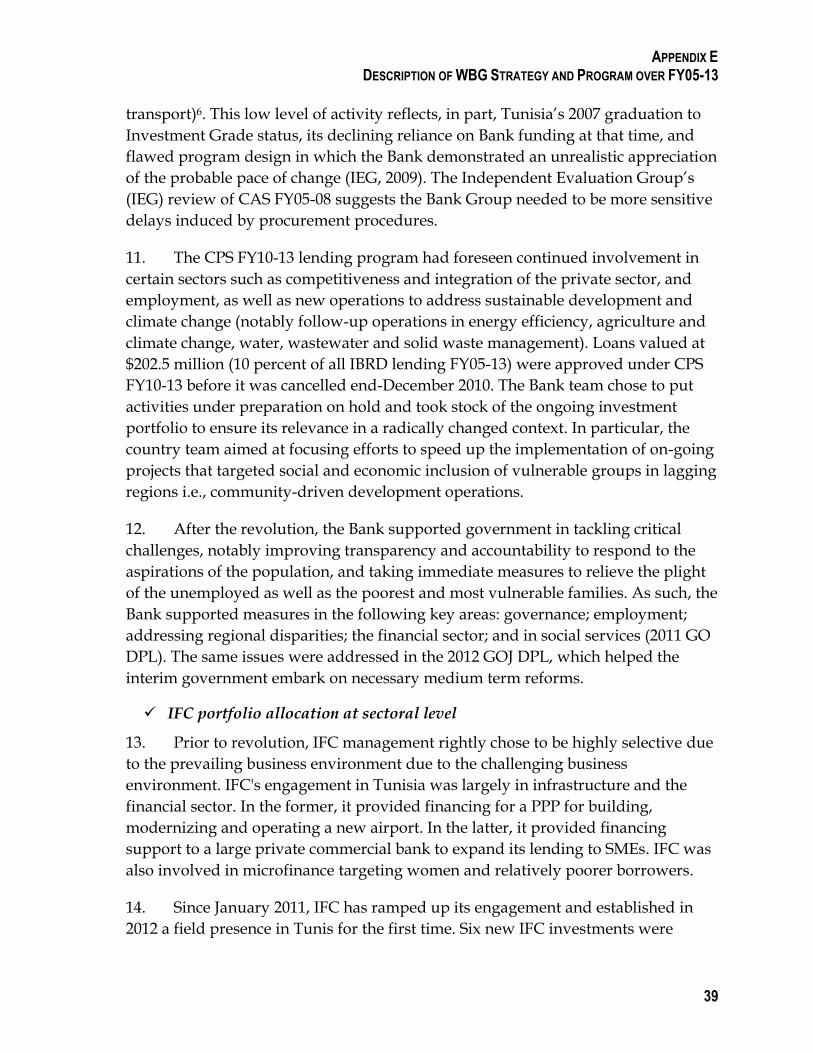
APPENDIX E DESCRIPTION OF WBG STRATEGY AND PROGRAM OVER FY05-13
39
transport)6. This low level of activity reflects, in part, Tunisia’s 2007 graduation to
Investment Grade status, its declining reliance on Bank funding at that time, and
flawed program design in which the Bank demonstrated an unrealistic appreciation
of the probable pace of change (IEG, 2009). The Independent Evaluation Group’s
(IEG) review of CAS FY05-08 suggests the Bank Group needed to be more sensitive
delays induced by procurement procedures.
11. The CPS FY10-13 lending program had foreseen continued involvement in
certain sectors such as competitiveness and integration of the private sector, and
employment, as well as new operations to address sustainable development and
climate change (notably follow-up operations in energy efficiency, agriculture and
climate change, water, wastewater and solid waste management). Loans valued at
$202.5 million (10 percent of all IBRD lending FY05-13) were approved under CPS
FY10-13 before it was cancelled end-December 2010. The Bank team chose to put
activities under preparation on hold and took stock of the ongoing investment
portfolio to ensure its relevance in a radically changed context. In particular, the
country team aimed at focusing efforts to speed up the implementation of on-going
projects that targeted social and economic inclusion of vulnerable groups in lagging
regions i.e., community-driven development operations.
12. After the revolution, the Bank supported government in tackling critical
challenges, notably improving transparency and accountability to respond to the
aspirations of the population, and taking immediate measures to relieve the plight
of the unemployed as well as the poorest and most vulnerable families. As such, the
Bank supported measures in the following key areas: governance; employment;
addressing regional disparities; the financial sector; and in social services (2011 GO
DPL). The same issues were addressed in the 2012 GOJ DPL, which helped the
interim government embark on necessary medium term reforms.
IFC portfolio allocation at sectoral level
13. Prior to revolution, IFC management rightly chose to be highly selective due
to the prevailing business environment due to the challenging business
environment. IFC's engagement in Tunisia was largely in infrastructure and the
financial sector. In the former, it provided financing for a PPP for building,
modernizing and operating a new airport. In the latter, it provided financing
support to a large private commercial bank to expand its lending to SMEs. IFC was
also involved in microfinance targeting women and relatively poorer borrowers.
14. Since January 2011, IFC has ramped up its engagement and established in
2012 a field presence in Tunis for the first time. Six new IFC investments were
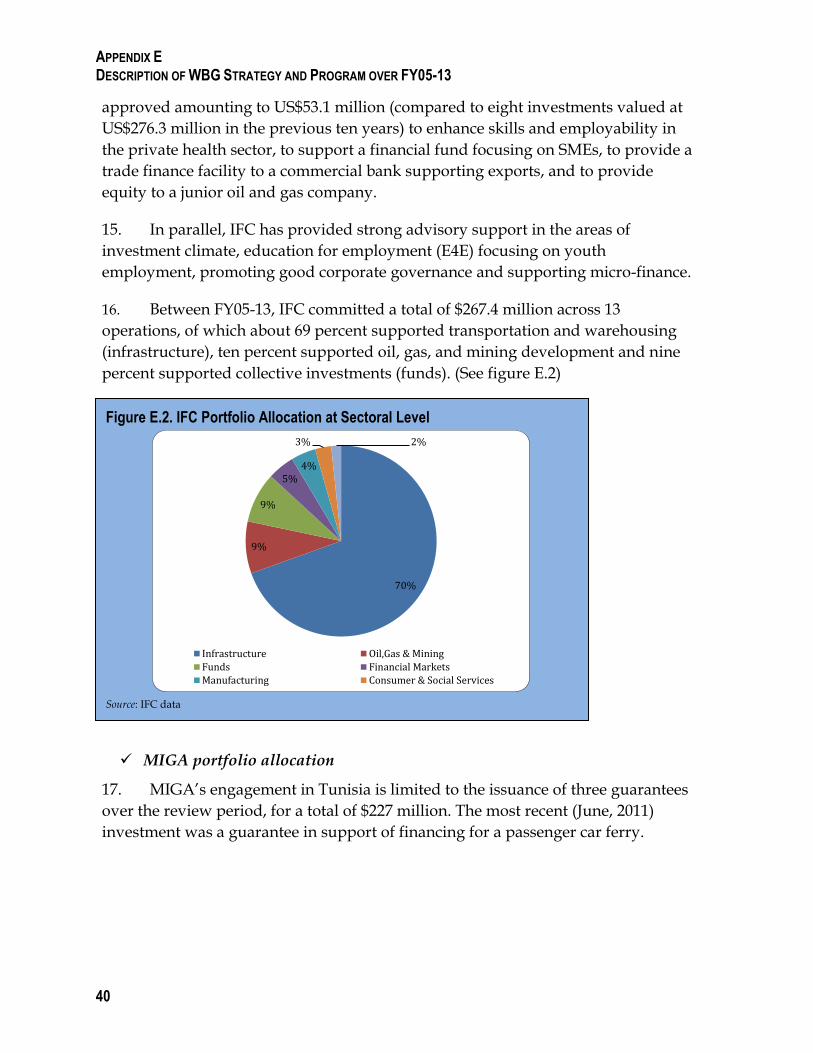
APPENDIX E DESCRIPTION OF WBG STRATEGY AND PROGRAM OVER FY05-13
40
approved amounting to US$53.1 million (compared to eight investments valued at
US$276.3 million in the previous ten years) to enhance skills and employability in
the private health sector, to support a financial fund focusing on SMEs, to provide a
trade finance facility to a commercial bank supporting exports, and to provide
equity to a junior oil and gas company.
15. In parallel, IFC has provided strong advisory support in the areas of
investment climate, education for employment (E4E) focusing on youth
employment, promoting good corporate governance and supporting micro-finance.
16. Between FY05-13, IFC committed a total of $267.4 million across 13
operations, of which about 69 percent supported transportation and warehousing
(infrastructure), ten percent supported oil, gas, and mining development and nine
percent supported collective investments (funds). (See figure E.2)
MIGA portfolio allocation
17. MIGA’s engagement in Tunisia is limited to the issuance of three guarantees
over the review period, for a total of $227 million. The most recent (June, 2011)
investment was a guarantee in support of financing for a passenger car ferry.
Figure E.2. IFC Portfolio Allocation at Sectoral Level
Source: IFC data
70%
9%
9%
5% 4%
3% 2%
Infrastructure Oil,Gas & MiningFunds Financial MarketsManufacturing Consumer & Social Services

APPENDIX E DESCRIPTION OF WBG STRATEGY AND PROGRAM OVER FY05-13
41
Table E.4. MIGA Guarantees to Tunisia (FY05-13)
Project ID Project Name FY Project Status Sector
Guarantees Gross
Exposure, US$ millions
10180 Passenger-Car Ferry TANIT (Investor: BNP Paribas and Société Générale, France)
2012 Active Transportation 217.7
10015 HHW, S.A. (Investor: Fons Mediterrània Capital, F.C.R. de Régimen Simplificado, Spain
2012 Active Manufacturing 4.1
9949 Bitaka S.A. (Investor: Fonds Mediterrània Capital, F.C.R. de Régimen Simplificado, Spain
2012 Active Services 5.1
Total 226.9
Source: MIGA data
PORTFOLIO PERFORMANCE AND RISK
18. Of the projects rated by IEG, those that closed in the earlier part of the
period received better ratings than more recent exits. One hundred percent of the
projects that closed during FY05-09 were rated moderately satisfactory or better
compared to fifty percent during the period FY10-13. IEG has reviewed the ICRs for
seventeen of the twenty five projects that closed during the FY05-13 period (See
Table E.3.). The assessments of the completed Bank operations in Tunisia indicate
these had better development outcome ratings (81 percent moderately satisfactory
or better) than the average for MENA (69 percent), and the Bank as a whole (76
percent)7.
Table E.5. IEG Project Ratings by Fiscal Year, FY05-13
2005 2006 2007 2008 2009 2010 2011
Grand Total
Satisfactory 2 1 3
Moderately Satisfactory 1 2 1 2 2 2 10
Moderately Unsatisfactory 1 1 2
Unsatisfactory 1 1
Grand Total 2 2 2 1 2 3 4 16
Source: WB data Warehouse
19. Projects rated moderately satisfactory and better spanned a range of sectors
including education, financial and private sector development, agriculture and
rural development and water. Unsatisfactory projects were located in the economic
policy, social protection and transport sectors. Two of the three projects rated as
moderately unsatisfactory or worse were DPLs (the 2011 employment, and the 2009
integration and competitiveness DPLs). Both closed in 2011, and together
represented 25 percent of total loan commitments of the closed projects evaluated
by IEG within the evaluation period. The employment DPL was the only project

APPENDIX E DESCRIPTION OF WBG STRATEGY AND PROGRAM OVER FY05-13
42
rated unsatisfactory and was found to have had major shortcomings in the
relevance of its objectives and design (see chapter 5). The transport sector
investment project approved in FY01 and the integration and competitiveness DPL
were each rated moderately unsatisfactory. IEG found that the $250 million
integration and competitiveness DPL, lacked relevant performance indicators.
Table E.6. IEG Project Ratings by Sector Board, FY05-13
Sector Board Satisfactory Moderately Satisfactory
Moderately Unsatisfactory Unsatisfactory Total
Agriculture and Rural Development
3 3
Economic Policy 1 1
Education 1 2 3
Environment 1 1
Financial and Private Sector Development
1 1 2
Global ICT 1 1
Social Protection 1 1
Transport 1 1 2
Urban Development 1 1 2
Water 1 1
Total 3 10 2 2 17
Source: WB data Warehouse
20. IEG’s review of closed projects found a significant risk to development
outcome in six (46 percent) of the thirteen instances where risk was assessed.
Total value of loans to these projects was about $320 million or 32 percent of the
value of all projects assessed for risk to development outcome. Five of the six
projects in question were approved FY00-03 and one was approved in FY11. The
largest, a $103 million water sector investment loan closed 18 months later than
expected due to procurement difficulties as well as budget constraints at the start of
the project. The most recent project assessed as having significant risk to
development outcome is the FY11 employment DPL. In that instance IEG found, at
entry, the Bank underestimated risk associated with slow recovery and uncertainty
in the region, and overestimated government commitment to necessary reforms.
21. The riskiness of the Bank’s portfolio under implementation increased
substantially after 2010 and is now more than three times as high as that for the
Middle East and North Africa (MENA) average.
Between FY05-FY09, no Bank operation in Tunisia (and none of the
commitment) was considered to be at risk. This was in contrast to an average
16.5 percent of projects and 12.6 percent of commitment at risk in MENA, and a

APPENDIX E DESCRIPTION OF WBG STRATEGY AND PROGRAM OVER FY05-13
43
World average 16.6 percent of projects and 14.5 percent of commitment at risk
over the same period (see table E.4. below).
In FY11, the level of commitment at risk in the active portfolio (16.2 percent)
exceeded the average for the MENA region (15.6 percent) and the World (13.9
percent) for the first time over the evaluation period.
In FY12, the percentage commitment at risk in Tunisia increased to 23.6 percent
(against averages of 21.6 percent for MENA, and 14.1 percent for the World).
The percentage of projects at risk (29.4 percent – up from 17.6 percent in FY11)
exceeded the World average (19.1 percent) for the first time over the evaluation
period, although it remained below MENA average in that year (35.8 percent).
In FY13, the riskiness of the overall portfolio worsened considerably. The risk to
commitment was rated 66.9 percent (against MENA, 20 percent, and WB, 23.2
percent) and the proportion of projects at risk was 43.8 percent (against MENA,
29.4 percent, and WB, 21.1 percent).
Table E.7. World Bank Projects at Risk, FY05-13
FY
Tunisia % projects at risk
MNA % projects at risk
World Bank portfolio % projects at risk
By number of projects
By commitment at risk
By number of projects
By commitment at risk
By number of projects
By commitment at risk
2005 0 0 12.9 8.3 16.1 13.3
2006 0 0 9.1 3.8 13.6 11.6
2007 0 0 20.7 18.8 16.4 15.3
2008 0 0 19.0 14.1 17.0 17.1
2009 0 0 20.7 17.8 20.1 15.4
2010 5.9 8.8 25.2 21.9 20.6 17.8
2011 17.6 16.2 26.8 15.6 18.6 13.9
2012 29.4 23.6 35.8 21.6 19.1 14.1
2013 43.8 66.9 29.4 20.0 21.1 23.2
Source: WB data Warehouse


45
Appendix F. Supplementary Information on Pillar 1
APPENDIX F.1: OVERVIEW OF MACROECONOMIC PERFORMANCE
APPENDIX F.2: DEEPENING GLOBAL INTEGRATION
APPENDIX F.3: IMPROVING THE BUSINESS ENVIRONMENT
APPENDIX F.4: IMPROVING EFFICIENCY OF THE FINANCIAL SECTOR
APPENDIX F.5: MODERNIZING INFRASTRUCTURE

APPENDIX F SUPPLEMENT INFORMATION ON PILLAR 1
46
F.1. Overview of Macroeconomic Performance over FY05-13
1. Through the nineties and early 2000s, Tunisia’s macro-economic
performance was good. Despite external shocks (such as the decline of tourism
following September 11, 2001), real GDP grew at an average annual rate of 4.5
percent during 2001-05. Prudent macro-economic management kept the rate of
inflation to about 2.6 percent during the period. The current account deficit stayed
below 3 percent of GDP through the 1990s and averaged 2.7 percent of GDP during
2001-05. The primary budget deficit (excluding privatization receipts and grants)
was also maintained at reasonable levels, not exceeding 3.5 percent of GDP during
2001-05. Monetary policies supported low inflation and maintenance of external
balances, and exchange rate policy targeted a constant real effective exchange rate
that helped maintain the competiveness of Tunisian exports. As a result of these
efforts, and prudent debt management policies, public debt (averaging about 60.5
percent of GDP during 2001-05) was kept within reasonable limits. Prudent macro
policies helped Tunisia improve its access to international financial markets, and
Tunisia was among the few emerging market borrowers that had investment grade
status.
Macro-economic developments 2005-10
2. Overall, macro-economic management was satisfactory, and the twin
objectives of sustaining economic growth and preserving macro-economic
stability were largely achieved. Despite the slow-down in economic activity
caused by the financial crisis in 2008-09, real GDP grew at an average rate of about
4.5 percent per year during 2006-10, comparable to the growth rate of the previous
five year period. This performance, in a difficult international environment8, was
driven by growing exports and foreign development investment (FDI) inflows, and
robust private consumption. The service sector (comprising almost 59 percent of
GDP) was the main engine of growth.
3. Inflation (as measured by period average consumer price index -CPI) was
kept in check, averaging about 4 percent per year during 2006-10 (compared to 2.6
percent per year in 2001-05). The relatively higher inflation, mainly during 2006-08
was partly attributable to higher energy and food prices, as well as increased
liquidity associated with FDI. Inflation fell thereafter following declining
commodity prices and tightened liquidity. Price controls on key commodities were
also a reason for low inflation in both periods.
4. Fiscal control, tight monetary policies, and prudent debt management also
helped reduce the burden of public and foreign debt over most of the period. The
average fiscal deficit (excluding grants) over the period 2006-10 was contained at
APPENDIX F SUPPLEMENT INFORMATION ON PILLAR 1
47
about 2.1 percent of GDP as compared to 3.3 percent during the previous five year
period. Debt consolidation efforts and the partial use of privatization receipts for
early debt repayment in 2006-07 resulted in the share of public debt in GDP falling
from an average of about 60 percent during 2001-05 to just about 46 percent in 2006-
10 (and to 44 percent in 2011). The reduction in public debt resulted in a sharp
decline in interest payments, allowing fiscal space for increased subsidies (due to
higher food and energy prices) and public investment.
5. External debt also declined, from about 66 percent of GDP during 2001-05 to
about 52 percent in 2006-10 (and 51 percent in 2011)9. The composition of external
debt and its maturity structure is also favourable - 38 percent of Tunisia’s external
debt is owed to multilateral donors and 20 percent of the debt is ‘concessional’.
Tunisia’s average interest rate on new external debt is the lowest among “resource-
poor” middle income Middle East and North Africa (MENA) countries since 2006
(in 2008, the average interest on new external debt was 2.5 percent for Tunisia).
Four percent of the medium and long term external debt has a maturity of between
1 and 5 years, 26 percent between 5 and 10 years, 44 percent between 10 and 15
years and 18 percent between 15 and 20 years. Medium- and long-term external
debt is mostly (77 percent) contracted with a fixed interest rate.
Macro-economic developments since 2011
6. The economy contracted by two percent in 2011 due to on-going social
tensions in the country, the Euro-zone crisis, and the war in Libya. The slow-
down in Europe had a major adverse impact on tourism receipts (which fell 33
percent in 2011). Strikes and social tensions adversely affected mining exports (such
as phosphates), which fell by 30 percent. FDI inflows, which had already fallen
because of the 2008 global financial crisis, dropped by a further 29 percent. These
negative trends were partly compensated by a nine percent increase in agricultural
production that benefited from favourable rainfall.
7. The economy began a slow recovery in 2012 (3.6 percent GDP growth).
Much of the growth was the result of a rebound in tourism and mining, which were
heavily hit in 2011, and the increased consumption resulting from large public
expenditures on wages and social programs. However, the combination of political
uncertainty and persistent social tensions domestically, as well as weak Euro zone
performance and the continued instability in Libya impaired faster recovery. GDP
growth is likely to be lower in 2013 due to a slow-down in FDI and tourism receipts
due to security concerns.

APPENDIX F SUPPLEMENT INFORMATION ON PILLAR 1
48
8. The fiscal stimulus and monetary relaxation10 to off-set the recessionary
impact of social unrest and the euro-zone crisis contributed to a widening of the
fiscal and current account deficits, and to an increase in inflation. The budget
deficit widened from 3.5 percent of GDP in 2011 to 5.1 percent in 2012 as the
government increased spending on an expanded wage bill, almost doubled food
and energy subsidies to offset higher international prices, and implemented new
social measures, including revamped youth unemployment programs. The planned
stimulus was much more ambitious, but a large volume of planned expenditures
could not be absorbed because of delays in execution of public investment projects
due to social unrest, and weak implementation capacity. The composition of
expenditure centred on wages and subsidies (almost 70 percent of total
expenditures). As noted in the PD for the second tranche of the GOJ DPL: “this
questions the government’s ability to consolidate fiscal expenditures as they seek to
unwind the stimulus over the next few years”.
9. The injection of liquidity by the Central Bank and the fiscal stimulus
contributed to a surge in inflation starting in the last quarter of 2011. Inflation
steadily increased over 2012 (fuelled by increases in international prices of non-
subsidized food and fuel) to reach a peak of 6.5 percent in March 2013 before
stabilizing at 6 percent since August 2013. Against this background, the central
bank reversed the expansionary monetary policy in late 2012, raising the main
interest rate by 25 basis points and publishing two circulars to limit the decline of
foreign reserves.
10. Despite the external shocks, and the fiscal and monetary relaxation,
external debt remains sustainable in the medium term. Public and External debt
are estimated to have increased by 6 percent over 2011-13. Public debt (40 percent
in 2010) increased since the revolution but was contained at 44 percent of GDP in
2011, and 43.7 percent in 2012. External Debt (48 percent of GDP in 2010), 52.8
percent in 2012) remains high but its composition (favourable maturity, 38 percent
owed to multilateral donors and 20 percent concessional) posed limited risk for
debt sustainability.
11. The current account deficit increased to 7.3 percent of GDP in 2011 mainly
due to the sharp drop in tourism revenues and continued to widen in 2012 ( 8.1
percent of GDP) as the improvement in tourism receipts was offset by a rapid
increase in imports (driven mainly by energy), while exports remained stagnant.
The deficit was financed by a recovery in FDI (mainly in the energy sector) and
large inflows of external official financing. External financing needs were large in
2011-12 (in the range of $5.3-$5.4 billion), and much of the required finance came
from official sources and IFIs, reflecting the high cost of accessing private capital

APPENDIX F SUPPLEMENT INFORMATION ON PILLAR 1
49
markets11. In the face of lower reserves (just below 3 months of export by end
August 2013 –See figure F.1.1) and increasing financing needs, Tunisia signed a two
year US$1.75 billion Standby Arrangement with the International Monetary Fund
(IMF) in June 2013.
Figure F.1.1 Current Account Deficit and Gross Official Reserves
Source: IMF data
Table F.1.1: Selected Macro-Economic Indicators
Average 2001-05
Average 2006-10 2011
2012 (estimate)
2013 (projected)
Real GDP Growth Rate (%) 4.4 4.5 -1.0 3.6 4.0
Gross Domestic Investment/GDP (%) 24.9 25.0 24.1 24.5 24.5
CPI (average) % 2.6 4.14 5.0 5.5 5.6
Fiscal Deficit (excl grants) (as % of GDP) -3.3 -2.1 -3.5 -5.1 -7.3
Foreign Direct Investment/GDP (%) 2.3 4.0 0.9 3.9 2.1
Current Account Deficit (as % of GDP)
-2.54 -3.2 -7.3 -8.1 -7.9
Total Public Debt (as % of GDP)
60.44 46.26 44.0 44.0 44.6
Total External Debt (as % of GDP)
66.26 51.8 48.1 52.8 51.4
Source: PD for GOJ-2 DPL Sept 2013; various project appraisal documents
Exchange rate and competitiveness
12. The Central Bank continues to intervene in the foreign exchange market to
limit the movement of the exchange rate. While these interventions have declined
in recent years, exchange rate flexibility is still limited. This policy has allowed
some depreciation of the real effective exchange rate (see Figure F.1.2) which
helped Tunisian exporters maintain their competitiveness through a period of
increased global integration and adverse external shocks.

APPENDIX F SUPPLEMENT INFORMATION ON PILLAR 1
50
Figure F.1.2. Real Effective Exchange Rate (2005-11)
Source: IFS
F.2. Deepening Global Integration
13. In 1995, Tunisia became the first country in the MENA region to sign an
Association Agreement with the EU (AAEU), marking a major step in opening
Tunisia's economy to international competition. A process of gradual tariff
reduction on EU imports was initiated. Tariffs on EU industrial goods dropped
from about 100 percent in 1996 to about 24 percent in 2003. Also, the level and the
number of schedules of Most Favoured Nation (MFN) tariffs were reduced.
14. Improving integration was a core objective of most of Tunisia’s National
Development Plans (NDPs). Higher export growth was seen as critical to the 10th
Economic Development Plan’s (2002-06) objective of boosting economic growth,
employment and incomes. The National Development Plan (2007-11) held greater
integration and exports to be instrumental for achieving its central objective of
transforming the economy to a higher value-added, knowledge intensive one. The
consolidation of the economy and the acceleration of growth through further
efficient integration into the global economy was one of the five axes of the NDP. In
the immediate aftermath of the revolution, the short term objective of the interim
government was to restore economic growth by boosting domestic and foreign
investment. Global integration remained a strategic objective of the 2012 medium
term plan of the interim government.
15. The bank has undertaken useful analytical work over the period (see Box
F.2.1)

APPENDIX F SUPPLEMENT INFORMATION ON PILLAR 1
51
Box F.2.1. Analytical and advisory activities related to Global Integration Issues
The Development Policy Review (DPR) on Global Integration (World Bank, 2008) noted the potential trade diversion and fraud that could result from maintaining differential tariffs on imports from the EU and elsewhere identified the importance of reforms in the on-shore regime and in the non-tourism services sector to bring in more private investment and raise productivity.
The DPR-Towards Innovation Driven Growth (World Bank, 2010) provided an analytic input to the revision of the 10th Development Plan and also in defining the agenda for reforms that formed the basis for the CPS (2010) between the government and the Bank. Global integration was a critical aspect of this transformation. In the area of trade policy, specific recommendations included: reducing non-tariff barriers (NTBs) unilaterally and within a regional framework to enhance regional integration in MENA; negotiating Free Trade Agreements (FTAs) with regional entities to stabilize commercial relations; seeking agreement with regional partners to increase maritime transport links; promoting the establishment of financing mechanisms for trade and investment in MENA and sub-Saharan Africa; and a prudent opening up of the capital account. Other aspects included the policy and regulatory framework for private sector development (PSD), and financial sector reforms (discussed further in this report).
The subsequent DPR Bringing Opportunity, Good Jobs and Shared Prosperity to Tunisians (World
Bank 2013) analyses the performance of exporting firms and the nature of the policy and structural changes required to make exports more competitive and sophisticated.
Technical Assistance to the Tunisian Ministry of transport outlined an action plan to upgrade its infrastructure (ports, storage warehouses etc.) and regulation (for example, customs), and put an end to the fragmentation of logistics services (especially road transport operators, shippers) in order to enable Tunisia compete internationally.
16. The paragraphs below provide detailed evidence of results achieved over
the evaluation period towards deepening global integration along four
dimensions: (i) the foreign trade regime; (ii) the foreign trade facilitation and
logistics; (iii) non tourism services and (iv) the evolution of export and foreign
direct investment.
Foreign Trade Regime12
17. Tunisia has made significant strides towards an open trade regime and
exporters have benefitted from a competitive exchange rate and other incentives,
especially in the off shore sector which continued to profit from an “enclave”
business environment. Effective integration with the EU led to a significant
reduction in tariffs faced by the EU, Tunisia’s largest trading partner. The EU
accounts for 70 percent of Tunisian imports and 80 percent of its exports. Tariffs on
EU industrial products dropped from about 100 percent in the mid-1990s to zero by
2008.
18. The gap in import duties between preferential and non-preferential
partners was reduced, but it is still relatively large. The simple average of MFN

APPENDIX F SUPPLEMENT INFORMATION ON PILLAR 1
52
tariffs was reduced over the years from 34.5 percent in 2002 (compared with EU
preferential tariffs of 24.3 percent) 13 to 16 percent in 201114. The average was 13.5
percent for non-agricultural imports and 37.5 percent for agricultural products. The
average import tariff remains amongst the highest in the Maghreb region and more
than twice as high as the MENA and world averages. The substantial wedge
between the duties on imports from the EU and those from third countries may be
leading to diversion of trade and providing an incentive for fraud (origin of
product).
Foreign Trade Facilitation and Logistics
19. Global integration was strengthened by reducing transaction costs through
improving basic trade facilitation (by reducing inefficiencies in port logistics,
customs clearances and quality and safety controls). Using IT, technical controls
were streamlined and border and customs procedures were improved, resulting in
some savings in time to trade and lower transaction costs. The extent to which these
measures have actually resulted in time and cost savings is debatable. While official
statistics show a reduction in time taken to clear consignments, entrepreneurs
continue to claim that customs procedures remain arbitrary and discretionary
contributing to delays or increased cost of doing business due to the need to spend
“speed money”. Lack of competition from competing ports also contributes to
artificially created queues, another source of increased cost and petty corruption.
20. To help exporters (especially the emerging ones) overcome information and
other market failures inherent in penetrating new markets, various trade-support
institutions, programs, and financing schemes were created. For example, the
Centre de Promotion des Exportation (CEPEX) provides a one-stop shop for exporters,
implements the export promotion strategy under the Ministry of Trade, manages
the computerized trade database, Trade Net, and organizes training missions, in-
country fairs, and exhibitions. The Fonds de Promotion des Exportations (FOPRODEX
or Export Promotion Fund), set-up in 1985, grants loans and transport subsidies to
exporters, carries out international market surveys, assists enterprises with
canvassing and advertising, and helps them strengthen their internal structure.
Despite these improvements, logistic costs still remain high and inhibit exporting.
In particular, there is a shortage of large modern warehouses, logistics platforms,
and efficient logistics service providers.
Liberalization of non-tourism Services
21. Progress in liberalization of services was slow (especially transport) but
some progress has been made recently in the ICT sector. But prices remain high as
Tunisia Telecom continue to charge high prices of the use of its facilities, hindering

APPENDIX F SUPPLEMENT INFORMATION ON PILLAR 1
53
the private sector capacity to compete as it faces higher operational costs. Since
20122, competition has been strengthened in the international telecommunication
and backbone market by the opening-up of access to the landing stations of
international telecommunications cables (currently controlled by Tunisie Telecom).
Also, to enable the wider use of alternative backbone infrastructure, efforts are
being made to permit the three holders (all majority state-owned enterprises) of
alternative fiber optic backbone infrastructure to lease capacity to licensed
operators, as well as to the internet service providers (ISPs) and "private" networks
(e.g. networks of schools, private banks etc.), on a non-discriminatory and cost-
oriented basis.
22. High transport costs (including by air, rail and road) and inadequate
infrastructure in ports remain serious impediments to increased global integration
and economic efficiency. Though there have been some reforms to improve
efficiency of ports, logistics costs are still relatively high.
Growth of Exports and Foreign Direct Investment
GROWTH OF FOREIGN DIRECT INVESTMENT
23. There was a steady increase in the volume of foreign investment since 2000.
The share of FDI in GDP increased from 2.3 percent in 2001-05 to four percent
between 2006-10, before falling sharply to 0.9 percent in 2011 in the wake of the
Euro-zone crisis and adverse developments in Libya and within Tunisia. However,
more than 50 percent of FDI inflows to Tunisia go to the energy sector while FDI
inflows into manufacturing go predominantly to the low value-added textile and
clothing, and mechanical and electrical sectors. Furthermore, FDI inflows are
mostly in the offshore sector, which is largely disconnected from the rest of the
economy.
EXPORT GROWTH
24. Exports of goods and services averaged about 49.4 percent of GDP during
2006-10, up from 47.7 percent in 2001-05. Exports performed reasonably well in
2000-10, growing at an annual average rate of 4.3 percent. However, during the
period under review (2005-13), the performance of exports deteriorated compared
to the first half of the decade. The average yearly growth of exports during 2005-10
was only 4.1 percent compared to 4.4 percent in the preceding five year period.
Almost 40 percent of the growth in exports during the decade was due to exports of
the electrical machinery sector, largely the production of components for European
car manufacturers. Exports of mineral fuels accounted for another 20 percent of the
growth of exports. The volume of exports fell by 1.5 percent in 2011 and 1.0 percent

APPENDIX F SUPPLEMENT INFORMATION ON PILLAR 1
54
in 2012, reflecting the slow-down in the European market, which constitutes about
three quarters of Tunisian exports15. Cross-country comparison of GDP growth and
export growth also suggests that exports from Tunisia underperformed relative to
the rest of its economy, and that exports played a smaller role as drivers of growth
in Tunisia than in other economies.
EXPORT MARKET DIVERSIFICATION
25. Tunisian exports became slightly more diversified during the period
under review. In terms of direction of trade, while exports to the EU remained
predominant, their share in total exports fell from about 81 to 76 percent between
2005 and 2012. This fall not only reflects the relative slow-down in Europe, but also
a decline in the market share of Tunisian exports in total EU imports. The share of
imports from Tunisia in total EU imports fell from an average of about 0.66 percent
in 2001-05 to 0.55 percent in 2010-12, a decline of almost 17 percent. This decline
reflects the impact of the dismantling of the multi-fiber agreement completed in
2005 on exports of the apparel, textile and footwear sector.
26. The share of exports to other, major trading partner countries in the region
such as Libya, Algeria, and Morocco increased somewhat, but the overall share of
Maghreb partners still remains about 8 percent of total exports from Tunisia.
Exports to fast growing Asian countries or to the U.S. remain very low: China and
India, two of the largest and fastest growing economies account for about 2 percent
of total exports, as does the U.S. This pattern of trade highlights not only the
continuing vulnerability to economic slow-down in Europe, but also the enormous
potential in hitherto untapped markets.
PRODUCT DIVERSIFICATION16
27. Product diversification, as measured by different indicators, increased
over the last decade. While Tunisia exported approximately 2,200 products in year
2000, it exported 2,600 products in 2010. Export diversification is also reflected in
the decline in the Herfindahl index17 from 0.13 percent in 2000 to 0.10 in 2010. This
trend is also confirmed by the substantial improvement in the Index of Economic
Complexity18 over the last decade.
28. While the diversification of exports suggests a successful response of
exporters to increased competition, empirical studies of Tunisian exports suggest
worrying tendencies. First, the impact of export diversification on the economy is
limited because much of this production of sophisticated and diverse products is to
a large extent simple assembly of various more or less sophisticated imported
intermediary inputs. To this extent, these activities have limited value-added and

APPENDIX F SUPPLEMENT INFORMATION ON PILLAR 1
55
very little impact on the employment of a skilled and educated labor force. Second
small exporters are more likely to die and hardly ever grow large. And third,
almost all export growth in recent years has been due to entry of newly established,
foreign-owned firms. The contribution of domestically owned firms to export
growth was close to zero.
F.3. Improving the Business Environment
29. Between 1996 and 2002, the Bank supported these objectives through three
Economic Competitiveness Adjustment Loans (ECALs), which were meant to open
up the foreign trade regime, create a more business friendly environment, open
investment activities to the private sector (such as in telecom) and promote the
development of an efficient financial sector. Yet, domestic private investment
actually fell between 2000 and 2005 despite Bank support to improve the
investment climate.
30. Over the evaluation period, the Bank continued to support some measures
to liberalize the investment climate. The scope of activities that required prior
authorizations from the government before private sector participation was to be
somewhat reduced; accelerated value-added tax (VAT) reimbursement was
extended to cover more private firms; and to facilitate market entry, the
Competition Council’s authority and autonomy was to be enhanced. Some results
were obtained: the coverage of prior authorizations that were required for private
investment was reduced from 225 at the beginning of the period to about 48
activities at present. All companies with certified accounts were made eligible for
advanced VAT reimbursement.
31. But domestic private investment performance was poor. The share of
private investment to GDP was 14.6 percent in 2001. It fell to 12.8 percent in 2005,
but despite the recovery since then, it is still averaging no more than 14 percent.
Tunisia’s domestic private investment performance pales compared to East
European competitors (18-19 percent in Bulgaria and Romania), fast-growing East
Asian countries (28-30 percent), and many MENA countries (Morocco 25 percent in
2007)19 . This is in contrast with FDI evolution which rose from an average of 2.3
percent of GDP in 2001-05 to about 4 percent in 2006-10, before falling to 0.9 percent
of GDP in 2011 due to the political uncertainties. FDI increased by 85 percent
between 2011-12 and by 38 percent 2010-12. Forty-six percent of FDI inflows went
to the energy sector.
32. According to Doing Business, Tunisia’s ranking evolved from 58th place (out
of 155 countries) in January 2005 to 55th place (out of 183 countries) by June 2010
APPENDIX F SUPPLEMENT INFORMATION ON PILLAR 1
56
and to 50th place (out of 185 countries) by June 2012 (See Appendix I). The World
Economic Forum’s Index of Competitiveness20 shows a similar trend, with Tunisia’s
country ranking improving between 2003-04 (when it was 42nd among 104
countries) and 2011-12 (when it was 40th out of 142 countries). Tax avoidance and
the weak protection of investors were Tunisia’s weakest points in the World Bank
Doing Business ranking. Worldwide, as well as relative to more developed
neighboring countries, Tunisia compares very well in international trade rules and
ease of closing business, and reasonably well in respect of starting a business,
registering property, and contract enforcement. Rigidity of firing laws, which is the
result of deliberate labor-protection policy, and not a symptom of regulatory
weakness, is also a weak point for Tunisia in the Doing Business ranking.
33. The review of implementation completion report (ICRR) of ECAL 4 rated
outcomes in the PSD agenda to be moderately unsatisfactory, based on under-
performance in terms of the volume of on-shore and off-shore investments during
the period as well as the modest improvement in Doing Business indicators. The
ICRR of ICL rated the efficacy in achieving the business environment and
competitiveness objective ‘modest’.
34. One cause for this poor result is the failure to address the most binding
issues and, in particular, the duality between the “on-shore” and “off-shore”
regime. Wholly exporting firms were given an “enclave” business environment
with minimal state intervention and regulation, duty-free raw material and
equipment imports, 10-year corporate tax holiday, free repatriation of profits and
trade facilitation services (e.g., “in-house” customs clearance). Firms can, in
principle, switch between the onshore and offshore regimes, but that is rare in
reality. Offshore status does not imply foreign ownership; in fact, a majority of
offshore exporters are domestically owned. Although a slight majority of exporting
firms are onshore, more than three quarters of overall exports are due to offshore
firms (Source: 2013 draft DPR). Removing this dichotomy, set up in the early 70s,
was discussed as early as the 2000 CAS, but no progress was made. The
government asked for a deferment of the progressive dismantling of the dual
regime until 2008. There has not been much forward movement even five years
later21.
IFC Investment
35. IFC supported private sector investment in the manufacturing and energy
sectors, as well as in infrastructure and health.

APPENDIX F SUPPLEMENT INFORMATION ON PILLAR 1
57
INFRASTRUCTURE
36. IFC provided funding to a special purpose company established to build a
new Airport at Enfidha, upgrade the Monastir airport and operate both on a 40
year BOT concession. Monastir international airport, the gateway to Tunisia’s
main tourism areas (Hammamet/Nabeul and Sousse/Monastir), was already
operating at more than full capacity and could not be expanded on-site. Enfidha is
90 kms south east of Tunis..
Despite amendments to the concessions agreement, the financial equilibrium of the
project is still to be achieved..
ENERGY
37. IFC’s energy investments focused on exploration and development of oil and gas. ).
MANUFACTURING
38. IFC’s support to manufacturing focused on the production of printed circuit
boards for use in manufacturing automobiles. All production is meant for export,
mainly to Europe. IFC’s investment was negatively impacted by the recession in
Europe.
F.4. Improving Financial Sector Efficiency
A glance at the financial sector
39. Commercial banks dominated the financial system accounting for close to 70
percent of its total assets. The rest of the financial sector comprised specialized
banks (3 percent), insurance companies (3.4 percent), pension funds (6.5 percent)
and other institutions (17.4 percent).
40. The state run Banque Tunisienne de Solidarité (BTS) is a micro-finance
provider which lends to about 100 associations to lend on, in turn, to micro-
borrowers. ENDA Inter-arabe is a microfinance NGO based in Tunisia. It currently
operates as the local branch of a Belgian NGO. It is presently the only private
sector institution that provides commercially sustainable micro-credit. Its main
source of funding is long term loans.
AAA Analysis and Recommendations
41. The 2006 FSAP made a number of recommendations to improve the
soundness of the banking system, but a large number of the recommendations
were not implemented. For example, a measure to prohibit distribution of
APPENDIX F SUPPLEMENT INFORMATION ON PILLAR 1
58
dividends in banks with inadequate provisioning was not implemented. Tax
deductibility for encouraging partial write-offs to reduce NPLs was also not
implemented. Nor was there an effective restructuring of bank loans to problem
sectors (like tourism). Supervision of banks, especially on-site supervision,
remained weak.
42. The Policy Note on SME Access to Finance (FY10) focused on the reasons
why SMEs were constrained by lack of finance and its high cost22. The Note made
recommendations to improve financial transparency of SMEs, enhance the
availability and quality of information, continue efforts to reduce NPLs, simplify
procedures for lending, and improve the functioning of the stock market and the
venture capital market.
A tourism debt restructuring analysis (FY12) was undertaken by the Bank and IFC. Based on the Bank-IFC diagnostic, an action plan was proposed, which is currently under serious consideration by government. One of the recommendations is to create a "special purpose vehicle"
43. for the distressed assets of Société Tunisienne de Banque (STB) or to transfer all
banking sector distressed assets from the tourism sector to asset management
companies.
44. The follow up FSAP (2012) noted that over the period, loan quality,
solvency, and profitability of banks had deteriorated, and weaknesses in
underwriting had led to inappropriate lending to well-connected borrowers. The
report noted the deterioration in the quality of banking supervision by the CBT
during 2006-11. While prudential regulations were strengthened, no on-site
inspections were carried out since 2006. The 2012 FSAP recognized that the banking
sector may face large recapitalization needs to cover past losses, and reiterated the
need for improving governance of state owned banks and restructuring of their
balance sheets.
45. The FSAP (2012) made a number of recommendations incorporating
guidance already provided in a number of policy and technical notes prepared
during FY10-12. These included: Policy Note on Financial Sector: Toward a Better
Governance and High Performance (FY11); Technical Note on Corporate
Governance in Private Banks (FY10) which identified the deficiencies in bank
corporate governance practices and suggested recommendations for
improvements; and the Note on Restructuring Tourism Sector’s Debt: Proposed
Action Plans (FY12). The report recommended strengthening supervision by
introducing and enforcing stricter regulatory and reporting requirements
referencing loan classification, assets and collateral valuation and provisioning,

APPENDIX F SUPPLEMENT INFORMATION ON PILLAR 1
59
and compliance with international best practices. A comprehensive capital market
reform was also proposed.
IBRD Lending
46. The ICR Review (March 2008) of ECAL 4 rated achievements in the financial
sector (as well as overall outcomes) moderately satisfactory. The ICR Review (July
2012) of the ICL rated the efficacy of achieving financial sector objectives modest
and the overall objectives moderately unsatisfactory. In the financial sector, “...
there were noticeable improvements in the health of the financial sector with regard
to facilitating private investment from the domestic stock market and from a
relatively more healthy banking system, although progress was less clear regarding
the development of venture capital funds and micro-finance institutions”. The ICR
of the GO DPL (December 2012) found significant progress had been made in
financial sector reforms.
47. In this evaluation, we have looked at the following main outcomes that
would demonstrate financial sector reforms helped promote greater financial
intermediation: (i) greater mobilization of domestic savings in financial
institutions; and (ii) improved access of credit to the productive sectors. Results
were disappointing on both accounts.
(i) Savings mobilization
48. There was very little progress in mobilizing savings. One measure of
savings mobilization in the banking system is the share of quasi-money23 in GDP.
A broader measure of savings that includes demand deposits as well as time and
other deposits is broad money (M2 in Table F.4.1. below). This indicator also
confirms that there was very little progress in mobilizing savings between 2000-04
and 2005-10. There was however some improvement in 2011 and 2012. ). Savings
mobilization in banks in Tunisia was lower than in some other countries in the
region for example, Egypt, Jordon, Lebanon and Morocco24.
Table F.4:1 Financial Intermediation: Impact on Domestic Savings Mobilization (in percent of GDP) 2000-04 and 2005-12
2000-04 2005-10 2005-11 2005-12
Money 23.8 23.7 24.6 24.7
Quasi Money 33.8 34.3 34.8 36
Broad Money 57.7 58 59.4 60.7
Source: IFS: Money (line 34); Quasi-money (line 35); GDP (line 99b).

APPENDIX F SUPPLEMENT INFORMATION ON PILLAR 1
60
(ii) Credit allocation
49. Progress in financial intermediation was no better in terms of credit
allocation. In fact, the share of domestic credit in GDP fell from an average 67.6
percent in 2000-04 to 63.7 percent in 2005-10. Though domestic credit allocation
improved in 2011, its share of GDP in 2005-11 was below the level achieved in 2000-
04. Similarly, reforms did not improve access to credit for the private sector. The
share of claims on the private sector in GDP fell from an average of 61.7 percent in
2000-04 to 57.9 percent in 2005-10. The performance improved in 2011, but the share
of credit to the private sector during 2005-11 (60 percent) remained below what it
was in 2000-04. While Tunisia performed better than Algeria, Egypt and Libya in
2009-10, its record was worse than of Jordon, Lebanon and Morocco.
Table F.4.2: Financial Intermediation: Impact on Credit Allocation (in percent of GDP) 2000-04 and 2005-12
50. The level of Non-Performing Loans (NPLs) was reduced from 21 percent of
gross assets in 2005 to 13 percent by end 2011. As acknowledged in the 2012 FSAP,
part of this decline may have been due to a circular from the Central Bank (CBT),
issued in mid-2011 that allowed banks to reschedule loans due from companies
hurt by the political turmoil in 2011. It is estimated that re-classifying these
rescheduled loans as non-performing would add another 5 percent to the overall
NPL ratio.
51. It is too early to assess the full impact of the most recent reforms undertaken
since 2011 notably :
In the banking sector, new prudential rules were adopted which required :
increasing the minimum solvency ratio to 9 percent by end 2013 and to 10
percent by end 2014; increasing the risk weighting factor from 100 percent to 300
percent for risks in excess to the risk division rules; restricting large exposures
by lowering the standards of 5 times the net capital for loans exceeding 5
percent of the capital to 3 times that level and from 2 to 1.5 times for loans
exceeding 15 percent of net capital; and lowering the threshold from 3 times to 1
time the capital on outstanding loans granted to officers, directors and
shareholders whose shareholding exceeds 10 percent.
2000-04 2005-10 2005-11 2005-12
Domestic credit 67.6 63.7 65.8 n.a
Claims on Private Sector 61.7 57.9 59.9 n.a
Source: IFS: domestic credit (line 32) claims on private sector (line 32). GDP (line 99b).

APPENDIX F SUPPLEMENT INFORMATION ON PILLAR 1
61
In the security market, the law governing venture capital and mutual venture
funds was amended to: (i) encourage venture capital companies’ risk taking by
eliminating pre-determined exit conditions and basing exit from financed
projects on the performance of the venture capital company at the time of the
exit; (ii) simplify taxation of venture capital companies; (iii) encourage venture
capital companies to invest in regional development areas; (iv) eliminate the
requirement that mutual venture funds must liberate the totality of the
subscribed funds in order to benefit from tax exemption.
F.5: Modernizing Infrastructure – ICT and Transport
ICT
Background
52. World Bank Group-wide strategy for ICT (2001) called for advancing sector
reform by : (a) broadening the focus across all ICT components (including the
postal sector); (b) creating an enabling environment for e-commerce and e-
government; (c) strengthening policy and regulatory institutions to implement
sector reform; (d) promoting growth, efficiency, quality, and innovation through
competition and private sector participation; and (e) promoting access to
information infrastructure with a special focus on rural communities.
53. In 2001, government, working in partnership with the Bank, prepared and
issued a national ICT strategy paper. In 2003, at government’s request, the Bank
carried out a study on private participation in infrastructure (PPI) that included a
chapter on telecommunications and information technologies. Both AAA were
instrumental in the design of the ICT project approved in 2004.
54. At end 2003, mobile penetration (number of mobile subscribers per 100
inhabitants), was less than 20 percent (compared, for example, with over 24 percent
in Morocco, and 65 percent in Estonia). Similarly, Tunisia had 0.27 Internet Hosts
per 10,000 inhabitants, while Egypt had 0.49 and Lebanon had over 21.
International bandwidth capacity was also lower than regional benchmarks. For
example, the highest link-to-link international connection was Tunis- Palermo with
40 Mbps, while the Rabat-Palermo capacity was 68 Mbps; Rabat-Paris was 76 Mbps.
Also, the total connectivity measure (TCCM) was 63%, which was lower than
Lebanon with 98% and Jordan with 79%, and about equal to Egypt’s.
55. Over the evaluation period, some progress was made to reform and
modernize the ICT sector. But overall, the telecom sector is less open to competition

APPENDIX F SUPPLEMENT INFORMATION ON PILLAR 1
62
than most countries in MENA and Tunisia lost ground over the last 10 years in the
area of broadband internet. The government adopted a list of measures described in
Box F.5.1.
Box F.5.1. List of measures adopted in the ICT sector.
These measures include:
granting of eight licenses to three operators, including a global license (mobile and fixed phones as well as internet) awarded to Orange Tunisie, the first of its kind in the region. Subsequently, two more global licenses were awarded;
divestment by government of 25 percent of its capital in Tunisiana to private operators; allowing enterprises with their own fiber-optics installations (STEG and SNCFT) to
make such services publicly available, at prices and technical standards approved by government;
liberalization of the domain “.tn”, with less administrative procedures to register and host “.tn” websitesa, and the extension of the number of subjects that can be Domain Name registrars;
introduction of technical guidelines to encourage government websites to include citizen feedback loops using ICT-enabled social media, such as Facebook; and (vi) authorization to internet service providers to offer telephone services over the internet (VoIP). They are no longer required to go through the national internet agency (ATI) for internet traffic.
a/ However, the impact of the liberalization is not always clear. For example, there seems to still be reluctance by many users to use the domain ‘tn’, for lack of what is called “confiance numérique”, that is, the perception that emails with the ‘tn’ domain may be potentially subject to review by authorities. Such users, including some NGOs, prefer to use a domain based in other countries.
56. As a result, fixed and mobile penetrations have improved reaching 118
percent in 2010, up from 32 percent in 2003, and higher than the 109 percent target.
The high penetration does not mean that, on average, there is more than one fixed
and mobile phone per person, but that many people have more than one account,
by having sometimes multiple SIM cards (and therefore multiple phone numbers)
that are used with one single mobile phone.
57. Following the removal of restrictions and controls on internet access after the
revolution, the projected demand for additional websites and related content is
expected to generate, over at 5,000 – 8,000 jobs in the short term and this could be
sustained and increased on a long term basis.
Table F.5.1. Major Outcome Measures, ICT
Objective Baseline
2003-2004 Results
2011-2013
Increase in the share of ICT sector in GDP to reach 7% in 2008
5% Estimated at 10-11%
(assessed at 9.2% in 2008)
Fixed & mobile telephone lines (as % of pop), to reach 60% by 2008
32% Substantially over 100 %

APPENDIX F SUPPLEMENT INFORMATION ON PILLAR 1
63
% of population using the internet to reach 30% by 2008
6% 39% (2011)
No. of internet hosts based in Tunisia, to reach 4,000 by 2008.
1,625 20,000
Source: CASCR; and WB Infrastructure and Poverty Data Base.
58. Despite the increase in competition, prices remain high. The cost of
international calls from Skype (from the US) to Tunisia is higher than practically all
countries in the region (as noted in Chapter 3 – Fig 3.1.). As noted earlier, Tunisia
Telecom continues to be the dominant player and to charge high prices for the use
of its facilities, hindering the private sector capacity to compete.
TRANSPORT
59. Bank supported the government through the Transport Sector Investment
(TSI) APL.
Phase 1 (TSI-1) of the project focused on: restructuring port services and
promoting private investments; setting up a new cargo handling organization
and supporting new port facilities under BOT schemes; commercializing the
railway parastatal and giving it financial autonomy; and promoting the use of
lead gasoline and cleaner diesel to reduce pollution.
Phase 2 (TSI-2) was directed towards improving the regulatory framework,
facilitating exports, and improving infrastructure and urban transport in general
through an appropriate institutional framework.
60. Results are discussed below.
Port management
61. Port reforms were implemented mostly before 2005. The monopoly of
longshoremen was abolished, and the port landlord model was adopted25.
Concessions of specialized terminals in 2005 paved the way for private investment
in the existing container facility at Radès (that serves mainly roll-on, roll-off vessels)
and La Goulette Passenger terminal. However, the full implementation of the
“Landlord Port” model (which will entail the concessioning of handling and
storage functions in secondary ports and new terminals in Radès by the port
authority (Office de la Marine Marchande et des Ports - OMMP) to broaden
competition) has not yet been completed. Currently, the state-owned company,
Société Tunisienne d'Acconage et de Manutention (STAM), is still dominant in cargo
handling and has a monopoly in Radès port. Some further improvements to the
regulatory and institutional framework were implemented in recent years. These

APPENDIX F SUPPLEMENT INFORMATION ON PILLAR 1
64
measures include introducing competition between a state owned and a privately
owned company in stevedoring services in all ports (except Radès), and
improvements in logistics facilitation, with the introduction of online,
computerized import documentation. The government’s plan to develop a deep
water port in Enfidha via PPP failed to materialize. Instead, the government is
currently planning for an expansion of the Radès port with the addition of a
specialized container terminal which will be partly financed by the private sector
though a BOT concession.
Railways
62. The objective of commercializing the railway parastatal to make it financially
autonomous through institutional changes was not achieved, as reforms to provide
autonomy were launched but not completed. The expected increases in
productivity and profitability of railway operations in the transport of phosphate
did not materialize - the cost of carrying phosphate dropped only marginally
between 2005 and 2009. The 20 percent improvement in staff productivity between
2005 and 2010, gained as a result of down-sizing, has recently been partially
reversed. As a means of increasing stable employment, the government instructed
the railway parastatal to suspend outsourcing of services and include the persons
providing the services in the payroll of the railways instead. The sharp decline in
phosphate transport26 by rail in recent years further impacted the parastatal’s
finances.
Urban Transport
63. There was some improvement, but also deterioration in the efficiency of
public transport operations. Thanks to staff reduction, there were large gains in
productivity in the bus company (“Société de Transport du Sahel” / STS). The number
of riders per bus staff increased from 60 in the beginning of the period to 87 in 2009.
However, as noted above, such gains have largely been erased in the last couple of
years. There were no gains in the other two bus companies ( “Société des Transports
de Tunis” SNT and “Société Régionale de Transport du Gouvernorat de SFAX” Soretras),
and all three bus companies experienced a decline in fleet availability during most
of the period due to delays in acquiring new buses. Overall, public transport’s share
of total motorized trips fell short of objectives (33 percent versus 50 percent).
64. Overall subsidies to urban transport companies remained about the same,
due to reductions in support to “Société Régionale de Transport de Gouvernorat”
SRTG27 that were balanced out by increases for SNT. Subcontracting of urban
transport services to private operators showed some gains in Tunis in the first part
of the review period (from 0 percent of bus-km in the mid-2000s to 7.1 percent in
APPENDIX F SUPPLEMENT INFORMATION ON PILLAR 1
65
2009), but such gains have practically disappeared since 2010, as the government
has requested that outsourced services, mainly cleaning and security, be cancelled
and taken over by the parastatal company. There were no gains in regional cities
served by the SRTG, because the Ministry of Transport did not open urban
transport services to private operators.
65. No legislation was passed to ensure proper rules for financing urban
transport activities with compensation for public service obligations (PSO). The ICR
for the project noted as especially disappointing the failure to create a formal urban
transport coordination, management and regulation mechanism in Greater Tunis.
F.6. Agriculture Performance
BACKGROUND
66. The sector is dominated by smallholders, 75 percent of farms each averaging
less than 10 ha (2005 data)28. Between 1961 and 2005, average farm size went from
16 ha to 10.2 ha. Farm fragmentation has continued unabated, with farm sizes of 5
ha increasing from 41 to 54 percent of total arable land. These small farm sizes
occupy only 11 percent of total arable land while 3 percent of farmers, farm size of
50 ha each and up, own 42 of total land (2004-05). The state of Tunisia (terres
domaniales) owns 10 percent of land, a major portion of which it leases to Sociétés de
Mise en Valeur et de Développement Agricole (SMVDA) and to agricultural technicians.
Absenteeism is widespread as it affects some 40 percent of farms29. The “suspicion”
is that out-of-date or “frozen” titles and land without any title, are widespread30.
67. According to the WTO, Tunisia’s trade reforms in the 1990s-2005 have not
“substantially liberalized trade” (World Bank, July 2006: viii). However, a few
measures were taken by the early 2000s after two policy loans--ASIL I (1993-2000) &
II (1997-2002) which themselves followed two other structural adjustment loans,
ASAL I & II (1986-95)31. The government undertook agricultural liberalization
reforms primarily in terms of reducing/removing subsidies to farm inputs such as
fertilizer, animal feed, seed, irrigation and mechanized services but there was no
liberalization in food marketing32. The importation and marketing of cereals
continued to be handled by the monopoly Office des Céréales (OC). Prices and margins
throughout the wheat marketing chain remained under the control of the OC as the
GOT sought to protect domestic food and agriculture production (primarily against
subsidized EU agriculture and food imports) while also keeping prices low and
stable for urban consumers. GOT also fixed prices and margins in non-cereals
markets; e.g., fruit and vegetables were subject to informal GOT price controls33. For
tomato concentrate (an important consumption item) (tomate de transformation), there

APPENDIX F SUPPLEMENT INFORMATION ON PILLAR 1
66
is an official reference price at the beginning of every season34. These price controls
were an important component of government food security policy as government
negotiated the prices of selected basic food prices at consumer level (e. g., sugar,
vegetable oils, milk). These price controls on basic consumption items—cereals and
non-cereals—typically favored consumers over producers.
68. By the early 2000s, agricultural tariffs remained high (by regional and world
standards). For example, preferential tariff rates (2005) with the EU (in percent) were
for: Agriculture: 63.5, range: 0-150; Dairy: 94.2, range: 0-150; Cereals: 45.1, range: 0-
100; Coffee, tea, sugar, etc.: 67.7, range: 0-150. MFN tariff rates for the same
commodities were: Agriculture: 66.8 range: 0-150; Dairy: 95.3, range: 15-150; Cereals:
45.3 range: 0-100; and for Coffee, tea, sugar, etc.: 72.1; range: 0-15035. For agricultural
exports, GOT negotiated quotas with the EU under the Association Agreement
(effective since March 1998, signed July 1995) to promote exports of fruits and
vegetables for which Tunisia has comparative advantage. For these, e.g., olive oil,
fruits and vegetables, taxes were eliminated although there was still substantial
control in other ways. For example, the Office Nationale des Huiles, ONH, lost its
monopoly in 1994 but still control the allocation of quotas to the private sector36.
69. A major rationale for government’s extensive control of the sector is the
sector’s strategic environmental and socio-economic importance. Agriculture,
largely rain-fed and semi-arid, is vulnerable to highly variable rainfall and
increasingly frequent droughts.37 It uses some 82 percent of mobilized water
resources; contributes to 18 percent of total employment (for comparison, public
administration contributes to 23 percent and manufacturing to 19 percent of total
employment), 10-11 percent of total merchandise exports or 25 percent of
agricultural GDP; and is afflicted with higher rates of poverty. The Northwest is
home to watersheds which supply around 80 percent of Tunisia’s water resources,
and is also has more than half of Tunisia’s forested areas38.
70. Agriculture has higher rates of poverty as the poverty rates for the North
West and the Center West are 10 and 29 percent (2005) respectively, in comparison
to the 5-7 percent for the Center East and Grand Tunis region, and a national
average of 11.8 percent, revised from 3.8 percent39. This higher poverty rate has
contributed to significant rural-urban migration. Agriculture’s contribution to GDP
has remained fairly flat at around 13 percent of GDP from 1980 to 200040 then
declining slowly to 12 percent by 2005. The various rainfall-driven shocks to the
agricultural sector (13 percent of GDP and 18 percent of employment) over the last
10 years significantly affected growth, as in 1999, 2002 and 200441.

APPENDIX F SUPPLEMENT INFORMATION ON PILLAR 1
67
RESULTS
71. There was no significant liberalization of food marketing during the
period under review. As pointed out by knowledgeable Tunisian counterparts42,
the period under review was highly unfavorable for government to undertake
liberalization reforms. In fact, the overall socio-political environment could hardly
be more inimical to food price and marketing liberalization. There was first the food
price crisis (2007-08)43 then the financial crisis, (2008-09) which hurt the EU and its
purchasing of Tunisian exports; the global food price crisis again (2010-11)44 , the
Revolution (2011); and then inflation accelerating from 3.5 to 5.7 percent (y-o-y,
April 2011-12) reflecting higher food prices due in part to increased demand from
Libya45. With the crisis unleashed by the Revolution, the downturn in the economy
in 2011 and a dramatic rise in unemployment, maintenance of social peace and
political stability has become the top priority.
72. In the all-important cereals market, the Office des Céréales (OC) remains
the implementing agency for GOT price and marketing policy. It is the sole
importer of cereals except for barley. It controls all the prices and margins from
farm production to final sale. The market for collection and storage of cereals has
been opened recently to selected private brokers (mandataires agrées) which operate
at prices and margins determined by OC46. Cereals producer prices were raised
following the food price crisis of 2007-08 while consumer prices were kept low47.
Thus the producer prices of durum, bread wheat and barley were raised in 2008/09
(see text table below), and since then, every year, by 3-5 dinars per quintal.
Interviews with Tunisian counterparts noted that at the same time, consumer prices
have remained constant. Prices of other non-cereals basic consumer items (e.g.,
vegetables oils, sugar, dairy products) are no longer directly controlled by the GOT
but they still have to be negotiated with and agreed to. Fruits and vegetables for
which prices are supposed to be market determined are also controlled in an ad hoc
manner. For example, in the wholesale market in Tunis, representatives of the
MOT check prices every day48.
73. With respect to the competitiveness of its main agricultural exports
(mostly to the EU)49 for which Tunisia has already preferential access to the EU
market, Tunisia was still not able to fulfill its quotas; e.g., for olive oil, 92 percent
of which go the EU, only 79 percent of the quota is used; for oranges, 60 percent50.
The problem of poor quality, largely due to government price controls; e.g., olive
oil and oranges, is long standing51. Internal price controls and inadequate support
services continue to undermine incentives for quality production.

APPENDIX F SUPPLEMENT INFORMATION ON PILLAR 1
68
74. Agribusiness is still affected by distortions that do not help the
development of an export-oriented industry. Although the government has taken
measures to help upgrade the sector, such as creating the Bizerte technopole in 2010,
agriculture and agribusiness share in exports has fallen from 12 percent in 1993
down to 8 percent of exports in 2010. Support policies have created a bias that
favors import markets at the expense of exports. There is also strong protection of
agricultural goods at the border (beef, lamb/mutton and wheat), domestic price
controls for agricultural goods (cereals, milk, sugar beets and tobacco) and
subsidies on agricultural inputs (chemical fertilizers, pesticides and water). While
these measures protect producers against fluctuations in world prices52, they do not
provide the necessary incentives to be competitive53. Except for its Agreement with
the EU, there is no evidence that this situation vis-à-vis other trading partners has
changed. Both the EU and Tunisia consider agriculture to be a “sensitive” sector to
be shielded from reciprocal liberalization. In fact, the differential liberalization
between EU and non-EU products has accentuated the distortions in the tariff
regime, widening the wedge between EU and non-EU products, thus increasing
incentives for fraud (See Chapter 3)54.
75. Largely as a result of the poor policy environment, agriculture is characterized
by “low profit margins with prices informally capped by government directive and
declining terms of trade for the sector”55. Output prices remain controlled while
input prices have been liberalized in the late 1990s (under the ASALs and ASILs) and
have risen over the years. Productivity of major commodities is low; e.g.,
productivity of cereals and dairy cattle is not only low but represents a loss of
resources to the economy. (World Bank, July 2006: vii, 9-10)56. For example, domestic
resource cost57 estimates for soft wheat ranges from 1.8 – 3.3; for milk from 1.06 - 2.1
(depending on the yield and price scenarios)58. For decades, there have been no
significant long term upward trends in cereals yields (interpreted as a proxy for
productivity) which fluctuate sharply depending on the availability of rains.59
Tunisia’s two largest agricultural products, cereal and olives, depend on the level
and variability of rainfalls each year. The graph below displays the variability in
cereals yields/production (only about 7 percent is irrigated) over a long period.

APPENDIX F SUPPLEMENT INFORMATION ON PILLAR 1
69
Figure F.6.1. Production and Yield of Wheat and Barley (1993-94 – 2010-11
Source: USDA
76. Moreover, the gap in
performance has widened.
Agricultural productivity is
significantly lower than in other
countries with a large agriculture
sector (See figure F.6.2). Yet as has
been frequently pointed out, crops
for which Tunisia has a strong
comparative advantage-e.g., fruits
and vegetables, Tunisia cannot
fulfill its quotas with the EU;
whereas crops for which it has a
comparative disadvantage, Tunisia
is subsidizing and using its scarce
water resources.
BANK ANALYTICAL WORK
77. The Bank undertook four
pieces of analytical and advisory
work during this review period
(2005-12) all responding to the
government request on how best to
exploit the potential of agriculture
Figure F.6.2. Agricultural Performance Gap
Source: Agriculture Policy Note (World Bank, 2013)
4000
8000
12000
16000
20000
24000
1990 1995 2000 2005 2010
Agriculture
Industries Manufacturières
Total (Activités marchandes)
Services Marchands
Productivité dans l'industrie et l'agriculture
valeur ajoutée par travailleur (constant 2005 DT)
0
4000
8000
12000
16000
20000
24000
28000
32000
1990 1995 2000 2005 2010
Productivité agricole : comparaison internationale
valeur ajoutée par travailleur (constant 2000 US$)
Espagne
Italie
Portugal
Turquie
Tunisie
US $

APPENDIX F SUPPLEMENT INFORMATION ON PILLAR 1
70
so the sector maximizes its contribution to the economy and increase agricultural
productivity. But these recommendations were not followed. Box F.6.1. below
briefly presents Bank main recommendations.
Box F.6.1. Bank analytical work in the agriculture sector
Tunisia Agriculture Policy Review (July 2006): The question was: “How could government help the farm sector realize its potential more completely?” The Bank’s answer through its report was that GOT’s interventionist approach of its food security policy is not only making agriculture non-competitive but its growth is a cost (resource drain) on the rest of the economy. To make agriculture more productive and competitive, it advocated a fundamental reorientation of GOT approach to food security, the removal of pervasive controls on prices and margins, and the creation of an environment within which supply chains would be responsive to consumer demand, in terms of scale and quality. To counteract possible adverse short term impact of liberalization on the poor and food-insecure populations, it advocated establishing a system of targeted food assistance and a food reserve stock for emergencies. More broadly, it advocated the GOT focus on delivering public goods and services instead of controlling private sector margins and prices along the value chain.
The update of the agriculture policy review (June 2009) focused on the functioning of cereals market and elaborated on the same message. It emphasized not only the need to liberalize but also to invest in research and extension so as to increase productivity of cereals cultivation, as increased productivity is the bedrock for increased food security. It also advocated developing risk management instruments for smallholders and a targeted system to assist the basic cereals consumption needs of the poor and vulnerable. The June 2009 update evaluated the structure and determinants of comparative advantage of selected commodities of major importance to Tunisia under alternative price and yield scenarios. In particular, it pointed out that cereal cultivation, a land- and water-using crop, is of low value. In view of the relative resource endowment of agriculture, much of cereal cultivation is not the best use of these scarce resources. Again it emphasized that the productivity of much of cereal cultivation needs to increase if Tunisia wants to strengthen its food security.
The Agricultural Finance Study (May 2012) emphasized the fact that the poor policy environment has been largely responsible for agriculture being a low productivity and low profitability sector. This problem has to be solved before agricultural finance can expand and make a contribution to the growth and productivity prospects of the sector. It argued that under the current controlled system, the GOT is unlikely to be able to modernize agriculture, increase its competitiveness and its export earnings.
The latest report: Tunisia in a Changing Climate (November 2012, recently reissued in March 2013) also stressed the urgency for the GOT in reshaping its food security policy, this time from the point of view of climate change. The increased stresses expected of a drier and hotter climate, with greater variability in precipitation by 2050, will require that the GOT fundamentally rethink the allocation of its increasingly scarce water between agriculture and the rest of the economy.

71
Appendix G. Supplementary Information on Pillar 2
1. This appendix provides additional (i) quantitative information on the
education budget, enrollment and completion rate in the education sector, (ii)
qualitative information on the challenges encountered by the institutional reforms
supported through Bank projects and (iii) evidence on employability. Most
information comes from field discussion, Aide Memoire of the education projects
and recent analysis contained in the 2013 DPR.
Education Budget
2. The budget allocated to education was 7 percent of GDP in 2005 (up from 5.2
percent in 1980 and 6.0 percent in 1990), which is much higher than the average for
OECD and transition countries where enrollment rates were much higher. The
share of the education budget in the overall budget increased to close to 16% in
2010 before dropping to close to 13% in 2012. Over 90% of the education budget
represents recurrent expenditure. A large part is absorbed through current
expenditures in support of salaries to the detriment of other pedagogic input60. This
highlights problems associated with low efficiency, as well as the risk to long term
sustainability.
Figure G.1. Evolution of the Share of education spending in Total budget
Source: Ministry of Education, 2012/13.
3. The unit cost per student in primary education as well as in upper basic and
secondary has increased steadily over the evaluation period.

APPENDIX G SUPPLEMENT INFORMATION ON PILLAR 2
72
Figure G.2. Evolution of Unit cost per cycle in Tunisian Dinar (DT)
Source: Ministry of Education, 2012/13.
Pre-school (“année préparatoire”)
4. The enrollment rate of children aged 5-6 years has steadily improved over
the course of the evaluation period. Similarly, the share of primary schools offering
pre-schooling program (“année préparatoire”) has tripled since the inception of this
program.
Figure G.3. Evolution of Net Enrollment Schools in Basic and Secondary Education
Figure G.4. Evolution of Percentage of Primary Offering Pre-schooling Program
Source: Ministry of Education, 2012/13.
Basic and Secondary Education
5. Basic education includes primary school (6-11) and the second cycle of basic
education (collège). Secondary education refers to lycée.
(i) Enrollment : Notable progress

APPENDIX G SUPPLEMENT INFORMATION ON PILLAR 2
73
In 2005, 97 percent of children aged 6 to 11 years were enrolled at school61.This achievement was partially influenced by a decline in fertility rates that led to a significant reduction in the primary school age population. Enrollments declined from 1.4 million in 1999/2000 to 1.1 million in 2004/05.
6. Notable progress was made in enrollment in basic and secondary education
over the evaluation period. Between 2005 and 2010, enrollment rates increased from
97 percent to 98.2 percent for 6 to 11 year olds. For 12-18 years old, enrollment for
girls is 81.4 percent compared to 74.7 percent for boys (ICR, EQUIPII). Most recent
data (Annuaire statistique 2012/13) confirm these trends.
Table G.1. Evolution of Net Enrollment in Basic and Secondary Education
Source: Ministry of Education, 2012/13.
(ii) Completion/drop-out and repetition rates : Still high rate of drop-outs
and repetition especially for boys
7. The government does not compute completion rates of basic and secondary
education on a regular basis. Data on completion rates are sourced from the ICR of
EQIPII (Table p4). The completion rate in basic education has increased from 51.9
percent in 2004/05 to 60.7% in 2009/10. In secondary education, target rates (set in
2006-07) were 67.9% for Girls and 54.3% for Boys but completion rates achieved in
2009-10 were 60.6% for Girls and 45.3% for boys (ICR, EQUIPII). Changes in
baccalaureate examination explain partially the high volatility of completion rates.
Completion rates for boys and girls were respectively 42.9% and 45.5% in 2002/03
and then fluctuated from [41.9%; 53%] for boys and [56.1%; 66.7%] for girls over
2003/04 to 2009/10 (ICR, EQUIPII).

APPENDIX G SUPPLEMENT INFORMATION ON PILLAR 2
74
8. Table G.2.shows key trends in promotion, repetition (repeating a year), and
dropout with respect to basic education, higher primary and second level
education. Drop-out in the public primary school system reduced to 1 percent in
2012/13 (down from 1.7% in 2006/07) and repetition rates fell to 7.5% in 2011/12,
down from 8.3% in 2006/07. By contrast, drop-out and repetition rates from public
schools in upper primary cycle remains high, reaching, respectively, 9.3% and
17.3% in 2011/12. Data collected by the Ministry of Education shows the repetition
rate is particularly high in the first year of the second cycle of basic education (7th
grade)62 as well as for the 10th grade. In 2011/12, drop out and repetition rates were
twice as high for boys as for girls in the second cycle of basic education - (6% vs.
12%) and (13% vs. 21%) respectively. The same conclusion holds for secondary
education where the repetition and dropout rates for boys are 18.1 and 15.6 percent,
versus 15.8 and 9.2 percent for girls.
Table G.2. Evolution of Promotion, Drop-out and Repetition Rates in Basic Education and Secondary Education 1999/2000 – 2010/11
1999/2000 2004/05 2006/07 2007/08 2008/09 2009/010 2010/011 2011/12
Lower Primary
Promoted 83.3 92.5 90 91.6 92.2 92.6 91.7 91.5
Repetition 13.8 5.9 6.8 6.5 6.1 7.3 7.5
Drop-out 2.9 1.7 1.6 1.3 1.3 1.0 1.0
Upper Primary
Promoted 71.2 70.4 71.2 71.4 73.2 75.8 73.3 73.4
Repetition 19.1 18.7 18.3 17.2 16.6 14.8 17.6 17.3
Drop-out 9.7 10.9 10.5 11.4 10.2 9.4 9.0 9.3
Secondary
Promoted 72.7 69.9 71.9 72.2 72.9 74.4 73.9 71.3
Repetition 17.7 18.4 17.2 16.3 16.3 15.1 16.6 16.8
Drop-out 9.6 11.7 10.9 11.6 10.8 10.5 9.6 11.0
Source: Annuaire Statistique 2012/13
(iii) Inclusive Education : Lack of M&E to assess impact
9. The Priority School Program (PEPE) was initiated in 1999/2000 by UNICEF.
Schools were defined as priority schools based on a ranking along 16 indicators
(such as repetition rates, and drop out). All schools (4,000) were ranked according
to these indicators. Schools scoring lowest were defined as PEPE schools and
benefitted from an additional budgetary allocation. PEPE schools benefited, for
example, from training for teachers and schools heads, and increased numbers of
school hours. The number of beneficiary students grew from 7,667 students in 2001
to 157,806 in 2010. This includes 558 priority primary schools (lower basic
education) and 100 priority colleges (upper basic education). Questions regarding
the efficiency of this program have been raised in the report (See chapter 4).

APPENDIX G SUPPLEMENT INFORMATION ON PILLAR 2
75
10. Launching a kindergarten program was a strategic decision made by the
government to enhance kids’ ability at schools. As the number of kids enrolled in
primary education was declining (following demographic transition), there was a
number of redundant teachers and/or empty classrooms, which facilitated the
implementation of this pre-primary school year. The ICR noted that in 2007-08 a
total of 1,750 kindergartens serving 31,869 children benefited from technical
support (rehabilitation, training of trainers, and development of adapted programs)
- see data on pre-school above.
11. In 2003/04, government has started to progressively integrate disabled
children into mainstream schools. Since 2005/06, 182 schools integrated roughly
800 students with disabilities in pre-schooling, and the first three years of basic
education. The project supported the elaboration of guidelines to provide guidance
to integrate children with different disability types. Some interlocutors noted that
children with disabilities no longer had the opportunity to go to the closer school if
the latter had not been elected as a school participating to the integration program.
Because the transport system is not sufficiently developed, some kids who were
previously attending standard, mainstream schools could no longer do so and had
to join schools for children with disabilities. Simultaneously, some schools selected
in the participatory programs didn’t have many children with disabilities joining
them, but they remained in the program and continued to benefit from relevant
budgetary allocations.
(iv) Introducing the skill based approach in basic education : Flaws in
design and implementation
12. The Bank had supported the implementation of APC in primary school in
the first phase of the APL63. Surprisingly, the ICR failed to report specifically on the
objective to extend this skill based approach to upper basic education64. It only
indicates that a total of 1,000 trainers, 800 principals and 42,542 teachers were
trained in the APC methodology. In fact, the APC reform faced strong resistance
notably from teachers. Field discussions with various stakeholders noted a number
of flaws in the design and implementation of the program. The approach initially
created and piloted by the CNIPRE was too rapidly promoted as a national
program by the policy makers. The CNIPRE noted that the program gave initially
greater emphasis on internal evaluation (providing teachers with a battery of tests
based on criteria and indicators for them to assess students’ skills) at the expense of
changes in pedagogic programs and learning methods (which were only
introduced later on). Teachers had tools to test students ‘ability to follow, but some
stakeholders noted that no specific remediation time slot was inserted in teachers’

APPENDIX G SUPPLEMENT INFORMATION ON PILLAR 2
76
weekly calendar and teachers had no incentives to do remediation during extra
hours. Also, no engineering of remediation was designed at the system level to
assist teachers in using alternative teaching methods during remediation class. This
was only done on an ad-hoc basic. More critically, the APC guiding methodology
lacks a didactic approach. Teachers had to follow a strict, pre-determined program,
and their capacity to adjust the pace of teaching was hindered depending on the
adhesion of the inspector to the reform program. Overall, teachers felt the system
was extremely bureaucratic and this didn’t lead to a positive dynamic in the reform
process
Measuring Learning Outcomes through International Test: At the Bottom of International Test
13. The TIMSS is an international assessment of mathematics and science at the
fourth and eighth grades that has been conducted every four years since 1995.
Despite some minor improvement between 2007 and 2011, Tunisia is among
countries with the greatest decrease in average mathematics achievement at the
eighth grade compared to 1999 but performance is relatively higher in the later
years.
Table G.3. Tunisia Students: Performance in International Student Assessment
Tunisia TIMSS 1999 2003 2007 2011
4th Grade
Math 339 327 359
Sciences 314 318 346
8th Grade
Math 448 410 420 425
Sciences 430 404 445 439
PISA Mean Score 2003 2006 2009 2012
Change between 2003 and 2012
2009 2012 (2006 if 2003 na)
Performance in : TUNISIA Score difference OECD
Reading 375 380 404 29 493 494
Math 359 365 371 13 496 496
Sciences 386 401 15 501 501
Source: Authors, from PISA and TIMMS Reports a. TIMMS uses four points on the scale as international benchmarks advanced (>635), high (550-624), intermediate (477-554), low (400-474) and
below low (<400). b. PISA scores can be located along specific scales developed for each subject area, designed to show the general competencies tested by PISA.
These scales are divided into levels that represent groups of PISA test questions, beginning at Level 1 with questions that require only the most basic skills to complete and increasing in difficulty with each level. In each test subject, the score for each participating country is the average of all student scores in that country. The average score among OECD countries is 500 points and the standard deviation is 100 points. About two-thirds of students across OECD countries score between 400 and 600 points
14. The Program for International Student Assessment (PISA) is an international
assessment that measures 15-year-old students' reading, mathematics, and science

APPENDIX G SUPPLEMENT INFORMATION ON PILLAR 2
77
literacy. PISA also includes measures of general or cross-curricular competencies,
such as problem solving. PISA emphasizes functional skills that students have
acquired as they near the end of compulsory schooling. PISA (2012) show some
progress especially in mathematics but Tunisia remains statistically below the
OECD average on the overall reading, math and sciences scale.
TERTIARY EDUCATION
(i) Enrolment : A decrease in the student population since 2009
15. There was a rapid expansion of the student population in the higher
education public institutions between 1995 and 2005 (102.000 to 330.00). The
enrollment rates at University doubled from 14.6 percent in 1998 to 29 percent in
2004, and the rate of increase was even greater for women. Women’s enrollment
rate increased from 13.percent in 1998 to 32.4 percent in 2004.
16. The government
forecast a continued increase
in enrolment (around 6.6
percent per year) but the
increase in student
population was much less (on
average 2 percent per year
over 2006-2009) and as of
2009, student enrolment in
tertiary education continued
to drop.
(ii) Introduction of the
LMD system : The reform has yet to produce most targeted results
notably to better meet labor market needs
17. The LMD is a degree system equivalent to the Bachelor (3 years), Masters (5
years) and PhD (8 years). The LMD reform had been officially endorsed in 2001 in
line with the Bologna process. The system which was hastily deployed in 2006, with
insufficient preparation (although government had enough time to prepare
implementation plan). Staffs from the Ministry of Higher Education acknowledge
that they receive many questions from students and teachers who do not
understand the modalities of the new system. In September 2012 a total of 669
Figure G.5. Evolution of Student Population
Source: WB Aide Memoire, May 2013

APPENDIX G SUPPLEMENT INFORMATION ON PILLAR 2
78
Licenses, and 410 Masters had been approved, and work on the Doctorates was
soon to be launched.
18. In order to reinforce the relevance of Licenses and Masters to the needs of
the labor market, two kinds of diplomas were introduced: (i) the traditional general
License and Master (License Fondamentale and Master Recherche); and (ii) the License
and Masters linked to specific professional activities (Applied Bachelor and
Professional Master) chosen by roughly two thirds of students. Field interviews
noted that diplomas were accredited during a one day session and participants
were not compensated for this. A Bank supervision mission also noted the absence
of professional representatives in the evaluation committee of professional
masters65. Bank staff noted there was no evidence that students enrolled in applied
bachelor and professional masters were all able to attend training in companies as
scheduled in the curricula. Given the numbers enrolled in these programs, it is
unlikely that all students would benefit from a work placement, raising the
question, in at least some cases, of the true difference in practice between traditional
and applied diplomas.
19. The reform had also targeted the co-development of some curricula with the
private sector -e.g. large retailers (“grande distribution”) who trained specialized
vendors, or insurance companies who trained brokers. Yet difficulties quickly
emerged. Problems include transport logistics of students between the university
and workplace, payment of professional staff who don’t have a professor status and
therefore were paid at the bottom of the wage scale for professors, often with
delays. University Professors in charge of these programs were rapidly
overwhelmed, monitoring students ‘performance in and out of universities was a
full time job and they did not have extra time or allowances to do so.
(iii) Efficiency : Some progress but mostly due to the new credential system
20. The impact of internal efficiency improvement is estimated to have
represented 9.4% of government’s total operating budget between 1998 and 200366.
The internal efficiency of the tertiary sector improved following the implementation
of the new degree structure that reduced the number of years required to get a
diploma. The theoretical time to get a bachelor is 3 years. In 2012, the actual time
amounted to (i) 3.91 vs. 4.2 in 2010 for traditional bachelor, (ii) 3.3 vs. 3.6 in 2010 for
short cycle, and (iii) 3.4 vs. 3.6 in 2010 for professional bachelor.

APPENDIX G SUPPLEMENT INFORMATION ON PILLAR 2
79
Figure G.6. Average Time to Get a Diploma 9(in Years)
Source: World Bank. PARES II Aide mémoire, June 2013
(iv) Field Selection : contributing to the mismatch with market needs
21. The choice of program is determined by a centralized system, the “système
national d’orientation universitaire”, which places students to a certain program given
his/her preferences, scores at the Baccalaureate, the stream chosen for the
Baccalaureate, and the quota set by the Ministry for each field of study.
22. A large segment of students choose fields in humanities and social sciences,
which are associated with high repetition and failure rates as well as limited labor
demand. About 63 percent of all students enrolled in tertiary education institutions
in 2010/11 were in the fields of humanities, health and social sciences.
(v) Governance of Universities : lowest level of autonomy and
accountability within the region
23. The study undertaken in 2011 and 2012 on the governance of Universities in
Tunisia and in the region indicate that Tunisian Universities have among the lowest
levels of autonomy and accountability over both years67 (Figure G.7.). Participation
assesses the level of involvement of civil society, notably students and alumni,
private sector.

APPENDIX G SUPPLEMENT INFORMATION ON PILLAR 2
80
Figure G.7. Governance Indicators of Tunisian University
Source: World Bank. “La gouvernance des Universités en Tunisie et dans la région », 2011 and 2012 surveys
24. The 2008 higher education law opens the way to grant greater autonomy to
universities. None of the universities were able to seize the opportunity given the
level of complexity of eligibility criteria. Prior conditions for accessing the EPST
status are related to the quality of pedagogic, scientific, financial and administrative
management, opening to the economic/social environment and the conclusion of
training and research contract conform to the 2008 law. This new statute would
increase their financial resources and autonomy notably including through the
implementation of public private partnership
Comparison of University Score in the region in 2011 along three dimensions : Autonomy, Accountability and Participation
Comparison of Score for University having participated
in the 2011 and 2012 surveys (incl auto-perception scores in ---)

APPENDIX G SUPPLEMENT INFORMATION ON PILLAR 2
81
Employability: a quick overview of the labor market situation for graduates
25. Employability refers to the capacity to get available jobs and to be able to
function well once hired thanks to the accumulation of skills, competencies and
professional qualifications68.
26. Labor force participation increased between 2005 and 2011 (Figure G.8.).
Unemployment rates remained high between 2005 and 2010, and worsened after
the revolution69 (Figure G.9.).The situation is particularly worrisome for women
(Figure G.10.)
Figure G.8. Labor force participation rates (%) in Tunisia, by strata, gender, age and education
Source: World Bank. Draft DPR 2013.
Figure G.9. Unemployment Rates among Youth 15-29 years old in 2005, 2010 and 2011
Source: World Bank. Draft DPR 2013 – Authors calculations using the Labor Force Survey [2005, 2010, 2011]
0
10
20
30
40
50
60
70
80
% o
f p
op
ula
tio
n 1
5-6
4
2005
0
10
20
30
40
PrimaryEducation
SecondaryEducation
TertiaryEducation
2005
2010
2011

APPENDIX G SUPPLEMENT INFORMATION ON PILLAR 2
82
Figure G.10. Unemployment rates by gender
Source: INS – World Bank Aide Memoire June 2013
27. Long term unemployment is particularly prevalent among the young (25-34)
and high skilled individuals (figure G.11)
Figure G.11. Long term unemployment by age and education (>12 months, 2005, 2010 and 2011).
Source: Draft DPR 2013 – Authors calculations using the Labor Force Survey [2005, 2010, 2011]
28. Also, informal employment is wide-spread in Tunisia70, notably among the
less educated individuals, but has decreased for wage earners with secondary and
tertiary education. An analysis of the dynamics of informal employment reveals
that the share of the employed population without a contract has decreased from 54
percent in 2007 to 44.5 percent in 2011, probably due to a rapid increase in public
sector hiring in 2011 and the expansion of fixed term contracts. Informality for
wage earners with secondary and tertiary education reached 39 percent and 17.7
percent respectively in 2011, but has decreased respectively by 18.7 percent and 27.2
percent over 2007-2011.

83
Appendix H. Supplementary Information on Pillar 3
APPENDIX H.1: POVERTY ANALYSIS
APPENDIX H.2: LABOR POLICIES
APPENDIX H.3: HEALTH OUTCOME
APPENDIX H.4: ACCESS TO INFRASTRUCTURE TO UNDERSERVED COMMUNITIES

APPENDIX H SUPPLEMENT INFORMATION ON PILLAR 3
84
H.1. Poverty Analysis
1. This appendix provides additional information on the revised methodology
to estimate poverty and the updated poverty profile.
REVISED METHODOLOGY FOR ESTIMATION POVERTY.
2. The basis of the estimation of poverty is the data collected by the INS in its
National Budget Survey, which includes household consumption data71. A
“poverty line” is defined which is the minimum consumption expenditure
necessary to meet essential needs, including food and non-food items.
3. The estimate of essential food consumption expenditures is obtained by
estimating the cost of a food basket that ensures a minimum number of calories
essential for meeting energy requirements. This involves two steps. First, the
recommended caloric requirement is calculated from the anthropometric data and
the level of physical activity in different categories (large cities, small towns, rural
areas) reported in the survey. These are in accordance with the calorie guidelines of
the WHO. Second, the cost per unit of calorie consumed by the poorest 20 percent
of the population is estimated from the survey data. These two estimates are
combined to provide a food poverty line72.
4. Two alternative estimates are obtained for essential non-food expenditures
of the poor. In the first method, the expenditures on non-food items of households
with per capita total consumption just equal to the food poverty line are taken. This
is added to the food poverty line to give the rock bottom (food and non-food)
poverty line. In the second method, the expenditures on non-food items of
households with per capita food consumption exactly equal to the food poverty line
are taken. This is added to the food poverty line to give the upper threshold of
poverty.
5. The poverty line (in terms of consumption per capita per year) was
estimated at 1,277 dinars in 2010 in the big cities, 1,158 dinars in smaller towns, and
820 dinars in rural areas. The
corresponding estimates for the extreme
poverty line were 757, 733 and 571 dinars
respectively. Table H.1.1 provides the
new estimates of poverty (and extreme
poverty).
Table H.1.1. Estimates of Poverty in Tunisia
Percent of population below: 2000 2005 2010
Poverty Line 32.4 23.3 15.5
Extreme Poverty Line 12.0 7.6 4.6
Source: INS

APPENDIX H SUPPLEMENT INFORMATION ON PILLAR 3
85
UPDATED POVERTY PROFILE (ISN 2012)
6. Based on the new methodology, new estimates for poverty at the national
level, as well as in different regions for 2000, 2005 and 2010 were provided. The
new estimate of poverty is considerably higher than that previously estimated
although the overall trend, as discussed below, was on a downward trajectory. For
example, the CPS quotes a poverty estimate of 3.8 percent for 2005, which is half of
the population found to be below the extreme poverty threshold based on the new
methodology.
7. There was a significant reduction in poverty between 2000 and 2010, which
declined by an average of 7.1 percent every year. The reduction in extreme poverty
was even sharper, falling by about 10 percent per year during the decade. Progress
in poverty reduction was better during 2005-10 compared to the first half of the
decade: both poverty and extreme poverty fell more sharply (See table H.1.2.)
Table H.1.2. Reduction in Poverty 2000-10
Annual percent Reduction in: 2000-05 2005-10 2000-10
Poverty -6.4 -7.8 -7.1
Extreme Poverty -8.7 -9.5 -9.1
Annual GDP Growth (%) 4.5 4.4 4.5
Impact on Poverty of 1% GDP Growth (%) -1.4 -1.8 -1.6
Impact on Extreme Poverty of 1% GDP Growth (%) -1.9 -2.2 -2.0
Source: INS
8. Not only did poverty decline, but growth benefitted the poor relatively
more, especially in the second half of the decade. During 2005-10, a one
percentage point increase in GDP growth reduced poverty by 1.8 percent points
and extreme poverty by 2.2 percentage points. The corresponding declines over
2000-05 were 1.4 and 1.9 percentage points (See Table H.1.2.).
9. The inclusive nature of growth is confirmed by the faster per capita
growth of consumption for the lowest quintile of the population, which grew by
3 percent per year (2000-10) compared to the overall average of 2.9 percent over
the same period. During 2005-10,
the difference was more marked:
per capita consumption of the
lowest quintile rose by 3.4 percent
per year compared to 1.7 percent
growth for the richest quintile and
overall average growth of 2.5
percent (Table H.1.3.). This trend is
Table H.1.3. Growth of consumption per capita in poorest quintile 2000-10
Annual Growth rate (%) 2000-05 2005-10 2000-10
Lowest Quintile 2.5 3.4 3.0
Highest Quintile 2.3 1.7 2.0
Entire Population 3.3 2.5 2.9
Source: INS

APPENDIX H SUPPLEMENT INFORMATION ON PILLAR 3
86
also confirmed by the reduction in inequality in consumption expenditures within
most regions during 2005-10. Inequality in consumption came down significantly in
the Northeast, Central West, South West, and South East regions of the country. In
other regions, the decline was not statistically significant.
10. The positive trends at the national level hide widening gaps between
regions. Poverty (and extreme poverty) is significantly higher than the country
average in some areas. This is especially so in the western part of the country
comprising the North-west, Central-west and South-west regions. In 2010, the
poverty level in the poorest region (the Central-west) was more than 3 ½ times the
poverty level in Greater Tunis (See Table H.1.4.). Poverty was also much higher in
rural areas. In 2010, poverty in non-communal areas73 was 22.6 percent (compared
to the national average of 15.5 percent). Extreme poverty was 9.2 percent, double
the national average of 4.6 percent.
Table H.1.4. Regional Poverty Trends
In % Poverty Extreme Poverty Population
2000 2005 2010 2000 2005 2010 2010
Tunisia 32.4 23.3 15.5 12 7.6 4.6 23.2
Greater Tunis 21 14.6 9.1 4.3 2.3 1.1 13.9
North East 32.1 21.6 10.3 10.5 5.4 1.8 11.5
North West 35.3 26.9 25.7 12.1 8.9 8.8 23.3
Central East 21.4 12.6 8 6.4 2.6 1.6 13.3
Central West 49.3 46.5 32.3 25.5 23.2 14.3 9.1
South East 44.3 29 17.9 17.5 9.6 4.9 5.6
South West 47.8 33.2 21.5 21.7 12.1 6.4
Source: INS
11. The gap between poverty in
the better off regions and the poorer
regions, which had widened 2000-05,
widened further 2005-10 (See table
H.1.5.). Though there is less
inequality in consumption
expenditures within regions, the gap
between regions has widened.
Reducing this gap between regions
will be an important challenge in the
coming years.
Table H.1.5. Poverty Gap between Greater Tunis and Poorer Regions
Poverty Gap
2000 2005 2010
Greater Tunis 100 100 100
North East 153 148 113
North West 168 184 282
Central East 102 86 88
Central West 235 319 355
South East 211 199 198
South West 228 227 236
Source: INS

APPENDIX H SUPPLEMENT INFORMATION ON PILLAR 3
87
H.2. Labor Policies
12. This appendix provides succinct background information on the regulation
of the labor market and active labor market policies (ALMPs) in Tunisia.
Regulation of the labor market
13. The labor market in Tunisia is highly regulated. The labor market was rigid
due to regulations associated with dismissal procedures, advance notice, lengthy
procedures and systematic court involvement. For instance, an employer typically
needs to request authorization from and to notify the regional board or central
commission for dismissal control prior to laying off any open-ended worker for
economic reasons. The Labor Code also requires sector-wide collective agreements
between employers and employees to determine further details of contractual
(hiring and layoff) procedures, as well as salary scales according to professional
category74. The Tunisia Labor Code provides for severance benefits up to 3 months
of salary; however employers do not create reserve funds. Unemployment
insurance offers 12 weeks minimum wages for laid-off workers; and is financed by
0.9 percent payroll contribution. Coverage is incomplete and only about 6 percent
of dismissed workers receive benefits. Employers were also discouraged from
hiring due to relatively high social security contributions.
14. To gain more flexibility, employers are increasingly using fixed-term
contracts, or hiring workers informally without any contract. Forty one percent of
those made redundant had a terminated fixed-term contract. Severance payment
was relatively low and inadequate to secure income protection.
Active Labor Market Policies
15. Active labor market programs (ALMPs) run by the state have long been at
the core of Tunisian labor market policy. Formal ALMP provision was initiated in
1981 in response to employment challenges faced by vocational training graduates.
In 1987, program content moved from exclusive technical training provision to
programs aimed at the transmission of life skills for university graduates.
16. Funding for these programs is provided through the National Employment
Fund. The Fund is financed from general revenues, proceedings of state
privatization operations, and contributions from private donors as well as from
income, payroll, and sales taxes. Until recently, the Fund operated directly under
the President and was perceived as a source of official patronage. In 2011, resources
in the Fund amounted to 0.8 percent of GDP, and 80 percent of resources of which
went for active labor market programs administered by the national employment

APPENDIX H SUPPLEMENT INFORMATION ON PILLAR 3
88
agency ANETI. The other 20 percent were roughly equally divided between
financing micro-credits provided by BTS and regional employment programs,
including public works.
H.3. Health outcome
17. This appendix provides additional information on health outcomes prior to
the evaluation period.
18. Tunisia’s health sector improved over 2000-2005 (See Table H.3.1) and
performed reasonably well compared to other countries with similar incomes
and level of spending on health (refer to Appendix K.4).
Table H.3.1. Health indicators
Health Indicators 2000 2004/2005
Life expectancy at birth (M/F) 70.6 / 74.7 71.6 / 75.5
Maternal mortality ratio (per 100,000 live births) 84 68
Mortality rate, infant (per 1,000 live births) 24.7 19.1
Fertility rate, total (births per woman) 2.08 2.04
Source: World Development Indicators.
19. Yet prior to 2005, there were already rising concern regarding:
(i) Regional disparities in terms of health infrastructure, outcomes and
utilization.
Poorer regions were generally underserved in terms of lesser numbers of
hospital beds per 1,000 inhabitants, and a lesser number of general physicians
and specialists in public hospitals. Health outcomes reflected these inequities.
Maternal mortality rates are three times higher in rural areas (70 versus 20
deaths per 100,000 live births). Children are more than twice as likely to be
stunted (10 percent in rural areas versus four percent in urban areas).
Between 2000 and 2007, maternal deaths increased in the central and south-
western parts of the country75. In 2006, the maternal mortality rate was more
than three times higher for the poor (MOH 2008). The infant mortality rate
(IMR) in rural areas (30 per 1,000 live births) was almost double that in urban
areas (16 per 1,000 live births) and full immunization rate coverage was, for
example, more than six times higher in Nabeul (95 percent) than in Tataouine
(15 percent).
(ii) Financing of rising health care expenditures.
The percentage of GDP devoted to health increased from 4.2 percent in 1985
to 5.6 percent in 2003. This was close to the MENA regional average of 5.5

APPENDIX H SUPPLEMENT INFORMATION ON PILLAR 3
89
percent. Tunisia’s per capita expenditure on health as a percentage of GDP
was in line with the global trend. But the private sector’s share of health
spending in Tunisia is larger than the average in MENA countries. Annual
health expenditures per capita had increased five-fold between 1985 and
2004, representing an average nominal annual growth rate of 10 percent. In
2004, almost 54 percent of health spending was contributed by direct out of
pocket payments by households76.
H.4. Access to Infrastructure to Underserved Communities
20. This appendix provides additional information on the results achieved
under WB projects over the period.
Closed Project
First natural resource management project (closed FY04):
21. The natural resources management project (NRMP) aimed to support
sustainable natural resources management, in particular of crop and rangeland, in
severely degraded areas, and agricultural productivity improvements, attained
with greater involvement of the resource users in development programs. While
not explicitly mentioned, the project intended to help three regions, Jendouba,
Kasserine and Medenine to get improved access to rural infrastructure, so that by
the end of the project 90 percent of each of these regions would have access to rural
roads, and 100 percent to potable water. However, the targets were not fully
achieved, and by project completion the access rates were 25%, 75% and 100% for
rural road, and 22%, 75% and 95% for potable water. Rural infrastructure
represented some 20 percent of total project cost. IEG rated outcome under the first
natural resource management project as satisfactory and sustainability as likely.
First Water Sector Investment Project (FY00-09)
22. The first Water Sector Investment Project (FY00; closed in FY08) did not
explicitly aim to improve access to water for rural households. Its objectives were
couched broadly to promote effective integrated water resource management and
water conservation. However, it was expected that the project would contribute to
increase access to safe water in rural areas. Under this Project, access to clean and
safe drinking water was extended to about 170,000 people in disadvantaged rural
areas served by the project. Beneficiary surveys indicate this infrastructure is used
and is improving quality of life for remote rural households and for women in
particular. Other physical investments under the project such as electrification of
pumps and creation of boreholes met or exceeded expectations. IEG rated

APPENDIX H SUPPLEMENT INFORMATION ON PILLAR 3
90
achievement of outcomes under the first water sector investment project as
moderately satisfactory. It rated risks as significant, given the weak institutional
capacity and financial vulnerability of Water User Associations (WUAs).
Third North-West Mountains and Forestry Area Development Project (FY03-10)
23. The third North-West Mountains and Forestry Area Development
(NWMFAD) Project (FY03-10) aimed to improve the socioeconomic conditions of
the populations in five governorates covering the mountainous and forested areas
of the northwest region (including Béja, Bizerte, Le Kef, Jendouba, and Siliana),
while ensuring sustainable management of natural resources.
24. The project included construction of rural roads, and the construction of
tanks to improve supply of potable water. The percentage of communities with
improved access to roads increased from 56 percent to 81 percent involving 275
additional communities during the project implementation period. Almost 272 km
of rural roads were constructed and 599 km of roads rehabilitated. Also, the
percentage of households with better access to potable water increased from 69
percent to 81 percent involving 4,980 additional households.
25. NWMFAD project (FY03-10) also included support for strengthening the
capacity of ODESYPANO, the Northwest Forestry and Pastoral Development
Agency - Office du Développement Sylvo-Pastoral du Nord-Ouest (ODESYPANO)
created in 1981 to protect natural resources, (through the construction of rural
infrastructure, mainly roads, and the implementation of anti-erosion measures).
The project also funded specific investments in (i) soil and water conservation
works, including stonewalls, anti-erosion plantations, small dikes, and grass strips,
(ii) improvement of pasture and rangelands in degraded areas, including the
establishment of resting areas as well as reseeding and fertilizing activities in other
areas, and (iii) agro-forestry development, essentially through the establishment of
plantations, mainly olive and fruit trees with some forage for livestock
development, as a complement to mechanical soil and water conservation works.
The project led to some improvement in the targeted region. Forest and vegetation
cover is estimated to have increased from 32 to 38 percent between 2003 and 2009
with a total of 22,251 hectares treated with soil and water conservation works to
reduce erosion and increase protection against water runoff. Including
improvements to rangeland and forestry and agro-forestry, the improvements
covered almost 55 thousand hectares of fragile land.

APPENDIX H SUPPLEMENT INFORMATION ON PILLAR 3
91
26. IEG rated outcomes under the Northwest Mountainous and Forestry Areas
Development Project as moderately satisfactory and the risk to development
outcome, significant.
Active Projects
27. It is too early to review the results of the on-going projects that were
significantly slowed down after the revolution.
Second Natural Resource Management Project (FY10-ongoing)
28. Only 6 percent of the second NRM project loan had been disbursed by June
2012, two years after the loan was approved. (Source: Project ISRs.)
Second water sector investment (FY09-ongoing)
29. Disbursements for the WSI-2 had reached 58% by December 2012, three and
one half years after the loan was approved.
Fourth North-West Mountains and Forestry Area development Project (FY11-ongoing)
30. Disbursements were only 4 percent in the case of the fourth NWMFAD
project approved in December 2010. (Source: Project ISRs.)


93
Appendix I. Supplementary Information on Pillar 4
APPENDIX I.1. OVERVIEW OF PUBLIC FINANCIAL MANAGEMENT REFORM
APPENDIX I.2. OVERVIEW OF GOVERNANCE PERFORMANCE 2000-10
APPENDIX I SUPPLEMENT INFORMATION ON PILLAR 4
94
I.1. Overview of Public Financial Management Reform
BACKGROUND
1. The 2004 CFAA underlined that the Tunisian budgetary system was sound
but rigid, legally well-defined and pragmatically managed, although some
weaknesses were identified in the budget process, notably excessive controls and
weak external accountability. Budget preparation lacked clear instructions for
budget preparation, in particular the notification of budgetary choices to sector
Ministries. Budget implementation was impaired by delayed opening of
appropriations, insufficient flexibility in the use of budget lines, and excessive
controls. government accounting and reporting were insufficient (mainly cash
basis) to allow for transparency in relation to government assets and liabilities.
DONORS’ COORDINATION
2. The WB supported the introduction of the PBB reform, which donors had
been pushing for, since its inception in 2004. Bank TA was closely coordinated with
the EU. The EU supported the PBBS reform with a three phase specific budget
support grant. The EU also provided major TA support to create global and sector
MTEFs in pilot line ministries, as well as tailor-made assistance for each pilot line
ministry to adopt its performance indicators. It is also supporting a comprehensive
review of the internal controls and audit (ex-ante and ex-post expenditure controls,
performance auditing, etc.).
3. The MoF Unit in charge of implementing PBB reform is now also twinned
with the French MoF, which is providing relevant assistance, particularly with a
view to reforming the control system so that it is consistent with PBB principles
(notably to introduce a prioritized approach to expenditure controls (“contrôle
hiérarchisé de la dépense”) and credit globalization (“globalisation des credits”).
PROGRESS IN REFORM IMPLEMENTATION
4. Though the 2004 presidential program called for the move towards
performance based budgeting reform, implementation proved quite challenging.
There was some buy-in from middle level staff in the pilot ministries, but little
enthusiasm for Budget reform by the Ministry of Finance until 2009, no visible
support from the President’s office and lack of interest from the Prime Minister’s
Office. For example, the inter-ministerial committee in charge of steering the reform
and the follow-up and evaluation committee was only set-up three years after the
start of the reform process (2007); the PBB units in pilot ministries due to be
installed in 2006 were eventually created in 2008; and the appointment of a
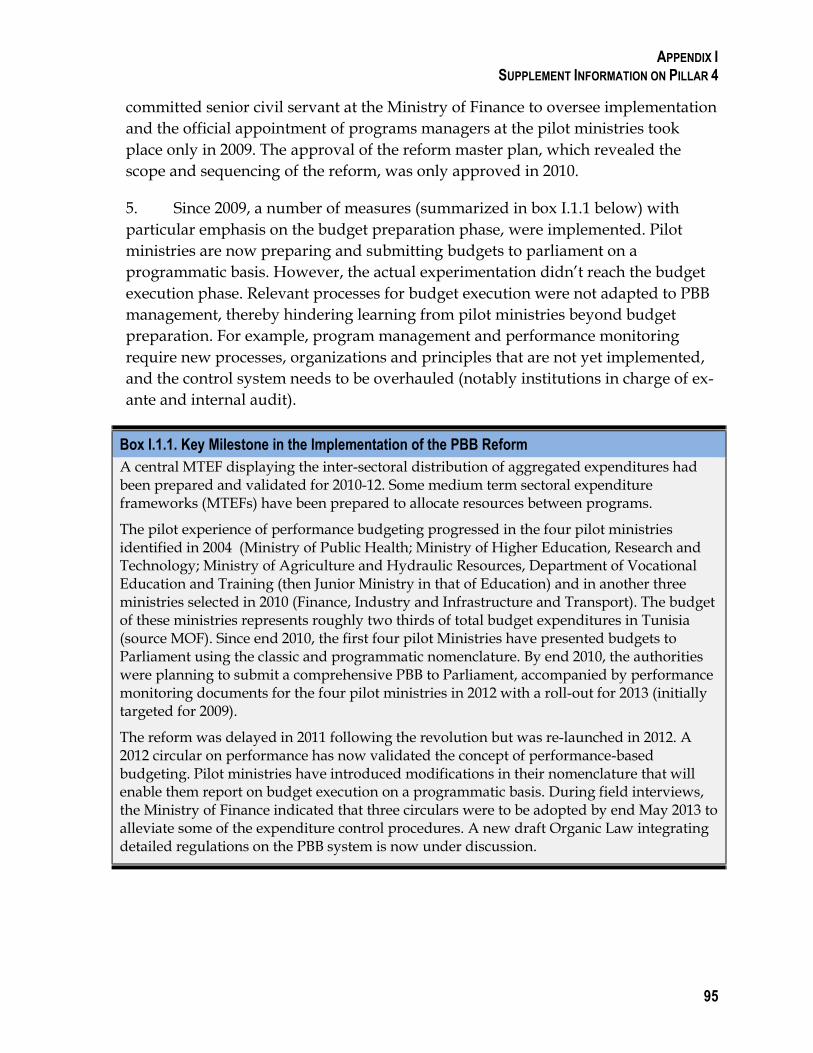
APPENDIX I SUPPLEMENT INFORMATION ON PILLAR 4
95
committed senior civil servant at the Ministry of Finance to oversee implementation
and the official appointment of programs managers at the pilot ministries took
place only in 2009. The approval of the reform master plan, which revealed the
scope and sequencing of the reform, was only approved in 2010.
5. Since 2009, a number of measures (summarized in box I.1.1 below) with
particular emphasis on the budget preparation phase, were implemented. Pilot
ministries are now preparing and submitting budgets to parliament on a
programmatic basis. However, the actual experimentation didn’t reach the budget
execution phase. Relevant processes for budget execution were not adapted to PBB
management, thereby hindering learning from pilot ministries beyond budget
preparation. For example, program management and performance monitoring
require new processes, organizations and principles that are not yet implemented,
and the control system needs to be overhauled (notably institutions in charge of ex-
ante and internal audit).
Box I.1.1. Key Milestone in the Implementation of the PBB Reform
A central MTEF displaying the inter-sectoral distribution of aggregated expenditures had been prepared and validated for 2010-12. Some medium term sectoral expenditure frameworks (MTEFs) have been prepared to allocate resources between programs.
The pilot experience of performance budgeting progressed in the four pilot ministries identified in 2004 (Ministry of Public Health; Ministry of Higher Education, Research and Technology; Ministry of Agriculture and Hydraulic Resources, Department of Vocational Education and Training (then Junior Ministry in that of Education) and in another three ministries selected in 2010 (Finance, Industry and Infrastructure and Transport). The budget of these ministries represents roughly two thirds of total budget expenditures in Tunisia (source MOF). Since end 2010, the first four pilot Ministries have presented budgets to Parliament using the classic and programmatic nomenclature. By end 2010, the authorities were planning to submit a comprehensive PBB to Parliament, accompanied by performance monitoring documents for the four pilot ministries in 2012 with a roll-out for 2013 (initially targeted for 2009).
The reform was delayed in 2011 following the revolution but was re-launched in 2012. A 2012 circular on performance has now validated the concept of performance-based budgeting. Pilot ministries have introduced modifications in their nomenclature that will enable them report on budget execution on a programmatic basis. During field interviews, the Ministry of Finance indicated that three circulars were to be adopted by end May 2013 to alleviate some of the expenditure control procedures. A new draft Organic Law integrating detailed regulations on the PBB system is now under discussion.

APPENDIX I SUPPLEMENT INFORMATION ON PILLAR 4
96
I.2. Overview of Governance Performance over 2000-10
6. This appendix provides a short description of governance performance over
2000-10 based on the Freedom House Report (2005), Global Integrity Report (2008)
and Bank Governance Index.
BACKGROUND PRIOR TO 2005
7. Tunisia’s pre-revolution political system and the operation of government
lacked transparency and accountability to citizens. The 1959 constitution accords
the president significant powers, including the right to select the prime minister
and cabinet, to rule by decree when the legislature is not in session, and to appoint
the governors of Tunisia's 23 provinces. The legislature, by contrast, serves as a
rubber stamp for the president's policies and does not provide a check on executive
power (2005 Freedom House report).
8. The political system was characterized by an absence of checks and
balances, illustrated by the lack of:
Free elections: “The elections are multiparty but not competitive due to fraud
and because the regime bans truly popular and thus politically threatening
political parties.”(2005 Freedom House report);
Conflict of interest legislation;
Independent review of the executive or legislature: The Cour des Comptes is not
independent of the executive branch. The executive can interfere with this body's
functioning;
Judicial system independence “The executive controls judges' careers, interferes
in their courtrooms, and often dictates their verdicts”. “The government has used
the courts to convict and imprison critics” (2005 Freedom House report).
9. Tunisia, as most countries in MENA, has historically been amongst the
least free in the world. The country was rated “not free”, the lowest rank
possible77. (2005 Freedom House report).
Press freedom was among the most restricted in the Arab world “Despite the
Tunisian government's professed commitment to democracy, it tightly controls
the media and represses dissent through a highly effective system of legal,
financial, and psychological measures. The constitution guarantees freedom of
the press except under conditions laid down by law." The press code stipulates
imprisonment and heavy fines for defamation of government officials and for the
dissemination of "false information," and all local and foreign publications
require a receipt from the government, called a "depot legal," before they can be
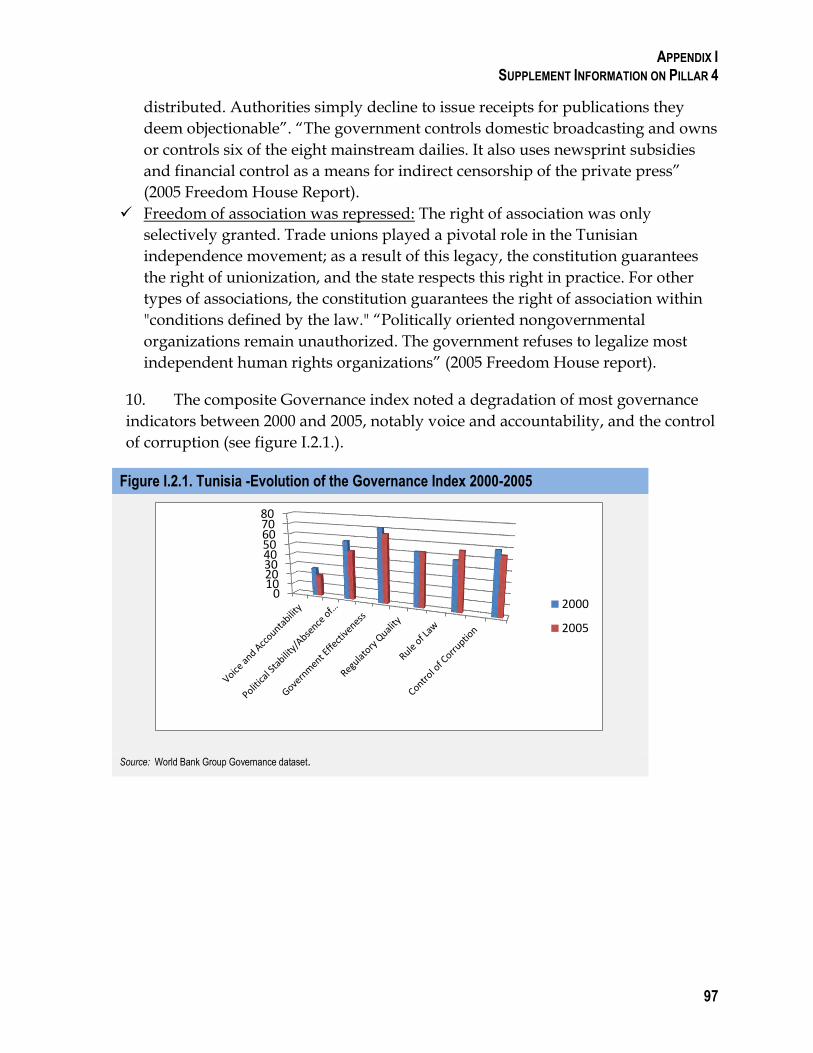
APPENDIX I SUPPLEMENT INFORMATION ON PILLAR 4
97
distributed. Authorities simply decline to issue receipts for publications they
deem objectionable”. “The government controls domestic broadcasting and owns
or controls six of the eight mainstream dailies. It also uses newsprint subsidies
and financial control as a means for indirect censorship of the private press”
(2005 Freedom House Report).
Freedom of association was repressed: The right of association was only
selectively granted. Trade unions played a pivotal role in the Tunisian
independence movement; as a result of this legacy, the constitution guarantees
the right of unionization, and the state respects this right in practice. For other
types of associations, the constitution guarantees the right of association within
"conditions defined by the law." “Politically oriented nongovernmental
organizations remain unauthorized. The government refuses to legalize most
independent human rights organizations” (2005 Freedom House report).
10. The composite Governance index noted a degradation of most governance
indicators between 2000 and 2005, notably voice and accountability, and the control
of corruption (see figure I.2.1.).
Figure I.2.1. Tunisia -Evolution of the Governance Index 2000-2005
Source: World Bank Group Governance dataset.
01020304050607080
2000
2005

APPENDIX I SUPPLEMENT INFORMATION ON PILLAR 4
98
GOVERNANCE OVERVIEW OVER 2005-2010
11. The 2008 global integrity
report78 rates Tunisia’s performance
“very weak” on a number of
dimensions as follows: on executive
accountability (mainly because of the
concentration of power that was subject
to few checks and balances); on
legislature accountability (in the absence
of (i) conflict of interest regulations, (ii)
judicial review of legislative actions, and
(iii) asset disclosure requirements); on
budget processes (as the legislature
provided limited input in the national
budget); and on election integrity (in the
absence of an agency with the
independence and authority to monitor
the integrity of elections or a judicial
process for citizens to contest election
results). Tunisia suffered from
substantial discretion in the application
of laws (e.g. discriminatory enforcement
of tax laws and very weak
implementation of the anti-corruption
law in the absence of an effective anti-
corruption agency to monitor and
enforce the law.).
Figure I.2.2 Global Integrity Report
Source: World Bank Group Governance dataset.
NB. Anti-corruption performance is rated on an absolute scale of 0 to 100 in these categories. The colors correspond to ratings as follows: very strong (90+), strong (80+), moderate (70+), weak (60+), very weak (<60).

APPENDIX I SUPPLEMENT INFORMATION ON PILLAR 4
99
12. The Governance Index also indicates a net degradation of the rating of voice
and accountability between 2005 and 2010 (see figure I.2.3.).
Figure I.2.3.Tunisia - Evolution of the Governance Index 2005-2010
Source: World Bank Group Governance dataset.
010203040506070
2005
2010


101
Appendix J. Analysis of Social Media Outreach
1. Public outreach was recognized from the onset as a key element of the
Tunisia CPE’s design. Given the importance of reaching out to broader groups of
stakeholders in Tunisia and the limited ability for the evaluation team to travel
across the country due to security restrictions, the team opted to use social media
channels to get public feedback on key evaluative questions. With this in mind,
IEG’s Tunisia CPE and Online Communications teams developed a strategy and
outreach plan for the evaluation, using a blend of social media channels that are
most popular in the country and specific online groups used by Tunisian
professionals. The goals were to make the evaluation process transparent, solicit
feedback from a greater number of country representatives, and gather data that
can be triangulated with other sources of data collected by the evaluation team.
2. The team will disseminate the final report broadly, including on the social
media channels consulted during the evaluation, to enhance the usage of the
report’s findings, lessons, and recommendations.
Methodology
3. The online and social media channels selected enabled the team to efficiently
reach a targeted set of stakeholders, and offered the possibility to build an engaged
audience throughout the evaluation process. To achieve its outreach goals, the team
used Facebook and Twitter, the two most popular platforms in the country, and
several LinkedIn groups.
4. All of the questions raised on social media were aligned with the evaluative
questions and topics of the study. The outreach included a combination of open-
ended and poll questions to solicit feedback. Each question was cross-posted on
Twitter several times. The questions were posted sequentially allowing a week to
two weeks for user response.
5. In an effort to build its target audience on its Facebook page, the team used
ads targeted at people from Tunisia. Each question was promoted separately and in
some cases highlighted a few times to receive greater feedback. Facebook users
mostly dominated in poll results — several hundreds to over 7,000 votes per
question.
6. The team also identified professional groups on LinkedIn with attributes
relevant to the evaluative questions on education, business environment,

APPENDIX K STATISTICAL SUPPLEMENT
102
accountability, and voice in Tunisia. Most of the qualitative comments/data was
generated on discussion boards in LinkedIn.
7. On Twitter, IEG created a distinct hashtag79 (#TunisiaEval) to tag its content
and share it with other users. IEG also identified organizations and individuals
who are working or living in Tunisia and dealing with issues of relevance to the
evaluation.
Main Messages and Data
Access to Education
8. Seventy-nine percent of respondents to the Facebook poll did not think that
education received by young people prepares them to find better jobs.
Question: Do you think young people in Tunisia get adequate education and training to find jobs? (combined Arabic and French Poll Results)80
Response Number Percentage
No 7,031 79%
Yes 1,831 21%
There was good education but not anymore 53 1%
Total 8,915
9. In the open-ended responses on various education-related questions, both on
Facebook and LinkedIn, users identified poor quality of education (21%),
corruption in the education system (4%), and inconsistencies between market
demands and education programs (17%) as main reasons for lack of adequate
education. A Facebook user from Tunisia commented saying:
“Most of the studies are theatric, and there is no practical training. This is mostly the problem that we are facing when we are looking for a job in the private sector.” – translated from French
10. Another user from LinkedIn’s Tunisia THEN Group commented:
“The university is there only to provide knowledge without teaching or showing how to use it in practice.” – translated from French.
11. Seventy-one percent of respondents are unaware of programs or projects
implemented by international organizations and think tanks to increase access to
education.

APPENDIX K STATISTICAL SUPPLEMENT
103
Question: Are you aware of any programs and/or activities that international organizations and think tanks are implementing in Tunisia to increase access to education? If yes, please specify what organization(s) you know about
Response Number Percentage
No 500 71%
Yes 207 29%
Total 707
Gender Equality in Political Participation, Access to Jobs, and Voice
12. IEG solicited comments on various topics through the prism of gender
equality. The topics mainly focused on women’s political participation, access to
jobs, and equal voice.
13. On Access to Jobs: Facebook users did not think that men are better off in
finding jobs than women, but the majority of poll respondents (80% of votes)
thought that more unmarried women apply for jobs and more of them work (72%
of votes) than married women. The polls results were:
Question: Do you think it is easier for young men (under 30 years) to find jobs than young women (under 30 years)?
Response Number Percentage
Yes 816 36%
No 1,463 64%
Total 2,279
Question: In your opinion, do more “single” women apply for jobs than “married” women?
Response Number Percentage
Yes 341 80%
No 85 20%
Total 426
Question: In your opinion, do more “single” women work than ‘married’ women?
Response Number Percentage
Yes 375 72%
No 62 12%
I don't know 87 17%
Total 524
14. On Women’s Political Participation: The majority of poll respondents did not
think that women have greater voice in politics after the revolution (75%). This was

APPENDIX K STATISTICAL SUPPLEMENT
104
also reflected in the users’ open ended comments. One of the users said in response
to this question:
“No because women become more oppressed than in Ben Ali government” – comment by a user from Tunisia on Facebook.
Question: Do you think that women have greater participation in politics and are empowered to have a voice in national and local space after the Revolution in Tunisia?
Response Number Percentage
Yes 120 25%
No 358 75%
Total 478
Access to Jobs
15. The majority of respondents felt that more single women work and apply for
jobs than married women.
16. In general, when asked how long it takes for a person under 30 years to get a
job, over 47% of respondents indicated that it took them over a year to do so and
another 47 percent said they got a job within nine months.
Question: If you are under 30 years old young person in Tunisia and are currently not working but looking for work, please tell us how long have you been looking for a job?
Response Number Percentage
1-3 months 119 30%
6-9 months 69 17%
9 month - 1 year 24 6%
More than a year 187 47%
Total 399
Business Environment
17. The majority of respondents to a poll question: what has been the most
important change after the revolution in the business environment, believed that
there has been less government interference (63%) followed by less corruption
(16%).
Question: What has been the single most important change in business environment benefiting the private sector after the Revolution?
Responses Number Percentage
Less interference by the state 98 63%
Less corruption 25 16%
Simpler regulations 18 12%
Lower taxes 5 3%
Easier access to credit 0 0%
Others (please specify) 9 6%
Total 155

105
Appendix K. Statistical Supplement APPENDIX K.1. TUNISIA AT A GLANCE APPENDIX K.2. MILLENNIUM DEVELOPMENT GOALS APPENDIX K.3. TUNISIA ECONOMIC AND SOCIAL INDICATORS, 2005-2012 APPENDIX K.4. TUNISIA AND COMPARATORS (MENA, MOROCCO, EGYPT, LIBYA): KEY ECONOMIC AND SOCIAL
INDICATORS, AVERAGE 2005-2010 APPENDIX K.5. TUNISIA SELECTED GENDER INDICATORS SUMMARY, 2005-2012 APPENDIX K.6. TUNISIA: GOVERNANCE INDICATORS (COMPARISON BETWEEN 1995, 2000, 2005, 2007, 2010, 2011, 2012)

APPENDIX K STATISTICAL SUPPLEMENT
106
Table K.1. Tunisia at a Glance
Key Development indicators Tunisia Middle East & North Africa
Upper Middle Income
2011
Population, mid year (millions) 10.7 337.0 2,372.6
Surface area (thousand sq. km) 163.6 11,370.8 43,472.2
Population growth (annual %) 1.2 1.9 0.8
GNI, Atlas method (current US$ billions) 42.9 2755.2 14768.7
GNI per capita, Atlas method (current US$) 4,020.0 7,101.0 6,224.8
GNI per capita, PPP (current international $) 8,860.0 9,998.0
GDP growth (annual %) -2.0 5.4 6.5
GDP per capita growth (annual %) -3.1 3.4 5.7
Most recent estimate, 2005-11
Poverty gap at $1.25 a day (PPP) (%) 0.3 - 2.8
Poverty gap at $2 a day (PPP) (%) 1.5 - 7.9
Life expectancy at birth, total (years) 74.2 71.4 73.4
Infant mortality (per 1,000 live births) 16.7 24.2 19.8
Child malnutrition (% of children under 5) 3.3 6.0 3.9
Adult literacy, male (% of ages 15 and older) 86.2 86.1 95.8
Adult literacy, female (% of ages 15 and older) 69.7 71.8 91.4
Gross primary enrollment, male (% of age group) 112.2 107.2 110.8
Gross primary enrollment, female (% of age group) 107.4 99.9 110.4
Access to an improved water source (% of population)
94.6 90.1 90.8
Access to improved sanitation facilities (% of population)
87.8 89.6 70.9
1980-1990 1990-2000 2000-2012
(average annual growth %)
2.5 1.7 1.0
3.6 5.1 3.9
3.2 7.0 1.8
4.4 4.4 2.8
6.8 3.0 3.4
4.0 5.3 6.4
3.8 4.6 3.8
5.0 4.1 5.3
0.8 5.5 3.2
4.9 5.0 3.7
3.4 4.0 3.4
- - -
AGE DISTRIBUTION 2011 UNDER 5 MORTALITY RATE (PER 1,000)
Net Aid Flows 1991 2001 2010 2011
(US$ millions)
Net ODA and official aid 354.5 365.4 550.4 918.3
Top 3 donors (in 2011):
France - - 213.5 385.1
Japan - - 118.4 108.9
Spain - - 164.0 88.7
Aid (% of GNI) 2.8 1.7 1.3 2.1
Aid per capita (US$) 42.6 37.8 52.2 86.0
Long term Economic Trend
Consumer prices (annual % change) 8.2 2.0 4.4 3.6
GDP implicit deflator (annual % change) 7.0 2.8 4.7 5.0
Exchange rate (annual average, local per US$) 0.9 1.4 1.4 1.4
Population, mid year (millions) 8.4 9.6 10.5 10.7
GDP (US$ millions) 13,074.8 22,066.0 44,377.7 46,434.6
15 10 5 0 5 10 15
0-4
15-19
20-24
25-29
30-34
45-49
50-64
75-79
Percent of total population
FemaleMale
0
10
20
30
40
50
60
70
1990 1995 2000 2012
Middle East & North Africa Tunisia

APPENDIX K STATISTICAL SUPPLEMENT
107
Structure of the economy % of GDP
Agriculture 19.1 10.7 8.0 8.9
Industry 33.1 30.0 31.1 31.3
Manufacturing 19.4 18.8 18.4 18.1
Services 47.8 59.4 61.0 59.8
Household final consumption expenditure 62.4 61.2 62.5 65.5
General government final consumption expenditure 16.6 16.6 16.2 17.6
Gross capital formation 26.0 26.2 26.5 24.1
Exports of goods and services 40.4 42.8 50.1 48.9
Imports of goods and services 45.3 46.7 54.9 55.8
Gross savings 22.2 22.2 20.5 15.9
Balance of Payments and Trade
(US$ millions)
Exports of goods and services 5277.7 9448.0 22236.1 22685.4
Imports of goods and services 5925.5 10312.6 24350.7 25933.2
Net trade in goods and services - - -2114.6 -3306.2
Current account balance -577.0 -863.0 -2104.4 -3385.7
Current account balance (% of GDP) -4.0 -4.6 -4.8 -7.4
Workers' remittances and compensation of employees, received
524.5 927.1 2063.3 2004.5
Total reserves including gold 866.0 2049.6 9764.3 7785.3
Central government Finance
(% of GDP)
Current revenue (including grants) 29.2 30.5 31.7 32.6
Tax revenue 20.4 22.2 21.8 21.9
Current expenditure 29.4 28.1 30.5 34.1
Current budget balance including grants -4.7 -2.4 -1.5 -3.8
External Debt and Resource Flows
(US$ millions)
Total debt outstanding and disbursed 8251.3 12916.2 22047.7 22335.5
Total debt service 1364.5 1393.5 2358.6 2661.5
Total debt service (% of exports) 26.4 14.3 10.5 10.7
Foreign direct investment (net inflows) 125 452 1334 433
Portfolio equity, net inflows (BoP, current US$) 34 -15 -26 -44
Growth of GDP and GDP per Capita Governance Indicators, 2000 and 2011
0 20 40 60 80
Control of Corruption
Rule of Law
Regulatory Quality
Government Effectiveness
Political Stability and Absence ofViolence/Terrorism
Voice and Accountability
Country's percentile rank (0-100)higher values imply better rankings)
2011
2000

APPENDIX K STATISTICAL SUPPLEMENT
108
Composition of 2011 debt (US$ m Current Account Balance to GDP
Technology and Infrastructure 1991 2001 2010 2011
High-technology exports (% of manufactured exports) 1.8 3.3 4.9 5.6
Mobile cellular subscriptions (per 100 people) 0.0 4.1 106.0 116.9
Roads, paved (% of total roads) 75.5 65.4 76.0 ..
Environment
Agricultural land (% of land area) 59.3 61.1 64.6 64.8
Annual freshwater withdrawals, total (billion cubic meters) .. .. .. 2.9
CO2 emissions (metric tons per capita) 1.9 2.2 2.5 ..
Energy use (kg of oil equivalent per capita) 588.9 797.1 917.0 890.4
Forest area (% of land area) 4.3 5.5 6.5 6.6
GDP per unit of energy use (constant 2005 PPP $ per kg of oil equivalent)
7.7 7.9 9.3 9.2
Renewable internal freshwater resources per capita (cubic meters) .. .. .. 393.0
Terrestrial protected areas (% of total land area) 1.3 1.3 1.3 ..
Private sector development
Bank capital to assets ratio (%) .. 7.5 .. ..
Cost of business start-up procedures (% of GNI per capita) .. .. 5.0 4.2
Market capitalization of listed companies (% of GDP) 5.4 10.4 24.1 20.8
Time required to register property (days) .. .. 39.0 39.0
Time required to start a business (days) .. .. 11.0 11.0
World Bank Group portfolio(US$ millions) 1991 2001 2010 2011
IBRD
Total debt outstanding and disbursed 1,552 1,297 1,381 1,775
Disbursements 297 293 234 597
Principal repayments 125 146 157 151
Interest payments 111 80 42 43
IDA
Total debt outstanding and disbursed 58 37 18 16
Disbursements - - - -
Principal repayments 1.7 2.1 1.9 2.1
Total debt service 2.2 2.4 2.0 2.2
Private; 5,637
Other multilateral; 5,420
Short term; 4,967
Bilateral; 3,683
IBRD; 1,775
IMF; 419IDA; 16
-9
-8
-7
-6
-5
-4
-3
-2
-1
0
05 06 07 08 09 10 11 12

APPENDIX K STATISTICAL SUPPLEMENT
109
Table K.2. Millennium Development Goals
With selected targets to achieve between 1990 and 2015
Goal/ Series name 1990 1995 2000 2005 2010
Goal 1: halve the rates for extreme poverty and malnutrition
Poverty headcount ratio at $1.25 a day (PPP) (% of population) 5.9 6.5 2.6 1.4 1.1
Poverty headcount ratio at national poverty line (% of population) .. .. 32.4 23.3 15.5
Income share held by lowest 20% 5.9 5.7 6.0 5.9 6.7
Malnutrition prevalence, weight for age (% of children under 5) .. .. 3.5 .. ..
Goal 2: Ensure that children are able to complete primary schooling
School enrollment, primary (% net) 92.4 96.7 95.6 99.2 98.7
Primary completion rate, total (% of relevant age group) 80.1 91.6 88.2 101.9 ..
Literacy rate, youth total (% of people ages 15-24) .. .. .. .. ..
Goal 3: Eliminate gender disparity in education and empower women
Ratio of girls to boys in primary and secondary education (%) 83.5 90.3 97.6 101.2 101.0
Share of women employed in the nonagricultural sector (% of total nonagricultural employment)
.. .. 24.3 .. ..
Proportion of seats held by women in national parliaments (%) 4.3 .. 11.5 22.8 27.6
Goal 4: Reduce under-5 mortality by two-thirds
Mortality rate, under-5 (per 1,000) 51.1 38.8 29.6 22.4 17.2
Mortality rate, infant (per 1,000 live births) 40.3 31.6 24.7 19.1 14.8
Immunization, measles (% of children ages 12-23 months) 93.0 91.0 95.0 96.0 97.0
Goal 5: Reduce maternal mortality by three-fourths
Maternal mortality ratio (modeled estimate, per 100,000 live births) 130.0 110.0 84.0 68.0 56.0
Births attended by skilled health staff (% of total) .. 80.5 89.9 .. ..
Contraceptive prevalence (% of women ages 15-49) .. 60.0 65.5 .. ..
Goal 6: Halt and begin to reverse the spread of HIV/AIDS and other major diseases.
Prevalence of HIV, total (% of population ages 15-49) 0.1 0.1 0.1 0.1 0.1
Incidence of tuberculosis (per 100,000 people) 29.0 31.0 25.0 23.0 28.0
Tuberculosis case detection rate (%, all forms) 88.0 87.0 87.0 90.0 80.0
Goal 7: halve the proportion of people without sustainable access to basic needs.
Improved water source (% of population with access) 81.5 85.8 89.4 92.8 95.9
Improved sanitation facilities (% of population with access) 72.6 77.8 81.9 85.7 89.1
Forest area (% of land area) 4.1 .. 5.4 5.9 6.5
Terrestrial protected areas (% of total surface area) 1.3 1.3 1.3 1.3 1.3
CO2 emissions (metric tons per capita) 1.6 1.8 2.1 2.3 ..
GDP per unit of energy use (constant 2005 PPP $ per kg of oil equivalent) 7.4 7.6 7.9 8.7 9.3
Goal 8: Develop a global partnership for development
Telephone lines (per 100 people) 3.7 5.8 10.1 12.7 12.3
Mobile cellular subscriptions (per 100 people) 0.0 0.0 1.3 57.3 106.0
Internet users (per 100 people) 0.0 0.0 2.8 9.7 36.8
Source: World Bank MDG database
90
95
100
105
2000 2002 2004 2006 2008 2010
Primary net enrollment ratio
Ratio of girls to boys in primary and secondary education
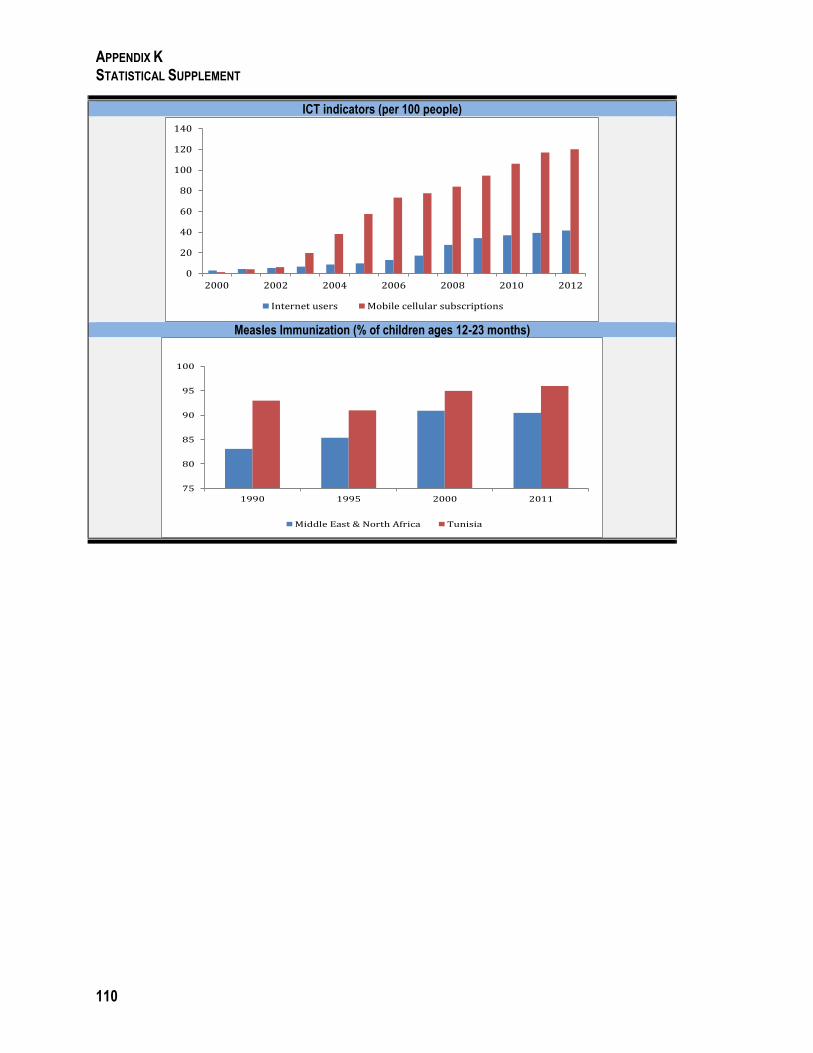
APPENDIX K STATISTICAL SUPPLEMENT
110
ICT indicators (per 100 people)
Measles Immunization (% of children ages 12-23 months)
0
20
40
60
80
100
120
140
2000 2002 2004 2006 2008 2010 2012
Internet users Mobile cellular subscriptions
75
80
85
90
95
100
1990 1995 2000 2011
Middle East & North Africa Tunisia

APPENDIX K STATISTICAL SUPPLEMENT
111
Table K.3.Tunisia Economic and Social Indicators, 2005-12
Series name 2005 2006 2007 2008 2009 2010 2011 2012
Growth and inflation
GDP growth (annual %) 4.0 5.3 6.3 4.6 3.0 3.0 -2.0 3.6
GDP per capita growth (annual %) 3.0 4.3 5.3 3.6 2.0 1.9 -3.1 2.6
GNI per capita, Atlas method (current US$) 3,200.0 3,370.0 3,560.0 3,890.0 4,100.0 4,150.0 4,020.0 4,150.0
GNI per capita, PPP (current international $) 6,820.0 7,380.0 7,950.0 8,380.0 8,660.0 8,950.0 8,860.0 9,360.0
Inflation, consumer prices (annual %) 2.0 4.5 3.4 4.9 3.5 4.4 3.6 5.5
Composition of GDP
Agriculture, value added (% of GDP) 10.1 10.2 9.4 8.5 9.1 8.0 8.9 8.7
Industry, value added (% of GDP) 29.2 29.7 31.4 33.8 30.3 31.1 31.3 29.9
Services, etc., value added (% of GDP) 60.7 60.1 59.2 57.7 60.6 61.0 59.8 61.4
External accounts
Exports of goods and services (% of GDP) 44.9 46.0 51.2 56.3 45.7 50.1 48.9 48.0
Imports of goods and services (% of GDP) 45.3 47.9 53.1 59.4 48.4 54.9 55.8 58.6
Current account balance (percent of GDP) -0.9 -1.8 -2.4 -3.8 -2.9 -4.8 -7.4 -8.2
Present value of external debt (% of GNI) - - - - - - 45.2 -
Total debt service (% of GNI) 6.6 7.7 6.8 4.8 5.1 5.6 6.0 -
Other macroeconomic indicators
Gross domestic savings (% of GDP) 21.3 21.6 22.0 23.0 22.0 21.2 16.8 14.2
Gross fixed capital formation (% of GDP) 21.3 22.6 23.1 23.6 24.1 24.5 21.5 22.7
Gross fixed capital formation, private sector (% of GDP)
18.3 19.5 20.2 20.8 20.7 21.2
Gross savings (% of GDP) 20.3 21.2 20.9 21.7 21.4 20.5 15.9 -
Fiscal accounts
Cash surplus/deficit (% of GDP) -2.8 -2.4 -2.0 -0.6 -1.5 -1.4 -3.7
General government final consumption expenditure (% of GDP)
16.9 16.7 16.5 16.1 16.2 16.2 17.6 13.8
Gross national expenditure (% of GDP) 100.4 101.9 101.9 103.1 102.9 105.3 107.3 110.1
Revenue, excluding grants (% of GDP) 26.2 26.4 27.0 29.3 28.6 28.8 31.0 -
Social indicators
Health expenditure, public (% of GDP) 2.9 3.0 3.0 3.0 3.2 3.1 3.4 - Immunization, DPT (% of children ages 12-23 months)
98.0 99.0 98.0 99.0 99.0 98.0 98.0 -
Improved sanitation facilities (% of population with access)
85.7 86.4 87.1 87.8 88.5 89.1 89.8 -
Life expectancy at birth, total (years) 73.5 73.9 74.2 74.3 74.5 74.6 74.8 - Mortality rate, infant (per 1,000 live births) 19.2 18.3 17.4 16.6 15.8 15.0 14.4 13.8
Out-of-pocket health expenditure (% of private expenditure on health)
84.2 85.5 86.8 86.9 87.3 87.8 87.9
Population growth (annual %) 1.0 1.0 1.0 1.0 1.1 1.0 1.2 1.0
Population, female (% of total) 50.1 50.2 50.2 50.2 50.3 50.3 50.4 50.4
Population, total 10.0 10.1 10.2 10.3 10.4 10.5 10.7 10.8
Poverty headcount ratio at national poverty line (% of population)
23.3 - - - - 15.5 - -
School enrollment, preprimary (% gross) - - - - - - - -
School enrollment, primary (% gross) 112.2 111.4 108.5 108.0 108.8 110.2 109.9 -
School enrollment, secondary (% gross) 85.5 87.2 90.5 92.1 90.5 90.4 92.6 -
School enrollment, tertiary (% gross) 30.9 31.8 31.6 33.6 34.4 35.8 37.1 -
Telephone lines (per 100 people) 12.7 12.7 12.6 12.1 12.3 12.3 11.5 10.3
Unemployment, total (% of total labor force) 12.9 12.5 12.4 12.4 13.3 13.0 - -
Source: World Development Indicators data as of September 23, 2013.

APPENDIX K STATISTICAL SUPPLEMENT
112
Table K.4.Tunisia Economic and Social Indicators, 2005-12
Series name Tunisia Egypt Libya MENA Morocco
GDP growth (annual %) 3.5 4.9 5.5 5.0 4.4
GDP per capita growth (annual %) 2.4 3.2 3.9 2.9 3.2
GNI per capita, Atlas method (current US$) 3,805.0 2,112.5 10,492.0 5,734.6 2,566.3
GNI per capita, PPP (current international $) 8,295.0 5,875.0 16,486.0 9,805.1 4,332.5
Inflation, consumer prices (annual %) 4.0 10.0 5.9 4.8 1.8
Agriculture, value added (% of GDP) 9.1 14.0 2.1 6.9 15.3
Industry, value added (% of GDP) 30.8 37.1 77.2 51.0 28.7
Services, etc., value added (% of GDP) 60.1 48.9 20.8 42.1 56.0
Exports of goods and services (% of GDP) 48.9 26.1 68.2 51.1 34.2
Imports of goods and services (% of GDP) 52.9 30.8 27.6 38.9 44.4
Current account balance (% of GDP) -4.0 -0.6 33.3 N/A -3.6
Present value of external debt (% of GNI) 45.2 13.3 N/A N/A 25.5
Total debt service (% of GNI) 6.1 1.9 N/A N/A 4.4
Gross fixed capital formation (% of GDP) 22.9 18.8 22.4 22.6 30.4
Gross fixed capital formation, private sector (% of GDP) 20.1 11.7 4.2 N/A 25.6
Gross domestic savings (% of GDP) 20.3 14.3 61.6 37.4 23.6
Gross savings (% of GDP) 19.5 21.0 62.3 39.7 30.4
Revenue, excluding grants (% of GDP) 28.2 25.8 N/A N/A 33.1
General government final consumption expenditure (% of GDP)
16.3 11.6 10.8 16.2 18.3
Gross national expenditure (% of GDP) 104.1 104.7 59.5 N/A 110.2
Cash surplus/deficit (% of GDP) -2.1 -7.0 N/A N/A -0.4
Life expectancy at birth, total (years) 74.2 70.0 74.3 71.4 69.7
Immunization, DPT (% of children ages 12-23 months) 98.4 97.3 98.0 91.2 98.0
Mortality rate, infant (per 1,000 live births) 16.3 21.4 16.1 23.8 30.6
Out-of-pocket health expenditure (% of private expenditure on health)
86.6 97.9 100.0 78.1 87.0
Health expenditure, public (% of GDP) 3.1 2.0 1.9 2.7 1.9
Population growth (annual %) 1.0 1.7 1.4 2.0 1.1
School enrollment, primary (% gross) 109.8 103.4 111.5 103.6 109.5
School enrollment, secondary (% gross) 89.8 71.5 107.1 75.1 59.8
School enrollment, tertiary (% gross) 33.6 30.4 N/A 27.5 12.5
Population, total (millions) 10.4 76.2 5.9 369.4 31.2
Telephone lines (per 100 people) 12.1 12.9 15.7 16.6 8.7
Unemployment, total (% of total labor force) 12.7 9.6 N/A 10.8 9.6
Poverty headcount ratio at national poverty line (% of population)
19.4 22.1 N/A N/A 9.0
Improved water source (% of population with access) 94.6 98.6 N/A 90.1 81.3
Improved sanitation facilities (% of population with access) 87.8 94.5 96.5 89.6 69.3
School enrollment, preprimary (% gross) N/A 21.7 9.4 24.4 59.4
Population, female (% of total) 50.3 49.8 48.9 48.5 50.8
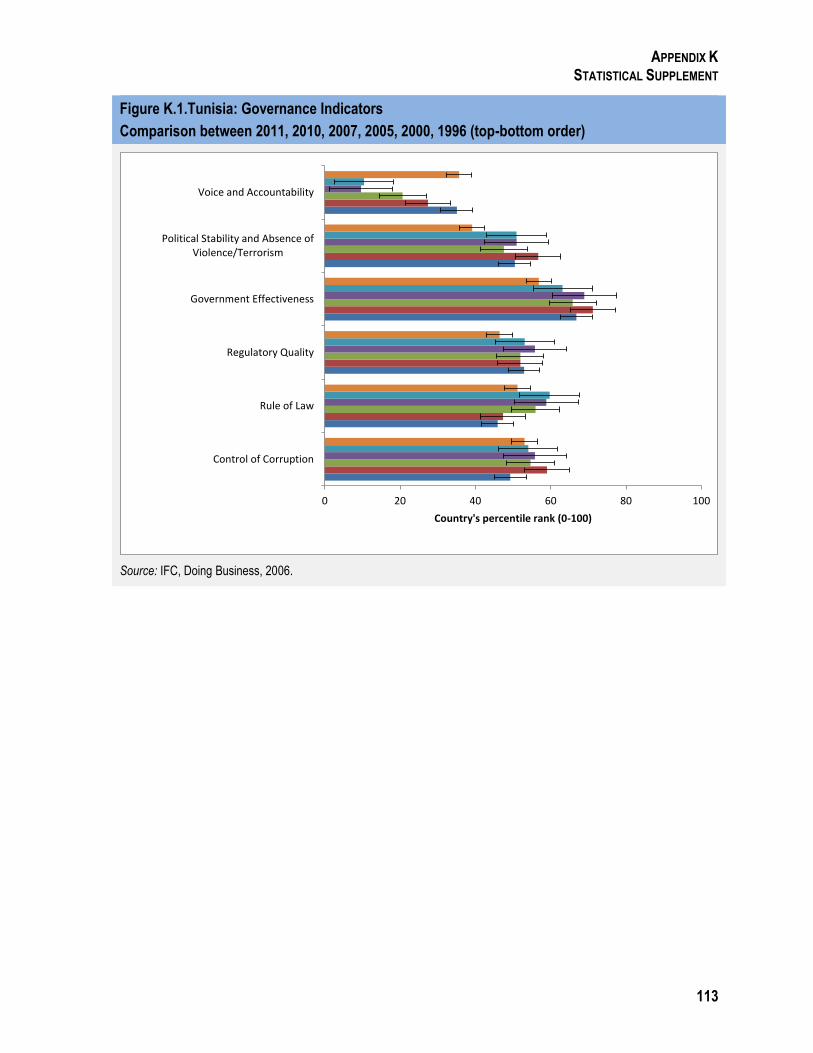
APPENDIX K STATISTICAL SUPPLEMENT
113
Figure K.1.Tunisia: Governance Indicators
Comparison between 2011, 2010, 2007, 2005, 2000, 1996 (top-bottom order)
Source: IFC, Doing Business, 2006.
0 20 40 60 80 100
Control of Corruption
Rule of Law
Regulatory Quality
Government Effectiveness
Political Stability and Absence ofViolence/Terrorism
Voice and Accountability
Country's percentile rank (0-100)


115
Appendix L. Gender
Introduction
1. Tunisia is considered one of the advanced countries in the MENA region
with regards to gender parity. The introduction of the Personal Status Code soon
after Tunisia achieved independence (1956) led to legal reform that gave equal
rights to women and men. The code outlawed polygamy, required mutual consent
for marriage, and gave married women the right to vote, travel, work, file for
divorce, sign contracts, and open bank accounts without their husband’s
permission. Significant progress was achieved in improving health and education
outcomes, and Tunisia is on track to achieve the MDGs.
Legal Status of Women in the Post-Revolution Era
2. Post-revolution, issues concerning the social status and political participation
of women have been at the forefront of public debate due to divided opinion
between religious and secular factions. For the World Bank Group, maintaining and
advancing the role of women in Tunisia through the political transition is a
priority.81 In the re-drafting of the constitution, the extent to which the rights of
women will remain protected is uncertain. Representative groups consulted over
the course of the field work for this evaluation82 expressed concerns about the
effectiveness of the Convention on Elimination of All Forms of Discrimination
against Women (CEDAW) and the extent to which current ambiguity threatens
women’s rights.
3. Several human rights and women’s organizations have criticized the
violation of women’s rights by conservative Islamists associated with the coming to
power of the Ennahda Islamist party in October 2011, and the rise of radical
religious groups such as the Salafists.83 Consequently, women’s rights activists have
been closely monitoring the drafting of the new Constitution. Following a strong
showing of opposition in August 2012, they were successful in securing a change in
the wording of a draft of the constitution, ensuring that women are legally
regarded as ‘equal’ to, rather than merely ‘complementary’ to, men under the law.
Gender-based Analysis
4. The Gender analysis for the Tunisia CPE involves an analysis of gender-
based outcomes along three dimensions: human development (including health
and education), economic empowerment (including employment and
microfinance), and voice and participation (at the local and national level). The

APPENDIX L GENDER
116
analysis primarily relies on secondary data from World Bank project documents,
country strategy documents, and analytical work. Qualitative data was also
collected through IEG’s mission to Tunisia in July 2013 as part of this evaluation.
HUMAN DEVELOPMENT
(i) Health
5. Overall, the population’s health status in Tunisia is better than in most other
MENA countries. Health-related MDGs are on track to be achieved, and
approximately 85 percent of the population is covered by two national social
assistance schemes.84 Rapid progress has been made on reducing the rates of infant
and maternal mortality, and malnutrition over the past two decades. HIV/AIDS
prevalence remains relatively low.
6. Despite successes on health care outcomes, access to care in rural areas
continues to be a challenge even though Tunisia has a well distributed network of
public health facilities (also alluded to in the Health DPL which was cancelled). In
IEG consultations with health officials, regional disparities in health came up as an
important issue. Women in underserved regions report foregoing necessary
prenatal health care due to cost and distance,85 with rural women being up to four
times as likely as their urban counterparts to report foregoing antenatal care
because of a lack of local services. Underserved rural regions in Tunisia also tend to
have three times fewer doctors, contributing to a gap in maternal and child health
indicators between rural and urban areas (e.g., a 30 percent higher rate of MMR in
rural areas compared with urban areas)86. About 70 percent of births in rural areas
are attended by a skilled professional, compared to nearly 95 percent of births in
urban areas as of 2007.87
7. The Bank is supporting the health sector through the Community Health
Collaborative JSDF. The main objective of this project is to improve health quality
and health service delivery for reproductive health in under-served and peri-urban
areas through community involvement in planning and delivery.88 However, the
project has faced implementation challenges since it was approved in 2011. Per the
most recent ISR, no current PDO indicators or Intermediate Results Indicators were
reported. 89
8. Overall, the Bank did not focus on health care access issues for rural
communities, especially rural women, where there was an urgent need as women
were foregoing prenatal health care due to factors associated with cost and distance
(mentioned above). The Governance and Opportunity DPL showed that the
number of community health workers (100 new community health workers in 23

APPENDIX L GENDER
117
governorates) and mobile clinics remained low (13 mobile clinics) during the DPL
period.90 As referenced in the Governance and Opportunity DP L (Priority Action
#9), government was not able to institutionalize an inter-ministerial coordination
package for health, education and social protection services for underserved
regions. The Bank could have prioritized filling the health care access gaps for
prenatal care between rural and urban women; however, for almost seven years, its
health program focused on hospital accreditation (leading to a decree in 2012) with
no evidence that this contributed to better quality of care for low-income groups.
The Bank might also have considered addressing the financial and efficiency
problems in the free medical care system (referenced in chapter 5 of the evaluation)
targeted to the poor.
(ii) Education
9. Tunisia has achieved considerable success in closing gender gaps in
education and is on track to meet relevant MDGs. Near universal enrollment (97.4
percent) at primary school was achieved for both boys and girls aged between 6
and 11 years (2007-08). In the same period, the primary completion rate for girls (91
percent) was higher than that for boys (87 percent).
10. The Bank supported four projects in the education sector between 2005-12:
the Education Quality Improvement Project I or EQIP I (FY00), EQIP II (FY04),
Higher Education Reform Support II (FY98), and Higher Education Reform Support
III (FY06). During the EQIP1 and EQIP 2 timeframe, completion rates for girls
exceeded those of boys in basic education and secondary education.91 The dropout
phenomenon, particularly for boys, continued to be a cause of concern but did not
form a specific focus for Bank projects. 92 The Higher Education Reform Support
Project II (FY98) and the Higher Education Reform Support Project III (FY06)
focused on providing infrastructure to public and private institutions to promote
higher education, improve internal and external efficiency, and enhance financial
sustainability of the public higher education system. The projects did not have a
gender focus.
11. Overall, Tunisia’s success in achieving gender parity in education has
allowed the Bank to focus more on infrastructure and efficiency issues in education
rather than on more traditional issues such as increasing enrollment at school.
However, from a gendered perspective, the phenomenon of school dropout among
boys, could have provided a focus as could the transitioning of young women from
education to the labor market.

APPENDIX L GENDER
118
ECONOMIC EMPOWERMENT
(i) Microfinance
12. The World Bank Group has engaged with microfinance in Tunisia since
2007, primarily through IFC. IFC support led to increased lending to micro-
enterprises, especially those owned by women. The impact was confirmed through
consultations with clients93 who reported increases in income that allowed them to
provide better nutrition for their families, improve their purchasing power for
buying household goods, as well as become economically independent from their
husbands. Women clients were engaged in diverse businesses like selling luggage,
detergents, and buying carpets and blankets from Libya to sell in Tunisia. They
were provided services beyond loans, like demand-driven vocational training (e.g.
baking, hair dressing), and social support groups (‘sensitization circles’) that allow
women to share domestic problems. IFC also provided technical assistance, and
contributed to impressive scalability, but linkages to external markets for
microfinance clients remain limited. IFC and World Bank could play a role in
helping connect these artisans (most of whom are women) to markets within
Tunisia and internationally.
(ii) Employment
13. A recent World Bank report on gender equality and development in MENA
highlights the gender equality paradox in the region where investments in human
development have narrowed gender gaps in education and health, but have not
translated into higher rates of female participation in economic and political life.94
14. In Tunisia, the Bank engaged in employment issues through lending
(including employment DPLs prior to the revolution and the GO and GOJ DPL
after 2011), and through programmatic analytical work throughout the evaluation
period (using the MILES framework).
15. Tunisia suffers from high rates of unemployment - the national
unemployment rate was 18.9 percent in 2011 in the aftermath of the Revolution,
decreasing to 15.9 percent in mid-2013.95 Unemployment rates are much higher
among women at 27.6 percent in 2011, up from 15.4 percent in 2005.96 For men,
unemployment rates were comparatively lower at 15.3 percent in 2011 and 12.4
percent in 200597 . More women than men with higher education levels are
unemployed. For example at the end of 2011, 48 percent of women graduates were
unemployed compared with 31 percent of their male counterparts.98 The ISN FY13-
14 recognizes that unemployment disproportionately affects women graduates.99

APPENDIX L GENDER
119
16. Also, unemployment is increasingly concentrated among youth and
graduates (increasing from 13.3 percent in 2005 to 33.2 percent in April 2013), which
tend to be the most productive group in the population.100 Unemployment is
concentrated geographically in the North-West (at 20.3 percent) and the interior
South of the country (at 23.5 percent).
17. The Bank’s Employment DPL did not yield desired outcomes, and this is
reflected in its ‘unsatisfactory’ performance.101 There was no specific gender-related
focus to address gender gaps in employment. The objectives of the DPL were
narrowly focused on stimulating ALMPs the Active Labor Market Programs
(ALMPs) and migration, which mostly benefited formal sector employees and
University graduates. However, despite the fact that Bank diagnostics show that
unemployment and underemployment among low-income groups to be a more
serious problem, its employment programs focused on the relatively small
privileged group of university graduates. Given the high rates of unemployment
for women graduates in urban areas and unemployed women with primary school
education in rural areas (many of whom work in agriculture), a gender-targeted
approach to tackle unemployment in urban and rural areas may have been fruitful.
For example, in rural areas, even though the Bank’s Northwest projects focused on
participatory approaches to encourage women’s role in community meetings, a
clearer focus on sustained income generation mechanisms like the formation of
cooperatives for agri-business would have been helpful (especially for home-based
businesses like soap or oil production). In urban areas, tackling women’s
unemployment through youth focused employment programs with an emphasis on
enhancing skill sets for the job market as well as training for building
entrepreneurship skills, may also have been beneficial. That said, we recognize that
addressing employment issues for women could not be done in isolation since there
were other, significant challenges related to private sector growth, an overall lack of
jobs in the public sector and private sector, and weak government capacity to
implement employment programs.
18. Consultation with stakeholders showed that a major challenge faced by
female entrepreneurs is the lack of access to markets. UTICA started a National
Chamber of Business Women (Chambre Nationale Des Femmes Chefs D’
Entreprises or CNFCE) to encourage women entrepreneurs to join the federation.
CNFCE has a membership of 600 women entrepreneurs, and has 24 chapters
located across all Tunisian Governorates. These chapters provide relevant training
to youth (e.g., preparing business plans), and seek to educate members on new
financial and labor laws. CNFCE has worked with USAID, and other organizations

APPENDIX L GENDER
120
(like Vital Voices and Foundation for the Future). Some of the challenges faced by
CNFCE members include knowledge gaps (e.g., pricing of raw materials and the
final product in industries like agri-business, pharmaceuticals, and plastic), as well
as a lack of access to markets. The World Bank could engage by providing TA to
business women so they can better prepare themselves for market linkages.
VOICE AND PARTICIPATION
(i) National Level Participation
19. Overall the involvement of women in national level politics in Tunisia has
been weak compared to a strong presence of women in positions of leadership in
the NGO sector, in academia, and as human rights activists
20. There has been little Bank engagement to encourage women’s role in state-
building in Tunisia. Bank projects did not focus on the role of women as negotiators
or public administrators. In the post-Revolution times, this can be attributed to the
controversial and divided public opinion between religious and secular factions
around women’s political participation in Tunisia as well as the uncertain political
future making this a particularly challenging issue from a Bank perspective.
(ii) Local Level Participation
21. Women’s participation at the community level and local level continues to be
a challenge in Tunisia. Despite Bank efforts to integrate participatory approaches in
some projects, women’s involvement and attendance in community level planning
continues to be low. However, in the post-Revolution era, the NGO sector has
gained momentum as regulations around establishing NGOs have been relaxed.
Both religious and secular NGOs have mushroomed, working in urban and rural
areas on citizenship education issues, human rights, and constitutional rights of
women. However, the emergence of NGOs has not necessarily contributed to an
organized voice for women or led to the formation of social support networks and
social capital. There is a clear divide between the secular and religious NGOs and
the approaches they take to empower women. The bankruptcy of national level
NGOs like the National Union of Tunisian Women (UNFT) 102 has further taken
away from the formation of a unified women’s movement, and outcomes are yet
evident.
CONCLUSION
22. While Tunisia has achieved better outcomes for health and education
compared to several other MENA countries, gender disparities that impact women
exist in access to health care particularly in rural areas. Gender disparities in school

APPENDIX L GENDER
121
completion have emerged that disproportionately impact boys. The Bank Group
has contributed positively to economic empowerment for women through
microfinance but did not prioritize employment opportunities for women in rural
or urban areas. Voice and participation issues for women continue to be a cause of
concern, and remain uncertain in the post-Revolution era due to the divide between
the religious and secular factions of the population.
23. Based on the findings of this analysis, a gendered-approach is recommended
for the health sector to target rural women for access to prenatal care, as well as for
increasing employment opportunities for women graduates in the urban areas and
women with primary education in the rural areas. Clearly a combination of factors
would have to be considered for service delivery (like the increase in community
health workers and mobile clinics), as well as government capacity building in
order to address rural health focused issues. Alternative models like contracting
health care to NGOs in remote areas (as was done in Afghanistan) can also be
considered. Analytical work around addressing barriers to women’s access to
employment and distinguishing between short-term gains (for e.g., vocational
training for graduate women and assisting with setting up of small-scale or
cooperative based agri-business in rural areas) and long-term gains (on behavioral
change issues like fewer women joining the workforce after marriage) can help
address high unemployment rates for women.


123
Appendix M. Persons Interviewed
Former government Officials
Mr. Saidi Aidi Former Minister of Education Mr. Jolel Ayed Former Minister of Finance Mr. Mohamed Agrebi Former Director General, Assistance to Enterprises,
Ministry of Industry and Trade Mr. Yassine Brahim Former Minister of Equipment Mr. Ouissem Ghorbel Former Advisor to the Ministry of Employment and
Training Mr. Nouri Jouini Former Minister of Cooperation Mr. Eyles Jouini Former Minister of Economic Reforms Mr. Salem Miladi Former Minister of Equipment Mr. Aberraouf Ounaies Former Ambassador and Minister of Foreign Affairs
after the Revolution Mr. Ali Saana Former Advisor, Ministry of Training and
Employment Mr. Ahmed Smaoui Former Minister of Tourism Mr. Abdelhamid Triki Former Minister of Planning
Current government Officials
Premier Ministère Mr. Fares Bessrour Director General, Department of Administrative
Reforms Mr. Khaled Johmani Director, Observatoire National des Marchés Publics
(ONMP) [National Procurement Observatory] Khaled Laadhrie Head, “Contrôle général services publics”
Ministry of Investment and International Cooperation Mr. Abdallah Zekri Director of International Cooperation Ms. Lamia Zribi Director General Macro Planning Ministry of Finance Mr. Khochtali Director General, “Unité gestion budgétaire par
objectifs (GBO)” Ms. Nawrez Ben Ticha Counselor, “Unité gestion budgétaire par objectifs
(GBO)” Ms. Faouzia MoussaSaïd Head of Budget Department Mr. Abdelmalek Saadaoui Director General, “Direction Générale des
Ressources et des Equilibres “ Ministry of Education Mr. Mohamed Tonn Director General of Facilities and Equipment Mr. Riadh Ben Boubaker Director, Department of Educational Innovation and
New Technology Mr. Hédi Saidi Director of Studies, Planning and Programming Mr. Houcin Swissi Evaluation and Quality Department Mr. Mohamed Naceur Chraitih’sini Director General, “Unité gestion budgétaire par

APPENDIX M PERSONS INTERVIEWED
124
objectifs (GBO)” Mr. Karim Mustapha Bouamoud Deputy Director, “Unité gestion budgétaire par
objectifs (GBO)” Mr. Issam Boukhtir Head, “Unité gestion budgétaire par objectifs
(GBO)” Ministry of Employment and Training Ms. FaizaKallel Director of Employment Ben Touati Mohsen Chief Engineer and Deputy Director Chief Engineer and Deputy Director Chief of Cabinet Ministry of Health Mr. HelmiJebali Director, “Unité gestion budgétaire par objectifs
(GBO)” Dr. Ben Saleh Director of Primary Healthcare Dr. Ben Brahim Director of Planning Dr. Nabil Ben Salah Directeur de la recherche médicale, Direction
générale de la santé Ministry of Higher Education and Scientific Research Ms. Najla Romdane Director of Higher Education Mr. Adel Ben Amor Director, Direction générale de la rénovation
universitaire Ministry of Agriculture Mr. RidhaMasmoudi PISEAU II Coordinator Ms. Raqya Al-Latiri DGREE Director Mr. Ismail Garbi Officer in charge of performance-based objectives
(Chargé des questions liées à la gestion par objectif) Mrs. Narjess Hamrouni, Director, Rural Women Support Unit Ministry of Equipment Mr. Cherif Ghazi Director of Roads Ministry of Transport Mr. Ramzi Khaznada Director of Planning Ministry of Information Technology and Communication Mr. Mohamed Ben Amor Deputy Director Ministry of Solidarity and Social Affairs Mr. Khaled Ben Youssef Former lead for the component of eDisability Mr. Mohamed Zribi Director General of Social Promotion Ms. Najet DkhilGulai Senior Director of Promotion of Poor Families Ministry of Governance and corruption Mr. Mohamed Tarek Bahri Director General Ministry of Commerce and Handicrafts Mr. Khaled Salhi Director
APPENDIX M PERSONS INTERVIEWED
125
Cour des Comptes Mr. Abdelkade rZgoulli First President M. Abellatif Kharrat Advisor Ms. Hend Gongs Advisor M. Mohamed Rafik Kraiem Advisor
Central Bank
Mr. Chedly Ayari Governor Mr. Mohamed Rekik Vice-Governor Mrs. Monia Saadaoui Director of International Relations, Head of the
Financial Intelligence Unit Mr. Ahmed Tarchi Director General of Studies, Research and Statistics Mr. Mohamed Toujani Director of Economic Studies Skander Turki Head of Department in charge of International
financial institutions
Government Agencies
Agence nationale pour l’emploi et le travail (ANETI)
Ms. Saloua Lachheb Fezzani, Director of International Cooperation Anne-Catherine Belier, Expert
Banque tunisienne de Solidarité (BTS) Instance Nationale de la Lutte contre la Corruption (National Corruption Office)
Mr. Mohamed Ben Mohamed, Chairman Mr. Samir Annabi, President
Centre national d’innovation pédagogique de recherche en éducation
Mr. Belgacem Lassoued, Director General
Chamber of Commerce Mrs. Leila Belkhiria Jaber, Vice President, The National Chamber Of Business Women
COTUNACE (Tunisienne d'Assurance de Commerce Extérieur (COTUNACE) Insurance company
Ms. Chabchoub, Chairman and CEO
Agence Tunisienne d'Internet Institut Tunisien de la Compétitivité et des Etudes Quantitatives (ITCEQ) [Tunisian Institute of Competiveness and Quantitative Studies)
Mr. Kamel Saadaoui, Chairman & CEO
Observatoire national des emplois et qualifications (ONEQ)
Ms. Fatma Moussa, Director
Office de la Marine Marchande et des Ports Fonds 21-21 Mr. Taieb Zerai, Coordinator Institut National des Statistiques (National Statistics Institute)
Mr. Jalleledine Ben Rejeb, Director General Mr. Hamouda Ben Lamine, Director of statistics coordination and international cooperation M. TahaKhsib Mr. Hassen Arouri Mr. Helel Yemen Mr. Ferchichi Arbia, Gender Focal point
UTSS (Union Tunisienne de Solidarité Sociale)
Ms. Latifa Rahmani Project Coordinator Ms. Samia Mzoughi, Financial Management Specialist

APPENDIX M PERSONS INTERVIEWED
126
Private Sector
Amen Bank Mr. Boutheima Bouhlel and Rejeb Chebel Attijari Bank Ms. Neijla Aissa BIAT (Banque Internationale Arabe de Tunisie)
Mr. Masmoudi Zied, Director General
Hexabyte Mr. Nassr Hidoussi, Chairman & CEO Mr. Slim Chaker Former counterpart on export-promotion projects IM Bank (International Maghreb Merchant Bank)
Mr. Hichem Ben Fadhl, CEO
L’Institut Arabe des Chefs d’entreprises (Arabic Institute of Business Managers)
Mr. Ahmed Bouzguenda, Président
Tunisie Telecom Mr. Mohamed Fadhel KRAIEM, Deputy CEO Mr. Mohamed Fadhel KRAIEM, Deputy CEO
Mr. Khaled Ben Younes, Director ICT
Orange Tunisie Mr. Didier Charvet, Chairman & CEO
Tunisie Cable Mr. Hedi Sellami
Private export company Mr. Ahmed Belkhodja Lawyer, Ferchiou& Associés Avocats & Conseils Juridiques
Mr. Noureddine Ferchiou
Hospitals
Hôpital Charles Nicolle Dr. Amel Ben Said, Physician and Administrator
National Companies
Office de développement sylvo-pastoral du nord (ODESYPANO)
Mr. Kamel Aloui, Coordinator Mr. Ahmed Bousselmi, Fourth Northwest Mountainous and Forested Areas Development Project Manager
Ms. Amouri Amel, Sociologist Office national de l’assainissement (ONAS) Mr Khalil Atti, Chairman & CEO
Mr. Najib Abid, Director of Studies Mr. Ali Chaabi, Regional Director Mr. Nefza Jamel, Regional Director Mr. Soussi Mohamed, Counselor Société nationale des Chemins de Fer Tunisien (SNCFT)
Mr. Chedli Guizani, Chairman & CEO
Société nationale d’Exploitation et de Distribution des Eaux (SONEDE)
Mr. Adned Boubakeur, Director of Studies
Higher Education
Institut préparatoire aux écoles d'ingénieur (Preparatory School of Engineers)
Mr. Moncel Boughtir, Director
University of Carthage Université de Carthage Universities Mr. Mohamed Ben Romdhane, Professor in

APPENDIX M PERSONS INTERVIEWED
127
Economics and Consultant Hafidah Chekir, Law Professor and Activist, Co-
founder, Faculté de Droit et des Sciences (Law School)
Mr. Moncef Ben Sliman, President of Lam Echaml and Professor at Forum Unviersitaire
Ms. Imen Azouzi, Professor and Women’s rights activist
Mrs. Amel GRAMI, Professor of Gender Studies and Islamic Studies, journalist, women's rights and human rights activist, Manuba University
Civil Society
Democratic Control of Armed Forces (DCAF) Mr. Jonas Loetscher, Regional representative Prof. Haykel Ben Mahfoudh, Senior Advisor Dr. Lina Zekri, “Gender and Security” Project
Manager National Union of Tunisian Women RadhiaJerbi, President
UTICA Mustapha Baccouche, in charge of Higher Education,
Training and Employment, Private Sector Arab Institute of Human Rights Ms. Lamia Grar, Executive Director Ms. Jalila Boukari, Human Rights Education and
Training Officer Touensa Mrs. HajerTrabelsi, Head of Projects, Access to
Information ENDA Mrs. Saloua Saidi, Branch Supervisor Mrs. Asma Bahia, Chief Audiovisual Communication
Officer Mr. Hassen Jami, ENDA Agent at ENDA Sidi
Hassine Branch Mr. Fadhel Briki, Marketing, études and nouvelles
technologies Center of Arab Women for Training and Research (CAWTER)
Dr. Soukeina Bouraoui, Executive Director
Mr. Malek Baklouti, Project Coordinator Lam Echaml Ms. Imen Azouzi, Professor, and Women's Rights
Activist Mr. Moncef Ben Sliman, President of Lam Echaml Ms. Afef Mubarak, Member of Executive Committee Ms. Nejar Essouki, Project Manager
Donors
SDC - Swiss Agency for Development and Cooperation
Dr. Danielle Mewly Monteleone, Deputy Director of Cooperation Dr. Nejla Ghachem Ep. Cherif, Head of National Program
African Development Bank Mr. Mohamed Kalif, Division Manager

APPENDIX M PERSONS INTERVIEWED
128
World Bank Staff
Former Bank Staff Theodore Alhers Former Country Director (2007-2010) Catherine Laurent Michel Bellier
Former Senior Public Sector Management Specialist (2009-2011) Former Lead Transport Specialist
Current Bank Staff Ismael Arslan Senior Evaluation Officer, IEGCC Salim Benouniche Lead Procurement Specialist, MNAPC Garry Charlier Senior Rural Development Specialist, MNSWA Antoine Courcelle-Larousse Principal Operations Officer, CMEMR Marouane El Abassi Former Senior Economist (2007-2012), current
Representative MNCLY Sameh El-Saharty Former Health Specialist (2000-2009), current Senior
Health Specialist, SASHN Mourad Ezzine Manager, MNCMI Simon Gray Country Director, MNC01 Rebekka Grun Senior Economist, ECSH3 Isabelle Huyn Senior Operations Officer, TWICT Adriana Jaramillo Lead Education Specialist, MNSHE Mats Karlsson Director, MNCMI Philippe Marin Senior Water and Sanitation Specialist, MNSWA Odile Mornet Consultant, AFTEW Eileen Murray Country Manager, MNCTN Carlo Maria Rossotto Former Middle East and North Africa Regional
Coordinator, GICT Department (2004-2012), Current Lead ICT Policy Specialist, TWICT
Antonio Nucifora Lead Economist, MNSED Fabian Seiderer Senior Public Sector Management Specialist, MNSPS Jeffrey Waite Lead Education Specialist, MNSHE

129
References
African Economic Outlook. 2012. Tunisia. http://www.africaneconomicoutlook.org/en/countries/north-africa/tunisia/. African Economic
Outlook: Paris. Arfa Chokri and Adel Souident, and Achour Noureddine. 2007. “National Health Accounts in
Tunisia: Results for Years 2004 and 2005”. Ministry of Public Health, National Institute of Public Health: Tunis.
Ben Farhat E., Chaouch M., Chelli H., Gara M. F., Boukraa N., Garbouj M., Hamrouni M., Fourati A., Calvez T., Thonneau Patrick. 2012. Reduced Maternal Mortality in Tunisia and Voluntary Commitment to Gender Related Concerns. International Journal of Gynecology and Obstetrics. 116 (2012) 165–168.
Commission Nationale d’Investigation sur la Corruption et la Malversation (CNICM). 2011. Rapport de la Commission Nationale d’Investigation sur la Corruption et la Malversation 2011. CNICM : Tunis.
Food and Agriculture Organization, World Bank, and Agence Française de Développement. 2012. Financement du Secteur Agricole Tunisien : Rapport Technique Complet. P15-16. May 7. Rome: FAO.
----------.2013. “The Multiple Dimensions of Food Security”. http://www.fao.org/publications/sofi/en/. Rome: FAO
Freedom House. 2004. Freedom in the World 2004. Freedom House: Washington, DC.
Global Integrity Report. 2008. Tunisia 2008 Assessment. Global Integrity Report: Washington, DC.
Heath, J., and Binswanger, H. P. 1996. “Natural resource degradation effects of poverty are largely policy induced: The case of Colombia”. Environment and Development Economics, 1, 65–84.
Ricardo Hausmann and César Hidalgo. 2011
International Monetary Fund. 2007. Working Paper. International Monetary Fund: Washington, DC.
----------.2012. Article 1V Report. September 2012. International Monetary Fund: Washington, DC.
----------.2012. IMF Country Report # 12/255. September 2012. International Monetary Fund: Washington, DC.
Ministère de l’Agriculture et des Ressources Hydrauliques (MARH). 2005. Revue du Secteur Agricole –Etude de la Filière Fruits et Légumes. October 2005. MARH : Tunis
-----------.2005. Revue du Secteur Agricole –Etude de la Filière des céréales. October 2005. MARH : Tunis.
République Tunisienne. 2013. “Appui à la gestion budgétaire par objectifs. Jumelage TU10/ENP-AP/F122, Rapport consolidé de diagnostic et d’orientations”. 26 avril 2013. Tunis.
Ministère de l’Agriculture, des Ressources Hydrauliques et de la Pêche (DGEDA), Agence Française de Développement. 2011. Actualisation Concertée de la politique agricole. CIRAD, GRET, IRAM
Rolland, Jean-Pierre. 2010. Comptabilité des Mesures de Politique Agricoles avec les Engagements Commerciaux Bilatéraux et Multilatéraux : Note Thématique. Ministère de l’Agriculture, des Ressource Hydrauliques et de la Pêche (DGEDA), Agence Française de Développement, CIRAD, GRET, IRAM. P8.

REFERENCES
130
Romm, Joe. 2011. “The high cost of food is one reason that protesters took to the streets in Tunisia and Egypt”. http://thinkprogress.org/climate/2011/02/07/207444/economist-krugman-high-cost-of-food-extreme-weather-climate-change-tunisia-egypt/?mobile=nc. February 2007. The Economist.
Angel Urdinola, D. Brodmann, S. and Hilger, A. 2012. Labor Markets in Tunisia: Recent Trends and Policy Options. Washington, DC” World Bank Mimeo.
Verner, Dorte (ed). 2013. Tunisia in a Changing Climate: Assessment and Actions for Increased Resilience and Development. A World Bank Study. # 76186. Washington, DC: World Bank.
World Bank. 1982. Tunisia: Agricultural Sector Survey (In Two Volumes) Volume I. Europe, Middle East, North Africa Projects Department Agriculture II. Washington, DC: World Bank.
----------.1996. Tunisia Resource Management Project. Report No. PIC 3138. Washington, DC: World Bank.
----------.1997. Tunisia: Natural Resources Management Project. Project Appraisal Document. Report no. 16488-TUN. Washington, DC: World Bank.
-----------.2000. Memorandum of the President of the International Bank for Reconstruction and Development to the Executive Directors on a Country Assistance Strategy of the World Bank Group for the Republic of Tunisia. March 28, 2000. Report No. 20161-TN. Washington, DC: World Bank.
-----------.2001. Tunisia: Agricultural Support Services Project. Project Appraisal Document, Report # 22135-TUN. Washington, DC: World Bank.
-----------.2002. Tunisia: Northwest Mountainous and Forestry Areas Development Project. Project Appraisal Document Report no. 23468-TUN. Washington, DC: World Bank.
------------.2003. Better Governance for Development in the Middle East and North Africa. Enhancing Inclusiveness and Accountability. Washington, DC: World Bank.
----------.2004. Tunisia: Country Environmental Analysis, 1992-2003. Report no. 25966-TN. Washington, DC: World Bank.
-----------.2004. Memorandum of the President of the International Bank for Reconstruction and Development to the Executive Directors on a Country Assistance Strategy of the World Bank Group for the Republic of Tunisia. June 3, 2004. Washington, DC: World Bank.
-----------.2004. WB, Strategy for Public Debt Management. Washington, DC: World Bank.
-----------.2004. Rapport analytique sur la passation des marchés. Projet Définitif, MENA, June 29. Washington, DC: World Bank.
-----------.2004. Tunisia: Natural Resources Management Project Implementation Completion Review. Report no. 30963-TUN. Washington, DC: World Bank.
-----------.2004. Tunisia: Rural Development and Poverty Reduction 1990-2003 – A Country Assistance Evaluation. Washington, DC: World Bank.
------------, and Islamic Development Bank. 2005. Tunisia: Understanding Successful Socioeconomic Development - A Joint World Bank-Islamic Development Bank Evaluation of Assistance. Washington, DC: World Bank.
-----------.2005. Tunisia GEF: Gulf of Gabes Marine & Coastal Resources Protection. Project Information Document. Project P069460. Report No. 30074. Washington, DC: World Bank.
-----------.2005. Project Document on a Proposed Grant from the Global Environment Facility Trust Fund in the Amount of US$1.7 Million and US$4.0 Million Respectively, to South Africa and Tunisia in

REFERENCES
131
Support of the First Phase of the US$21.7 MILLION Africa Stockpile Programme - Project 1. Report No: 32232-MNA. Washington, DC: World Bank.
---------.2005.HigherEducation Reform Support Project. Implementation Completion and Results Report. Report 32523. Washington, DC: World Bank.
-----------.2006. Tunisia: Agricultural Policy Review. Report no. 35239-TN. Washington, DC: World Bank.
-----------.2007. QAG 2007 AAA Review. Washington, DC: World Bank.
----------.2007. Country Assistance Strategy Progress Report for the period FY 2005-08. Report no. 38572-TUN. Washington, DC: World Bank.
------------.2008. Tunisia’s Global Integration: Second Generation of Reforms to Boost Growth and Employment. World Bank Report, May. Washington, DC: World Bank.
-----------.2008. Tunisia: Water Sector Investment Loan Implementation Completion Review Report No: ICR00008. Washington, DC: World Bank.
-----------.2009. Tunisia: Second Water Sector Investment Project Appraisal Document. Report No: 46396-TN. Washington, DC: World Bank.
-----------.2009. Country Partnership Strategy for the Republic of Tunisia, FY 10-13. Report No. 50223-TUN. Washington, DC: World Bank.
----------.2009. Tunisia Country Assistance Completion Report. Washington, DC: World Bank.
-----------.2009. La Compétitivité De L’Agriculture Tunisienne: Rétrospective et Prospective. Actualisation de la Revue Sectorielle Agricole de 2006. Washington, DC: World Bank.
-----------.2009. Republic of Tunisia: Agricultural Support Services Project Implementation Completion and Results Report. Report No: ICR00001113. Washington, DC: World Bank.
----------.2009. Développement Récents de la Filière agroindustrielle du Secteur Céréalier. Actualisation de la Revue Sectorielle Agricole de 2006. Washington, DC: World Bank.
----------.2009. From Privileges to Competition. Unlocking Private-Led Growth in the Middle East and North Africa. MENA. Washington, DC: World Bank.
----------.2009.Tunisia’s Global Integration: A second generation of reforms to boost growth and employment. A World Bank Country Study. Report no. 45409. Washington, DC: World Bank.
----------.2010. Tunisia: Second Natural Resource Management Project. Project Appraisal Document. Report No. 52965-TUN. Washington, DC: World Bank.
------------.2010. Republic of Tunisia: Development Policy Review--Towards Innovation-Driven Growth. Report No. 50847-TN. Washington, DC: World Bank.
-----------.2010. Third Northwest Mountains and Forestry Areas Development Project Implementation Completion and Results Report; (PNO3). April 27, 2010. Report No: ICR00001314 Project ID: P072317. Washington, DC: World Bank.
-----------.2010. Tunisia: Fourth Northwest Mountainous and Forested Area Development Project. Project Appraisal Document Report No: 56483-TUN. Washington, DC: World Bank.
-----------.2011. Tunisia – Employment Development Policy Loan Project: Implementation Completion and Results Report. Washington, DC: World Bank.
-----------.2011. Gulf of Gabes Marine and Coastal Resources Protection Project. Implementation Status and Results: ISR # 2835, Feb 15, 2011; ISR # 4931 June 30, 2011; ISN # 7436, December 16, 2011. Washington, DC: World Bank.

REFERENCES
132
-----------.2011. Gulf of Gabes Marine and Coastal Resources Protection Project. Implementation Status Report # 6214, 05 October 2011. Washington, DC: World Bank.
-----------.2012. Interim Strategy Note for the Republic of Tunisia for the Period FY13-14. Report No. 67692-TN. Washington, DC: World Bank.
-----------.2012. Tunisia: Agricultural Finance Study. Main Summary Report. Report No. 62471-TN. Sustainable Development Department. Middle East and North Africa Region. Washington, DC: World Bank.
-----------.2012. Tunisia: From Revolutions to Institutions. Washington, DC: InfoDev Growing Innovation. Washington, DC: World Bank.
-----------.2012 Tunisia: Agricultural Finance Study. Main Summary Report. Report # 62471-TN Sustainable Development Department, Middle East and North Africa Region. Washington, DC: World Bank.
-----------.2012. République Tunisienne : Projet de Protection des Ressources Marines et Côtières du Golfe de Gabès (P069460) Don du FEM: MULT 054942-TUN 11ème Mission de Supervision (13 au 17 juin 2012) Aide-mémoire (by Garry Charlier, Team Task Leader). Washington, DC : World Bank.
----------. 2013. République Tunisienne : Projet de Protection des Ressources Marines et Côtières du Golfe de Gabès : Préparation du Rapport d’Achèvement du Projet. Aide-Mémoire (by Taoufiq Bennouna, Team Task Leader). February 18-22, 2013. Washington, DC: World Bank.
-----------.2013. Draft Project Concept Note for a Proposed Banking Sector Restructuring Project. April 2013. Washington, DC: World Bank.
-----------.2013. Draft Project Performance Appraisal Report of the Agricultural Services Support Project. Washington, DC: World Bank.
-----------.2013. Aide Mémoire – Supervision mission of GO and GOJ DPL. February 2013. Reforms under preparation p 23. Washington, DC: World Bank.
-----------.2013. DPR Exports draft. Washington, DC: World Bank.
-----------.2013. Tunisia: GEF: Gulf of Gabes Marine & Coastal Resources Protection. Implementation Completion and Results Review. Report No ICR2667. Washington, DC: World Bank.
133
Endnotes 1 In this note, assistance program refers to products and services generated in support of the economic development of a country over a specified period.
2 The CAS commits the Bank to close cooperation with the EU, the AfDB and the IMF, but also with bilateral donors (AFD and GTZ, in particular), Arab funds (such as Arab Fund for Economic and Social Development) and the IDB.
3 The NDP prioritized employment and set out a strategy to establish a high added-value, knowledge-based economy, with a focus on human capital development.
4 EU and AfDB participated to both DPLs while AFD financed the 2011 Governance and Opportunity DPL.
5 Precise allocation of WB resources across sectors and pillars would be somewhat arbitrary as the three Economic Policy DPLs committed to FY05-13 ($1,250 million representing 62.6% of total commitment) in fact operate on a multi-sector basis.
6 Three projects totaling $170m (in the tourism, water and health sectors) were dropped after the government lost interest. Another two projects planned for the FY05-08 period were eventually launched FY09-10. Another task related to vocational training was initially planned, but never materialized due to lack of funding.
7 Some 19 percent of all closed projects in Tunisia were rated fully satisfactory and 63 percent moderately satisfactory.
8 Econometric analysis shows that a 1 percent reduction in growth in the EU leads, on average, to a 0.66 percentage point reduction in Tunisia’s growth, all else being equal
9 Source: PAD, GO DPL, pp 16.
10 Monetary policy was relaxed to stimulate demand by reducing reserve requirements from 10.5 to 2 percent. It also reduced its main interest rate from 4.5 to 3.5 percent to boost access to credit and investment. The CBT also provided substantial short term loans to banks to increase their liquidity. 11 Tunisia was unable to finance such growing requirements from traditional capital market sources, as major rating agencies continued to downgrade Tunisia's sovereign debt ratings. Moodys downgraded Tunisia immediately after the revolution, followed by Fitch and S&P in March 2011. In December 2012, Fitch downgraded again its rating to BB+ with negative outlook, motivated by the ongoing social and political tensions while S&P downgraded its rating to BB-following the political crisis after the assassination of Chokri Belaid. The political situation also led Moody’s to lower its ratings on Tunisia and on the Tunisian Central Bank into junk territory and to place them under surveillance for a possible new downgrading.
12 This section draws heavily on Tunisia’s Global Integration: Second Generation of Reforms to Boost Growth and Employment- World Bank Report, May 2008
13 Source PPAR (2004), pp 8
14 Source: WTO
15 Source: DPR Exports (draft, 2013).
16 This section had made extensive use of the analysis in DPR-Exports (draft, 2013)

ENDNOTES
134
17 Herfindahl index is calculated as the sum of squared shares of the individual 2-digit sectors. It would be equal to 1 if one sector accounted for all exports, whereas it would be close to zero if exports were evenly spread across many sectors.
18 The Economic Complexity Index, recently developed by Ricardo Hausmann and César Hidalgo (2011a), is designed to measure complexity in a country’s economy, where complexity is defined as the ability to export many different products and especially the more complex products. A country has a high value of the index if it exports many products, if it exports products that few other countries export, and if it exports products typically exported by complex economies.
19 ICL PD para 45.
20 This is a composite index of twelve factors that influence the macro-economic and micro-economic foundations of national competitiveness.
21 For example, some tax concessions with regard to VAT reimbursements for onshore producers were implemented over the years, but these are not significant compared to the tax holiday that off shore exporters get.
22 SMEs, defined as enterprises with less than 100 employees, account for at least 97.8 percent of Tunisian firms (across all sectors). SMEs’ ability to obtain financing for their business operations and investments is therefore crucial to Tunisia’s future economic development.
23 Quasi money comprises time, savings and foreign currency deposits of resident sectors other than central government and is an indicator of the confidence in the banking sector.
24 Tunisia did better than Algeria and Libya.
25 In the landlord port model, the port authority acts as a regulatory body and as a landlord, while port operations, especially cargo handling, are carried out by private operators. In this model, government-built infrastructure is leased to private operators.
26 Railway freight traffic was adversely affected by the contraction of phosphate export demand in 2008-09. Though traffic picked up in 2010 (to 8.1 million tons from 7.2 million tons in 2009), domestic disturbances caused rail freight traffic of phosphates to drop to less than 3 million tons per year in 2011-12.
27 SRTG refers to 12 regional transport companies serving 12 Governorates.
28 Gouvernement de la Tunisie : Portail de l’Agriculture. This slow rate of relative decline is indicative of a slow rate of structural transformation for both agriculture and the entire economy. http://www.agriportail.tn/index.php?option=com_content&task=view&id=98&Itemid=62
29 FAO-World Bank-Agence Française de Développement, le 7 mai 2012. Rapport Technique Complet. P15-16 30 World Bank, July 2006: 62-63. 31 More details on these loans in World Bank. 2004. Tunisia: Rural Development and Poverty Reduction 1990-2003 – A Country Assistance Evaluation. (See Annex B)
32 Joint World Bank-Islamic Development Bank Evaluation of Assistance. 2005. Tunisia: Understanding Successful Socioeconomic Development
33 For example, in the wholesale market in Tunis, representatives of the Ministry of Trade check prices every day. (FAO-WB-AFD, mai 2012; 14).
34 République Tunisienne. Décembre 2005. Revue du Secteur Agricole –Etude de la Filière Fruits et Légumes, MARH. (pp 6).
35 World Bank. July 2006. Tunisia: Agricultural Policy Review. Report no. 35239-TN. (Tab 6 and 7)

ENDNOTES
135
36 ONH is accused of making these allocations in a non-transparent way.
37 World Bank. January 2010. Republic of Tunisia: Development Policy Review--Towards Innovation-driven Growth. Report No. 50847-TN “Only 2.3 percent of arable land is in humid or sub humid zones with at least 600 mm of rain per year and 78.6 percent is located in arid or desert areas with rainfall lower than 300 mm per year.” (World Bank, Jan 2010: 55)
38 World Bank. 2010. NORTHWEST MOUNTAINOUS AND FORESTRY AREAS DEVELOPMENT PROJECT; (PNO3). April 27, 2010. Report No: ICR00001314 Project ID: P072317 39 World Bank. May 7, 2012 Tunisia: Agricultural Finance Study. Main Summary Report. Report #
62471-TN Sustainable Development Department, Middle East and North Africa Region. (Para 21 and fig 1)
40 World Bank. July 2006. Tunisia: Agricultural Policy Review. Report no. 35239-TN. – Fig 1
41 Source: Development Policy Review (2010). 42 The Tunisian counterparts are: Maamri Akremi and Boubaker Thabet in conversations of April 22 and 24, 2013 respectively. (See email for above dates copied to selected Tunisia CPE team members)
43 There were also unfavorable weather conditions for the cropping seasons 2007/08, 2008/09. (FAO-WB-AFD, mai 2012: fn # 4) CIF prices of soft wheat rose from around USD 150/ton in the spring of 2006 to USD 380-390/ton in December 2007 to rise still further to USD 500/ton in March 2008. (World Bank, May 2009: 5).
44 The Economist. Joe Romm, Feb 07, 2011. “The high cost of food is one reason that protesters took to the streets in Tunisia and Egypt”. http://thinkprogress.org/climate/2011/02/07/207444/economist-krugman-high-cost-of-food-extreme-weather-climate-change-tunisia-egypt/?mobile=nc. Indeed, food price crises and food insecurity are becoming a chronic concern of the entire global community. http://www.fao.org/publications/sofi/en/
45 IMF Country Report # 12/255. September 2012. Tunisia : 2012 Article IV Consultation.
46 World Bank. MAI 2009 DÉVELOPPEMENTS RÉCENTS DE LA FILIÈRE AGROINDUSTRIELLE DU SECTEUR CÉRÉALIER Actualisation de la Revue Sectorielle Agricole de 2006. P11-13
47 Rolland, Jean-Pierre, juillet 2010. Comptabilité des Mesures de Politique Agricoles avec les Engagements Commerciaux Bilatéraux et Multilatéraux : Note Thématique. Ministère de l’Agriculture, des Ressource Hydrauliques et de la Pêche (DGEDA), Agence Française de Développement, CIRAD, GRET, IRAM. P8
48 FAO-WB-AFD, may 2012; 14.
49 EU 27 accounted for 74 percent of all Tunisian exports (2011). (Data dated 23 May, 2013) http://trade.ec.europa.eu/doclib/docs/2006/september/tradoc_122002.pdf
50 Rolland, Jean-Pierre, juillet 2010. Comptabilité des Mesures de Politique Agricoles avec les Engagements Commerciaux Bilatéraux et Multilatéraux : Note Thématique. Ministère de l’Agriculture, des Ressources Hydrauliques et de la Pêche (DGEDA), Agence Française de Développement, CIRAD, GRET, IRAM. Table 7
51 World Bank, July 2006. p 6-7
52 High border protection is an integral component of GOT’s food security policy. « Adapter la politique d’importation aux risques liés à l’instabilité des marchés et à l’objectif de souveraineté alimentaire » (Rolland, 2010 : 19).
53 African Economic Outlook – Tunisia (2012)

ENDNOTES
136
http://www.africaneconomicoutlook.org/en/countries/north-africa/tunisia/
54 World Bank. January 2010. Republic of Tunisia: Development Policy Review--Towards Innovation-driven Growth. Report No. 50847-TN. “Yet, Tunisia’s tariff policy remains highly distortive and has arguably become even more so with the preferential liberalization vis-à-vis the EU. In the extreme, imports from third countries are liable to duties of 43 percent, while the same product could enter the Tunisian market from the EU duty free.” p32
55 World Bank, May 2012. p2.
56 The structure of production has remained fairly unchanged for decades, with the main subsectors (in percent of agricultural GDP and in descending order of magnitude) being livestock; fruits and vegetables; cereals, and fish. In terms of arable land (4.4 million ha) use, the main crops are fruit trees, cereals; leguminous crops; and vegetables. (FAO-WB-AFD, may 2012 - p16-17)
57 A Domestic Resource Cost (DRC) above 1 means the country has a comparative disadvantage in the production of that commodity; it costs more to produce it domestically than to import it. In other words, the country loses by its domestic production of that good. A DRC of less than 1 means the country has a comparative advantage; and a DRC of 1 means it has neutral advantage.
58 World Bank. June 2009: Tab 1 & 2.
59 Due to the sharp and frequent annual fluctuations, only data on long-term trends, spanning several decades at least, can serve as meaningful indicators of productivity.
60 Source: PAD of the Second Higher Education Reform Project Support. Annex 10 Financial and Economic
61 Ministère de l’Education, Statistique Scolaire 2011/12.
62 Out of the 43,000 kids that drop out, in college, 25000 drop-out on average after the first year of college.
63 ICR EQIP I, 2007 p17.
64 Sub component A1 (cf p7) describes the objectives. Annex 2 of the ICR which describes outputs by component failed to report specifically on what was done at the upper basic education level..
65 WB AM May 2011 p 24).
66 ICR, Higher Education Reform Support project, Report 3252).
67 See study on Governance of Universities. Some improvements are recorded in terms of management. The president of universities and chairmen of departments (establishment) are now elected with greater participation of the academic staff and on the basis of detailed job posting. Members of the board are now selected by committees and do not need to be academics and to belong to the university. Their mandate are below 4 years but can be renewed. Nevertheless, supervision and evaluation of personnel remained centralized. Regarding autonomy, the overall score mask some differentiation between academic autonomy (e.g. cursus, introduction of new program, assessing learning outcomes) which is greater than financial autonomy and personnel management. Universities have less flexibility to hire administrative staff or new professors. In terms of accountability, fewer universities monitor their students’ insertion rate, average wage in the job market. Regarding participation, students and private sector are now members of the board with no voting rights. The private sector is also part of academic council but can’t vote.
68 World Bank 2012
ENDNOTES
137
69 Negative growth (-1.8 percent) following the revolution has to be taken into account, but unemployment among university graduates has been trending upwards for many years e.g. 46.600 in 2006, 64.900 in 2010, 184.300 in 2011 and 193.400 in 2012 registered at ANETI.
70 A large majority of employed individuals (about 65%) is working as informal wage earner or self-employed. Informality rates are higher among younger and less educated individuals.
71 The survey is conducted every five years. The last was completed in 2010 and covered 13392 households.
72 The methodology for deriving the food poverty line is different from the previous methodology in two ways. First, the calculation of energy (and hence calorie) requirement is based on the ideal weight of the individual and not the actual weight as was done earlier. Second, the cost per calorie consumed was estimated on the basis of the median cost for the poorest 20 percent of the population. In the old methodology, the reference group was defined as are households whose total expenditure per capita was between DT 360 and 480 per year.
73 Communal areas (milieu communal) are defined as large cities (grande villes) and average commune (Moyennes Communes). Non Communal areas include the rest.
74 Source: Labor Markets in Tunisia: Recent Trends and Policy Options, World Bank (2011)
75 Ben Farhat, E. et al. (2012). Reduced maternal mortality in Tunisia and voluntary commitment to gender related concerns. International Journal of Gynecology and Obstetrics. 116 (2012) 165–168.
76 The remainder was split between the national budget and social security.
77 In 2005, freedom was rated 5.5, Civil Liberties 5 and Political Rights 6.
78 The Global Integrity Report assessed Tunisia performance in 2008. The Global Integrity Report provides quantitative data and qualitative reporting on the health of a country's anti-corruption framework. Each country assessment contained in the Global Integrity Report comprises two core elements: a quantitative Integrity Indicators scorecard and a qualitative Reporter's Notebook. The scorecard assesses the existence, effectiveness, and the citizen access to key governance and anti-corruption mechanisms through more than 300 actionable indicators. It examines issues such as transparency of the public procurement process, media freedom, asset disclosure requirements, and conflicts of interest regulations. Scorecards take into account both existing legal measures on the books and de facto realities of practical implementation in each country.
79 The # symbol is commonly referred as a hashtag on Twitter and is used to mark keywords or topics in a Tweet.
80 Please note that the numbers in this table combine votes from an Arabic and French polls ran separately on this question.
81 Tunisia ISN 13-14, pp.14. 82 Consultations with IEG staff in Tunis in July 2013. 83 http://www.middle-east-online.com/english/?id=60775 84 Tunisia, CAS 2005-2008, pp.14. 85 Tunisia, Health DPL (cancelled), pp.vi. 86 Tunisia, Health DPL (cancelled), pp.6. 87 Tunisia, Health DPL (cancelled), pp.6. 88 May 2013 ISR, JSDF project 89 Tunisia, Community Health Collaborative JSDF, ISR, May 2013, page 2-3.

ENDNOTES
138
90 Tunisia, Governance and Opportunity DPL, Implementation and Completion Report (ICR), pp.10. 91 EQIP 2, ICR page 5 92 EQIP 2, ICR page 5 93 Enda’s Sidi Hassine Branch 94 Opening Doors, Gender Equality and Development in the Middle East and North Africa, The World Bank, 2013, pp.3. 95 Tunisia 2013 DPR Draft, Chapter 1, pp.9. 96 Tunisia 2013 DPR Draft, Annex 5.1 (based on authors’ calculations of Tunisia Labor Force Survey, 2005, 2010, 2011). 97 Tunisia 2013 DPR Draft, Annex 5.1 (based on authors’ calculations of Tunisia Labor Force Survey, 2005, 2010, 2011). 98 Governance, Opportunity, and Jobs DPL, pp.4. 99 Tunisia ISN FY 13-14, pp.8. 100 Tunisia 2013 DPR Draft, Chapter 1, pp.9. 101 ICRR, Employment DPL. 102 National Union of Tunisian Women (UNFT) is the first non-governmental organization working to improve women’s status in society and under the law since 1956.