tunisia s third national communication as part of the
TRANSCRIPT

1Tunisia’s Third National Communication as part of the United Nations Framework Convention on Climate Change (UNFCCC)


Table of contents
Executive summary ................................................................................................................... 6
Chapter 1 : National background..........................................................................71. Geographical situation and topography ......................................................................... 7
2. Climate characteristics.................................................................................................... 8
3. Political situation and governance of climate policies .................................................... 9
4. Socio-cultural situation and dynamics ............................................................................ 9
5. Socio-economic conditions ........................................................................................... 10
Chapitre 2 : Greenhouse gases inventory ...........................................................111. Global results from the national GHG inventory of 2012 ............................................. 11
2. Trends in Tunisia’s GHG emissions ................................................................................ 12
Chapter 3: Implemented and scheduled national initiatives contributing to GHGs mitigation ...........................................................................................................14
1. Mitigation policies and measures in the energy sector ................................................ 14
2. Mitigation policies and measures in other sectors ....................................................... 15
3. Projection of Tunisian GHG emissions by 2030 ............................................................ 16
4. Impacts of GHG mitigation policies and measures ....................................................... 17
Chapter 4: Assessment of vulnerability, climate change impacts and adaptation measures in Tunisia ............................................................................................18
1. Synthesis of climate projections for Tunisia ................................................................. 18
2. Water resources ........................................................................................................... 22
3. Agriculture and ecosystems .......................................................................................... 24
4. Coastal areas and fisheries ........................................................................................... 26
5. Tourism ......................................................................................................................... 27
6. Health ........................................................................................................................... 29
7. Gender approach .......................................................................................................... 31
Chapter 5: Research, awareness, information and capacity building .................32
Chapter 6: Governance, financing and technology transfer ...............................33

6
Executive summary
Tunisia ratified the United Nations Framework Convention on Climate Change (UNFCCC) on July 15th, 1993. In accordance with the guidelines recommended by the Convention for its preparation, this Third National Communication presents the Tunisian national background (chapter 1); the results from the national greenhouse gas emissions inventory and mitigation policies (chapter 2); the national initiatives undertaken and planned contributing to GHG mitigation (chapter 3); the assessment of vulnerability, of climate change impacts and of implemented and yet to be adopted adaptation measures (chapter 4); the overview, and assessment of additional needs in terms of research, awareness, information and capacity building (chapter 5), and finally the overview and additional needs in terms of governance, funding and technology transfer (chapter 6). This national communication has sought to include gender issue as a cross-cutting issue. This document also reflects the efforts undertaken by Tunisia regarding climate change mitigation and adaptation since the elaboration of the Second National Communication of 2013.

7Tunisia’s Third National Communication as part of the United Nations Framework Convention on Climate Change (UNFCCC)
Chapter 1 : National context
1. Geographical situation and topography
Tunisia is located in northern Africa, on the southern shore of the Mediterranean Sea, at the junction between the eastern and western Mediterranean basins. The country has a total area of 164 000 km2. Tunisia has 1 300 km of coastline along its eastern and northern fronts.
Tunisia is divided in two large geographical areas, separated by successive low points occupied by the Chotts El Gharsa, Djerid and Fedjej, aligned from west to east. The northern part is diagonally crossed (SW-NE) by the Tunisian Ridge, a mountain chain resulting from the reunification of the Tell atlas and the Saharan atlas. The Northwest is marked by a series of high plains and a rugged landscape, and the Southeast by a low and hilly landscape extending to the coast. The center-west outer reaches of the country that extend south of the Tunisian Ridge are dominated by highlands bordering low and scattered mountain peaks and are occupied by steppes. The southern area essentially consists of the Saharan desert whose eastern border is represented by the Matmata and Dahar chains (600m).
Figure 1: Map of the Tunisian topography (Source: Agricultural map of Tunisia)

8
2. Climate characteristics
The relatively high latitude of Tunisia and its geographical north-south expansion give it the following succession of climate zones: subhumid to the far north; semiarid in the north-west and at Cap Bon; arid in central Tunisia and desert in the entire southern part.
The analysis of annual cumulative rainfalls between 1901 and 1980 shows an overall low amount of rain, a very scattered spatial distribution a high interannual variability. Only the north-western third of the country benefits from a total annual rainfall of 400 mm or more. In the areas south of the Ridge (two thirds of the country), the average annual rainfall varies from 50 to 350 mm.
The average annual temperature values are high, between 16°C and 20°C. They exceed 18°C for three quarters of the country. The summers are very hot, with mean temperatures often greater than 25°C, reaching and even exceeding 32°C in the south. On the contrary, winters are mild with maximum temperatures greater than 15°C, except for high-altitude areas in the western part of the country.
Figure 2. Map of bioclimatic regions(Source : Agricultural map of Tunisia)
Figure 3. Graph showing the variability and trend in mean annual temperature in Tunis-Carthage between 1950 and 2015 (source: INM, 2017)
Tem
péra
ture
(°C)
21
21
20
20
19
19
18
18
17
20152010200520001995199019851980197519791965196019551950

9Tunisia’s Third National Communication as part of the United Nations Framework Convention on Climate Change (UNFCCC)
3. Political situation and governance of climate policies
Following the December 17th, 2010 – January 14th, 2011 revolution, Tunisia adopted a new constitution on January 26th, 2014, that breaks deeply changed the political system and established a democracy allowing political freedom and political changeover. The new constitution was written in the line of a more sustainable economic, social and environmental development, by giving great importance to regional balance, to the right to employment and to environmental protection. The fight against climate change is integrated in the new constitution which, according to article 44, institutes that the Tunisian State must ensure a healthy and balanced environment and contribute to climate security by providing the necessary means.
Tunisia’s gross emissions went from 29 Mt CO2e (CO2 equivalent) in 1994 to 46.6 Mt CO2e in 2012, decreasing on average by 2.7% per year. The net emissions on the other hand went from 20.5 Mt CO2e to 32.6 Mt CO2e during the same period, recording an average annual increase of 2.6%. The Tunisian net emissions per capita amounted to 3 t CO2e in 2012, which is far below the global average (5 t CO2e per capita).
Thanks to a proactive policy targeting energy management and the transformation of the economic structure towards low-energy practices, the carbon intensity of the country hasn’t stopped decreasing since the 1990s, going from 0.8 t CO2e/1000 TD in 1994 to only 0.6 t CO2e/1000 TD in 20121.
On September 16th, 2015, Tunisia submitted its Intended Nationally Determined Contribution (INDC) to the UNFCCC, with an ambitious mitigation goal. The goal is to reduce carbon intensity by 41% between 2010 and 2030. On October 17th, 2016 the Tunisian parliament unanimously ratified the Paris Agreement and consequently formally adopted its intended nationally determined contribution. This ratification falls in the line of the country’s engagement in the fight against climate change which started with the adoption of the UNFCCC in 1992 and its ratification in 1993. Since then, Tunisia has always met its commitments towards the UNFCCC by submitting national communications, its first and second biennial updated reports (BUR) as well as its INDC.
4. Socio-cultural situation and dynamics
Tunisia has 11 304 483 inhabitants (July 1st, 2017) of which 50.27% are women. Tunisia having successfully carried out its demographic transition, the average annual population growth rate is decreasing, reaching around 1.03% over the 2004-2040 period (going from 2.35% over 1984-1994 to 1.21% over 1994-2004). Life expectancy at birth is on average 75.1 years, 74.5 years for men and 77.8 years for women.
The total workforce in 2017 is estimated at 4 077 100 people, over a working age population (15 and older) of 8 666 800, i.e. 47%. While 68.29% of men in working age are active, it is not the case for women, for whom the ratio is estimated to be 26.6%. Tunisia has relied on education for its development, by dedicating about 6% of its current GDP to the sector. The illiteracy rate has been significantly decreased since the independence.
1 Net emissions brought back to GDP expressed in 2005 constant prices.

10
The Tunisian Human Development Index (HDI) for 2015 is 0.725, which makes it part of the “high human development” category of countries and places it in the 97th position over a total of 188 countries. Between 1990 and 2015, the Tunisian HDI went from 0.569 to 0.725, a 27.3% growth.
5. Socio-economic conditions
Social tensions combined with the decline of some key sectors of the Tunisian economy, such as phosphate production and tourism, have led to a slow GDP growth (0.8% in 2015). Tunisia is also seeing a drop in exports, a decline in investments and over-indebtedness. Poor economic performances have led to negative impacts on some indicators such as the unemployment rate which reached 15.4%, inflation which settled to 4.9% and the balance of trade deficit which rose to 11.3% of GDP. Despite the drop of the international price of oil and the decrease in energy subsidies, the budget deficit reached 4.6% of GDP in 2015. The following table presents the key indicators of Tunisia from 2011 to 2015.
Table 1: Main economic indicators for the 2011-2015 period (source: Tunisian Central Bank)
2011 2012 2013 2014 2015
GDPconst2005 per capita (TD) 4 843 4 981 5 049 5 113 5 092
GDP growth rate at constant prices (%) -1,9 3,9 2,4 2,3 0,8
Investment/GDP (%) 21,7 21,6 21,9 20,6 19,4
Unemployment rate (%) 18,9 16,7 15 ,3 15,0 15,4
Coverage rate (%) (Importation/exportation) 74,5 69,5 70,1 67,6 69,6
Debt/GDP (%) 44,4 44,5 41,4 44,3 48,3
Budget deficit/GDP (%) 3,3 5,2 6,9 5,0 4,8
Inflation rate (%) 3,5 5,6 6,1 4,9 4,9
The Tunisian development plan elaborated by the government for the 2016-2020 period is guided by the following general goals: (1) Make Tunisia an economic hub; (2) Ensure a human development based on social inclusion; (3) Focus on a balanced development of all regions; (4) Promote green economy as a driver of sustainable development.
The economic development plan of 2016-2020 aims at an average economic growth of 4% per year against 1.5% per year over the 2011-2015 period. Over the next five years, the implementation of this plan should allow for an increase of the annual revenue per capita from 8 000 TD to 12 520 TD, the creation of 400 000 jobs and a reduction of the poverty rate from 4.6% to 2%.

11Tunisia’s Third National Communication as part of the United Nations Framework Convention on Climate Change (UNFCCC)
Chapitre 2 : Greenhouse gases inventory
1. Global results from the national GHG inventory of 2012
Tunisia’s gross emissions absorption of direct GHG are detailed in Table 2 for the year 2012. Results are written in CO2-equivalent (CO2e). Note that no PFC use was recorded in Tunisia in 2012.
Table 2: Summary of the gross GHG emissions of Tunisia in 2012 (ktCO2e)
CO2 CH4 N2O HFCs SF6 TOTAL
TOTAL 36 567,7 7 145,0 2 567,2 343,7 8,4 46 632
1 - Energy 25 172,3 1 616,6 234,2 27 023
1 - A Combustion 23 857,8 804,8 229,7 24 892
1 - B Fugitives 1 314,6 811,9 4,4 2 131
2 – Industrial processes and product uses 4 810,2 - 278,7 343,7 8,4 5 441
3 - Agriculture, Forest, and Other Land Use 6 568,2 2 636,2 1 945,1 11 150
4 - Waste 17,0 2 892,2 109,2 3 018
The energy sector is the biggest contributor to direct gross GHG emissions, with 27 million tCO2e representing 58% of national gross emissions in 2012 (Figure 3). Over nine tenth of emissions linked to energy are due to combustion.
With over 11 million tCO2e, i.e. about 24% of the total gross emissions, AFOLU is the second contributor to Tunisia’s gross emissions, but still far behind the energy sector. Then come processes and waste, whose gathered emissions only reach 18% of Tunisia’s gross emissions, the waste sector being the lowest contributor to national gross emissions (6.5%).
Concerning carbon absorption by the AFOLU sector, it amounted to 14 million tCO2e, hence widely compensating the AFOLU emissions.

12
Figure 4: Distribution of Tunisia’s directgross GHG emissions per source in 2012
2- Procédés industrial
processes andproduct uses
11,7%
3- Agriculture, Forest and Other
Land Use23,9%
4- Wastes6,5%
2012
1- Energie57,9%
Figure 5: Distribution of Tunisia’s direct gross GHG emission per gas type in 2012
CH415,3%
78,5%
N2O5,5%
HF SF60,02%
CO2
2. Trends in Tunisia’s GHG emissions
Tunisia’s GHG emissions for the years 1994, 2000, 2010, 2011 and 2012 are presented below to illustrate the trends in GHG emissions/absorption.2
Table 3: Evolution of GHG emissions in Tunisia
Net emissions (ktCO2) Annual growth
1994 2000 2010 2011 2012 1994-2000
2000-2012
1994-2012
1- Energy 15 830 21 163 27 082 25 671 27 023 5,0% 2,1% 3,0%
2 - Industrial processes and products use 3 776 3 871 5 071 4 438 5 441 0,4% 2,9% 2,0%
3- Agriculture, Forest and Others land uses -269 -1 422 -2 391 -3 116 -2 878
4- Waste 1 115 1 998 2 807 2 872 3 018 10,2% 3,5% 5,7%
Total 20 452 25 610 32 569 29 864 32 604 3,8% 2,0% 2,6%
Gross emissions (ktCO2) Annual growth
1994 2000 2010 2011 2012 1994-2000
2000-2012
1994-2012
1- Energy 15 830 21 163 27 082 25 671 27 023 5,0% 2,1% 3,0%2 - Industrial processes and products use 3 776 3 871 5 071 4 438 5 441 0,4% 2,9% 2,0%
2 The gas GWPs for the five-year inventory are consistent according to the latest IPCC figures already adopted for the 2010 inventory.

13Tunisia’s Third National Communication as part of the United Nations Framework Convention on Climate Change (UNFCCC)
3- Agriculture, Forest and Others land uses 8 238 8 669 11 219 10 737 11 150 0,9% 2,1% 1,7%
4- Waste 1 115 1 998 2 807 2 872 3 018 10,2% 3,5% 5,7%Total 28 959 35 701 46 179 43 717 46 632 3,5% 2,3% 2,7%
1994 2000 2010 2011 2012 1994-2000
2000-2012
1994-2012
Population(1000 inhabitants) 8 785,4 9 444,4 10
540,810
649,610
759,5 1,2% 1,1% 1,1%
Net emissions perinhabitant(tCO2/head)
2,3 2,7 3,1 2,8 3,0 2,6% 0,9% 1,5%
Gross emissions per inhabitant(tCO2/head)
3,3 3,8 4,4 4,1 4,3 2,3% 1,1% 1,5%
The inventories of 2010, 2011 and 2012 are comparable since similar methodologies were used,
however the comparison with the 1994 and 2000 inventories is less reliable. This should be taken into consideration in any detailed analyses of the emissions sectors or sources.
The following table presents the evolution of the sectors’ contribution to the gross national emissions. One may note the rise in the energy contribution, going from 55% to 58% from 1994 to 2012, and the high progress of the waste share going from 4% to 6.5% over the same period, even though this share is still limited. These growths occur precisely at the expense of AFOLU, which “loses” over 4 points from 1994 to 2012, because of the very small increase of emissions in this sector, compared to other sectors.
Table 4: Evolution of the sectors contribution to the gross national emissions
Emissions Brutes 1994 2000 2010 2011 2012
1 - Energy 54,7% 59,3% 58,6% 58,7% 57,9%
2 - Industrial processes and product uses 13,0% 10,8% 11,0% 10,2% 11,7%
3 - Agriculture, Forest, and Other Land Use 28,4% 24,3% 24,3% 24,6% 23,9%
4 - Waste 3,9% 5,6% 6,1% 6,6% 6,5%
TOTAL 100% 100% 100% 100% 100%

14
Chapter 3: Implemented and scheduled national initiatives contributing to GHGs mitigation
The historical analysis of Tunisian GHG emissions shows that under the combined effect of proactive sectoral GHG mitigation policies and Tunisian economic change towards less carbon-intensive sectors, started more than two decades ago, net emissions of GHGs have grown at a fairly moderate pace compared to the economic growth3. As a result, the net carbon intensity4 recorded an overall drop of 25% between 1994 and 2012 (Figure 6); going from 0.8125 in 1994 to 0.608 tCO2 / 1000 TD of GDP in 2012.
Figure 6: Net carbon intensity in Tunisia between 1994 and 2012 (tCO2 / 1000 TD of GDP)
1. Mitigation policies and measures in the energy sector
With a stable institutional structure, the National Agency for Energy Management (ANME), shows a remarkable continuity of its energy management policy. Tunisia has already launched several measures in the areas of energy efficiency and renewable energies, with a goal of translating the new energy transition policy into concrete results. Current results are quite convincing and encourage to intensify efforts towards the low-carbon transition. For example, the implementation of the Renewable Energy Program has made it possible to achieve a cumulative capacity for the production of electricity from renewable sources of 280 MW (245 MW wind and 35 MW PV), thus bringing the share of renewable energy in the national electricity production at 4%. In addition, at the end of 2015, the energy efficiency and renewable energy program created around 3 850 direct jobs, of which 51% were generated by solar thermal and photovoltaic programs.
3 2.6% per year between 1994 and 20124 Calculated on the basis of net national emissions.5 Carbon intensity is brought back to GDP expressed in 2005 constant prices.

15Tunisia’s Third National Communication as part of the United Nations Framework Convention on Climate Change (UNFCCC)
The energy-saving action plan for 2017-2030 represents a total investment of 27.1 billion dinars, equivalent to 11.3 billion US dollars. The measures of this Action Plan address energy efficiency (EE), renewable energy (RE) development, and energy efficiency for the following sectors: industries, tertiary and residential buildings, transportation, public lighting and agriculture and fisheries.
The energy efficiency mitigation goal was based on a bottom-up approach by aggregating the CO2 reductions expected by different measures, which would represent an emission reduction of around 11.2 MtCO2 by 2030 according to the baseline scenario (BaU). These reductions would come from the energy efficiency in buildings including the tertiary sector, residential and public lighting (56%), industry (32 %) and transportation (11 %).
Figure 7 : Mitigating of GHGs’ emissions through energy efficiency measures
Industry
Building
Transport
Agriculture
0
1
2
3
4
5
6
7
8
9
10
11
2015 2016 2017 2018 2019 2020 2021 2022 2023 2024 2025 2026 2027 2028 2029 2030
25%
67%
7%
1%
MtéCO2
10 MteCO2
2. Mitigation policies and measures in other sectors
The development and implementation of mitigation measures is quite heterogeneous for the industry, tourism, agriculture, forest and waste sectors. Nevertheless, Tunisia has been among the pioneering countries to prepare NAMAs (Nationally Appropriate Mitigation Actions), thus being ready for the implementation of the Paris Agreement recommendations. Five NAMA proposals have already been developed: (1) NAMA Cement, (2) NAMA Buildings, (3) NAMA Tunisian Solar Plan, (4) NAMA Forests, and (5) NAMA Sanitation. A 6th NAMA related to the transportation sector should be developed in the city of Sfax. These numerous initiatives emphasize the country’s determination to move forward on a low-carbon development transition, with the support of the international community.

16
3. Projection of Tunisian GHG emissions by 2030
~Development of a baseline scenario
Reference year: As part of the baseline and mitigation scenarios determination, 2010 was defined as the reference year. The year 2010 is fairly representative of the structure and practices of consumption and GHG emissions of Tunisia, and a GHG inventory was rigorously established for this year according to the recommendations of the IPCC.
Time Horizon: The horizon year was set at 2030, allowing enough time (13 years) to infuse new development and consumption practices; and even to initiate deep changes. The 2030 horizon is also close enough to have sufficient benchmarks to develop credible prospective scenarios.
Socio-economic scenario: Emerging from a period of political transition, the country doesn’t have a long-term economic growth scenario yet. Thus, the socio-economic scenario was defined within the Tunisia’s NDC preparation by a formal economic foresight working group.
The values of GDP (at 2005 constant prices) as well as population trends are presented in Table 6.
Table 5: Trends in the main parameters of the socioeconomic scenario
2010 2020 2025 2030
GDPconst2005 (MTD) 52 280 75 120 99 017 132 609
Population (1000 hab.) 10 547 11 714 12 173 12 551
This scenario would reflect an extension of current trends (called Business-as-Usual, BaU) for all sources of GHG emissions: Energy, Industrial Processes, Agriculture, Forests and Other Land Use, and Waste.
~Aggregated baseline
The results of the BaU GHG emissions projections are presented in Table 7. The BaU scenario shows that GHG emissions would reach 68.2 MtCO2 by 2030, with an average annual increase of 4.5% over the period 2010-2030. In comparison, GDP at constant prices would grow by 4.8% per year over the same period. Therefore, the BaU shows that GHG emissions would increase at a slower rate than economic growth.

17Tunisia’s Third National Communication as part of the United Nations Framework Convention on Climate Change (UNFCCC)
Table 6: Sectoral GHG emissions according to the BaU scenario
Emissions -BaU (1000 téCO2) 28406 38437 48320 60640
Energy 22 974 31 179 37 613 45 500
Industrial processes 5 071 6 822 8 605 10 823
Forest and other land use -6 987 -9 243 -9 511 -9 786
Agriculture 4 597 5 260 5 622 6 053
Waste 2 751 4 418 5 990 8 051
Thus, in the BaU scenario Tunisia’s carbon intensity decrease, going from 0.540 to 0.515 tCO2 / 1000TD of GDP between 2010 and 2030, e.g. a decrease of around 5% over the entire period.
The assessment of baseline scenario emissions at the national level was based on the aggregation of sectoral baselines, which are described and presented in the following section.
4. Impacts of GHG mitigation policies and measures
It is important to keep in mind that the mentioned GHG emission reductions refer exclusively to the new actions considered under the mitigation scenario which has normally started in 2017. The impacts of past actions (e.g. existing wind or hydropower projects, contracts - ongoing EE programs, etc.) are not counted in the mitigation results, but rather in the baselines.
Tunisia’s GHG mitigation action plan, only taking into account the actions to be started in 2017, should generate cumulative reductions, over the 2017-2030 period, 183 MtCO2e.

18
Chapter 4: Assessment of vulnerability, climate change impacts and adaptation measures in Tunisia
Based on updated climate projections from the latest IPCC report, this chapter presents the vulnerability of different sectors to climate change (water resources, agriculture and ecosystems, coast and fisheries, tourism, health and gender), by describing the potential impacts of climate change on each sector and their capacity to adapt. An overview of the main ongoing or scheduled adaptation initiatives is also provided, followed by a presentation of the priority axes and strategies of adaptation to climate change in Tunisia.
For this third national communication, the outputs of a set of models used in the latest IPCC report (AR5) with two representative concentration pathways (RCP 4.5 and 8.5) are analyzed to provide climate change projections for Tunisia at both the 2050 and 2100 horizons. These data come from the simulations of all EURO-CORDEX models at a 12.5 km resolution.
1. Synthesis of climate projections for Tunisia
~Past climate trends in Tunisia
In Tunisia, over the 1978-2012 period, we observe a significant upward trend in annual maximum, average and minimum temperatures of around 2.1 ° C, with regional disparities.
Observations show a slight upward (statistically insignificant) trend for the total annual rainfall over this same period of observed data. Nevertheless, the disparities between seasons and the interannual variability are very strong. The beginning of the 1980s is known for a succession of several dry years in Tunisia, influencing the general trend of the curves.
Regarding meteorological and climatic extremes, a change in the frequency of thermal and rainfall extremes is observed over the past period, based on the observed data from the meteorological stations of the Tunisian National Institute of Meteorology (INM).

19Tunisia’s Third National Communication as part of the United Nations Framework Convention on Climate Change (UNFCCC)
Figure 8: Evolution of the number of hot days (Source: INM)
Figure 9: Evolution of the number of cold days (Source: INM)
Figure 10: Evolution of extreme rainfall events in mm (Source: INM)
~2050 and 2100 climate projections under RCP 4.5 and RCP 8.5 scenarios
Projections show an increase in annual temperature at the 2050 and 2100 horizons for both scenarios. This increase ranges between 1° C and 1.8° C by 2050 on average for the set of studied models and between 2° C and 3° C at the end of the century, with the RCP 4.5 scenario. For the RCP 8.5 scenario, this increase ranges between 2° C and 2.3° C by 2050 on average for the set of studied models and between 4.1° C and 5.2° C at the end of the century. The coast in the North and the East of Tunisia would warm up less quickly than the West and the extreme South.

20
A B
Figure 11: Evolution of the mean annual temperature (in ° C) by 2050 (A) and by 2100 (B) under the RCP 4.5 scenario (Source: INM)
Figure 12: Changes in mean annual temperature (in ° C) by 2050 (A) and by 2100 (B) under the RCP 8.5 scenario (Source: INM)
Seasonal projections of temperature show a much more pronounced variability of temperatures by 2100 with increases above 3° C and above 5.2° C, respectively for the scenarios RCP 4.5 and RCP 8.5.
The simulations show a 5 % to 10 % (5 % to 20 %) decrease in total annual rainfall by 2050 (2100) under the RCP 4.5 scenario. The results under the RCP 8.5 scenario show a 1 % to 14 % (18 % to 27 %) decrease in total annual rainfall by 2050 (2100). The spatial disparities would be reinforced by 2100 with total annual rainfalls more and more weak in the center-west of the country (between Sfax and Gabes in particular), in the northwest of the country (governorates of Jendouba and Le Kef) and in the desert area of Tunisia (Tataouine governorate).
National Institute of Meteorology
National Institute of Meteorology

21Tunisia’s Third National Communication as part of the United Nations Framework Convention on Climate Change (UNFCCC)
Figure 13: Changes in total annual rainfall (in %) by 2050 (A) and by 2100 (B) under the RCP 4.5 scenario (Source : INM)
Figure 14: Changes in total annual rainfall (in %) by 2050 (A) and by 2100 (B) under the RCP 8.5 scenario (Source : INM)
Under the RCP 4.5 scenario, the seasonal rainfall projections show a much more pronounced variability by 2100 with significant rainfall decreases in summer in southern Tunisia (- 35 %) and a slight increase in rainfall in autumn in the north-west of the country (+ 5 %).
Under the RCP 8.5 scenario, the seasonal rainfall projections show very pronounced decreases in precipitation (-35%) in winter in southern Tunisia and in spring in northern Tunisia, which differs from the scenario RCP 4.5.
Regarding climate extremes, Tunisia could experience more frequent and longer heat waves by 2100 under the scenario RCP 8.5. On the other hand, the cold waves would decrease as well as the episodes of extreme rainfall.
National Institute of Meteorology
National Institute of Meteorology

22
2. Water resources
Among the 36 billion of m3 of rainwater that Tunisia receives each year, 16.3 billion of m3 (45%) can be mobilised. 4.8 billion of m3 (13%) constitute the annual potential for blue water which can be used to meet socio-economic needs6. The main permanent watercourse is the Medjerda River, which has its sources in Algeria and on which is set the Sidi Salem dam, the largest one in Tunisia. 11.5 billion of m3 (32%) infiltrate into the soil and constitute water reserves for rainfed agriculture, forests and rangelands. The remaining 19.7 billion of m3 (55%) evaporate, are stored in the wetlands or flow towards the sea.
Figure 15: Estimated potential of water resources (surface water, groundwater and deep aquifers) in northern, central and southern Tunisia. (Source: Revue nationale du secteur de l’eau 2015, MARHP 2016)
~Climate change impacts on the sector
The decrease in average rainfall and the increase in the intensity and frequency of dry periods, combined to the increase in temperature, should reduce soil moisture and surface and underground water stocks. These impacts of climate change are likely to be worsened by the increasing water needs, notably for human use, but more particularly for agriculture, given the increase in evapotranspiration and the decrease in soil humidity.
Groundwater forms 44.5% of Tunisia’s water potential, with 226 shallow water tables and 340 deep aquifers. Most of the groundwater comes from deep aquifers in the south, among which the largest resources are non-renewable fossil groundwater (610 Mm3 / year are non-renewable)7.
6 Revue nationale du secteur de l’eau 2015, MARHP, 2016.7 L’Univers De l’Eau, 2016. Rapport sur les indicateurs de suivi et évaluation de l’adaptation de l’agriculture au changement clima-tique.

23Tunisia’s Third National Communication as part of the United Nations Framework Convention on Climate Change (UNFCCC)
Currently, there is an intensive exploitation of underground resources8, which provide around 81% of the water needs of the irrigated sector. The decrease in available stocks would be more pronounced in the north of the country which concentrates 80% of the resources already mobilized, and in the center of the country where groundwater is the main resource for agriculture and drinking water. By 2050, the overall decrease of water resources due to climate change could be significant. In particular, we could assist in a drying up of water sources, which constitute the main resources in some rural areas of the country.
Among a set of about 215 water tables in Tunisia, almost a quarter is located in the coastal area. These coastal aquifers store about 290 Mm3, i.e. 40% of the groundwater potential and almost 6% of the total water resources that can be mobilized in the country. Sea water intrusion into the coastal water tables will contribute to their progressive salinization, especially since many of these aquifers already show signs of degradation (salinization, overexploitation). Sea level rise could be responsible for the loss of 220 Mm3 of water resources, i.e. about 30% of the total groundwater potential and 75% of the phreatic resources.
Water use conflicts are already observed and are intensifying in Tunisia, especially during drought periods. Rural areas relying on springs for drinking will be greatly affected, given the drying up of these springs. Women could be even more vulnerable, considering that they often are responsible for water supply and hygiene in the household. The poorest people, including those living in forests and rural areas, should be more heavily affected, leading to the intensification of current social crises between different regions of the country.
~Major initiatives for adaptation
Given the fact that Tunisia is already affected by water scarcity in some regions and that the rate of conventional water resources mobilization reaches 92%, various adaptation measures have already been implemented. These measures include investments for a greater mobilization of unconventional water. For instance, the seawater desalination plant in Djerba will be operational in 2018 and the desalination plants in Sfax, Zarrat and Sousse should be operational by 2020. These investments should allow securing the supply of drinking water until 2030. The potential reuse of wastewater, estimated at 300 Mm3, is also an ongoing adaptation measure in Tunisia.
The possibility of transferring a part of the surplus water from the extreme north, estimated at 400 Mm3 / year, to the center of the country in the area of Kairouan, is currently under study. This would be done through the reinforcement of infrastructures: connection of dams, doubling of transfer lines, building of new storage facilities. A national program for artificial groundwater recharge, by surface water or treated wastewater, is also initiated. However, the volume of water injected underground is dependent on the availability of surface water, which has decreased from 66.2 Mm3 in 1996 to 30.52 Mm3 in 2015.
Water and soil conservation are part of a new strategy integrating the impact of climate change on the national territory. Adaptation measures are also initiated in the agricultural sector to reduce the water demand, such as the use of conservation agriculture9. A national water saving strategy in the agricultural sector implemented since 1995 led to the equipment of more than 80% of irrigated
8 DGRE, 2015. Annuaires de l’exploitation des nappes profondes 9 http://www.tech-action.org/publications
24
perimeters with water saving techniques, which reduced the water demand in some of these areas. However, the effectiveness of this strategy is limited by the obsolescence of the facilities (65% of the perimeters are more than 25 years old).
Finally, the Ministry of Agriculture, Hydraulic Resources and Fisheries initiated the program “water 2050” in order to identify the new orientations of the water sector by 2050 taking into account the issues related to climate change, the needs of decentralization, the right to water as defined by the Tunisian constitution and sustainable development goals.
3. Agriculture and ecosystems
Tunisian agriculture is of crucial importance because of its contribution to national food security. Tunisia has more than 10 million hectares of agricultural land representing 62% of the country’s total area, with 32% of the total area covered by annual and permanent crops. Livestock production, with more than 400,000 breeders, is dominated by a flock of sheep, cattle, goats and poultry. The agriculture and agri-food sector accounted for 11.5% of the GDP in 2012. The agricultural sector provides permanent income for 470,000 farmers, contributing to the stability of the rural population, which represents 35% of the country’s population.
~Climate change impacts on the sector
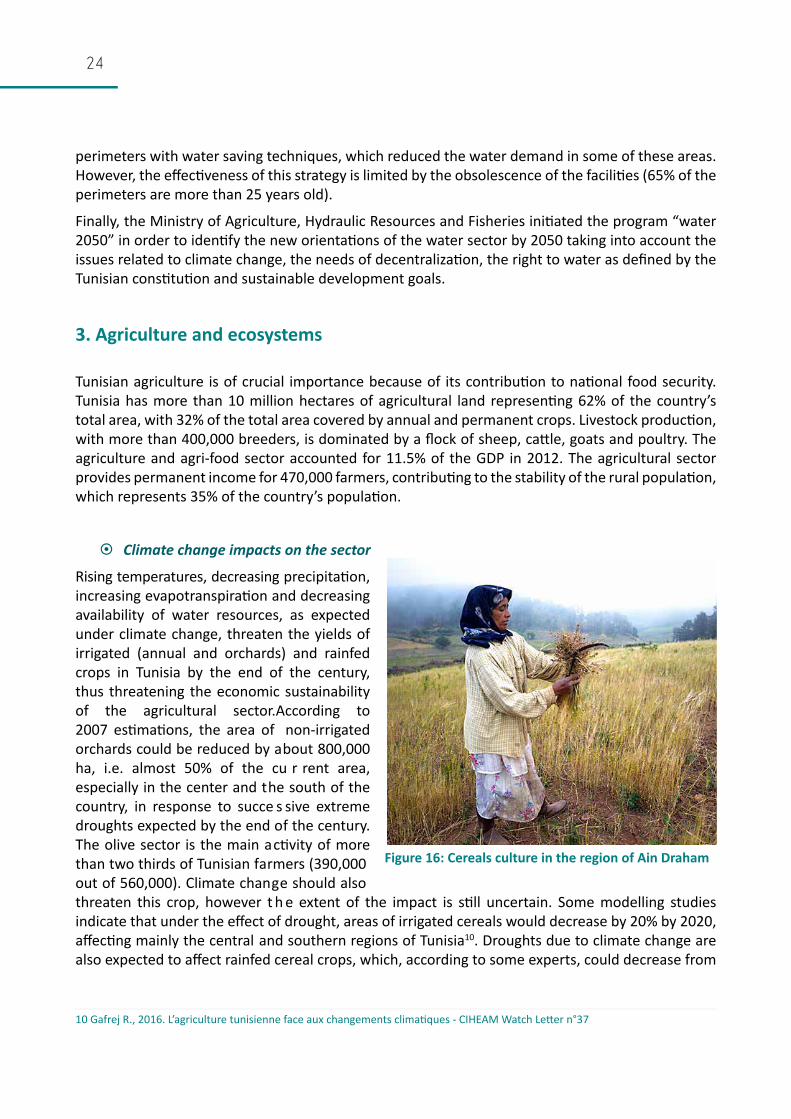
Rising temperatures, decreasing precipitation, increasing evapotranspiration and decreasing availability of water resources, as expected under climate change, threaten the yields of irrigated (annual and orchards) and rainfed crops in Tunisia by the end of the century, thus threatening the economic sustainability of the agricultural sector.According to 2007 estimations, the area of non-irrigated orchards could be reduced by about 800,000 ha, i.e. almost 50% of the cu r rent area, especially in the center and the south of the country, in response to succe s sive extreme droughts expected by the end of the century. The olive sector is the main activity of more than two thirds of Tunisian farmers (390,000 out of 560,000). Climate change should also threaten this crop, however t h e extent of the impact is still uncertain. Some modelling studies indicate that under the effect of drought, areas of irrigated cereals would decrease by 20% by 2020, affecting mainly the central and southern regions of Tunisia10. Droughts due to climate change are also expected to affect rainfed cereal crops, which, according to some experts, could decrease from
10 Gafrej R., 2016. L’agriculture tunisienne face aux changements climatiques - CIHEAM Watch Letter n°37
Figure 16: Cereals culture in the region of Ain Draham

25Tunisia’s Third National Communication as part of the United Nations Framework Convention on Climate Change (UNFCCC)
an average of 1.5 million hectares to an average of one million hectares in 2030, i.e. a drop of about 30%11. Globally, the consequences of climate change would be economically negative for the most vulnerable populations, notably for women, of whom 32.3% live in rural areas and who constitute more than 70% of active jobs in agriculture and forestry. Poverty is likely to intensify and to affect small farmers whose agricultural activities, already economically unprofitable, may disappear under the impact of climate change. As a consequence of the expected decline in suitable areas for agriculture, and considering constant yields, agricultural GDP would decline by 5% to 10% in 203012.
Many ecosystems would also be strongly impacted by climate change. An increase in forest fires is expected, which currently already reduce the forest area by 1,200 ha each year, leading to the degradation and loss of biodiversity. Alfa ecosystems and rangelands are already under heavy anthropogenic pressure like overgrazing. A study conducted in 2014 in the governorate of Medenine13
estimated that the reduction of natural fodder resources would be around 23 % and 26 % respectively in 2020 and 2050, threatening the sustainability of pastoralism. Wetlands would also be threatened by increased salinization and eutrophication. The oasis ecosystems are already highly vulnerable due to their strong dependency on water resources. For the Tunisian oasis zone, an average warming of 1.9 ° C is expected by 2030 and of 2.7 ° C by 2050, with decreasing rainfalls by 9% in 2030 and 17 % in 2050, and an increase in evapotranspiration of 8% by 2030 and 14% by 205014.
~Major initiatives for adaptation
Initiatives for climate change adaptation in agriculture are generally multi-scalar and more developed since the revolution. Meteorological and climatic monitoring has been widely developed in order to anticipate extreme events that can cause severe damages and losses on agricultural yields.
Looking for more efficiency in water use within irrigated perimeters, Tunisia began its National Program on Water Saving in 1995. In 2015, notably to respond to climate change impacts already observed, localized irrigation (drip irrigation) is applied to 46% of the total area of irrigated perimeters, compared to 30% for sprinkler irrigation and 24% for gravity irrigation15. Several other adaptation measures are implemented in the agricultural sector to reduce the water demand, such as the use of conservation agriculture, both at a local and regional scale. In terms of traditional agriculture, one of the initiatives for adaptation is to educate farmers and encourage them to use ancestral know-how. Each governorate, depending on the types of agriculture developed within its geographical area, has also planned adaptation to climate change by strengthening participative deba t es between managers and farmers and / or inhabitants of rural areas for example. Capacity building of dedicated national services is also a priority. Several strategies have been recently de v eloped to protect Tunisian ecosystems from the impacts of climate change. Many strategies focus on the sensitive oasis ecosystems. Moreover, in 2015, a study formulated strategic directions and developed an action
11 Ministère de l’agriculture et des ressources hydrauliques et GTZ, 2007. Stratégie nationale d’adaptation de l’agriculture tunisi-enne et des écosystèmes aux changements climatiques.12 MARH/GIZ, 2007. Stratégie nationale d’adaptation de l’agriculture tunisienne et des écosystèmes aux changements climatiques.13 GIZ et Ministère de l’Agriculture, 2014. Etudes de la vulnérabilité de trois écosystèmes tunisiens face au changement climatique : l’écosystème pastoral dans le gouvernorat de Médenine.14 GIZ et Ministère de l’Environnement, 2012. Les oasis de Tunisie à protéger contre la dégradation et les effets du changement climatique.15 L’Univers De l’Eau, 2016. Rapport sur les indicateurs de suivi et évaluation de l’adaptation de l’agriculture au changement climatique.

26
plan for the adaptation to climate change16. of biodiversity, in all its components. However, the implementation of the advocated actions and recommendations of all these studies and strategies remains constrained.
4. Coastal areas and fisheries
The Tunisian coast has a total length of 2,290 km, distributed as follows: 1,280 km of continental coastline, 450 km of island coastline and 560 km of lagoons. The three main types of fishing encountered in Tunisia are trawling, lamp fishing and inshore fishing. The main marine production area is located in the governorates of Sousse, Monastir and Nabeul, while the production of continental aquaculture, is mainly located in the governorate of Béja. Fishery production has steadily increased since the 1990s, reaching a total production of 118,000 tons in 2012, with an annual growth rate of 2.6% between 1996 and 2012. The production of the year 2016 was estimated at 126,528 tons, for a total amount of 828 million of dinars.
~Climate change impacts on the sector
Tunisian coasts are subject to the continuous action of physical hazards (current, swells, tide, etc.) which can be amplified by sea level rise (SLR) induced by climate change. A progressive retreat of the coastline is therefore expected.
More than 3,000 hectares of urban areas are considered vulnerable and threatened by submersion due to SLR. More than half of these potentially submersible lands are residential urban areas located mainly in the city of Tunis and in the city of Sfax. The vulnerable zones also include 781 hectares of industrial zones located mainly in Tunis and Sfax, and 560 hectares of tourist zones largely located on the eastern side of the island of Djerba.
16 Ferchichi A., 2015.Orientations stratégiques et plan d’action relatifs à l’adaptation de la biodiversité aux changements climatiques
Figure 17 : Collectors of clams

27Tunisia’s Third National Communication as part of the United Nations Framework Convention on Climate Change (UNFCCC)
Within a total of 2,290 km of coastline (continental, lagoon and island), Tunisia has only 570 km of sandy beaches suitable for swimming. Tunisia has already lost more than 90 km of beaches due to erosion or due to the construction of artificial defense structures. Of the 570 km of existing beaches, 190 km are very degraded and may disappear.
�The sustainability of fishing practices (foot-fishing, Charfia fishing) is also threatened by sea level rise. Indeed, these types of fishing are practiced on the foreshores which may migrate inwards and therefore see their surface decrease. Inshore fisheries are also threatened, especially on Kerkennah Island. From a social point of view, SLR would affect the entire population of Kerkennah (15,500 inhabitants) for whom the only source of income comes from the sea (coastal fishing and sponge fishing).
Moreover, human activities have already degraded ecological habitats on the Tunisian coastline. These degradations are likely to increase with SLR, the water warming and the increase of its salinity. Ecosystems’ degradation could be accompanied by a proliferation of invasive alien species, as already observed for the blue crab Portunis segnus, the Atlantic tropical crab Libinia dubia and the false Red Sea shrimp Erugosquilla massavensis which threaten the fish and seafood richness, as well as the fishing activity.
~Major initiatives for adaptation
Since the beginning of the 1980s, hard coastal protection techniques have been used (rubble-mound breakwaters and groin systems etc.). A total of 30 km of coastline have been protected by coastal defense structures. These structures have consolidated the coastline where they are located, but new problems have emerged such as disfigurement of the landscape, accumulation of algae, eutrophication of water in closed creeks, sedimentary imbalances, aggressive erosion in adjoining areas, etc.
Based on the observations of the hard structures’ impacts on the Tunisian coastline, the Coastal Protection and Development Agency (APAL) began, from the end of the 1990s, to look for new flexible methods for the protection of the coastline. They include beach top stabilization techniques such as beach replenishments, anti-wind poles and stabilization by geocontainers. A total of 6,530 m of coastline has already been protected between the sites of Tabarka, Korba, Bni Khiar, Mahdia, Chebba, Gabes and Jerba. The ongoing Tunisian Coastal Protection Program (PPLT) aims to protect 27 km of coastline against erosion and marine submersion for the sites of Kerkennah, Rafraf, Sousse North, Soliman, Tabarka and Hammamet.
However, there is still a need to strengthen the institutional framework, governance, regulatory measures, knowledge and capacity to cope with this important challenge of accelerated SLR.
5. Tourism
As one of the major tourist destinations in the South of the Mediterranean, Tunisia hosted more than 5.7 million tourists in 2016, accounting for 17.9 million overnight stays. Coastal resort tourism is largely developed with resorts in Tunis, Hammamet, Sousse, Monastir, Sfax and Djerba. A hard drop of 20.1% in tourist influx was recorded between 2014 and 2016. However, at the end of 2016, Tunisia

28
recorded a 6.8% increase in tourist arrivals17. Tourism plays a major role in the Tunisian economy since its revenues in 2016 represented 2,373 MTD (Ministry of Tourism and Handicrafts) and it contributes to the direct employment of about 95,500 people (average between 2011 and 2015).
~Climate change impacts on the sector
Expected increasing temperatures and decreasing precipitation under climate change should have a significant impact on the attractiveness of tourist destinations. The seasons and regions favorable to tourism should be modified, directly affecting the tourist flows and therefore the economy resulting from this activity. The summer season should be very hot, aggravating discomfort during the day and degrading the night respite. This type of atmosphere already shows a clear upward trend both in terms of frequency and intensity of heat18. Nevertheless an extension of the tourist season in spring and autumn should be made possible. Saharan tourism is likely to be highly vulnerable to climate change, given the already extreme climate characterizing these regions. Summer tourism could become impracticable in the southern regions of Tunisia, especially for the Saharan and mountainous tourist hubs of Tozeur, Kebili and Gafsa.
17 Ministère du Tourisme et de l’Artisanat et Office National du Tourisme Tunisien, 2016. Le tourisme tunisien en chiffre.18 Henia L et Alouane T., 2009. Les ambiances caniculaires dans les villes tunisiennes : cas de Monastir, Kairouan et Tozeur.
Reference period: 1961-1990
Period : 2010-2039
Period : 2040-2069Period : 2070-2099
Figure 18: Number of “good seaside months” (BCI> 70) for 4 periods according to the SRES A1F scenario and the HadCM3 model (TEC, 2010)

29Tunisia’s Third National Communication as part of the United Nations Framework Convention on Climate Change (UNFCCC)
As tourism is largely developed towards the seaside in Tunisia, the coastline is a fundamental resource for tourism. SLR is therefore considered as the major threat to this sector. Signs of beach erosion have already been observed and are becoming more and more pronounced in heavily modified shorelines. A 0.5 to 1.5 m/yr shoreline retreat is often observed however the retreat can reach 7 m/yr, affecting many tourist destinations.
The potential impacts of climate change could also result in an increase in the operating cost of hotels related to the management of water and energy resources. Failures in the drinking water supply could appear in over-frequented areas (coasts and islands in particular) and for some leisure facilities (swimming pools, golf, etc.) and infrastructures (hotels, etc.), which would directly affect the seaside tourism activity. Even though the sector uses less than 1% of the country’s water potential, the demand for water related to tourist activity is mainly concentrated during the summer, coinciding with periods of low water availability, and is concentrated in areas naturally lacking in drinking water resources (coastlines, islands, and oasis). In addition, desalination is an expensive adaptation option, for mostly small and financially fragile structures. The intensification of heat waves should also intensify the hotels’ air conditioning needs and, consequently, energy consumption, thus impacting their cost of operation.
~Major initiatives for adaptation
The land management and urbanism code plans a retreat behind the Public Maritime Domain for any new tourist infrastructure development. However, the accelerated SLR remains insufficiently accounted for in regulations. In addition, protection measures against coastal erosion tend to remain isolated and occasional, sometimes causing additional environmental problems and contributing to increase or displace erosion somewhere else.
In order to cope with the progressive deterioration of the Tunisian coastline and the increase of discomfort in summer, diversifying the tourism offer will be essential to ensure the adaptation of the sector to the impacts of climate change and therefore to support the tourist economy.
Overall, it seems that the tourism sector has a limited awareness of climate change impacts and is facing difficulties in the coordination of a coherent and global response to these emerging and increasingly worrying issues affecting its economy.
6. Health
Positive and important advancements in this field have been recorded during the last decades. The rising standard of living of the Tunisian population has allowed the success of national health programs such as the reduction of infant mortality (from 51.4% in 1985 to 16.3% in 2014) and the lengthening of the life expectancy of the Tunisian citizen at birth, from 74 years to 77.4 years in just 7 years (between 2007 and 2014). In 2015, the part of the state budget allocated to health was 5.6% (1.9% of GDP). Overall, Tunisians benefit from an extensive offer of care but some difficulties remain such as strong regional inequalities and a growing demand of healthcare due to an aging population.Finally, the presence of doctors in rural areas remains scarce, causing difficulties to access health care facilities in some areas.

30
~Climate change impacts on the sector
Climate change impacts on human health are twofold: direct or indirect. Some impacts are more due to an aggravating factor leading to health issues, while others derive directly from climate change.
Since the 20th century, several major vector-borne diseases have attracted attention in Tunisia: leishmaniasis, malaria, schistosomiasis and West Nile viral fever (FVWN). Some of them have been eradicated from the territory such as schistosomiasis and malaria. However, changes in rainfall patterns and temperatures may change the geographical distribution of insect vectors of these diseases, such as mosquitoes or sandflies.
Moreover, increasing water scarcity and the deterioration of water quality would have tangible consequences for human and animal health. The increase in waterborne diseases has already been felt in all governorates in response to lack of water. The current deterioration of water quality and related health risks are caused by the lack of water sterilization. Access to drinking water, sanitation and hygiene may become more difficult, resulting in new break outs of pathogenic microorganisms and potential bacteriological contamination. These diseases are expected to affect rural areas in particular, mainly in the center and north-west part of Tunisia, where access to drinking water and sanitation is already limited.
The increase of heat waves and heat islands could strongly increase respiratory diseases. Increase in the CO2 content of the atmosphere, degrading the air quality, would also contribute to increased risks of heart attacks, strokes and respiratory infections. People living in urban areas should be more affected because of greater pollution by fine particles and higher CO2 content in the air, caused by a concentration of human activities.
The increase in droughts and floods would destabilize the agricultural sector, with insufficient water resources for ecosystems and agrosystems. This could have a significant impact on food security in the country, causing an increase in malnutrition (with 5% of the population already suffering from malnutrition in 2010 according to the FAO).
~Major initiatives for adaptation
The Ministry of Health is responsible for vector disease fight and control, and has cooperated with the National Meteorological Institute (INM) to establish early warning systems for health applications. An early warning system related to “new and emerging diseases” was set up in 2008, in coordination with the National Observatory for New and Emerging Diseases (ONMNE).
Figure 19: Hydraulic shortage in Tunisia (2016)

31Tunisia’s Third National Communication as part of the United Nations Framework Convention on Climate Change (UNFCCC)
Tunisia has also focused on communication and health education to encourage healthy behaviors. This expertise constitutes a valuable asset for climate change adaptation.
7. Gender approach
According to several studies19,20 conducted on gender in Tunisia, climate change affects both men and women, but its impacts vary according to regions, social categories, generations and gender. Women are considered more vulnerable to climate change given their greater exposure to socio-political and economic inequalities.
Existing sectoral climate change vulnerability studies in Tunisia are all considered to be “gender neutral”. Indeed, the issue of vulnerability was approached with a socio-economic and environmental angle (agriculture, water resources, ecosystems, coastline, health and tourism) and when the human dimension was integrated, related issues were tackled in a global way, without taking into account the different needs, priorities, and roles of men and women.
For the first time, this report aims to integrate the gender dimension in each chapter, through a census of all existing studies on this concept and through discussions conducted during consultation workshops. An analysis of gender mainstreaming in national adaptation policies identified barriers to gender mainstreaming in the field of climate change.
19 GIZ et Ministère de l’Environnement. 2012. « Genre et changement climatique » dans le cadre du projet « Appui à la mise en œuvre de la Convention Cadre des Nations unies sur le Changement climatique ».20 APAL et PNUD, 2015. « Addressing Climate Change Vulnerability and Risks in Vulnerable Coastal Areas of Tunisia » Élaboration d’un diagnostic sur l’intégration de l’approche genre dans le projet – Ghar El Melh et Djerba ; APAL – PNUD ; 2015

32
Chapter 5: Research, awareness, information and capacity building
There is a clear need to reinforce the general public’s knowledge on the basic concepts and the issues and risks related to climate change. The subject of climate change has not yet been seized by the media. Substantive work is required to form a core of specialized media, which would relay information in this area. The executive bodies of the Energy, Forest and Rangelands, Water and Agricultural Lands sectors seem to be globally well informed on the issues related to climate change. Nevertheless, gaps remain in the sectors of Tourism, Health and Education in terms of awareness and information. On the other hand, important progress has been made in Tunisia in the field of mitigation. Beyond the enabling activities (inventory, BUR, national communication), Tunisia has set up the Information Cell on Sustainable Energy and on the Environment within the National Agency for Energy Management (ANME). Several new concepts such as NAMAs and the MRV system have been promoted and adopted. However, significant technical, institutional, regulatory and financial shortcomings are identified.
The categories of actors that have benefited the most from capacity building actions are central government officials and NGOs, and to a lesser extent decentralized state services in the governorates. The other groups have been less targeted so far, in particular parliamentarians, local authorities, academia and research, and private sector and financial players.

33Tunisia’s Third National Communication as part of the United Nations Framework Convention on Climate Change (UNFCCC)
Chapter 6: Governance, financing and technology transfer
Despite the inclusion of the fight against climate change in the Tunisian Constitution and the country’s commitment within the international community to meet this challenge, there is still no designated institution to coordinate public policies in the matter. The main institutions nominated to implement the UNFCCC are the Ministry of Local Affairs and Environment (MALE), the National Agency for Energy Management (ANME), the Ministry of Agriculture, Water Resources and Fisheries (MARHP) and the Designated National Authority (DNA) for the Clean Development Mechanism (CDM) of the Kyoto Protocol.. Other sectoral agencies contribute to the development of policies and measures to fight climate change without having specific assignments for this purpose. Tunisia’s NDC is largely built on existing sectoral and horizontal strategies, such as the National Climate Change Strategy (SNCC) developed in 2012, the Energy Efficiency Strategy, the Tunisian Solar Plan (TSP) and adaptation strategies of different sectors and areas.
Thanks to the support of several capacity-building projects and several donors (UNDP Tunisia, GIZ Tunisia), efforts have been made to enhance the collaboration between sectors. However, this was done only for a number of specific projects, such as the development of the NDC. Indeed, there is still no assigned representative to coordinate the discussions and work of different sectors to ensure an effective and consistent implementation of the UNFCCC and to prepare the future implementation of the Paris Agreement. Moreover, a complete, permanent and formalized MRV system needs to be set up, to allow the monitoring and evaluation of all components of mitigation and adaptation actions carried out at a national level and in all sectors.
The investments required to achieve the mitigation target would be about 31.5 billion of dinars over the 2017-2030 period, equivalent to 13 billion of dollars. In accordance with Tunisia’s NDC, the total financing needs to achieve Tunisia’s climate change adaptation goals would be about 848 million of dinars over the 2017-2030 period, i.e. around 353 million of dollars. These costs are mainly “soft” costs linked to supporting and popularizing new practices (institutional support, capacity building, etc.) to face climate change impacts. These financing needs do not include the very expensive infrastructure and development costs, such as the construction of dikes for the protection of the coastline, or the displacement of human or industrial settlements.


36