turbulence and wind turbines - · pdf fileturbulence and wind turbines arno j. brand ecn wind...
TRANSCRIPT

September 2011
ECN-M--11-086
Turbulence and Wind TurbinesArno J. Brand
Joachim Peinke Jakob Mann
Presented at: 13th European Turbulence Conference, Warsaw, Poland, 12-15 September 2011

Turbulence and wind turbines
Arno J. Brand ECN Wind Energy, Petten, Netherlands E-mail: [email protected] Joachim Peinke ForWind, Institute of Physics, University of Oldenburg, Oldenburg, Germany E-mail: [email protected] Jakob Mann Risø Nat. Lab. for Sust. Energy, Techn. Univ. of Denmark, Wind En. Div., Roskilde, Denmark E-mail: [email protected] Abstract. The nature of turbulent flow towards, near and behind a wind turbine, the effect of turbulence on the electricity production and the mechanical loading of individual and clustered wind turbines, and some future issues are discussed.
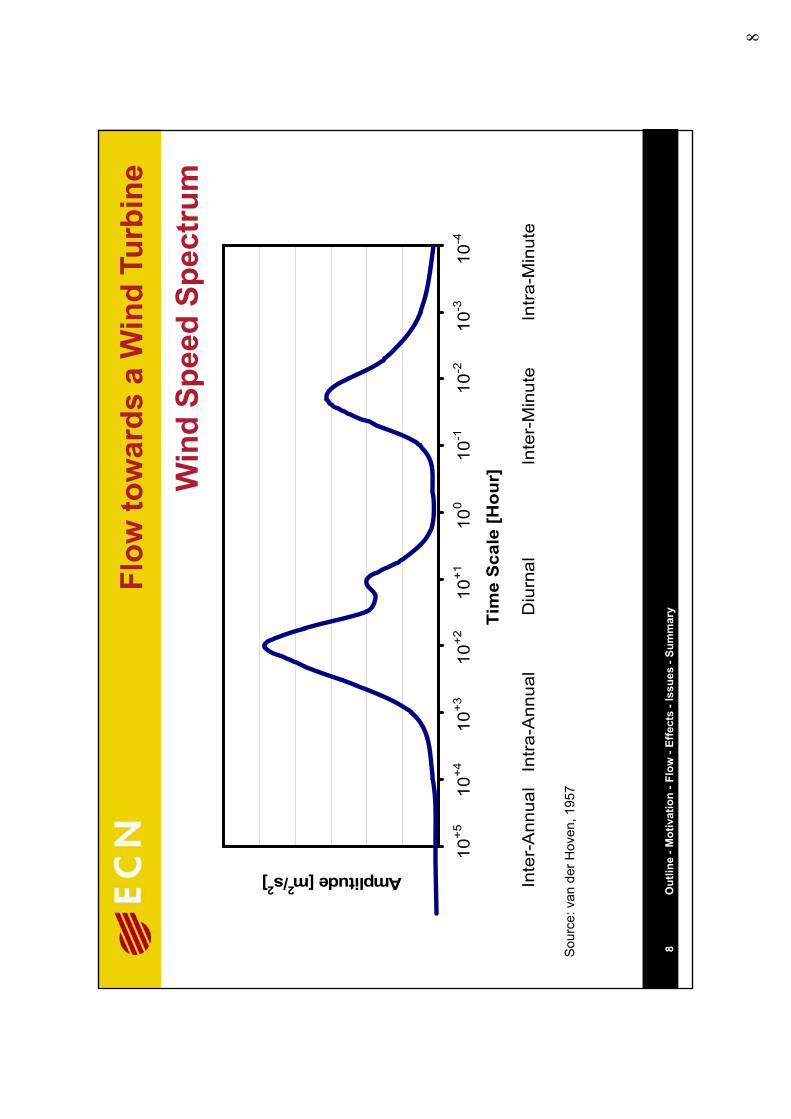
1. Wind energy conversion and turbulence A wind energy conversion system extracts energy from the turbulent wind and while doing so creates extra turbulence. Wind energy conversion systems include horizontal axis wind turbines, vertical axis wind turbines, and other devices like kites or ladders, but in this paper the focus is on horizontal axis wind turbines. In the following these devices are referred to as wind turbines. Wind is motion of air in the planetary boundary layer. As shown in figure 1 it is a process at various time and space scales (Orlanski, 1975). This paper addresses small scale turbulence, which is all variation in time of wind speed and wind direction with periods less than ten minutes. In this paper an overview is given of the effect of wind turbines on turbulence, and the effect of turbulence on wind turbines. In addition various modeling approaches are presented. First, in section 2 descriptions are presented of the turbulent flow towards, near and behind a wind turbine. Next, in section 3 the electricity production and the mechanical loading under turbulent conditions are addressed. Finally, in section 4 some future issues are presented. 2. Turbulent flow towards, near and behind a wind turbine 2.1. The flow towards a wind turbine The flow towards a wind turbine is essentially turbulent, with wind speed variations originating from production of turbulent kinetic energy due to surface roughness in combination with production or destruction of turbulent kinetic energy due to atmospheric stability. The modeling of the flow towards a wind turbine is based on classical assumptions on the time variation of wind speed (van der Hoven, 1957), the type of the probability density function of wind speed variations within ten-minute periods (Wyngaard, 1992), and the shape of the wind speed profiles under various atmospheric stability conditions (Businger et al., 1971). These assumptions are shown in the figures 2, 3 and 4. Recent insights challenge these assumptions: the spectral gap in the Van der Hoven spectrum is absent over land (Courtney and Troen, 1990) and under unstable maritime conditions (Gjerstad et al., 1994), the distribution of wind speed variation is non-Gaussian (Böttcher et al., 2006), and wind speed profiles under maritime conditions differ from the Businger-Dyer profiles (Gryning et al., 2007).

Space Scale
Time Scale
second minute hour day week month year years
1000 km
100 km
10 km
1 km
100 m
10 m
1 m
10000 km trade winds
westerlies polar winds fronts
huricanes cyclones
thunderstorms mountain winds
tornadoes
gusts turbulence
Figure 1. Processes in the planetary boundary layer according to the classification by Orlanski, 1975
1.E-041.E-031.E-021.E-011.E+001.E+011.E+021.E+031.E+041.E+05
Time Scale [Hour]
Am
plitu
de [m
2 /s2 ]
Figure 2. The classical assumption on the time variation of the wind speed. The spectrum of wind
speed variation has a gap allowing for a separation of scales (van der Hoven, 1957) The turbulence in the flow towards a wind turbine is modeled on basis of similarity theory in combination with computational fluid dynamics methods (Satoh, 2004; chapter 11). The computational fluid dynamics approaches employ closure models in order to threat the effect of scales smaller than the resolution of the numerical model. These closure models include the classic zero, one and two-equation turbulence sub-models as well as the modern Smagorinsky and Mellor-Yamada sub-models. The closure models are implemented in atmospheric models like the HiRLAM (Undén et al., 2002), the WRF (Skamarock et al., 2008) or EllipSys3D (Bechman et al., 2007).

f(u)
μu + σuμu – σu μuu
Figure 3. Sketch of the classical assumption of the probability density function f(u) of the wind speed u within ten-minute periods. This distribution is Gaussian and is characterized by the
average value μU and the standard deviation σU (Wyngaard, 1992)
μu
z
Uh
h
stable
unstable
neutral
z0
Figure 4. Sketch of the classical assumption on the shape of the wind speed profiles under various atmospheric stability conditions but for the same wind speed Uh at the top h of the atmospheric boundary layer. The average wind speed μU depends on the height z; z0 is the surface roughness
length where the wind speed is zero (Businger et al., 1971) 2.2. The flow near a wind turbine Upon approaching a wind turbine, the wind speed decreases and the turbulence increases in anticipation of the flow disturbing and energy extracting object. The flow near a wind turbine is modeled by using a rotor disk which contains the rotor blades. The flow through the rotor disk traditionally is modeled homogeneously under the assumption that the wind speed and the turbulence do not depend on the position in the rotor disk, although it is not unusual to include some inhomogeneity in the form of a horizontal or vertical

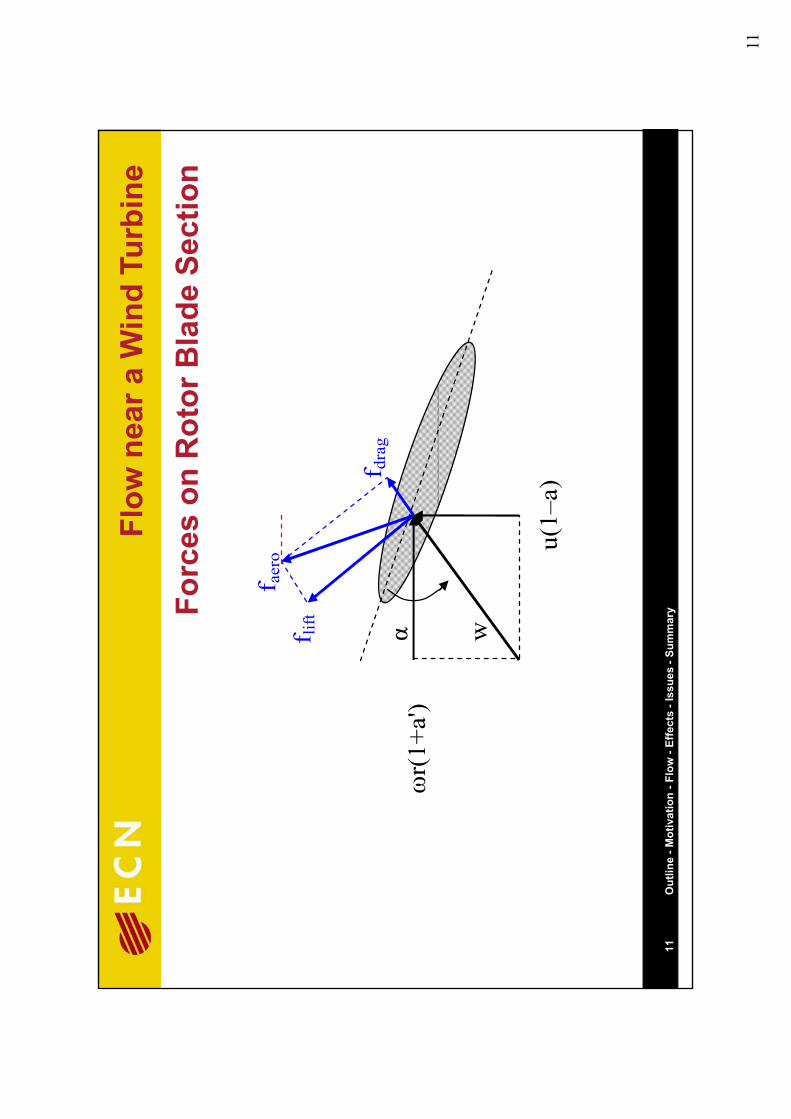
wind gradient in order to model wind shear respectively yaw misalignment. The turbulence in a point in the rotor disk is modeled on basis of a spectrum, usually Kaimal (Kaimal et al., 1972), in combination with inverse Fourier transforms (Veers, 1984), or an approach based on rapid distortion theory (Mann, 1998). A rotating rotor blade meets the incoming wind, and as a result feels an effective wind speed and an effective angle of attack (figure 5). Turbulent structures in the incoming wind are rotationally sampled by the rotor blade. The flow past a rotor blade is modeled by using blade-element/momentum theory and employing sectional airfoil data (Sørensen, 2011). The airfoil data have been found to depend heavily on unsteadiness (Devinant et al., 2002); for example a turbulent intensity of a percent considerably reduces the lift force and increases the drag force which effectively spoils rotor performance. The airfoil data traditionally originate from wind tunnel experiments but to date also from computationally fluid dynamics methods or aerodynamic design methods. If the computationally fluid dynamics method is based on the Reynolds-averaged Navier-Stokes equations, usually a kε or kω sub-model is used in order to calculate the flow over the airfoil section beyond transition. In the case of a Large Eddy Simulation method, the Smagorinsky-Lilly sub-grid model is used for this purpose. Aerodynamic design codes employ integral boundary layer formulations. 2.3. The flow behind a wind turbine The flow behind a wind turbine is sub-divided in three regions, each requiring distinct modeling approaches (Vermeer et al., 2003). This is shown in the figures 6 and 7. In the near wake the flow is dominated by the velocity deficit due to the energy extraction and the vortices created at the tip of the rotor blades, resulting in a wind speed deficit and extra turbulence. In this region the flow structure essentially depends on the aerodynamics of the rotor blades. On basis of solutions of this flow problem and empirical information the resulting flow is assumed to have a top-hat shaped wind speed profile and edge-concentrated turbulence. In the intermediate wake the tip vortices gradually lose identity, and the undisturbed flow mixes with the core flow. As a result the wind speed deficit and the extra turbulence begin to decay. In the far wake equilibrium is assumed between the convective forces and the gradients of the turbulent momentum fluxes. On basis of analytical solutions of the governing equations the profiles of the wind speed deficit are assumed to be Gaussian. On basis of empirical information the profiles of the extra turbulence are assumed to be Gaussian too, but with different values of the decay parameters. Both the velocity deficit and the extra turbulence decay with the streamwise and the spanwise distance until the limit situation of the upstream wind speed and the ambient turbulence is reached. Depending of the atmospheric stability, this takes a distance of 10 to 20 rotor diameters. The mechanism here is redistribution of energy between the mean and the turbulent wind field in combination with feed-in of undisturbed flow. A wind turbine wake does not have a fixed position even if the mean wind direction is constant: it has been found to move in horizontal as well as vertical direction. This effect is known as wake meandering. A meandering wake smears the velocity deficit and the extra turbulence over a much larger volume than a fixed wake does. To date the process is not completely understood; hypotheses include stochastic wind direction variation (Bingöl et al., 2010), an analogy with bluff body vortex shedding (Medici & Alfredsson, 2006), and motion due to a spanwise wind speed component (Larsen et al., 2008). May this be as it is, a small number of empirical wake meandering models exist.

u(1–a)
α
w
ωr(1+a')
Figure 5. The effective wind speed w and the effective angle of attack α of a section of a wind turbine rotor blade is a function of the upstream wind speed u, the rotor speed ω and the radial
position r. The induction factors a and a' represent the effect of the rotor blade on the flow
y
x
μ0
μw
σw
y
x
σ0
near wake intermediate wake
far wake
Figure 6. Top view of the average μ (top) and the standard deviation σ (bottom) of the wind speed at hub height near a wind turbine. The upstream values are μ0 and σ0, and the downstream values
are μw and σw. The streamwise and the spanwise directions are x and y, respectively

z
x
μ0 μw μw μw
σ0
z
x
σw
near wake intermediate wake
far wake
σw σw
Figure 7. Side view of the average μ (top) and the standard deviation σ (bottom) of the wind speed near a wind turbine as a function of the height. The upstream values are μ0 and σ0, and the
downstream values are μw and σw. The streamwise and the vertical directions are x and z, respectively
3. Effect of turbulence on electricity production and mechanical loading 3.1. Individual wind turbine The wind exerts forces on the rotor blades of a wind turbine. When rotating, the in-plane components of the aerodynamic force on the rotor blades cause torque about the rotor axis. Similarly, the out-of-plane components cause thrust on the rotor. Turbulence now leads to time variations in the rotor shaft torque and the rotor thrust. The aerodynamic power is the product of the rotor shaft torque and the rotor speed. Turbulence therefore gives rise to variations in the power and consequently the electricity production. In fact, turbulence is believed to be essential in assessing energy yield (Gottschall & Peinke, 2008). The mechanical loading of the components of a wind turbine, like the blades or the shaft, originates from the aerodynamic force on the rotor blades. Turbulence therefore causes variations in the mechanical loading; in other words: it causes fatigue loading. To date fatigue loading is

considered the primary factor which determines the life time of a wind turbine, and several methods for designing for a given life time exist. Understanding and characterizing turbulence before and behind a wind turbine is believed to be essential here (Mücke et al., 2010). 3.2. Cluster of wind turbines In a cluster of wind turbines the flow towards a given wind turbine is affected by the velocity deficit and the extra turbulence due to any upstream wind turbine. Such a cluster usually is referred to as a wind farm. In general, this interaction leads to a complex structure of the flow in and behind the wind farm. For example, depending on the wind direction and the layout of the wind farm, regions with multiple velocity wakes and multiple turbulence wakes may be identified. In this section of the paper the focus is on the relatively simple case where the wind direction is parallel to a row of wind turbines. The limit situation of the upstream wind speed and the ambient turbulence only is reached after the most downstream turbine of a row of wind turbines. In the row a different limit situation is reached (Barthelmie et al., 2004). If the separation distance between the turbines is smaller than a critical value, the power deficit at the second turbine is the largest in the row and the power deficits in the subsequent turbines are constant. In this case beyond the second turbine equilibrium is reached between the mean kinetic energy extracted by a wind turbine and the vertical fluxes of the turbulent kinetic energy (Cal et al., 2010). On the other hand, for separation distances larger than the critical value, the power deficit smoothly increases with position in the row and a constant power deficit is not obtained. The mechanism in this case is superposition of the individual values of the velocity deficit and the added turbulence, without replacement from above. The consequences for the mechanical loading of the turbine components are less clear, but in general the loading has been found to increase with the position in the row. 4. Future issues In the preceding sections of this paper it has been shown that a wind turbine produces turbulence at a scale of the rotor size (diameter as well as chord) and the corresponding frequency (rotor speed) and induced velocity, and that this turbulence decays to smaller scales when traveling in downstream direction and eventually dissipates to a level which can not be discriminated from the background turbulence. In addition it has been shown that a wind turbine adds turbulence to the inhomogeneous turbulence in the atmospheric boundary layer, which turbulence is created by the always present roughness of the surface but usually also by the thermal structure of the atmospheric boundary layer. In the remainder we address three outstanding issues. First, the classic turbulence sub-models that were addressed in the section 2 have been found to perform poorly in validations on basis of full-scale data. This has to do with the limitations of the experimental techniques (usually point measurements), but it also points to a limited understanding of the complex structure of the flow towards, near and behind a wind turbine. Second, as already explained in section 2.1, the modeling of the flow towards a wind turbine is based on classical assumptions on the variability of wind speed which have been challenged by recent insights. The third issue is the assumed homogeneity of the wind field in the rotor plane (section 2.2). This assumption has been found to be reasonable for wind turbines which are small compared to the length scales of the coherent motions in the atmospheric boundary layer. (These coherent motions include – but are not limited to – flow induced by thermal instability, low-frequency/large-scale structures due to weather systems, and short-lived and local bursts.) Since the scales of larger rotors are of the same order as those of the coherent motions, the wind field in the rotor plane of such a wind turbine is expected to be inhomogeneous.
In order to resolve these issues and to identify the consequences for the design of wind turbines, there is a need to describe the physical processes which are relevant to the production, the transport and the dissipation of the turbulence due to the wind turbine and their interaction with the turbulence in the atmospheric boundary layer. New experiments will play an important role in this research (Knebel et al., 2010). In addition there is a need to develop a comprehensive model of this kind of turbulence for application in wind turbine and wind farm design. References BARTHELMIE R., LARSEN G., PRYOR S., JØRGENSEN H., BERGSTRÖM H., SCHLEZ W., RADOS K., LANGE B., VØLUND P., NECKELMANN S., MOGENSEN S., SCHEPERS G., HEGBERG T., FOLKERTS L., & MAGNUSSON M. 2004 Efficient development of offshore wind farms – Modeling wake and boundary layer interactions. Wind Energy, Vol. 7, Iss. 3, pp. 225-245 BECHMANN A., SØRENSEN N. & JOHANSEN J. 2007 Atmospheric flow over terrain using hybrid RANS/LES. In: Proceedings of EWEC 2007. European Wind Energy Association, pp. 64-67 BINGÖL F., MANN J. & LARSEN G.C. 2010 Light detection and ranging measurements of wake dynamics - Part I: One-dimensional scanning. Wind Energy, Vol. 13, Iss. 1, pp. 51-61 BÖTTCHER F., BARTH ST. & PEINKE J. 2006 Small and large-scale fluctuations in atmospheric wind speeds. Stoch. Env. Res. and Risk Ass., Vol. 21, No. 3, pp. 299-308 BUSINGER J.A., WYNGAARD J.C., IZUMI Y. & BRADLEY E.F. 1971 Flux-profile relationship in the atmospheric surface layer. J. Atmos. Sci., Vol. 28, pp. 181-189 CAL R.B., LEBRÓN J., CASTILLO L., KANG H.S. & MENEVEAU C. 2010 Experimental study of the horizontally averaged flow structure in a model wind-turbine array boundary layer. J. Renewable Sustainable Energy, Vol. 2, 013106, 25 pp COURTNEY M. & TROEN I. 1990 Wind speed spectrum from one year of continuous 8 Hz measurements. In: Ninth Symposium of Turbulence and Diffusion, pp. 301-304 DEVINANT PH., LAVERNE T., & HUREAU J. 2002 Experimental study of wind turbine airfoil aerodynamics in high turbulence. J. Wind Eng. Ind. Aerodyn., Vol. 90, Iss. 6, pp. 689-707 GJERSTAD J., AASEN S.E., ANDERSSON H.I., BREVIK I., & LØVSETH J. 1994 An analysis of low-frequency maritime atmospheric turbulence. J. Atmos. Sci., Vol. 52, pp. 2663-2669 GOTTSCHALL J. & PEINKE J. 2008 How to improve the estimation of power curves for wind turbines. Environ. Res. Lett., Vol. 3, 015005, 7 pp GRYNING S.E., BATCHVAVORA E., BRÜMMER B., JØRGENSEN H. & LARSEN S. 2007 On the extension of the wind profile over homogeneous terrain beyond the surface layer. Bound. Layer Meteor., Vol. 124, pp. 251-268 VAN DER HOVEN I. 1957 Power spectrum of horizontal wind speed in the frequency range from 0.0007 to 900 cycles per hour. J. Meteorology, Vol. 14, pp. 160-164 KAIMAL J.C., WYNGAARD J.C., IZUMI Y. & COTÉ O.R. 1972 Spectral characteristics of surface layer turbulence. Q. Journal Roy. Met. Soc., Vol. 98, Iss. 417, pp. 563-589 KNEBEL P., KITTEL A. & PEINKE J. 2010. Atmospheric wind field conditions generated by active grids. Exps. Fluids, Submitted LARSEN G.C., MADSEN H.A., THOMSEN K. & LARSEN T.J. 2010 Wake meandering: A pragmatic approach. Wind Energy, Vol. 11, Iss. 4, pp. 377-395 MANN J. 1998 Wind field simulation. Prob. Mech. Engng., Vol. 13, No. 4, pp. 269-282 MEDICI D. & ALFREDSSON P.H. 2006 Measurements on a wind turbine wake – 3D effects and bluff body vortex shedding. Wind Energy, Vol. 9, Iss. 3, pp. 219-236

MÜCKE T., KLEINHANS D. & PEINKE J. 2010 Atmospheric turbulence and its influence on the alternating loads on wind turbines. Wind Energy, Vol. 14, Iss. 2, pp. 301-316 ORLANSKI I. 1975 A rational subdivsion of scales for atmospheric processes. Bull. Am. Met. Soc., Vol. 56, No. 5, pp. 527-530 SATOH M. 2004 Atmospheric circulation dynamics and general circulation models. Springer. ISBN 3-540-42638-8 SKAMAROCK W.C., KLEMP J.B., DUDHIA J., GILL D.O., BARKER D.M., DUDA M.G., HUANG X.-Y., WANG W. & POWERS J.G. 2008 A description of the Advanced Research WRF Version 3. NCAR Technical Note NCAR/TN–475+STR SØRENSEN J.N. 2011 Aerodynamic aspects of wind energy conversion. Ann. Rev. Fluid Mech., Vol. 43, pp. 427-448 UNDÉN P. et al. 2002. HiRLAM-5 scientific documentation. Online: www.hirlam.org, accessed 31 May 2011 VEERS P.S. 1984 Three-dimensional wind simulation. Technical report SAND88-0152, Sandia National Laboratories VERMEER L.J., SØRENSEN J.N. & CRESPO A. 2003 Wind turbine wake aerodynamics. Prog. Aerosp. Sci., Vol. 39, pp. 467-510 WYNGAARD J.C. 1992 Atmospheric turbulence. Ann. Rev. Fluid Mech., Vol. 24, pp. 205-234

1
Turb
ulen
cean
d W
ind
Turb
ines
Arn
o J.
Bra
ndJo
achi
m P
eink
eJa
kob
Man
nJa
kob
Man
n

2
Out
line
Mot
ivat
ion
Win
d en
ergy
con
vers
ion
Flow
tow
ards
, nea
r and
beh
ind
a w
ind
turb
ine
,
Effe
cts
of tu
rbul
ence
Mod
ellin
gis
sues
Mod
ellin
g is
sues
2O
utlin
e -M
otiv
atio
n -F
low
-Ef
fect
s -I
ssue
s -S
umm
ary

3
Mot
ivat
ion
Win
d tu
rbin
es a
ffect
turb
ulen
ce
Turb
ulen
ce a
ffect
s w
ind
turb
ines
3O
utlin
e -M
otiv
atio
n -F
low
-Ef
fect
s -I
ssue
s -S
umm
ary

4
Win
d En
ergy
Con
vers
ion
Win
d Sp
eed
Mec
hani
cal L
oads A
erod
ynam
ic P
ower
4O
utlin
e -M
otiv
atio
n -F
low
-Ef
fect
s -I
ssue
s -S
umm
ary

5
Win
d En
ergy
Con
vers
ion
Win
dSc
ales
1000
k
1000
0 km
te
rres
tial s
yste
ms
Win
d Sc
ales
1000
km
100
km
10km
seco
ndar
y ci
rcul
atio
ns
Spa
ce S
cale
10 k
m
1 km
100
mte
rtiar
y ci
rcul
atio
ns
100
m
10 m
1m
Tim
e S
cale
seco
nd m
inut
e ho
ur
day
wee
k m
onth
ye
ar
year
s
1 m
Sou
rce:
Orla
nski
, 197
5
5O
utlin
e -M
otiv
atio
n -F
low
-Ef
fect
s -I
ssue
s -S
umm
ary

6
Win
d En
ergy
Con
vers
ion
Win
dSc
ales
1000
k
1000
0 km
tra
de w
inds
w
este
rlies
Win
d Sc
ales
1000
km
100
km
10km
pola
r w
inds
fr
onts
hu
rican
es
cycl
ones
Spa
ce S
cale
10 k
m
1 km
100
m
yth
unde
rsto
rms
mou
ntai
n w
inds
to
rnad
oes
100
m
10 m
1m
gu
sts
turb
ulen
ce
Tim
e S
cale
seco
nd m
inut
e ho
ur
day
wee
k m
onth
ye
ar
year
s
1 m
Sou
rce:
Orla
nski
, 197
5
6O
utlin
e -M
otiv
atio
n -F
low
-Ef
fect
s -I
ssue
s -S
umm
ary

7
Win
d En
ergy
Con
vers
ion
Rot
oran
dW
ind
Scal
es
1000
k
1000
0 km
tra
de w
inds
w
este
rlies
Rot
or a
nd W
ind
Scal
es
1000
km
100
km
10km
pola
r w
inds
fr
onts
hu
rican
es
cycl
ones
Spa
ce S
cale
10 k
m
1 km
100
m
yth
unde
rsto
rms
mou
ntai
n w
inds
to
rnad
oes
100
m
10 m
1m
gu
sts
turb
ulen
ce
Tim
e S
cale
seco
nd m
inut
e ho
ur
day
wee
k m
onth
ye
ar
year
s
1 m
Sou
rce:
Orla
nski
, 197
5
7O
utlin
e -M
otiv
atio
n -F
low
-Ef
fect
s -I
ssue
s -S
umm
ary
8
Flow
tow
ards
a W
ind
Turb
ine
Win
dSp
eed
Spec
trum
Win
d Sp
eed
Spec
trum
2] tude [m
2/s
2Amplit
1.E
-04
1.E
-03
1.E
-02
1.E
-01
1.E
+00
1.E
+01
1.E
+02
1.E
+03
1.E
+04
1.E
+05
Tim
e S
cale
[Hou
r]
It
Al
It
Al
Di
lI
tM
it
It
Mi
t
10+5
1
0+4
10
+3
10+2
10+1
100
1
0-1
1
0-2
10
-3
1
0-4
Sou
rce:
van
der
Hov
en, 1
957
Int
er-A
nnua
l In
tra-A
nnua
l
Diu
rnal
Inte
r-M
inut
e
I
ntra
-Min
ute
8O
utlin
e -M
otiv
atio
n -F
low
-Ef
fect
s -I
ssue
s -S
umm
ary

9
Flow
tow
ards
a W
ind
Turb
ine
Dis
trib
utio
nof
Win
dSp
eed
Varia
tion
f(
u)
Dis
trib
utio
n of
Win
d Sp
eed
Varia
tion
uμ u
+ σ
uμ u
– σ
uμ u
u
Sour
ce: W
ynga
ard,
199
2
9O
utlin
e -M
otiv
atio
n -F
low
-Ef
fect
s -I
ssue
s -S
umm
ary

10
Flow
nea
r a W
ind
Turb
ine
Forc
eson
Rot
orB
lade
Sect
ion
Forc
es o
n R
otor
Bla
de S
ectio
n
α ω
r(1+
a')
w
u(1–
a)
10O
utlin
e -M
otiv
atio
n -F
low
-Ef
fect
s -I
ssue
s -S
umm
ary
11
Flow
nea
r a W
ind
Turb
ine
Forc
eson
Rot
orB
lade
Sect
ion
Forc
es o
n R
otor
Bla
de S
ectio
n
f
f lift
f aer
o
α ω
r(1+
a')
f dra
g
w
u(1–
a)
11O
utlin
e -M
otiv
atio
n -F
low
-Ef
fect
s -I
ssue
s -S
umm
ary

12
Flow
nea
r a W
ind
Turb
ine
Forc
eson
Rot
orB
lade
Sect
ion
Forc
es o
n R
otor
Bla
de S
ectio
n
f
fl
f lift
f aer
of n
orm
al f d
rag
f tang
entia
l
12O
utlin
e -M
otiv
atio
n -F
low
-Ef
fect
s -I
ssue
s -S
umm
ary

13
Flow
beh
ind
a W
ind
Turb
ine
Mea
nW
ind
Spee
dTo
pVi
ewM
ean
Win
d Sp
eed
–To
p Vi
ew
y μ 0
x μ w
near
wak
e in
term
edia
te w
ake
far w
ake
13O
utlin
e -M
otiv
atio
n -F
low
-Ef
fect
s -I
ssue
s -S
umm
ary

14
Flow
beh
ind
a W
ind
Turb
ine
Win
dSp
eed
Stan
dard
Dev
iatio
nTo
pVi
ewW
ind
Spee
d St
anda
rd D
evia
tion
–To
p Vi
ew
y σ 0
σ wσ w
x
near
wak
e in
term
edia
te w
ake
far w
ake
14O
utlin
e -M
otiv
atio
n -F
low
-Ef
fect
s -I
ssue
s -S
umm
ary

15
Flow
beh
ind
a W
ind
Turb
ine
Mea
nW
ind
Spee
dSi
deVi
ewM
ean
Win
d Sp
eed
–Si
de V
iew
z
μ 0μ
μμ
μ 0μ w
μ wμ w
x
near
wak
e in
term
edia
te w
ake
far w
ake
15O
utlin
e -M
otiv
atio
n -F
low
-Ef
fect
s -I
ssue
s -S
umm
ary

16
Flow
beh
ind
a W
ind
Turb
ine
Win
dSp
eed
Stan
dard
Dev
iatio
nSi
deVi
ewW
ind
Spee
d St
anda
rd D
evia
tion
–Si
de V
iew
z
σ 0
σ w
σ w
σ w
x
near
wak
e in
term
edia
te w
ake
far w
ake
16O
utlin
e -M
otiv
atio
n -F
low
-Ef
fect
s -I
ssue
s -S
umm
ary

17
Effe
ct o
f Tur
bule
nce
Win
dTu
rbin
eR
otor
Win
d Tu
rbin
e R
otor
Sou
rce:
Tom
Obd
am
17O
utlin
e -M
otiv
atio
n -F
low
-Ef
fect
s -I
ssue
s -S
umm
ary

18
Effe
ct o
f Tur
bule
nce
Clu
ster
ofW
ind
Turb
ines
Clu
ster
of W
ind
Turb
ines
W
ind
Spee
d hi
gh
low
Uno
m
Ust
op
very
hig
h
low
nom
Ust
art
med
ium
WT1
WT2
y
W
WT3
x W
T4
18O
utlin
e -M
otiv
atio
n -F
low
-Ef
fect
s -I
ssue
s -S
umm
ary

19
Effe
ct o
f Tur
bule
nce
Clu
ster
ofW
ind
Turb
ines
Clu
ster
of W
ind
Turb
ines
C
apac
ity
full
zero
zero
zero
100%
0%
part
ial
WT1
WT2
y
W
WT3
WT1
+WT2
+WT3
+WT4
x W
T4
19O
utlin
e -M
otiv
atio
n -F
low
-Ef
fect
s -I
ssue
s -S
umm
ary

20
Rot
oran
dW
ind
Scal
es
The
Hom
ogen
eity
Issu
e
1000
k
1000
0 km
tra
de w
inds
w
este
rlies
Rot
or a
nd W
ind
Scal
es
1000
km
100
km
10km
pola
r w
inds
fr
onts
hu
rican
es
cycl
ones
Spa
ce S
cale
10 k
m
1 km
100
m
yth
unde
rsto
rms
mou
ntai
n w
inds
to
rnad
oes
100
m
10 m
1m
gu
sts
turb
ulen
ce
Sca
les
of R
otor
≈S
cale
s of
Coh
eren
t Mot
ions
Tim
e S
cale
seco
nd m
inut
e ho
ur
day
wee
k m
onth
ye
ar
year
s
1 m
Sou
rce:
Orla
nski
, 197
5
20O
utlin
e -M
otiv
atio
n -F
low
-Ef
fect
s -I
ssue
s -S
umm
ary

21
Win
dSp
eed
Spec
trum
The
Varia
bilit
y Is
sue
2]
Win
d Sp
eed
Spec
trum
Mod
est D
epth
tude [m2/s
2Amplit
1.E
-04
1.E
-03
1.E
-02
1.E
-01
1.E
+00
1.E
+01
1.E
+02
1.E
+03
1.E
+04
1.E
+05
Tim
e S
cale
[Hou
r]
It
Al
It
Al
Di
lI
tM
it
It
Mi
t
10+5
1
0+4
10
+3
10+2
10+1
100
1
0-1
1
0-2
10
-3
1
0-4
Int
er-A
nnua
l In
tra-A
nnua
l
Diu
rnal
Inte
r-M
inut
e
I
ntra
-Min
ute
Sour
ce: C
ourtn
ey a
nd T
roen
, 199
0; G
jers
tad
et a
l., 1
994
21O
utlin
e -M
otiv
atio
n -F
low
-Ef
fect
s -I
ssue
s -S
umm
ary

22
Dis
trib
utio
nof
Win
dSp
eed
Varia
tion
The
Varia
bilit
y Is
sue
f(
u)
Dis
trib
utio
n of
Win
d Sp
eed
Varia
tion
Hea
vier
Tai
ls
uμ u
+ σ
uμ u
– σ
uμ u
u
Sou
rce:
Böt
tche
r et a
l., 2
006
22O
utlin
e -M
otiv
atio
n -F
low
-Ef
fect
s -I
ssue
s -S
umm
ary

23
Win
dSp
eed
Prof
ile
The
Varia
bilit
y Is
sue
z
Win
d Sp
eed
Prof
ile
Hig
her W
ind
Spe
eds
h
stab
le
neut
ral
μ
unst
able
z 0
μ uU
h S
ourc
e: G
ryni
ng e
t al.,
200
7
23O
utlin
e -M
otiv
atio
n -F
low
-Ef
fect
s -I
ssue
s -S
umm
ary

24
The
Sub-
Mod
els
Issu
e
kεm
odel
sve
rsus
mea
sure
men
ts
1
1.2
Obs
erva
tions
kε-m
odel
s ve
rsus
mea
sure
men
ts
0.81
Obs
erva
tions
Wak
eFar
mF
arm
Flo
w
0.4
0.6
Pi/P1
0
0.2
01
23
45
6
orde
r in
row
Sou
rce:
Edw
in B
otN
ear W
ake:
Red
uced
turb
ulen
t mix
ing
Inte
rmed
iate
Wak
e:Tu
rbul
entm
ixin
gco
ncen
trate
d
24O
utlin
e -M
otiv
atio
n -F
low
-Ef
fect
s -I
ssue
s -S
umm
ary
Inte
rmed
iate
Wak
e: T
urbu
lent
mix
ing
conc
entra
ted
in a
nnul
ar s
hear
laye
r

25
Sum
mar
y
Win
d en
ergy
con
vers
ion
Flow
tow
ards
, nea
r and
beh
ind
a w
ind
turb
ine
Effe
cts
of tu
rbul
ence
Mod
ellin
g is
sues
25O
utlin
e -M
otiv
atio
n -F
low
-Ef
fect
s -I
ssue
s -S
umm
ary

26
Arn
o J.
Bra
nd
EC
N W
ind
Ene
rgy
Win
d tu
rbin
e ro
tor a
nd W
ind
farm
Aer
odyn
amic
s
M: P
.O. B
ox 1
, NL
1755
ZG
Pet
ten,
Net
herla
nds
E: b
rand
@ec
n.nl
T: +
31 2
24 5
6 47
75F:
+31
224
56
8214
I: nl
.link
edin
.com
/in/a
rnob
rand
26O
utlin
e -M
otiv
atio
n -F
low
-Ef
fect
s -I
ssue
s -S
umm
ary