turkey price stabilization and food security...
TRANSCRIPT
This internal workirg paper is prepared forSTAFF USE ONLY, The view expressed are notnecessarily those of the World Bank.
AGP66
TURKEY
PRICE STABILIZATION AND FOOD SECURITY POLICIES IN GRAINS
AGREP Division Working Paper No. 66
Prepared by:
David Bigman (consutant)Economics and Policy DivisionAgriculture and Rural Development Department
March 1983
Pub
lic D
iscl
osur
e A
utho
rized
Pub
lic D
iscl
osur
e A
utho
rized
Pub
lic D
iscl
osur
e A
utho
rized
Pub
lic D
iscl
osur
e A
utho
rized
Pub
lic D
iscl
osur
e A
utho
rized
Pub
lic D
iscl
osur
e A
utho
rized
Pub
lic D
iscl
osur
e A
utho
rized
Pub
lic D
iscl
osur
e A
utho
rized
TURKEY
PRICE STABILIZATION AND FOOD SECURITY POLICIES IN GRAINS
by David Bigman
1. Incroduction
1. Price policies for food and feed grains in general and wheat inparticular touch tbe vital interests of most Turkish house&odds. Thefollowing statistics are indicative: roughly b6 percent of the Turkishpopulation works in the agricultural sector, most of whom produce some grainfor sale or for hboe consumption; value added in grains comprises aboutone-third of the agricultural GDP; wheat alone occupies about 45 percent ofthe total sown area and accounts for 19 percent of the wholesale price index,and bread accounts for 11-12 percent of the consumer price index. This annexevaluates the performance of these policies and examines the direct andindirect effects oo consumer3, producers, the fiscal budget and the balance ofpayments. The main tool of analysis is a simulation model of the wheat sectorin Turkey. The structural and behavioral parameters of the model are based onreal data; the policy decisions in the model are policies and practicesexisting in Turkey, adjusted to the specific structure of the simulationmodel. Alternative policies are aiso examined with the model, and theirefficiency is compared with existiLig policies.
2. The primary goals of highly intensive government involvement in thewheat market are to maintain wheat prices at levels that would remunerat2producers fcr their production costs; ernsure a more desirable wheatdistribution betweea surplus and deficit areas; and prevent sharp increases inconsumer prices. The Turkish government has tried to achieve these goalsthrough the direct regulatioo of commodity prices; by providing fertilizers,capital and arher farm inputs at subsidized prices; by establishing andproviding mar eting services such as transport, storage and processing; and,finally, by close regulation of imports and exports.
3. The ultimate responsiblity for those programs is vested in theCouncil of Ministers. The Ministries of Commerce, Agriculture and Forestry,and Finance as well as the State Planning Organization, concerned parastatals,sales cooperatives and other agencies act in an advisory capacity to theCouncil on various aspects of policy, particularly the annual exercize todetermine the farm procurement prices. Various State Economic Enterprises(SEE) and Unions of Sales Co peratives carry out the procurement and themarketing of the c-nodities concerned. Thus, the Soil Products Office (TMO),an SEE which operates under the nominal control of the Ministry of Commerce,intervenes in grains on behalf of the government. The report does not attemptto examine the whole range of government interventions, however. Neithergovernment subsidies for farm inputs nor the periodic but temporaryinterventions of TXO aimed at preventing pockets of scarcity are considered.Instead, the report focuses on price determination, procurement, storage andtrade processes from a national and a long-term, rather than a short-run andregional: perspective.
4. Although the share of TMO purchases in total wheat productioncomprises only about 10 percent (although it has reached 20 percent in some
years), or about one-third of the marketed surplus, their role in the wheatmarket is pivotal. The basic procurement price, whicb the governmentannounces each June, becoces the effective support price for producers, sincethe T10 is required to procure any quantity at the announced price. 'heprocurement price, therefore, is a major factor affecting the entire marketeach year. Sales of the TM0 to local millers at a reduced price are made onan allocation basis, and they are mostly if not solely designated for breadproauction. The sale price may at times be partially subsidized. 'Thisaftects the price of bread to consumers, especially in urban areas. In1974/7), for instance, the ThM sale price was 40 percent ana in 1978/79 it was20 percent below the support purchase price. Losses suffered by TM10 arecovered by the'government and effectively can be regarded as subsidies tobreadl. Since 1960, however, government's intentions are to set the sale priceabove the procurement price thereby abolishing this direct subsidy.Nonetheless, there is still an indirect element of subsidy in TU10 salesthrough storage and transport operations, and its access to Central Bankrediscounts at highly preferential rates.
5.- Special attention in the report is given co trade activities andtrade policies of the Turkish government. Wheat exports became fairlysignificant in the mid to late 1970s, as whear production was deliberatelyencouraged following the trauma of the world-'iie wheat shortage in 1972-74.In 1978 and 1979, for instance, Turkish wheat exports were around 2 million MTor about 15 percent of total wheat production. These subsequently werecurtailed with the onset of the recent economic crisis, and the country becamea net importer, tlough marginally so, in 1981 and 1982. Export and iiaportoperations have been carried out with the primary intention of ensuringadequate stocks so that government agencies will be able to perform thefunction of regulating and stabilizing the domestic market. Although privateexports of wbeat has recently been authorized, THO will remain involved inwbeat trade and the government will secure its goals through tariffs,subsidies or quota restrictions.
b. In general, a country's economic policies relating to theagricultural sector are typically determined by broad guidelines and overallstrategies, but their actual execution on a year-to-year or even day-to-daybasis is largely determined by the specific conditions existing at that periodof time. 'The general strategies accord with long-range goals; the specificday-to-day tactics respond to any short-term change in the production andmarketing environment. 'Thus, for example, a country may adopt the strategy ofpromoting the free market or allowing comparative advantage considerations todetermine crop selection. Nevertheless, a year of poor domestic harvest orunfavorab1'. world markets may still force radical government intervention ifthe far-.;.s' subsistance or Lhe availability of food to low-income consumersis ena5,,c ' red.
7. The simulation model used in this paper explicitly recognizes thenature of the economic environment within which the Turkish governmentoperates. The model accounts for changes in government policies in responseto environmental changes. It thus provides the means for evaluating theeffects ot these policies over an extended period of time and fur examiningthe degree to whicb these short-run tactics indeed complement the long-runstrategies and tally with the general goals of ton; economy.
8. 'T'he paper contains two types of analyses. The first evaluates thespecific price policies and other interventions presently practiced inTu'rkey. 'lhis analysis is based on actual 1981 production and price figures aswell as on _he estimated growth rates for wheat production, per capita wheatconsumption and the population. 'ibe second is a more general comparativeanalysis of alternative policy regimes. To avoid reference to any specificyear and permit _ core general review, ihe latter analysis is based on indexnumbers instead of actual figures and the pe:formance of the various policiesis evaluated in rei3tion to the outcomes under free trade.
9. Aware of cne diversity of governme.it goals with respect to food andother staple foods, the report refrains from resorting to a single performancemeasure (e.g. tota' economic gains). Instead it presents the effects of thevarious policies over a wide range of performance criteria.
II. *Model, Data and Parameters
10. 'the analysis is based on a simulation model of the agriculturalsector.l/ The model accounts for short-run stochastic variations inagricultural production due to varying climatic conditions as well as withlong-run growth trends in production and consumption. ilonte Carlo simulationsyield random "weatber" events in the home country (Turkey) and abroad. Foreach ranaom event the state variables of the model are calculated according tothe specified de-ision rules and the state variables of the previous years.The process is repeated a large number of times and the statistics collectedyield the expected values and the frequency distribution of the performancemeasures.
11. As mentioned ir the introduction, the analysis is divided into twoparts: one evaluating the specific price policies and orher interventionpractices in Turkey, and the other a more general analysis of alternativepolicies and policy combinations and under different scenarios. The former,Turkey-specific aaalysis use actual 1981 data of wheat consumption andproduction in Turkey ano financial magnitudes are given in Turkish lira (IL)in terms of 1981 prices. The latter, more general analysis expres.es theresults in terms of index numbers rather than actual figures in order to avoidreference to any specific year. Accordingly, the iniLial levels of bothoutput and price bave been normalized to be 100. Financial magnitudes
1/ See Bigman and Reutlinger (1979a, 1979b); Bigman (198U, 1981, !'82a,198Zb, 1982c) for further references and a more detailed aescription ofche model.
(economic gains, taxes, rev-enues) are then axpressed as percentages of totaldomestic expenditures on wheat in a normal year and quantities (output,imports, exports) are expressed as percentages ot the mean output. The (real)rate of interest in all the financial calculations is assumed to be 5oer_ent. The values of the behavioral parameters in the model are generally',ased on estimates obtained in previous studies or the Turkish wheat sector(Im:ohoroglu and Kasnakoglu (1979) and (198U); Gurkan (1979); Somel (1979)),estima,es prepared for this report 1/ and on TMO estimates.
12. The simulation experiments themselves were ccnducted over a timehorizon of 3U years, each experiment consisting of 300 iterations of a 3U-yearsequence of ranco. production events. The total sample therefore consists of9,OUu oDservatioois arawn at r, :viom from a normal probability distribution.
13. Following is a brief description of :-ne structure of the model and thes?ecific parameters assumed in the analysis.
Consumption
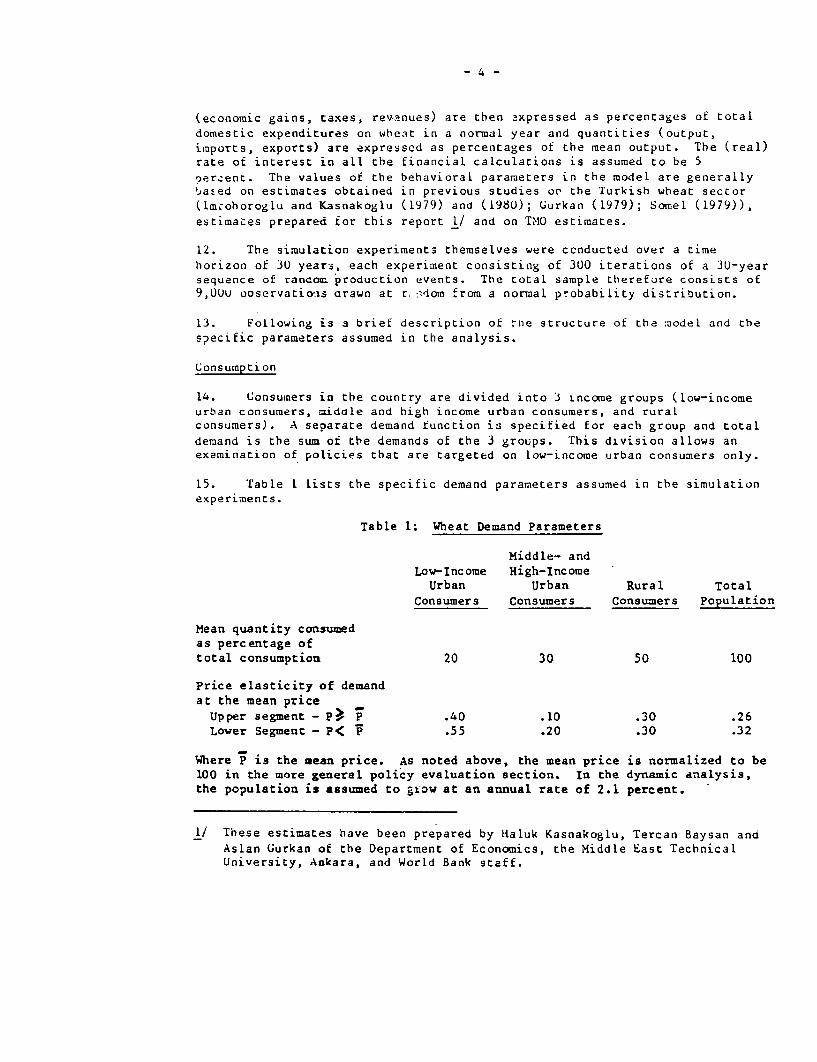
14. Consumers in the country are divided into 3 income groups (low-incomeurban consumers, 3idcle and high income urban consumers, and ruralconsumers). A separate demand function is specified for each group and totaldemand is the sum of the demands of the 3 groups. This division allows anexamirnation of policies that are targeted on low-income urban consumers only.
15. Table I lists the specific demand parameters assumed in the simulationexperiments.
Table 1: Wheat Demand Parameters
Middle- andLow-Income High-Income
Urban Urban Rural TotalConsumers Consumers Consumers Population
Mean quantity consuimdas percentage oftotal consumption 20 30 50 100
Price elasticity of demandat the mean price
Upper segment - p p .40 .10 .30 .26Lower Segment - P< P .55 .20 .30 .32
Where P is the mean price. As noted above, the mean price is normalized to be100 in the more -eneral policy evaluation section. In the dynamic analysis,the population is assumed to gDow at an annual rate of 2.1 percent.
1/ These estimates have been prepared by Haluk Kasnakoglu, Tercan Baysan and
Aslan Gurkan of the Department of Economics, the Middle East TechnicalUniversity, Ankara, and World Bank staff.
-5-
Production
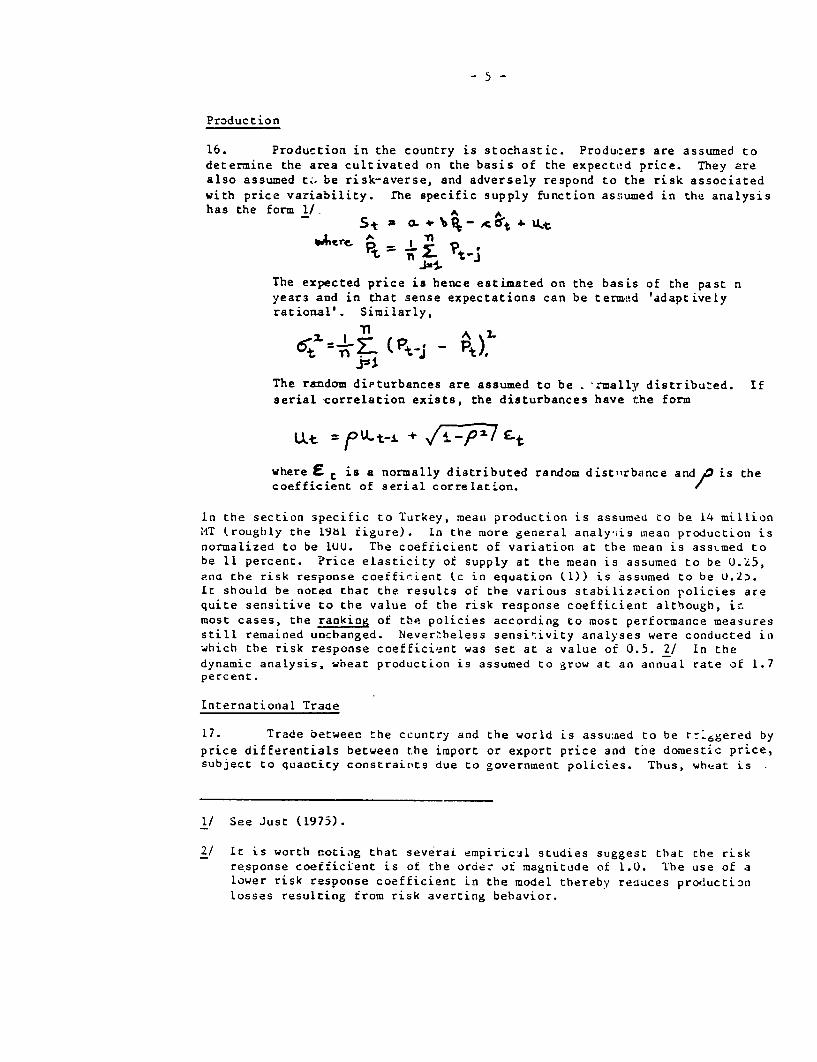
16. Production in the country is stochastic. Producers are assumed todetermine the area cultivated on the basis of the expecti!d price. They arealso assumed to, be risk-averse, and adversely respond to the risk associatedwith price variability. rhe specific supply function ass;umed in the analysishas the form 1/. A
-St = n. £ Pt _; Ufn-
The expected price is hence estimated on the basis of the past nyears and in that sense expectations can be termed 'adaptivelyrational'. Similarly,
it J=1 (tj Pt)
The random dipturbances are assumed to be - rmallyr distribu:ed. Ifserial correlation exists, the disturbances have r.:he form
wet = s u-t-e + £t
where E t is a normally distributed random distuirbance and is thecoefficient of serial correlation.
In the section specific to Turkey, mean production is assumed to be 14 millionMT (roughly the l9bl figure). In the more general analysis mean production isnormalized to be IUU. The coefficient of variation at the mean is assLmed tobe 11 percent. Price elasticity of supply at the mean is assumed to be U.25,ena the risk response coefficient (c in equation (1)) is assumed to be U.2.Ic should be notea thac the results of the various stabilization policies arequite sensitive to the value of the risk response coefficient although, in.most cases, the ranking of the policies according to most performance measuresstill remained unchanged. Nevertheless sensi'.ivity analyses were conducted inwhich the risk response coefficient was set at a value of 0.5. 2/ In thedynamic analysis, wheat production is assumed to grow at an annual rate of 1.7percent.
International Trade
17. Trade betweec the ccuntry and the world is assumed to be r-:.6gered byprice differentials between the import or export price and tne domestic price,subject to quantity constrairits due to government policies. Thus, wheat is
1/ See Just (1975).
2/ It is worth notiag that severai empirical studies suggest that the riskresponse coefficient is of the order of magnitude of 1.0. Ihe use of alower risk response coefficient in the model thereby reduces productionlosses resulting from risk averting behavior.

exported whenever the export price exceeds the domestic price and importedwhenever the import price falls below the domestic price. The import andexport prices are determined by the world prices, transportation costs and thegove:rnment tariffs or subsidies. The world price is a random variable,
determined from world production and world demand a.cording to a simple modelthat transforms the frequency distribution of world production into afrequency distribution of the price. World production is assumed to benormally distributed with a coefficient of variation of 5 percent. Worlddemand for wheat is assumed to be kinked linear, tbereby generating a skeweddistribution of world prices. The price elasticities of world demand,
calculated at the mean level of world prices.
upper segment - ; P F: r~ 0. 5
lower segoent - 4 P: - = 1.5
In the 'Turkey-spe'cific analysis the mean world price is assunmed to be$155 per FIT or approximately TL 17 per kg according to the official 1981exchange rate. Tran3portation costs are assumed to be $lb per MT on wheatimports and $8.25 per MT on wheat exports, reflecting the fact that wheat isgenerally imported by Turkey from the US while wheat exports go mostly to theMiadle East or East EuroDe.
18. In the more genernl analysis the mean world ori--e is -rmaliz.d to be1OU and trani-ortacion costs are assumed to 5 percent c.i the r'.O.H. price.
llI. 'The Structure of Intervention in Wheat
19. The goverament of Turkey, mostly through TMO, has intervened innearly every aspect of Turkey's domestic and external wheat markets. The TMOprocurement price effectively sets the price of wheat to producers while TMOsales price, along vitb price ceiling restrictions, sets the price of bread toconsumers. The following table provides some q.antitacive measure for TMOactivities in the wbeat market over the past four years.
Table 1: TMO Purchases and Sales of Wheat(in million MIT)
1978 1979 1980 1981
Quantity purchased in domestic market 3.20 l.b4 1.b5 1.05Quantity imported - - - U.34
Quantity sold in domestic market 2.74 2.34 1.74 1.15Quantity exported 2.U9 0.79 0.38 0.30Quantity in storage 7 1.65 I.lb 1.U7
Source: TM()
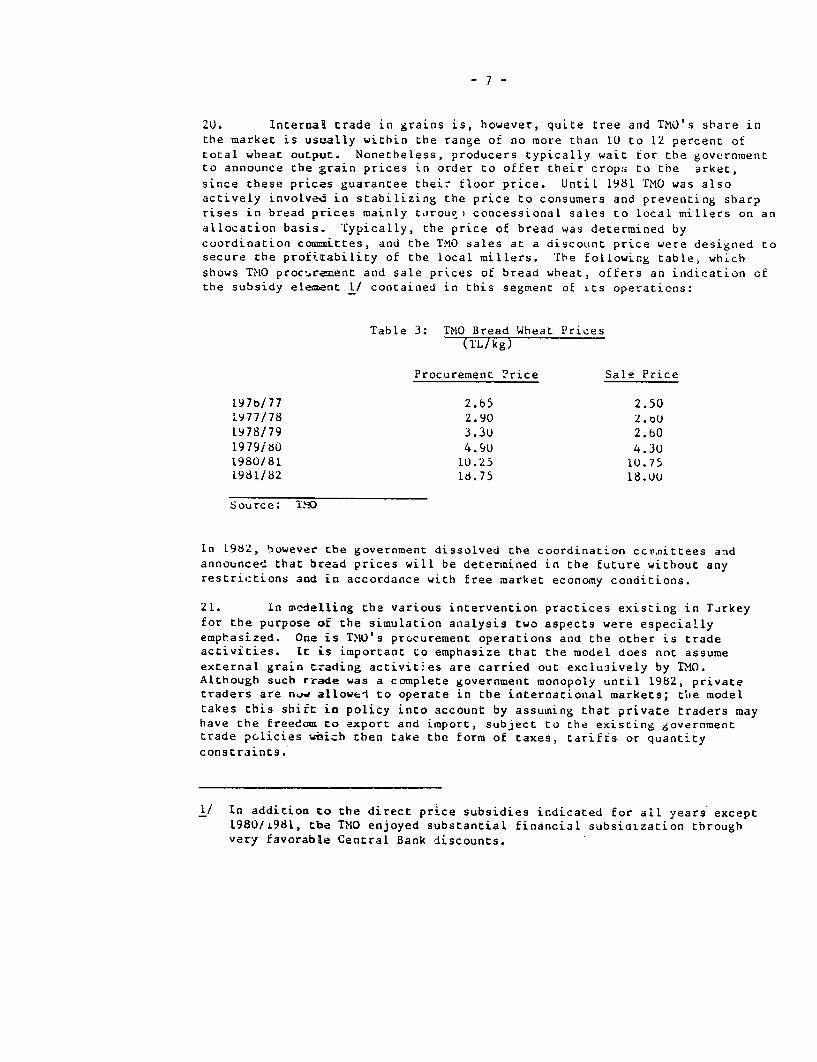
2U. Internal trade in grains is, however, quite tree and TMO's sbare inthe market is usually within the range of no more than 1U to 12 percent oftotal wheat output. Nonetheless, producers typically wait for the governmentto announce the -rain prices in order to offer their crops to the arket,since these prices guarantee thei. floor price. Until 1981 TMO was alsoactively involved in stabilizing the price to consumers and preventing sharprises in bread prices mainly torougp concessional sales to local millers on anallocation basis. Typically, the price of bread was determined bycuordination committes, and the TMO sales at a discount price were designed tosecure the profitability of the local millers. Tbe following table, whichshows TMO proc-..reent and sale prices of bread wheat, offers an indication ofthe subsidy element 1/ contained in this segment of its operaticns:
Table 3: TMO Bread WheaL Prices(TL/kg)
Procurement ?rice Sale Price
197b/77 2.05 2.501977/78 2.90 2.oU1978/79 3.3u 2.bO1979i/U 4.90 4.3U1980/81 10.25 10.751981/82 18.75 18.UU
Source: IMO
In 1982, however tbe government dissolved the coordination ccvmittees andannounced that bread prices will be determined in the future without anyrestrictions and in accordance with free market economy conditions.
21. In modelling the various intervention practices existing in Turkeyfor the purpose of the simulation analysis two aspects were especiallyemphasized. One is TMO's procurement operations and the other is tradeactivities. It is important co empbasize that the model does nnt assumeexternal grain trading activities are carried out exclu3ively by TMO.Although such rrade was a complete government monopoly until 1982, privatetraders are nug allowed to operate in the international markets; the modeltakes this shift in policy into account by assuming that private traders mayhave the freedom to export and import, subject to the existing governmenttrade pclicies wbi_h then take the form of taxes, tariffs or quantityconstraints.
1/ In addition to the direct price subsidies in.dicated for all years except1980/I981, tbe TMO enjoyed substantial financial subsidization throughvery favorable Central Bank discounts.
The Modelling of Government Intervention
22. The various elements of the government's r-rice stabilization and foodsecurity policies in Turkey tbus consist of a package of decisions in fourmain areas, namely producers prices, storage decisions, consumer prices andthe nature of interventions in foreign grain trade. In the paragraphs whichfollow, a particular package of decisions is termed a "policy", which includeswitbin it a set of responses (decisions) that apply to all the above areas.These respcnses are not fixed once and for all, but within each response isprovided at least one option if a crit.:ricn variable (e.g. a price) exceeds orfalls below a certain level. However, the policies, or groups of responsesarc differentiated either by the choice of criterion variables in one of thefour main £reas (e.g. choice of a tariff vis-a-vis physical quantityrestrictions on importation) or by a more fundamental change in the structureof intervention in one of these areas (simple consumer price stabilizationvis-a-vis subsidization for target groups). A description of the variouselements and assumptions made.for each "policy" simulation is set forth in theremainder of this section.
A. Producers' Floor Prices
23. The government determi.nes each year (typically in June) the wheatprocurement price which thus becomes the floor price for the farmers. Themain considerations taken into account in determining th:s price areprfiduction costs and world prices. The procuremenL price is thus likely tochange from year to year. In modelling this policy the following specificassumptions bave been made:
U) The government supports the produce'rs' price if the free marketprice falls below a predetermined trigger price denoted by Pm.If the free market price rises above PXM the government does notintervene 'lo further raise the producers' price.
(ii) If the free market price falls below Pm. the government inter-venes to raise the producers' price by procu:ing and removing theexcess grain from the market.
When modelling tbe government's response, it is importanL to note that theactual procurement price in a specific season has also been affected by theactual production at that season, largely due to TMO's budgetary constraints.Thus, for instance, _n a year of'bumper harvest the TMO has often lowered theannounced procuremznt price, thereby reducing the amount peocured fromquantities implicit in the announced price. Nevertheless, within itsbudget'ary capabilities (which are substantial), the I'NO has always intervenedto prevent too sbarp a fall in wheat price to farmers. Therefore, thisbehavior is modelled as follows: 'in the -urkey-specific analysis, the triggerprice for the governmeat intervention scr,eme is TL 18.75 per kg in constant1981 prices. if che market price falls below that level, the government,
-9-
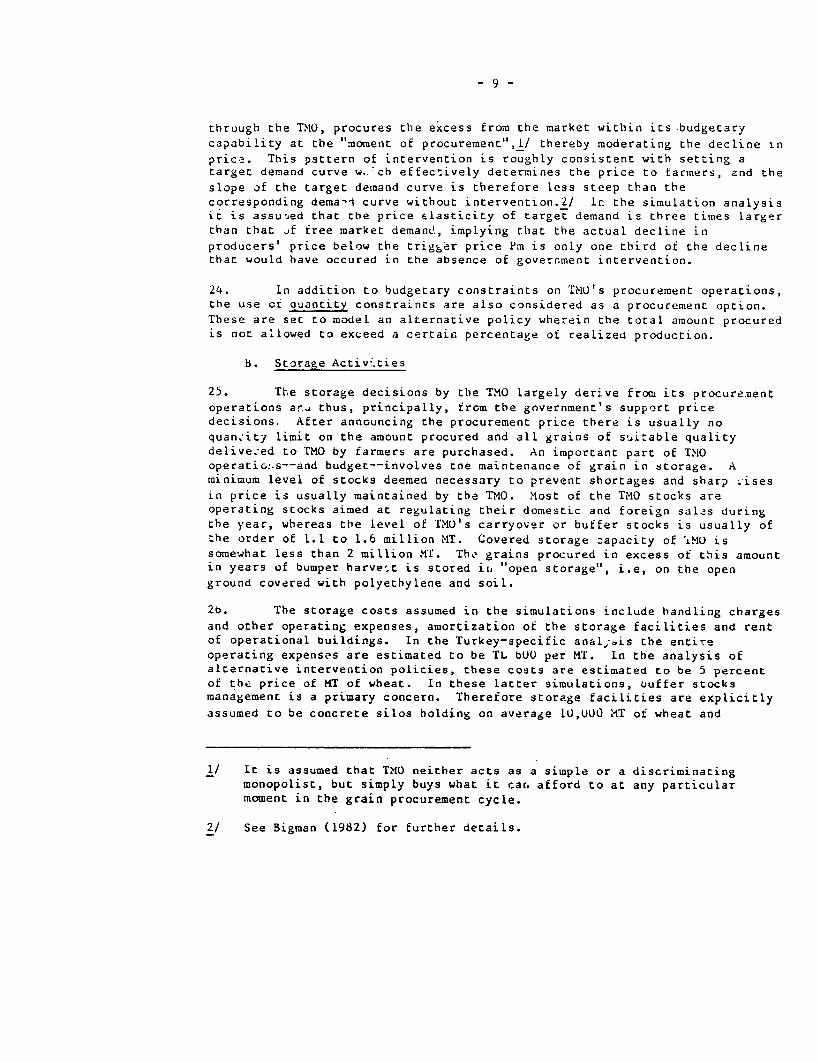
through the TMO, procures the excess from the market within its budgetarycapability at the "moment of procurement",l/ thereby moderating the decline inprice. This pattern of intervention is roughly consistent with setting atarget demand curve w. ch effectively determines the price to farmers, and theslope of the target demand curve is therefore less steep than thecorresponding demand curve without intervention.2/ In the simulation analysisit is assu,,ed that the price elasticity of target demand is three times largerthan that uf free market demand., implying that the actual decline inproducers' price below the trig6er price Pm is only one third of the declinethat would have occured in the absence of government intervention.
24. In addition to budgetary constraints on ThU1's procurement operations,the use cr quantity constraints are also considered as a procurement option.These are set to model an alternative policy wherein the total amount procuredis not allowed to exceed a certaio percentage of realized production.
B. Storage Activ".ties
25. The storage decisions by the TMO largely derive from its procurementoperations ar4 thus, principally, from the government's support pricedecisions. After announcing the procurement price there is usually noquantity limit on the amount procured and all grains of suitable qualitydelive:ed to TMO by farmers are purchased. An important part of TMOoperatio:.s--and budget--involves toe maintenance of grain in storage. Aminimum level of stocks deemed necessary to prevent shortages and sharp .isesin price is usually maintained by the TMO. Most of the TMO stocks areoperating stocks aimed at regulating their domestic and foreign salas duringthe year, whereas the level of TMU's carryover or buffer stocks is usually ofthe order of 1.1 to 1.6 million MT. Covered storage zapacity of iMU issomewhat less than 2 million Kr. Thb grains procured in excess of this amountin years of bumper harvest is stored in, "open storage", i.e, on the openground covered with polyethylene and soil.
2b. The storage costs assumed in the simulations include handling chargesand other operating expenses, amortization of the storage facilities and rentof operational buildings. In the Turkey-specific anal;4is the entireoperating expenses are estimated to be TL bUU per MT. In the analysis ofalternative intervention policies, these costs are estimated to be 5 percentof the price of MT of wheat. In these latter simulations, uuffer stocksmanagement is a primary concern. Therefore storage facilities are explicitlyassumed to be concrete silos holding on average lU,UUO XT of wheat and
1/ It is assumed that TMO neither acts as a simple or a discriminatingmonopolist, but simply buys what it car. afford to at any particularmoment in the grain procurement cycle.
2/ See Bigman (1982) for further details.
- lu -
anmortized over a tbir: --,yar period. The annual capital allowances for thesefacilities include depreciation of buildings and machinery, and interest andloadj amortization, which are estimated to be about 1U percent of the domesticprice of 'MT of voeat or approximnately $17 per ton capacity at 1981 prices.
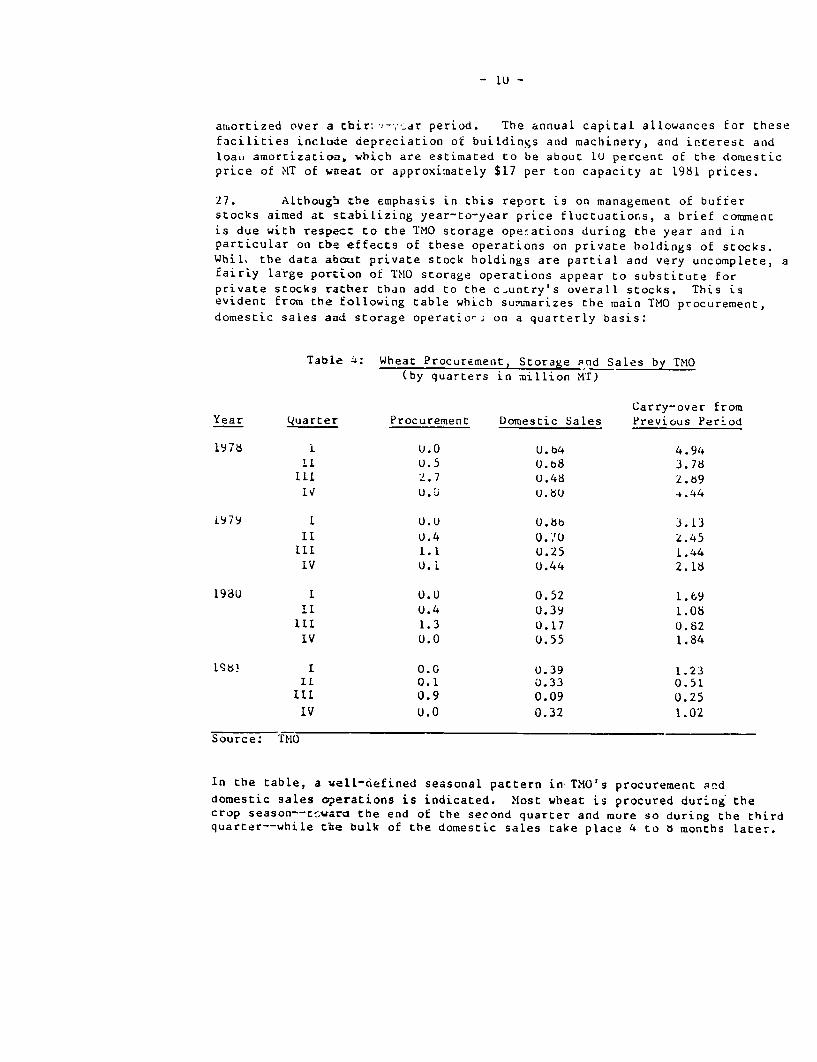
27. Although the emphasis in this report is on management of bufterstocks aimed at stabilizing year-to-year price fluctuatior.s, a brief cotamencis due with respect to the TMO storage openations during the year and inparticular on tbe effects of these operations on private holdings of stocks.Whil, the data about private stock holdings are partial and very uncomplete, afairly large portion of TMO storage operations appear to substitute forprivate stocks ratber than add to the c_untry's overaLl stocks. This isevident from the following table which surbnarizes the main TMO procurement,domestic sales and storage operatio-. on a quarterly basis:
Table _: Wheat Procurement, Storage -nd Sales by TMO(by quarters in million M'T)
Carry-over fromYear quarter Procurement Domestic Sales Previous Period
1976 i 0.0 U.b4 4.94II U.5 U.b8 3.78
111 '.7 U.48 2.b9if ~~~U.uj U.bU 4.44
i979 L U.U U.8b 3.1311 U.4 O'U 2.45
I11 1.1 U.25 1.44IV 0.1 U.44 2.18
198U 1 0.0 0.52 1.69iI U.4 0.39 1.08III 1.3 0.17 0.82IV 0.0 U.55 1.84
19i8 I 0.0 0.39 1.23IL 0.1 0.33 0.51
III 0.9 0.09 0.25IV 0.0 0.32 1.02
Source: TMO
In the table, a well-defined seasonal pattern in TMO's procurement anddomestic sales operations is indicated. Most wheat is procured during thecrop season--tfwara the end of the second quarter and more so during the thirdquarter--while the bulk of the domestic sales take place 4 to 6 months later.
- 1I -
During the crop season itselt, TMO's domestic sales are particularly low,indicating cat much of the domestic supply during these months comes from
private tracers. la later montbs, however, the share of T110 in total supplyincreases sb_rgly, and can be as high as 4U percent (and even r.more in certain
areas) compared wich and annual average of lU to 12 percent.
28. Tbis pattern of TM1O vs. private sales and stock holding has importantimplications -with respect to the subsidy element contained in TMO'soperations. It suggests that a simple comparison between TMO procurement andsale price is in fact inappropriate for ea .ining tbe subsidy element.Instead, wbac should be compared is the T110 procureinent price with its saleprice plus mazcthly storave and financial costs, since the procuremenL and thesales take place at different periods of time. Further development of themodel should zarefully incorporate these costs which could measurably increasethe annual czs.s of this kind cf intervention in the grain trade.
C. Consmmers' Subsidies
29. As uenri-nnd above the government has announced its intention toretrain from airectly subsidizing wheat prices to consumers. There were anumber of exzeptions in the past, e.g. in 1974 when a massive interventionprevented a audden and sharp increase in consumers' prices. The element ofsubsidy coocstined in the various TM0 distribution and stocks operations hasalso been no-ed. In the Turkey-specific analysis no direct subsidy toconsumers c-' any form is assumed, in keeping with T1iO's intention to no longer
supply subsidized urban grain rations. In the more general analysis, threeri~ations mf possible government subsidy schemes will be considered:
(i) A general subsidy to the entire population: speciticai y itass=med that the subsidy element con~ained in the TMO o.'eratio.swork to lower the market price to all consumers by an a'erage of5 percent.
(ii) A ceiling price to consumers: if the domestic price rises above2 certain critical level eitber due to a considerable cropfaill1re or due to a sharp rise in the world price, the-owernment would maintain the ceiling price either by morestrizigent export restrictions, a more precipitate release fromstorage, or through imports even at a sub :dazed price.
(iii; Tar,-t subsi-y to low-income consumers only. The details onthis variation are given in paras 33 and 34 below.
D. Trace
30. In the Turkey-specific analysis, it is assumed that export activitiescan be carried out eitber by the TMO or bv private traders. Export taxes(e.g. levies) are the main instrument for regulating the export activities ofprivate trace_s, altbougb quantity restrictions can also be imposed. Importsis largely a -overnment monoply even though the considerations about whether
to import az3d bow much are quite similar to those of private, profit orientedtraders.
- 12 -
3L. The central principle underlying the export activities is that the
quantity exported is regulated through variable export taxes (or subsidies) so
as to maintain tbe guaranteed procurement pri-ce to wheat producers. Thus, ifthe export price FOB exceeds the procurement price, an export tax is imposedLo ptent the market price from rising above that level. Wheat imports are
assumed to be subject to a general Lar-.ff of 25 percent de.signed to preventcheap imports frou depressing toe domestic price. In the version ot the
policy that assumd a ceiling price to consumers, the import tariff may bereduced or removed altogether. In the Appendix some specific trading rulesand their interaccion with other governmen.t polic es are described.
E. Description of "Policies"
32. Turkey-tyve policies. In the ar.alysis which follows, the combination
of decisions for producer's prices; storage, relecse and procurementdecisions; cons cer price and trade po..icies d.:.;zribed in sections III A-D
above are termed YIR-type policies. The basic Turkey-type policy, whichtogether with free trade serves as a basis for comparison, is termed TUR and
consists of TMO purchases when tne market determined producer's price fallsbelow a predetermioed level; stockpiling in years of good production, fcau
domestic purchases which are disposed of first to fill vacant TMO storageirrespeccive of price, then released for exports or dcmestic sales; government
refrains from directly subsidizing consumption but does dispose of excessstocks to stabilize consumer prices; and regulation of exports ana imports soas to maintain g-araoteed producer's prices. Simple variants of the TURpolicy are denote± -w-ith the prescript "TUK". Thus, a version of the modelthat assurnes a ceiling price to consumers but othe:wise maintains the TURassumptions is deaoted as TIR 1.
33. Other basic stabilization policies. As an alternacive to theTUR-type policy packages, several additional combinations have beenconsidered, whicb are typical of stabilization practices found in other
countries. These policy combinations have the following essential elements:
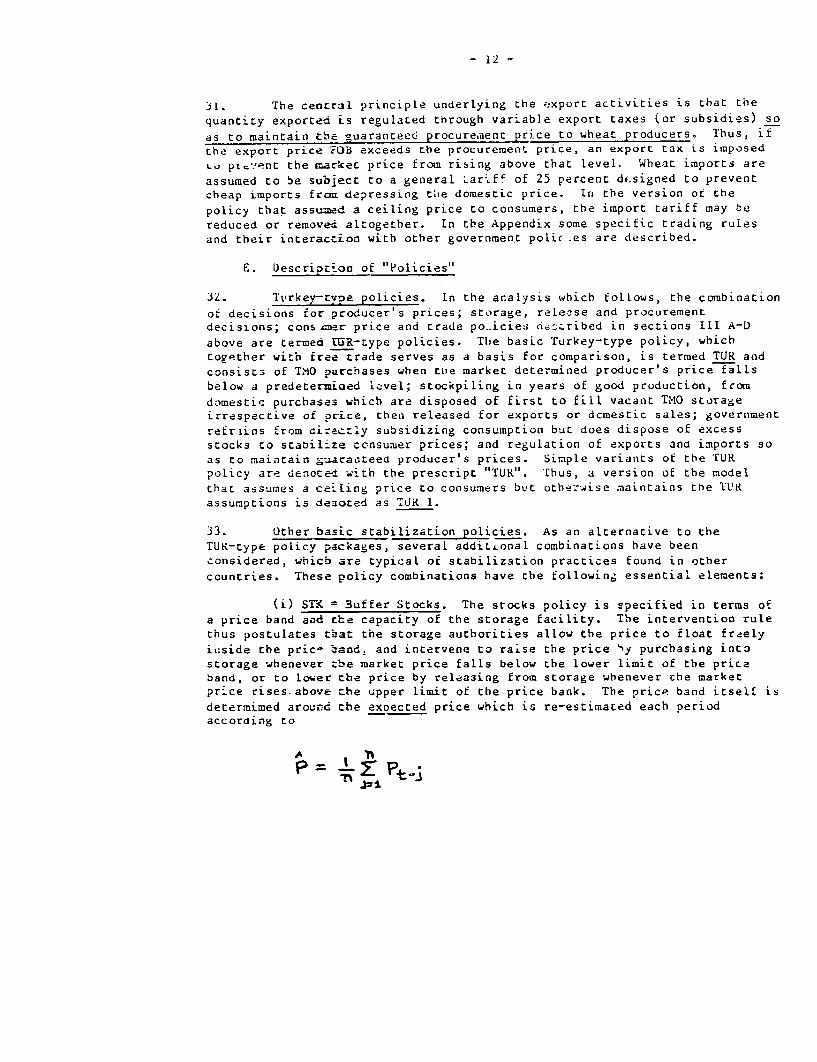
(i) STK = 3uffer Stocks. The stocks policy is specified in terms ofa price band aad tbe capacity of the storage facility. The intervention rulethus postulates that the storage authorities allow the price to float freely
iu:side the pric- band. and intervene to raise the price Sy purchasing intostorage whenever zbe market price falls below the lower limit of the priceband, or to lower cbe price by releasing from storage whenever che marketprice rises above the upper limit of the price bank. The price band itself is
determimed around tbe exDected price which is re-estimaced each periodaccording to
A I nE tP I
- 13 -
The price band may thus shift gradually over time. In particular, the priceband shifts as an effect of policy changes and the resulting supply response
that affects the expected price (e.g. an increase in supply due to supportprice programs or -educing the price-risk thereby enhancing supply due tostabilization programs). In the analysis below the price band is assumed tobe 10 percent around the estimated price. Handling charges and annual capitalexpenses are similar to those assumed in TUR.
(ii) SUB = Target Subsidy Program. This program applies only to asubgroup of the population--the low-income urban consumers. The program worksby subsidizing the price to the beneficiary consumers when the market priceexceeds a certain critical level. Above that level these consumers will beable to buy bread at a subsidized price which is lower than the market price.Budgetary constraints are assumed, however, to force the government to raisethe price uf breaa as the market price rises, though at a lower rate, in ordertn reduce the subsidy paymnents. Specifically the model assumes the followinigdecision rurle for the subsidy program: let P denote the market price, thenPs--the subsidized price--is determined according to
ps =$ eP ~* ( -e) v ;v
where P is the critical price above which the subsidy program becomeseffective. e is the subsidy rate, e = 0 c 1. This linear rule amounts tosetting a target demand curve for the benefic ary consumers which is lesselastic than their ordinary demand curve, thereby preventing their breadconsumption from dropping too sharply as the market price rises. The actualimplementation of the program can take the form of food stamps on rationshops, through ordinary retail outlets located in low-income urban areas, oreven through subsidizing low-quality or otherwise 'inferior' staple foods thatare largely consumed by the low-income consumers.
34. In the simulation analysis the critical price for the program tobecome effective is assum.ed to be the median price and the price elasticity ofthe target demand curve is assumed to be U.1. Since the ordinary priceelasticity of the low-income consumers at the upper-segment is 0.4 the programimplies that a price rise of 10 percent (above the critical price) would leadto a reduction in the poor's bread consumption by 1 percent wich the subsidyprog-1 hut by 2.s percent without the program.
35. Trade Policies. Trade policies can be used to stabilize the domesticmarket price or tbey can be used to promote exports. In the former caseexports would be taxed in order to curb the quantities exportaci and thusprevent the market price from rising to the high world price; in the lattercase exports would be subsidized. Specifically, three types of trade policiesare considered:
(i) FRE = Free Trade. No price or quantity restrictions are imposed ontrade; no internal or external interventions are undertaken (freemarket policy);
- 14 -
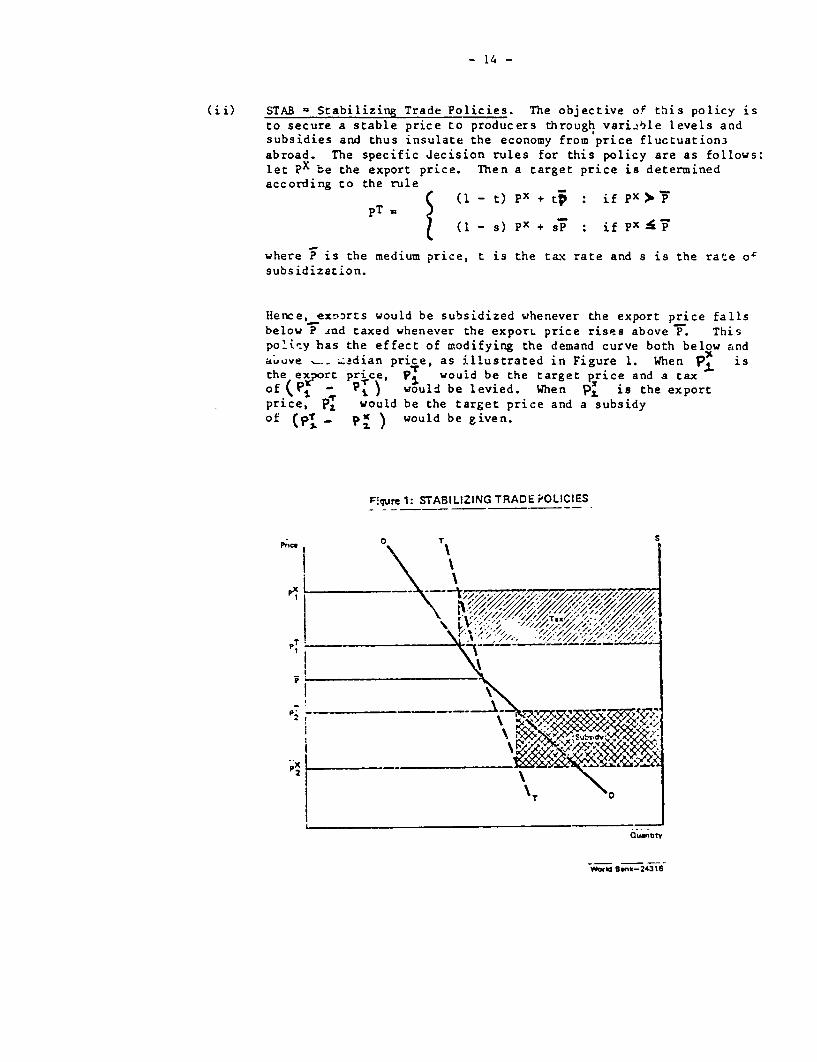
STAB = Stabilizing Trade Policies. The objective of this policy isto secure a stable price to producers through variuble levels andsubsidies and thus insulate the economy from price fluctuation3abroad. The specific decision rules for this policy are as follows:let pX be the export price. Then a target price is determinedaccording to the rule
( (1 - t) px + tj if px >ippT .
l( - s) px + sP if px A p
where P is the medium price, t is the tax rate and s is the rat:e ofsubsidization.
Hence, exnrts would be subsidized whenever the export price fallsbelow ? And taxed whenever the exporL price rises above P. Thispol(.zy has the effect of modifying the demand curve both below andauuve - ..adian price, as illustrated in Figure 1. When isthe export price, pX would be the target price and a taxof ( I P1k) would be levied. When p is the exportprice, p w vould be the target price and a subsidyof (pT - px ) would be given.
Fgqure I: STABILIZING TRADE POLICIES
PT ~ ~ 0
2,
I D

- 15 -
36. In the simulation analysis the trigger price P is assumed to be the
median price and the target demand curves are determined by 'te correspondingelasticities at the median price. The specific parameters used in thesimulation analysis are listed in Table 5.
TABLE 5: Price Elasticities of Demand with Stabilizing Trade Policies
Policv Upper Segment Lower SegmentP a 100 P < 100
Total Demand 0.26 0.32Target Demand 0.10 0.15
iii) STAB1 * Stabilizing Export Levies. Variable export taxes are leviedwhenever the export price rises above a prespecified level in orderto prevent sharp rises in the domestic price and hence sharp falls inthe quantity available for domestic consumption. The operationalrule for this policy is illustrated in Figure 2. If the exportprice F.O.B. rises above the median price, a tax would be imposed onexports according to the rule
rp >
Where T is tne tax per unit of exports and t is the tax rate;pX 's the export price and P is the median price. This policy thuschanges tCe effective price on exports according to the rule
(.L (- t)P ? P : ts py->j
where pT is the target price set for exporters. This rule has theeffect of modif ing the country's demand curve as illustrated inFigure 2.. If P' is the export price then pT v-uld be the targetprice and a tax of (pX P w) vould be levied.
Figure 2: VARIABLE EXPORT LEVIES
I 1' .5S
jsl
i ~~~~~~~ X

- lb -
37. This policy is essentially a variant of STAB in that it becomeseffective only at the upper segment of the demand curve. At the upper segment
the parameters of this policy assumed in the simulation analysis are identicalto those of STAB wbile at the lower segment they are identical to those of theordinary demand curve.
38. Trade Scenarios. Lascly, in the general analysis, three tradescenarios are considered for the country:
(i) The country is 'generally exporting': in a normal year, i.e.,when botb domestic production and the world price are at theirlong-run = stable level, the country is exporting 12 percent ofits wheat output.
(ii) The country is 'self-sufficient': in a normal year there is noprice differential between the country and the world and thus noincentive for trade.
(iii) The country is 'generally importing': in a normal year thecountry is imuporting 12 percent cf its wheat output.
It should be noted however that random disturbances in either the world priceor domestic production may generate trade Elows even though the country is, onaverage, 'self-sufficient'. When The country is 'generally exporting' or'generally importing' such random disturbances may cause the level of exportsor imports to aeviate substantially froin their normal levels.
IV. Policy Evaliation for Turkey
A. The Stationary Case
39. This section provides an evaluation of the price policies andthe other interventioLl practices of the Turkish government in the wheatmarket. The assu'med sit"iation is essentially stationary to highlight thestabilization effects of these policies, taking into account the response ofvarious welfare indicators to annual variations in yield, mostly due tovarying weather conditions or due to fluctuations in the world price ofwheat. The detailed structure of the price policy in Turkey as modelled forthis analysis, tbe specific decision rules as well as the data and parametersused in the analysis were discussed in the previous section. In the presentsection, the 1981 data for Turkey are applied and the estimated growth ratesderived from the sectoral modelling analysis (refer to TASM paper). Allfinancial figures are expressed in 1981 terms.
40. The analysis examines two variations of the 'Tirkish-type' price
policies. One, denoted by TUR, assumes a tariff of 15 percent on all importedwheat as means of constraining competing imports and insulating domesticproducers from cheap imports. The other, denoted by TUR (F-IMP) assumes nosuch tariff. In all other respects, particularly those concerning thegovernmcnt procurement and support price arrangements, the two policies are

- 1.7 -
identical. For comparison, two alternative policies are also considered: oneis free trade and is denoted by FRE; and the ocher is free trade plusgovernment procurement program and is denoted by FRE + SUP. The detailedstricture of the latter policy and its specific decision rules are describedin .be previous section and in the Appendix.
41. The main conclusion emnerging under the assumptions made for thesimulation analysis is th3t on average (though not necessarily in any specificyear), the present price policLes and intervention practices in Turkey wouldappear to fall very short of achieving the objectives for which they wereestablisbed. They would proviie neitler greater, nor even equal security andstabil-ty to consumers and proaucers, as would a policy of no intervention andfree trade; and tbere are alternative policies that are likely to perfornbetter and in a less costly way. Under these assumptions, which areconsidered to be realistic, the present price policies are likely to hEsesubstantial negative impact in a number of areas not directly related to, butnonetheless affected by the government decisions. These effecrs appear to bedisregarded by the Government in the decision making process altbough theymust be reckoned witb in a complete policy evaluation.
Table 6: Main Stability Indicators
Policies_F_ TUR TUR (F-I1P) FRE + SUP
--------- Coefficient of Variation----------
Consumers' Price 8.5 15.7 12.8 2.7Producers' Price 8.5 15.6 12.7 2.7Domestic Consumption 1.5 2.9 2.2 1.4Farmers' Income 9.2 9.1 Y.7 9.8
Insecurity Measures* -Probability of Falling Below Critical Level-
Total Consumption (5%) 0.2 10.3 3.1 0.0Low-Income Consumption (5X) 2.3 12.5 3.9 0.2
10%) 0.0 1.0 0.1 0.0Farmers' Income (15%) 10.0 l0.b 6.8 6.9
* Probability that variable falls by aore than the specified percent below itsexpectea level.
42. Table b demonstrates the stability effects of the four policies underconsideration. It sbows that despite the floor price guarantee provided bythe TUR policies, price variability both for producers and ..onsumers is higherJy 85 percent under the TUR policy and by ;0 percent unde;- TUR (F-IMP) thanunder free trade. This is largely the result of insulating the economy andensuring the government procurement operations by prohibiting free exports arby preventing the export price (FOB), via a shield of export taxes, fromaffecting the dom-sic. price.

- 18 -
43. The variability of farmers' income as measured by the coefficient ofvariation, appears to be smaller under the TUR policies. This result is,
however, somewhat misleading: of relevance in this connection is not thespread of the stocbastic variable along both tails of its frequencydistribution but only along one: e.g. the probability that the value of thevariable under cocsideration falls below a certain critical level. Thesemeasures are termed in Table 6 "Insecurity Measures." The table shows thatnlthough the .:equency distribution of farmers' income is more condensed underthe. TUR policy, it is concentrated more in the lower tail of the frequency'.stribution. As a result, the probability that fanrers' income would fall bymore than 15 percent below their normal income is higher under TUR than underany of the other policie!j. Part of the problem is due to the constraintsimposed on imports under this policy. 'Jhen the inport tariff is removed--asfor example under TUR (F-IMP)-the probability of an extreme fall in farmers'income is markedly reduced. It should be noted however that under TUR,farmers' income is, on average, 2.5 percent higher than under TUR (F-IMP), asshown below in T.;:le 7. A fall by 15 percent below the long-run average levelof farmers' income under TUR should therefore be compared with a fall by about13 percent under TUR (F-IMP).
L 4. Figure 3, which demonstrates these probabilities for differentcritical levels and under the four palicies examined, allows us to make thiscomparison. It shows that after accounting for the chaige in the averagelevel of farmers' income they are subject to roughly same level of insecurityunder TUR as under TUR (F-IMP) (in the sense that the probability of havingtheir income falling below a certain minimum subsistance level is roughly thesame) and both provide a somewhat greater security than free trade. This samecomparison shows that the policy (FRE + SUP) perforns by far better than allthe other policies in securing a minimum income to farmers. On averagefarmers' income unaer this policy is 10 to 13 percent bigher than under theother policies. A fall by 15 percent under (FRE + SUP) should thus becompared with a fall by about 5 percent under the other policies when apredetermined minimum income is the reference point (Figure 3).

Figure 3: PROBABILITY THAT FARMERS' INCOAIE FALLS BYMORE THAN THE SPECIFIED PERCENT BELOW ITSEXPECTED LEVEL, UNDER DIFFERENT PRICEREGIMES
Probabiity (%)
30 FTUR
FRE
20 - FRE +SUP **
I ~~~\ *.,
TUR (- IMP) I
10
-tO% --15% -20%
Percentage F311 in Farmers' Income below its Expected Level
Worid Bank -24318
- 2u -
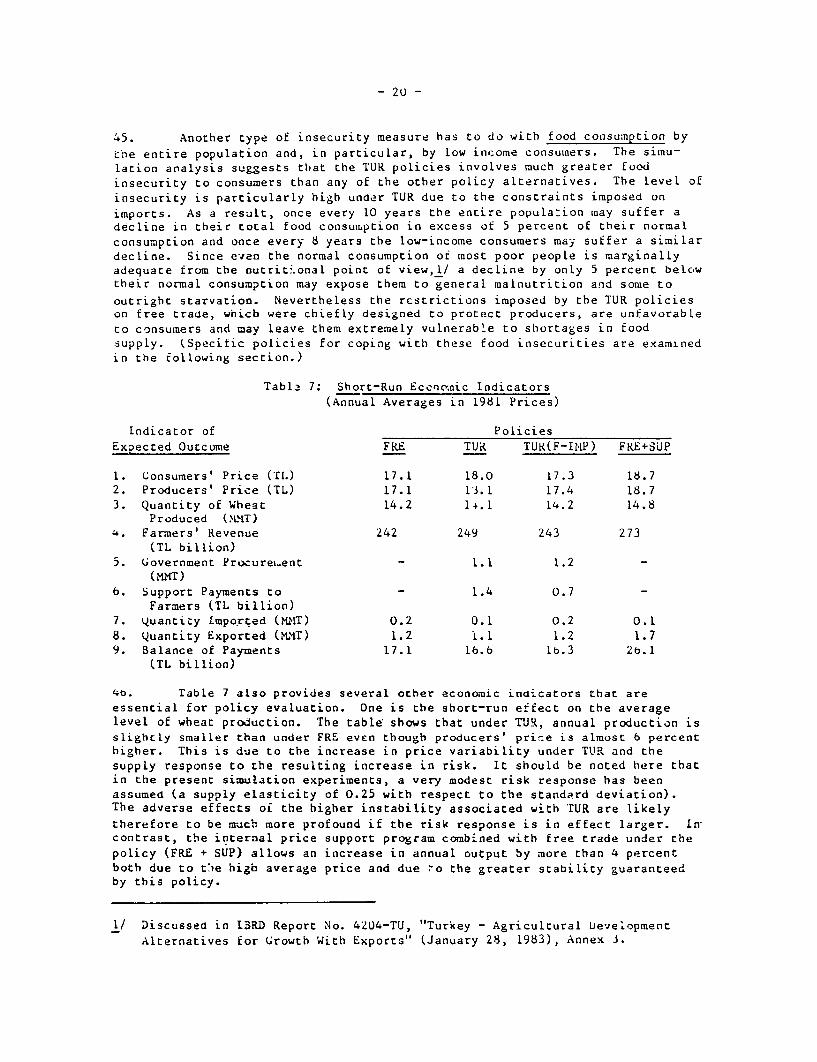
45. Another type of insecurity measure has to do with food consumption by
tne entire population and, in particular, by low income consumers. The simu-lation analysis suggests that the TUR policies involves much greater foodinsecurity to consumers than any of the other policy alternatives. The level ofinsecurity is particularly high under TUR due to the constraints imposed on
imports. As a result, once every 10 years the entire popula-ion mnay suffer adecline in their total food consumption in excess of 5 percent of their normalconsumption and once every 8 years the low-income consumers may suffer a similardecline. Since even the normal consumption of most poor people is marginallyadequate from the nutrit.onal point of view,l/ a decline by only 5 percent belcwtheir normal consumption may expose them to general malnutrition and some to
outright starvation. Nevertheless the restrictions imposed by the TUR policieson free trade, whicb were chiefly designed to protect producers, are unfavorableto consumers and may leave them extremely vulnerable to shortages in foodsupply. (Specific policies for coping with these food insecurities are examinedin the following section.)
Tabla 7: Short-Run Econc'nic Indicators(Annual Averages in 1981 Prices)
Indicator of Policies
Expected Outcome FRE TUR TUR(F-IMP) FRE+SUP
1. Consumers' Price (T1.) 17.1 18.0 17.3 18.72. Producers' Price (TL) 17.1 13.1 17.4 18.73. Quantity of Wheat 14.2 14.1 14.2 14.8
Produced (M.MT)4. Farmers' Revenue 242 249 243 273
(TL billion)j. Government Procurei.ent 1.1 1.2
( MT)6. Support Payments to - 1.4 0.7 -
Farmers (TL billion)7. quantity Lmported (MMIT) 0.2 0.1 0.2 0.18. Quantity Exported (MIT) 1.2 l.l 1.2 1.79. Balance of Payments 17.1 1b.6 lb.3 2b.l
(TL billion)
40. Table 7 also provides several other economic indicators that areessential for policy evaluation. One is the short-run ef-fect on the averagelevel of wheat production. The table shows that under TUR, annual production isslightly smaller than under FRE even though producers' price is almost 6 percenthigher. This is due to the increase in price variability under TUR and thesupply response to the resulting increase in risk. It should be noted here thatin the present simulation experiments, a very modest risk response has beenassumed (a supply elasticity of 0.25 with respect to the standard deviation).The adverse effects of the higher instability associated with TUR are likelytherefore to be mucb more profound if the risk response is in effect larger. Incontrast, the internal price support program combined with free trade under the
policy (FRE + SUP) allows an increase in annual output by more than 4 percentboth due to tle higb average price and due ,o the greater stability guaranteedby this policy.
1/ Discussed in 13RD Report No. 42U4-TU, "Turkey - Agricultural Development
Alternatives for Urowth With Exports" (January 28, 1983), Annex 3.
- 21 -
Teble 8: Welfare Indicators: Annual Gains '+) or Losses (-) from Policies(in l96l billion TL)
TUR TUR(F-IP) FRE+SUP
Consumers -10 -2 -2UProducers +5 +1 +27Government -11 -12 -12Total Economy -17 -13 -5
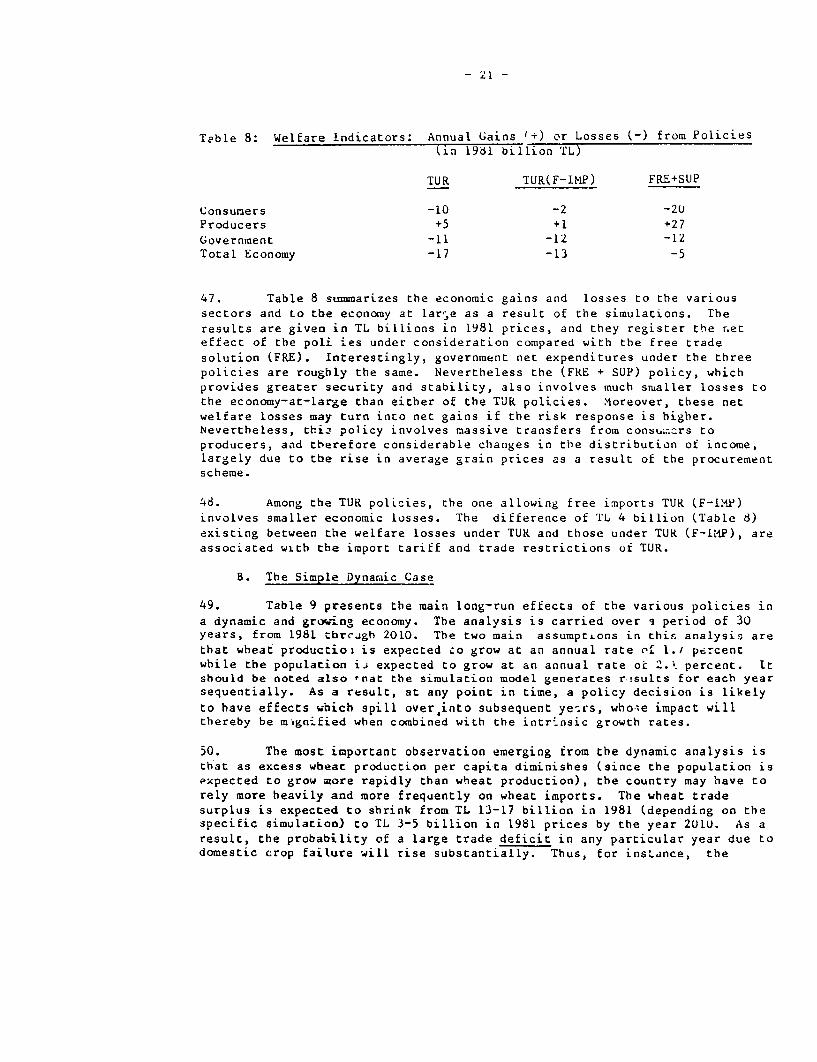
47. Table 8 summarizes the economic gains and losses to the varioussectors and to tbe economy at large as a result of the simulations. Theresults are given in TL billions in 1981 prices, and they register the r.eteffect of the poli ies under consideration compared with the free tradesolution (FRE). Interestingly, government net expenditures under the threepolicies are roughly the same. Nevertheless the (FRE + SUP) policy, whichprovides greater security and stability, also involves much smaller losses tothe economy-at-large than either of the TUR policies. >loreover, these netwelfare losses may turn into net gains if the risk response is higher.Nevertheless, thiz policy involves massive transfers from consu.^rs toproducers, and therefore considerable changes in the distribution of income,largely due to tbe rise in average grain prices as a result of the procurementscheme.
4d. Among the TUR polLcies, the one allowing free imports TUR (F-IMP)involves smaller economic losses. The difference of TL 4 billion (Table 8)existing between the welfare losses under TUR and those under TUR (F-iMP), areassociated witb the import tariff and trade restrictions of TUR.
B. The Simple Dynamic Case
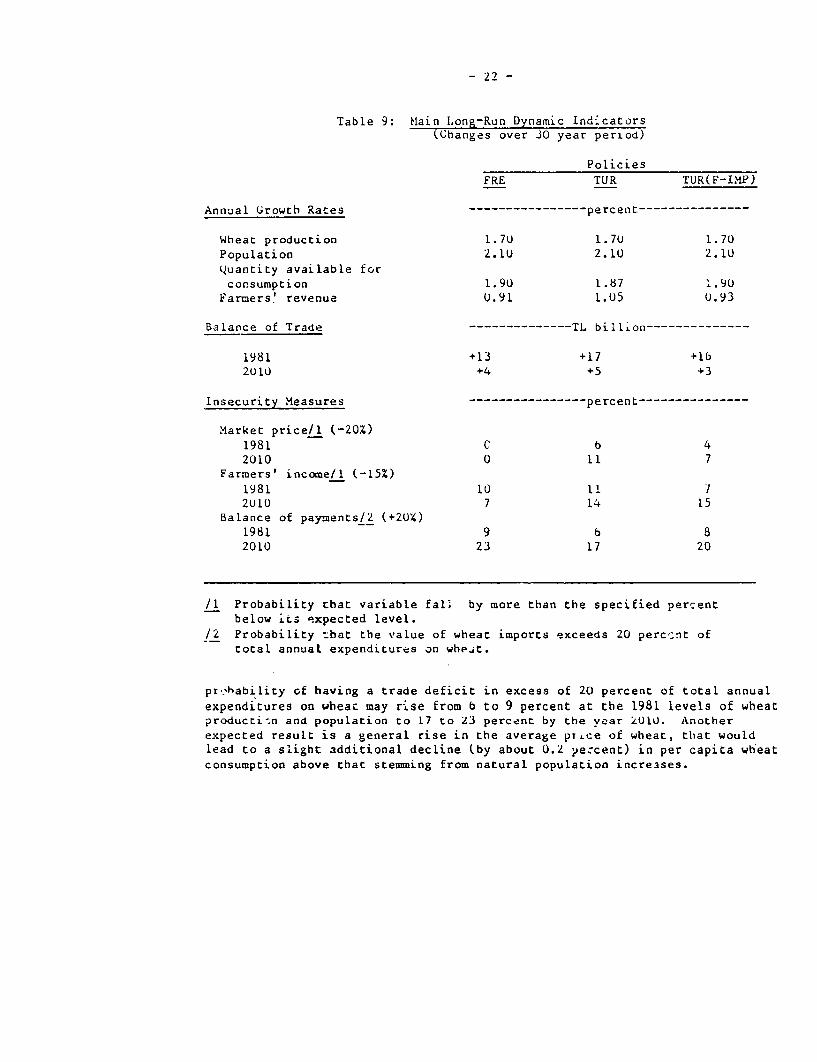
49. Table 9 presents the main long-run effects of the various policies ina dynamic and growi.n economy. The analysis is carried over i period of 30years, from 1981 tbrcagh 2010. The two main assumptions in this; analysis arethat wheat production is expected co grow at an annual rate of 1./ percentwbile the population ij expected to grow at an annual rate or 2.1 percent. Itshould be noted also 'nat the simulation model generates r.!sults for each yearsequentially. As a result, at any point in time, a policy decision is likely
to have effects wbich spill over,into subsequent ye-rs, who:e impact willthereby be mignified when combined with the intr-.nsic growth rates.
50. The most important observation emerging from the dynamic analysis isthat as excess wbeat production per capita diminishes (since the population isPxpected to grow aore rapidly than wheat production), the country may have torely more heavily and more frequently on wheat imports. The wheat tradesurplus is expected to shrink from TL 13-17 billion in 1981 (depending on thespecific simulation) to TL 3-5 billion in 1981 prices by the year 2U1U. As aresult, the probability of a large trade deficit in any particular year due todomestic crop failure will rise substantially. Thus, for insLance, the
- 22 -
Table 9: Main Long-Run Dynamic Ind_cators(Cbanges over 30 year period)
Policies
FRE TUR TUR(F-I,MP)
Annual Growth Rates -------------- percent---------------
Wheat production 1.70 1.70 1.7UPopulation 2.1U 2.1U 2.1Uquantity available forconsumption 1.90 1.87 1.90
Farmers' revenue U.91 1.05 U.93
Balance of Trade ---------- TL billion--------------
1981 +13 +17 +lb2010 +4 +5 +3
Insecurity Measures -------------- percent-----------
Market price/I (-20X)1981 C 6 42010 0 11 7
Farmers' income/l (-15X)1981 10 11 I2U10 7 14 15
Balance of payments/2 (+2U0)1981 9 6 82010 23 17 20
/1 Probability cbat variable fal. by more than the specified percentbelow ics expected level.
/2 Probability :bat the value of wheat imports exceeds 20 perc-nt oftotal annual expenditures on wheat.
prshability of having a trade deficit in excess of 20 percent of total annualexpenditures on whea; may rise from b to 9 percent at the 1981 levels of wheatproductisn and population to L7 to 23 percent by the year kOlU. Anotherexpected result is a general rise in the average pT.ce of wheat, that wouldlead to a slight additional decline (by about 0.2 pezcent) in per capita wheatconsumption above that stemming from natural population incre3ses.

- 23 -
51. The results of the simulations indicate thb ne different policiesare likaWly tu lead to different growth patterns in several respects: Under
TUR farmers' i.,come is likely to rise at a slightly higber rate than under
free trade, reflecting tae lasting effects of the producers' support program
that prevent sharp falls in price. At the same time, however, priceinstability an.d the instability of farmers' income is likely to increase underTUR but decline under free rrade. Thus, for exampie, the probability of afall in tarmers' -ncome by more than 15 percent below its expected level will
rise under TUR from 11 perLent tc 14 percent but decline under PRE from 10 to7 perzent.
52. These expected changes in the pattern of wheat production and
L.-aurmption and tbe narrowing of trade surpluses ia the dynamic world suggaststhat 3 more general analysis of performance would be appropriate underdifferent assumptions about net self-sufficiency. In the foilo' g section,thb:.e "trade" scenarios are considered for the dyn:-mic case: first, when thecoLntry is generally exporting; secondly, when the country is, on average,self-sufficient; and third, when the country is generally importing. The mainquesticn that needs to be examined is whether a price regime and interventionpractices that may be suitable when the country is generally i!xporting arestill appropriate when the country becomes self-sufficient or generallyimporting. The results of this analy;is are presented below.
V. Comparative Analysis of Alternative Policies
A. impact on Stability and Food Security of lajor Policy Variants
53. In this section a more general analysis of alternative stabilization
policies is undertaken as discussed in the preceding paragraph. One purposeof this aialysis is to permit a more complete ranking of the alternative
policies. For this purpose, the general analysis continues to apply indexnumbers, as were used in the Simple Dynamic Case for the Turkey specificsimulations. Again, to avoid reference to any specific year, the ranking ofthe outcomes of tbe various policy simulations is made by comparing their
performanca measures with that under free trade. In this analysis, severaltyp.s of stabilization policies ..re examined, including:
(i) A Turkisb-type Stabilization Package which by and large is
similar to that analyzed in the Section III, above. Again, thispolicy will be denoted as TUR, although there are two importantdifferences in the parameter values assumed. First, the TMO'sstorage and distribution operations are now assumed to containsubsidies which would result in a reduction of 5 percent in theconsumers' price. Second, the risk response coefficient hasbeen increased from 0.25 to 0.5. Two variants of the TUR policyare examined for the general analysis:

- 24 -
One--denoted by TUR1--assumes a price ceiling on the consumerprice. Irn other words, under tois policy the government see toit that the market price will not exceed a certain criticallevel (assumed to be 25 percent above the normal price) even ifthat would invoLve supplementing domestic supply with subsidizedimports. The otber--denoted by TUR (constrained)--assumes aceiling on the amount that can be procured by the TMO due tobudgetary constraints. Specifically, under this constraint, TMOprocurements cannot exceed 10 percent of annual proJuction.
(ii) An internal Stabilization Policy. Under this policy-- denotedabove by (FRE+SUP)--the government attempts to secureremunerative prices to farmers through procurement and pricesupport intarventions. If the internal prices are favorabLe eexcess supply procured by the government is exported; otherwis,it is stored in the existing storage facilities if there isenough vacant capacity or in open-storage. The detailedsLructure of this policy is given in Section III.
(iii) An External Stabilization Policy. This policy--denoted above bySTAB---assumes the government atter.pts to stabilize the domesticprice and supply via variable exn,ort and import levies but also,when necessary, via appropriate subsidies. The detailedstructure of this policy is described in Section ILL.
(iv) A Policy of Cot._:rained imports. This policy--denoted by FRE(TARF)-assumes free exports but an ad-valorem tariff of 15percent on wheat imports. The main reason for adding thi.spolicy is to examine what effects of the TUR policy should beattributed to the import tariff containea thcrein.
3efore turning to the simulation results, two comments are required withrespect to their interpretation. First, the simulation model assumes acertain stability through time to the pattern of decisions which constituteeacb policy.l/ The specific decisions, within the decision set permitted bythe policy being followed, may and indeed should change from year to year,according to the specific circumstances existing in that year. Tbc stabilityof the decision aaking process means that if identical circumstanzes areencountered during subsequent years, idenLical decisions will be vade underthe policy being examined as were made when the set of c4rcumstancais werefirst encountered. Second, the results presented below therefore should notbe interpreted as an assessment of any specific deci3isn but rather an overallevaluation of different policies, each consisting of a pattern of decisionsover an extended period of time.
1/ See para 22 for a definition of "policy".

- 25, -.
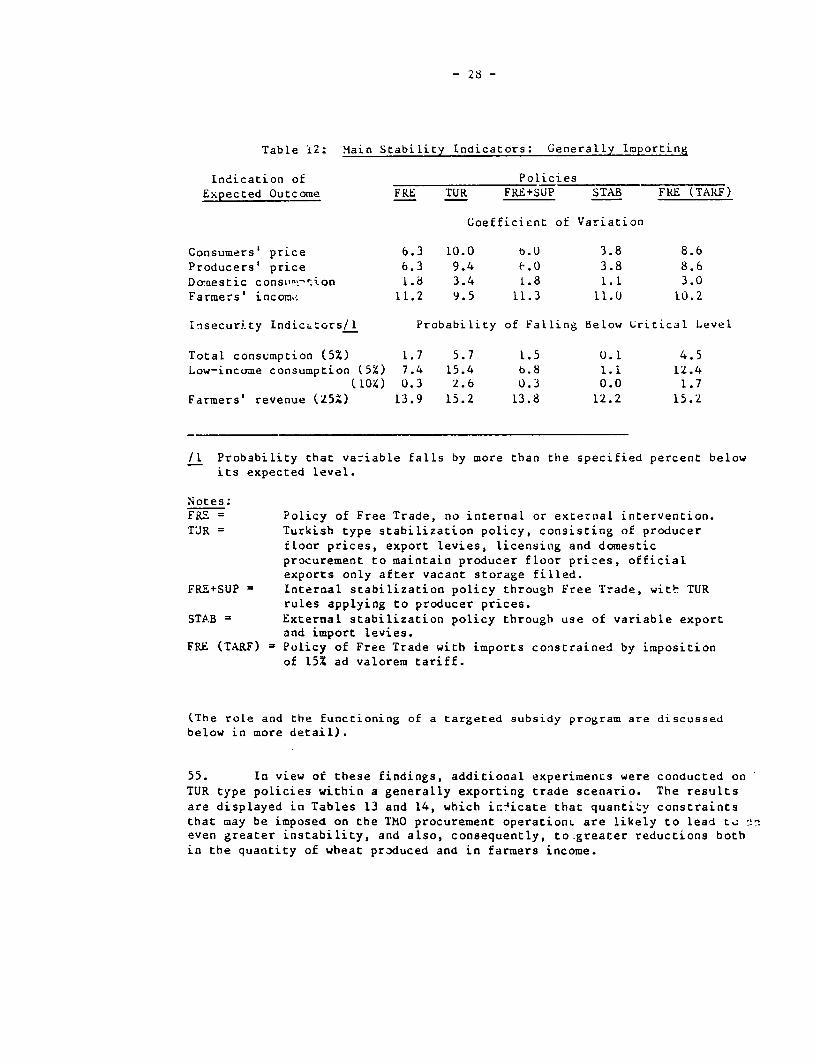
54. i:tb these caveats in mi . the main stability indicators for .befive policies under consideration ice presented in Tables 10-i2. A number ofinteresting conclusions stem from the simulation experiments for the threetrede scenarios (paras 38 and 52) assumed for the general case. First, theTUR policy enbaaces instability in all three trade scenarios considered. Thisincrease in instability is due only in small part to the import levy since theinstability nuder IUR is significantly larger than that urder FRE (TA1R2).Associated witb the large increase in price instabilicv under TUK comparedwith free-tra-e (and even more so compared with the alternative stabilizationpolicies), is a rather discouraging decrease in food security. Thus, .o;instance, under generally-<:?porting conditions, Lbe probability of tavinm a_read wheat sbortage in excess of S percent of normal consumption rises from2.b percent under free trade (and 1 percent undsr FRE+SUP) to 16.9 p^rcentudcer TUR. iais insecurity is magnified for the low income segm-.nts of thepopulatio3, ubere the probability of having an extreme shortfall in breadwha't consumption of low-xncome urban consumers by more than 10 percent belowtbeir noraal ttbough noc necessarily adequate) consumption, rises from 0.7perLont under free trrde to 14.7 percent under TUR. These results stronglysugges; the nzee for ,ecial programs if the government continues co followits TUR policies, in order to prevent periods of extreme insecurity amorgstthe more vulnerable segments of the population.

- 2b -
Table 10: Main Stability Indicators: Generally Exporting
Indication of PoliciesExpected Outcome PRE TUR FRE+SUP STAB FRE (TARF)
Coefficient of Variation
Consumers' price 7.6 18.6 5.3 3.0 10.0Producers' price 7.6 16.5 5.3 3.0 10.0Domestic consumption 2.1 4.9 2.1 0.8 Z.8Far-ners' income 12.0 5.9 11.4 10.8 11.0
Insecurity Indicators/l Probability of Falling Below Critical Level
Total consumption (5%) 2.G 18.9 1.U U.0 b.9Lcw--income consumption (5%) 9.b 25.3 4.8 0.4 14.9
(10%) G,7 14.7 0.3 0.0 3.0Farmers' revenue (15%) 15.9 22.0 12.1 9.3 17.1
/1 Probability that variable falls by more than the specified percent belowits expected level.
Notes:FRE = Pclicv of Free Trade, no internal or external interventior.TUR = Turkish type stabilization policy, consisting of producer floor
prices, export levies, licensing and domestic procurement tomaintain producer floor prices, official exports only aftervaca.nt storage filled.
FRE+SUP Lnternal stabiliz.tion policy through Free Trade, with TUR rulesapplying to producer prices.
STAB Exteinal 3tabilization policy through use of variable export andimoort levies.
FRE (rARF) Policy of Free Trade with imports constrained by imposition of15% ad valorem tariff.

- 27 -
Table il: Main Stability Indicators: Self-Sufficient
Indication of PoliciesExpected 9utcome FRE TUR FKE+SUP STAB FRE (TARF)
Coefficient of Variation
Consumers' price 7.5 15.4 b.1 3.9 11.7Producers' price 7.5 13.8 b.l 3.9 11.7DomesLic consumption 2.2 4.8 2.2 1.1 3.bFarmers' income 10.1 7.4 10.2 9.9 8.0
Insecurity Indicators/l Probability of Falling Below Critical Level
Total consumption (5X) 2.3 15.4 1.5 0.0 2.6Low-income consumption (5%), 8.4 29.7 b.3 0.4 9.6
(10Z) 0.6 8.0 0.3 0.U 0.7Farmers' revenue (15%) 12.0 22.6 10.9 9.3 12.0
/1 Probability tbzt variable falls by more than the specified percent belowits ex.ected level.
Notes:FRE = Policy of Free Trade, no internal or '^xternai intervention.TUR = Turkish type s:abilization policy, cnrsisting of producer floor
prices, export levies, licensing and domestic procurement tomaintain producer floor prices, official exports only aftervacant storage filled.
FRE+SUP - Internal stabilization policy through Free Trade, with TUR rulesapplying to producer prices.
STAB = External stabilization policy through use of variable export andimport levies.
FRE (TARF) = Policy of Free Trade with imports constrained by imposition of15% ad valorem tariff.
- 28 -
Table 12: Main Stability Indicators: Generally Importing
Indication of PoliciesExpected Outcome FRE TUR FRE+SUP STAB FRE (TARF)
Coefficient of Variation
Consumers' price 6.3 10.0 b.U 3.8 8.6Producers' price 6.3 9.4 t'.0 3.8 8.6Domestic consoum-.ion 1.8 3.4 1.8 1.1 3.0Farmers' incom,- 11.2 9.5 11.3 11.0 10.2
Insecuri.ty Indicators/1 Probability of Falling Below Critical Level
Total consumption (5%) 1.7 5.7 1.5 0.1 4.5Low-income consumption (5%) 7.4 15.4 b.8 I.i 12.4
(1OX) 0.3 2.6 0.3 0.0 1.7Farmers' revenue (25%) 13.9 15.2 13.8 12.2 15.2
/1 Probability that vaziable falls by more than the specified percent belowits expected Level.
Notes:FRE = Policy of Free Trade, no internal or external intervention.TJR = Turkisb type stabilization policy, consisting of producer
floor prices, export levies, licensing and domesticprocurement to maintain producer floor prizes, officialexports only after vacant storage filled.
FRE+SUP Internal stabilization policy through Free Trade, wite: TURrules applying to producer prices.
STAB External stabilization policy through use of variable exportand import levies.
FRE (TARF) = Policy of Free Trade with imports constrained by impositionof 15X ad valorem tariff.
(The role and the functioning of a targeted subsidy program are discussedbelow in more detail).
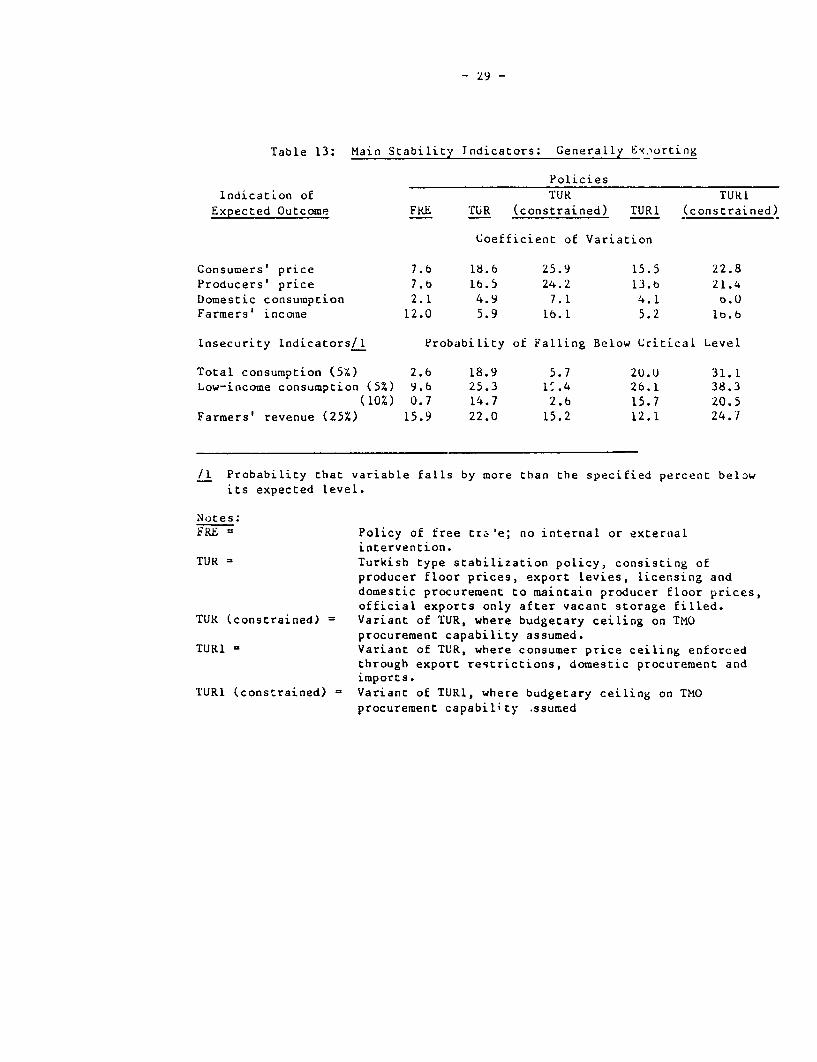
55. In view of these findings, additional experimenLs were conducted onTUR type policies within a generally exporting trade scenario. The resultsare displayed in Tables 13 and 14, which ic-'icate that quantitv constraintsthat may be imposed on the TMO procurement operationL are likely to lead t.. ̂!neven greater instability, and also, consequently, to.greater reductions bothin the quantity of wheat produced and in farmers income.
- 29 -
Table 13: Main Stability Indicators: Generally E.oorting
PoliciesIndication of TUK TURI
Expected Outcome FKE TUR (constrained) TUR1 (constrained)
Coefficient of Variation
Consumers' price 7.b 18.6 25.9 15.5 22.8Producers' price 7.b lb.5 24.2 13.o 21.4Domestic consumption 2.1 4.9 7.1 4.1 b.OFarmers' income 12.0 5.9 16.1 5.2 lb.b
Insecurity Indicators/1 Probability of Falling Below Critical Level
Total consumption (5X) 2.6 18.9 5.7 2U.U 31.1Low-income consumption (5%) 9.b 25.3 1'.4 26.1 38.3
(10%) 0.7 14.7 2.b 15.7 20.5Farmers' revenue (25%) 15.9 22.0 15.2 12.1 24.7
/1 Probability that variable falls by more than the specified percent belowits expected level.
Notes:FRE = Policy of free tr'e; no internal or external
intervention.TUR = Turkish type stabilization policy, consisting of
producer floor prices, export levies, licensing anddomestic procurement to maintain producer floor prices,official exports only after vacant storage filled.
TUR (constrained) = Variant of TUR, where budgetary ceiling on TMOprocurement capability assumed.
TUR1 - Variant of TUR, where consumer price ceiling enforcedthrough export restrictions, domestic procurement andimports.
TUR1 (constrained) = Variant of TUR1, where budgetary ceiling on TMOprocurement capability ssumed

- 3U -
Table 14: Othcr Economic Indicators: Generally Exporting
PoliciesIndication of TUi. TUR1
Expected Outcome FRE TUR (constrained) TUR1 (constrained,---Percentage Change of Outcome Undei- !iree Trade---
Consumers' price - -o.8 -6.9 -9.6 -11.3Producers' price - -3.8 -3.9 -o.5 -8.9Farmers' revenue - -b.3 -10.b -lU.0 -10.5QuanLity of wheat produced - -4.6 -7.7 -3.9 -7.0
Percentage of Normal Supply
Government procurement - 6.5 4.3 0.9 4.5Quzntity imported 0.7 U.8 l.b 1.1 2.5Quantity exported 11.9 5.7 3.7 b.O 3.9
Percentage of Normal Domestic Expenditures on Wheat
Ba'ance of Paymencs 11.7 7.2 L.9 7.1 1.7
Notes:
FRE = Policy of free trade; no internal or externalintervention.
TUR = Turkish type stabilization policy, consisting ofproducer floor prices, export levies, licensing anddomestic procurement to maintain producer floor prices,official exports onlv after vacant storage filled.
TUR (constrained) = Variant of TUR, where budgeLary ceiling on THO
procurement capability assumed.TUR1 Variant of TUR, where consumer price ceiling enforced
through export restrictions, domestic procurement andimports.
TURI (constrained) = Variant of TUR1, where budgetary ceiling on TMOprocurement capability assumed
- 31 -
56. Returning to the 5 basic policies under discussion, Tables 15 and 16
provide additional economic indicators on the effects of the various policiesunder the two most likely trade scenarios, In the generally-exporting case,
the rise in price instability issociated with the TUR type policy, coupledwith a decline in the level of the average price (due to TUR's export taxes
and quantity constraints) lead to a considerable decline in the quantity ofwbeat produced and even more so in farmets' income. However in the self-
sufficient case, -UR's import tariff is likely to bring about an increse inaverage consumer and producer prices by more than 5 percent, compared with
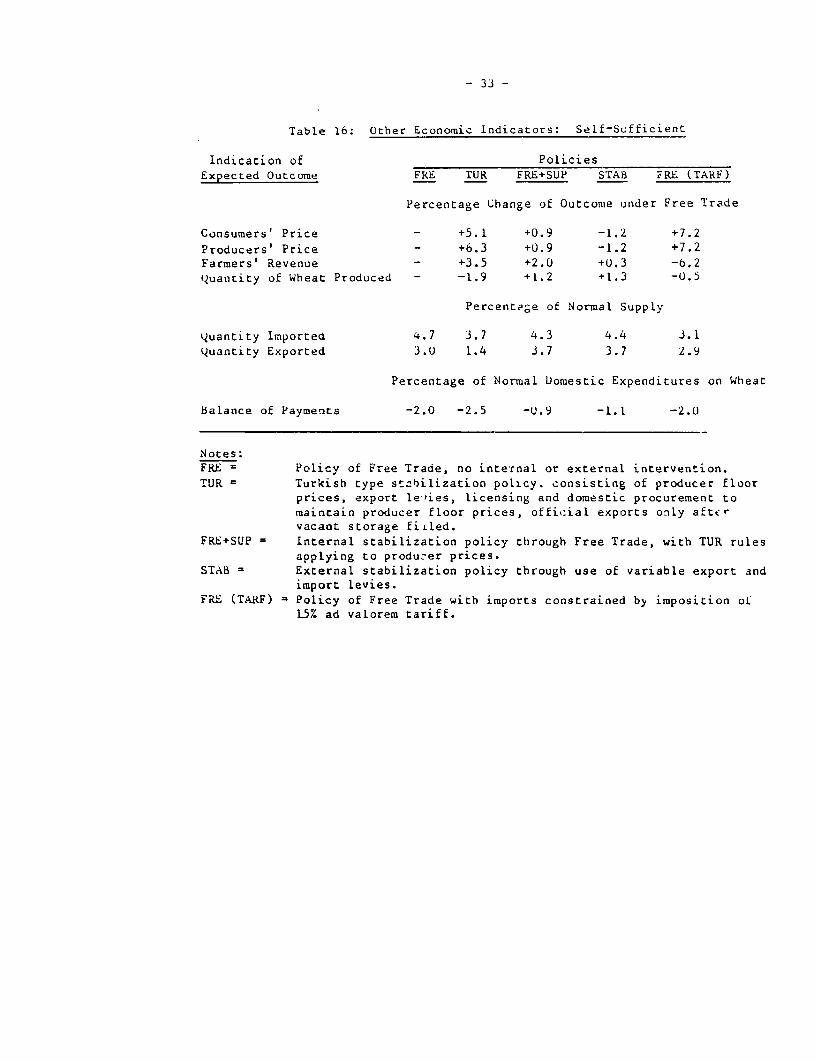
free-:rade. Nevernheless, the large rise in instability would outweigh therise in price, leaaing again to a decline in the long-run average quantity ofwheat produced by slightly less than 2 percent. The end result wouid be adecline by 3.5 percent in farm rs' average income and a decLine by 5S percentin the average quantity exported.
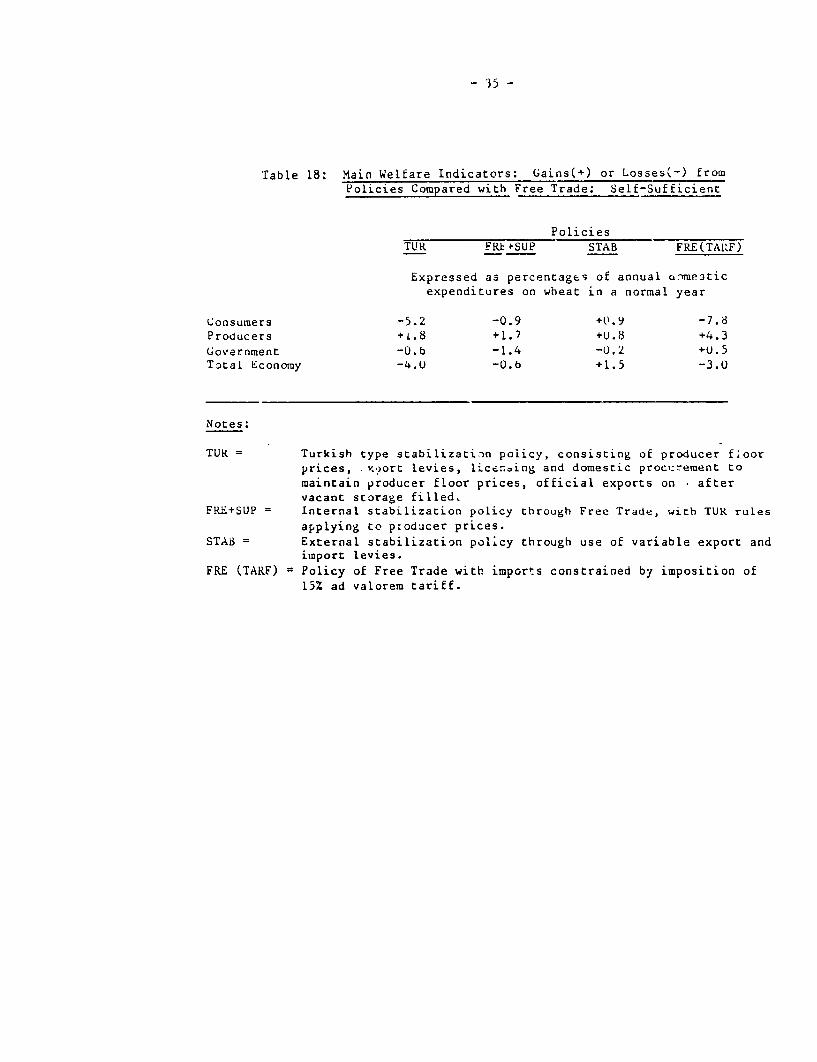
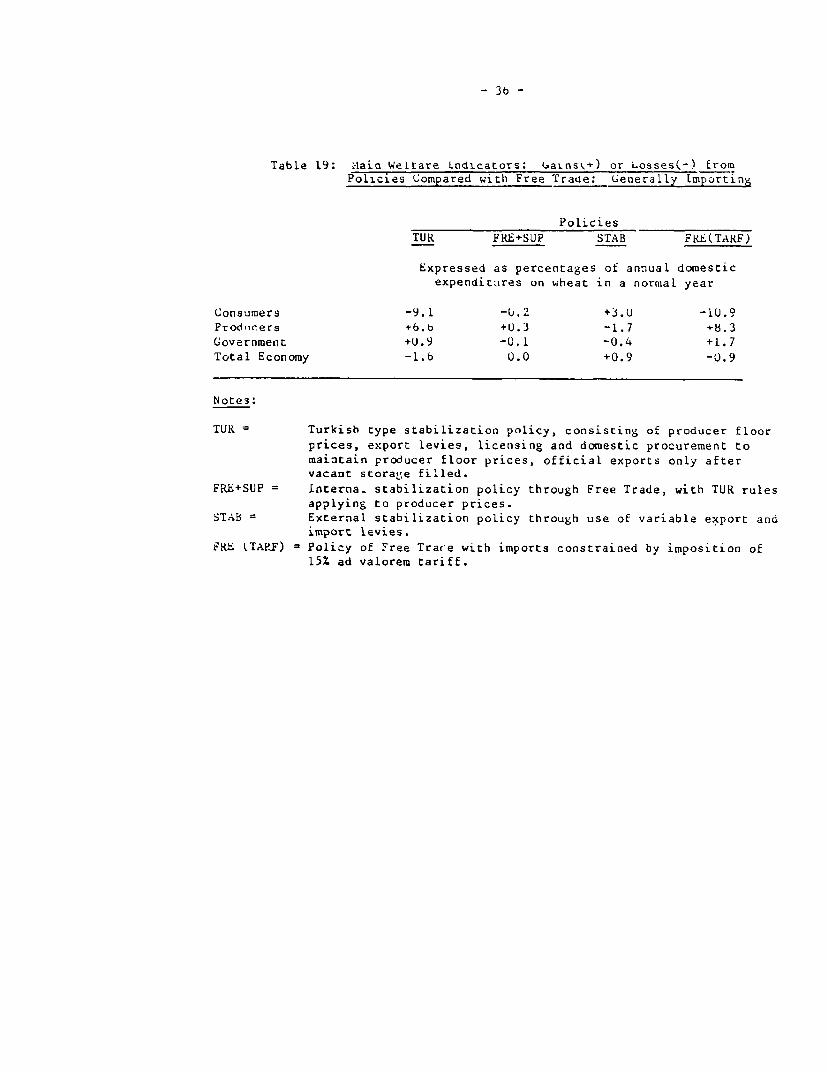
57. Lastly, Tables 17 through 19 summarize the welfare gains and losses
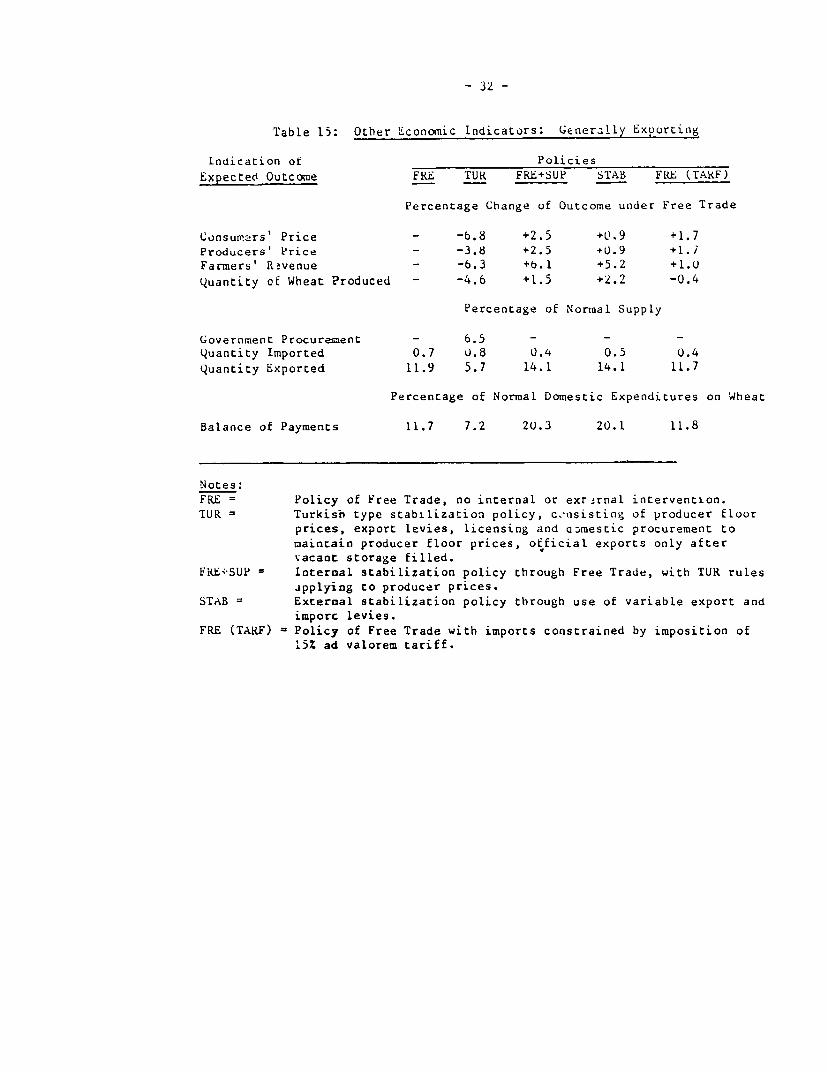
due to the various poLicy combinations for the three trade scenarios. Twoobservations stand out. First, the TUR policy involves considerable welfarelosses to the economy at large, much larger than under any of the alternativepolicies considered here. Second, the distrioution of the gains and lossesassociated with the TUR polity depend on the specific trade scenario. In thegenerally-exporting scenario, consumers would gain and producers lose, mostlyas a resuit of the export taxes and quantity ccnstraints associated with TUR.Under cor,ditions of general self-sufficiency ann even more so under thegenerally-importing acenario, consumers would lose and the producers wouldgain from the TUR policy, mostly due to the import tariff and quantityrestrictions aimed at protecting producers.
- 32 -
Table 15: Other Economic Indicators: Generally Exporting
Indication of PoliciesExpected Outcome FRE TUK FRE+SUP STAB FRE (TAKF)
Percentage Change of Outcome under Free Trade
Consumers' Price - -b.8 +2.5 +0.9 +1.7Producers' P'rice - -3.8 +2.5 +0.9 +l.iFarmers' R!venue - -6.3 +b.1 +5.2 +1.Dquantity cf Wheat ?roduced - -4.6 +1.5 +2.2 -0.4
Percentage of Normal Supply
Government Procurement - 6.5 - - -Quantity Imported 0.7 u.8 0.4 0.5 0.4Quantity Exported 11.9 5.7 14.1 14.1 11.7
Percentage of Normal Domestic Expenditures on Wheat
Balance of Payments 11.7 7.2 20.3 20.1 11.8
Notes:FRE = Policy of Free Trade, no internal or exr-rnal intervention.TUR = Turkish type stabilization policy, c.'nsisting of producer floor
prices, export levies, licensing and a.mestic procurement tomaintain producer floor prices, official exports only aftervacant storage filled.
FKEiSUP Internal stabilization policy through Free Trade, with TUR rulesapplyLing to producer prices.
STAB External stabilization policy through use of variable export andimporc levies.
FRE (TARF) Policy of Free Trade with imports constrained by imposition of,5Z ad valorem tariff.
- 33 -
Table 16: Other Economic Indicators: Self-Sufficient
Indication of PoliciesExpected Outcome FRE TUR FRE+SUP STAB FRE (TARF)
Percentage Change of Outcome under Free Trade
Consumers' Price - +5.1 +0.9 -1.2 +7.2
Producers' Price - +6.3 +0.9 -1.2 +7.2Farmers' Revenue - +3.5 +2.0 +0.3 -o.2
Quantity of Wbeat Produced - -1.9 +1.2 +1.3 -0.5
Percentege of Normal Supply
quantity Imported 4.7 3.7 4.3 4.4 3.1Quantity Exported 3.0 1.4 3.7 3.7 2.9
Percentage of Normal Domestic Expenditures on Wheat
balance of Payments -2.0 -2.5 -0.9 -1.1 -2.(
Notes:FRE = Policy of Free Trade, no internal or external intervention.TUR Turkish type st_bilization policy. consisting of producer floor
prices, export leties, licensing and domestic procurement tomaintain producer floor prices, offi,:ial exports only afttrvacant storage fiiled.
FRE+SUP = Internal stabilization policy through Free Trade, with TUR rulesapplying to produ.-er prices.
STAB = External stabilization policy through use of variable export andimport levies.
FRE (TARF) = Policy of Free Trade with imports constrained by imposition ot15%. ad valorem tariff.

- 34 -
Table 17: .Main WeLfare lndicators: Gains(+) or Losses(-) fromPolicies Compared with Free Trade: Generally Exporting
Policies
TUR FRE+SUP STAB FRE(TARF)
Exnressed as percentages of annual domesticexpenditures on wheat in a normal year
Consumers +6.1 -3.1 -2.4 -2.0Producers -9.4 +4.9 +3.9 +0.6Government -1.9 -3.8 -2.5 +U.3Total Economy -5.2 -2.0 -1.0 -1.1
Notes:
TUR = Turkish type stabilization policy, consistirng of producer floorprices, export levies, licensing and domestic procurement tomaintain producer floor prices, official exports only aftervacant storage filled.
FRK+SUP Internal stabilization policy through Free Trade, with TUR rulesapplying to producer prices.
STA1. = r.xternal stabilization policy through use of variable export andimport levies.
FRE (TARF) = Policv of Free Trade with imports constrained by imposition of15% ad valorem tariff.
- 35 -
Table 18: Main Welfare Indicators: Gains(+) or Losses'-) fromPolicies Compared with Free Trade: Self-Sufficient
PoliciesTUR FREI-SUP STAB FRE(TAR,F)
Expressed as percentages of annual cknme3ticexpenditures on wheat in a normal year
Consumers -5.2 -0.9 +0.9 -7.8Producers +i.8 +1.7 +U.8 +4.3
Government -0.b -1.4 -0.2 +U.5Total Economy -4.0 -0.6 +1.5 -3.0
Notes:
TUR = Turkish type stabilization policy, consisting of producer foorprices, .xport levies, lice..ing and domestic procurement tomaintain producer floor prices, official exports on * aftervacant storage filled.
FRE+SUP = Internal stabilization policy through Free Trade, with TUR rules
applying to p;oducer prices.STAB External stabilization policy through use of variable export and
imnport levies.FRE (TARF) = Policy of Free Trade with imports constrained by imposition of
15% ad valorem tariff.
- 3b -
Table 19: .-ain Weltare Indtcators: Uaixns+) or Losses(-) fromPolicies Compared with Free Tracie: Generally lmporting
Policies
TUR FRE+SUP STAB FRE(TARF)
Expressed as percentages of annual domesticexpenditures on wheat in a normal year
Consumers -9.1 -,.2 +3.U -10.9
Prodlrers +6.b +U.3 -1.7 +8.3
Government +U.9 -0.1 -0.4 +1.7
Total Economy -l.b 0.0 +0.9 -0.9
Notes:
TUR = Turkisb type stabilization policy, consisting of producer floor
prices, export levies, licensing and domestic procurement to
maintain producer floor prices, official exports only aftervacant storage filled.
FRE+SUP Lnterna_ stabilization policy through Free Trade, with TUR rules
applying to producer prices.STAB External stabilization policy through use of variable export and
import levies.F"6 (TARF) = Policy of F'ree Trace with imports constrained by imposition of
15% ad valorem tariff.

- 3 7
B. Specific Adaptations of TUR
Target Subsidy Programs and Food Security
52. Recent nutrition studies (cf para 45, ff 1) indicatn that theincidence of malnutrition in Turkey is by no means negligible. In periods ofsharp price iacreases a much larger portion of the population may become
temporarily malnourished, and close at verge of subsistern,e may experienceextreme food shortage.
59. In most middle- and high-income countries, the wide "stochastic"fluctuations in wheat production and prices has made it politically necessaryfor governments tc design programs to cope with critical shortfalls in foodsconsumption, and in such countries these programs are essential ingredients toan analysis of overall stabilization policies.
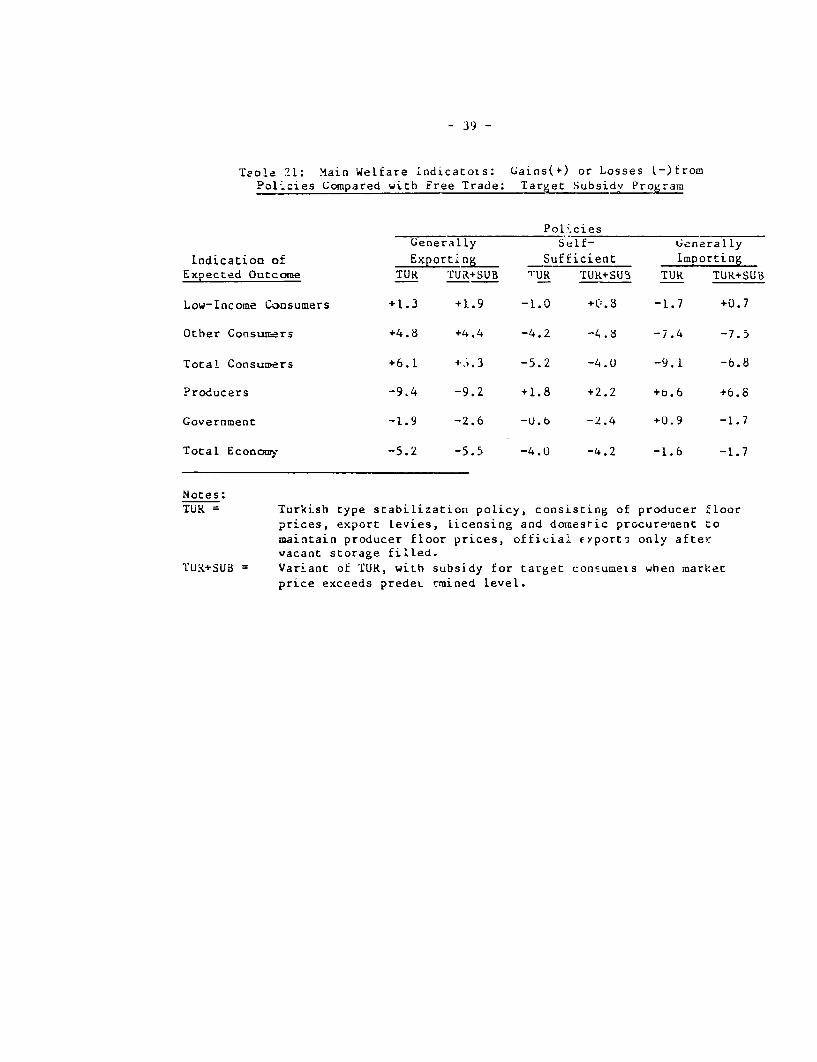
bO. Table 20 examines the effects of a subsidy program presently notpracticed in Turkey, which would be targeted on low income consumers in urbanareas, denoted by TUR+SUB. Two observations stand out: First, under allthree of the tra'e scenarios, a price stabilization cum subsidy policy basedon the TUR assumptions, will substantially reduce or even entirely eliminateperiodic short.dlls in food consumption by the poor. However, in doing so,theTUR+SUB policy destabilizes the market price to the other consumers anddestabilize farmers income.
bl, Table 21 summarizes the welfare gains and losses due to the TURpolicy, with ana without a target subsidy. The results clearly indicate thatwhile the beneficiary consumers gain on the margin from the subsidy, the otherconsumers would suffer losses due to a rise in their price and the overalleffect is a net .jelfare loss to the economy. Against these losses is a largegain in food security, and the trade off must be explicitly recognized ifgovernment chooses to continue with TUR type policies. In this instance, theeconomic loss could perhaps be viewed as an insurance premiuiA whicn must bepaid by the economy (under TUR-type policies) to reduce the probability ofperiodic starvation.

- 38 -
Table 20: Main Stability Indicat ors: _e Subsidy Pro-ra
PoliciesGenerally Self- Generally
Indication of Exporting Sufficient ImportingExpected Outcome TUR TUR+SUB TUR TUR+SUb TUK TUR+SUb
Coeffi:ient of Variati.on
Consumers' price 18.b 19.1 5.4 15.- 10.0 10.1
Prolucers' price 1i.5 lb.9 L3.8 14.1 9.4 9-)
Domestic consumption 4.9 4.6 4.8 4.2 3.4 2.8
Farmers' incomre 5.9 b.5 7.4 8.1 9.5 10.0
Insecurity Indicators/i Probability of Falling Below Critical Levei
Total consumptioa (5%) 18.9 17.X 15.4 8.4 5.7 2.4Low-income onsumption (5%) 25.3 17.9 29.7 1.4 15.4 0.0
(10X) 14.7 3.5 8.U 0.0 2.u 0.0Farmers' revenue (.5%) 22.0 ' 22.6 25.U 15.2 16.3
/ Probability that variable falls by more than the specitied perc^nt belowits expected level.
Notes:TUR Turkish type stabilizaLion policy, consisting of peoducer floor
prices, export levies, lics3i.rig and domestic procurement tomaintain producer floor pric!s, official exports only aftervacact storage filled.
TUR+SUB = Variant of TUR, with subsidy for target consumers when marketprice exceeds predttt-ermined level.
- 39 -
T2ole 21: Main Welfare indicatois: Gains(+) or Losses (-)fromPol.cies Compared witb Free Trade: Target Subsidy Program
Pol:0ciesGenerally Self- Gcnerally
Indication of Exporting Sufficient ImportingExpected Outcome TUR TUR+SUB TUR TUR+SUB TUR TUR+SUB
Low-Income Consumers +1.3 +1.9 -1.0 +0.8 -1.7 +0.7
Other Consumers +4.8 +4.4 -4.2 -4.8 -7.4 -7.5
Total Consumers +6.1 +.i.3 -5.2 -4.U -9.1 -b.8
Producers -9.4 -9.2 +1.8 +2.2 +b.6 +6.8
Government -1.9 -2.6 -0.6 -2.4 +0.9 -1.7
Total Econonr -5.2 -5.5 -4.0 -4.2 -1.6 -1.7
Notes:TUR Turkish type stabilization policy, consisting of producer floor
prices, export levies, licensing and domesric procurement tomaintain producer floor prices, official fYport-3 only aftervacant storage filled.
TUX+SUB Variant of TUR, wiLh subsidy for target consumeis when marketprice exceeds predeL rmined level.

- 40 -
O2peation of Buffer Stocks
62. The usual level of _arry-over stocks held by the TMO ranges between10 to 15 percent of anneal production. These stocks are held pririarily asoperating stocks and partly as emergency stocks against the contingency of anextrrme shortfall in wheat pr.,auction. TMQ bas not, however, made moreextenisive use of chcse stocks to stabili2e the market and prevent or at leastmrzx!erate price increases during less critical periods oL shortage. Tc examinethis pOssioility, the operati3n of butffer stocks are simulated within a rathernarrow price band. The description of the stock operations assumed for thisanal-sis-are given in Section IllI above. Table 2L portrays the stabilizingefIfect3 of buffer stocks opetation under the TUK policy while Table 23summarizes the associated economic gains and losses.
o3. The results of the si-ulation indicate that modest gains in thestability of ccnsumer price and domestic consumption levels are to be expectedfrom managing stocks w.ithin a fairly narr3w pri:e range when the country'slong-run position is either generally-exporting or s!lf-sufficient. Howeversubstantial gains in food security for all consumer groups are reaiized inthese tvj trade scenarios, which would also be experienced in a more modestway if generally-importing condLtions prevailed. Farmer's income is slightlydestabilized under the generally export>-g conditions. Table 23 shows only aslighc impact on total economic welfare frotw the TUR+STK poli^y comparcd withthe basic TUR oper3tior, with consumers generally benefitting, but goverp,nentsuffering some loss in "welta.e" as a result jf increased stock managementcosts due tv the reqrlrement in T'UR that excess s' ply--when it exists--befirst directed to fill vacant storage facilities hefore engaging in exports.
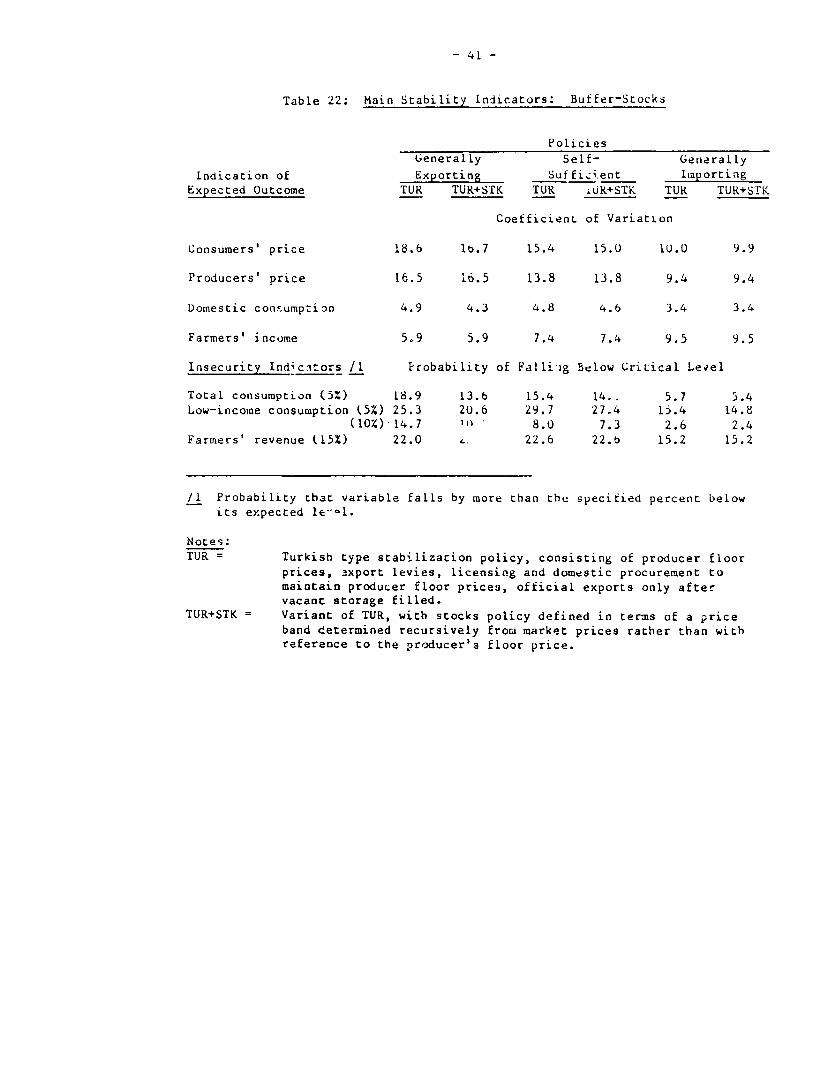
- 41 -
Table 22: Main Stability Indicators: Buffer-Stocks
PoliciesGenerally Self- Generally
Indication of Exporting Suffi,ient ImportingExpected Outcome TUR TUR+STK TUR .uR+STK TUR TUR+STK
Coefficient of Variation
Consumers' price 18.6 lb.7 15.4 15.0 10.0 9.9
Producers' price 16.5 16.5 13.8 13.8 9.4 9.4
Domestic confumpziza 4.9 4.3 4.8 4.6 3.4 3.4
Farmers' income 5.9 5.9 7.4 7.4 9.5 9.5
Insecurity Indicitors /1 Probability of Falli'ig Below Critical Level
Total consumption (5%) 18.9 13.6 15.4 14... 5.7 5.4
Low-income consuraption (5X) 25.3 20.6 29.7 27.4 15.4 14.8(10%) 14.7 1" 8.0 7.3 2.6 2.4
Farmers' revenue (15%) 22.0 22.6 22.b 15.2 15.2
/1 Probability that variable falls by more than the specified percent below
its expected le-l.
Notes:TUR = Turkish type stabilization policy, consisting of producer floor
prices, sxport levies, licensing and domestic procurement tomaintain producer floor prices, official exports only aftervacant storage filled.
TUR+STK = Variant of TUR, with stocks policy defined in terms of a price
band determined recursively from market prices rather than withreference to the producer'a floor price.
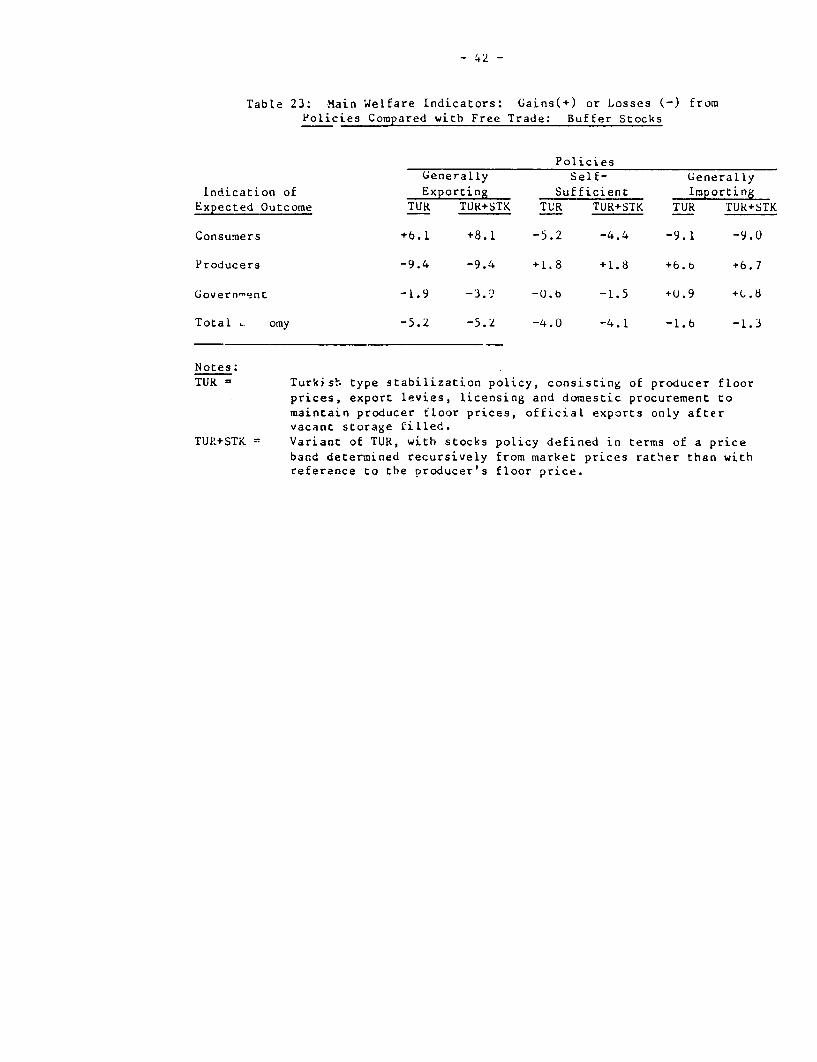
- 42 -
Table 23: .Yain Welfare Indicators: Gains(+) or Losses (-) fromPolicies Compared witb Free Trade: Buffer Stocks
PoliciesGenerally Self- Generally
Indication of Exporting Sufficient ImportingExpected Outcome TUR TUR+STK TUR TUR+STK TUR TUR+STK
Consumers +6.1 +8.1 -5.2 -4.4 -9.1 -9.U
Producers -9.4 -9.4 +1.8 +1.8 +6.t +6.7
Governent -1.9 -3.' -0.6 -1.5 +U.9 +b.8
Total omy -5.2 -5.y -4.0 -4.1 -1.6 -1.3
Notes:TUR = Turkish. type stabilization policy, consisting of producer floor
prices, export levies, licensing and domestic procurement tomaintain producer floor prices, official exports only aftervacant storage filled.
TUP+STK - Variant of TUR, with stocks policy defined in terms of a priceband determined recursively from market prices rather than withreference to the rroducer's floor price.

I
I

- 43 -
Consumer and Proaucer Price Intervention
64. The final set of simulation experiments compares performance for thegenerally self-sufficient case under conditions of simple free trade (FRE) andfree trade with domestic price interventions, with the basic TUR policies anda variant (TURI) which sets a ceiling on consumer prices. The results,displayed in Tables 24-2b, are clear ana un& quivocal. The policy denoted asFRE+SUP+SUB, which is an effort to minimize the downside risk in farm incomethrough use of the floor pricing rules contained in TUR and TURI, with theaddition of a target group consumer subsidy, provides the highest level ufconsumers' and producers' price stabilization amongst the policies considered(includ.ng, not unexpectedly, free trade), as well as domestic consumptionbalances (see Table 24). The TUR policies, however, continue to providehigher stability for farmer' incomes. Most importantly, though, is the
mar-ed improvement in food security gained under FRE+SUP+SUB for all groups,including farmers. On the consumption sid1e, this manifests the effect ofallowing imports in years of shortage which, under FRE+SUP+SUB, would be at alevel to maincain reasonable consumer price levels. From the standpoint ofproducers, tb.e inreraction of the guaranteed price in years of overproductioncombined with the absence of trade interventions in the form of export levies(ostensibly to iasulate domestic prices from fluctuating border prices)operates to decrease the density of the lower tail of the distribution ofexpected outcomes, and thereby reduce the probability of an extreme shortfallin farmer's income.
6b. In Table 25, the main welfare indicators for the TUR, TUR1 andFRE+SUP+SUB policies are displayed for the three trade scenarios assumed.When compared with tree trade, the point of reference, the FRE+SUP+SUB policyentails the least loss in Total Economic Welfare compared with the TUR-typepc.icies. Thus the opportunity cost of obl:aining food security with thispolicy is lowest and, considerin- the magnitude of the increased securitygained (Table 24), its performance would be demonstrably superior. There is ashift of burden, bowever, from consumers in the case of the TUR policies togovernment under tbe free trade cum price interventions policy, which seemsappropriate. Tbe results displayed in Table 2b reinforce comparable findingsin the Turkey-specific analysis of Section IV above, that free trade in wheatin the general case will have a less negative effect on the balance ofpayments than the TUR-type policies, which is further improved by aFRE+SUP+SUB policy. This latter results from the enhanced production, whichin turn appears to be ret .ed to greater producer price stability (Table 24),even though the expected value of the producer's price is somewhat lower underthis policy than the TUR and TUR1 policies, as indicated in Table 26.
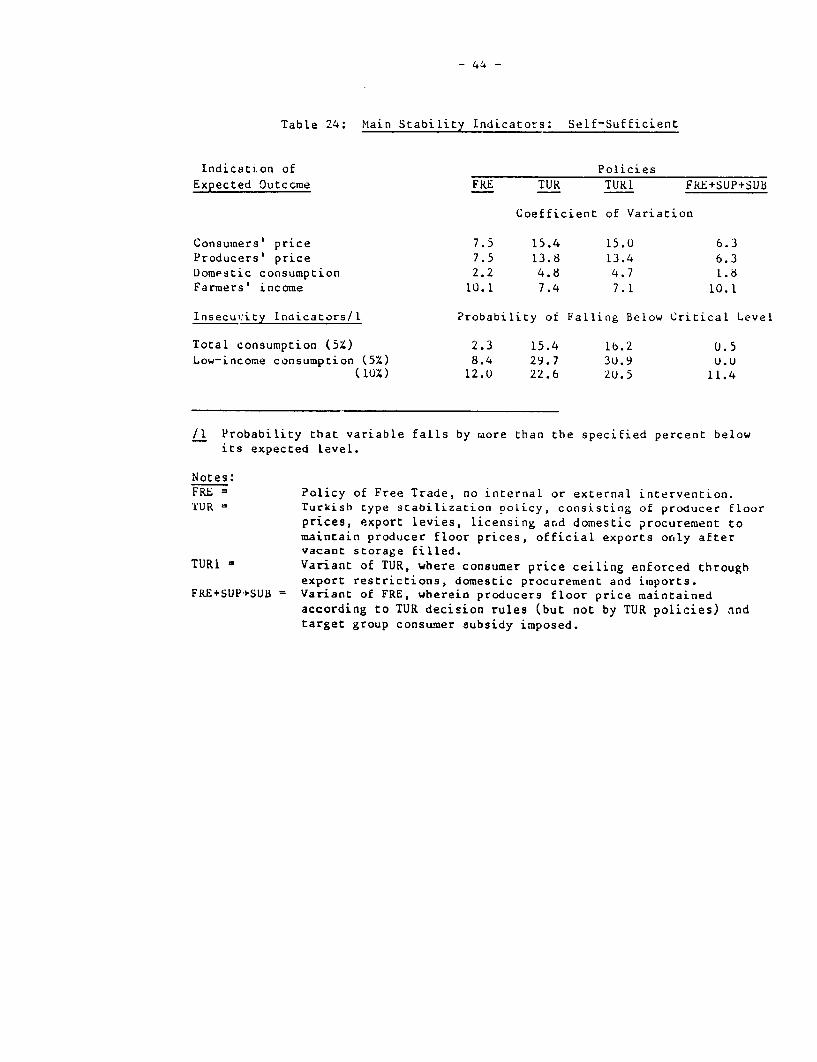
-44 -
Table 24: Main Stability Indicators: Self-Sufficient
Indicaci.on of PoliciesExpected Outccme FRE TUR TURI FRE+SUP+SUB
Coefficient of Variation
Consumers' price 7.5 15.4 15.0 6.3Producers' price 7.5 13.8 13.4 6.3Domestic consumption 2.2 4.8 4.7 1.6Farmers' income 10.1 7.4 7.1 10.1
Insecui.-ity Indicators/l Probability of Falling Below Critical Level
Total consumption (5Z) 2.3 15.4 lb.2 U.5Low-income consumption (5%) 8.4 29.7 3U.9 U.u
(10%) 12.U 22.6 2U.5 11.4
/1 Probability that variable falls by rmore than the specified percent belowits expected level.
Notes:FRE = Policy of Free Trade, no internal or external intervention.TUR T Turkish type stabilization Dolicy, consisting of producer flour
prices, export levies, licensing ar.d domestic procurement tomaintain producer floor prices, official exports only aftervacant storage filled.
TUR1 Variant of TUR, wbere consumer price ceiling enforced throughexport restrictions, domestic procurement and imports.
FRE+SUP+SUB = Variant of FRE, wherein producers floor price maintainedaccording to TUR decision rules (but not by TUR policies) andtarget group consumer subsidy imposed.
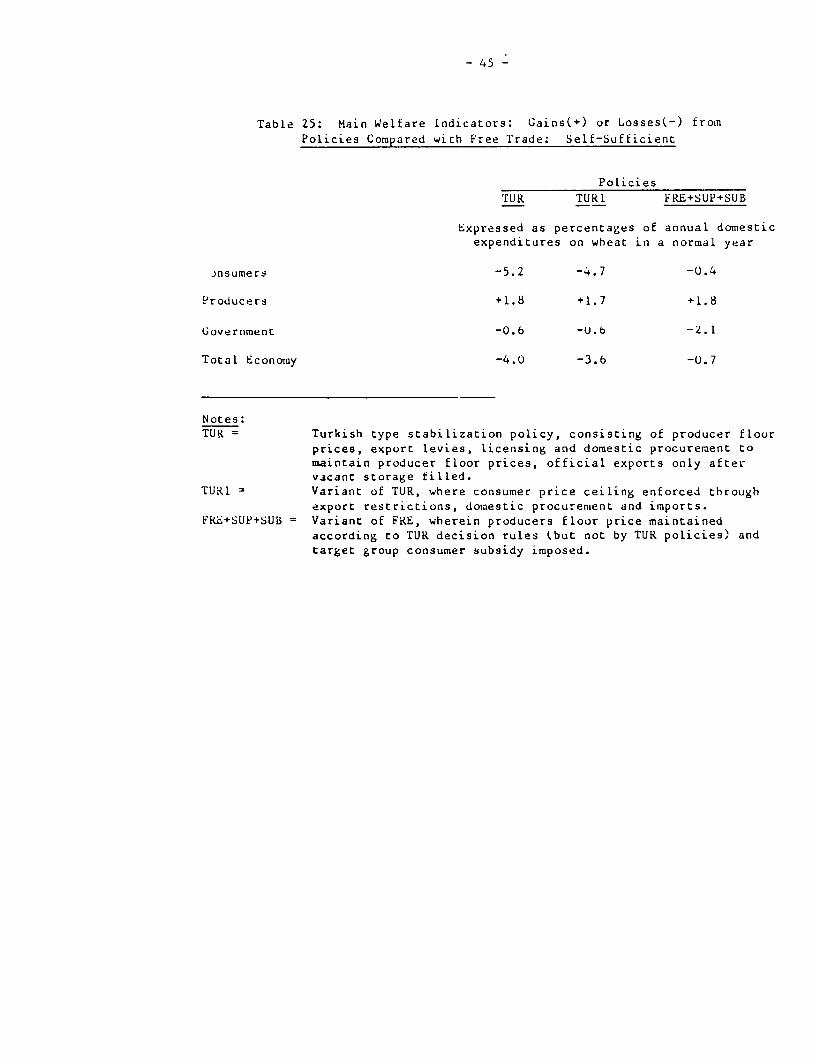
- 45 -
Table 25: Main Welfare Indicators: Gains(+) or Losses(-) fromPolicies Compared wich Free Trade: Self-Sufficient
Policies
TUR TURI FRE+SUP+SUB
Expressed as percentages of annual domesticexpenditures on wheat in a normal year
.,nsumers -5.2 -4.7 -0.4
Producers +1.8 +1.7 +1.8
Government -0.6 -U.6 -2.1
Total Economy -4.0 -3.6 -U.7
Notes:TUR = Turkish type stabilization policy, consisting of producer floor
prices, export levies, licensing and domestic procurement tomaintain producer floor prices, official exports only aftervacant storage filled.
TUR1 = Variant of TUR, where consumer price ceiling enforced throughexport restrictions, domestic procurement and imports.
FRE+SUP+SUB = Variant of FRE, wherein producers floor price maintainedaccording to TUR decision rules (but not by TUR policies) andtarget group consumer subsidy imposed.
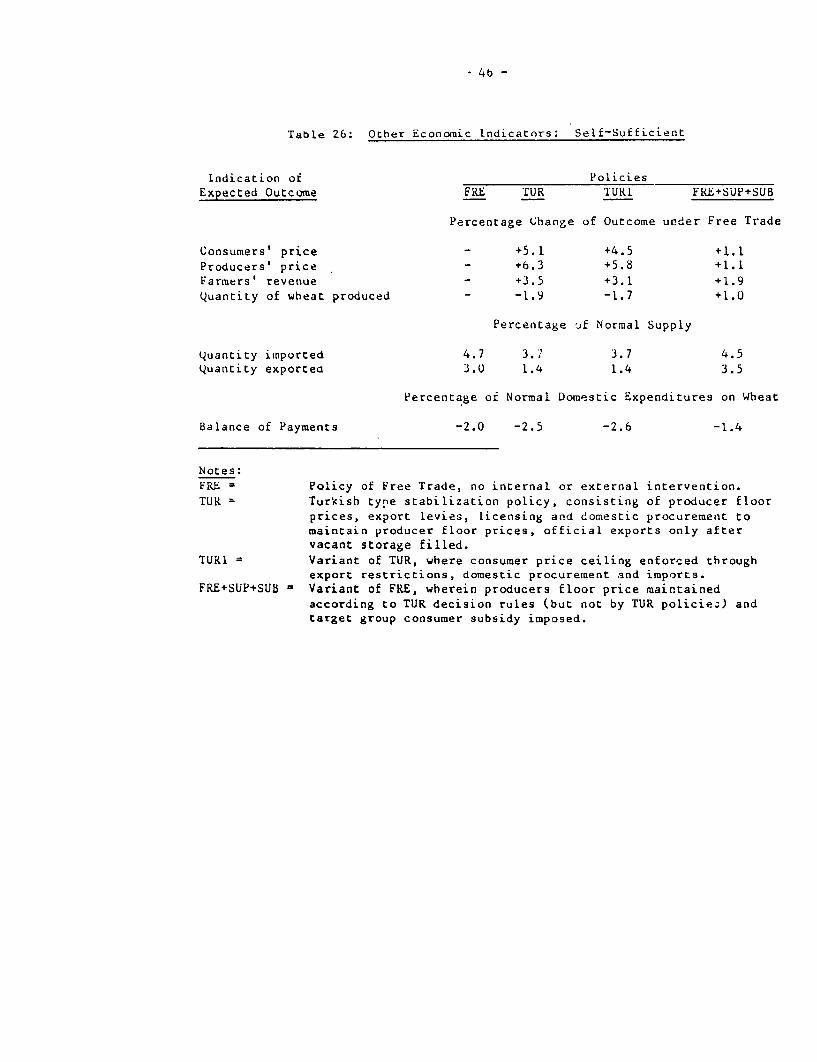
4b -
Table 26: Otber Economic Indicators: Self-Sufficient
Indication of PoliciesExpected Outcome FRE TUR TUK1 FKE+SUP+SUB
Percentage Change of Outcome under Free Trade
Consumers' price - +5.1 +4.5 +1.1Producers' price - +6.3 +5.8 +1.1Farmers' revenue - +3.5 +3.1 +1.9quantity of wheat produced - -1.9 -1.7 +1.0
Percentage if Normal Supply
quantity imported 4.7 3., 3.7 4.5quantity exportea 3.U 1.4 1.4 3.5
Percentage or Normal Domestic Expenditures on Wheat
Balance of Payments -2.0 -2.5 -2.6 -1.4
Notes:FRE = Policy of Free Trade, no internal or external intervention.TUR = Turkish type stabilization policy, consisting of producer floor
prices, export levies, licensing and domestic procurement tomaintain producer floor prices, official exports only aftervacant storage filled.
TURI = Variant of TUR, where consumer price ceiling enforced throughexport restrictions, domestic procuremaent and imports.
FRE+SUP+SUB 0 Variant of FRE, wherein producers floor price maintainedaccording to TUR decision rules (but not by TUR policie_) andtarget group consumer subsidy imposed.

- 47 -
VI. Gonclusions and Recommendations
bb. The analysis presented in the previous sections represents an
extension of recently developed methodologies to the pattern of Turkishinterventions in the wheat trade. The findings, however, are by no means
unique to Turkey nor is the Turkisb pattern of intervention unusual. In thedrive for foodgraios self-sufficiency and the related food security wbich such
subventions endeavor to secure, many countries have assumed that the directmanagement of a national stockpile by Government is a necessary concommitant,thus a Tl10-type operation has been put into place. In doing so, the respon-sible agencies have tended to use very simple performance measures of thelevels of security achieved, niamely a comparison of actual farm gate andconsumer prices abd fluctuat.ons with administratively determined referenceprices, and the availabilit) of domestically produced grain to maintainreference levels of per capita consumption. Within the limitations of suchindicators, the resource cost of government managed stockpiles are frequentlyignored. What is unique about the Turkish pattern is both the degree ofinsulation from international price fluctuations which the Government attemptsto achieve for producers and consumers, and the very strong emphasis given toproducer price maintenance with a correspondingly lesser emphasis on consumerprice ceilings and stabilization (and none at all for rural consumers).
b7. The foregoing study accomplished two principle tasks. Firstly, itcast an analysis of the effects of intervention within a probabilisticframework, which is proper considering that food security and price stabiliza-tion policies are adopted with the avowed purpose of improving risk managementand reducing the associated variability in producer and consumer welfare. Thes.udy also presents a method of quantifying the probability of extreme short-falls in consumption and producer incomes through use of cut-off probabili-ties, and operationalizes this methodology under Turkish conditions. Thisaspect of food security is as important as the former (i.e. general riskmanagement) yet rigor is rarely applied for a variety of reasons. Second, aquantification of tbe effects of alternative patterns of intervention werecarried out to provide a basis of comparison with Turkish-type policies on theassumption that these will be continued into the future.
68. The results of the analysis are striking, and indicate that the basicTUR-type policies can be expected to perform less efficiently over thelong-run than policy variants which feature considerably less intervention in
external and internal markets. This applies both to the efficiency of generalrisk management and the price and income stabilization thereby gained, as wellas to minimizing the expected occurance of extreme shortfalls. Ironically, byreducing the cumulative effects of risk on producer incomes, the analysis alsosuggests that the less interventionist policies could be expected to increaseexpected wheat production above levels projected for the TUR-type interven-tions, even though these primarily emphasize producer incentives. Moreover,the results are robust, and are not altered by the net external trade posi-tions assumed over the pro,ection period; e.g. whether the country remains anet exporter of wheat, becomes basically self-sufficient, or becomes a netimporter. It would thus appear that successful price and income stabilization

- 48 -
and the achieverment of improved food security onder Turkish conditions areassociated neither with self-sufficiency in wheat production nor with thephysical storage and movement of wheat according to TMO rules. rhe existingpolicies tierefore merit serious review.
69. If such a review is undertaken, some points requir-e furtherelaboration. These involve (a) the sensitivity testing of some keyparameters, especially the assumed income elasticities and risk coefficientsand the assumed level of reference prices, (b) a more detailed costing ofTMO's wheat haodling operations, including the opportunity cost of the verygenerous subsidy given TMO through the Central Bank rediscounting of TMO'sprocurements, (c) adjustmentc to the structure of the analysis to reflect thefollowing subordinate yet possibly important features of TUR policies whichwere not rigorous addressed in the analysis:
(i) the reiaposition of TMO's monopoly in the foreign wheat trade;
(ii) the restrictions of TMO's domestic wheae sales to urban areas;
(iii) decomposition of annual data into monthly or quarterly data totrace tbe effects of seasonality on the measures of stabilityand security achieved and the associated carrying costs o.seasonal stocks; and
(iv) a disaggregation of the model on the demand side to incorporatesubstitute grains for bread wheat, especially hard wheat, and onthe production side to incorporate substitute crops for wheat,principally barley, sunflower oil and cotton.
7U. With regard to alternative policies, a policy of target consumersubsidization anad producer price supports within the context of free trade'/appeared to perform especially well. However, the testing of this policy waslimited to the "generally self-sufficient" trade scenario, and it would bedesirable to learn whether its performance ranking would be maintained undergenerally exporting and generally importing conditions. Should the policyalso perform well under these two scenarios, it would then be desirable toderi-e the least cost system for administering target consumer subsidies--bethese in kind or by using cash equivalents--and farmer price supports, whetherthrough subsidy payments, direct procurement or other measures. Mostimportantly, the Government, in doing so, sbould remain open to theconsideration of alternatives which would represent a significant departurefrom the existing pattern of intervention, and which if adopted, may imply adismantling of tbe present institutional structure and methods of financingthrough which current policies are effectuated.
1/ Denoted by FRF+SUP+SUB (cf Tables 24-26).

ANNEX 10Appendix
POLICY COMBINATIONS OPERATION RULES
The purpose of this appendix is to describe in more detail theinteraction between various policy combinations.
Exoort Subsidy, Procurement, and Consumers' Subsidy:
Suppose that %U is the quantity produced in a given year.Producers' price--determined by the tar.'ac demand curve DT--would then bepT, At that price, the quantity Y2 wouid be sold in the market while thequaLntity (U - would be procured by the government. Consumers price,determined as a fraction of the market price--would then be pS, a pricewhich would be attained by a subsidy of (PT _ pS). At that price,consumers purchase the quantity ql and the rest is exported. It the exportprice is pA tbat the exports is assured by a subsidy of (PT - P ).These are in fact the losses of the government agencies in charge ofprocurement and export. If the government maintains also buffer stocks thenthe excess supply (qo - yl) would be used firsL to fill the storagefacility up to capacity and o..ly the excess beyond that would be exporLed.
Figure Al: EXPORTS, PROCURE1ENT AiND SUBSIDY
Pnce O
I I
02 0¶, co , anh
.Wodld Bank-2432
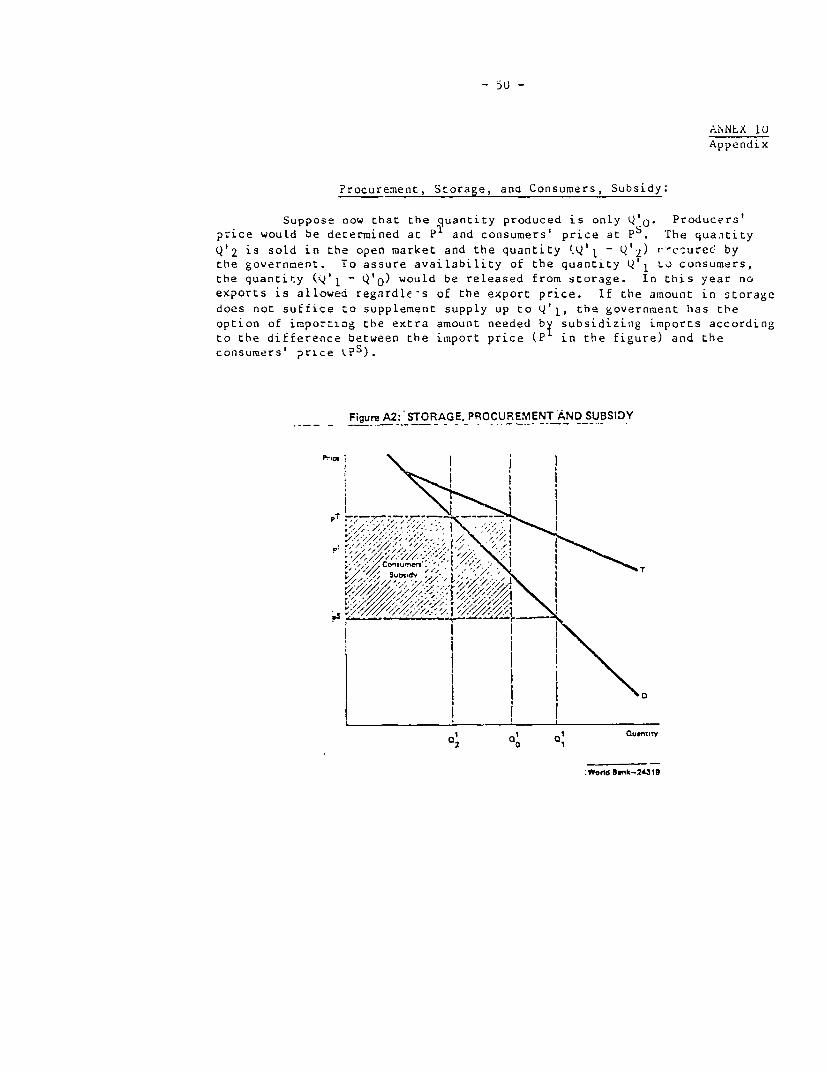
- 5U -
ANNEX 10Appendix
Procurenent, Storage, ana Consumers, Subsidy:
Suppose now that the quantity produced is only Q'0. Producers'price would be determined at Pl and consumers' price at pS. The qua.ntityQ'2 is sold in the open market and the quantity (Q'1 - q' 2) r-cture& bythe government. To assure availability of the quantity q'1 Lo consumers,the quantity (Q' 1 - Q'o) would be released from storage. In this year noexports is allowed regardle-s of the export price. If the amount in storagedoes not suffice to supplement supply up to q'l, the government has theoption of impo-ting the extra amount needed by subsidizing imports accordingto the difference between the import price (P in the figure) and theconsumers' price k?S).
Figure A2: STORAGE. PROCUREMENT AND SUBSIDY
p,.~~~ I Ip- - -r-77 7
_ _ _ _ _ _ I \_ _ _
I I i0 I
Q2 Qo B. Guam,>
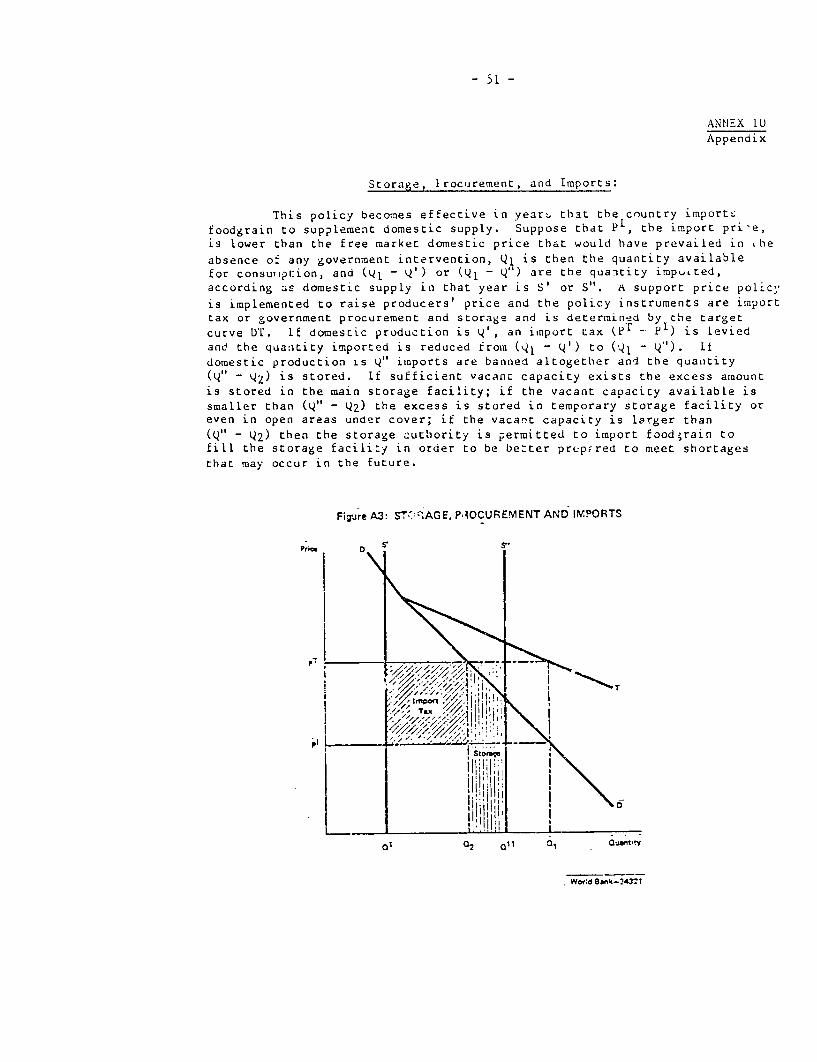
- 51 -
ANtNEX 10Appendix
Storage, Lrocurement, and Imports:
This policy becomes effective in yearw. that the country import_
foodgrain to sup?lement domestic supply. Suppose that Pi, the import pri-e,is lower than the free market domestic price that would have prevailed in Lhe
absence o' any government intervention, Ql is then the quantity available
for consumig1;ion, and 04I - Q') or Ql ") are the quantity impu.ted,
according as domestic supply in that year is S' or S". A support price policy
is implemented to raise producers' price and the policy instruments are import
tax or government procurement and storage and is deternined by the target
curve Dl'. lf domestic production is k', an import tax (pi _ pI) is levied
and the quantity imported is reduced troim (, - ') to (l - `') ifi
domestic production is y" imports are banned altogether and the quanitity
N" - 14) is stored. If sufficient vacant capacity exists the excess amount
is stored in the main storage facility; if the vacant capacity available is
smaller than (W" - Q2) the excess is stored in temporary storage facility oreven in open areas under cover; if the vacant capacity is larger than
0" - Q2) then the storage authority is permitted to import food,rain tofill the storage facility in order to be be_ter prup,red to meet shortages
that may occur in the future.
Fi7Jre A3: ST.:"AGE, P-OCUREMENT AND IMPORTS
tZ/ 4 <5 s ttot
T
World BwIk-24321
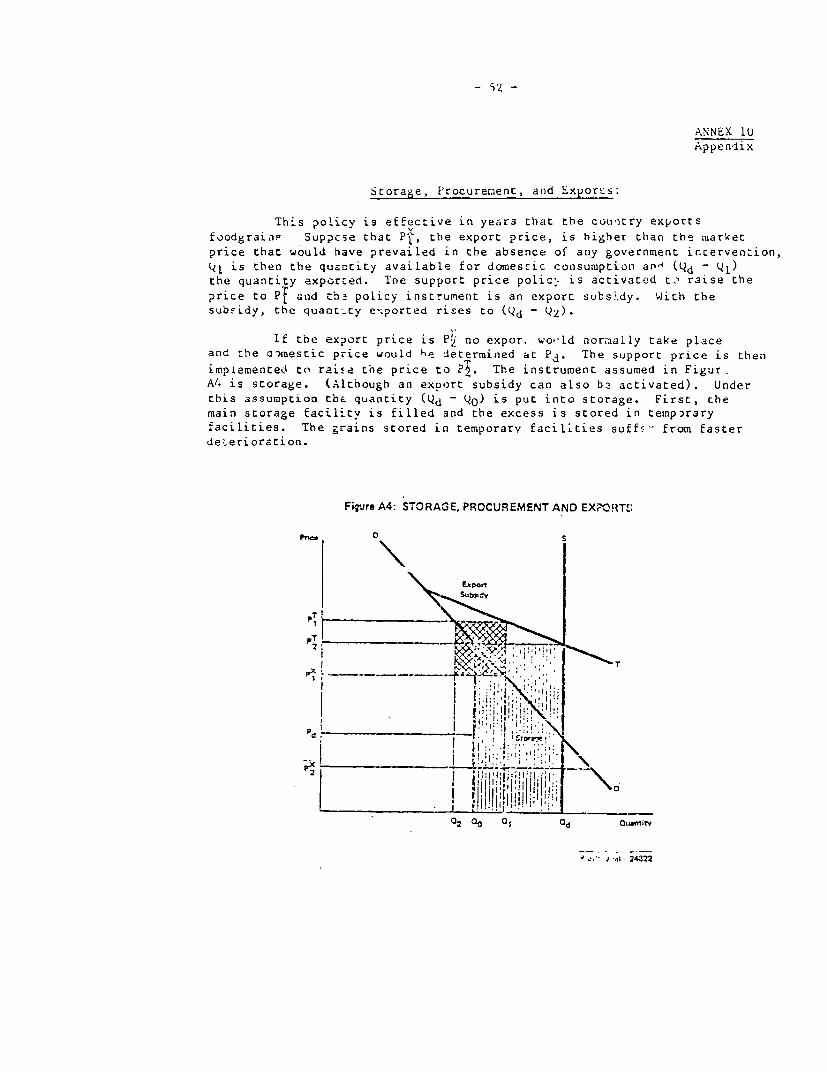
ANNEX lUAppendix
Storage, Erocureraent, and Expor s:
This policy is effective in years thiat the couintry exportsfoodgraiao Suppcse that Pi, the export price, is higher than the marketprice that would have prevailed in the absence of any government incervenzion,R1 is then the quantity available for domestic consumption anI, (Qd - Qthe quantity exported. Tne support price polic, is activated to raise theprice to PTI and cb! policy instrumenit is an export subsidy. With thesubridy, the quaot:cy e:'ported rises to (Qd - Q2)
If the export price is P; no expor. wolld normally take placeand the armestic price would hp determined at Pd. The support price is thenimplemented to raise the price to Pt. The instrument assumed in FigurA4 is storage. (Although an export subsidy can also be activated). Underthis assumption tbe quantity (Qd - qO) is put into storage. First, themain storage facility is filled and the excess is stored in temppraryfacilities. The grains stored in temporarv facilities suffz-- from fasterde erioration.
Fi7Jre A4: STORAGE, PROCUREMENT AND EXRORTS
Przcs 0 S
SuJbtdy
PT~~~~~~~~~~~~~~~~
2 1
.. .
02~~~~~~~~ A' -l ad .L-as
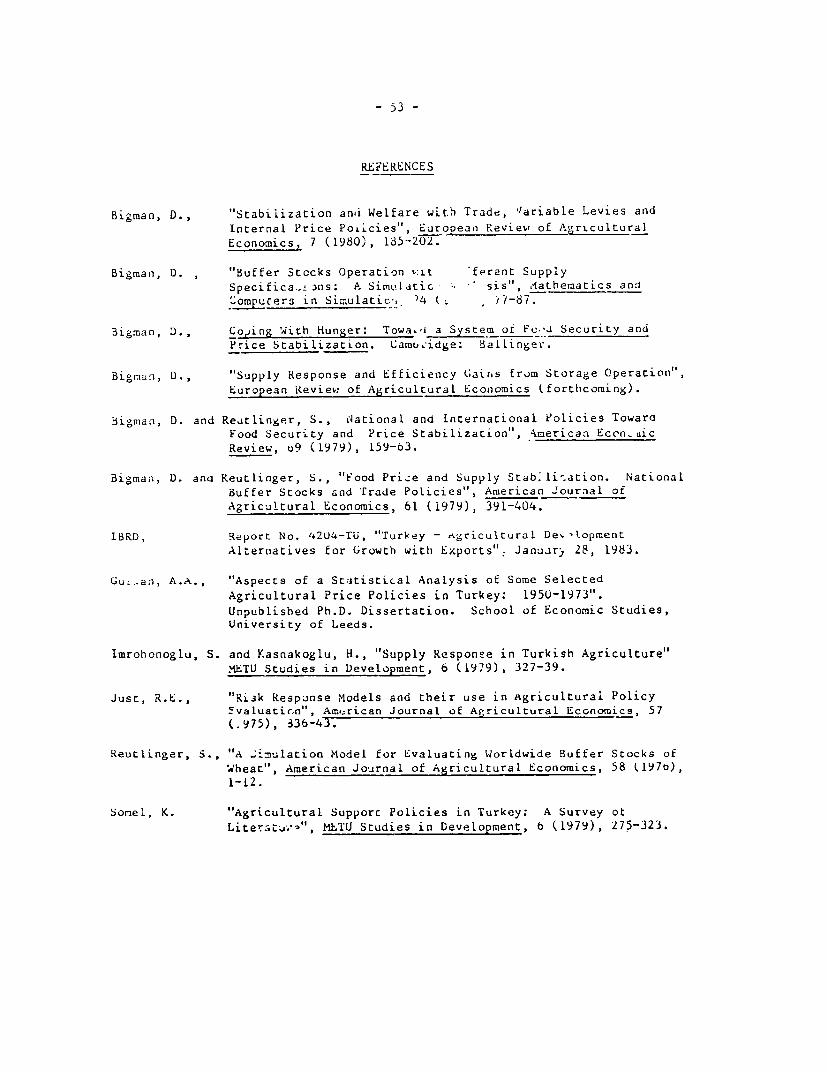
- 53 -
REFERENCES
Bigman, D., "Stabilization and Welfare with Trade, '"ariable Levies andInternal Price PoLicies", European Review of AgriculturalEconomics, 7 (1980), 185-202.
Bigman, D. , "Buffer Stccks Operation ,:Lt 'ferant SupplySpecifica. ns: A Simuldtic - sis", ,athematics andSompucers in Simulaticn 74 (, 7/-87.
Bigman, D., Coding With Hunger: Towa~'i a System of Fo-J Security andPrice Stabilization. Camu.idge: BalLinger.
Bigman, D., "Supply Response and Efficiency (;airns from Storage Operation",European Review of Agricultural Economics (forthcoming).
3igman, D. and Reutlinger, S., e4ational and International Policies TowaraFood Security and Price Stabilization", American Ecen.uicReview, u9 (1979), 159-63.
Bioman, D. ana Reutlinger, S., "Food Price and Supply Stab;li-ation. NationalBuffer Stocks and Trade Policies", American Journal ofAgricultural Economics, 61 (1979), 391-404.
IBRD, Report No. 42U4-TU, "Turkey - e.gricultural De'.kopmentAlternatives for Growth with Exports"; Januarj 28, 1983.
Gu...an, A.A., "Aspects of a St;atistical Analysis of Some SelectedAgricultural Price Policies in Turkey: 195U-1973".Unpublished Ph.D. Dissertation. School of Economic Studies,University of Leeds.
Imrohonoglu, S. and Kasnakoglu, H., "Supply Responee in Turkish Agriculture".METU Studies in Development, 6 (1979), 327-39.
Just, R.E., "Ri3k Respunse Models and their use in agricultural Policyfvaluatir,n", Am..rican Journal of Agricultural Economics, 57(.975), 336-43.
Reutlinger, S., "A S ulation Model for Evaluating Worldwide Buffer Stocks ofWheat", American Journal of Agricultural Economics, 58 (1970),1-12.
Somel, K. "Agricultural Support Policies in Turkey: A Survey otLiteratu.->", MkTU Studies in Development, 6 (1979), 275-323.

- 54 -
Figure 1: STAB.LIZING TRAV ?OLICIO:S
t T T
'.1 -- \-. I~
-~~~~~~~~~~~ ,~g' ..
Quanuty
World Sank-24;'16
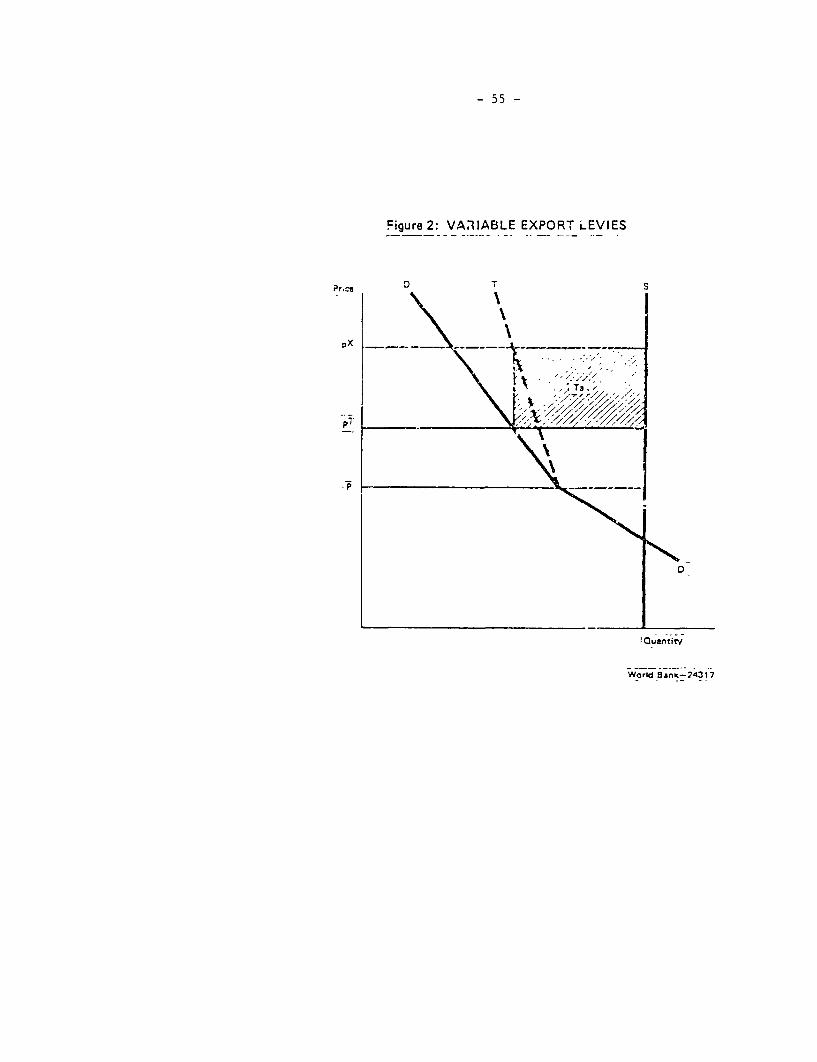
- 55 -
Figure 2: VARIABLE EXPORT LEVIES
Pr Oi T F-
I'
IQluantity
World 8ank-24317
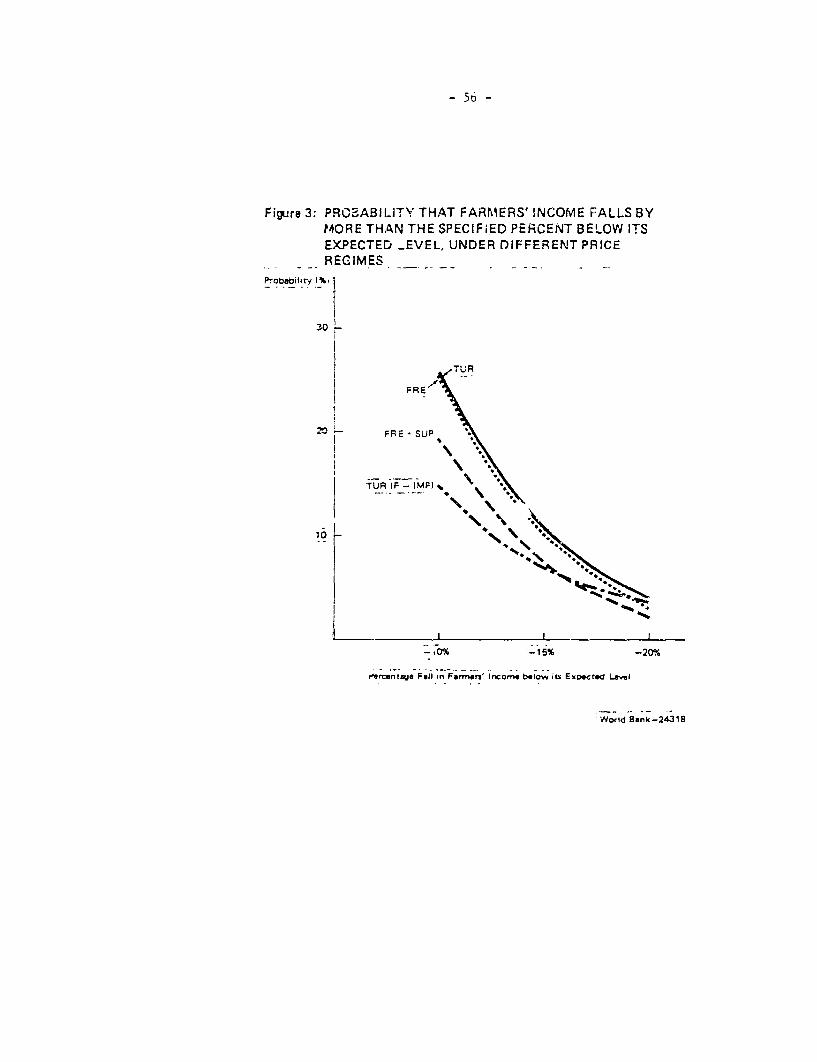
- 56 -
Figure 3: PROBABILITY THAT FARM1ERS' INCOME FALLS BYt?ORE THAN THE SPECIFIED PERCENT BELOW ITSEXPECTED _EVEL, UNDER DIFFERENT PRICEREGIMES
. ..obability 1%, "I
TUR
FRE
20 i FRE SUP *
! ~~\ X*
TUR (F-IMF) % .
-* 0% -125% -20%K
Hercentarje Fill In Farrme' Income below its Expected Level
'World Bank-24318
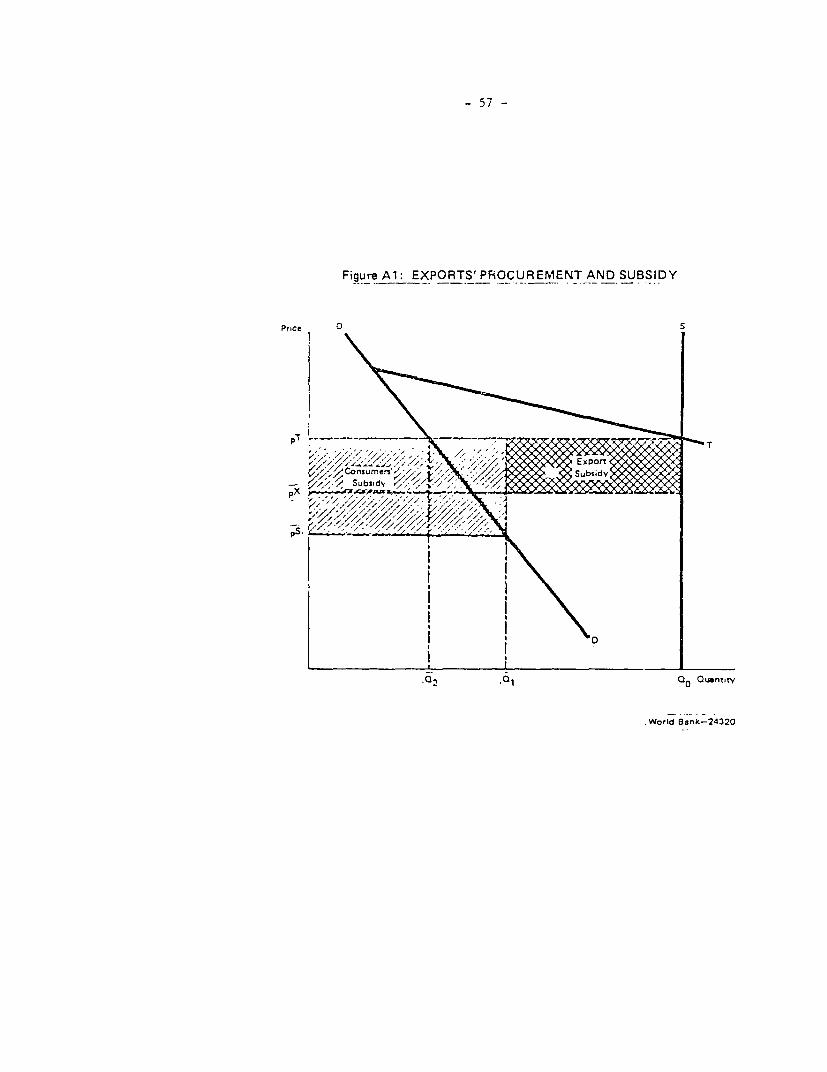
- 57 -
Figure Al: EXPORTS' PROCUREMENT AND SUBSIDY
'°2 °1 ~~~~~~~~~~00 Quanityr
.World ;3ank-24320

- 58 -
Figure A2: STORAGE, PROCUREMENT AND SUBSIDYr
PrIce
PT
Consumers' -. Subsidy l '
I j1 1
'01 1 , () 'QlQuantity:_ 0 _ _
World Bank-24319
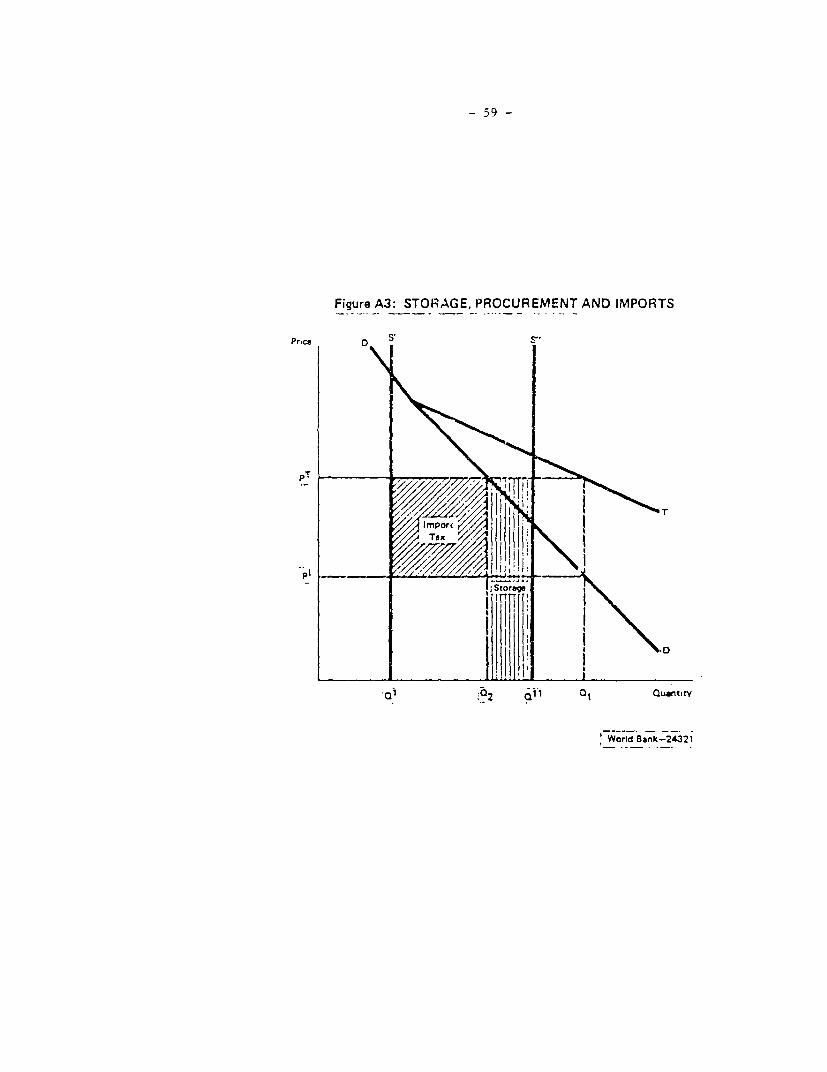
- 59 -
Figure A3: STORAGE, PROCUREMENT AND IMPORTS
Pt
Storae"
b.2 a*1 Quantiw
Word Bank-24321
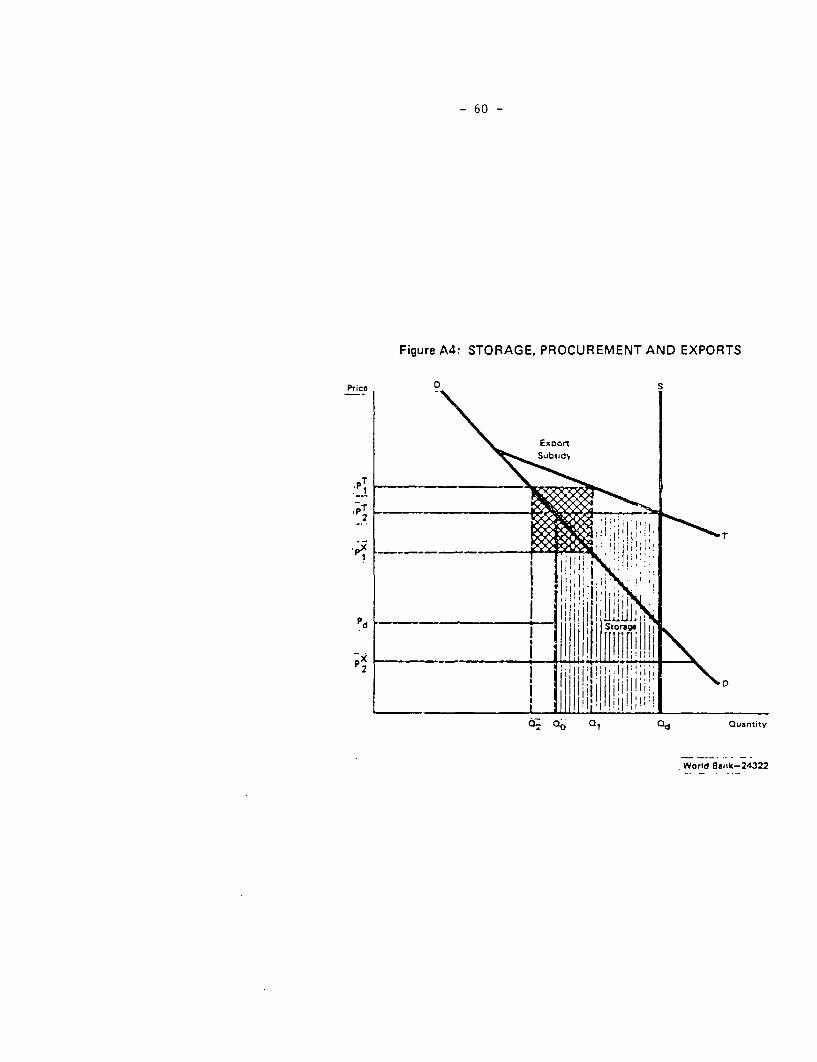
- 60 -
Figure A4: STORAGE, PROCUREMENT AND EXPORTS
PriCO XDn
Subsjds
P1P
PT~~~~~~~~~~~~~~~~
_; Storage1
2
a,%aO Q1 Qd Quantity
World Ba;nk-24322