turkey’s renewable power -...
TRANSCRIPT

2014
REPORT
ENG
THIS REPORT HAS BEEN
PREPARED WITH THE SUPPORT
OF EUROPEAN CLIMATE
FOUNDATION, IN COLLABORATION
WITH BLOOMBERG NEW ENERGY
FINANCE
TURKEY’S
RENEWABLE POWERAlternative Power Supply Scenarios for Turkey

WWF-TurkeyWWF-Turkey is the national offi ce of the World Wide Fund for Nature (WWF); one of the world’s oldest and foremost independent nature conservation organizations. WWF-Turkey’s history goes as far back as 1975, when its parent organization, Doğal Hayatı Koruma Derneği (DHKD) was founded. With over fi ve million supporters worldwide and an active presence in more than 100 countries, the mission of WWF is “to stop the degradation of the planet’s natural environment and to build a future in which humans live in harmony with nature. WWF-Turkey focuses its work on two main areas: nature conservation and the reduction of ecological footprint.
For more information, please visit www.wwf.org.tr adresini ziyaret edebilirsiniz.
BNEF (BLOOMBERG NEW ENERGY FINANCE)Bloomberg New Energy Finance (BNEF) provides unique analysis, tools and data for decision makers driving change in the en-ergy system. With unrivalled depth and breadth, we help clients stay on top of developments across the energy spectrum from our comprehensive web-based platform. BNEF has 200 staff based in London, New York, Beijing, Cape Town, Hong Kong, Munich, New Delhi, San Francisco, São Paulo, Singapore, Sydney, Tokyo, Washington D.C., and Zurich. BNEF products fi t your daily workfl ow, streamline your research, sharpen your strategy and keep you informed. BNEF’s sectoral products provide fi nancial, economic and policy analysis, as well as news and the world’s most comprehensive database of assets, investments, companies and equipment in the clean energy space. BNEF’s regional products provide a comprehensive view on the transformation of the energy system by region.
New Energy Finance Limited was acquired by Bloomberg L.P. in December 2009, and its services and products are now owned and distributed by Bloomberg Finance L.P., except that Bloomberg L.P. and its subsidiaries (BLP) distribute these products in Argentina, Bermuda, China, India, Japan, and Korea.
For more information on Bloomberg New Energy Finance:, visit http://about.bnef.com
Authors (Part 1: WWF-Turkey’s Policy Recommendations)Mustafa Özgür Berke (WWF-Turkey)
Authors (Part 2: BNEF Analysis)Michael Wilshire (Bloomberg New Energy Finance)Janis Hoberg (Bloomberg New Energy Finance)Itamar Orlandi (Bloomberg New Energy Finance)Harry Boyle (Bloomberg New Energy Finance)
ContributorsCeren Ayas (European Climate Foundation)Tolga Baştak (WWF-Turkey)Dr. Sedat Kalem (WWF- Turkey)Eren Atak (WWF- Turkey)Funda Gacal (WWF- Turkey)Öykü Şenlen (WWF- Turkey)
EditorsBerivan Dural (WWF- Turkey)Angus McCrone (Bloomberg New Energy Finance)
DesignTasarımhane Tanıtım Ltd. Şti.
PressOfset Yapımevi
This report was made possible by the generous support of European Climate Foundation.
The contents of this document cannot be reproduced without prior permission of WWF-Turkey© Texts and graphics: Bloomberg New Energy Finance and WWF-Turkey 2014All rights reserved.
WWF-TurkeyBüyük Postane cad. No:19 Garanti Han Kat:5Bahçekapı 34420 - İstanbul
Front cover photo: © Fatih Ünlü / Getty Images Turkey
ISBN: 978-605-9903-01-1

TURKEY’S
RENEWABLE POWER Alternative Power Supply Scenarios for Turkey


Foreword 5
PART I 7
CLIMATE CHANGE AND ENERGY POLICIES 9
WWF’s HIGHLIGHTS OF THE BNEF ANALYSIS 10
GREENHOUSE GAS EMISSIONS 15
RECOMMENDATIONS FOR CLEAN AND LOW-COST POWER
GENERATION IN TURKEY 171. Make Renewable Energy an Integral Part of Energy Supply Security 192. Put More Realistic and Ambitious Targets for Renewables 213. Improve Support Schemes for Renewable Energy Technologies 234. Phase out Fossil Fuel Subsidies / Start with Coal 255. Energy Finance Needs to Prioritize Renewable Energy Projects over Thermal Power Projects 276. Renewable Energy Should Be an Integral Part of Industrial Policies 297. Implement Effective Mechanisms in Order to Meet Energy Effi ciency Targets 318. Implement Robust Environmental Impact Assessment Processes in Thermal Power Plants 339. We Are Running out of Time. Now is the Time to Act. 35
RENEWABLE ENERGY AND NATURE CONSERVATION 36Hydropower 36Wind Energy 37Solar Energy 37
PART 2: BNEF ANALYSIS (BNEF FULL REPORT) 39
Contents
Çan
akka
le ©
Sua
t Gür
sözl
ü
4 TURKEY’S RENEWABLE POWER Alternative Power Supply Scenarios for Turkey
BY 2030, TURKEY
CAN MEET ALMOST
50% OF ITS POWER
DEMAND FROM
RENEWABLE ENERGY
SOURCES

5TURKEY’S RENEWABLE POWER Alternative Power Supply Scenarios for Turkey
With one of the most dynamic energy markets in the world, Turkey is at a critical crossroads. Decisions to be made today on how the ever increasing energy and power demand is going to be met -together with their economic, environmental and social implications- will shape the next 30 years.
We all agree on the ultimate goal of Turkey’s energy policies: To ensure energy supply security. In other words, we aspire to meet the power demand that is rising in parallel to Turkey’s economic growth, while we reduce the country’s dependence on fuel imports. The general opinion dictates that the only option before Turkey in its efforts to achieve these goals is to prioritize coal -both domestically extracted and imported-, ignoring the risks it poses in terms of climate change, public health and even labor safety.
The critical question for WWF-Turkey is as follows: Is it possible to ensure both environmental sustainability and a cleaner, cost-comparative energy mix, while progressing towards the goal of suffi cient and secure energy provision? We know that an affi rmative answer will be a game-changer.
In this study, we sought answers to these questions through the analysis commissioned to Bloomberg New Energy Finance (BNEF) and funded by the European Climate Foundation (ECF). The scenario analysis, which is based on informed assumptions on costs and capacity factors of renewable energy technologies and expected progress in energy effi ciency, states the following:
By 2030, Turkey can meet almost 50% of its power demand from renewable energy resources; mainly solar, wind and hydropower. A renewables-based energy strategy could be cost-comparable to a coal-based strategy. Moreover, a renewables-based strategy could allow Turkey to anchor its GHG emissions from power generation slightly above current levels and limit the pressure on its foreign trade balance.
The Electricity Market Law aims at suffi cient, high-quality, uninterrupted, cost-effi cient and environmentally friendly supply of power to consumers. With its fi ndings that point to these targets, we hope that our analysis will serve as a useful reference tool for policymakers.
Uğur BayarChairman of the Board of Directors WWF-Turkey
FOREWORD

6 TURKEY’S RENEWABLE POWER Alternative Power Supply Scenarios for Turkey

7TURKEY’S RENEWABLE POWER Alternative Power Supply Scenarios for Turkey
© G
loba
l War
min
g Im
ages

8 TURKEY’S RENEWABLE POWER Alternative Power Supply Scenarios for Turkey
IN ORDER TO STAY BELOW 2°C
GLOBAL WARMING, 2/3 OF ALL
PROVEN FOSSIL FUEL RESERVES
MUST BE LEFT UNDERGROUND
Not
tingh
amsh
ire, İ
ngilt
ere
© G
loba
l War
min
g Im
ages
/ W
WF
-Can
on

9TURKEY’S RENEWABLE POWER Alternative Power Supply Scenarios for Turkey
1 IPCC, 2014, 5th Assessment Report, Working Group III Report: “Mitigation of Climate Change”, http://mitigation2014.org/report/summary-for-policy-makers2 IEA 2013. CO2 Emissions From Fuel Combustion (2013 Edition)3 “Turn Down The Heat: Why a 4°C World Must be Avoided”, World Bank, 20124 IPCC, 2014, 5th Assessment Report, Working Group II Report: “Climate Change 2014: Impacts, Adaptation, and Vulnerability”, http://ipcc-wg2.gov/AR5/images/uploads/IPCC_WG2AR5_SPM_Approved.pdf5 IEA, World Energy Outlook 20126 http://www.guardian.co.uk/environment/2011/nov/09/fossil-fuel-infrastructure-climate-change
CLIMATE CHANGE AND ENERGY
POLICIES5th Assessment Report of the Intergovernmental Panel on Climate Change (IPCC) concluded that it is extremely likely that human infl uence has been the dominant cause of the observed warming. IPCC further underlined that two thirds of GHG emissions since the industrial revolution have resulted from fossil fuel combustion and cement production1.
Coal accounts for 29% of global primary energy demand. On the other hand, due to its high carbon content per unit of energy released, it is responsible for 44% of global CO2 emissions2.
Climate scientists contend that, in order to have a fair chance to avoid devastating impacts of climate change, the rise in average temperatures compared to pre-industrial levels should be limited to 2°C. However, Earth’s temperature has already increased 0.9°C since 1900. Should emissions continue to increase at this rate, the rise in global average temperatures is expected to be 4°C in 20603, and 6°C by the end of the century4.
IPCC urges swift and signifi cant emission cuts as well as structural changes in the global energy sector to meet the 2°C target. Accordingly, the share of low-carbon energy supply should exceed 90% by 2050. The International Energy Agency (IEA) asserts that two thirds of global fossil fuel reserves should be left underground in order to be able to limit temperature increase to 2°C5. The IEA concludes that unless a structural transition towards clean energy and low-carbon technologies is initiated by 2017, today’s dependency on fossil fuel infrastructure will render it much harder and costly to meet energy security and climate targets of tomorrow6.
Climate scientists and energy experts agree on this simple fact: In order to avoid the devastating impacts of climate change, scaling up the share of renewables in both primary energy and power demand should be the top-priority policy option.
0.9°C
6°C
INCREASE IN AVERAGE GLOBAL
TEMPERATURES SINCE INDUSTRIAL
REVOLUTION
THE WORLD IS EN ROUTE TO 6°C OF
GLOBAL WARMING

10 TURKEY’S RENEWABLE POWER Alternative Power Supply Scenarios for Turkey
Turkey’s energy market is going through a rapid change. Over the last decade, power demand has grown by 70%; this is a trend that is expected to continue. Turkish government is compelled to make critical decisions: on the one hand it has to meet the power demand, on the other it has to minimize dependency on energy imports. Turkey’s current energy strategy and policies aim to utilize primarily coal, secondarily nuclear and fi nally renewable energy sources.
WWF-Turkey commissioned Bloomberg New Energy Finance (BNEF) to provide an analysis on alternative scenarios through which Turkey can meet its power demand until 2030. BNEF has provided three alternative scenarios and analyzed the impacts of each scenario on capital expenditures, O&M costs (including fuel) as well as Turkey’s overall balance of trade and GHG emissions:
(i) Offi cial Plan: This scenario depicts the offi cial targets for increase in power demand, the installed capacity targets for coal, nuclear and renewable energy sources for 2023, as well as the offi cial power demand and electricity mix projections for year 2030.
(ii) Business-as-Usual (BAU) Scenario: This scenario makes mainstream projections on how power demand and supply will evolve in Turkey by 2030 on the basis of the current conditions of the electricity market and sector, existing policy outlook and capacity pipeline.
(iii) Renewables Development Pathway (RDP) Scenario: The projections under this scenario are based on the assumption that by 2030, wind and solar will take on the dominant role, which is now played by natural gas and will be played by coal in the future by virtue of existing policies.
The main fi ndings of the analysis are as follows:
Power DemandAccording to the offi cial projections, energy demand in 2030 will reach 620 TWh - nearly 2.5 times today’s level. According to BNEF estimates, the increase in power demand will be limited to 93%. Under the BAU Scenario, power demand will reach 462 TWh by 2030, 25% less than offi cial projections.
The RDP scenario, meanwhile, indicates that the rate of increase in power demand will be 0.15 percentage points lower than the BAU scenario, thanks to enhanced energy effi ciency. These relatively lower expectations are based on the view that, as in other European economies, economic growth and increased welfare will lead to a decline in the rate of increase of power demand in Turkey.
WWF’S HIGHLIGHTS OF
THE BNEF ANALYSIS
70%RISE IN TURKEY’S POWER DEMAND
THROUGHOUT THE LAST DECADE
25%ACCORDING TO BNEF
PROJECTIONS, POWER DEMAND IN 2030 WILL
BE 25% LOWER THAN OFFICIAL PROJECTIONS
11TURKEY’S RENEWABLE POWER Alternative Power Supply Scenarios for Turkey
19 GW
3.3 GW
ADDITIONAL COAL CAPACITY, WHICH IS EXPECTED TO COME ON LINE UNDER THE
BUSINESS AS USUAL SCENARIO
ADDITIONAL COAL CAPACITY TO COME
ON LINE UNDER THE RENEWABLES
DEVELOPMENT PATHWAY SCENARIO
2014 2018 2022 2026 2030
Source: Bloomberg New Energy Finance
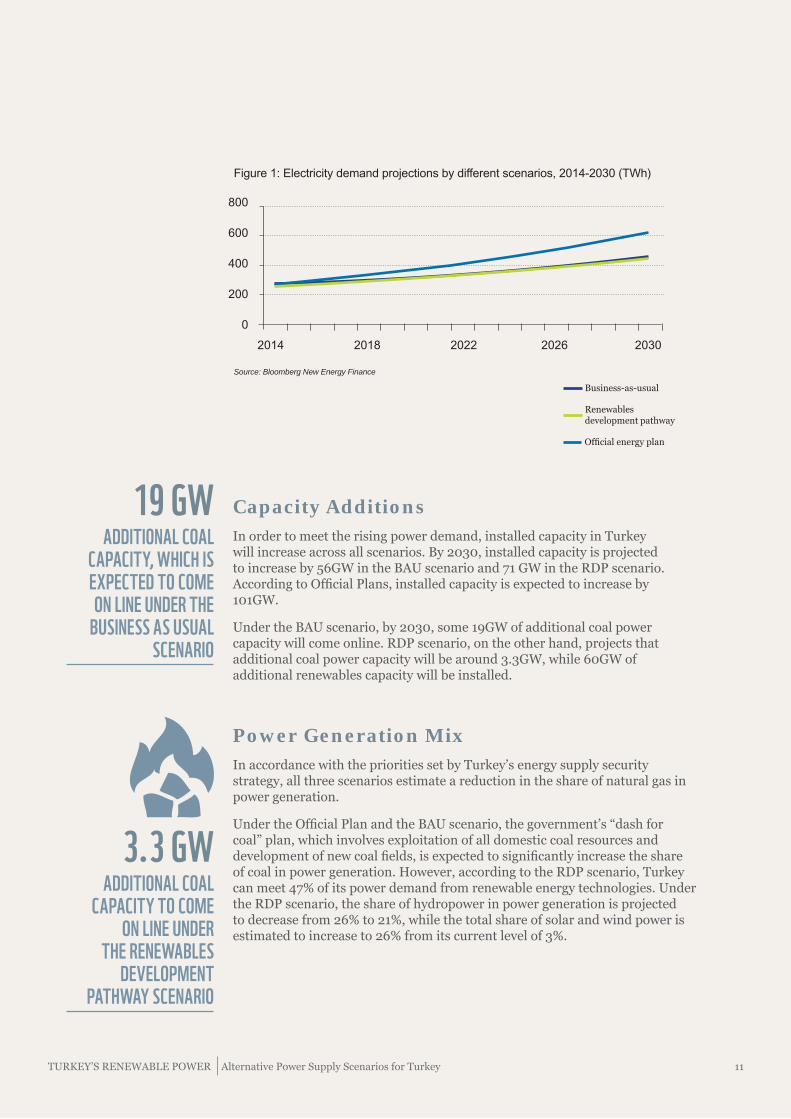
Capacity AdditionsIn order to meet the rising power demand, installed capacity in Turkey will increase across all scenarios. By 2030, installed capacity is projected to increase by 56GW in the BAU scenario and 71 GW in the RDP scenario. According to Offi cial Plans, installed capacity is expected to increase by 101GW.
Under the BAU scenario, by 2030, some 19GW of additional coal power capacity will come online. RDP scenario, on the other hand, projects that additional coal power capacity will be around 3.3GW, while 60GW of additional renewables capacity will be installed.
Power Generation MixIn accordance with the priorities set by Turkey’s energy supply security strategy, all three scenarios estimate a reduction in the share of natural gas in power generation.
Under the Offi cial Plan and the BAU scenario, the government’s “dash for coal” plan, which involves exploitation of all domestic coal resources and development of new coal fi elds, is expected to signifi cantly increase the share of coal in power generation. However, according to the RDP scenario, Turkey can meet 47% of its power demand from renewable energy technologies. Under the RDP scenario, the share of hydropower in power generation is projected to decrease from 26% to 21%, while the total share of solar and wind power is estimated to increase to 26% from its current level of 3%.
800
600
400
200
0
Figure 1: Electricity demand projections by different scenarios, 2014-2030 (TWh)
Business-as-usual
Renewables development pathway
Offi cial energy plan
12 TURKEY’S RENEWABLE POWER Alternative Power Supply Scenarios for Turkey
Source: Bloomberg New Energy Finance
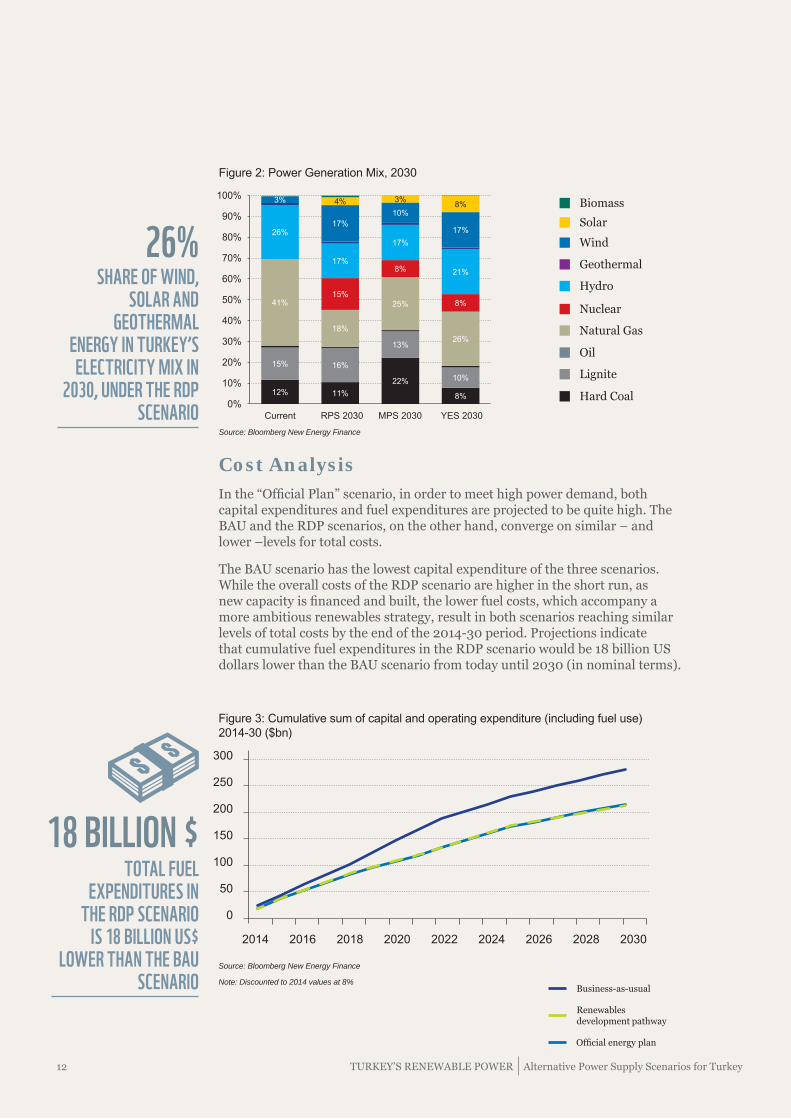
Figure 2: Power Generation Mix, 2030
12% 11%
22%
8%
15% 16%
13%
10%
41%
18%
25%
26%
15%
8%
8%
26%
17%
17%
21%
3%
17%10%
17%
4% 3%8%
0%
10%
20%
30%
40%
50%
60%
70%
80%
90%
100%Biomass
Solar
Wind
Geothermal
Nuclear
Natural Gas
Oil
Lignite
Hard Coal
Hydro
Current RPS 2030 MPS 2030 YES 2030
26%SHARE OF WIND,
SOLAR AND GEOTHERMAL
ENERGY IN TURKEY’S ELECTRICITY MIX IN
2030, UNDER THE RDP SCENARIO
18 BILLION $TOTAL FUEL
EXPENDITURES IN THE RDP SCENARIO
IS 18 BILLION US$ LOWER THAN THE BAU
SCENARIO
2014 2016 2018 2020 2022 2024 2026 2028 2030
300
250
200
150
100
50
0
Figure 3: Cumulative sum of capital and operating expenditure (including fuel use) 2014-30 ($bn)
Source: Bloomberg New Energy Finance
Note: Discounted to 2014 values at 8%
Cost AnalysisIn the “Offi cial Plan” scenario, in order to meet high power demand, both capital expenditures and fuel expenditures are projected to be quite high. The BAU and the RDP scenarios, on the other hand, converge on similar – and lower –levels for total costs.
The BAU scenario has the lowest capital expenditure of the three scenarios. While the overall costs of the RDP scenario are higher in the short run, as new capacity is fi nanced and built, the lower fuel costs, which accompany a more ambitious renewables strategy, result in both scenarios reaching similar levels of total costs by the end of the 2014-30 period. Projections indicate that cumulative fuel expenditures in the RDP scenario would be 18 billion US dollars lower than the BAU scenario from today until 2030 (in nominal terms).
Business-as-usual
Renewables development pathway
Offi cial energy plan

13TURKEY’S RENEWABLE POWER Alternative Power Supply Scenarios for Turkey
BNEF analysis points out that the estimated decline in the levelized cost of energy (LCOE) pertaining to solar and wind power technologies is the driving force behind the long-term cost effectiveness of the RDP scenario.
According to BNEF fi gures, the LCOE for an onshore wind project in Turkey is currently around $120/MWh. By 2030, it is estimated that the LCOE of a similar project should fall into the $60 to $80 per MWh range, on average below the current $73-116 per MWh LCOE for coal.
In a similar vein, it is projected that the LCOE for a ground-mounted solar project will decrease from $150/MWh to $85-120/MWh by 2030.
BNEF analysis indicates that, in the medium to long term, the levelized costs of power generation from solar and wind power – excluding social, environmental and societal externalities – may become comparable to the costs of fossil fuels in Turkey.
0 50 100 150 200 250 300 350
Biomass (Global)
Solar (Europe)
Wind (Turkey specifi c)
Geothermal (Global)
Nuclear (Global)
Natural Gas (Europe)
Lignite (Turkey specifi c)
Hard Coal (Turkey specifi c)
Hydro (Global)
Source: Bloomberg New Energy Finance
Note: Some developers of solar and wind projects in Turkey have LCOEs at the low end of this range, while hard coal and lignite LCOEs could equally be at the high end of our range. BNEF has however elected to continue using an internal methodology for all these technologies, which it has built and refi ned in the last decade.
Figure 4: Levelized cost of electricity for various technologies in Europe, Turkey and globally, 2014 ($ / MWh)
60-80 $/MWHBY 2030, LCOE OF
AN ONSHORE WIND PROJECT IS EXPECTED
TO FALL INTO $60-$80/ MWH RANGE, ON
AVERAGE BELOW THE LCOE FOR COAL

14 TURKEY’S RENEWABLE POWER Alternative Power Supply Scenarios for Turkey
© G
loba
l War
min
g Im
ages
/ W
WF
-Can
on
TURKEY COULD
STABILIZE GHG
EMISSIONS FROM
THE POWER SECTOR
WITHIN THE NEXT
FIVE YEARS

15TURKEY’S RENEWABLE POWER Alternative Power Supply Scenarios for Turkey
Currently, annual GHG emissions of Turkey from the power sector stand around 110 million tons CO2 equivalent (mtCO2e). Under BNEF’s BAU scenario, it is expected that the upward trend since 1990 will continue and the GHG emissions from the power sector will almost double to over 200 million tons per annum by 2030, as a result of intensifying coal consumption.
BNEF analysis indicates that, under a renewables-based strategy, power sector emissions will continue to rise slowly in the next fi ve years, but will remain constant from that time onwards at around 120 mtCO2e. The difference between two alternative scenarios corresponds to one fi fth of Turkey’s current total emissions per annum.
When the projected stabilization of emissions is combined with the results of the cost analysis, an alternative path for Turkey becomes visible: Turkey could stabilize GHG emissions from the power sector in the next fi ve years. The expected decline in the costs of wind and solar technologies means that such an alternative can be achieved at a comparable cost to coal oriented policies.
Turkey’s EmissionsFrom 1990 till 2012, Turkey’s GHG emissions rose by 133%. Within the same period, emissions from public electricity and heat production increased by 286%. Carbon intensity of Turkey’s power generation is above OECD and EU averages. In other words, Turkey emits more CO2 per kWh electricity generated.
GREENHOUSE GAS EMISSIONS
Source: Bloomberg New Energy Finance
150
50
100
200
250
02000 2004 2008 2012 2016 2020 2024 2028 2030
Figure 5: Annual power sector CO2e emissions, 2000-30 (Million tons of CO2equivalent)
Business-as-usual Renewables development pathway Offi cial energy plan

16 TURKEY’S RENEWABLE POWER Alternative Power Supply Scenarios for Turkey
© G
loba
l War
min
g Im
ages
/ W
WF
-Can
on

17TURKEY’S RENEWABLE POWER Alternative Power Supply Scenarios for Turkey
50%
RECOMMENDATIONS FOR
CLEAN AND LOW-COST POWER
GENERATION IN TURKEY Bloomberg New Energy Finance’s analysis indicates that by 2030, Turkey could meet almost half of its power demand from renewable energy sources. An energy strategy designed towards this target could be cost comparable to coal-dependent strategies. In addition, the analysis points out that by employing a renewables-oriented strategy, it is possible to stabilize power sector emissions at levels slightly higher than the current levels.
BNEF analysis shows that deployment of renewable energy can help halt the increase in natural gas imports, while an increase in the share of domestically manufactured renewable energy technologies might have a positive impact on the balance of trade. When various externalities are factored in, the cost difference between the renewable energy and its coal-dependent alternatives become more apparent in favor of renewables. In the event that a carbon price and more stringent emissions criteria for power plants are instituted as a consequence of Turkey’s prospective EU membership or of international climate negotiations, Renewables Development Scenario could turn out to be more cost-effective.
WWF-Turkey’s policy recommendations for a transformation that shall serve both economic and ecological sustainability are as follows:
TURKEY’S RENEWABLE ENERGY TARGET FOR
2030 SHOULD BE 50%
18 TURKEY’S RENEWABLE POWER Alternative Power Supply Scenarios for Turkey
Am
bles
ide,
İngi
ltere
© G
loba
l War
min
g Im
ages
/ W
WF
-Can
on

19TURKEY’S RENEWABLE POWER Alternative Power Supply Scenarios for Turkey
1. Make Renewable Energy an Integral Part of Energy Supply Security Energy security may be defi ned as resilience to disruptions in energy supply. In Turkey, supply security discussions focus mostly on the availability of energy resources. Turkey’s import dependency in primary energy stands at 75%. 98.6% of country’s natural gas7, 93% of oil and 92% of hard coal8 consumption is derived from imports. This puts Turkey in a vulnerable position in the face of price fl uctuations and probable supply disruptions in the import of fossil fuels due to political, logistical or other reasons.
For Turkey, achieving the twin goals of satisfying increasing power demand and reducing fuel import dependency is crucial to sustaining economic growth without increasing dependence on natural gas imports. “Energy imports” is the item that has the most negative impact on the current account defi cit of Turkey, and the share of the power sector in energy imports is around 40%9. According to BNEF analysis, should a renewables-oriented path be adopted, it is possible to reduce cumulative fuel expenses by $US 18 billion compared to the BAU scenario between 2014 and 2030.
According to the Ministry of Energy and Natural Resources, Turkey’s installed capacity potential for hydropower, wind and geothermal are 36 GW, 48 GW and 2 GW, respectively. The country’s solar energy potential is calculated as 380 billion kWh of electricity per annum, while its biomass potential is 1.3 billion kWh of electricity per annum.
Renewable energy could be the main building block for Turkey to maintain supply security in power generation. Turkey is a resource-rich country in renewable energy resources and the costs associated to renewable energy technologies are gradually decreasing. Seizing this opportunity and supporting it with sound targets and policy tools could render it possible for Turkey to limit the increasing use of imported coal and natural gas in power generation.
>90%98.6% OF TURKEY’S
NATURAL GAS, 93% OF OIL AND 92% OF HARD COAL
CONSUMPTION IS DERIVED FROM IMPORTS
7 Energy Market Regulatory Authority of the Republic of Turkey, 2013, Natural Gas Market Sector Report 8 Energy Market Regulatory Authority of the Republic of Turkey , 2014, Hard Coal Market Sector Report9 Central Bank of the Republic of Turkey, Balance of Payments Report 2013-II, http://www.tcmb.gov.tr/research/odemeler/ODRapor_20132.pdf

20 TURKEY’S RENEWABLE POWER Alternative Power Supply Scenarios for Turkey
Yor
kshi
re, İ
ngilt
ere
© G
loba
l War
min
g Im
ages
WW
F-C
anon

21TURKEY’S RENEWABLE POWER Alternative Power Supply Scenarios for Turkey
3.000 MWTURKEY’S SOLAR
POWER INSTALLED CAPACITY TARGET FOR
202310 Unlicensed Electricity Generation Association’s website, http://www.lisanssizelektrik.org/lisanssiz-elektrik-uretimi-basvurulari/
3.000 MWTURKEY’S CURRENT
WIND POWER INSTALLED CAPACITY
2. Put More Realistic and Ambitious Targets for Renewables In 2013, renewables accounted for 29% of Turkey’s power generation. The target for 2023 is to increase the share of renewables in power generation to 30%. Toward this end, Turkey intends to utilize all technically and economically feasible hydropower capacity (around 36GW) and reach 20GW wind, 3GW solar and 600MW geothermal installed capacity.
The Bloomberg New Energy Finance analysis indicates that by 2030, Turkey could generate 47% of its power from renewables. For achieving this target, installed capacity of wind and solar power should be substantially increased. BNEF envisages that by 2030, installed capacity of solar power and wind power could reach 24GW and 27 GW, respectively.
Energy policies in Turkey should focus on the concurrent enhancement of renewables. “50% renewables in power generation by 2030” should be the new minimum target. This shall serve as a powerful message to investors, encouraging them to allocate required funds for investments in renewable energy technologies, particularly wind and solar.
Wind
Despite arguably low FiTs (feed in tariff), wind power capacity in Turkey has been displaying a steady growth for the last 9 years. Since 2009, annual wind capacity additions amounted to around 500MW, as a result of which, total installed capacity has exceeded 3,000MW. However, given the current rate of development, 20GW (20,000 MW) installed capacity target in 2023 seems out of reach. According to BNEF’s Renewables Development Pathway (RDP) Scenario, total wind capacity may rise to 14 GW in 2023 and 27GW in 2030.
Solar
Given the solar energy potential of the country, Turkey’s targets for solar power are considerably unambitious. Solar installed capacity target for 2023 is only 3GW – by comparison Germany has 32GW and Italy has 16GW online. According to BNEF, relatively lower levels of FiTs for solar power in Turkey may partly explain this difference. However, there are also various regulations that hold back the development of solar energy.
The fi rst round of license applications for power generation from solar energy was fi nalized in July 2013. While a cap of 600MW was set for solar power licenses, 496 applications -which amounted to a total of 7,873MW installed capacity- were fi led. It should be underlined that as of September 2014, 675 MW of unlicensed solar power generation applications have received positive evaluation from the regulatory authorities10. In a similar fashion with wind power, as a result of the decrease in the costs of solar generation, solar power is expected to scale up not thanks to the government incentives, but despite them.

22 TURKEY’S RENEWABLE POWER Alternative Power Supply Scenarios for Turkey
© G
loba
l War
min
g Im
ages
/ W
WF
-Can
on

23TURKEY’S RENEWABLE POWER Alternative Power Supply Scenarios for Turkey
3. Improve Support Schemes for Renewable Energy Technologies The designated strategy of Turkey to ensure supply security in electricity is based on fossil fuels. BNEF analysis demonstrates that in the long run, a policy path that increases the share of renewables is cost-comparable with a strategy based on fossil fuels.
Turkey’s supply security strategy and power market legislation need to be revised in a way that will refl ect this trend and prioritize renewable energy. FiT regimes for especially wind and solar power need to be improved by introducing higher prices and/or longer terms. These changes should provide a more favorable environment for investors and help secure fi nance for renewable energy projects.
Feed-in Tariffs
Turkey’s Renewable Energy Resources Support Mechanism (YEKDEM) was devised as a key tool to support the use of renewable energy sources in power generation. The feed-in tariffs stipulated by this mechanism only cover a period of 10 years11. This is shorter than the 15-year period implemented in many EU member states.
It should be noted that the FiTs for wind and geothermal power are also lower than those granted to the Russian contractor for the nuclear power plant project in Akkuyu, Mersin.
11 http://www.enerji.gov.tr/mevzuat/5346/5346_Sayili_Yenilenebilir_Enerji_Kaynaklarinin_Elektrik_Enerjisi_Uretimi_Amacli_Kullanimina_Iliskin_Kanun.pdf
LENGTH OF THE PERIOD, DURING WHICH, FITS
FOR RENEWABLES ARE APPLICABLE
10 YEARS
Technology Purchase Guarantee
Domestic Component Price
Incentives
Maximum Limit for Incentives
Hydroelectric power plant 7,3 2,3 9,6Wind energy power plant 7,3 3,7 11Photovoltaic power plant (PV) 13,3 6,7 20Concentrated Solar Power Plant (CSP)
13,3 9,2 22,5
Biomass power plant (landfi ll gas included)
13,3 5,6 18,9
Geothermal power plant 10,5 2,7 13,2
Table 1: Renewable Energy Feed-in Tariffs in Turkey (US $ cent/kWh)
24 TURKEY’S RENEWABLE POWER Alternative Power Supply Scenarios for Turkey
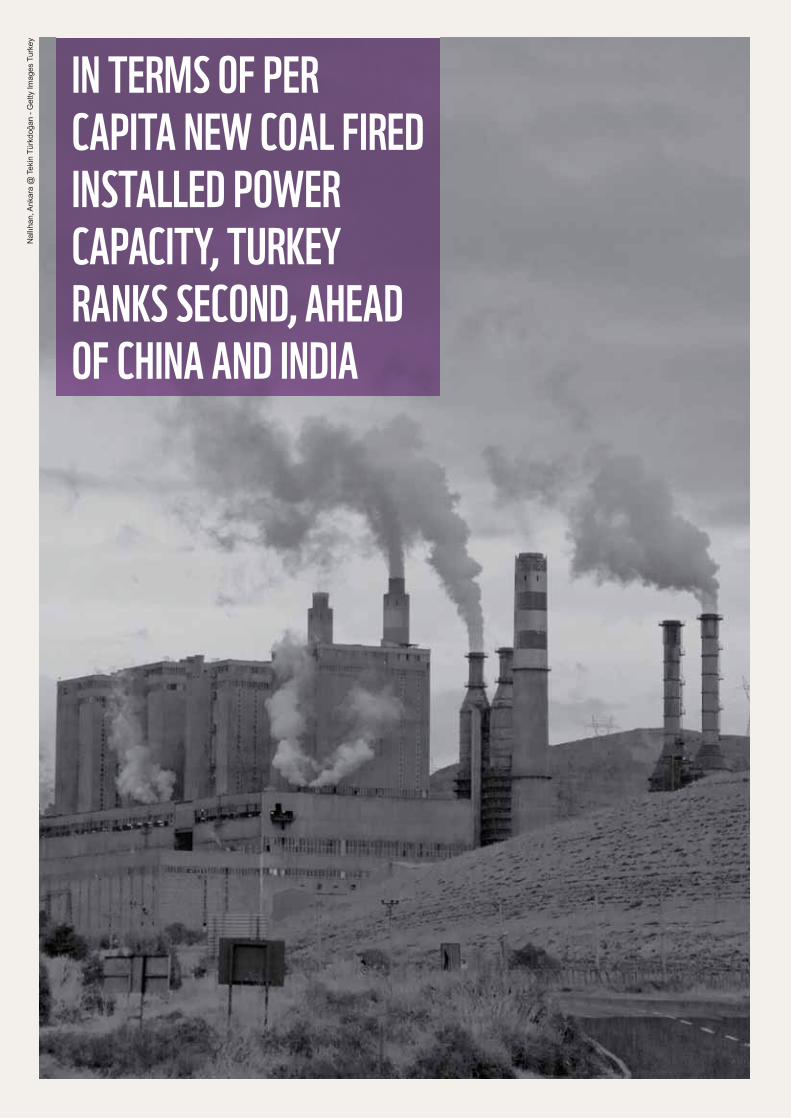
IN TERMS OF PER
CAPITA NEW COAL FIRED
INSTALLED POWER
CAPACITY, TURKEY
RANKS SECOND, AHEAD
OF CHINA AND INDIA
Nal
lıhan
, Ank
ara
@ T
ekin
Tür
kdoğ
an -
Get
ty Im
ages
Tur
key

25TURKEY’S RENEWABLE POWER Alternative Power Supply Scenarios for Turkey
4. Phase out Fossil Fuel Subsidies / Start with CoalThe Ministry of Energy and Natural Resources in Turkey is prioritizing coal-related objectives. Turkey has tremendous lignite reserves, estimated at approximately 14.1 billion tons. In the last nine years, some 5.8 billion tons were discovered after a fi ve-fold increase in prospecting work. The Ministry announced 2012 as the “Year of Coal”, while action towards implementation gained momentum in 2013. The government is currently developing policies to support a series of coal and lignite projects that will utilize domestic resources. There are 55 coal-fi red power plant projects in the pipeline, with a total installed capacity of 50,000MW. Turkey ranks 4th in terms of new installed coal power capacity following China, India, and Russia, while in terms of per capita new installed power capacity, it ranks second.
In Turkey, substantial subsidies are available for coal mining and coal based power generation. Investments in these fi elds are offered “Region 5” incentives, which is the second highest subsidy level under the new Investment Incentives Program that was introduced in 2012. Projects enjoy VAT and customs duties exemption, tax reductions, support for national insurance contribution of employer and land allocation.
According to International Monetary Fund (IMF) data, Turkey’s coal subsidies amounted to 1.9% of government revenues and to 0.66 % of its GDP in 201112.
Phasing out these subsidies could constitute the fi rst step in revealing the actual costs of fossil fuels. By allocating these funds to low-cost energy effi ciency and renewable energy projects, it may be possible to ensure both energy supply security and environmental sustainability.
Phase-out of fossil fuel subsidies is an item that was previously agreed at G-20 summits held by the largest 20 economies of the world. Turkey, the world’s 17th largest economy, will be hosting the G-20 Summit in 2015. This provides Turkey with the chance to place fossil fuel subsidies high on the summit agenda and assume the role of a global pioneer on the issue.
12 IMF, Energy Subsidy Reform: Lessons and Implications.
IN 2011, COAL SUBSIDIES IN TURKEY
AMOUNTED TO 1.9% OF GOVERNMENT
REVENUES
1.9%

26 TURKEY’S RENEWABLE POWER Alternative Power Supply Scenarios for Turkey
Nor
th R
hine
-Wes
tpha
lia, A
lman
ya ©
And
rew
Ker
r -
WW
F-C
anon
27TURKEY’S RENEWABLE POWER Alternative Power Supply Scenarios for Turkey
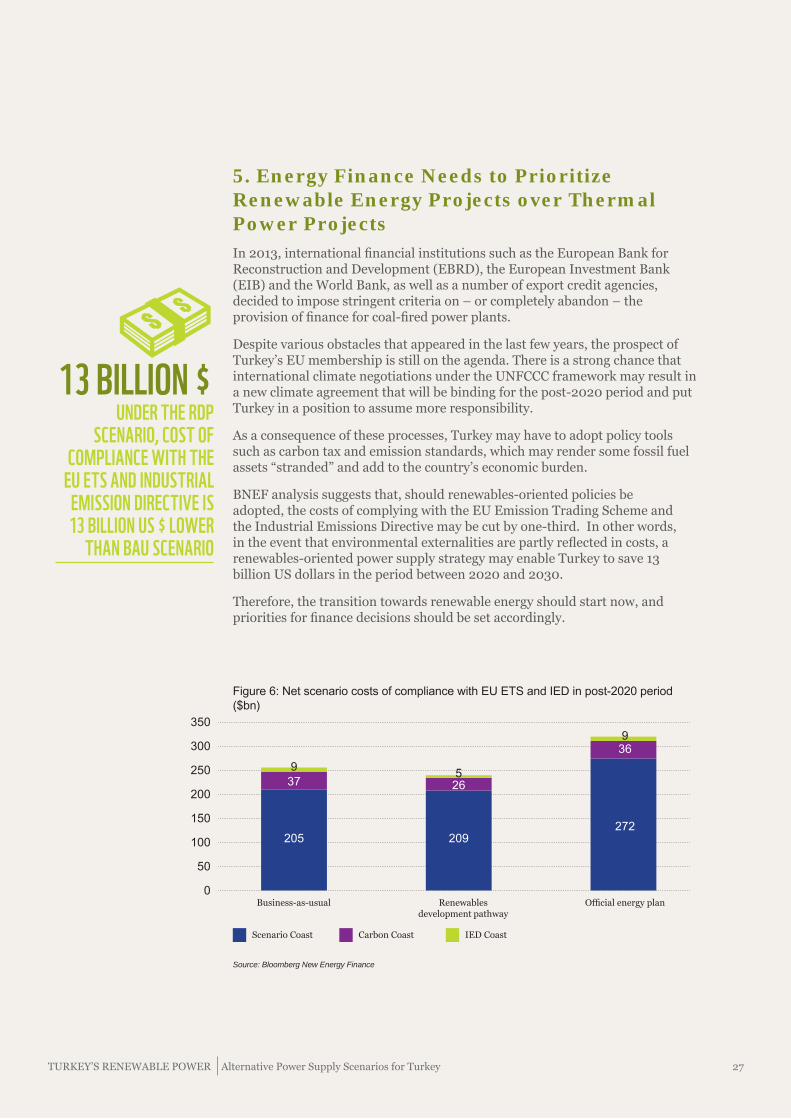
5. Energy Finance Needs to Prioritize Renewable Energy Projects over Thermal Power Projects In 2013, international fi nancial institutions such as the European Bank for Reconstruction and Development (EBRD), the European Investment Bank (EIB) and the World Bank, as well as a number of export credit agencies, decided to impose stringent criteria on – or completely abandon – the provision of fi nance for coal-fi red power plants.
Despite various obstacles that appeared in the last few years, the prospect of Turkey’s EU membership is still on the agenda. There is a strong chance that international climate negotiations under the UNFCCC framework may result in a new climate agreement that will be binding for the post-2020 period and put Turkey in a position to assume more responsibility.
As a consequence of these processes, Turkey may have to adopt policy tools such as carbon tax and emission standards, which may render some fossil fuel assets “stranded” and add to the country’s economic burden.
BNEF analysis suggests that, should renewables-oriented policies be adopted, the costs of complying with the EU Emission Trading Scheme and the Industrial Emissions Directive may be cut by one-third. In other words, in the event that environmental externalities are partly refl ected in costs, a renewables-oriented power supply strategy may enable Turkey to save 13 billion US dollars in the period between 2020 and 2030.
Therefore, the transition towards renewable energy should start now, and priorities for fi nance decisions should be set accordingly.
13 BILLION $UNDER THE RDP
SCENARIO, COST OF COMPLIANCE WITH THE
EU ETS AND INDUSTRIAL EMISSION DIRECTIVE IS 13 BILLION US $ LOWER
THAN BAU SCENARIO
Figure 6: Net scenario costs of compliance with EU ETS and IED in post-2020 period ($bn)
Scenario Coast Carbon Coast IED Coast
9 5
9
37 26
36
205 209272
150
50
100
200
250
300
350
0
Source: Bloomberg New Energy Finance
Business-as-usual Renewables development pathway
Offi cial energy plan

28 TURKEY’S RENEWABLE POWER Alternative Power Supply Scenarios for Turkey
Cum
bria
, İng
ilter
e ©
Glo
bal W
arm
ing
Imag
es W
WF
-Can
on
RENEWABLE ENERGY
TECHNOLOGIES
OUTPERFORM
FOSSIL FUELS AND
NUCLEAR ENERGY
IN EMPLOYMENT
CREATION PER UNIT OF
POWER GENERATION

29TURKEY’S RENEWABLE POWER Alternative Power Supply Scenarios for Turkey
6. Renewable Energy Should Be an Integral Part of Industrial PoliciesIn countries such as Germany, Denmark and China, renewable energy technologies are not merely a tool for energy supply security, but also an integral part of industrial policies. As a result of this approach, these countries have witnessed improvements in manufacturing, export and employment pertaining to renewable energy technologies in parallel with the increasing use of renewable energy.
Turkey spends almost as much on natural gas imports (an estimated $8-10bn) as the value of the foreign investment it attracts ($10bn in 2013). The BNEF analysis asserts that it is possible to limit the increase in natural gas imports through coal-oriented policies. However, a projected increase in the use of hard coal in coal-fi red power plants points out to a further increase in fossil fuel imports: as of today, Turkey meets 92 % of its hard coal demand through imports.
BNEF analysis indicates that meeting the increasing power demand with renewables instead of coal could have a positive impact on Turkey’s balance of trade. It further underscores that this positive effect can be achieved only if a major portion of the additional installed capacity investments for renewables are provided by domestic manufacturers.
Multiplier effect created by macroeconomic parameters such as employment, export and GDP could reinforce this advantage. According to the “Green Jobs Report” published by the International Labour Organization (ILO) in 2008, per installed capacity, solar and wind generate more jobs than coal or natural gas13. World Bank also suggests that, in employment creation per unit of power generated, renewable energy technologies perform much better than fossil fuels and nuclear energy14.
The additional incentives provided by Turkey’s Renewable Energy Resources Support Mechanism (YEKDEM) for the use of domestic content in renewable energy projects signify a positive step in this respect. This step should be transformed into a strategic priority. Manufacturing renewable energy technologies and equipment should be integrated into Turkey’s industrial policy.
13 UNEP/ILO/IOE/ITUC, 2008. Green Jobs: Towards Decent Work in a Sustainable Low Carbon World.14 The World Bank, 2011. Issues in estimating the employment generated by energy sector activities, http://siteresources.worldbank.org/INTOGMC/Resources/Measuring_the_employment_impact_of_energy_sector1.pdf
ENERGY POLICIES THAT PRIORITIZE
RENEWABLES COULD HAVE A POSITIVE
IMPACT ON TURKEY’S BALANCE OF TRADE
Solar PV Land fi ll gas
SmallHydro
Geothermal SolarThermal
CCS Wind Nuclear Coal Natural Gas
BiomassEnergyEffi ciency
0,2
0,4
0,6
0,8
1
0
Figure 7: Job creation potential of various power generation technologies per GWh energy generated

30 TURKEY’S RENEWABLE POWER Alternative Power Supply Scenarios for Turkey
@ A
ndre
w K
err
/ W
WF
-Can
on

31TURKEY’S RENEWABLE POWER Alternative Power Supply Scenarios for Turkey
7. Implement Effective Mechanisms in Order to Meet Energy Effi ciency TargetsAccording to the BNEF analysis, power demand in 2030 is projected to be 25% lower than offi cial projections. The level of power demand has signifi cant impact on capacity additions, capital and fuel expenditures and greenhouse gas emissions associated with power generation.
Even the conservative estimates in the BNEF analysis indicate that it is possible to limit the growth in power demand through energy effi ciency measures. If Turkey can meet its 2023 target of reducing its energy intensity by 20%, this would mean a big step towards a more effi cient use of the electricity it generates.
The International Energy Agency states that the most cost-effective way to resist fl uctuations in energy prices is through energy effi ciency15. Under its 2020 climate and energy package, The European Union aims to achieve a 20% increase in energy effi ciency. For 2030, the target is an increase of “at least 27%” in energy effi ciency. Developing countries are also undertaking successful policies and practices in energy effi ciency. As mentioned in the BNEF analysis, Brazil, despite the increases in its national income, has managed to stabilize its per capita electricity consumption, thanks partly to the energy effi ciency measures it has been implementing since 2000.
The cleanest and the cheapest energy is the energy that is not consumed. In order to meet its ambitious energy effi ciency and intensity targets, Turkey needs to unwaveringly implement necessary measures at the sectoral level, without any delays or opt-outs. As in the case of Brazil, allocation of a certain portion of their revenues to energy effi ciency projects by utilities might yield positive results in Turkey.
20%MEETING THE 2023
TARGET OF REDUCING ENERGY INTENSITY
BY 20% WOULD BE A SIGNIFICANT STRIDE
FOR TURKEY15 IEA World Energy Outlook 2013, page 297.
32 TURKEY’S RENEWABLE POWER Alternative Power Supply Scenarios for Turkey

33TURKEY’S RENEWABLE POWER Alternative Power Supply Scenarios for Turkey
Not
tingh
am, İ
ngilt
ere
© G
loba
l War
min
g Im
ages
WW
F-C
anon
8. Implement Robust Environmental Impact Assessment Processes in Thermal Power PlantsThe Electricity Market Law No.6446, which entered into force in 2013, provided exemption from environmental legislation until 2018 to those power generation assets that are owned by EÜAŞ or are in the privatization process. This clause was revoked by the Constitutional Court in May 2014.
No thermal power plant should be exempt from environmental legislation. The impacts on ecosystems, biodiversity, public health and other factors should be thoroughly assessed, and decisions regarding thermal power plant projects should be taken accordingly. In order to complement this process, tools such as carbon pricing mechanisms and GHG emission standards need to be employed and the process of harmonization with the EU’s acquis in relevant areas needs to be accelerated.

34 TURKEY’S RENEWABLE POWER Alternative Power Supply Scenarios for Turkey

35TURKEY’S RENEWABLE POWER Alternative Power Supply Scenarios for Turkey
@ G
loba
l War
min
g Im
ages
/ W
WF
-Can
on
9. We Are Running out of Time. Now is the Time to Act.The economic life span of a coal power plant is around 30-40 years. The decisions made today could lock-in the Turkish economy and society to a high carbon, high cost, fossil fuel dominated future toward the middle of the century. In light of their decreasing costs and environmental, social and economic advantages, renewable energy sources should be given priority in the electricity supply security strategy of Turkey. Fossil fuel projects, on the other hand, need to be phased out.
36 TURKEY’S RENEWABLE POWER Alternative Power Supply Scenarios for Turkey
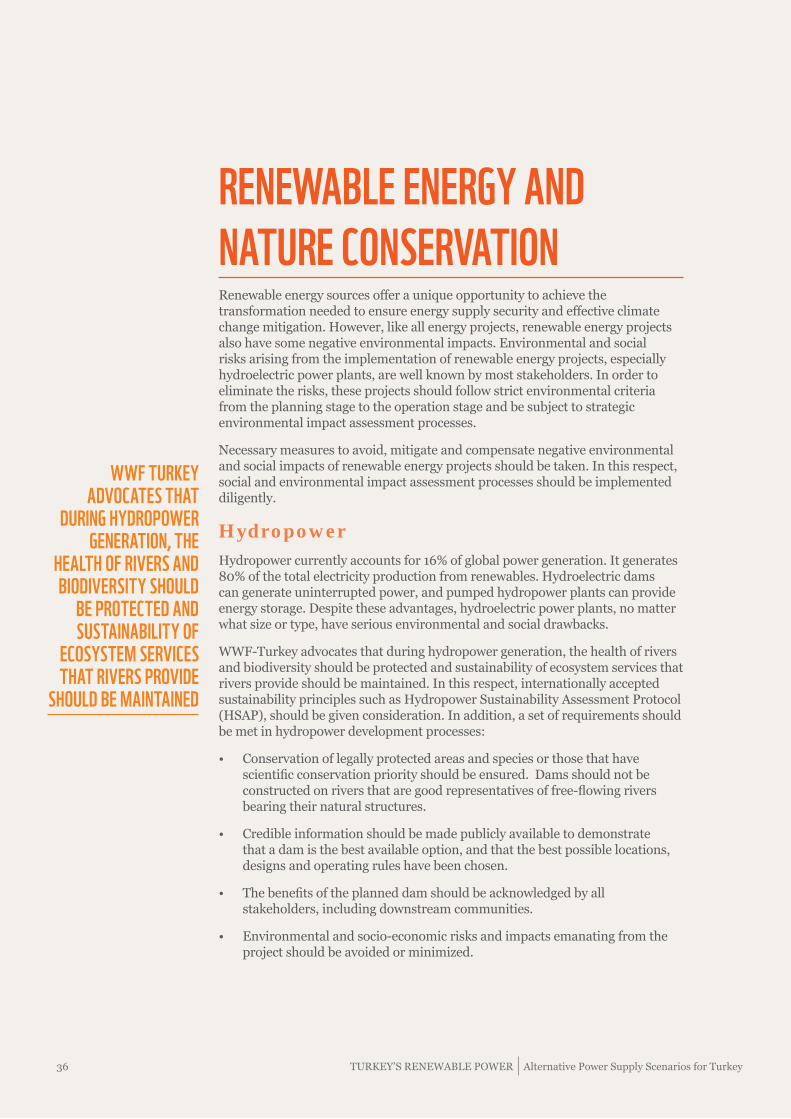
RENEWABLE ENERGY AND
NATURE CONSERVATIONRenewable energy sources offer a unique opportunity to achieve the transformation needed to ensure energy supply security and effective climate change mitigation. However, like all energy projects, renewable energy projects also have some negative environmental impacts. Environmental and social risks arising from the implementation of renewable energy projects, especially hydroelectric power plants, are well known by most stakeholders. In order to eliminate the risks, these projects should follow strict environmental criteria from the planning stage to the operation stage and be subject to strategic environmental impact assessment processes.
Necessary measures to avoid, mitigate and compensate negative environmental and social impacts of renewable energy projects should be taken. In this respect, social and environmental impact assessment processes should be implemented diligently.
Hydropower Hydropower currently accounts for 16% of global power generation. It generates 80% of the total electricity production from renewables. Hydroelectric dams can generate uninterrupted power, and pumped hydropower plants can provide energy storage. Despite these advantages, hydroelectric power plants, no matter what size or type, have serious environmental and social drawbacks.
WWF-Turkey advocates that during hydropower generation, the health of rivers and biodiversity should be protected and sustainability of ecosystem services that rivers provide should be maintained. In this respect, internationally accepted sustainability principles such as Hydropower Sustainability Assessment Protocol (HSAP), should be given consideration. In addition, a set of requirements should be met in hydropower development processes:
• Conservation of legally protected areas and species or those that have scientifi c conservation priority should be ensured. Dams should not be constructed on rivers that are good representatives of free-fl owing rivers bearing their natural structures.
• Credible information should be made publicly available to demonstrate that a dam is the best available option, and that the best possible locations, designs and operating rules have been chosen.
• The benefi ts of the planned dam should be acknowledged by all stakeholders, including downstream communities.
• Environmental and socio-economic risks and impacts emanating from the project should be avoided or minimized.
WWF TURKEY ADVOCATES THAT
DURING HYDROPOWER GENERATION, THE
HEALTH OF RIVERS AND BIODIVERSITY SHOULD
BE PROTECTED AND SUSTAINABILITY OF
ECOSYSTEM SERVICES THAT RIVERS PROVIDE
SHOULD BE MAINTAINED
37TURKEY’S RENEWABLE POWER Alternative Power Supply Scenarios for Turkey
Wind Energy While the global wind power installed capacity has increased eight-fold over the last decade, wind power capacity in Turkey has increased from 20MW to 3,000MW. A target of 20,000MW of installed wind capacity in 2023 has been set. In terms of carbon life-cycle emissions (cradle to grave), wind power is 40 times cleaner than natural gas and 80 times cleaner than coal. Wind will play a key role in power generation in the rest of the 21st century.
On the other hand, environmental and social impacts of wind power plants are also becoming a topical issue. The “environmental” value of wind energy projects are being questioned because of aesthetic concerns about wind turbines and landscape, noise pollution, impacts on wildlife – birds in particular – on agriculture and other types of land use.
It should be emphasized that the environmental impacts of wind power can be considered to be negligible when compared to those of other alternatives such as fossil fuels and nuclear energy. Various policy tools and measures are available to prevent, mitigate and compensate for environmental and social impacts of wind power development projects:
• Wind power plants should undergo appropriate planning and siting processes in order to minimize their negative impacts on ecosystems as well as local communities.
• Wind power plants should be included in strategic environmental impact assessment processes. If necessary, “no-go” areas should be identifi ed by taking into account relevant environmental and socio-economic criteria.
• EIA processes should be transparent, and all stakeholders should be involved. Measures, identifi ed for mitigation and compensation of environmental and social impacts should be implemented.
Solar Energy Solar energy installed capacity appeared in the Turkish Electricity Transmission Company’s statistics only in 2014. By the end of July 2014, installed solar capacity of Turkey was 14MW. The offi cial target for 2023, on the other hand, stands at 3,000MW.
The most important environmental concern regarding the proliferation of solar power is the potential impact on land use – in particular on valuable agricultural land.
The Solar PV Atlas report that was published by WWF in 2013 illustrates that PV technology, when well-planned, does not confl ict with conservation goals. According to the Solar Atlas, in theory, a total of 790 km² of solar panels would generate enough electricity to meet Turkey’s current total power demand. 790 km² is equal to 0.1 % of Turkey’s total surface area or the total lake area of Atatürk Dam.
In the foreseeable future, Turkey will not be meeting its power demand solely from solar energy. Even in a 100% renewable energy system, other sources such as wind, geothermal, hydropower and biomass will have signifi cant shares. It just needs to be underlined that nature conservation and renewable energy development can coexist and develop in parallel, without undermining each other.
As the global climate change takes its toll on people and the environment, the importance of properly-sited renewable power plants that meet the criteria of sustainability becomes even more apparent.
IN TERMS OF CARBON LIFE-CYCLE EMISSIONS,
WIND POWER IS 40 TIMES CLEANER THAN NATURAL GAS AND 80 TIMES CLEANER THAN
COAL
SOLAR PV PANELS THAT COVERS AN
AREA EQUIVALENT TO TOTAL LAKE AREA OF
ATATÜRK DAM WOULD BE ENOUGH TO MEET TURKEY’S CURRENT
POWER DEMAND

38 TURKEY’S RENEWABLE POWER Alternative Power Supply Scenarios for Turkey

39TURKEY’S RENEWABLE POWER Alternative Power Supply Scenarios for Turkey
Fle
vola
nd, H
olla
nda
© G
etty
Imag
es T
urke
y

TURKEY'S CHANGING POWER MARKETS A report funded by the European Climate Foundation and commissioned by WWF-Turkey
18 November 2014
TURKEY'S CHANGING POWER MARKETS
18 NOVEMBER 2014
© Bloomberg Finance L.P.2015
No portion of this document may be reproduced, scanned into an electronic system, distributed, publicly displayed or used as the basis of derivative works without the prior written consent of Bloomberg Finance L.P. For more information on terms of use, please contact [email protected]. Copyright and Disclaimer notice on page 52 applies throughout.
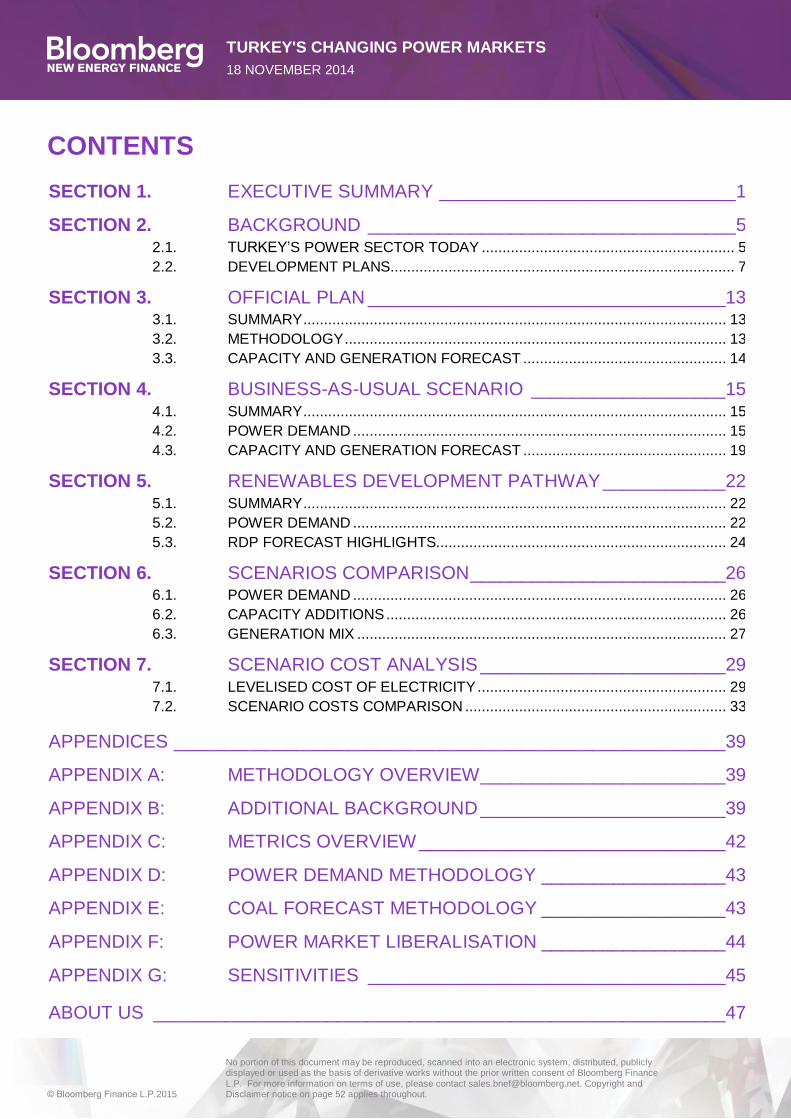
CONTENTS
SECTION 1. EXECUTIVE SUMMARY _____________________________ 1
SECTION 2. BACKGROUND ____________________________________ 5
2.1. TURKEY’S POWER SECTOR TODAY ............................................................. 5
2.2. DEVELOPMENT PLANS................................................................................... 7
SECTION 3. OFFICIAL PLAN ___________________________________13
3.1. SUMMARY ...................................................................................................... 13
3.2. METHODOLOGY ............................................................................................ 13
3.3. CAPACITY AND GENERATION FORECAST ................................................. 14
SECTION 4. BUSINESS-AS-USUAL SCENARIO ___________________15
4.1. SUMMARY ...................................................................................................... 15
4.2. POWER DEMAND .......................................................................................... 15
4.3. CAPACITY AND GENERATION FORECAST ................................................. 19
SECTION 5. RENEWABLES DEVELOPMENT PATHWAY ____________22
5.1. SUMMARY ...................................................................................................... 22
5.2. POWER DEMAND .......................................................................................... 22
5.3. RDP FORECAST HIGHLIGHTS...................................................................... 24
SECTION 6. SCENARIOS COMPARISON _________________________26
6.1. POWER DEMAND .......................................................................................... 26
6.2. CAPACITY ADDITIONS .................................................................................. 26
6.3. GENERATION MIX ......................................................................................... 27
SECTION 7. SCENARIO COST ANALYSIS ________________________29
7.1. LEVELISED COST OF ELECTRICITY ............................................................ 29
7.2. SCENARIO COSTS COMPARISON ............................................................... 33
APPENDICES ______________________________________________________39
APPENDIX A: METHODOLOGY OVERVIEW________________________39
APPENDIX B: ADDITIONAL BACKGROUND ________________________39
APPENDIX C: METRICS OVERVIEW ______________________________42
APPENDIX D: POWER DEMAND METHODOLOGY __________________43
APPENDIX E: COAL FORECAST METHODOLOGY __________________43
APPENDIX F: POWER MARKET LIBERALISATION __________________44
APPENDIX G: SENSITIVITIES ___________________________________45
ABOUT US ________________________________________________________47

TURKEY'S CHANGING POWER MARKETS
18 NOVEMBER 2014
© Bloomberg Finance L.P.2015
No portion of this document may be reproduced, scanned into an electronic system, distributed, publicly displayed or used as the basis of derivative works without the prior written consent of Bloomberg Finance L.P. For more information on terms of use, please contact [email protected]. Copyright and Disclaimer notice on page 52 applies throughout.
TABLE OF FIGURES Figure 1: Turkish power capacity by type, 2000-2013 .......................................................... 5
Figure 2: Turkish power generation by type, 2000-2013 ...................................................... 5
Figure 3: Coal-fired power plants in Turkey ......................................................................... 9
Figure 4: "Official Plan" scenario projected capacity in Turkey, 2014-2030 (GW) .............. 13
Figure 5: "Official Plan" scenario projected power generation in Turkey, 2014-2030 (TWh)14
Figure 6: Turkish power demand, 1996-2030 (TWh / Year) ............................................... 16
Figure 7: European economies annual power demand and GDP per capita (1990-2012) .. 16
Figure 8: Developing world economies annual power demand and GDP per capita (1990-2012) ............................................................................................................... 17
Figure 9: Turkish GDP power intensity, 1990-2020 (GWh / Real TRY bn) ......................... 18
Figure 10: Turkish electricity consumption shares by sector, 1990-2013 (%) ..................... 18
Figure 11: Energy intensity vs. per capita consumption for select countries (2011) ........... 18
Figure 12: Actual vs. projected Turkish power demand (TWh / Year) ................................ 19
Figure 13: BAU scenario installed capacity in Turkey, 2014-2030 (GW) ............................ 20
Figure 14: BAU scenario power generation in Turkey, 2014-2030 (TWh) .......................... 20
Figure 15: Historical electricity transmission and distribution losses (%) in Turkey, 1970-2012 ................................................................................................................ 23
Figure 16: RDP scenario installed capacity in Turkey, 2014-2030 (GW) ........................... 24
Figure 17: RDP scenario power generation in Turkey, 2014-2030 (TWh) .......................... 25
Figure 18: Scenario power generation projections, 2014-2030 (TWh) ............................... 26
Figure 19: Official plan capacity additions (GW) ................................................................ 27
Figure 20: BAU scenario capacity additions (GW) ............................................................. 27
Figure 21: RDP scenario capacity additions (GW) ............................................................. 27
Figure 22: Annual power generation, 2014-30 (TWh) ........................................................ 27
Figure 23: Power generation technology mix, 2023 ........................................................... 28
Figure 24: Power generation technology mix, 2030 ........................................................... 28
Figure 25: Power generation scenario comparison, 2023 .................................................. 28
Figure 26: Power generation scenario comparison, 2030 .................................................. 28
Figure 27: Levelised cost of electricity for various technologies in Europe, Turkey and globally, 2014 ($ / MWh) ................................................................................. 29
Figure 28: European solar PV LCOE range, 2013-30 ($ / MWh) ....................................... 30
Figure 29: European onshore wind LCOE range, 2013-30 ($ / MWh) ................................ 30
Figure 30: BNEF Turkish fuel price assumptions ............................................................... 32
Figure 31: Official plan capital expenditure, 2014-30 ($bn) ................................................ 33
Figure 32: BAU scenario capital expenditure, 2014-30 ($bn) ............................................. 33
Figure 33: RDP scenario capital expenditure, 2014-30 ($bn) ............................................. 33
Figure 34: Capital expenditure comparison, 2014-30 ($bn) ............................................... 33
Figure 35: Fuel expenditure comparison, 2014-30 ($bn) ................................................... 33
Figure 36: Annual sum of capital and operating expenditure (including fuel use) 2014-30 ($bn) ............................................................................................................... 34
Figure 37: Cumulative sum of capital and operating expenditure (including fuel use) 2014-30 ($bn)........................................................................................................... 34
Figure 38: BAU versus RDP scenario trade balance impacts, 2014-30 ($bn nominal) ....... 36
Figure 39: Annual power sector CO2e emissions, 2000- 2030 (Million tonnes) ................. 37
Figure 40: Net scenario costs when including post-2020 EU compliance ($bn) ................. 38

TURKEY'S CHANGING POWER MARKETS
18 NOVEMBER 2014
© Bloomberg Finance L.P.2015
No portion of this document may be reproduced, scanned into an electronic system, distributed, publicly displayed or used as the basis of derivative works without the prior written consent of Bloomberg Finance L.P. For more information on terms of use, please contact [email protected]. Copyright and Disclaimer notice on page 52 applies throughout.
Figure 41: Methodology overview ...................................................................................... 39
Figure 42: BNEF battery pack costs and production forecast (2010-2030) ........................ 41
Figure 43: Annual coal capacity additions in BAU scenario (GW) ...................................... 44
Figure 44: Annual coal capacity additions in RDP scenario (GW) ...................................... 44
Figure 45: Liberalisation milestones of the Turkish power market, 2001-16 ....................... 45
TABLE OF TABLES Table 1: Scenario top-level results comparison ............................................................... 3
Table 2: Turkish government 2023 energy targets .......................................................... 7
Table 3: Turkish “10th Development Plan” targets for 2018 ............................................ 7
Table 4: Domestic coal supply market shares (2011) ...................................................... 8
Table 5: Concluded coal tenders through the Royalty Tender Mechanism ...................... 9
Table 6: Renewable energy production incentives ($ cents / kWh)................................ 10
Table 7: Turkey energy sector policies and targets summary table (GW) ...................... 11
Table 8: Turkey's transmission and distribution capacity ............................................... 11
Table 9: Opportunities for energy storage applications.................................................. 12
Table 10: "Official Plan" installed capacity in Turkey, 2000-2030 (MW) ........................... 14
Table 11: Official Plan and BAU scenario installed capacity projections, 2023/2030 (MW)21
Table 12: Official Plan, BAU and RDP scenario installed capacity projections, 2023 and 2030 (MW) ...................................................................................................... 25
Table 13: Key capital expenditure assumptions, $m / MW (2014) ................................... 30
Table 14: Overview of fixed O&M assumptions, 2014 ($ / MW / Year) ............................ 31
Table 15: Total discounted cost assessment over 2014-2030 ($bn) ................................ 34
Table 16: Overview of key input metrics and variables .................................................... 42
Table 17: Turkey coal plant pipeline analysis, 2014 ........................................................ 44

TURKEY'S CHANGING POWER MARKETS
18 NOVEMBER 2014
© Bloomberg Finance L.P.2015
No portion of this document may be reproduced, scanned into an electronic system, distributed, publicly displayed or used as the basis of derivative works without the prior written consent of Bloomberg Finance L.P. For more information on terms of use, please contact [email protected]. Copyright and Disclaimer notice on page 52 applies throughout. Page 1 of 48
SECTİON 1. EXECUTIVE SUMMARY Turkey’s energy market is at a crossroads. Demand for electricity grew by 70% in the last
decade, and it is a trend that is expected to continue. The government is being forced to
make some critical decisions about how it delivers electricity today and in the long term –
while minimising the costs to the economy and environment.
There are two imperatives underlying the government’s energy plans – firstly to satisfy rising
electricity demand and secondly to decrease its fuel import dependency. Succeeding in both will
be crucial to sustaining Turkey’s economic growth without increasing its dependence on natural
gas imports. Current plans strive for greater use of domestic resources such as coal, a modest
increase in renewables capacity and a reduction in its dependence on natural gas imports amid
continued strong growth in total electricity consumption. Bloomberg New Energy Finance
examines these plans, and their likely consequences, and then outlines two independent
scenarios for the future of the Turkish electricity system. Both scenarios envisage Turkish
electricity demand growth slowing as the nation becomes richer, a well-observed pattern in
comparable nations. In the first scenario, the demand growth is met mainly by coal-fuelled power
plants. In the second projection we asked whether Turkey could achieve the same benefits with a
focus on renewables instead of fossil fuels. This study was commissioned by WWF-Turkey and
funded by the European Climate Foundation (ECF).
TURKEY’S POWER SYSTEM TODAY
At present, Turkey spends almost as much on natural gas imports as it attracts foreign direct
investment – an estimated $8-10bn versus $10bn each year. The Turkish government is keen to
stem these high gas import costs, and it has recently unfurled its “dash-for-coal” plan. To this end,
it is also encouraging power plant construction by subsidising asset capital expenditure and
operating costs. Turkey has been equally diligent in finding and mining its considerable lignite
reserves, which are close to 14.1bn tonnes. Some 45% of these lignite reserves alone come from
the Asfin-Elbistan field, which already houses two power plants with a combined installed capacity
of close to 2.8GW. And, perhaps more importantly, since 2000 the government has made
significant moves towards both liberalising and privatising its power sector. In the last decade it
has begun selling certain coal assets. The government likewise has ambitious wind and hydro
plans for 2023 while defending its modest solar targets by suggesting they will protect a
transitional electricity market.
OFFICIAL PLANS
In the Official Plan, which represents the government position, annual power demand is projected
to grow at 5.25% each year for the next decade and a half. It sees – or hopes – that the natural
gas share of electricity generation will fall from 41% to 18% by 2030 as coal, nuclear, hydro and
renewables all start to contribute more substantially. We believe both ambitions are more wishful-
thinking than plausible projections. The government has a track record of overestimating future
power demand, and our analysis indicates that it is on course to do so again with its current plans.
Furthermore, we think it is unlikely that many of the capacity targets for nuclear, wind and other
technologies will be met on time.
BNEF’S BUSINESS-AS-USUAL (BAU) SCENARIO
In our BAU scenario, we attempt to create a more plausible projection of how Turkey’s electricity
sector could evolve, if the government continues in its ambition of replacing natural gas imports
with domestic coal. We project power demand will be about 25% lower than foreseen by the
government during the next decade. We benchmark this conclusion against comparable

TURKEY'S CHANGING POWER MARKETS
18 NOVEMBER 2014
© Bloomberg Finance L.P.2015
No portion of this document may be reproduced, scanned into an electronic system, distributed, publicly displayed or used as the basis of derivative works without the prior written consent of Bloomberg Finance L.P. For more information on terms of use, please contact [email protected]. Copyright and Disclaimer notice on page 52 applies throughout. Page 2 of 48
economies, like Brazil and Poland which have also seen declining demand growth rates as they
grew wealthier. In fact, the data from 2013 suggest Turkish electricity demand growth is already
beginning to slow. Examples from Brazil and Germany also highlight the potential of energy
efficiency measures, which could further slow demand growth. Brazil, for instance, has managed
to stabilise its electricity consumption per capita in recent years, partly by requiring its utilities to
invest 0.5% of their annual revenue in energy efficiency improvements.
The forecasts for future capacity installations similarly reflect what we consider realistic
assumptions in line with the spirit of the current government plan. We project that natural gas
capacity will not grow by more than 3.3GW before 2030, in accordance with the government
plans. We project that around 50% of the target for wind installations will be met by 2023, with
10.3GW, rather than 20GW of total installed capacity. We are also bearish about the prospects of
its three nuclear sites. Given concrete has not even begun being poured at its first four-reactor
site, in the Mersin province, we think it is unlikely Turkey will be able to meet its ambition to
source 10% of its electricity demand from nuclear by 2025. We anticipate the first reactor at this
site will come online around 2022, with one of the remaining three reactors coming online every
year after. If Turkey develops as this scenario projects, the nation will substantially boost the
share of coal and lignite in its generation mix while keeping natural gas import costs from rising. It
will also roughly double its carbon emissions from an estimated 110m tonnes in 2014 to 205m in
2030 according to our estimates – about the equivalent of adding a third of Germany’s annual
power sector emissions.
BNEF’S RENEWABLES DEVELOPMENT PATHWAY (RDP)
This scenario is underpinned by many of the same assumptions as our BAU scenario. The critical
difference is that we assume more renewable capacity can and will displace the government’s
ambitious new-build plans for hard coal and lignite capacity. We therefore model the Turkish
power sector under an assumption that no further coal capacity will come online after 2022, once
plants currently under construction or in advanced planning stages are delivered. Despite its
heavy reliance on variable renewable generation, we found that enough dispatchable back-up
capacity will be available to comply with the government’s requirements. In the spirit of this more
environmentally ambitious scenario, we have also assumed that Turkey will introduce energy
efficiency measures that slightly reduce power demand growth by 0.15% per annum, when
compared to our BAU projection. This scenario would keep both carbon emissions and natural
gas imports relatively stable, while boosting the investments required in new capacity.
SCENARIO COMPARISONS
A comparison of some of the main results from this scenario analysis is shown in the table below.
• Power demand projections: In the Official Plan, power generation hits almost 440TWh by
2023 and then climbs to over 600TWh by 2030. Electricity generation is more modest in both
our BAU and RDP scenarios, hitting around 370TWh in 2023 and 450TWh by 2030. This, in
our view more realistic outlook, substantially reduces the need for additional generation
capacity.
• New capacity build: In the Official Plan 101GW are added before 2030, in the BAU scenario
56GW come online and in the RDP 71GW are installed over the next decade and a half. Most
of the15GW difference between the BAU and the RDP scenarios is due to the lower
utilisation rates of wind and solar capacity.
• Greenhouse gas emissions: We estimate they would stabilise at around 120m tonnes per
year, or just above current levels, if Turkey develops in line with the conditions laid out in the
TURKEY'S CHANGING POWER MARKETS
18 NOVEMBER 2014
© Bloomberg Finance L.P.2015
No portion of this document may be reproduced, scanned into an electronic system, distributed, publicly displayed or used as the basis of derivative works without the prior written consent of Bloomberg Finance L.P. For more information on terms of use, please contact [email protected]. Copyright and Disclaimer notice on page 52 applies throughout. Page 3 of 48
RDP scenario. By relying on coal for its future capacity additions, Turkish emissions would
almost double in the next 15 years.
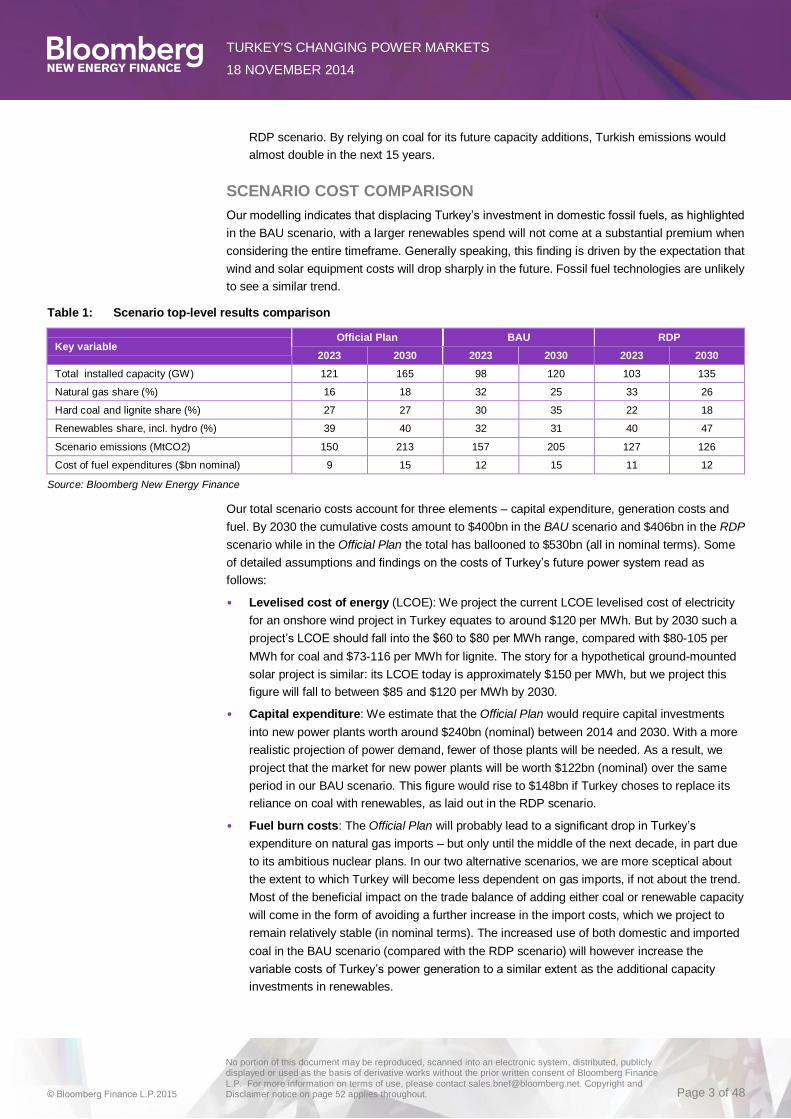
SCENARIO COST COMPARISON
Our modelling indicates that displacing Turkey’s investment in domestic fossil fuels, as highlighted
in the BAU scenario, with a larger renewables spend will not come at a substantial premium when
considering the entire timeframe. Generally speaking, this finding is driven by the expectation that
wind and solar equipment costs will drop sharply in the future. Fossil fuel technologies are unlikely
to see a similar trend.
Table 1: Scenario top-level results comparison
Key variable Official Plan BAU RDP
2023 2030 2023 2030 2023 2030
Total installed capacity (GW) 121 165 98 120 103 135
Natural gas share (%) 16 18 32 25 33 26
Hard coal and lignite share (%) 27 27 30 35 22 18
Renewables share, incl. hydro (%) 39 40 32 31 40 47
Scenario emissions (MtCO2) 150 213 157 205 127 126
Cost of fuel expenditures ($bn nominal) 9 15 12 15 11 12
Source: Bloomberg New Energy Finance
Our total scenario costs account for three elements – capital expenditure, generation costs and
fuel. By 2030 the cumulative costs amount to $400bn in the BAU scenario and $406bn in the RDP
scenario while in the Official Plan the total has ballooned to $530bn (all in nominal terms). Some
of detailed assumptions and findings on the costs of Turkey’s future power system read as
follows:
• Levelised cost of energy (LCOE): We project the current LCOE levelised cost of electricity
for an onshore wind project in Turkey equates to around $120 per MWh. But by 2030 such a
project’s LCOE should fall into the $60 to $80 per MWh range, compared with $80-105 per
MWh for coal and $73-116 per MWh for lignite. The story for a hypothetical ground-mounted
solar project is similar: its LCOE today is approximately $150 per MWh, but we project this
figure will fall to between $85 and $120 per MWh by 2030.
• Capital expenditure: We estimate that the Official Plan would require capital investments
into new power plants worth around $240bn (nominal) between 2014 and 2030. With a more
realistic projection of power demand, fewer of those plants will be needed. As a result, we
project that the market for new power plants will be worth $122bn (nominal) over the same
period in our BAU scenario. This figure would rise to $148bn if Turkey choses to replace its
reliance on coal with renewables, as laid out in the RDP scenario.
• Fuel burn costs: The Official Plan will probably lead to a significant drop in Turkey’s
expenditure on natural gas imports – but only until the middle of the next decade, in part due
to its ambitious nuclear plans. In our two alternative scenarios, we are more sceptical about
the extent to which Turkey will become less dependent on gas imports, if not about the trend.
Most of the beneficial impact on the trade balance of adding either coal or renewable capacity
will come in the form of avoiding a further increase in the import costs, which we project to
remain relatively stable (in nominal terms). The increased use of both domestic and imported
coal in the BAU scenario (compared with the RDP scenario) will however increase the
variable costs of Turkey’s power generation to a similar extent as the additional capacity
investments in renewables.

TURKEY'S CHANGING POWER MARKETS
18 NOVEMBER 2014
© Bloomberg Finance L.P.2015
No portion of this document may be reproduced, scanned into an electronic system, distributed, publicly displayed or used as the basis of derivative works without the prior written consent of Bloomberg Finance L.P. For more information on terms of use, please contact [email protected]. Copyright and Disclaimer notice on page 52 applies throughout. Page 4 of 48
FROM SCENARIOS TO REALITY
In the immediate term, too many barriers exist to advance aggressively towards higher reliance
on renewables. The Turkish electricity grid requires investment to deal with the supply variability
created by a flood of new renewable projects, the Turkish government is putting a break on solar
installations, the electricity market is not completely liberalised, the tenor of feed-in tariffs is
comparatively short and administrative grid connection complexities abound. These are however
only near-term barriers. As renewable long-run marginal costs – for which LCOEs are a good
proxy – fall subsidies will become less important while innovative developers will find ways around
the administrative and permitting complexities. Our analysis indicates that the conventional
wisdom, claiming that renewables are not cost-competitive, may not hold in the next decade. In
the medium to long term, Turkey may therefore achieve many of the benefits it expects to gain
from increased coal power generation also from a strategy that puts renewables at the centre.
This will not just be welcome news to environmentalists but also to the Turkish government and
economists.

TURKEY'S CHANGING POWER MARKETS
18 NOVEMBER 2014
© Bloomberg Finance L.P.2015
No portion of this document may be reproduced, scanned into an electronic system, distributed, publicly displayed or used as the basis of derivative works without the prior written consent of Bloomberg Finance L.P. For more information on terms of use, please contact [email protected]. Copyright and Disclaimer notice on page 52 applies throughout. Page 5 of 48
SECTİON 2. BACKGROUND Bloomberg New Energy Finance conducted an analysis of the Turkish power market and
formulated a view on some alternative plausible scenarios. This study was commissioned
by WWF-Turkey and funded by the European Climate Foundation (ECF). This section
provides some background on the Turkish energy sector, the power market policy
landscape and industry development plans.
2.1. TURKEY’S POWER SECTOR TODAY
In 2013, Turkey generated about 44% of its electricity from gas, 25% from coal and lignite, and
24% from hydro. It is thus heavily reliant on imported gas, much of which comes from Russia. The
government expects electricity demand to almost double between 2013 and 2023.
The government has enacted policy to build greater power capacity and improve energy efficiency
so as to become less dependent on gas imports – shifting its energy mix to favour both
domestically-sourced and imported coal. It plans likewise to have two nuclear plants
commissioned between 2020 and 2022, with a third under construction. Renewable generation is
expected to grow in line with its current share, with most of that growth satisfied by new-build
onshore wind capacity.
In 2013 Turkey generated 239TWh of power – almost 70% more than just a decade previously
and 315% more than 1990 levels. The nation has grown in just under 25 years from being a
power consumer roughly equivalent to Belgium to one the size of Spain. Because power
consumption and wealth per capita are still below the levels of western European nations, Turkey
could conceivably continue to show this rapid power demand growth in the coming years.
One important aspect to this growth has been a shift in fuel mix. Approximately 70% of Turkey’s
2013 generation was supplied by coal and gas power plants, up from about 47% in 1993. As a
result, fuel imports have risen. Almost half of the power generation in Turkey last year was
produced with imported natural gas. The government is keen to redress this balance in the
coming years.
Figure 1: Turkish power capacity by type, 2000-2013 Figure 2: Turkish power generation by type, 2000-2013
GW TWh
Source: Turkish Electricity Transmission Company (TEIAS), Bloomberg New Energy Finance
0
10
20
30
40
50
60
70
2000 2003 2006 2009 2012
Biomass
Solar
Wind
Geothermal
Hydro
Nuclear
Natural gas
Oil
Lignite
Hard coal0
50
100
150
200
250
2000 2003 2006 2009 2012
Biomass
Solar
Wind
Geothermal
Hydro
Nuclear
Natural gas
Oil
Lignite
Hard coal
Turkey’s power market is
currently heavily reliant
on natural gas imports.

TURKEY'S CHANGING POWER MARKETS
18 NOVEMBER 2014
© Bloomberg Finance L.P.2015
No portion of this document may be reproduced, scanned into an electronic system, distributed, publicly displayed or used as the basis of derivative works without the prior written consent of Bloomberg Finance L.P. For more information on terms of use, please contact [email protected]. Copyright and Disclaimer notice on page 52 applies throughout. Page 6 of 48
LIBERALISATION, REGULATION AND MARKET STRUCTURE
One of the top priorities of the Turkish Energy Ministry is to improve the efficiency of the country’s
power market and thus make it more attractive to private investors. It has set about reducing the
public ownership shares of power assets and liberalising the power market to expedite the
transition. It is hoped this will lead to an attractive environment for investors, and will ensure a
cost-effective and secure power supply for consumers1.
The privatisation model being pursued by the government, currently based on bilateral
agreements, is serving to increase the number of companies active in the sector – both in terms
of wholesale and retail electricity sales. Such agreements are made between suppliers and
eligible consumers, which have sufficiently high demand to buy from the wholesale market.
In advance of this privatisation wave, all state-owned power generation assets were first
transferred to the ownership of the newly formed Electricity Generation Company, or EÜAŞ. By
the end of 2013 EÜAŞ held 23.8GW of installed capacity, or 37% of the national total. It annually
generates approximately 80TWh, or 33.4% of the total2. A fully liberalised transmission grid
should make it easier for renewable projects to integrate into Turkey’s current power market.
However, the requisite adequate policy, to support a renewables industry, must be first put in
place.
In a fully liberalised market like the UK, capacity is simply brought online based on the lowest
short-run costs. In Turkey, a collection of prior agreements, between the government and power
suppliers, ensure that certain plants come into service despite not being the lowest cost at that
instant. This serves to distort power prices and adversely affect the profitability of other plants.
POLICY AND REGULATORY ENVIRONMENT
In the middle of its long-term strategic move to liberalise its power markets, it seems unlikely that
the Turkish government will reverse the privatisation process in the coming years. It hopes to
have a competitive electricity market by 2016. The most recent strategy announcements have put
a clear focus on energy security, independence and competition, and indicate that the
government will continue carefully shaping the new market structure with additional policy.
There are signs that the government is relaxing its control over electricity distribution – even if
such moves are not yet all-encompassing. As part of its privatisation push, the government reined
in the authority of the Turkish Electricity Distribution Company (TEDC) while giving private
distribution companies the right to obtain licences from the Turkish Energy Market Regulatory
Authority (EMRA).
Small-scale consumers cannot yet choose an electricity provider. Instead, they get allocated a
default provider from a specific region, while retail tariffs are regulated by EMRA. The threshold
for total electricity spend to be able to choose a supplier was recently reduced to TRY 133 ($63) a
month, which suggests both that less state control is being exerted and that a more competitive
retail market is evolving. In the future more and more consumers will be able to choose their
supplier. Larger consumers can negotiate their own terms with a supplier of their choice and are
not subject to the national tariffs.
1 Ministry of Energy and Natural Resources 2010-2014 Strategic Plan, 2010,
http://www.enerji.gov.tr/yayinlar_raporlar/ETKB_2010_2014_Stratejik_Plani.pdf
2 TEİAŞ (Turkey Electricity Transmission Company)
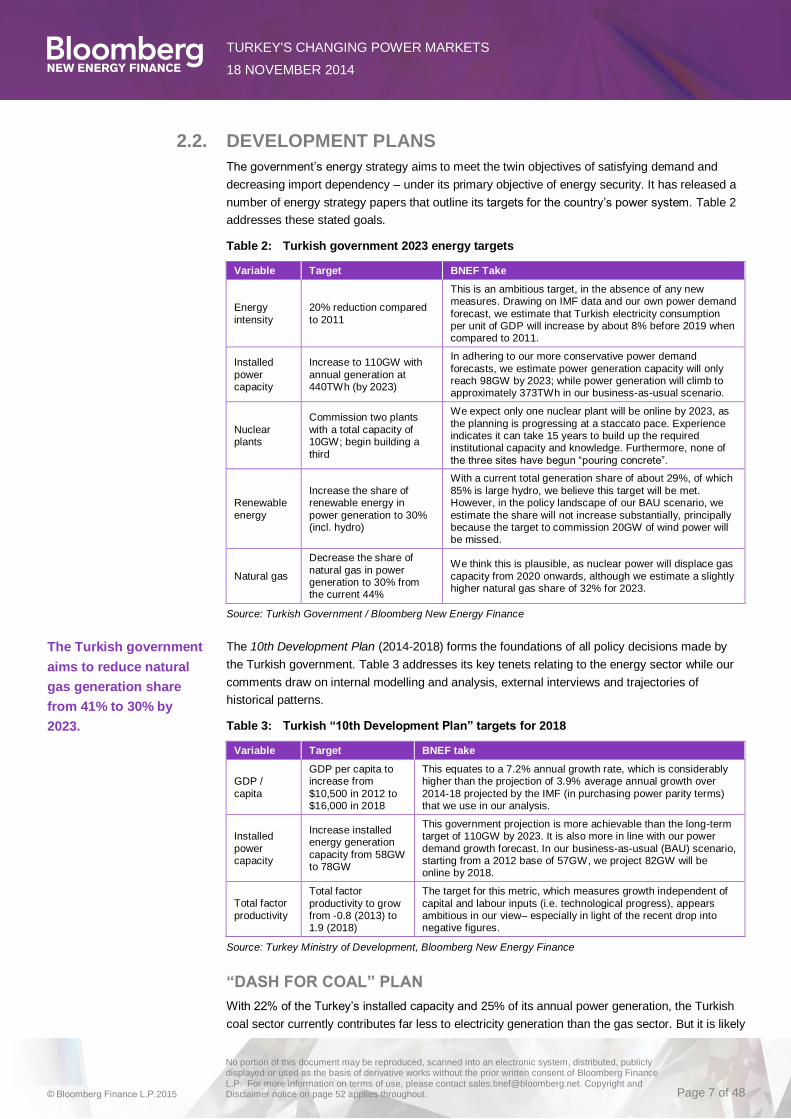
TURKEY'S CHANGING POWER MARKETS
18 NOVEMBER 2014
© Bloomberg Finance L.P.2015
No portion of this document may be reproduced, scanned into an electronic system, distributed, publicly displayed or used as the basis of derivative works without the prior written consent of Bloomberg Finance L.P. For more information on terms of use, please contact [email protected]. Copyright and Disclaimer notice on page 52 applies throughout. Page 7 of 48
2.2. DEVELOPMENT PLANS
The government’s energy strategy aims to meet the twin objectives of satisfying demand and
decreasing import dependency – under its primary objective of energy security. It has released a
number of energy strategy papers that outline its targets for the country’s power system. Table 2
addresses these stated goals.
Table 2: Turkish government 2023 energy targets
Variable Target BNEF Take
Energy
intensity
20% reduction compared
to 2011
This is an ambitious target, in the absence of any new measures. Drawing on IMF data and our own power demand
forecast, we estimate that Turkish electricity consumption per unit of GDP will increase by about 8% before 2019 when compared to 2011.
Installed
power capacity
Increase to 110GW with
annual generation at 440TWh (by 2023)
In adhering to our more conservative power demand
forecasts, we estimate power generation capacity will only reach 98GW by 2023; while power generation will climb to approximately 373TWh in our business-as-usual scenario.
Nuclear plants
Commission two plants
with a total capacity of 10GW; begin building a
third
We expect only one nuclear plant will be online by 2023, as
the planning is progressing at a staccato pace. Experience indicates it can take 15 years to build up the required institutional capacity and knowledge. Furthermore, none of
the three sites have begun “pouring concrete”.
Renewable
energy
Increase the share of renewable energy in
power generation to 30% (incl. hydro)
With a current total generation share of about 29%, of which
85% is large hydro, we believe this target will be met. However, in the policy landscape of our BAU scenario, we
estimate the share will not increase substantially, principally because the target to commission 20GW of wind power will be missed.
Natural gas
Decrease the share of
natural gas in power generation to 30% from the current 44%
We think this is plausible, as nuclear power will displace gas
capacity from 2020 onwards, although we estimate a slightly higher natural gas share of 32% for 2023.
Source: Turkish Government / Bloomberg New Energy Finance
The 10th Development Plan (2014-2018) forms the foundations of all policy decisions made by
the Turkish government. Table 3 addresses its key tenets relating to the energy sector while our
comments draw on internal modelling and analysis, external interviews and trajectories of
historical patterns.
Table 3: Turkish “10th Development Plan” targets for 2018
Variable Target BNEF take
GDP /
capita
GDP per capita to increase from
$10,500 in 2012 to $16,000 in 2018
This equates to a 7.2% annual growth rate, which is considerably higher than the projection of 3.9% average annual growth over
2014-18 projected by the IMF (in purchasing power parity terms) that we use in our analysis.
Installed
power capacity
Increase installed energy generation
capacity from 58GW to 78GW
This government projection is more achievable than the long-term target of 110GW by 2023. It is also more in line with our power
demand growth forecast. In our business-as-usual (BAU) scenario, starting from a 2012 base of 57GW, we project 82GW will be online by 2018.
Total factor
productivity
Total factor
productivity to grow from -0.8 (2013) to 1.9 (2018)
The target for this metric, which measures growth independent of
capital and labour inputs (i.e. technological progress), appears ambitious in our view– especially in light of the recent drop into negative figures.
Source: Turkey Ministry of Development, Bloomberg New Energy Finance
“DASH FOR COAL” PLAN
With 22% of the Turkey’s installed capacity and 25% of its annual power generation, the Turkish
coal sector currently contributes far less to electricity generation than the gas sector. But it is likely
The Turkish government
aims to reduce natural
gas generation share
from 41% to 30% by
2023.

TURKEY'S CHANGING POWER MARKETS
18 NOVEMBER 2014
© Bloomberg Finance L.P.2015
No portion of this document may be reproduced, scanned into an electronic system, distributed, publicly displayed or used as the basis of derivative works without the prior written consent of Bloomberg Finance L.P. For more information on terms of use, please contact [email protected]. Copyright and Disclaimer notice on page 52 applies throughout. Page 8 of 48
to become the fastest-growing part of the Turkish power market in the coming decade3. And to
underscore this momentum, 2012 was declared the “year of coal” by the Turkish energy ministry.
The Turkish government is currently advancing policy to support the development of coal and
lignite projects that can be fed cheaply with domestic resources. Turkish banks are prioritising
getting domestic coal projects financed4. International institutions, like the World Bank and EBRD,
are likewise continuing to support the government’s energy policies due to its almost-complete
power market liberalization. However, these institutions do not support the government’s plans for
coal plants expansion.
The Turkish coal industry is currently seeing the benefits of large-scale public investment – an
incentive scheme serves to subsidise both plant capital expenditure and operating costs for
domestic coal exploitation.
Turkey has tremendous lignite reserves, estimated at approximately 14.1bn tonnes. In the last
nine years, some 5.8bn tonnes were discovered after a five-fold increase in prospecting work.
Domestic coal resources are still largely supplied by public institutions (see Table 4). However,
the government says that roughly 35% of the coal production reported by state-owned enterprises
was in fact mined by private companies, under sub-contracts5.
Table 4: Domestic coal supply market shares (2011)
Turkish Coal
Enterprises (TKI)
Electricity
Generation Company (EUAS)
Turkish Hard
Coal Enterprises (TTK)
Remainder
(All Private)
Domestic coal
share 43.96% 41.59% 2.09% 12.36%
Source: Investment Support and Promotion Agency of Turkey
The government is prioritising the exploitation of these coal resources. It hopes that the dash-for-
coal plan will strengthen regional development, reduce the foreign trade deficit and secure long-
term energy resources. The government suggests that greater public support will lead to lower
consumer electricity costs, usher in further employment opportunities and increase value added in
the country. It is emotive and controversial rhetoric. Courtesy of the royalty tender mechanism,
the state-owned Turkish Coal Enterprise has opened 11 coal fields with a total generation
potential of 3.1GW6. As of November 2013, the government indicates there were seven
successful tenders for small-scale lignite fields resulting from the mechanism, as below.
3 Yazar, Y. (2013). Promotion of Renewable Energy in a Liberalizing Turkish Energy Sector
(2002-2012). Power Point Presentation. General Directorate of Renewable Energy, Ministry of
Energy and Natural Resources. Wind Workshop. 26 March 2013, Ankara.
http://events.ewea.org/events/workshops/wp-content/uploads/2013/03/EWEA-TUREB-
Workshop-27-3-2013-Yusuf-Yazar-YEGM.pdf
4Hatem, E. (2013). Enerji Projelerinin Finansmanı ve Geleceğe Yönelik Beklentiler. Power Point
Presentation. Garanti Bankası. ICCI. 24 April 2013, İstanbul. Retrieved April 26, 2013 from:
http//icci.com.tr/2012sunumlar/O3_Emre_Hatem.pdf
5 Investment Support and Promotion Agency of Turkey (2013). The Energy Sector: A quick tour
for the investor, accessed 3 September 2014, http://www.invest.gov.tr/en-
US/sectors/Pages/Energy.aspx
6 Turkey Ministry of Energy and Natural Resources

TURKEY'S CHANGING POWER MARKETS
18 NOVEMBER 2014
© Bloomberg Finance L.P.2015
No portion of this document may be reproduced, scanned into an electronic system, distributed, publicly displayed or used as the basis of derivative works without the prior written consent of Bloomberg Finance L.P. For more information on terms of use, please contact [email protected]. Copyright and Disclaimer notice on page 52 applies throughout. Page 9 of 48
Table 5: Concluded coal tenders through the Royalty Tender Mechanism
Location
Power
Plant Capacity
(MW)
Coal Field
Reserves (Million
Tonne)
Company
Tender
(Kurus / kWh)
Tender
($ cents /
kWh)
Tufanbeyli / Adana 600 323 Teyo Group 2.57 1.21
Soma-Deniş / Manisa 450 150 Kolin İnşaat 4.69 2.20
Keles-Davutlar / Bursa 270 55 Çeliker İnşaat 5.61 2.64
Domaniç / Kütahya 300 114 Çeliker İnşaat 5.03 2.36
Yeniköy / Muğla 420 50-60 - - -
Karabalçık Karlıova / Bingöl
150 89 Aska 3.2 1.50
Çan / Çanakkale 210 45 - - -
Source: Investment Support and Promotion Agency of Turkey Notes: power plants are built next to coal fields
In addition, the Afsin-Elbistan coal field, which holds up to 45% of Turkey’s lignite reserves and is
currently owned by the Turkish Electricity Generation Company (EUAS), can now be legally
privatised. In May 2014, the Turkish energy minister announced that the government is in talks
with China regarding the development of the $10bn to $12bn field. The same talks have covered
the construction of 8GW of coal-fired power plant7 in the locality. Furthermore, EUAS is privatising
six lignite sites in its portfolio with a combined capacity of 2.6GW. Figure 3 shows the status of
various coal plants in Turkey according to our projects pipeline.
Figure 3: Coal-fired power plants in Turkey
Source: Esri, Bloomberg New Energy Finance, ECF, Bloomberg (BMAP), Sourcewatch
7 Out-law (2014), “Turkey in talks with China over $12 billion Turkish coalfield and power plant
investment deal”, available at: http://www.out-law.com/en/articles/2014/may/turkey-in-talks-
with-china-over-12-billion-turkish-coalfield-and-power-plant-investment-deal/ (retrieved on 30
May 2014)

TURKEY'S CHANGING POWER MARKETS
18 NOVEMBER 2014
© Bloomberg Finance L.P.2015
No portion of this document may be reproduced, scanned into an electronic system, distributed, publicly displayed or used as the basis of derivative works without the prior written consent of Bloomberg Finance L.P. For more information on terms of use, please contact [email protected]. Copyright and Disclaimer notice on page 52 applies throughout. Page 10 of 48
RENEWABLES
The government expects to have 30% of its power supply from renewables by 2023, a share that
it wants to meet with new wind and hydro capacity. Hydro power currently accounts for over 90%
of installed renewable capacity. Despite low feed-in-tariffs (FiTs), Turkey’s wind market has
expanded at a modest pace in recent years8.
The targets for new-build solar and geothermal capacity are low, especially when taking into
account the considerable potential of both resources in Turkey. The 2023 target for solar is only
3GW – by comparison Germany today has 30GW online. This may be explained by the fact that
Turkish solar FiTs are below those of countries such as Germany, the Philippines and Greece.
The government says it wants to limit solar development to protect its newly-privatised power
market9. This policy is not in line with most other countries that see the benefits of a cheap and
diversified mix of technologies and are therefore pushing greater solar PV deployment.
Law No. 6094, which came into effective on 8 January 2011, amended a preceding law on the
deployment of renewable resources (No. 5346). The law guarantees prices from electricity sales
for renewables certificate holders. But, significantly, prices are only guaranteed for the first ten
years. This is a shorter time span than most EU-28 feed-in-tariff regimes, which typically last 15
years. Bidding in the first Turkish solar PV auction closed in July 2013. The total amount of
applicant capacity almost touched 9GW, but a cap of 600MW ensured that only just under 7% of
the applicants will receive FiT support.
Table 6: Renewable energy production incentives ($ cents / kWh)
Technology Guaranteed price Domestic
production support
Maximum
incentive
Hydro power 7.3 2.3 9.6
Wind 7.3 3.7 11
Solar PV 13.3 6.7 20
Concentrated solar 13.3 9.2 22.5
Biomass (including landfill gas) 13.3 5.6 18.9
Geothermal 10.5 2.7 13.2
Source: Amendment to Law No. 6094
The government is likely to set stringent back-up requirements for renewables. An excess of 50%
dispatchable conventional capacity is expected to be required to support each MW of solar and
wind capacity – essentially for 1GW of variable renewables, there must be 0.5GW of excess coal,
gas, hydro or nuclear capacity.
Hydro power is a relatively clean and non-variable technology that has been in use, on an
industrial scale, since the 19th century. In Turkey, hydro power plants currently provide about a
quarter of the total electricity generated, and it has more than 22GW of installed capacity.
According to the government’s project pipeline, another 4GW are expected to come online
between now and 2016, which will help the government push towards its 2023 target of 36GW.
The government believes that 433TWh of hydropower generation are theoretically possible,
216TWh are technically achievable and 140TWh are economically feasible10
. Most of the new
8 Since 2007, the wind sector has grown 15-fold and total installed capacity is now 2.8GW, with a
pipeline of 7GW.
9 EMRA, Law on Utilization of Renewable Energy Sources for The Purpose of Generating
Electrical Energy, accessed 2 September 2014
10 Source: Yenilenebilir Enerji Genel Mueduerlueglue, available at:
http://www.eie.gov.tr/yenilenebilir/h_turkiye_potansiyel.aspx (retrieved 2 July 2014)
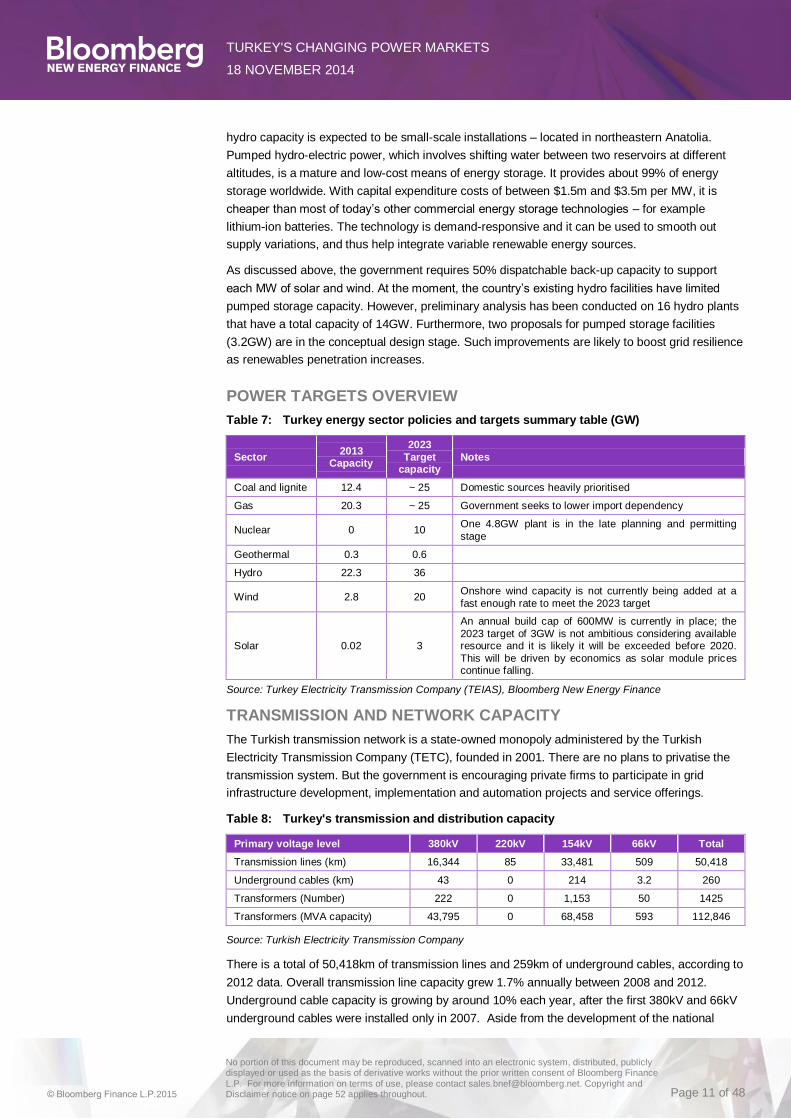
TURKEY'S CHANGING POWER MARKETS
18 NOVEMBER 2014
© Bloomberg Finance L.P.2015
No portion of this document may be reproduced, scanned into an electronic system, distributed, publicly displayed or used as the basis of derivative works without the prior written consent of Bloomberg Finance L.P. For more information on terms of use, please contact [email protected]. Copyright and Disclaimer notice on page 52 applies throughout. Page 11 of 48
hydro capacity is expected to be small-scale installations – located in northeastern Anatolia.
Pumped hydro-electric power, which involves shifting water between two reservoirs at different
altitudes, is a mature and low-cost means of energy storage. It provides about 99% of energy
storage worldwide. With capital expenditure costs of between $1.5m and $3.5m per MW, it is
cheaper than most of today’s other commercial energy storage technologies – for example
lithium-ion batteries. The technology is demand-responsive and it can be used to smooth out
supply variations, and thus help integrate variable renewable energy sources.
As discussed above, the government requires 50% dispatchable back-up capacity to support
each MW of solar and wind. At the moment, the country’s existing hydro facilities have limited
pumped storage capacity. However, preliminary analysis has been conducted on 16 hydro plants
that have a total capacity of 14GW. Furthermore, two proposals for pumped storage facilities
(3.2GW) are in the conceptual design stage. Such improvements are likely to boost grid resilience
as renewables penetration increases.
POWER TARGETS OVERVIEW
Table 7: Turkey energy sector policies and targets summary table (GW)
Sector 2013
Capacity
2023
Target capacity
Notes
Coal and lignite 12.4 ~ 25 Domestic sources heavily prioritised
Gas 20.3 ~ 25 Government seeks to lower import dependency
Nuclear 0 10 One 4.8GW plant is in the late planning and permitting
stage
Geothermal 0.3 0.6
Hydro 22.3 36
Wind 2.8 20 Onshore wind capacity is not currently being added at a
fast enough rate to meet the 2023 target
Solar 0.02 3
An annual build cap of 600MW is currently in place; the
2023 target of 3GW is not ambitious considering available resource and it is likely it will be exceeded before 2020.
This will be driven by economics as solar module prices continue falling.
Source: Turkey Electricity Transmission Company (TEIAS), Bloomberg New Energy Finance
TRANSMISSION AND NETWORK CAPACITY
The Turkish transmission network is a state-owned monopoly administered by the Turkish
Electricity Transmission Company (TETC), founded in 2001. There are no plans to privatise the
transmission system. But the government is encouraging private firms to participate in grid
infrastructure development, implementation and automation projects and service offerings.
Table 8: Turkey's transmission and distribution capacity
Primary voltage level 380kV 220kV 154kV 66kV Total
Transmission lines (km) 16,344 85 33,481 509 50,418
Underground cables (km) 43 0 214 3.2 260
Transformers (Number) 222 0 1,153 50 1425
Transformers (MVA capacity) 43,795 0 68,458 593 112,846
Source: Turkish Electricity Transmission Company
There is a total of 50,418km of transmission lines and 259km of underground cables, according to
2012 data. Overall transmission line capacity grew 1.7% annually between 2008 and 2012.
Underground cable capacity is growing by around 10% each year, after the first 380kV and 66kV
underground cables were installed only in 2007. Aside from the development of the national

TURKEY'S CHANGING POWER MARKETS
18 NOVEMBER 2014
© Bloomberg Finance L.P.2015
No portion of this document may be reproduced, scanned into an electronic system, distributed, publicly displayed or used as the basis of derivative works without the prior written consent of Bloomberg Finance L.P. For more information on terms of use, please contact [email protected]. Copyright and Disclaimer notice on page 52 applies throughout. Page 12 of 48
transmission system, the government is also pushing towards greater international grid
integration. The integration process with ENTSO-E is in its final testing stages, and the
government expects to sign a long-term contract later this year. It hopes there will be technical,
economic and environmental benefits from the connection. Turkey already has interconnections
to Azerbaijan, Georgia, Iran, Iraq and Syria. International integration brings flexibility to the grid,
and this could be a positive driver for renewables penetration. The ambition is to establish Turkey
as an energy bridge that connects Western customers with suppliers from the East. It is also
expected that progress will continue being made on Turkey’s section of the southern gas corridor.
The Interconnector Turkey-Greece-Italy (ITGI) and the Trans-Anatolian pipeline represent two
infrastructure projects that could transform the region into an energy hub moving gas from
Azerbaijan, Iraq and Iran to Western Europe11
.
ENERGY STORAGE
Utility-scale energy storage could play an important role in terms of helping Turkey integrate its
renewable capacity and efficiently upgrade its power grid. Applications include price arbitrage,
frequency regulation, renewable energy integration, both transmission and distribution investment
deferral, voltage compensation and congestion relief (see Table 9).
Table 9: Opportunities for energy storage applications
Application group
Application Definition
Market-level applications
Frequency regulation This is the provision or absorption of short bursts of power to maintain the balance of supply and
demand and hence the frequency of power. This is often procured by the system operator.
Other ancillary services
This involves the provision of power, real or reactive, to the system, often procured by system
operators. Reserves and frequency regulation are covered in other applications, examples of other ancillary services include reactive power.
Price arbitrage This involves buying electricity in the power market when prices are low, store it and then sell it
when prices are higher.
System-level applications
Renewables integration This involves being connected to renewable assets and manages the output of the assets so that they have a less negative impact on the operations of the grid.
Transmission-
level applications
Investment deferral Here modular energy storage system is used to meet the incremental increase in transmission
capacity requirement instead of a much more expensive upgrade to the transmission line itself.
Reduction of transmission
access charges
Energy storage system is used to reduce the peak load, thus reducing the transmission access
charges that need to be paid by the load to access the transmission system.
Reduction of transmission congestion charges
Energy storage system is used to reduce the peak load, thus reducing the congestion charges that need to be paid by the load in congested areas.
Voltage compensation Energy storage system with the right electronics can provide reactive power to the transmission
system in similar ways to a capacitor or STATCOM.
Distribution-level
applications
Investment deferral Modular energy storage system is used to meet the incremental increase in distribution capacity requirement instead of a more expensive upgrade to the distribution line itself.
Reduction of distribution
access charges
Energy storage system is used to reduce the peak load, thus reducing the distribution access
charges that need to be paid by the load to access the distribution system.
Voltage compensation Energy storage system with the right electronics can provide reactive power to the distribution
system in similar ways to a capacitor bank.
Turkey currently relies on the obligatory provision of various grid services (mandated or directly by
the state-owned grid operators) and this is limiting storage demand. Regulatory changes will be
required to allow storage to play a role. By contrast, South Korea recently announced that it was
switching from mandatory provision of frequency regulation to a storage market of 500MW by
2017; and in Chile generators are allowed to use energy storage to provide frequency regulation
to the grid instead of using their generation capacity.
11 Today’s Zaman (2013) “Regional hub Turkey becoming energy exchange centre”, available at:
http://www.todayszaman.com/news-331468-regional-hub-turkey-becoming-energy-exchange-
center.html (retrieved on 5 June 2014)

TURKEY'S CHANGING POWER MARKETS
18 NOVEMBER 2014
© Bloomberg Finance L.P.2015
No portion of this document may be reproduced, scanned into an electronic system, distributed, publicly displayed or used as the basis of derivative works without the prior written consent of Bloomberg Finance L.P. For more information on terms of use, please contact [email protected]. Copyright and Disclaimer notice on page 52 applies throughout. Page 13 of 48
SECTİON 3. OFFICIAL PLAN In the previous section, we outlined the current state of the Turkish power market, while
sketching out the government’s broader policy and development plans. In this section, we
build a demand and generation capacity forecast – based on Turkey’s official energy
plans. This section will also serve as a comparator for two alternative scenarios in Section
4 and Section 5.
3.1. SUMMARY
• The government believes there will be significant growth in power demand in the next two
decades, with current levels almost doubling by 2023.
• It plans to match growing demand with the ambitious construction of new coal, hydro and
onshore wind capacity.
• It hopes no additional natural gas capacity will come online as it attempts to improve trade
balances and lower fuel import dependency.
Figure 4: "Official Plan" scenario projected capacity in Turkey, 2014-2030 (GW)
Source: TEIAS / Bloomberg New Energy Finance
3.2. METHODOLOGY
POWER DEMAND
The Turkish government publishes regular medium- to long-term forecasts on power demand. In
its most recent estimate, it suggests power demand will grow at 5.25% each year until 2030. Total
power generation should consequently rise from 239TWh in 2013 to 440TWh by 2023 – and
619TWh by 2030. We adhere to these power demand scenarios in the “Official Plan” scenario.
POWER GENERATION CAPACITY
To formulate the power generation and capacity plans from this government vision, we simply use
the targets for 2023 and 2030 and linearly interpolate between 2014 and 2022, and 2024 and
2029. The data points for 2023 and 2030 merge two different official sources (the General
Directorate of Energy Affairs and the Turkish Ministry of Energy) and, generally, they align well
0
20
40
60
80
100
120
140
160
180
2014 2017 2020 2023 2026 2029
Biomass
Solar
Wind
Geothermal
Hydro
Nuclear
Natural gas
Oil
Lignite
Hard coal

TURKEY'S CHANGING POWER MARKETS
18 NOVEMBER 2014
© Bloomberg Finance L.P.2015
No portion of this document may be reproduced, scanned into an electronic system, distributed, publicly displayed or used as the basis of derivative works without the prior written consent of Bloomberg Finance L.P. For more information on terms of use, please contact [email protected]. Copyright and Disclaimer notice on page 52 applies throughout. Page 14 of 48
but there is a small divergence after 2023 because different government bodies use contrasting
numbers (see Figure 4)12
.
3.3. CAPACITY AND GENERATION FORECAST
Figure 5: "Official Plan" scenario projected power generation in Turkey, 2014-2030 (TWh)
Source: TEIAS, Bloomberg New Energy Finance
Table 10 summarises anticipated power generation capacity for specific years before 2030 when
taking into account government targets for 2023 and 2030.
Table 10: "Official Plan" installed capacity in Turkey, 2000-2030 (MW)
Technology 2014 2018 2023 2030
Hard coal 5,005 6,672 8,755 12,257
Lignite 9,288 12,380 16,245 22,743
Oil 737 854 1,000 1,000
Natural gas 24,672 24,818 25,000 25,000
Nuclear 0 0 9,600 12,000
Hydro 23,660 29,145 36,000 36,000
Geothermal 340 456 600 1,000
Wind 4,484 11,380 20,000 38,000
Solar 318 1,510 3,000 16,000
Biomass 153 530 1,000 1,000
Total 68,658 87,743 121,200 165,000
Source: TEIAS, GDEA and Bloomberg New Energy Finance Note: figures in purple indicate official
government targets, not BNEF projections; Total figures might not add up due to rounding.
12 Sources: Strategic government documents (for 2023 targets); Demircan, Z. (2013). What Energy Mix for
Turkey in 2030. Power Point Presentation. General Directorate of Energy Affairs, Ministry of Energy and
Natural Resources. Wind Workshop. 26 March 2013, Ankara. Retrieved March 28, 2013 from the World
Wide Web: http://events.ewea.org/events/workshops/wp-content/uploads/2013/03/EWEA-TUREB-
Workshop-27-3-2013-Zafer-Demircan.pdf (for 2030 targets)
0
100
200
300
400
500
600
700
2014 2017 2020 2023 2026 2029
Biomass
Solar
Wind
Geothermal
Hydro
Nuclear
Natural gas
Oil
Lignite
Hard coal
The official plan projects
total power demand to
reach more than 600TWh
by 2030.
TURKEY'S CHANGING POWER MARKETS
18 NOVEMBER 2014
© Bloomberg Finance L.P.2015
No portion of this document may be reproduced, scanned into an electronic system, distributed, publicly displayed or used as the basis of derivative works without the prior written consent of Bloomberg Finance L.P. For more information on terms of use, please contact [email protected]. Copyright and Disclaimer notice on page 52 applies throughout. Page 15 of 48
SECTİON 4. BUSINESS-AS-USUAL SCENARIO In this section, we will lay out the methodology and assumptions that drive our business-
as-usual scenario – particularly in terms of power demand growth and capacity additions.
4.1. SUMMARY
POWER DEMAND
• Drawing on our internal power demand modelling, which is based on GDP per capita
development, we conclude that the Turkish government forecast significantly overestimates
future power demand.
• Our own projections suggest that power demand will reach 373TWh by 2023 and 462TWh by
2030. These forecasts assume per-capita power demand growth will flatten as the country
develops. The government also has a stated ambition of growing the service sector of its
economy. The trajectory of Turkish power demand indicates it will converge with more
developed Western Europe markets in the coming decade.
POWER GENERATION CAPACITY
• In our BAU scenario, natural gas becomes less important to Turkey’s energy mix: its market
share of total power generation will slide to 32% by 2023 from 44% in 2013.
• The government’s dash-for-coal plan will boost hard coal and lignite-fired plants; these two
resources will together provide 35% towards Turkey’s 2030 power generation – up from the
current 26% share. We assume that capacity factors for all technologies but natural gas will
remain at historical average rates.
• The share of renewables when excluding hydro, as a proportion of total generation, will
increase from 4% in 2013 to 14% in 2030, with wind alone contributing 10%. In assessing the
government plans, and particularly wind and solar, it is worth pointing out that in most other
countries solar and wind installed capacity are more in balance.
• There will be sufficient thermal, hydro and nuclear capacity to provide the back-up capacity
required by the government energy plans and to meet expected peak demand.
4.2. POWER DEMAND
Starting with the government plan, and using data on the growth of European economies in
Europe, Bloomberg New Energy Finance concludes that the demand growth rate will be lower
than the government forecast. We have assembled a set of parameters that form the basis of our
BAU scenario assumptions, and further details can be found in the Appendix. We estimate that
Turkish power consumption will climb by 47% in the coming decade to 373TWh per annum. We
assume electricity demand per capita will follow a similar path to other European nations at
different levels of personal wealth. Despite the outlook of continuing demand expansion, the
percentage growth rate is likely to slow before 2030 (see Figure 6). The reasons for this are
outlined in the next section.

TURKEY'S CHANGING POWER MARKETS
18 NOVEMBER 2014
© Bloomberg Finance L.P.2015
No portion of this document may be reproduced, scanned into an electronic system, distributed, publicly displayed or used as the basis of derivative works without the prior written consent of Bloomberg Finance L.P. For more information on terms of use, please contact [email protected]. Copyright and Disclaimer notice on page 52 applies throughout. Page 16 of 48
Figure 6: Turkish power demand, 1996-2030 (TWh / Year)
Source: Bloomberg New Energy Finance, Turkey Energy Market Regulatory Authority
WHY THE PAST IS NOT ALWAYS A GOOD GUIDE TO THE FUTURE
Population growth should slow
A total of 76.5m people lived in Turkey in 2013, 9.7m more than a decade ago. By 2023, the total
is expected to grow by 7.8m, because as countries get richer populations tend to grow more
slowly. Between now and 2035, the number of residents is likely to increase at a compound
annual growth rate (CAGR) of 0.8% – well below the 1.4% rate observed between 1990 and 2013
– according to data from the Turkish Statistical Institute.
Figure 7: European economies annual power demand and GDP per capita (1990-2012)
Annual consumption (MWh / Capita)
GDP / Capita (in euro)
Source: Bloomberg New Energy Finance, Energy Market Regulatory Authority, Eurostat, ENTSO-E, IMF
Notes: the GDP per capita data uses 2005 euros and is purchasing power adjusted
0
50
100
150
200
250
300
350
400
450
500
1990 1993 1996 1999 2002 2005 2008 2011 2014 2017 2020 2023 2026 2029
6.4% CAGR (Historical)
3.9% CAGR (BNEF forecast)
0
1
2
3
4
5
6
7
8
9
0 5,000 10,000 15,000 20,000 25,000 30,000 35,000 40,000
Poland Portugal
Spain
France
UK
Germany
GreeceItaly
Turkey historical
Turkey projected
Our power demand
forecast puts Turkey on
a trajectory with other
developed European
economies.

TURKEY'S CHANGING POWER MARKETS
18 NOVEMBER 2014
© Bloomberg Finance L.P.2015
No portion of this document may be reproduced, scanned into an electronic system, distributed, publicly displayed or used as the basis of derivative works without the prior written consent of Bloomberg Finance L.P. For more information on terms of use, please contact [email protected]. Copyright and Disclaimer notice on page 52 applies throughout. Page 17 of 48
Electricity consumption per capita should flatten
Global historical trends show that a rapidly industrialising country requires steep rises in energy
consumption for each incremental unit of GDP per capita. However, as countries become
wealthier and the industrialisation process slows, each euro of additional GDP correlates with a
smaller increase in energy consumption. This finding is consistent with the observation that as
countries get richer, a greater proportion of its GDP growth tends to come from the service sector,
which is less energy-intensive than industrial sectors.
Turkey is currently in the bottom left hand corner of Figure 7, when compared to European
nations. The country saw very rapid and steep increases in electricity use at the end of the 20th
century, even though power intensity (as in power consumption per unit of GDP per capita)
remained below similar countries like Poland. Further sharp increases would however make
Turkey an outlier. It is therefore more likely that Turkey will follow the same trend as Poland,
Spain and Portugal with its energy consumption flattening as it becomes richer. The early signs of
slowing energy growth are, in fact, already becoming evident.
Figure 8 shows how Turkey compares to other developing economies. It falls well within its peer
group – with the exception of Brazil which enacted a successful energy efficiency programme in
2000.
Figure 8: Developing world economies annual power demand and GDP per capita (1990-
2012)
Annual consumption (MWh / Capita)
GDP / Capita
Source: Bloomberg New Energy Finance, Energy Market Regulatory Authority, Eurostat, ENTSO-E, IMF
Notes: GDP per capita data uses 2005 EUR rates and is purchasing power adjusted
Figure 9 shows that the ratio of power consumption to GDP has flattened in recent years, with
even a slight decline in 2013. Part of this trend is attributable to the falling share of heavy industry
in total electricity demand (see Figure 10). This has stabilised at between 45% and 47% – from
about 62% in 1990. And this is not because industrial demand has declined in absolute terms, but
rather that other sectors have grown disproportionately. Our demand forecasts take account of
the shifting trajectory of the economy, assuming an optimistic growth forecast that follows other
European nations.
0
0.5
1
1.5
2
2.5
3
3.5
4
4.5
5
0 2,000 4,000 6,000 8,000 10,000 12,000 14,000
Poland
Turkey historical
Turkey projected
BrazilMexico
South Africa
China
India

TURKEY'S CHANGING POWER MARKETS
18 NOVEMBER 2014
© Bloomberg Finance L.P.2015
No portion of this document may be reproduced, scanned into an electronic system, distributed, publicly displayed or used as the basis of derivative works without the prior written consent of Bloomberg Finance L.P. For more information on terms of use, please contact [email protected]. Copyright and Disclaimer notice on page 52 applies throughout. Page 18 of 48
Figure 9: Turkish GDP power intensity, 1990-2020 (GWh /
Real TRY bn)
Figure 10: Turkish electricity consumption shares by sector,
1990-2013 (%)
Source: Bloomberg New Energy Finance, IMF, Turkish electricity
transmission company (TEIAS). GDP figures are in real 1998 terns
Source: TEDC (Turkey Electricity Distribution Company)
The Turkish economy is relatively energy-intensive per unit of GDP, when compared to most of its
European peers (see Figure 11). This is perhaps because its service sector constitutes 64% of its
GDP, which is close to the world average but lower than in most developed nations. In the group
of displayed countries, it belongs to those with the lowest energy consumption per capita. The
government’s energy strategy aims to arrest this trend and shoot for higher energy consumption
per capita– an indicator of energy access levels in parallel with economic development – and
lower energy intensity of GDP. Developed economies are increasingly aspiring towards
increasing each unit of GDP growth at a lower rate of energy consumption.
Figure 11: Energy intensity vs. per capita consumption for select countries (2011)
Btu / GDP 2005 $
Mbtu / Capita
Source: US Energy Information Administration (EIA)
HOW DOES THE BAU SCENARIO COMPARE?
Our long-term power demand projections for Turkey fall well below even the most conservative
estimates of the Turkish government; it projects that generation will be 34% higher by 2030 than
our BAU forecast. Precedent suggests that the Turkish government systematically overestimates
0
500
1,000
1,500
2,000
2,500
1990 1993 1996 1999 2002 2005 2008 2011 2014 2017
20 22 21 21 22 22 22 23 23 25 24 24 23 23 23 24 24 24 24 25 24 24 23
56 6 6 6 6 8 8 9
9 10 10 11 12 13 14 14 15 15 16 16 16 16
62 58 58 58 56 56 55 53 53 51 50 48 49 49 49 48 48 48 46 45 46 47 47
0
10
20
30
40
50
60
70
80
90
100
1990 1995 2000 2005 2010
Other
Illumination
Government
Industrial
Commercial
Household
Finland
Sweden
Hungary
Turkey France
SpainGermanyGreece
ItalyDenmark
United Kingdom
Ireland
Brazil
Mexico
US
3000
4000
5000
6000
7000
8000
25 75 125 175 225 275 325
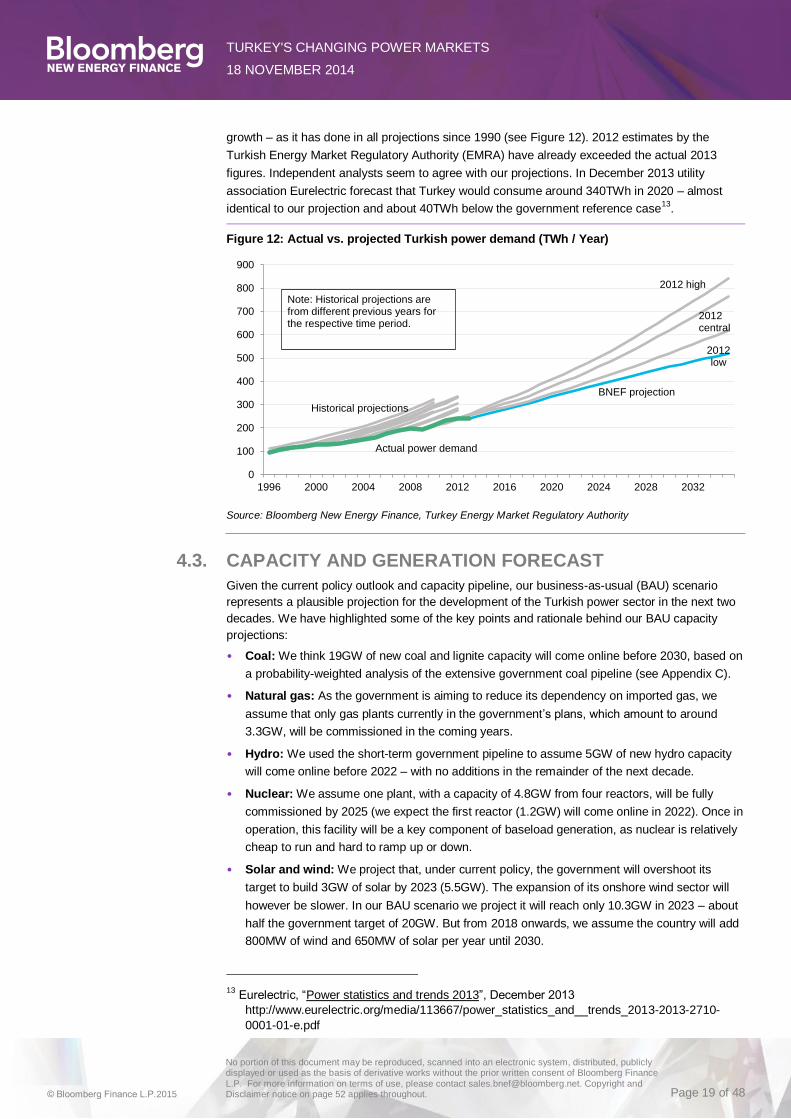
TURKEY'S CHANGING POWER MARKETS
18 NOVEMBER 2014
© Bloomberg Finance L.P.2015
No portion of this document may be reproduced, scanned into an electronic system, distributed, publicly displayed or used as the basis of derivative works without the prior written consent of Bloomberg Finance L.P. For more information on terms of use, please contact [email protected]. Copyright and Disclaimer notice on page 52 applies throughout. Page 19 of 48
growth – as it has done in all projections since 1990 (see Figure 12). 2012 estimates by the
Turkish Energy Market Regulatory Authority (EMRA) have already exceeded the actual 2013
figures. Independent analysts seem to agree with our projections. In December 2013 utility
association Eurelectric forecast that Turkey would consume around 340TWh in 2020 – almost
identical to our projection and about 40TWh below the government reference case13
.
Figure 12: Actual vs. projected Turkish power demand (TWh / Year)
Source: Bloomberg New Energy Finance, Turkey Energy Market Regulatory Authority
4.3. CAPACITY AND GENERATION FORECAST
Given the current policy outlook and capacity pipeline, our business-as-usual (BAU) scenario
represents a plausible projection for the development of the Turkish power sector in the next two
decades. We have highlighted some of the key points and rationale behind our BAU capacity
projections:
• Coal: We think 19GW of new coal and lignite capacity will come online before 2030, based on
a probability-weighted analysis of the extensive government coal pipeline (see Appendix C).
• Natural gas: As the government is aiming to reduce its dependency on imported gas, we
assume that only gas plants currently in the government’s plans, which amount to around
3.3GW, will be commissioned in the coming years.
• Hydro: We used the short-term government pipeline to assume 5GW of new hydro capacity
will come online before 2022 – with no additions in the remainder of the next decade.
• Nuclear: We assume one plant, with a capacity of 4.8GW from four reactors, will be fully
commissioned by 2025 (we expect the first reactor (1.2GW) will come online in 2022). Once in
operation, this facility will be a key component of baseload generation, as nuclear is relatively
cheap to run and hard to ramp up or down.
• Solar and wind: We project that, under current policy, the government will overshoot its
target to build 3GW of solar by 2023 (5.5GW). The expansion of its onshore wind sector will
however be slower. In our BAU scenario we project it will reach only 10.3GW in 2023 – about
half the government target of 20GW. But from 2018 onwards, we assume the country will add
800MW of wind and 650MW of solar per year until 2030.
13 Eurelectric, “Power statistics and trends 2013”, December 2013
http://www.eurelectric.org/media/113667/power_statistics_and__trends_2013-2013-2710-
0001-01-e.pdf
0
100
200
300
400
500
600
700
800
900
1996 2000 2004 2008 2012 2016 2020 2024 2028 2032
Actual power demand
Historical projections
2012 high
BNEF projection
2012 central
2012 low
Note: Historical projections are from different previous years for the respective time period.

TURKEY'S CHANGING POWER MARKETS
18 NOVEMBER 2014
© Bloomberg Finance L.P.2015
No portion of this document may be reproduced, scanned into an electronic system, distributed, publicly displayed or used as the basis of derivative works without the prior written consent of Bloomberg Finance L.P. For more information on terms of use, please contact [email protected]. Copyright and Disclaimer notice on page 52 applies throughout. Page 20 of 48
• Back-up capacity: In line with the government’s requirements, variable renewable capacity,
like solar and wind, should have sufficient back-up. We assume that coal, lignite, oil, natural
gas and nuclear plants will amply provide this cover. We assume all existing gas plants will
remain operational as back-up.
Figure 13: BAU scenario installed capacity in Turkey, 2014-2030 (GW)
Source: Turkey Energy Market Regulatory Authority (EMRA), Bloomberg New Energy Finance
Figure 14 shows our forecast for past and projected power generation in Turkey under our BAU
scenario conditions. The additional nuclear capacity will displace gas generation after 2022. We
believe this will lead to very low annual usage – or load factors – at gas plants, and potential
closures. The driver behind this trend is the higher marginal cost of gas plants, which require
costly fuel, unlike the newly-built nuclear plant which can generate power at a low cost once built.
Figure 14: BAU scenario power generation in Turkey, 2014-2030 (TWh)
Source: Turkey Energy Market Regulatory Authority (EMRA), Bloomberg New Energy Finance
0
20
40
60
80
100
120
140
2014 2017 2020 2023 2026 2029
Biomass
Solar
Wind
Geothermal
Hydro
Nuclear
Natural gas
Oil
Lignite
Hard coal
0
50
100
150
200
250
300
350
400
450
500
2014 2017 2020 2023 2026 2029
Biomass
Solar
Wind
Geothermal
Hydro
Nuclear
Natural gas
Oil
Lignite
Hard coal
Our BAU scenario
assumes a strong
growth in hard coal and
lignite capacity.

TURKEY'S CHANGING POWER MARKETS
18 NOVEMBER 2014
© Bloomberg Finance L.P.2015
No portion of this document may be reproduced, scanned into an electronic system, distributed, publicly displayed or used as the basis of derivative works without the prior written consent of Bloomberg Finance L.P. For more information on terms of use, please contact [email protected]. Copyright and Disclaimer notice on page 52 applies throughout. Page 21 of 48
Table 11: Official Plan and BAU scenario installed capacity projections, 2023/2030 (MW)
Scenario Official Plan BAU Scenario
2023 2030 2023 2030
Hard coal 8,755 12,257 12,108 19,318
Lignite 16,245 22,743 10,478 13,059
Oil 1,000 1,000 818 818
Natural gas 25,000 25,000 27,920 27,920
Nuclear 9,600 12,000 2,400 4,800
Hydro 36,000 36,000 27,434 27,434
Geothermal 600 1,000 703 703
Wind 20,000 38,000 10,302 15,902
Solar 3,000 16,000 5,500 10,050
Biomass 1,000 1,000 96 96
TOTAL 121,200 165,000 97,759 120,100
Source: Turkey Energy Market Regulatory Authority (EMRA), Bloomberg New Energy Finance; Note: Total
figures might not end up due to rounding.

TURKEY'S CHANGING POWER MARKETS
18 NOVEMBER 2014
© Bloomberg Finance L.P.2015
No portion of this document may be reproduced, scanned into an electronic system, distributed, publicly displayed or used as the basis of derivative works without the prior written consent of Bloomberg Finance L.P. For more information on terms of use, please contact [email protected]. Copyright and Disclaimer notice on page 52 applies throughout. Page 22 of 48
SECTİON 5. RENEWABLES DEVELOPMENT PATHWAY In this section, we build on the analysis from the business-as-usual (BAU) scenario to
create an alternative path that has a focus on renewable energy development. This means
that Turkey would meet most of the expected growth in power demand in the next decade
from renewable sources, mainly wind and solar, instead of the coal plants currently being
considered.
5.1. SUMMARY
The following four points represent some important observations from this scenario:
• Power demand will be slightly lower when compared to the BAU scenario. We believe there is
potential for efficiency improvements in the economy, triggered by both public sector policy
and private sector investment in new technology.
• Any net additional demand will not come from GHG-intensive coal-fired power plants, but from
a more aggressive build-out of renewable technologies – particularly wind, solar and hydro.
• By 2030, we project that renewables will amount to 26% of Turkey's power supply, excluding
hydro. Hydro’s share of total generation will be 21%.
• Gas will make up 26%, coal and lignite 18% and nuclear 8%, according to our projections.
Even in the light of these increases in variable generation and the strict back-up regulations, there
will be sufficient installed capacity to support expected peak demand
5.2. POWER DEMAND
Power demand in the RDP scenario draws on our forecast from the BAU scenario. Again we
assume there will be lower demand than outlined in the official plan and that there will be end-
user efficiency improvements. This scenario also projects slightly faster efficiency gains. In the
RDP scenario we project there will be annual incremental efficiency gains of 0.15% of annual
power demand, which will effectively serve to slow demand growth. As a result, generation
amounts to 367GWh in 2023 or about 6TWh lower than forecast in the BAU scenario. We align
these efficiency gains to our assessment of EU-28 member state efforts, which envisage
significantly less demand growth than Turkey. Consequently, the absolute impact on Turkish
power demand is relatively small. We believe these efficiency improvements will be driven by two
critical factors – government legislation and technology investment in energy efficiency. The
following case studies illustrate some comparable impacts on power demand development in
other countries.
CASE STUDY: GERMANY
Germany is a prime example of a country that managed to align GDP growth with its transition
towards having a cleaner and more productive energy economy. In the 20 years between 1991
and 2011, its GDP grew by 31%14
while power consumption per capita grew by only half that
amount. In the decade since 2001, its power consumption has stabilised at around 6.3MWh per
capita. The main drivers were not only concrete policy targets on energy intensity – like the 2005
coalition agreement, which aimed to double energy productivity by 2020 compared to 1990 – but
14 Eurostat, http://epp.eurostat.ec.europa.eu/portal/page/portal/statistics/search_database

TURKEY'S CHANGING POWER MARKETS
18 NOVEMBER 2014
© Bloomberg Finance L.P.2015
No portion of this document may be reproduced, scanned into an electronic system, distributed, publicly displayed or used as the basis of derivative works without the prior written consent of Bloomberg Finance L.P. For more information on terms of use, please contact [email protected]. Copyright and Disclaimer notice on page 52 applies throughout. Page 23 of 48
also its prescient recognition that the international competitiveness of German industry would rest
on resource efficiency.
CASE STUDY: BRAZIL
Our analysis suggests Brazilian power consumption stood at approximately 2.43MWh per capita
in 2011, close to our 2.51MWh per capita estimate for Turkey in the same year.15
By way of
context, in 2000 the Brazilian government passed a law to drive forward its energy efficiency
programme. It required utilities to use 0.5% of their annual revenues to work on end-user energy
efficiency, which equated to $248m in 2011. However, our analysis reveals that while the cost of
the programme – effectively $0.06 per kWh – was expensive, it did lower demand by an average
of 3.9TWh per year between 2008 and 2012, equivalent to 0.8% of net electricity consumption
from 2011. In the latest policy development, electricity distributors will have to provide smart
meters to all new customers and also, if requested, to existing residential users as of 1 January
2014. Brazil is at a similar stage of economic development to Turkey, and it has shown that with
progressive energy targets and legislation it can impact energy efficiency and arrest demand
growth.
ENERGY EFFICIENCY IN TURKEY
The above case studies give a flavour of how power demand and energy intensity have
developed in recent years in other nations, thanks to progressive policy and shifting investment
patterns. They likewise point a path forward for the Turkish government and economy. The
modernisation of inefficient transmission lines and aging grid connections should generally also
lead to efficiency improvements and lower demand. However, in Turkey’s case, the network and
distribution losses of around 15% largely relate to economic losses – unbilled electricity
consumption – and not physical losses. Reducing such economic losses would not therefore
result in less generation demand. The above figure shows historical transmission and distribution
losses and net supply to the grid of the Turkish power market.
Figure 15: Historical electricity transmission and distribution losses (%) in Turkey, 1970-
2012
Source: Turkish Electricity Transmission Company (TEIAS) Note: “transmission losses” represent a
percentage of net electricity supply; “distribution losses” represent a percentage of net electricity supply; “in-
plant losses” represent a percentage of gross generation; and “net supply” equates to gross generat ion less
direct consumption plus imports; Net supply = (Gross generation) – (In-Plant losses) + (Imports)
15 BNEF research note “Efficiency in Brazil: Tantalisingly out of reach” (11 December 2012)
0
2
4
6
8
10
12
14
16
18
1970 1973 1976 1979 1982 1985 1988 1991 1994 1997 2000 2003 2006 2009 2012
Transmission loss Distribution loss In-plant loss

TURKEY'S CHANGING POWER MARKETS
18 NOVEMBER 2014
© Bloomberg Finance L.P.2015
No portion of this document may be reproduced, scanned into an electronic system, distributed, publicly displayed or used as the basis of derivative works without the prior written consent of Bloomberg Finance L.P. For more information on terms of use, please contact [email protected]. Copyright and Disclaimer notice on page 52 applies throughout. Page 24 of 48
In terms of potential new legislation, Turkey’s 10th Development Plan draws attention to the
importance of transitioning towards Turkey developing a more information-based and less energy-
intensive economy. Improving energy efficiency is one of 25 transformation points outlined in the
plan. This underscores the likelihood that new policy will be implemented beyond what is
assumed in the BAU scenario. The Energy Efficiency Law (No. 5627), passed in 2007, outlines
some principles and procedures designed to promote energy efficiency measures across all
sectors of the economy. It does not set quantitative targets, but it does introduce regulation aimed
at expanding energy efficiency activity. Two such changes require the appointment of energy
managers and the monitoring and reporting of relevant information at a corporate and public
sector level. The law also puts in place a subsidy system for energy efficiency projects – for up to
20% of the cost – that have a payback period of five years or less and cost no more than TRY
500,000 ($237,000).
Figure 16: RDP scenario installed capacity in Turkey, 2014-2030 (GW)
Source: Bloomberg New Energy Finance
5.3. RDP FORECAST HIGHLIGHTS
There are four key points worth drawing attention to from our RDP scenario:
• In the RDP scenario, we assume only coal-fired power plants that have either secured finance
or are under construction will come online before 2030 (around 3.3GW).
• The resulting gap in generation is then entirely met by a mix of renewable capacity additions –
wind (55%), solar (30%) and hydropower plants (15%).
• Oil, nuclear, geothermal and biomass capacity additions are equal to those in the BAU.
• Capacity factors and the use of natural gas power plants are assumed to be equal to the BAU
scenario.
0
20
40
60
80
100
120
140
2014 2017 2020 2023 2026 2029
Biomass
Solar
Wind
Geothermal
Hydro
Nuclear
Natural gas
Oil
Lignite
Hard coal
The Renewables
Development Pathway
replaces coal additions
with a mix of
renewables.

TURKEY'S CHANGING POWER MARKETS
18 NOVEMBER 2014
© Bloomberg Finance L.P.2015
No portion of this document may be reproduced, scanned into an electronic system, distributed, publicly displayed or used as the basis of derivative works without the prior written consent of Bloomberg Finance L.P. For more information on terms of use, please contact [email protected]. Copyright and Disclaimer notice on page 52 applies throughout. Page 25 of 48
Figure 17: RDP scenario power generation in Turkey, 2014-2030 (TWh)
Source: Bloomberg New Energy Finance
Table 12: Official Plan, BAU and RDP scenario installed capacity projections, 2023 and 2030 (MW)
Scenario Official Plan BAU Scenario RDP Scenario
Year 2023 2030 2023 2030 2023 2030
Hard coal 8,755 12,257 12,108 19,318 6,672 6,672
Lignite 16,245 22,743 10,478 13,059 9,741 9,741
Oil 1,000 1,000 818 818 1,048 1,048
Natural gas 25,000 25,000 27,920 27,920 27,920 27,920
Nuclear 9,600 12,000 2,400 4,800 2,400 4,800
Hydro 36,000 36,000 27,434 27,434 30,459 33,968
Geothermal 600 1,000 703 703 674 674
Wind 20,000 38,000 10,302 15,902 13,980 26,883
Solar 3,000 16,000 5,500 10,050 10,091 23,546
Biomass 1,000 1,000 96 96 184 184
Total 121,200 165,000 97,759 120,101 103,167 135,435
Source: TEIAS, Bloomberg New Energy Finance; Note: Total figures might not end up due to rounding.
The above table compares the projected generation capacities, on a technology basis, for
specified years between the official plan and our two scenarios.
0
50
100
150
200
250
300
350
400
450
500
2014 2017 2020 2023 2026 2029
Biomass
Solar
Wind
Geothermal
Hydro
Nuclear
Natural gas
Oil
Lignite
Hard coal

TURKEY'S CHANGING POWER MARKETS
18 NOVEMBER 2014
© Bloomberg Finance L.P.2015
No portion of this document may be reproduced, scanned into an electronic system, distributed, publicly displayed or used as the basis of derivative works without the prior written consent of Bloomberg Finance L.P. For more information on terms of use, please contact [email protected]. Copyright and Disclaimer notice on page 52 applies throughout. Page 26 of 48
SECTİON 6. SCENARIOS COMPARISON Sections 3, 4 and 5 laid out the details behind three possible outcomes for the Turkish
power market in the next two decades. We now compare these three scenarios in terms of
power demand, new capacity and generation. The section highlights the opportunities for
renewable technologies to replace fossil-fuel generation.
6.1. POWER DEMAND
Our Turkish power demand forecast projects significantly less growth than the government
estimates. We believe that as GDP grows, the power consumption per capita data will follow a
similar line to other Western European countries, effectively slowing the current pace of demand
growth. The RDP scenario assumes energy efficiency improvements will be made at a similar
level to European targets – resulting in less demand than in the BAU scenario. Figure 18
compares the different power demand forecasts.
Figure 18: Scenario power generation projections, 2014-2030 (TWh)
Source: Turkish Government and Bloomberg New Energy Finance
The high government demand forecast significantly influences projected capacity additions. The
BAU and RDP demand forecasts diverge only slightly, on the other hand. It is worth noting that
the assumed efficiency gains of 0.15% in the RDP scenario are offset by the sizeable increase in
absolute demand.
6.2. CAPACITY ADDITIONS
The BAU and RDP scenarios require new capacity of 56GW and 72GW respectively by 2030, in
addition to what exists today. Current government plans would require 101GW of new build. It
should be noted that the government plan assumes there will be much higher demand (see
Figure 22), which increases the importance of adding new capacity.
0
100
200
300
400
500
600
700
2014 2018 2022 2026 2030
Business-as-usual (BAU)
Renewablesdevelopmentpathway (RDP)
Official energyplan

TURKEY'S CHANGING POWER MARKETS
18 NOVEMBER 2014
© Bloomberg Finance L.P.2015
No portion of this document may be reproduced, scanned into an electronic system, distributed, publicly displayed or used as the basis of derivative works without the prior written consent of Bloomberg Finance L.P. For more information on terms of use, please contact [email protected]. Copyright and Disclaimer notice on page 52 applies throughout. Page 27 of 48
Figure 19: Official plan capacity additions (GW) Figure 20: BAU scenario capacity additions (GW)
Figure 21: RDP scenario capacity additions (GW) Figure 22: Annual power generation, 2014-30 (TWh)
Source: Bloomberg New Energy Finance and TEIAS
• The high demand anticipated in the government plan requires significant capacity additions
across all technologies – apart from natural gas, where the government wants its share to fall.
• The coal capacity additions in our BAU scenario after 2023 are entirely replaced by
renewables in our RDP scenario. This results in a greater total figure for nameplate capacity
due to the lower load factors of wind and solar operating assets.
6.3. GENERATION MIX
Due to the differences in capacity additions and utilisation rates, our two scenarios also result in
differing generation mixes. Figure 23, Figure 24, Figure 25 and Figure 26 all project different
visions of how power generation could unfold up to 2030.
• The share of natural gas generation will decline in all three scenarios, in line with the
government aim. This could dent the profitability of such assets, even if their role as back-up
generators during peak times is growing.
• Under the current policy conditions, echoed in the official plan and BAU scenario, coal will win
a greater share of the generational mix as the government looks to promote domestic
resources by pushing the development of new coal fields.
• Renewables, and onshore wind in particular, will take a larger share of the generation mix. In
the short term, however, the official wind target seems too ambitious given the current pipeline
and the uncertainty surrounding the short life of the current feed-in-tariffs.
0
1
2
3
4
5
6
7
8
2014 2018 2022 2026 2030
Biomass
Solar
Wind
Geothermal
Hydro
Nuclear
Natural gas
Oil
Lignite
Hard coal 0
1
2
3
4
5
6
7
8
2014 2018 2022 2026 2030
Biomass
Solar
Wind
Geothermal
Hydro
Nuclear
Natural gas
Oil
Lignite
Hard coal
0
1
2
3
4
5
6
7
8
2014 2018 2022 2026 2030
Biomass
Solar
Wind
Geothermal
Hydro
Nuclear
Natural gas
Oil
Lignite
Hard coal 0
100
200
300
400
500
600
700
2014 2018 2022 2026 2030
Business-as-usual (BAU)
Renewablesdevelopmentpathway(RDP)
Officialenergy plan

TURKEY'S CHANGING POWER MARKETS
18 NOVEMBER 2014
© Bloomberg Finance L.P.2015
No portion of this document may be reproduced, scanned into an electronic system, distributed, publicly displayed or used as the basis of derivative works without the prior written consent of Bloomberg Finance L.P. For more information on terms of use, please contact [email protected]. Copyright and Disclaimer notice on page 52 applies throughout. Page 28 of 48
• Similarly, we consider the nuclear plans unrealistic, given that not a single plant is under
construction at this point. We think the official nuclear plans will struggle to meet both their
projected commissioning dates and full potential. We believe the first Rosatom plant could get
commissioned between 2020 and 2022, despite currently being behind its initial projected
timeline.
Figure 23: Power generation technology mix, 2023 Figure 24: Power generation technology mix, 2030
Figure 25: Power generation scenario comparison, 2023 Figure 26: Power generation scenario comparison, 2030
Source: Bloomberg New Energy Finance. Note: Renewables figures include hydro
12% 11%17%
10%
15% 16%13%
12%
41%
16%
32%
33%
17%
5%
5%
26%
23%
21%
24%
3%
13%8%
11%
1% 2% 4%
0%
10%
20%
30%
40%
50%
60%
70%
80%
90%
100%
Current OP2023 BAU2023 RDP2023
Biomass
Solar
Wind
Geothermal
Hydro
Nuclear
Natural gas
Oil
Lignite
Hard coal 12% 11%
22%
8%
15% 16%
13%
10%
41%
18%
25%
26%
15%
8%
8%
26%
17%
17%
21%
3%
17%
10%
17%
4% 3%8%
0%
10%
20%
30%
40%
50%
60%
70%
80%
90%
100%
Current OP2030 BAU2030 RDP2030
Biomass
Solar
Wind
Geothermal
Hydro
Nuclear
Natural gas
Oil
Lignite
Hard coal
71%
44%
63%55%
29%
39%
32%40%
17%5% 5%
0%
10%
20%
30%
40%
50%
60%
70%
80%
90%
100%
Current GP 2023 BAU 2023 RDP 2023
Nuclear
Renewables
Fossil fuels 71%
45%
61%
44%
29%
40%
31%
47%
15%8% 8%
0%
10%
20%
30%
40%
50%
60%
70%
80%
90%
100%
Current GP 2030 BAU 2030 RDP 2030
Nuclear
Renewables
Fossil fuels
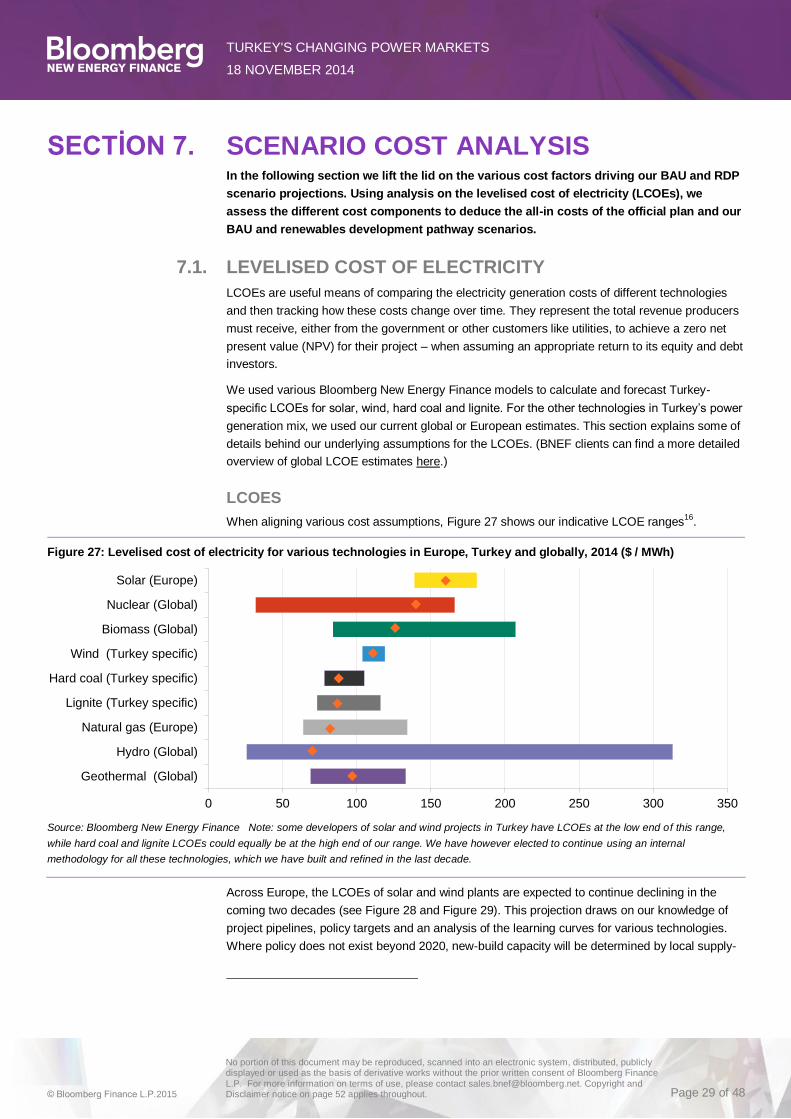
TURKEY'S CHANGING POWER MARKETS
18 NOVEMBER 2014
© Bloomberg Finance L.P.2015
No portion of this document may be reproduced, scanned into an electronic system, distributed, publicly displayed or used as the basis of derivative works without the prior written consent of Bloomberg Finance L.P. For more information on terms of use, please contact [email protected]. Copyright and Disclaimer notice on page 52 applies throughout. Page 29 of 48
SECTİON 7. SCENARIO COST ANALYSIS In the following section we lift the lid on the various cost factors driving our BAU and RDP
scenario projections. Using analysis on the levelised cost of electricity (LCOEs), we
assess the different cost components to deduce the all-in costs of the official plan and our
BAU and renewables development pathway scenarios.
7.1. LEVELISED COST OF ELECTRICITY
LCOEs are useful means of comparing the electricity generation costs of different technologies
and then tracking how these costs change over time. They represent the total revenue producers
must receive, either from the government or other customers like utilities, to achieve a zero net
present value (NPV) for their project – when assuming an appropriate return to its equity and debt
investors.
We used various Bloomberg New Energy Finance models to calculate and forecast Turkey-
specific LCOEs for solar, wind, hard coal and lignite. For the other technologies in Turkey’s power
generation mix, we used our current global or European estimates. This section explains some of
details behind our underlying assumptions for the LCOEs. (BNEF clients can find a more detailed
overview of global LCOE estimates here.)
LCOES
When aligning various cost assumptions, Figure 27 shows our indicative LCOE ranges16
.
Figure 27: Levelised cost of electricity for various technologies in Europe, Turkey and globally, 2014 ($ / MWh)
Source: Bloomberg New Energy Finance Note: some developers of solar and wind projects in Turkey have LCOEs at the low end of this range,
while hard coal and lignite LCOEs could equally be at the high end of our range. We have however elected to continue using an internal
methodology for all these technologies, which we have built and refined in the last decade.
Across Europe, the LCOEs of solar and wind plants are expected to continue declining in the
coming two decades (see Figure 28 and Figure 29). This projection draws on our knowledge of
project pipelines, policy targets and an analysis of the learning curves for various technologies.
Where policy does not exist beyond 2020, new-build capacity will be determined by local supply-
0 50 100 150 200 250 300 350
Geothermal (Global)
Hydro (Global)
Natural gas (Europe)
Lignite (Turkey specific)
Hard coal (Turkey specific)
Wind (Turkey specific)
Biomass (Global)
Nuclear (Global)
Solar (Europe)
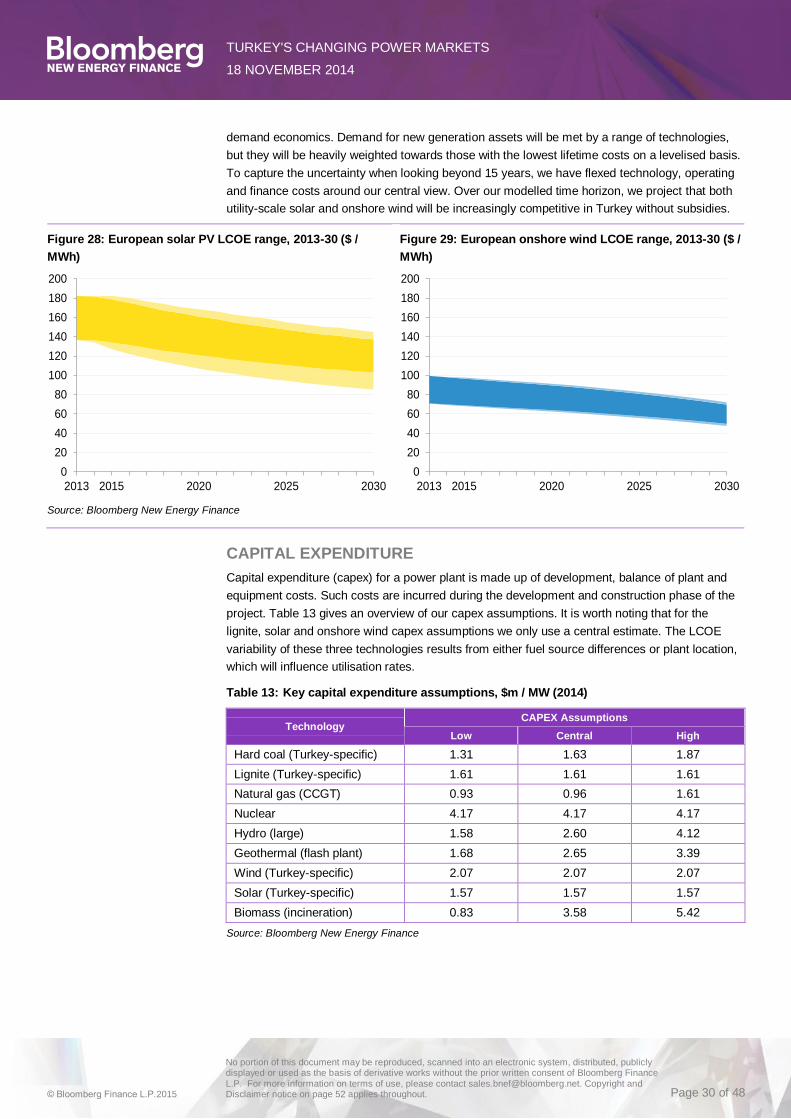
TURKEY'S CHANGING POWER MARKETS
18 NOVEMBER 2014
© Bloomberg Finance L.P.2015
No portion of this document may be reproduced, scanned into an electronic system, distributed, publicly displayed or used as the basis of derivative works without the prior written consent of Bloomberg Finance L.P. For more information on terms of use, please contact [email protected]. Copyright and Disclaimer notice on page 52 applies throughout. Page 30 of 48
demand economics. Demand for new generation assets will be met by a range of technologies,
but they will be heavily weighted towards those with the lowest lifetime costs on a levelised basis.
To capture the uncertainty when looking beyond 15 years, we have flexed technology, operating
and finance costs around our central view. Over our modelled time horizon, we project that both
utility-scale solar and onshore wind will be increasingly competitive in Turkey without subsidies.
Figure 28: European solar PV LCOE range, 2013-30 ($ /
MWh)
Figure 29: European onshore wind LCOE range, 2013-30 ($ /
MWh)
Source: Bloomberg New Energy Finance
CAPITAL EXPENDITURE
Capital expenditure (capex) for a power plant is made up of development, balance of plant and
equipment costs. Such costs are incurred during the development and construction phase of the
project. Table 13 gives an overview of our capex assumptions. It is worth noting that for the
lignite, solar and onshore wind capex assumptions we only use a central estimate. The LCOE
variability of these three technologies results from either fuel source differences or plant location,
which will influence utilisation rates.
Table 13: Key capital expenditure assumptions, $m / MW (2014)
Technology CAPEX Assumptions
Low Central High
Hard coal (Turkey-specific) 1.31 1.63 1.87
Lignite (Turkey-specific) 1.61 1.61 1.61
Natural gas (CCGT) 0.93 0.96 1.61
Nuclear 4.17 4.17 4.17
Hydro (large) 1.58 2.60 4.12
Geothermal (flash plant) 1.68 2.65 3.39
Wind (Turkey-specific) 2.07 2.07 2.07
Solar (Turkey-specific) 1.57 1.57 1.57
Biomass (incineration) 0.83 3.58 5.42
Source: Bloomberg New Energy Finance
0
20
40
60
80
100
120
140
160
180
200
2013 2015 2020 2025 2030
0
20
40
60
80
100
120
140
160
180
200
2013 2015 2020 2025 2030
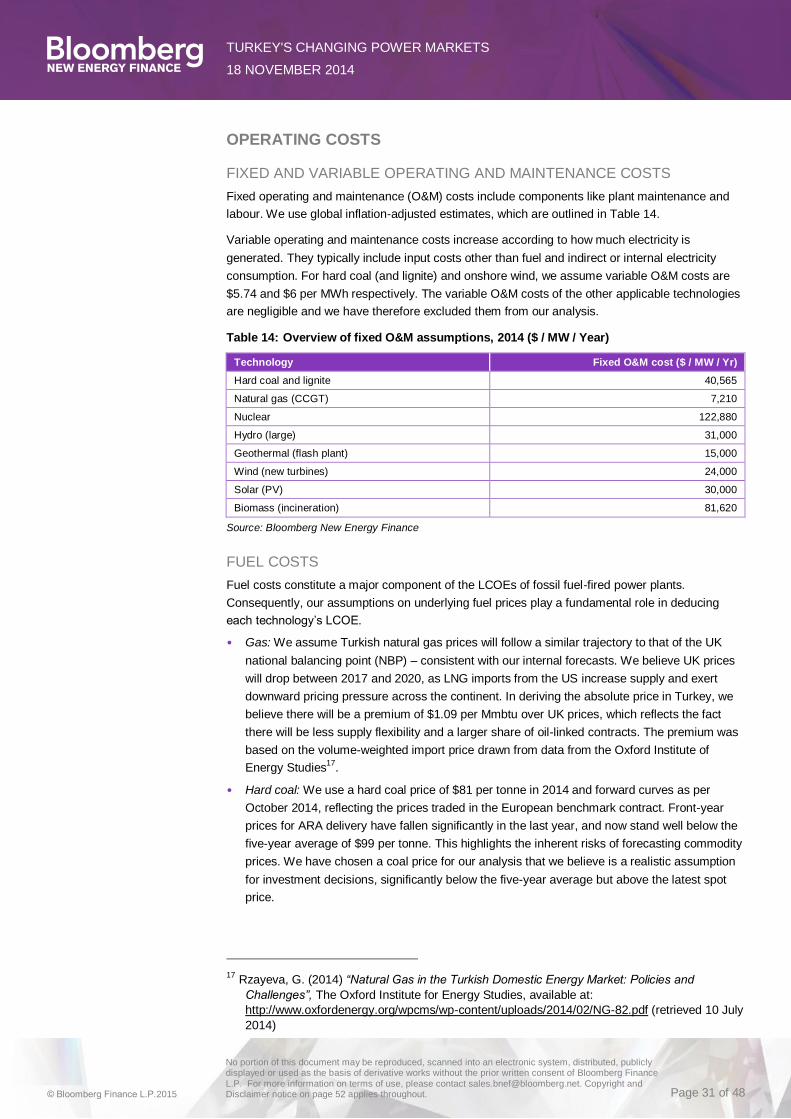
TURKEY'S CHANGING POWER MARKETS
18 NOVEMBER 2014
© Bloomberg Finance L.P.2015
No portion of this document may be reproduced, scanned into an electronic system, distributed, publicly displayed or used as the basis of derivative works without the prior written consent of Bloomberg Finance L.P. For more information on terms of use, please contact [email protected]. Copyright and Disclaimer notice on page 52 applies throughout. Page 31 of 48
OPERATING COSTS
FIXED AND VARIABLE OPERATING AND MAINTENANCE COSTS
Fixed operating and maintenance (O&M) costs include components like plant maintenance and
labour. We use global inflation-adjusted estimates, which are outlined in Table 14.
Variable operating and maintenance costs increase according to how much electricity is
generated. They typically include input costs other than fuel and indirect or internal electricity
consumption. For hard coal (and lignite) and onshore wind, we assume variable O&M costs are
$5.74 and $6 per MWh respectively. The variable O&M costs of the other applicable technologies
are negligible and we have therefore excluded them from our analysis.
Table 14: Overview of fixed O&M assumptions, 2014 ($ / MW / Year)
Technology Fixed O&M cost ($ / MW / Yr)
Hard coal and lignite 40,565
Natural gas (CCGT) 7,210
Nuclear 122,880
Hydro (large) 31,000
Geothermal (flash plant) 15,000
Wind (new turbines) 24,000
Solar (PV) 30,000
Biomass (incineration) 81,620
Source: Bloomberg New Energy Finance
FUEL COSTS
Fuel costs constitute a major component of the LCOEs of fossil fuel-fired power plants.
Consequently, our assumptions on underlying fuel prices play a fundamental role in deducing
each technology’s LCOE.
• Gas: We assume Turkish natural gas prices will follow a similar trajectory to that of the UK
national balancing point (NBP) – consistent with our internal forecasts. We believe UK prices
will drop between 2017 and 2020, as LNG imports from the US increase supply and exert
downward pricing pressure across the continent. In deriving the absolute price in Turkey, we
believe there will be a premium of $1.09 per Mmbtu over UK prices, which reflects the fact
there will be less supply flexibility and a larger share of oil-linked contracts. The premium was
based on the volume-weighted import price drawn from data from the Oxford Institute of
Energy Studies17
.
• Hard coal: We use a hard coal price of $81 per tonne in 2014 and forward curves as per
October 2014, reflecting the prices traded in the European benchmark contract. Front-year
prices for ARA delivery have fallen significantly in the last year, and now stand well below the
five-year average of $99 per tonne. This highlights the inherent risks of forecasting commodity
prices. We have chosen a coal price for our analysis that we believe is a realistic assumption
for investment decisions, significantly below the five-year average but above the latest spot
price.
17 Rzayeva, G. (2014) “Natural Gas in the Turkish Domestic Energy Market: Policies and
Challenges”, The Oxford Institute for Energy Studies, available at:
http://www.oxfordenergy.org/wpcms/wp-content/uploads/2014/02/NG-82.pdf (retrieved 10 July
2014)

TURKEY'S CHANGING POWER MARKETS
18 NOVEMBER 2014
© Bloomberg Finance L.P.2015
No portion of this document may be reproduced, scanned into an electronic system, distributed, publicly displayed or used as the basis of derivative works without the prior written consent of Bloomberg Finance L.P. For more information on terms of use, please contact [email protected]. Copyright and Disclaimer notice on page 52 applies throughout. Page 32 of 48
• Lignite: we derive our lignite prices again from Yildirim figures18
. They amount to $20 per
tonne for domestically-sourced lignite. We believe the price for this fuel will be more stable
because there is less international lignite trade and it is usually locally sourced. We assume
the costs will stay constant in real terms.
• Nuclear: we assume nuclear fuel costs, in real terms, will also remain constant up to 2030.
Figure 30: BNEF Turkish fuel price assumptions
$ / tonne (nominal) $ / MMBTU (nominal)
Source: Bloomberg New Energy Finance Note: y1 and y2 represent the left and right y-axes
FINANCE ASSUMPTIONS
Our Turkey-specific LCOEs for select technologies come from an internal project finance model.
Various assumptions concerning how the theoretical project is financed must be made, and we
detail the key features below:
• Debt-to-equity ratio: power plants are financed through a mixture of debt and equity. In the
Turkey-specific LCOEs, we assume the debt share is between 65 and 75% depending on the
commissioning year and technology.
• Hurdle rate: The hurdle rate represents the required rate of return for equity investors in the
power plant project. It varies between technologies due to differences in maturity and risk
perception. In our Turkey-specific LCOEs, we assume a constant hurdle rate of 11% for
onshore wind and 13% for solar PV. There is a downside potential for the LCOEs of
renewable technologies, as it can be expected that hurdle rates will decline with maturing
technologies.
• Debt costs: In the debt financing component, we use interest rates drawing from USD swap
rates. Each swap rate is technology specific, for instance the rate is longer-dated for onshore
wind projects than solar projects. The time horizon depends on the terms of loan tenor for
each technology, adjusting the spread to account for debt funding during construction and
operation. The debt spread in the Turkey-specific LCOEs ranges between 300 and 500 basis
points.
18 Turna, T. (2013) “Macro-Economic Assessment of Power Generation Technologies Under the
Latest Market Conditions: A Case Study of the Power Market in Turkey”, Yıldırım Energy Investments Inc. available at: http://www.yildirimenergy.com/uploads/Dr_Tamer_TURNA_Manuscript_for_Power_Gen_Vienna_13_05_2012.pdf (retrieved 26 June 2014)
0
2
4
6
8
10
12
0
20
40
60
80
100
120
2015 2017 2019 2021 2023 2025 2027 2029
Hard coal (y1) Lignite (y1) Natural gas (y2) Nuclear (y2)
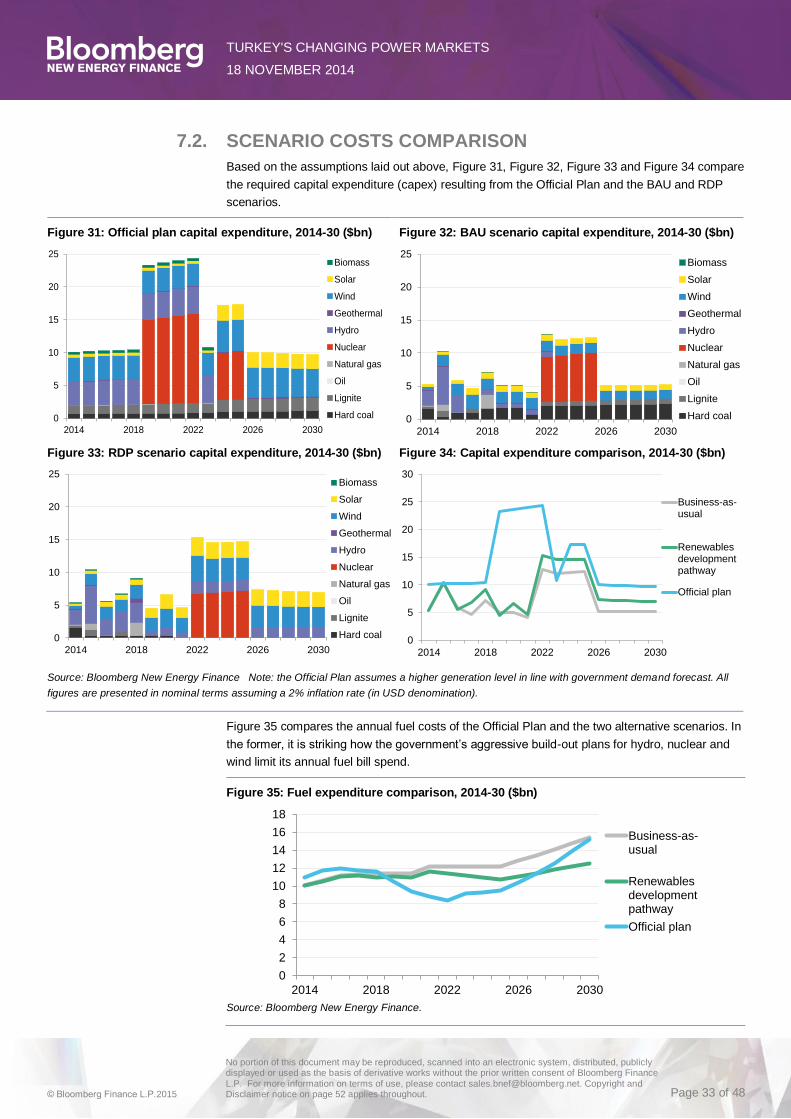
TURKEY'S CHANGING POWER MARKETS
18 NOVEMBER 2014
© Bloomberg Finance L.P.2015
No portion of this document may be reproduced, scanned into an electronic system, distributed, publicly displayed or used as the basis of derivative works without the prior written consent of Bloomberg Finance L.P. For more information on terms of use, please contact [email protected]. Copyright and Disclaimer notice on page 52 applies throughout. Page 33 of 48
7.2. SCENARIO COSTS COMPARISON
Based on the assumptions laid out above, Figure 31, Figure 32, Figure 33 and Figure 34 compare
the required capital expenditure (capex) resulting from the Official Plan and the BAU and RDP
scenarios.
Figure 31: Official plan capital expenditure, 2014-30 ($bn) Figure 32: BAU scenario capital expenditure, 2014-30 ($bn)
Figure 33: RDP scenario capital expenditure, 2014-30 ($bn) Figure 34: Capital expenditure comparison, 2014-30 ($bn)
Source: Bloomberg New Energy Finance Note: the Official Plan assumes a higher generation level in line with government demand forecast. All
figures are presented in nominal terms assuming a 2% inflation rate (in USD denomination).
Figure 35 compares the annual fuel costs of the Official Plan and the two alternative scenarios. In
the former, it is striking how the government’s aggressive build-out plans for hydro, nuclear and
wind limit its annual fuel bill spend.
Figure 35: Fuel expenditure comparison, 2014-30 ($bn)
Source: Bloomberg New Energy Finance.
0
5
10
15
20
25
2014 2018 2022 2026 2030
Biomass
Solar
Wind
Geothermal
Hydro
Nuclear
Natural gas
Oil
Lignite
Hard coal 0
5
10
15
20
25
2014 2018 2022 2026 2030
Biomass
Solar
Wind
Geothermal
Hydro
Nuclear
Natural gas
Oil
Lignite
Hard coal
0
5
10
15
20
25
2014 2018 2022 2026 2030
Biomass
Solar
Wind
Geothermal
Hydro
Nuclear
Natural gas
Oil
Lignite
Hard coal0
5
10
15
20
25
30
2014 2018 2022 2026 2030
Business-as-usual
Renewablesdevelopmentpathway
Official plan
0
2
4
6
8
10
12
14
16
18
2014 2018 2022 2026 2030
Business-as-usual
Renewablesdevelopmentpathway
Official plan

TURKEY'S CHANGING POWER MARKETS
18 NOVEMBER 2014
© Bloomberg Finance L.P.2015
No portion of this document may be reproduced, scanned into an electronic system, distributed, publicly displayed or used as the basis of derivative works without the prior written consent of Bloomberg Finance L.P. For more information on terms of use, please contact [email protected]. Copyright and Disclaimer notice on page 52 applies throughout. Page 34 of 48
TOTAL SCENARIO COSTS
Figure 36 and Figure 37 show the sum of the estimated annual and cumulative costs for capital
expenditure, operating costs and fuel use.
Figure 36: Annual sum of capital and operating expenditure (including fuel use) 2014-30
($bn)
Figure 37: Cumulative sum of capital and operating expenditure (including fuel use) 2014-
30 ($bn)
Source: Bloomberg New Energy Finance, Note: Discounted to 2014 values at 8%
As generation costs will change significantly over the period we are considering, a discounted
cash flow analysis gives a more accurate perspective on each scenario’s costs. Table 15 shows
the net present value of these generation costs at three different discount rates.
Table 15: Total discounted cost assessment over 2014-2030 ($bn)
Scenario Discount rate
4% 8% 12%
Official plan 369 273 209
Business-as-usual 280 205 157
Renewables development pathway 285 209 160
Source: Bloomberg New Energy Finance Note: these are the discounted total costs for each scenario (2014-
2030) including capex, opex and fuel use. Costs of energy efficiency improvements are not estimated.
CONCLUSIONS
• The BAU scenario will require the least capital expenditure – due to the higher capacity
factors of the coal fleet that we anticipate will provide future power, compared with those of
the renewable alternatives.
0
5
10
15
20
25
30
35
40
2014 2018 2022 2026 2030
Business-as-usual Renewables development pathway Official plan
0
50
100
150
200
250
300
2014 2016 2018 2020 2022 2024 2026 2028 2030
Business-as-usual Renewables development pathway Official plan

TURKEY'S CHANGING POWER MARKETS
18 NOVEMBER 2014
© Bloomberg Finance L.P.2015
No portion of this document may be reproduced, scanned into an electronic system, distributed, publicly displayed or used as the basis of derivative works without the prior written consent of Bloomberg Finance L.P. For more information on terms of use, please contact [email protected]. Copyright and Disclaimer notice on page 52 applies throughout. Page 35 of 48
• However, fuel costs in the BAU are substantially higher than in the RDP scenario, which
ultimately serves to put them both at a similar level by 2030.
• While the overall costs of the RDP scenario are higher in the short run, as new capacity is
financed and built, the lower fuel costs that accompany a more ambitious renewables strategy
result in a slightly lower total spend in the middle to late years.
• The future decline in the solar and onshore wind LCOEs drive the long-term cost efficiency of
the RDP scenario.
• As the official plan assumes a significantly stronger power demand, its power generation costs
are naturally higher.
TRADE BALANCE IMPACTS
Gas imports
One of the main drivers behind the Turkey government’s ambitions to shift its fuel mix away from
natural gas is the heavy toll that such imports have on its trade balance. The majority of its natural
gas demand comes from imports. We estimate Turkey will spend between $8 and $10bn
importing natural gas to support its grid-connected electricity generation in 2014 – or just below
the $10.2bn of foreign direct investment the nation attracted in 201319
. This figure would remain
relatively stable in both our scenarios, in nominal terms, because our scenarios indicate that
investment in either new coal or renewable capacity is unlikely to reduce the absolute level of
natural gas use – even if its proportional share declines sharply.
The main impact of the BAU and RDP scenarios on Turkey’s trade balance, will therefore be in
stabilising its gas import costs. However, the alternative of limiting gas expenditure will also
require imports of either hard coal or renewable energy systems, if they are not manufactured
domestically.
Hard coal imports
In our BAU scenario, most of the growth in tomorrow’s electricity demand is met by new lignite
and hard coal power plants. It is likely that these lignite resources will come from domestic
production but, based on its recent history, Turkey would have to continue importing around 80%
of hard coal20
. In the BAU scenario, the annual spend on hard coal could rise from an estimated
nominal figure of $1bn in 2014 to $4bn by 2030, as hard coal generation more than triples. For
our calculations in Figure 38 we assume that 50% of the capital expenditure on hard coal will flow
out of Turkey. In contrast, the RDP scenario would keep the annual spend on hard coal below the
nominal $1.5bn level – even by 2030.
19 Turkish Central Bank, http://sanalmuze.tcmb.gov.tr/odemedenge/table19.pdf.
20 IEA Statistics, Turkey energy balances, http://www.iea.org/statistics/statisticssearch Accessed
22 July 2014
The main impact on the
trade balance lies in
avoiding an increase in
gas import costs.

TURKEY'S CHANGING POWER MARKETS
18 NOVEMBER 2014
© Bloomberg Finance L.P.2015
No portion of this document may be reproduced, scanned into an electronic system, distributed, publicly displayed or used as the basis of derivative works without the prior written consent of Bloomberg Finance L.P. For more information on terms of use, please contact [email protected]. Copyright and Disclaimer notice on page 52 applies throughout. Page 36 of 48
Figure 38: BAU versus RDP scenario trade balance impacts, 2014-30 ($bn nominal)
Source: Bloomberg New Energy Finance.
Imports of renewable technologies
The RDP scenario will save fuel costs, but it will likewise boost spending on capital expenditure in
installing new capacity. Our analysis suggests that capital expenditure in the RDP scenario will
exceed spending in the BAU scenario by $0.75bn (nominal) on average each year, as renewables
require more installed capacity due to lower load factors. The impact on the trade balance of this
greater expenditure will rest on what renewable power equipment can be sourced domestically.
We assume 50% of this capital expenditure will flow out of the country with the remainder being
supplied by local manufacturers.
In the next 15 years, any additional capital expenditure on renewable technologies would then
total $13bn, around the same as the cumulative savings on coal imports of $12bn (nominal).
Replacing coal generation with renewables could thus have a positive impact on Turkey’s trade
balance – but only if a significant share of the envisaged renewable capacity investment can be
produced domestically. Our analysis however suggests that Turkey will only start to see the full
effects of these savings in the latter half of the next decade. We also illustrate the results if 100%
of the capital spent on renewable capacity is imported.
Turkey currently has the capacity domestically to manufacture 410MW of solar equipment each
year, according to Bloomberg New Energy Finance data. In our RDP scenario, it will need to add
1.9GW of solar capacity each year between 2021 and 2030. Significant additional investment in
manufacturing capacity would be required, to ensure the maximum local job creation from this
programme and to ensure that this scenario benefits Turkey's balance of trade in the long run.
Given the scale of the opportunity in the Turkish market, international manufacturers would be
likely to show interest in setting up factories.The government policy of offering higher feed-in-
tariffs for locally-sourced equipment has already proved successful. For instance, German
manufacturer Nordex, in June 2014, confirmed that the wind turbine towers and rotor blades it
plans to deliver to its Turkish clients will be made domestically21
.
INVESTMENT IN TRANSMISSION INFRASTRUCTURE
We anticipate that our Renewables Development Pathway scenario will necessitate additional
investment in the Turkish grid and transmission network – but some of this investment will be
required across all three scenarios. It is commonly held that the Turkish grid can accommodate
another 2GW of variable renewables capacity before major infrastructure investment becomes
very necessary. Data on the state of the Turkish grid system, and on expected investment
21 DGAP News, 22 July 2014, http://www.bloomberg.com/article/2014-06-18/aSSNnjVW8xh8.html
-2
-1
0
1
2
3
2014 2016 2018 2020 2022 2024 2026 2028 2030
50% imported
Savings in hard coal imports
Impact on trade balance assuming 50% of CAPEX is imported
Additional CAPEX spend in RDP scenario (100% imported)

TURKEY'S CHANGING POWER MARKETS
18 NOVEMBER 2014
© Bloomberg Finance L.P.2015
No portion of this document may be reproduced, scanned into an electronic system, distributed, publicly displayed or used as the basis of derivative works without the prior written consent of Bloomberg Finance L.P. For more information on terms of use, please contact [email protected]. Copyright and Disclaimer notice on page 52 applies throughout. Page 37 of 48
requirements, are not publicly available. A detailed assessment is therefore required, beyond the
scope of this analysis and our scenarios. However, drawing on loosely comparable circumstances
in Europe, we project that Turkey will have to invest heavily in its grid infrastructure to cope not
only with rising power demand but also grid-connected renewables integration. We have not
included cost estimates for improvements in transmission and distribution networks in any
scenario. The type and level of investment will largely depend on the state and complexity of the
existing power system, how electricity consumption grows over time and the distance between
new power plants and the main demand centres. Investment costs also differ considerably,
depending on which technologies are deployed. For instance, when assuming that 29GW of
offshore wind capacity will be installed in Europe, we believe EUR 28bn of transmission
investment will be required – of which EUR 21bn will go towards new projects. Our analysis also
suggests over EUR 60bn will be invested in onshore transmission lines by 2023.
The costs of offshore and onshore interconnectors differ widely, and are primarily dependent on
the type of current – direct or alternating. Across Europe the anticipated average costs range from
EUR 159m for an AC onshore interconnector to EUR 895m for a DC offshore one. As an
alternative example, at the distribution level, we estimate Germany will need 135,000km of new
lines and retrofits at an estimated cost of between EUR 15bn and EUR 27bn.
EMISSIONS
One of the clear advantages of the RDP scenario is that it almost entirely prevents the projected
rise in Turkey’s greenhouse gas emissions from the power sector. As Figure 39 illustrates,
emissions in the RDP scenario remain broadly constant from 2020 onwards: in the other two
scenarios, they continue increasing rapidly during the next decade, reaching more than 200m
tonnes per annum by 2030. By way of comparison, this volume equates to just under two-thirds of
German power sector emissions in 2013.
Figure 39: Annual power sector CO2e emissions, 2000- 2030 (Million tonnes)
Source: Bloomberg New Energy Finance, IEA
POST-2020 EU COMPLIANCE COSTS
With the possibility of Turkey joining the European Union, we have also assessed the potential costs to comply with the major environmental policies affecting the EU power sector. We therefore modelled the potential cost of Turkey complying with the European Emissions Trading Scheme (EU ETS) and the Industrial Emissions Directive (IED) from 2020 onwards.
CARBON COSTS
As a proxy for potential carbon pricing in Turkey, we applied our forecast price for European Union Allowances (EUAs) from July 2014. We only included the projected emissions from 2020 to 2030, as we do not expect a carbon pricing mechanism can come into play in Turkey in the next six years. Net carbon costs vary across the different scenarios and applied discount rates, and fall into a range of $21bn to $50bn. Our EUA price forecast considers the near-term impact of the recently passed
0
50
100
150
200
250
2000 2004 2008 2012 2016 2020 2024 2028
Business-as-usual
RenewablesDevelopment Pathway
Official plan

TURKEY'S CHANGING POWER MARKETS
18 NOVEMBER 2014
© Bloomberg Finance L.P.2015
No portion of this document may be reproduced, scanned into an electronic system, distributed, publicly displayed or used as the basis of derivative works without the prior written consent of Bloomberg Finance L.P. For more information on terms of use, please contact [email protected]. Copyright and Disclaimer notice on page 52 applies throughout. Page 38 of 48
backloading proposal, which temporarily withdraws permits from the markets in order to reduce supply. We project a bullish market from 2021 in response to a tightening of the EU ETS cap, reflecting the 2030 targets. Our detailed price forecast runs until 2024, and after that we assume prices will increase in line with 2% inflation.
INDUSTRIAL EMISSIONS DIRECTIVE (IED)
The IED will come into effect on 1 January 2016 and it regulates how many sulphur dioxide, nitrogen oxide, dust and heavy metals emissions are churned out of power plants over 50MW in size. We accounted for three abatement technologies:
Dry scrubbers for flue gas desulphurisation
Selective catalytic reduction for NOx abatement
Electrostatic precipitator for dust abatement
All three abatement technologies will result in higher capex and operating costs for each coal-fired power plant subject to the regulation. We assume that by 2020 all Turkey’s existing coal plants would be retrofitted with one of these three technologies. All new plants commissioned after 2020 must obviously also meet the regulation’s requirements.
TOTAL COMPLIANCE COST
We estimate that in the RDP scenario, Turkey could save $14bn between 2020 and 2030 on EU regulation compliance costs (in 2014 terms) because fewer coal plants will need to meet IED compliance and leaner carbon requirements.
Figure 40: Net scenario costs when including post-2020 EU compliance ($bn)
Note: BNEF clients have access to an in-depth analysis of IED compliance costs here; all costs discounted at 8%.
205 209
272
37 26
36
9 5
9
251 241
318
0
50
100
150
200
250
300
350
Business-as-usual Renewables developmentpathway
Official plan
CAPEX, OPEX and fuel costs Carbon cost IED cost
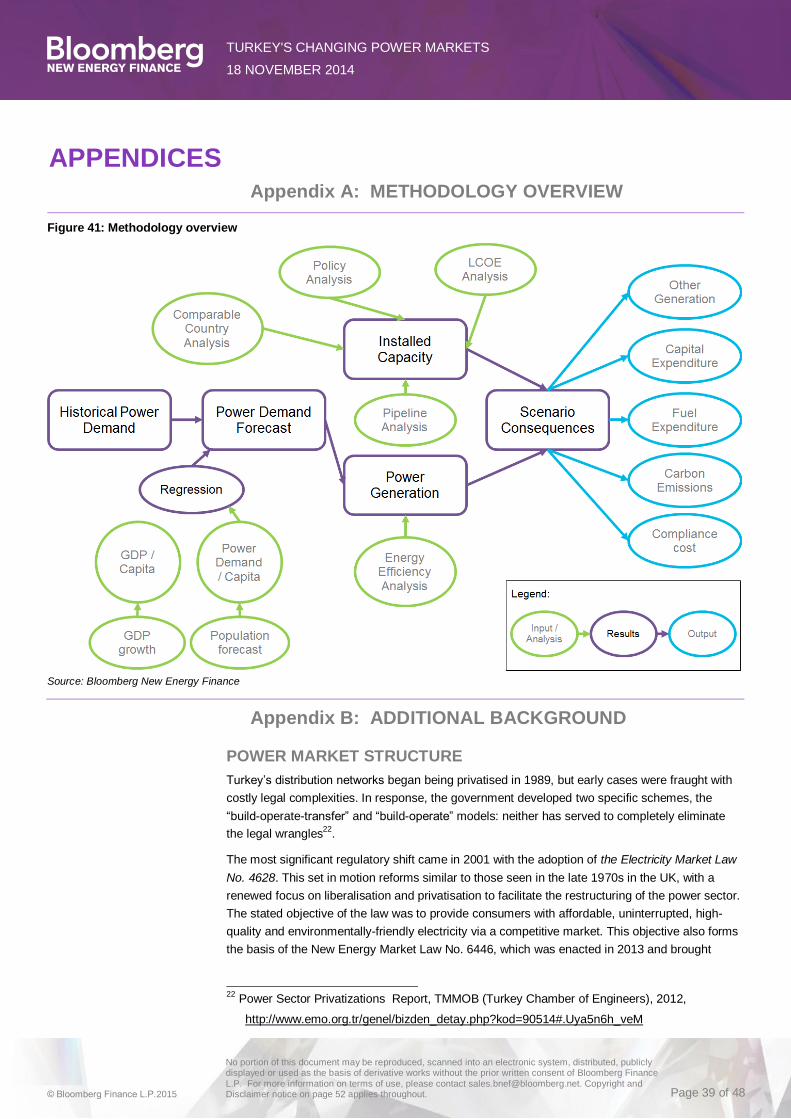
TURKEY'S CHANGING POWER MARKETS
18 NOVEMBER 2014
© Bloomberg Finance L.P.2015
No portion of this document may be reproduced, scanned into an electronic system, distributed, publicly displayed or used as the basis of derivative works without the prior written consent of Bloomberg Finance L.P. For more information on terms of use, please contact [email protected]. Copyright and Disclaimer notice on page 52 applies throughout. Page 39 of 48
APPENDICES Appendix A: METHODOLOGY OVERVIEW
Figure 41: Methodology overview
Source: Bloomberg New Energy Finance
Appendix B: ADDITIONAL BACKGROUND
POWER MARKET STRUCTURE
Turkey’s distribution networks began being privatised in 1989, but early cases were fraught with
costly legal complexities. In response, the government developed two specific schemes, the
“build-operate-transfer” and “build-operate” models: neither has served to completely eliminate
the legal wrangles22
.
The most significant regulatory shift came in 2001 with the adoption of the Electricity Market Law
No. 4628. This set in motion reforms similar to those seen in the late 1970s in the UK, with a
renewed focus on liberalisation and privatisation to facilitate the restructuring of the power sector.
The stated objective of the law was to provide consumers with affordable, uninterrupted, high-
quality and environmentally-friendly electricity via a competitive market. This objective also forms
the basis of the New Energy Market Law No. 6446, which was enacted in 2013 and brought
22
Power Sector Privatizations Report, TMMOB (Turkey Chamber of Engineers), 2012,
http://www.emo.org.tr/genel/bizden_detay.php?kod=90514#.Uya5n6h_veM

TURKEY'S CHANGING POWER MARKETS
18 NOVEMBER 2014
© Bloomberg Finance L.P.2015
No portion of this document may be reproduced, scanned into an electronic system, distributed, publicly displayed or used as the basis of derivative works without the prior written consent of Bloomberg Finance L.P. For more information on terms of use, please contact [email protected]. Copyright and Disclaimer notice on page 52 applies throughout. Page 40 of 48
novelties to the licence requirements and regulations, market operation, total market share and
some exemptions from environmental requirements.
With these legislative developments, the ministry’s objective continues to be privatising state-
owned power plants, with the exception of a few strategic hydroelectric dams with a total capacity
of 7.5GW.
REGULATORY ENVIRONMENT
There are signs that the government is relaxing its control over electricity distribution – even if
such moves are not yet all-encompassing. As part of its privatisation push, the government reined
in the authority of the Turkish Electricity Distribution Company (TEDC) while giving private
distribution companies the right to obtain licences from EMRA.
With these licences, said companies can formalise connection and system utilisation agreements
with users of the distribution facilities23
. They also facilitate the construction and operation of new
distribution facilities under 36kV – provided they are in line with EMRA’s country-wide investment
plans. But the government has not relinquished all its influence: TEDC owns all the country’s
distribution facilities while TETC continues to play a major role in the construction of the country’s
power distribution systems.
“DASH FOR COAL” PLAN
Turkey’s investment incentives programme includes: tax deductions; VAT and custom duties
exemptions; interest and insurance financial support; preferable land and site allocation; and
investment contributions. The extent of the government’s investment contribution varies between
geographical regions in Turkey, ranging from 25% in western Turkey to 60% for projects in the
eastern part of the country24
.
To boost coal exploitation, the state-run Turkish Coal Enterprise (TKI) has started privatising
existing coal fields by offering long-term contracts to investors. In 2012 it introduced a royalty
tender mechanism to spur private investment further. It includes a royalty fee for the generated
electricity, linked to the consumer price index. Private investors can also now get access to the
operating rights of certain coal fields – as long as they build a plant within the framework of the
royalty model.
TRANSMISSION AND NETWORK CAPACITY
As of 2012, the country has 1,425 transformers with a total installed capacity of 112,846MVA.
Between 2008 and 2012, transformer capacity grew at an annual rate of 6.6% according to the
available TETC data. Further investment in the transmission network is now expected – especially
in loop lines and new compressor stations to increase gas dispatch capacity.
23 Arseven, B & Ersin, B.T. (2014) “Electricity regulation in Turkey: overview” Practical Law, Multi-
Jurisdictional guide 2014: Energy and natural resources, available at:
http://uk.practicallaw.com/cs/Satellite?blobcol=urldata&blobheader=application%2Fpdf&blobk
ey=id&blobtable=MungoBlobs&blobwhere=1247814319751&ssbinary=true (retrieved 5 June
2014)
24 Deloitte & Invest in Turkey (2013), “The Energy Sector: A quick tour for the investor”,
November 2013, Investment Support and Promotion Agency of Turkey, available at:
http://www.invest.gov.tr/en-US/sectors/Pages/Energy.aspx (retrieved on 30 May 2014).

TURKEY'S CHANGING POWER MARKETS
18 NOVEMBER 2014
© Bloomberg Finance L.P.2015
No portion of this document may be reproduced, scanned into an electronic system, distributed, publicly displayed or used as the basis of derivative works without the prior written consent of Bloomberg Finance L.P. For more information on terms of use, please contact [email protected]. Copyright and Disclaimer notice on page 52 applies throughout. Page 41 of 48
ENERGY STORAGE
Developers are continuing overwhelmingly to select lithium-ion for their projects – an occasional
project deploys flow batteries or flywheels. We expect this to continue in the short- to medium-
term for a number of reasons:
• Technology risk: There is more operational data from already-commissioned projects and
other industries for lithium-ion. This increased certainty reinforces the technology’s
advantage, at least in the short-term.
• Company risk: Lithium-ion battery manufacturing is dominated by a few large diversified
conglomerates, notably LG Chem, Panasonic and Samsung SDI. They offer more warranty
security than other smaller technology developers. GE’s sodium nickel chloride battery is a
notable exception though.
Figure 42 shows BNEF’s global forecast for battery pack costs and projected annual production
until 2030. The expected decline in costs suggests energy storage will play a greater role in
tomorrow’s global power markets, including in Turkey.
Figure 42: BNEF battery pack costs and production forecast (2010-2030)
Total pack cost ($/kWh) Annual production (GWh)
Source: Bloomberg New Energy Finance
In general, energy storage economics are dependent on the system’s application and specific
location. There is thus no single threshold that must be met for the system to be cost-effective. It
is likely that the projected cost decreases will make battery storage a more attractive option in
offsetting renewables variability in the long run. Ultimately this will counteract the demand for
back-up capacity, increasing the role of energy storage in Turkey.
TURKEY'S ENERGY EFFICIENCY PLANS
The Energy Efficiency Coordination Board oversees the administration of the law25
, which
includes regulation on minimum energy efficiency requirements and penalties for non-
compliance26
. The energy efficiency investment support programme, launched by the General
Directorate for Renewable Energy in 2009, further demonstrates the government’s commitment to
support the sector.
25 Official Gazette, Issue: 26510, Energy Efficiency Law, Law No. 5627 (2 May 2007)
26 Calikoglu, E. (2010) Energy Efficiency Policies and Programs in Turkey, International
Consultation Workshop on Energy Efficiency Institutional Governance, The World Bank, 1-2
June 2010, http://siteresources.worldbank.org/EXTENERGY2/Resources/4114199-
1276110591210/Turkey.pdf
0
40
80
120
160
200
240
0
200
400
600
800
1,000
1,200
2010 2012 2014 2016 2018 2020 2022 2024 2026 2028 2030
Annual battery production (GWh) Battery pack price ($/kWh) Observed electric vehicle battery price ($/kWh)
2011:$800/kWh
H1 2012:$689/kWh
H1 2013:$599/kWh H2 2014:
$540/kWh
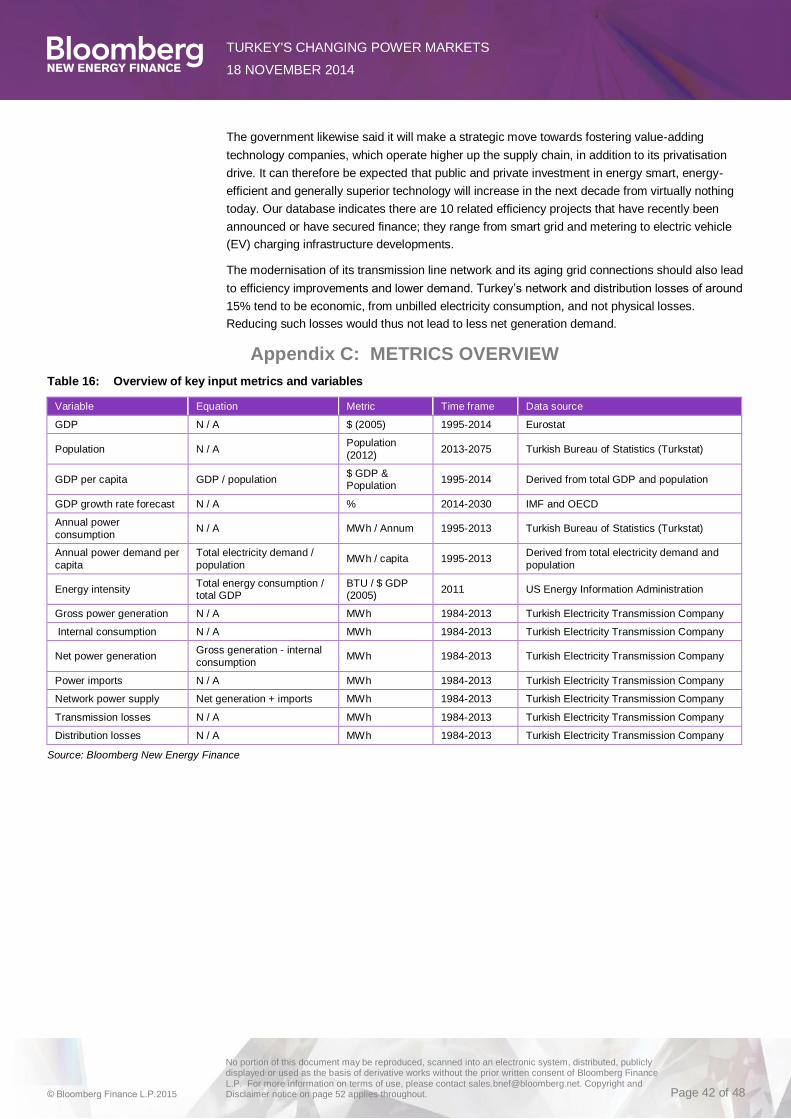
TURKEY'S CHANGING POWER MARKETS
18 NOVEMBER 2014
© Bloomberg Finance L.P.2015
No portion of this document may be reproduced, scanned into an electronic system, distributed, publicly displayed or used as the basis of derivative works without the prior written consent of Bloomberg Finance L.P. For more information on terms of use, please contact [email protected]. Copyright and Disclaimer notice on page 52 applies throughout. Page 42 of 48
The government likewise said it will make a strategic move towards fostering value-adding
technology companies, which operate higher up the supply chain, in addition to its privatisation
drive. It can therefore be expected that public and private investment in energy smart, energy-
efficient and generally superior technology will increase in the next decade from virtually nothing
today. Our database indicates there are 10 related efficiency projects that have recently been
announced or have secured finance; they range from smart grid and metering to electric vehicle
(EV) charging infrastructure developments.
The modernisation of its transmission line network and its aging grid connections should also lead
to efficiency improvements and lower demand. Turkey’s network and distribution losses of around
15% tend to be economic, from unbilled electricity consumption, and not physical losses.
Reducing such losses would thus not lead to less net generation demand.
Appendix C: METRICS OVERVIEW
Table 16: Overview of key input metrics and variables
Variable Equation Metric Time frame Data source
GDP N / A $ (2005) 1995-2014 Eurostat
Population N / A Population
(2012) 2013-2075 Turkish Bureau of Statistics (Turkstat)
GDP per capita GDP / population $ GDP & Population
1995-2014 Derived from total GDP and population
GDP growth rate forecast N / A % 2014-2030 IMF and OECD
Annual power
consumption N / A MWh / Annum 1995-2013 Turkish Bureau of Statistics (Turkstat)
Annual power demand per
capita
Total electricity demand /
population MWh / capita 1995-2013
Derived from total electricity demand and
population
Energy intensity Total energy consumption / total GDP
BTU / $ GDP (2005)
2011 US Energy Information Administration
Gross power generation N / A MWh 1984-2013 Turkish Electricity Transmission Company
Internal consumption N / A MWh 1984-2013 Turkish Electricity Transmission Company
Net power generation Gross generation - internal
consumption MWh 1984-2013 Turkish Electricity Transmission Company
Power imports N / A MWh 1984-2013 Turkish Electricity Transmission Company
Network power supply Net generation + imports MWh 1984-2013 Turkish Electricity Transmission Company
Transmission losses N / A MWh 1984-2013 Turkish Electricity Transmission Company
Distribution losses N / A MWh 1984-2013 Turkish Electricity Transmission Company
Source: Bloomberg New Energy Finance
TURKEY'S CHANGING POWER MARKETS
18 NOVEMBER 2014
© Bloomberg Finance L.P.2015
No portion of this document may be reproduced, scanned into an electronic system, distributed, publicly displayed or used as the basis of derivative works without the prior written consent of Bloomberg Finance L.P. For more information on terms of use, please contact [email protected]. Copyright and Disclaimer notice on page 52 applies throughout. Page 43 of 48
Appendix D: POWER DEMAND METHODOLOGY
The power demand projections for Turkey were calculated based on regression analysis of GDP
per capita and power demand per capita in 26 European nations. This is the same methodology
that Bloomberg New Energy Finance uses in its coverage of European power markets.
As Turkey is a complex and rapidly-changing country, it is particularly challenging to forecast such
a nation’s power consumption 20 years ahead. Our forecast could be too low or too high, for
reasons outlined below:
WHAT COULD INCREASE OUR FORECAST?
• Generation for export: our demand figures refer to generation for domestic consumption and
are derived from per capita consumption. If Turkey starts to export significant amounts of
electricity, the need for domestic generation will obviously increase. At the moment the
import-export balance is negligible in relation to total generation.
• De-industrialisation moving more slowly: the effect of slower power demand growth at higher
wealth levels seen in Europe is at least partially driven by a shift in manufacturing to cheaper
locations, including Turkey. Turkey may not be able to shift industrial production offshore in a
similar fashion as it develops, keeping its industry sector larger and power demand higher
than the projection based on a regression of European trends implies.
WHAT COULD LOWER OUR FORECAST?
• Greater energy efficiency: the impact of energy efficiency measures is notoriously difficult to
forecast. Energy efficiency measures could be rolled out at a much larger scale than our BAU
scenario assumes. Stable power consumption in some European countries over the past few
years may be an indicator that such measures could be more impactful than anticipated.
• 2013’s decline trend continues: power demand in Turkey slightly declined in 2013, and the
power intensity of a unit of GDP has been relatively stable since 2008. Our forecasts reflect
that fact that we think power demand will continue to grow and that the decline in total
consumption in 2013 was an outlier rather than a new trend.
Appendix E: COAL FORECAST METHODOLOGY
The Turkish government’s “Dash-for-Coal” plan will arguably be the most market-changing
development of the next two decades. It is worth therefore outlining our methodology concerning
coal capacity additions in our BAU and RDP scenarios.
In our BAU scenario, we used probability-weightings to build a coal plant pipeline out until 2030.
We used a combination of the following three sources, in order of importance:
Bloomberg data (BMAP)
Cross-checked and supplemented with data from the EMRA
SourceWatch (data on proposed and existing coal plants)
Based on talks with our colleagues at WWF and ECF Turkey, we applied probability weightings to
each plant due online as dependent on its current status. Table 17 summarises the results of this
approach:

TURKEY'S CHANGING POWER MARKETS
18 NOVEMBER 2014
© Bloomberg Finance L.P.2015
No portion of this document may be reproduced, scanned into an electronic system, distributed, publicly displayed or used as the basis of derivative works without the prior written consent of Bloomberg Finance L.P. For more information on terms of use, please contact [email protected]. Copyright and Disclaimer notice on page 52 applies throughout. Page 44 of 48
Table 17: Turkey coal plant pipeline analysis, 2014
Status Number of
plants
Total
capacity (MW)
Hard coal
capacity (MW)
Lignite
capacity (MW)
Asphaltite
capacity (MW)
Probability
weighting (%)
Time frame
From to
Financing Secured / Under Construction
6 4,136 2,604 1,532 0 80% 2015 2020
Permits Obtained 3 2,592 2,316 0 276 70% 2016 2020
Application 15 12,689 12,689 0 0 40% 2018 2030
Planned / Announced 31 30,252 19,052 11,062 138 30% 2022 2030
Cancelled 8 5,610 2,364 3,246 0 0% - -
TOTAL 63 55,278 39,024 15,840 413 - - -
Source: ECF, Sourcewatch, Bloomberg New Energy Finance and Bloomberg (BMAP) . Total figures might not add up due to rounding.
For some of the coal plants above the data represents the expected commission year. However,
for the majority of these projects, we distributed their capacity additions equally over the indicated
time frame. This approach yields 10GW of installed capacity across the coal, lignite and asphaltite
sectors before 2030.
In our RDP scenario, we assume that only plants that fall into the status of “financing secured /
under construction” come online between 2014 and 2020 – we apply an 80% probability weight to
these plants, like in BAU scenario. Under this methodology, total coal capacity additions before
2030 amount to 3.3GW.
Figure 43: Annual coal capacity additions in BAU scenario
(GW)
Figure 44: Annual coal capacity additions in RDP scenario
(GW)
Source: Bloomberg New Energy Finance
Appendix F: POWER MARKET LIBERALISATION
Since the turn of the century the Turkish government has embarked on a sustained liberalisation
and privatisation campaign in its energy sector. In the last 13 years, it has passed seven new
laws updating regulations on its natural gas, nuclear, renewables and energy efficiency sectors.
At the same time, it drove liberalisation by splitting up and privatising state-owned enterprises and
engaging the European Union in regards to its link with ENTSO-E. The government hopes to
have a fully competitive power market by 2016. The chart below illustrates the major milestones
of the liberalisation process:
0
200
400
600
800
1,000
1,200
1,400
1,600
2014 2016 2018 2020 2022 2024 2026 2028 2030
Lignite
Hard coal
0
200
400
600
800
1,000
1,200
1,400
2014 2016 2018 2020 2022 2024 2026 2028 2030
Hard coal
Lignite

TURKEY'S CHANGING POWER MARKETS
18 NOVEMBER 2014
© Bloomberg Finance L.P.2015
No portion of this document may be reproduced, scanned into an electronic system, distributed, publicly displayed or used as the basis of derivative works without the prior written consent of Bloomberg Finance L.P. For more information on terms of use, please contact [email protected]. Copyright and Disclaimer notice on page 52 applies throughout. Page 45 of 48
Figure 45: Liberalisation milestones of the Turkish power market, 2001-16
Source: Investment Support and Promotion Agency of Turkey / Bloomberg New Energy Finance
Appendix G: SENSITIVITIES
Bloomberg New Energy Finance estimates that the total capacity build and generation costs to
Turkey until 2030 of both options – business-as-usual and Renewables Development Pathway –
would be around $190-210bn (in current terms, discounted at 8%). This would include the upfront
capital cost of building new capacity, and also the cost of running the fleet of plants, including the
bill for fuel feedstock. This excludes potentially required investments in grid improvements.
As is always the case with such an ambitious long-term analysis of two complex scenarios, this
conclusion depends on a number of assumptions and expectations. Below we have discussed
and examined several of our assumptions to validate the robustness of our conclusion. We
believe that the finding of comparable costs for the BAU and the RDP scenario is robust,
notwithstanding the fact that both scenarios would expose Turkey to risks, be it from commodity
prices or unexpected changes in the rate of decline of renewables costs.
Capacity factors: In our analysis we have assumed that the capacity factors of both conventional
and renewables will remain in line with historical averages observed in Turkey. However, it is
possible that the market liberalisation efforts will boost the utilisation of coal and lignite plants from
their historical, relatively low levels. If the capacity factor for the coal and lignite fleet was to
increase to 78% from 2016 onwards, this would result in total estimated costs of the BAU
scenario of $193bn, compared to $204bn in the RDP scenario. This would also reduce gas
dependency.
Coal or lignite: We have applied an equal probability-weighting to the coal and the lignite project
pipelines. We think this is a reasonable assumption as the project-level pipeline for hard coal
projects is much larger than for lignite. However, if lignite was prioritised, this could reduce the
costs of the BAU scenario and give it a more positive impact on Turkey's balance of trade. A
lignite-heavy approach would however increase Turkey's emissions and local pollution beyond
that expected in the BAU scenario, further increasing the potential compliance costs in case of EU
accession.

TURKEY'S CHANGING POWER MARKETS
18 NOVEMBER 2014
© Bloomberg Finance L.P.2015
No portion of this document may be reproduced, scanned into an electronic system, distributed, publicly displayed or used as the basis of derivative works without the prior written consent of Bloomberg Finance L.P. For more information on terms of use, please contact [email protected]. Copyright and Disclaimer notice on page 52 applies throughout. Page 46 of 48
Associated costs: We have said in the report that the RDP scenario would possibly involve
Turkey making improvements to the grid above and beyond what would be required under the
BAU scenario. This would involve extra costs, although the addition of intelligence to the grid
would also have other benefits in terms of efficiency and reducing waste. The RDP scenario
would also involve extra investment on energy efficiency. This is not quantified in the report either.
It is possible that, on a net basis to 2030, the cost of this efficiency investment could be
outweighed by the money saved.
Repowering: The analysis in the report does not take into account the potential for repowering
wind, solar and hydro-electric projects with more up-to-date and efficient technology between now
and 2030. It is possible that this could reduce the cost of the RDP scenario by enabling Turkey to
generate the same amount of electricity with fewer investment dollars.
Generating costs after 2030: The report does not cover the ongoing generation costs after 2030
of fossil-fuel and renewable power capacity installed before that date. These costs would be
expected to be lower in the case of the wind, solar and hydro installations, since their feedstock is
free and maintenance costs relatively light, than in the case of coal or gas plants, which have
relatively high ongoing feedstock costs.

TURKEY'S CHANGING POWER MARKETS
18 NOVEMBER 2014
© Bloomberg Finance L.P.2015
No portion of this document may be reproduced, scanned into an electronic system, distributed, publicly displayed or used as the basis of derivative works without the prior written consent of Bloomberg Finance L.P. For more information on terms of use, please contact [email protected]. Copyright and Disclaimer notice on page 52 applies throughout. Page 47 of 48
ABOUT US
Applied Research
Michael Wilshire
Director of Analysis
+44 20 3216 4643
Angus McCrone
Chief Editor
+44 20 3216 4795
Felix Leworthy
Manager, Business Development
+44 20 3216 4233
Janis Hoberg
Analyst, Applied Research and Policy
+44 20 3525 8303
Luke Mills
Associate, Clean Energy Economics
+44 20 3525 8135
Itamar Orlandi
Associate, European Power and Carbon
+44 20 3525 8349
© Bloomberg Finance L.P. 2015. This publication is the copyright of Bloomberg New Energy
Finance. No portion of this document may be photocopied, reproduced, scanned into an
electronic system or transmitted, forwarded or distributed in any way without prior consent of
Bloomberg New Energy Finance.
Subscription details
Contact details
Copyright

TURKEY'S CHANGING POWER MARKETS
18 NOVEMBER 2014
© Bloomberg Finance L.P.2015
No portion of this document may be reproduced, scanned into an electronic system, distributed, publicly displayed or used as the basis of derivative works without the prior written consent of Bloomberg Finance L.P. For more information on terms of use, please contact [email protected]. Copyright and Disclaimer notice on page 52 applies throughout. Page 48 of 48
This service is derived from selected public sources. Bloomberg Finance L.P. and its affiliates, in
providing the service, believe that the information it uses comes from reliable sources, but do not
guarantee the accuracy or completeness of this information, which is subject to change without
notice, and nothing in this document shall be construed as such a guarantee. The statements in
this service reflect the current judgment of the authors of the relevant articles or features, and do
not necessarily reflect the opinion of Bloomberg Finance L.P., Bloomberg L.P. or any of their
affiliates (“Bloomberg”). Bloomberg disclaims any liability arising from use of this document
and/or its contents, and this service. Nothing herein shall constitute or be construed as an
offering of financial instruments or as investment advice or recommendations by Bloomberg of an
investment or other strategy (e.g., whether or not to “buy”, “sell”, or “hold” an investment). The
information available through this service is not based on consideration of a subscriber’s
individual circumstances and should not be considered as information sufficient upon which to
base an investment decision. BLOOMBERG, BLOOMBERG PROFESSIONAL, BLOOMBERG
MARKETS, BLOOMBERG NEWS, BLOOMBERG ANYWHERE, BLOOMBERG TRADEBOOK,
BLOOMBERG BONDTRADER, BLOOMBERG TELEVISION, BLOOMBERG RADIO,
BLOOMBERG PRESS, BLOOMBERG.COM, BLOOMBERG NEW ENERGY FINANCE and NEW
ENERGY FINANCE are trademarks and service marks of Bloomberg Finance L.P. or its
subsidiaries.
This service is provided by Bloomberg Finance L.P. and its affiliates. The data contained within
this document, its contents and/or this service do not express an opinion on the future or
projected value of any financial instrument and are not research recommendations (i.e.,
recommendations as to whether or not to “buy”, “sell”, “hold”, or to enter or not to enter into any
other transaction involving any specific interest) or a recommendation as to an investment or
other strategy. No aspect of this service is based on the consideration of a customer’s individual
circumstances. You should determine on your own whether you agree with the content of this
document and any other data provided through this service. Employees involved in this service
may hold positions in the companies covered by this service.
Disclaimer


WW
F.ORG.TR
TURKEY’S
RENEWABLE POWER
By 2030, Turkey can meet almost 50% of its power demand from renewable energy sources
Turkey could stabilize GHG emissions from the power sector in the next fi ve years
Total share of wind, solar and geothermal energy in electricity mix could increase from 4% to 26% by 2030
In order to stay below 2°C global warming, 2/3 of all proven fossil fuel reserves must be left underground
50 %
5 YEARS
26 %
2/3
According to BNEF analysis, power demand in 2030 will be 25% lower than offi cial projections
25 %
TURKEY’S RENEWABLE POW
ER
RECYCLED
CO
VE
R P
HO
TO
: © FA
TİH
ÜN
LÜ / G
ET
TY
IMA
GE
S T
UR
KE
Y
Why are we hereThe mission of WWF Turkey is “to stop the degradation of the planet’s natural environ-ment and to build a future in which humans live in harmony with nature” by protecting the world’s biological diversity, ensuring that the use of renewable natural resources is sustainable, promoting the reduction of pollution and wasteful consumption.
www.wwf.org.tr
ENG