turkish economy and machinery sector - … · turkish economy and machinery sector ... or semi...
TRANSCRIPT

TURKISH ECONOMY AND MACHINERY SECTOR
Necmi Uğurlu
Chief Commercial Counsellor Turkish Embassy
February 2014 Ministry of Economy 1
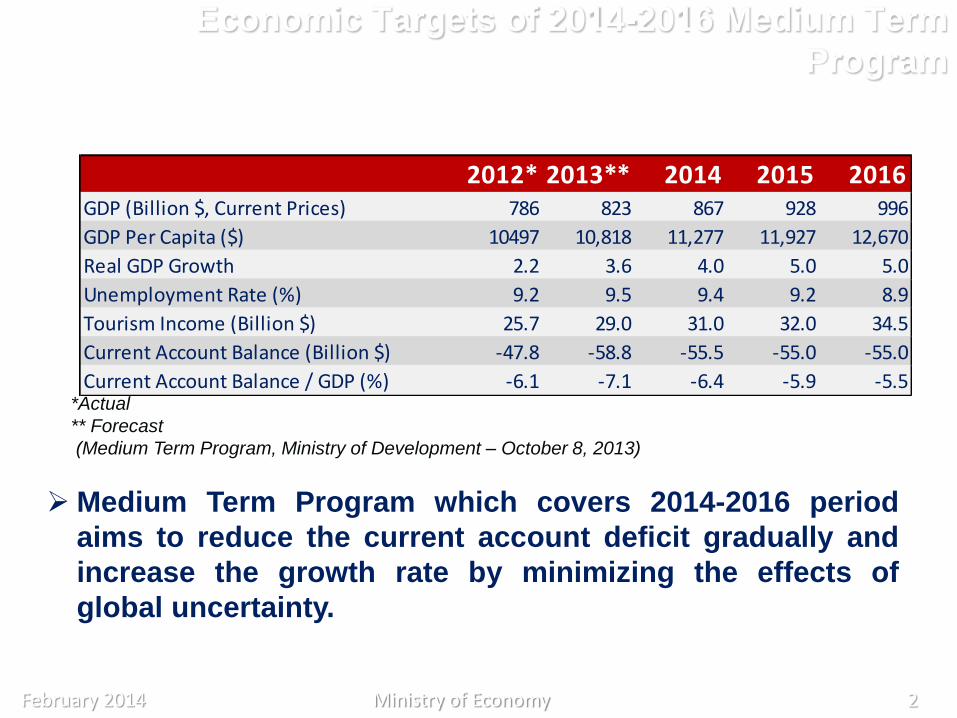
Economic Targets of 2014-2016 Medium Term
Program
*Actual
** Forecast
(Medium Term Program, Ministry of Development – October 8, 2013)
Medium Term Program which covers 2014-2016 period
aims to reduce the current account deficit gradually and
increase the growth rate by minimizing the effects of
global uncertainty.
February 2014 Ministry of Economy 2
2012* 2013** 2014 2015 2016GDP (Billion $, Current Prices) 786 823 867 928 996
GDP Per Capita ($) 10497 10,818 11,277 11,927 12,670
Real GDP Growth 2.2 3.6 4.0 5.0 5.0
Unemployment Rate (%) 9.2 9.5 9.4 9.2 8.9
Tourism Income (Billion $) 25.7 29.0 31.0 32.0 34.5
Current Account Balance (Billion $) -47.8 -58.8 -55.5 -55.0 -55.0
Current Account Balance / GDP (%) -6.1 -7.1 -6.4 -5.9 -5.5

Turkey is the 16th largest economy in the world and the 6th largest economy when
compared with the EU countries, according to GDP figures (at PPP) in 2012.
Average Annual Real GDP Growth of Turkey, 2002-2012 (%)
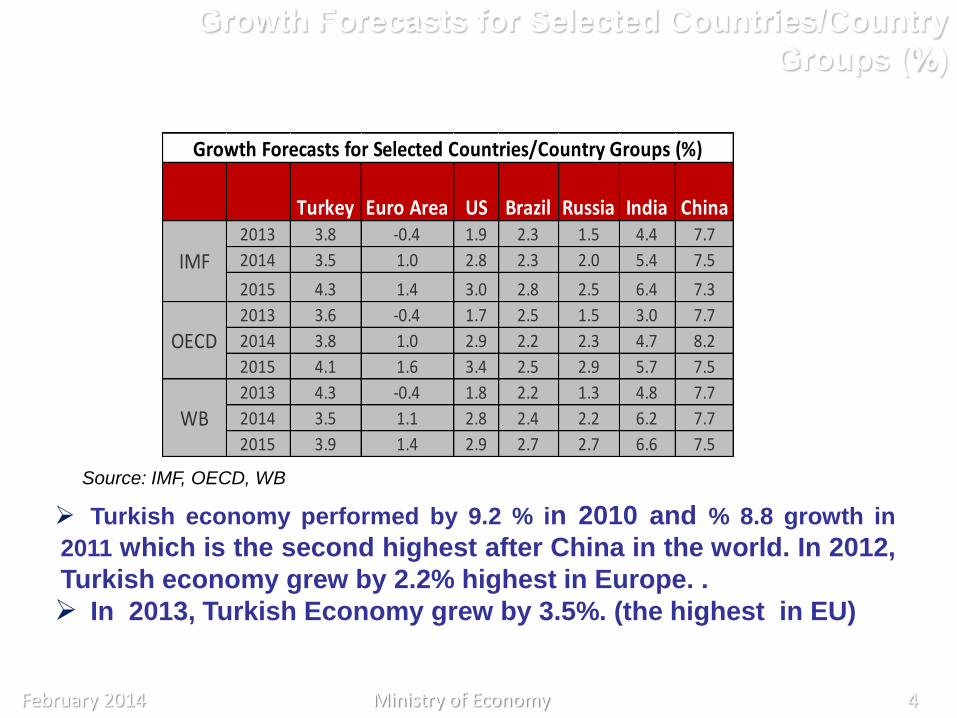
Growth Forecasts for Selected Countries/Country
Groups (%)
Turkish economy performed by 9.2 % in 2010 and % 8.8 growth in
2011 which is the second highest after China in the world. In 2012,
Turkish economy grew by 2.2% highest in Europe. .
In 2013, Turkish Economy grew by 3.5%. (the highest in EU)
Source: IMF, OECD, WB
February 2014 Ministry of Economy 4
Turkey Euro Area US Brazil Russia India China2013 3.8 -0.4 1.9 2.3 1.5 4.4 7.7
2014 3.5 1.0 2.8 2.3 2.0 5.4 7.5
2015 4.3 1.4 3.0 2.8 2.5 6.4 7.3
2013 3.6 -0.4 1.7 2.5 1.5 3.0 7.7
2014 3.8 1.0 2.9 2.2 2.3 4.7 8.2
2015 4.1 1.6 3.4 2.5 2.9 5.7 7.5
2013 4.3 -0.4 1.8 2.2 1.3 4.8 7.7
2014 3.5 1.1 2.8 2.4 2.2 6.2 7.7
2015 3.9 1.4 2.9 2.7 2.7 6.6 7.5
IMF
OECD
WB
Growth Forecasts for Selected Countries/Country Groups (%)

Annual Economic Growth Rates (2002-2012)
* Forecast, Medium Term Programme Source:TURKSTAT
Turkey has recovered fast from the global financial crisis. It is among the
least affected countries from current global economic uncertainties.
Mean annual growth rate between 2002 and 2012 was 5.2%.
Real GDP growth for 2012 realized as 2.2%.
February 2014 Ministry of Economy 5
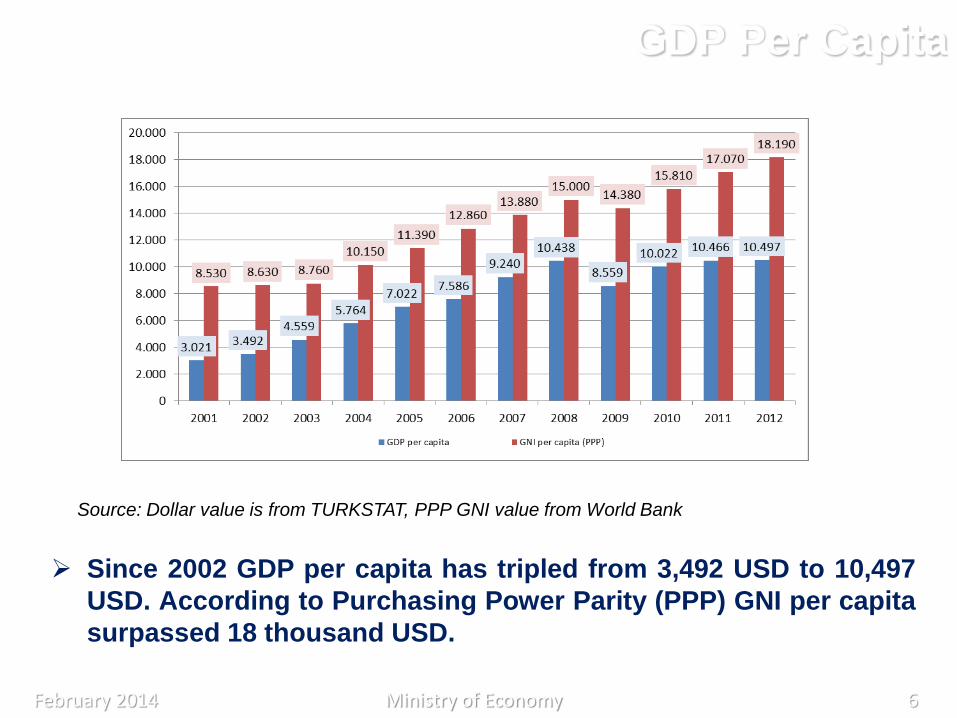
GDP Per Capita
Source: Dollar value is from TURKSTAT, PPP GNI value from World Bank
Since 2002 GDP per capita has tripled from 3,492 USD to 10,497
USD. According to Purchasing Power Parity (PPP) GNI per capita
surpassed 18 thousand USD.
February 2014 Ministry of Economy 6

EU Defined Budget Deficit/ GDP (%)
EU defined general government budget deficit/GDP ratio was 2.6%
in Turkey in 2010 and Turkey satisfied the Maastricht criteria of 3%.
Turkey also outperformed 22 EU Countries.
Central government budget deficit/GDP ratio was 2.0% in Turkey in
2012.
February 2014 Ministry of Economy 7
Source: Eurostat
* 2010

Government Debt / GDP (%)
Debt/GDP ratio of Turkey was 36.2% in 2012, which was below the
level in 25 EU Countries and the Mastricht Criteria (60%).
Debt/GDP ratio of Czech Rep. was 46.0 % in 2012 second after
Turkey. February 2014 Ministry of Economy 8
Source: Eurostat

B- FOREIGN TRADE OUTLOOK
February 2014 Ministry of Economy 9
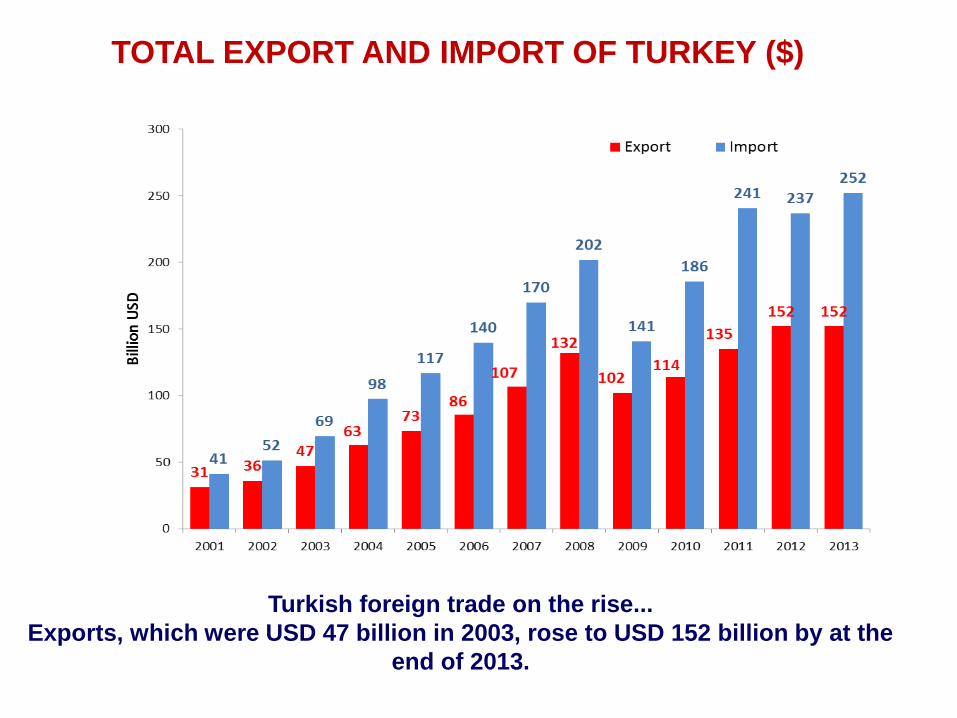
Turkish foreign trade on the rise...
Exports, which were USD 47 billion in 2003, rose to USD 152 billion by at the
end of 2013.
TOTAL EXPORT AND IMPORT OF TURKEY ($)
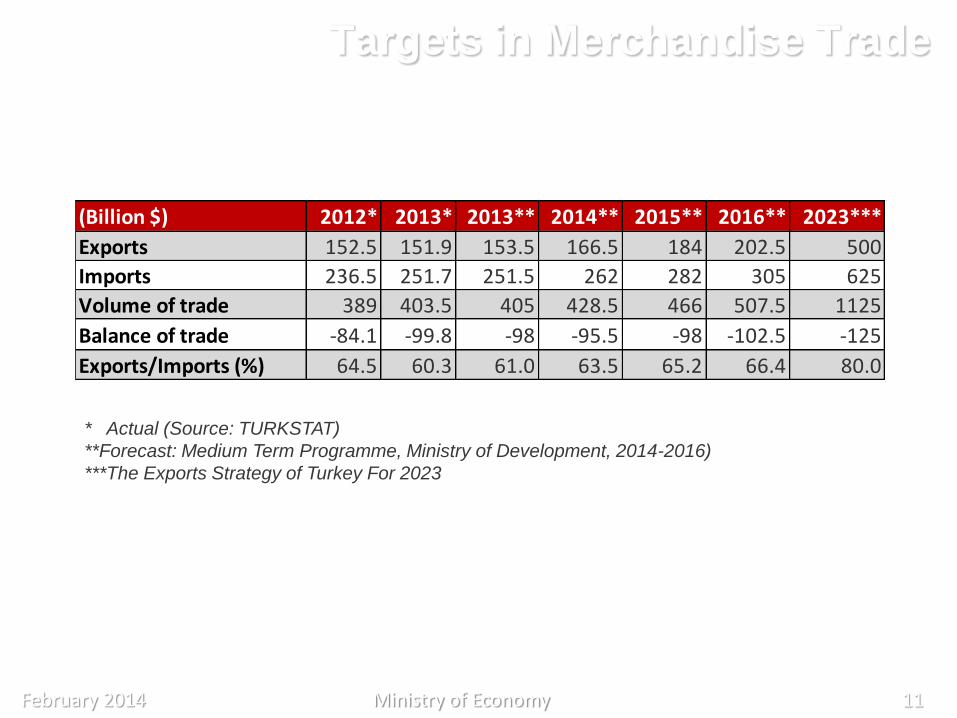
Targets in Merchandise Trade
* Actual (Source: TURKSTAT)
**Forecast: Medium Term Programme, Ministry of Development, 2014-2016)
***The Exports Strategy of Turkey For 2023
February 2014 Ministry of Economy 11
(Billion $) 2012* 2013* 2013** 2014** 2015** 2016** 2023***
Exports 152.5 151.9 153.5 166.5 184 202.5 500
Imports 236.5 251.7 251.5 262 282 305 625
Volume of trade 389 403.5 405 428.5 466 507.5 1125
Balance of trade -84.1 -99.8 -98 -95.5 -98 -102.5 -125
Exports/Imports (%) 64.5 60.3 61.0 63.5 65.2 66.4 80.0

Main Export Partners (Share,%)
Main Trade Partners (January-December
2013)
Main Import Partners
(Share,%)
Source:
TURKSTAT
February 2014 Ministry of Economy 34

BILATERAL TRADE BETWEEN TURKEY AND CZECH REPUBLIC
(1.000 US $ )
2011 2012 2013
Export 1.300.472 1.103.907 1.138.568
Import 1.356.756 1.703.953 2.209.955
Volume 2.657.228 2.807.860 3.348.526
Balance - 56.284 - 600.146 - 1.071.387
*The share of Turkey in Czech Rep. total imports is % 0.07
The share of Czech Rep. İn Turkey’s total import is % 0.08

C- TURKISH MACHINERY SECTOR

Rising Sector of Turkey :
MACHINERY
With its rapid development and the potential it has, the
Turkish Machinery Sector is a sector increasing its share
in the Turkish economy and exports.
Machinery and Accessories is the 2nd largest sector after
Vehicles (other than railway, tramway etc.) in Turkish
exports.
Turkey realizes exports to more than 200 countries
(including free zones).
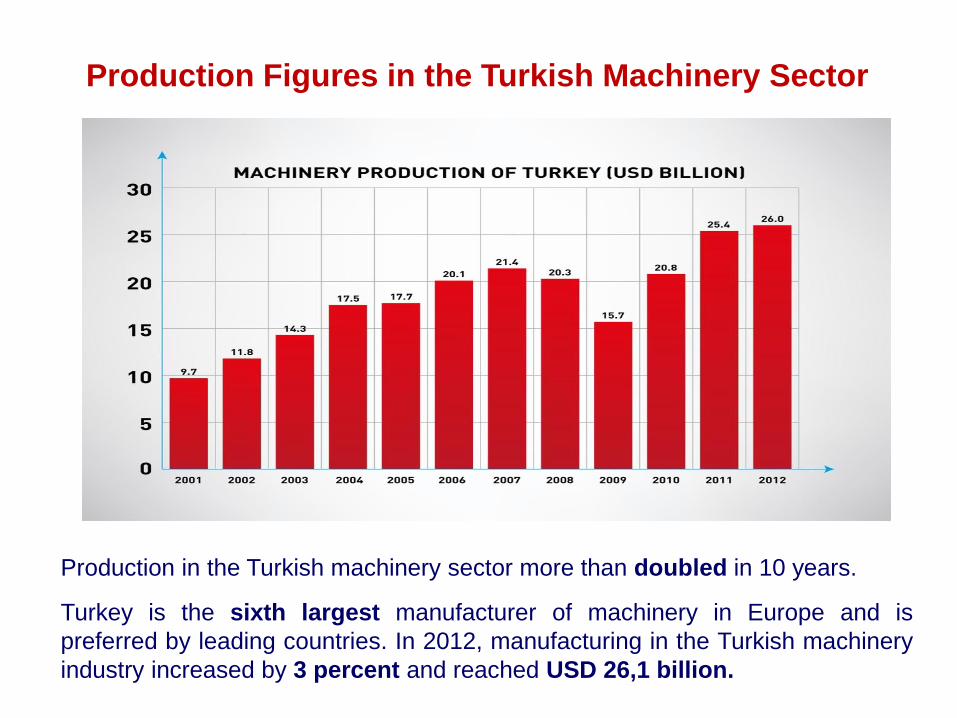
Production Figures in the Turkish Machinery Sector
Production in the Turkish machinery sector more than doubled in 10 years.
Turkey is the sixth largest manufacturer of machinery in Europe and is
preferred by leading countries. In 2012, manufacturing in the Turkish machinery
industry increased by 3 percent and reached USD 26,1 billion.
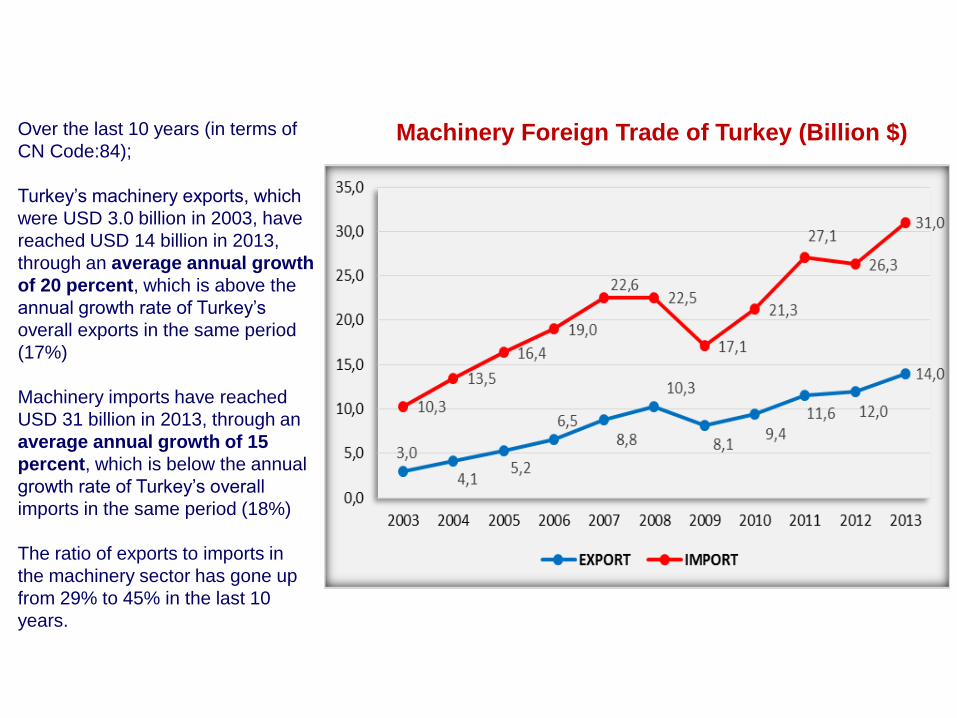
Over the last 10 years (in terms of
CN Code:84);
Turkey’s machinery exports, which
were USD 3.0 billion in 2003, have
reached USD 14 billion in 2013,
through an average annual growth
of 20 percent, which is above the
annual growth rate of Turkey’s
overall exports in the same period
(17%)
Machinery imports have reached
USD 31 billion in 2013, through an
average annual growth of 15
percent, which is below the annual
growth rate of Turkey’s overall
imports in the same period (18%)
The ratio of exports to imports in
the machinery sector has gone up
from 29% to 45% in the last 10
years.
Machinery Foreign Trade of Turkey (Billion $)
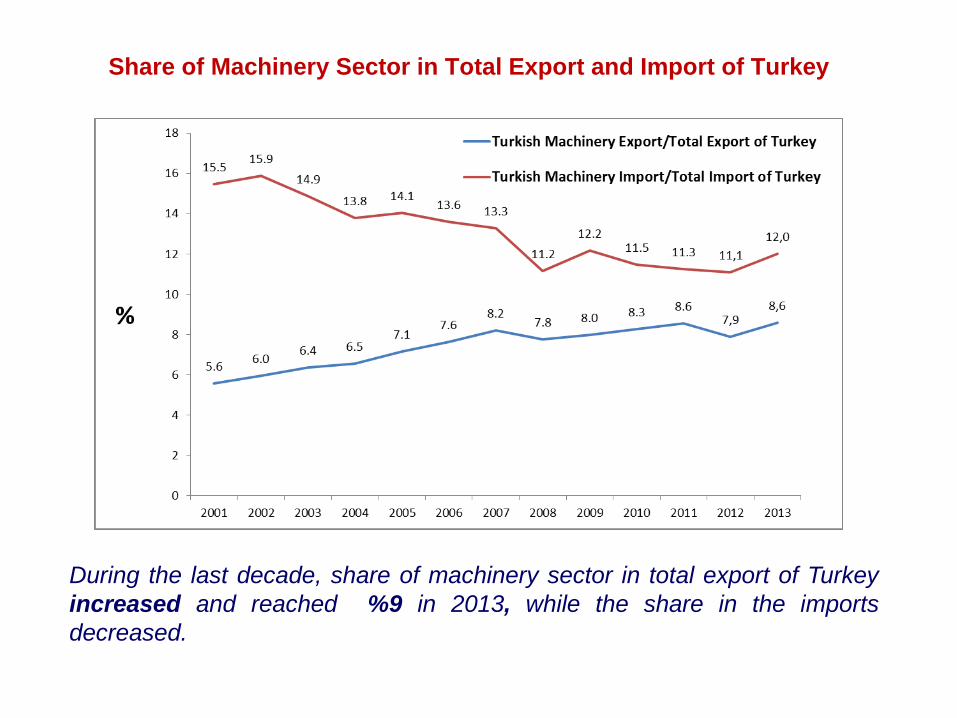
Share of Machinery Sector in Total Export and Import of Turkey
During the last decade, share of machinery sector in total export of Turkey
increased and reached %9 in 2013, while the share in the imports
decreased.
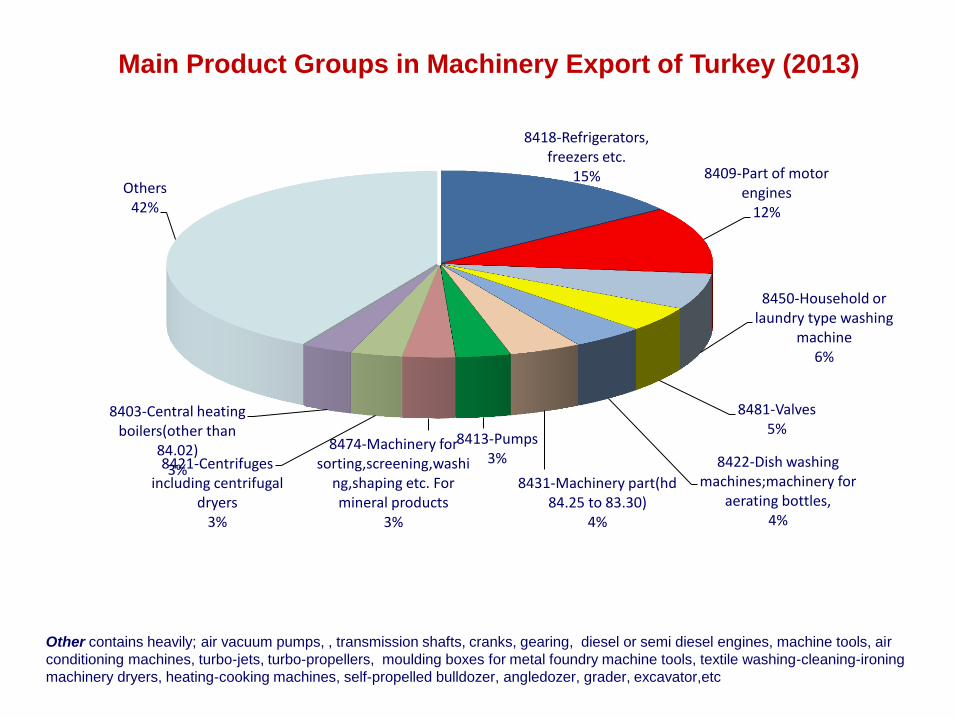
Main Product Groups in Machinery Export of Turkey (2013)
8418-Refrigerators, freezers etc.
15% 8409-Part of motor engines
12%
8450-Household or laundry type washing
machine 6%
8481-Valves 5%
8422-Dish washing machines;machinery for
aerating bottles, 4%
8431-Machinery part(hd 84.25 to 83.30)
4%
8413-Pumps 3%
8474-Machinery for sorting,screening,washi
ng,shaping etc. For mineral products
3%
8421-Centrifuges including centrifugal
dryers 3%
8403-Central heating boilers(other than
84.02) 3%
Others 42%
Other contains heavily; air vacuum pumps, , transmission shafts, cranks, gearing, diesel or semi diesel engines, machine tools, air
conditioning machines, turbo-jets, turbo-propellers, moulding boxes for metal foundry machine tools, textile washing-cleaning-ironing
machinery dryers, heating-cooking machines, self-propelled bulldozer, angledozer, grader, excavator,etc

Main Product Groups in Machinery Import of Turkey (2013)
8471-Automatic data proccessing engines etc.
9%
8408-Diesel or semi-diesel engines
7%
8429-Self propelled bulldozer,anglodozer,gra
der,excavator etc. 4%
8414-Compressors(Air, vacuum pumps;hoods
incorp a fan) 4%
8421-Centrifuges including centrifugal
dryers 4%
8481-Valves 4%
8479-Machines having individual functions
4%
8413-Pumps 3%
8443-Printing machinery 3%
8409-Part of motor engines
2%
Others 56%
Other contains heavily; steam or vapour generating boilers, air conditioning machines, engines, heating-cooking machines,
dish washing machines, transmission shafts, lifting/handling/loading machines, turbo jets, turbo-propellers, textile preparing
machines, refrigerators, freezers.

GERMANY 16,7%
ENGLAND 7%
RUSSIA 5,6%
IRAQ 5,2%
USA 4,8%
FRANCE 4,3%
ITALY 3,4%
FREE ZONES 3%
AZEBAIJAN 3%
ROMANIA 2,7%
OTHER 44,4%
Turkey exported USD 88 million worth of machinery to Czech Republic in 2013.
Machinery Export of Turkey by Country (2013)
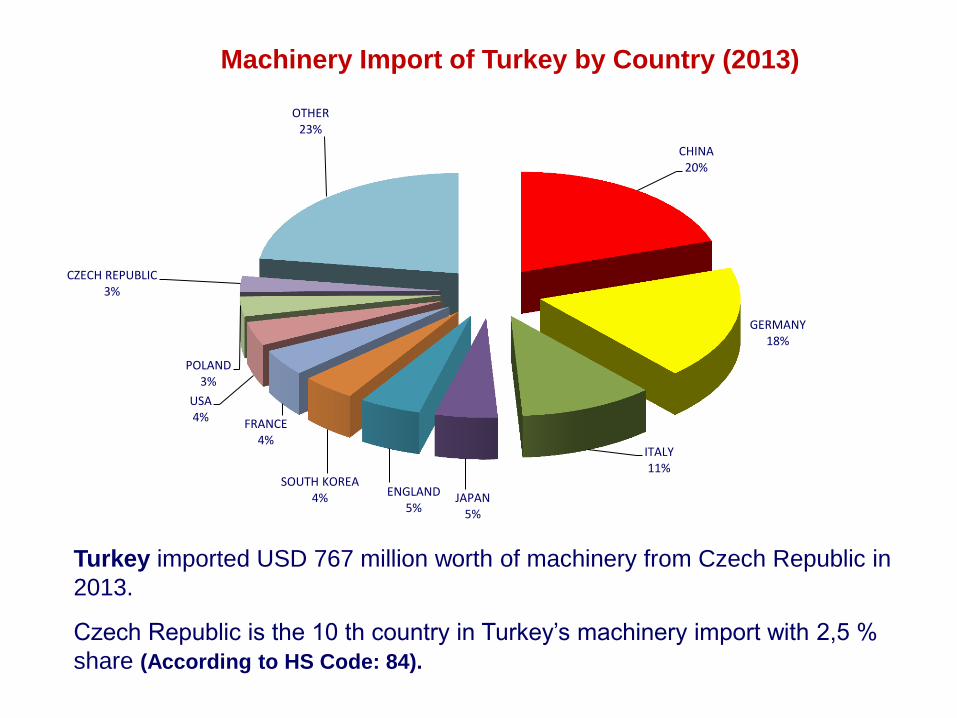
Machinery Import of Turkey by Country (2013)
CHINA 20%
GERMANY 18%
ITALY 11%
JAPAN 5%
ENGLAND 5%
SOUTH KOREA 4%
FRANCE 4%
USA 4%
POLAND 3%
CZECH REPUBLIC 3%
OTHER 23%
Turkey imported USD 767 million worth of machinery from Czech Republic in
2013.
Czech Republic is the 10 th country in Turkey’s machinery import with 2,5 %
share (According to HS Code: 84).
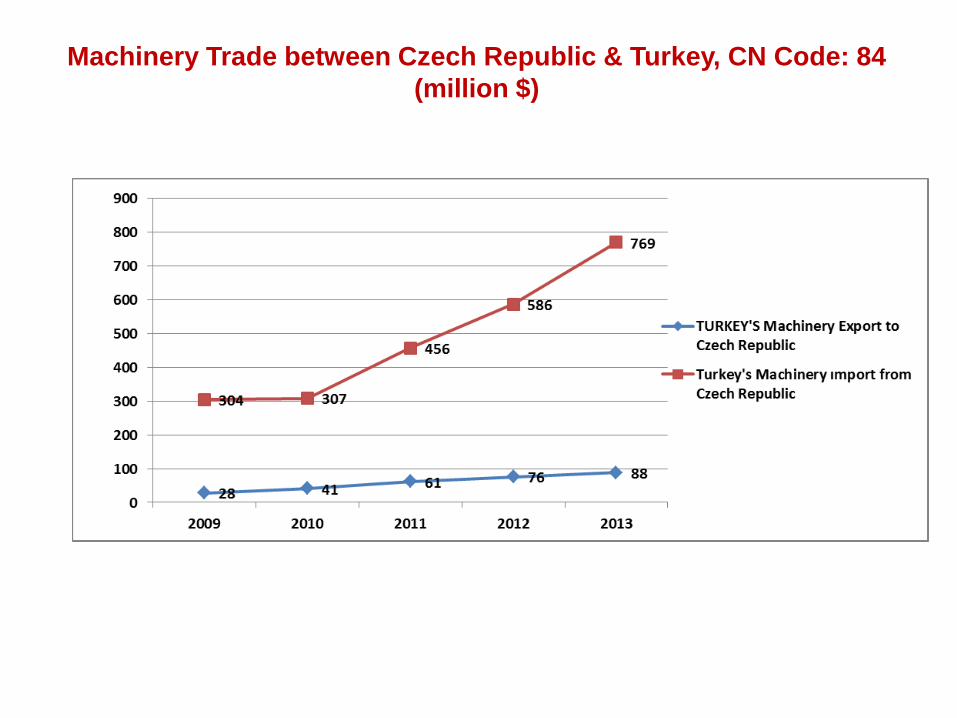
Machinery Trade between Czech Republic & Turkey, CN Code: 84
(million $)

Top 10 Products in Turkey’s Machinery Exports to Czech
Republic (2013, Million USD) (CN Code: 84)
0 2 4 6 8 10 12 14 16
8409-Part for use solely/principally with the motor engines
8418-Refrigerator, freezer, etc
8450-Household or laundry-type washing machines
8431-Machinery part (hd 84.25 to 84.30)
8414-Air, vacuum pumps; hoods incorp a fan
8422-Dish washing machines; machinery for aerating bottles
8403-Central heating boilers (other than 84.02)
8462-Machine-tool for wrkg met by forging/ hammerg,etc
8480-Moulding boxe for met foundry;mould base; etc
8483-Transmission shafts&cranks, bearing housing; gearing; etc

Top 10 Products in Turkey’s Machinery Imports from Czech Republic
(2013, Million USD) (CN Code: 84)
0 20 40 60 80 100 120
8471-Automatic data processing machines;optical reader, etc
8406-Steam turbines and other vapour turbines
8421-Centrifuges, incl centrifugal dryers; filtering/purifyingmachinery
8408-Diesel or semi-diesel engines
8414-Air, vacuum pumps; hoods incorp a fan
8415-Air conditioning machines, with motor-driven elements
8413-Pumps for liquids; liquid elevators
8402-Steam or vapour generatg boiler; super-heated water boiler
8481-Tap,cock,valve for pipe,tank for the like,incl pressurereducing valve
8404-Auxiliary plant for boiler of hd 8402/03,condenser for steam power uni

Countries Recording the Fastest Growth Rates in World Machinery Exports
(2003-2012)
Among the top 30 countries in world machinery exports, Turkey ranks 4th in
Average Annual Growth Rates of Machinery Exports from 2003 to 2012.

ADVANTAGES NEED TO BE DEVELOPEDDeveloped engineering skills and quick adaptation
to new technologies
Special financing models for the sector should be
developed
Quality awarenessThe production of high value-added systems
should be supported
Specialized, highly educated and skilled middle
and senior managers SMEs should be directed to act together
Young workforce
The number of qualified firms and quality
production should be increased and these
companies supported privately
Sufficient facilities (like industrial zones) and
sufficient infrastructure
Main and sub-industry cooperation should be
increased
Advanced sub-industry
R & D activities and investments for the
development of the technological infrastructure
should be increased
High level of organization of the sectorPromotional activities for brand building should
be increased
Rapid adaptation to international manufacturing
standards
Cooperation in areas with inadequate production
should be increased, investments to these areas
should be encouraged
Domestic supply of raw materialsUniversity-Industry collaboration should be
developed
Flexible structure of SMEs (Most of the active
companies in the Machine Manufacturing
Industry in Turkey are SMEs)
Employment of qualified technical personnel
should be increased
TURKISH MACHINERY INDUSTRY
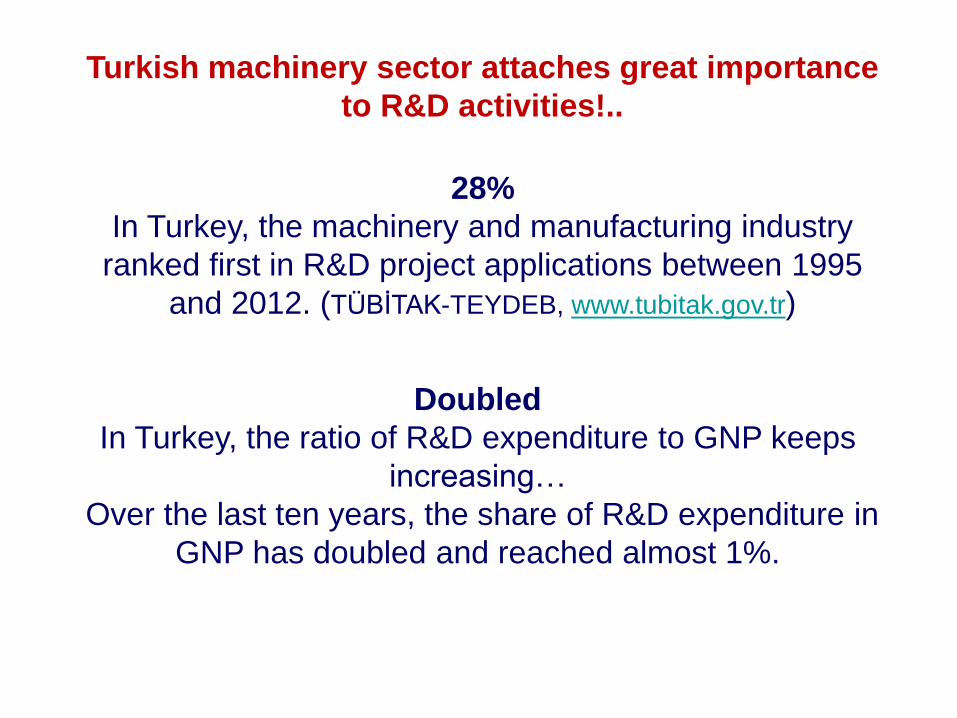
Turkish machinery sector attaches great importance
to R&D activities!..
Doubled
In Turkey, the ratio of R&D expenditure to GNP keeps
increasing…
Over the last ten years, the share of R&D expenditure in
GNP has doubled and reached almost 1%.
28%
In Turkey, the machinery and manufacturing industry
ranked first in R&D project applications between 1995
and 2012. (TÜBİTAK-TEYDEB, www.tubitak.gov.tr)

TURKEY IS THE 23rd GLOBAL FDI RECIPIENT
2005 2006 2007 2008 2009 2010 2011 2012
FDI Total (net), million USD 10.031 20.185 22.046 19.504 8.411 9.038 16.047 13.018
Machinery, million USD 13 54 48 226 220 64 78 32
Machinery/Total FDI, % 0,1 0,3 0,2 1,2 2,6 0,7 0,5 0,2
FOREIGN DIRECT INVESMENT (FDI) INFLOW TO TURKEY
78 percent of FDI inflows to Turkey is coming from European Countries.
In Turkey, number of companies with foreign capital is over 36 thousand as of
December, 2013. 50 of these companies are from Czech Republic.

- To be among the top 5 machinery exporting countries in
the world by carrying out USD 100 billion machinery
exports in Turkey’s total exports which are targeted to reach
USD 500 billion by 2023
- To increase the share of machinery in Turkey’s total
exports from 9% to 20 %.
Turkish Machinery Sector’s Export Target
Turkey should be considered with its neighbours and
trading partners!..Not alone…
By virtue of its strategic location, Turkey has strong
economic and trade relations with many of the countries.
Turkey’s construction and contracting companies are active
today in construction and infrastructure projects of all kinds
both in Turkey and abroad.

In reaching the 2023 target, we seek to cooperate with partner countries
in various areas.
Considering our relations in the past, European countries are among the
primary targets for us.
Our desire is to make joint investments, production and marketing
organizations; brand purchases; cooperation in technical training, R&D
activities; bilateral distribution agreements between two countries’
companies.
Our mission is to create a machinery industry with higher technology and
the Turkish machinery sector is open to cooperation towards integration
with European Countries like Czech Republic.
The Turkish machinery sector is ready to cooperate…

D) SERVICES
February 2014 Ministry of Economy 38

Tourism: Besides increasing the number of tourist arrivals, creating a structure that improves service quality, targets high-income groups by diversifying marketing channels, preserves natural capital and sustainability, and stimulates those types of tourism where Turkey has comparative advantages
Construction, Engineering-Architecture, Technical Consultancy and Contracting Services: Establishing a structure that fits Turkey’s economic and social needs, that is compatible with high technology and international rules, that is sensitive to environment, that creates high value added, high foreign exchange inflow and high employment, that grants high service quality, and that relies on qualified human and physical capital.
Commercial Services: Increasing productivity and commercial trade volume in a competitive way, and to encourage technology and innovation.
Targets in Services
February 2014 Ministry of Economy 39
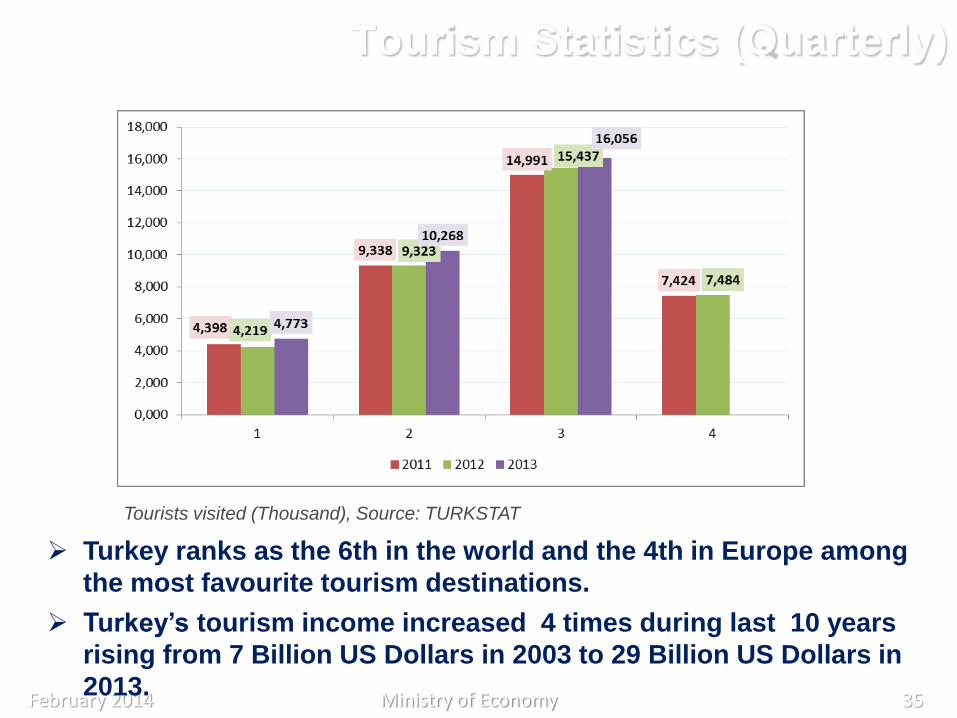
Tourism Statistics (Quarterly)
February 2014 Ministry of Economy 35
Tourists visited (Thousand), Source: TURKSTAT
Turkey ranks as the 6th in the world and the 4th in Europe among
the most favourite tourism destinations.
Turkey’s tourism income increased 4 times during last 10 years
rising from 7 Billion US Dollars in 2003 to 29 Billion US Dollars in
2013.

Contracting Services Abroad
36
38 out of the world’s top 250
contracting companies are
Turkish.
Turkey ranks as the 2nd country
(following China) in terms of the
number of top contracting
companies.
Contributions to the overall
economic performance:
Creating foreign exchange
inflow, exports, employment,
technology transfer; adding to
the machinery stock,
facilitating internationalization
February 2014 Ministry of Economy
Regional Breakdown of Projects(%)
Years Projects Countries
Project
Volume
(Million $)
Cum.
Project
Volume
(Million $)
Avr.
Project
Volume
(Million $)
1971-2001 2006 69 43,252 43,252 22
2002 132 32 2,571 45,823 19
2003 270 36 4,490 50,313 17
2004 429 39 11,367 61,680 26
2005 408 34 12,375 74,055 30
2006 515 36 24,059 98,114 47
2007 570 45 25,260 123,374 44
2008 620 40 24,827 148,201 40
2009 474 45 21,667 169,868 46
2010 583 48 23,067 192,935 40
2011 505 50 20,489 213,424 41
2012 485 49 29,434 242,858 61
2013 377 44 31,519 274,379 84
2014 14 9 2017 276,396 144Last updated on February 2014
E- INVESTMENTS, FOREIGN
CAPITAL and INCENTIVES
37 February 2014 Ministry of Economy

Investment Climate in Turkey
38
1- SOUND ECONOMIC
PERFORMANCE 6- CENTRAL LOCATION
2- YOUNG and DYNAMIC
POPULATION
7- ENERGY CORRIDOR and
TERMINAL of EUROPE
3- QUALIFIED and COMPETITIVE
LABOR FORCE
8- LOW TAX RATES and
INCENTIVE FACILITIES
4- LIBERAL and INNOVATIVE
INVESTMENT CLIMATE
9- CUSTOMS UNION with EU
and OPEN ECONOMY
5- INFRASTRUCTURE 10- DOMESTIC MARKET
10 REASONS TO INVEST IN TURKEY
February 2014 Ministry of Economy

Time Required to Start a Business
The required time to start a business is 6 days in
Turkey.
Source: Invest In Turkey
39 February 2014 Ministry of Economy

Investment Incentive System
The current investment incentive system of
Turkey is structured in four sub systems:
General Investment Incentive System
Regional Investment Incentive System
Investment Incentive System for Big
Scale Projects
Encouraging the Strategic Investments
52 February 2014 Ministry of Economy

The Prominent Czech Companies which are
doing business and cooperation with Turkish
Companies in Turkey
• CEZ
• Pro Energy
• CKD
• Vitkovice
• Zentiva

Vitkovice is the biggest machinery and power
energy Company doing business in Turkey
• Vitkovice von a tender last year to constract energy
power station in Yunus Emre (İn Central Anatolian
Region)
• The total value of the project is about 400 Million EURO.
• Apart from this project Vitkovice company is providing
technical aparat and machinery for the some of other
energy companies in Turkey
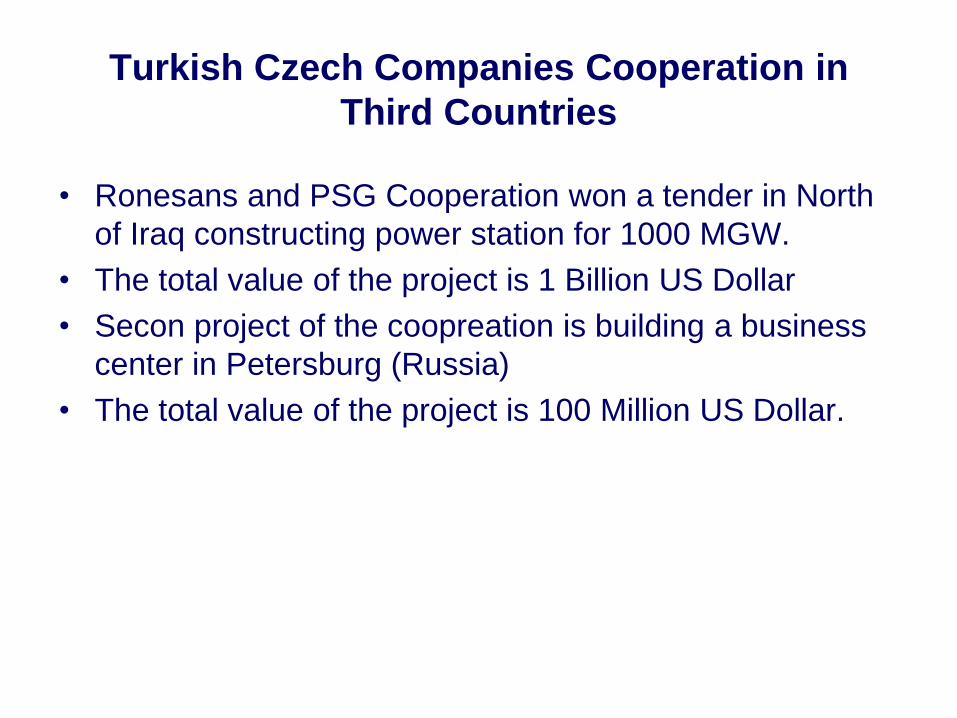
Turkish Czech Companies Cooperation in
Third Countries
• Ronesans and PSG Cooperation won a tender in North
of Iraq constructing power station for 1000 MGW.
• The total value of the project is 1 Billion US Dollar
• Secon project of the coopreation is building a business
center in Petersburg (Russia)
• The total value of the project is 100 Million US Dollar.

• THANK YOU VERY MUCH FOR YOUR
ATTENTION