turning the screws on db2
TRANSCRIPT

Copyright 2003 Grapevine Information Technology Pty Ltd. (# 1)
Turning the Screws on DB2
Bruce AllenGrapevine Information [email protected]
C2: Thursday 20 March, 1:30pm

Copyright 2003 Grapevine Information Technology Pty Ltd. (# 2)
Disclaimer• These notes are a combination of available DB2 documentation from IBM and
experience in using the product. Keep in mind that some things at the detail levelwill change from release to release.
• If there is a discrepancy between these notes and the DB2 manuals, you shouldprobably believe the official publications.
References:
System Monitor Guide and Reference
Administration GuideCommand Reference
Definitions included in this document for Configuration parameters are from theAdministration Guide.Definitions included in this document for Monitor elements are from the System MonitorGuide and Reference.

Copyright 2003 Grapevine Information Technology Pty Ltd. (# 3)
Turning the Screws on DB2• Introduction
♦ DB2 Configuration♦ Monitor Data
•Sort Activity•Buffer Pool Usage•Lock Activity•Catalog Cache Efficiency•Show Stoppers•First Changes
This presentation addresses Database Manager Configuration parameters and DatabaseConfiguration parameters and the monitor elements that provide feedback on thosesettings.

Copyright 2003 Grapevine Information Technology Pty Ltd. (# 4)
DB2 Configuration• Instance Configuration
♦ get DBM configuration♦ update DBM configuration using …♦ update dbm cfg using SHEAPTHRES 25000
•Database Configuration♦ get database configuration for <database>♦ update db configuration for <database> using …♦ update db cfg for gvdb using LOCKTIMEOUT 12
•DB2 Registry♦ db2set -all♦ db2set DB2_PARALLEL_IO=*
Configuration settings are held at the instance (or database manager) level and at thedatabase level.DB2 Registry settings are additional instance level settings. They may be specified asglobal (-g option) so that they refer to every instance on the server. Use the command‘db2set -lr’ to list all supported registry variables.
References to database manager configuration and database configuration parameters arein upper case and refer to the (short) name used in the update configuration command.For example, SHEAPTHRES is used to refer to the database manager configurationparameter Sort Heap Threshold.

Copyright 2003 Grapevine Information Technology Pty Ltd. (# 5)
Some DB2 Processes (Unix names)•db2pfchr (prefetchers)
♦ db cfg NUM_SERVERS (default 3)•db2pclnr (page cleaners)
♦ db cfg NUM_IOCLEANERS (default 1)•db2loggr (logging)•db2dlock (deadlock detection)•Solaris. Use db2ptree to list names
db2wdog - watchdog process to handle abnormal terminations (Unix only) (instance)
db2sysc - system controller (instance)
db2ipccm - communications listener that provides connection support for local andremote clients (database)
db2tcpim
db2gds - global daemon spawner that starts new processes (Unix only) (instance)
db2dlock - deadlock detector (database) db2loggr - manipulates log files to handle transaction processing and recovery(database)
db2pclnr - buffer pool page cleaners (database)
db2pfchr - I/O prefetchers (database)
db2tcpcm - communications listener that provides connection support for local andremote clients (database)
db2agent - coordinator agent performs database requests on behalf of local andremote clients (LRC) (connection)
others:db2udf - fenced udfs run outside of DB2's address space (instance)
db2dari - fenced stored procedures run outside of DB2's address space (instance)
db2agntp - subagents receive requests from the coordinator agent (connection)
On Sun, use the db2ptree command to see the process names listed above.
Copyright 2003 Grapevine Information Technology Pty Ltd. (# 6)
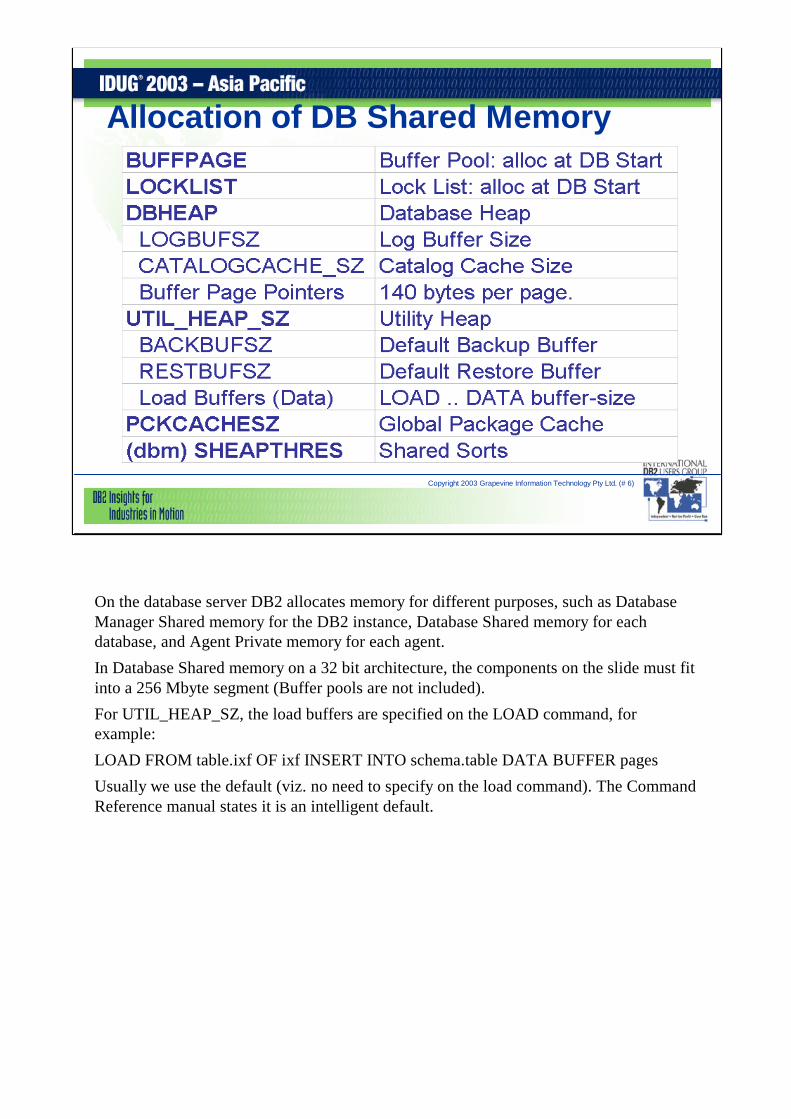
Allocation of DB Shared Memory
On the database server DB2 allocates memory for different purposes, such as DatabaseManager Shared memory for the DB2 instance, Database Shared memory for eachdatabase, and Agent Private memory for each agent.
In Database Shared memory on a 32 bit architecture, the components on the slide must fitinto a 256 Mbyte segment (Buffer pools are not included).
For UTIL_HEAP_SZ, the load buffers are specified on the LOAD command, forexample:
LOAD FROM table.ixf OF ixf INSERT INTO schema.table DATA BUFFER pages
Usually we use the default (viz. no need to specify on the load command). The CommandReference manual states it is an intelligent default.

Copyright 2003 Grapevine Information Technology Pty Ltd. (# 7)
Default Installation: Allocation ofDatabase Shared Memory
Default values are shown for Unix systems. Values for OS/2 and Windows systems arelower for some parameters.Default value for Global Package Cache is MAXAPPLS * 8 (default value forMAXAPPLS on Unix systems is 40), giving a value of 320 pages.
By the way, in these spreadsheets, I have used 1000 bytes to be 1Mbyte so there are lessnumbers to read on the foils.
Copyright 2003 Grapevine Information Technology Pty Ltd. (# 8)
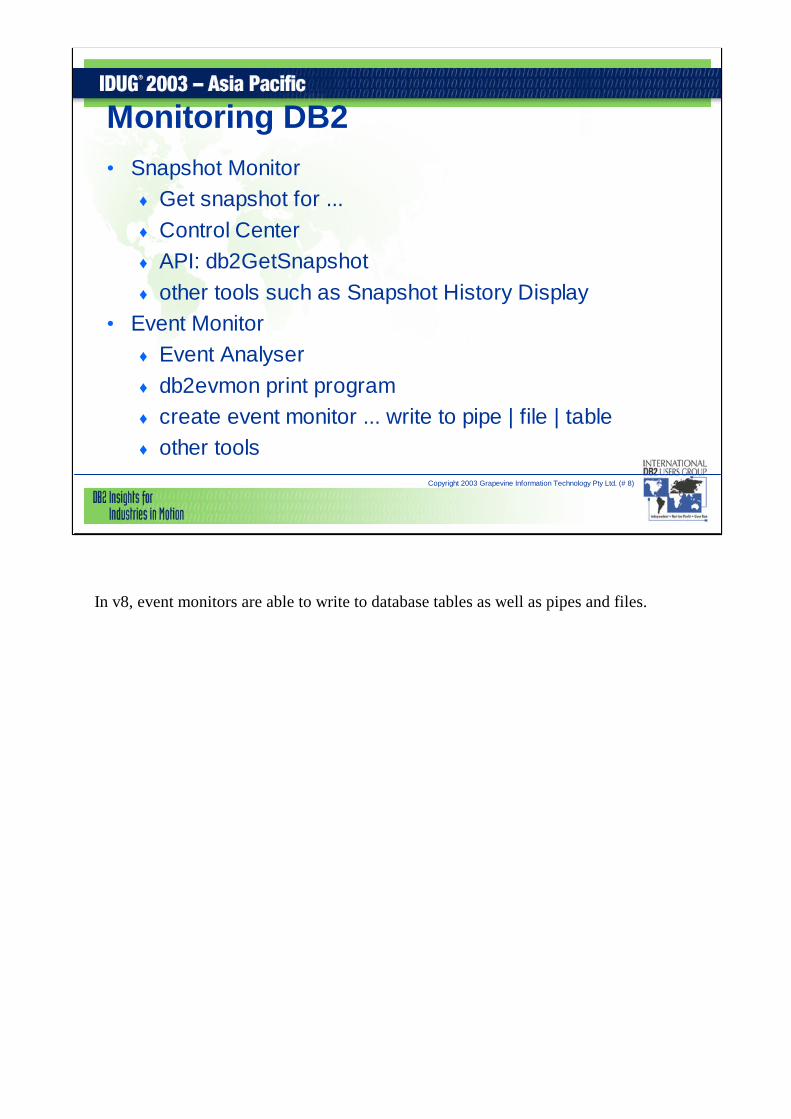
Monitoring DB2•Snapshot Monitor
♦ Get snapshot for ...♦ Control Center♦ API: db2GetSnapshot♦ other tools such as Snapshot History Display
•Event Monitor♦ Event Analyser♦ db2evmon print program♦ create event monitor ... write to pipe | file | table♦ other tools
In v8, event monitors are able to write to database tables as well as pipes and files.

Copyright 2003 Grapevine Information Technology Pty Ltd. (# 9)
Monitor Data•Database Manager (DB2): Number of Local and Remote
Connections, Number of Registered and Waiting Agents, Sorts
•Database: Logical and Physical Reads and Writes, RowsUpdated, SQL Statements, Locks, Sorts, Logging, Cache
♦ Bufferpool: Logical and Physical Reads and Writes
♦ Tablespace: Logical and Physical Reads and Writes
♦ Table: Rows Read and Written, Accesses to OverflowedRecords
•Application: Logical and Physical Reads and Writes, RowsUpdated, SQL Statements, Locks, Sorts, Logging, Cache
•Dynamic SQL: Prepares and Executions, Rows Updated, SQLStatement Text
References to DB2 monitor elements are in mixed case and refer to the 'English' name,rather than the programming name for the element. For example, Maximum DatabaseHeap Allocated is used to refer to the database snapshot element db_heap_top.

Copyright 2003 Grapevine Information Technology Pty Ltd. (# 10)
Using Monitor Data to Impact DB2•Sort Activity•Buffer Pool Usage•Lock Activity•Catalog Cache Efficiency•Show Stoppers

Copyright 2003 Grapevine Information Technology Pty Ltd. (# 11)
Sort Activity• goal: Minimise sort time• (Trend) Average Sort Time• = Total Sort Time / Total Sorts
♦ (database, applicationselements)
Avg Sort Time (msec)
0
5
10
15
20
25
To reduce sort time: Add an index
If Average Sort Time increases, we want to look for the cause of a sort taking longer. Is itoverflowing to disk, or just sorting more data.
Definitions.
Total Sort Time (total_sort_time at database, application and statement level) Totalelapsed time (in milliseconds) for all sorts that have been executed.Total Sorts (total_sorts at database, application and statement level) Total number ofsorts that have been executed.

Copyright 2003 Grapevine Information Technology Pty Ltd. (# 12)
Sorts• SORTHEAP allocated for
each sort from SHEAPTHRES• Total Sort Heap Allocated
(db2 and database snapshotelements) is fromSHEAPTHRES
A Sort Heap, of size SORTHEAP (db cfg), is allocated in memory for each sort. Anapplication can use multiple Sort Heaps. When SHEAPTHRES (dbm cfg) is reached (forprivate sorts), allocations of SORTHEAP continue, but with a reduced amount. Theseallocations are Post Threshold Sorts.
Total Sort Heap Allocated (db2 and database snapshot element) is the part ofSHEAPTHRES in use for Sort Heaps (for this database for the database element). Thiscan be larger than SHEAPTHRES as SHEAPTHRES is not a hard limit for private sorts.
Definitions.
Total Sort Heap Allocated (sort_heap_allocated at db2 and database snapshot level)Total number of allocated pages of sort heap space for all sorts at the level chosen and atthe time the snapshot was taken.
Sort Heap Size (SORTHEAP) Maximum number of private memory pages to be usedfor private sorts, or the maximum number of shared memory pages to be used for sharedsorts.
Sort Heap Threshold (SHEAPTHRES) Private and shared sorts use memory from twodifferent memory sources. For private sorts, this parameter is an instance-wide soft limiton the total amount of memory that can be consumed by private sorts at any given time.For shared sorts, this parameter is a database-wide hard limit on the total amount ofmemory consumed by shared sorts at any given time.

Copyright 2003 Grapevine Information Technology Pty Ltd. (# 13)
Sorts in Memory• Choice 1: Do sorts in memory• (Monitor) Reduced Sort Heap
allocations• elements: Post Threshold
Sorts (db2)• Decrease db cfg SORTHEAP• Increase dbm cfg
SHEAPTHRES
Post Threshold Sorts
0
5000
10000
15000
20000
25000
30000
35000
40000
45000
50000
If there are too many Post Threshold Sorts, decrease SORTHEAP to decrease the size ofeach Sort Heap. Otherwise, increase SHEAPTHRES. However, ensure there is enoughmemory to support the size of SHEAPTHRES without paging.
You may also get a reduced SORTHEAP allocation if Agent Private Memory is used up.SORTHEAP is allocated in Agent Private Memory (for non parallel operation) which is asingle segment on a 32 bit architecture and a maximum 256 Mbytes for the segment.A task running a Load command can get reduced Sort Heap allocation due to AgentPrivate Memory being constrained by the maximum segment size of 256 Mbytes. In thiscase, Post Threshold Sorts is zero since SHEAPTHRES is not reached.
If all sorts are in memory, reduce SHEAPTHRES until Post Threshold Sorts start to rise.On a loaded machine, this can ensure that the memory allocated to SHEAPTHRES isused and so a sudden increase in load will not cause unexpected memory usage.
Definitions.
Post Threshold Sorts (post_threshold_sorts at db2 snapshot level). The number of sortsthat have requested heaps after the sort heap threshold has been reached.

Copyright 2003 Grapevine Information Technology Pty Ltd. (# 14)
Sorts in Memory• Choice 1: Do sorts in memory
(cont.)• (Monitor) %Sorts Overflowed• = Sort Overflows / Total Sorts
* 100%♦ (database elements)
Sort Overflows (percent)
0
5
10
15
20
25
30
If Sort Overflows is non zero, sorts are using the Temporary tablespace.The defaultTemporary tablespace when a database is created is TEMPSPACE1. The Buffer statisticsfor the Temporary tablespace tell how much of this activity is going to disk.
Definitions.
Sort Overflows (sort_overflows at database, application, statement levels) The totalnumber of sorts that ran out of sort heap and may have required disk space for temporarystorage.
Total Sorts (total_sorts at database, application, statement levels) Total number of sortsthat have been executed.

Copyright 2003 Grapevine Information Technology Pty Ltd. (# 15)
Sorts in Memory•Choice 1: Do sorts in memory (cont.)• (Monitor) %Piped Sorts Accepted•%Piped Sorts Accepted = Piped Sorts Accepted / Piped
Sorts Requested * 100%•elements: Piped Sorts Accepted, Piped Sorts
Requested (db2)• (Monitor) %Sort Heap Allocated
♦ = Total Sort Heap Allocated / SHEAPTHRES * 100%•elements: Total Sort Heap Allocated (db2 and database
snapshot)
If %Piped Sorts Accepted is not 100%, then sorts that the optimiser thought would occurin memory were actually written to tempspace.SQL EXPLAIN output will show whether the optimiser requests a piped sort. A pipedsort is in memory in SORTHEAP.
If you change SORTHEAP, this can affect the access plan chosen by the Optimiser as ituses SORTHEAP to determine if a sort is to be Piped (done in memory). Rebindpackages. Other parameters may affect SHEAPTHRES. For example, an increase inMAXCAGENTS will probably require an increase in SHEAPTHRES.
%Sort Heap Allocated is an indicator of current memory usage by sorts.
Definitions.
Piped Sorts Requested (piped_sorts_requested at db2 snapshot level) Number of pipedsorts that have been requested.
Piped Sorts Accepted (piped_sorts_accepted at db2 snapshot level) Number of pipedsorts that have been accepted.

Copyright 2003 Grapevine Information Technology Pty Ltd. (# 16)
Sorts in Memory - Buffer Pool•Choice 2: Overflow to tempspace is buffered•Look at buffer statistics for TEMPSPACE1 (tablespace
elements)♦ Buffer Pool Data Logical Reads♦ Buffer Pool Data Physical Reads♦ Buffer Pool Data Writes♦ Buffer Pool Asynchronous Data Reads♦ Buffer Pool Asynchronous Read Requests
A second level cache for sorting is the buffer pool allocated to the system temporarytablespaces.Usually only one is allocated for each buffer pool size (4k, 8k, etc), and multiplecontainers are added for disk parallelism. The default temporary tablespace in a databaseis called TEMPSPACE1.
You can look at the tablespace level statistics for temporary tablespaces. A high BufferHit Ratio means that most reads are from the buffer pool. Since access is primarilysequential, we want enough buffer pool to ensure prefetch is effective (Buffer PoolAsynchronous Data Reads per Buffer Pool Asynchronous Read Requests).

Copyright 2003 Grapevine Information Technology Pty Ltd. (# 17)
Buffer Pool Usage•Choice 1: as much memory as possible, after sort pool•How many Buffer Pools?•For starters, Use 1 Buffer Pool
♦ Use the memory that’s left•What is a good value for each Buffer Pool?
♦ Allocate BP to different usage* Random Access versus Sequential* Data versus Index* In Memory Indexes or Tables
This presentation addresses Database Manager Configuration parameters and DatabaseConfiguration parameters and the monitor elements that provide feedback on thosesettings. Many other presentations address buffer pool tuning.

Copyright 2003 Grapevine Information Technology Pty Ltd. (# 18)
Buffer Pool - DBHEAP• Change bufferpool size• This will change the number
of Buffer Pool Descriptors• (Monitor) Maximum Database
Heap Allocated• (database elements)• Change db cfg: Increase /
decrease size of DBHEAP
DB Heap Top (M bytes)
0
10
20
30
40
50
60
70
DB2 Admin Guide: If the value of the Maximum Database Heap Allocated element is thesame as the DBHEAP configuration value, it is quite likely that an application hasreceived an error indicating that there was not enough storage available.
Definitions.
Maximum Database Heap Allocated (db_heap_top at database level) It now measuresmemory usage, but not exclusively usage by the database heap. Maintained for DB2version compatibility.
Database Heap (DBHEAP) There is one database heap per database, and the databasemanager uses it on behalf of all applications connected to the database. It contains controlblock information for tables, indexes, table spaces, and buffer pools. It also containsspace for the log buffer (logbufsz), and the catalog cache (catalogcache_sz).

Copyright 2003 Grapevine Information Technology Pty Ltd. (# 19)
Buffer Pool - DBHEAP
An increase in bufferpool pages to 100,000 Pages (400 Mb) will increase the number ofBuffer Pool Descriptors and the amount of space required in DBHEAP.So, an increase in DBHEAP from 1200 pages (4.8 Mb) to 5,000 pages (20 Mb) allowssufficient space.

Copyright 2003 Grapevine Information Technology Pty Ltd. (# 20)
Buffer Pool Usage - Sync Reads• goal: Minimise synchronous
read I/O time• (Trend) Average
Synchronous Read I/O Time• (Monitor) Synchronous Page
Read Rate (data and index)♦ = (Sync) / (Sync + Async
Physical Reads) * 100%(database, tablespace)
• Change db cfgNUM_IOSERVERS♦ Utilities use for async I/O
Synchronous Page Read Rate (percent)
0
10
20
30
40
50
60
There are many screws to turn to affect Average Synchronous Read Time, includingoverall disk activity, queuing on the device, seek time, use of an operating system cacheand ,of course, the size of the bufferpool.
The monitor elements are called Buffer Pool Data Reads, Buffer Pool Asynchronous DataReads, Buffer Pool Index Reads, Buffer Pool Asynchronous Index Reads.
Having extra I/O servers configured (db cfg NUM_IOSERVERS) will not impactperformance as I/O servers are not used unless required. The same static list is used, andservers are always allocated starting from the top of the list. The Admin Guide advises:To maximise parallelism, configure at least the physical number of disks.
If you increase NUM_IOSERVERS and the Synchronous Page Read Ratio improves, doit again.
If the application does a lot of random reads we would expect a correspondingly highsynchronous read rate.
Buffer size and disk activity will probably have a much bigger impact on synchronousread I/O time than these configuration parameters.
Definitions.
Number of I/O Servers (NUM_IOSERVERS) The number of I/O servers for a database.I/O servers are used on behalf of the database agents to perform prefetch I/O andasynchronous I/O by utilities such as backup and restore.

Copyright 2003 Grapevine Information Technology Pty Ltd. (# 21)
Buffer Pool Usage - Sync Writes• goal: Min Synchronous writes• (Trend) Synchronous Page
Write Rate (data and index)♦ = (Synchronous) /
(Synchronous +Asynchronous PhysicalWrites) * 100% (database,tablespace)
• Change db cfgNUM_IOCLEANERS
Synchronous Page Write Rate (percent)
0
5
10
15
20
25
There are many screws to turn to affect Synchronous Write Time, including overall diskactivity, queuing on the device, seek time, and use of an operating system cache.The monitor elements are called Buffer Pool Data Writes, Buffer Pool AsynchronousData Writes, Buffer Pool Index Writes, Buffer Pool Asynchronous Index Writes.
Change db cfg NUM_IOCLEANERS (increase to reduce synchronous writes). Too fewpage cleaners will increase roll forward recovery time after failures (see theAdministration Guide).
At the Application level, Synchronous I/O is counted but Asynchronous I/O is notcounted because a separate task does asynchronous I/O.
Synchronous writes are done by agents using victim pages; agents flushing objects (table,index, tablespace) to disk; and agents extending tables (by creating new pages) in SMStablespaces.
Buffer size can have a much bigger impact on performance than these configurationparameters.Definitions.
Number of Asynchronous Page Cleaners (NUM_IOCLEANERS) Number ofasynchronous page cleaners for a database.

Copyright 2003 Grapevine Information Technology Pty Ltd. (# 22)
Buffer Pool Usage - Sync Rds/Wrt• goal: Minimise synchronous
read I/O time• (Trend) Average
Synchronous Read I/O Time• (Monitor) Synchronous Page
Read Rate (data and index)♦ = (Sync) / (Sync + Async
Physical Reads) * 100%(database, tablespace)
• Change db cfgNUM_IOSERVERS♦ Utilities use for async I/O
• goal: Min Synchronous writes• (Trend) Synchronous Page
Write Rate (data and index)♦ = (Synchronous) /
(Synchronous +Asynchronous PhysicalWrites) * 100% (database,tablespace)
• Change db cfgNUM_IOCLEANERS
Buffer Pool Asynchronous Data Reads (pool_async_data_reads at database and tablespace level) Numberof pages read asynchronously into the buffer pool.Buffer Pool Asynchronous Index Reads (pool_async_index_reads at database, tablespace and applicationlevel) Number of index pages read asynchronously into the buffer pool by a prefetcher.Buffer Pool Data Physical Reads (pool_data_p_reads at database, tablespace and application level)Number of read requests that required I/O to get data pages into the buffer pool.Buffer Pool Index Physical Reads (pool_index_p_reads at database, tablespace and application level)Number of physical read requests to get index pages into the buffer pool.Buffer Pool Asynchronous Data Writes (pool_async_data_writes at database, tablespace and applicationlevel) Number of times a buffer pool data page was physically written to disk by either an asynchronouspage cleaner, or a prefetcher. A prefetcher may have written dirty pages to disk to make space for the pagesbeing prefetched.Buffer Pool Asynchronous Index Writes (pool_async_index_writes at database, tablespace andapplication level) Number of times a buffer pool index page was physically written to disk by either anasynchronous page cleaner, or a prefetcher. A prefetcher may have written dirty pages to disk to makespace for the pages being prefetched.Buffer Pool Data Writes (pool_data_writes at database, tablespace and application level) Number of timesa buffer pool data page was physically written to disk.Buffer Pool Index Writes (pool_index_writes at database, tablespace and application level) Number oftimes a buffer pool index page was physically written to disk.

Copyright 2003 Grapevine Information Technology Pty Ltd. (# 23)
Buffer Pool Usage - Victim Pages• (Monitor) %Page Steal
Cleaners Triggered♦ = Buffer Pool Victim Page
Cleaners Triggered /(Victim Page + Threshold+ Log Space CleanersTriggered) (databaseelements)
• If high♦ decrease
CHNGPGS_THRESH toreduce victim pagecleaners
♦ increase size of bufferpool
Page Steal Cleaners Triggered (percent)
0
10
20
30
40
50
60
Page Steal Cleaners Triggered (Victim Page Cleaners Triggered) is the number of times apage cleaner was started because a buffer was needed to be written to disk to allow thebuffer to be used for a read (victim buffer replacement). The agent using the victim pagedoes a synchronous write, and then waits for the buffer to be filled by a read.
Change db cfg CHNGPGS_THRESH (decrease to reduce victim pages). Page Cleanerswill be started due to CHNGPGS_THRESH being reached.If CHNGPGS_THRESH is set too low, you may be writing out pages that you will dirtylater. Aggressive cleaning defeats one purpose of the buffer pool, that is to defer writingto the last possible moment.
Definitions.Buffer Pool Threshold Cleaners Triggered (pool_drty_pg_thrsh_clns at database level)The number of times a page cleaner was invoked because a buffer pool had reached thedirty page threshold criterion for the database. (CHNGPGS_THRESH configurationparameter)
Buffer Pool Victim Page Cleaners Triggered (pool_drty_pg_steal_clns at databaselevel) The number of times a page cleaner was invoked because a synchronous write wasneeded during the victim buffer replacement for the database.
Buffer Pool Log Space Cleaners Triggered (pool_lsn_gap_clns at database level)Number of times a page cleaner was invoked because the logging space used had reacheda predefined criterion for the database. (SOFTMAX configuration parameter)
Changed Pages Threshold (CHNGPGS_THRESH) The level (percentage) of changedpages at which the asynchronous page cleaners will be started, if they are not currentlyactive.
Copyright 2003 Grapevine Information Technology Pty Ltd. (# 24)
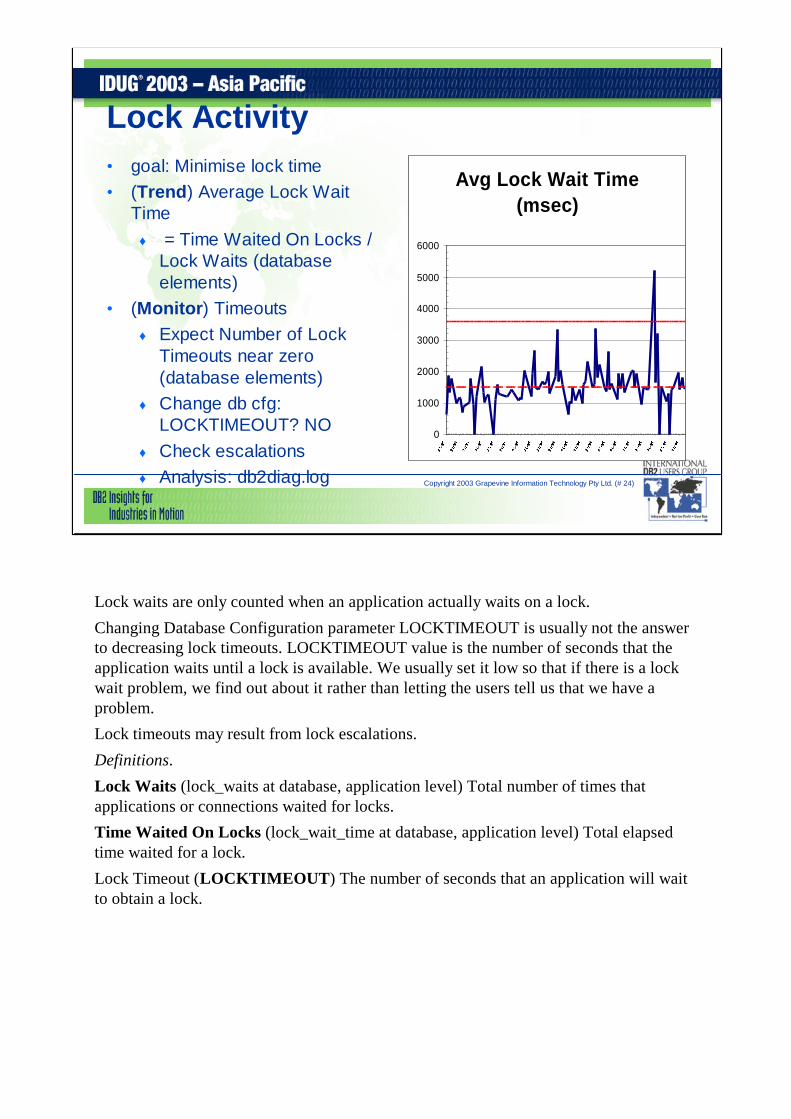
Lock Activity• goal: Minimise lock time• (Trend) Average Lock Wait
Time♦ = Time Waited On Locks /
Lock Waits (databaseelements)
• (Monitor) Timeouts♦ Expect Number of Lock
Timeouts near zero(database elements)
♦ Change db cfg:LOCKTIMEOUT? NO
♦ Check escalations♦ Analysis: db2diag.log
Avg Lock Wait Time (msec)
0
1000
2000
3000
4000
5000
6000
Lock waits are only counted when an application actually waits on a lock.
Changing Database Configuration parameter LOCKTIMEOUT is usually not the answerto decreasing lock timeouts. LOCKTIMEOUT value is the number of seconds that theapplication waits until a lock is available. We usually set it low so that if there is a lockwait problem, we find out about it rather than letting the users tell us that we have aproblem.Lock timeouts may result from lock escalations.
Definitions.
Lock Waits (lock_waits at database, application level) Total number of times thatapplications or connections waited for locks.Time Waited On Locks (lock_wait_time at database, application level) Total elapsedtime waited for a lock.
Lock Timeout (LOCKTIMEOUT) The number of seconds that an application will waitto obtain a lock.

Copyright 2003 Grapevine Information Technology Pty Ltd. (# 25)
Lock Escalations• (Monitor) lock escalation (database elements)•Expect Number of Lock Escalations near zero•Expect Exclusive Lock Escalations near zero•Change db cfg: LOCKLIST
♦ Maximum storage for Lock List♦ Increase for more memory for locks
•Change db cfg: MAXLOCKS♦ Maximum percent of Lock List before escalation for
an application♦ Increase for one application to use more locks
•Analysis: db2diag.log
Lock escalation can be caused by a LOCKLIST full condition or MAXLOCKS beingexceeded.Lock escalations reduce concurrency as the application locks more rows than it requires.Lock escalation changes row locks to table locks. Lock escalations usually increase theamount of time waited on locks by increasing the number of applications waiting onlocks, and by increasing the duration of each lock. Since lock escalation changes rowlocks to a table lock, more applications will be impacted by the escalation. This increasesthe number of lock waits. The applications may also wait longer if there is a queue ofapplications waiting on particular locks (access to a particular table).Definitions.
Number of Lock Escalations (lock_escals database, application level) Number of timesthat locks have been escalated to a table lock.
Exclusive Lock Escalations (x_lock_escals at database, application level) The numberof times that locks have been escalated to one exclusive table lock.
Maximum Storage for Lock List (LOCKLIST) The amount of storage that is allocated tothe lock list. There is one lock list per database and it contains the locks held by allapplications concurrently connected to the database.
Maximum Percent of Lock List Before Escalation (MAXLOCKS). Defines a percentageof the lock list held by an application that must be filled before the database managerperforms escalation for the locks held by that application.

Copyright 2003 Grapevine Information Technology Pty Ltd. (# 26)
Lock Activity - Deadlocks• Deadlocks. (Monitor) Use an
Event Monitor to catch themall
• (Monitor) DeadlocksDetected (database element)
• db cfg: DLCHKTIME
• Analysis: db2diag.log
• db2 create event monitormdead for deadlocks write tofile /monitor/mondead ...
• Analysis: Print daily♦ db2evmon
-path /monitor/mondead• Analysis: Event Analyzer
♦ more concise• Analysis: (v8) SQL, when
event monitor is written to atable
Details on all deadlocks that occur can be obtained by using an event monitor. DeadlocksDetected (database element) will tell you how many have occurred.Ensure DLCHKTIME < LOCKTIMEOUT to have DB2 eliminate deadlocks beforechecking for lock timeouts.
The db2diag.log also records deadlocks at certain levels of DIAGLEVEL (dbm cfg)
In v8, a default deadlock monitor is created for a new database.
Definitions.
Deadlocks Detected (deadlocks at database, application level). Total number ofdeadlocks that have occurred.
Time Interval for Checking Deadlock (DLCHKTIME) The frequency (milliseconds) atwhich the database manager checks for deadlocks among all the applications connectedto a database.
Copyright 2003 Grapevine Information Technology Pty Ltd. (# 27)
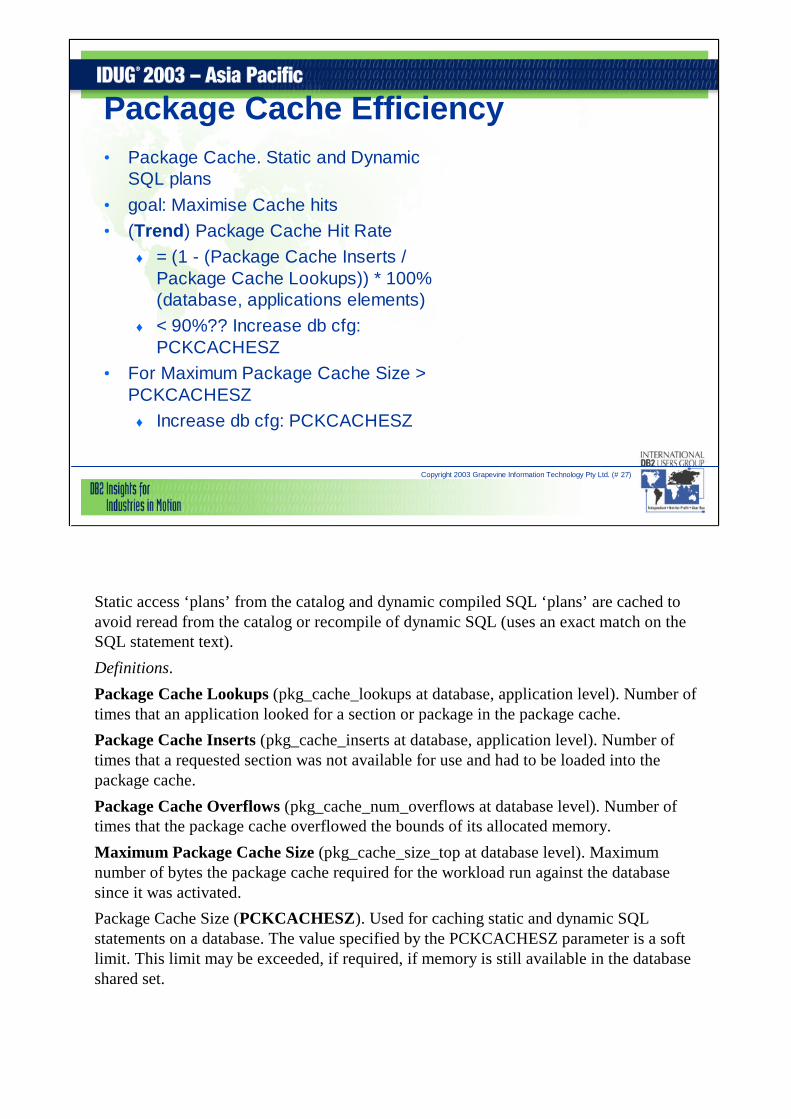
Package Cache Efficiency• Package Cache. Static and Dynamic
SQL plans• goal: Maximise Cache hits• (Trend) Package Cache Hit Rate
♦ = (1 - (Package Cache Inserts /Package Cache Lookups)) * 100%(database, applications elements)
♦ < 90%?? Increase db cfg:PCKCACHESZ
• For Maximum Package Cache Size >PCKCACHESZ♦ Increase db cfg: PCKCACHESZ
Static access ‘plans’ from the catalog and dynamic compiled SQL ‘plans’ are cached toavoid reread from the catalog or recompile of dynamic SQL (uses an exact match on theSQL statement text).
Definitions.
Package Cache Lookups (pkg_cache_lookups at database, application level). Number oftimes that an application looked for a section or package in the package cache.Package Cache Inserts (pkg_cache_inserts at database, application level). Number oftimes that a requested section was not available for use and had to be loaded into thepackage cache.
Package Cache Overflows (pkg_cache_num_overflows at database level). Number oftimes that the package cache overflowed the bounds of its allocated memory.
Maximum Package Cache Size (pkg_cache_size_top at database level). Maximumnumber of bytes the package cache required for the workload run against the databasesince it was activated.Package Cache Size (PCKCACHESZ). Used for caching static and dynamic SQLstatements on a database. The value specified by the PCKCACHESZ parameter is a softlimit. This limit may be exceeded, if required, if memory is still available in the databaseshared set.

Copyright 2003 Grapevine Information Technology Pty Ltd. (# 28)
Catalog Cache Efficiency• Catalog Cache. Information
for Optimiser• goal: Maximise Cache hits• (Trend) Catalog Cache Hit
Rate♦ = (1 - (Catalog Cache
Inserts / Catalog CacheLookups)) * 100%(database, applicationselements)
• < 95%. Increase CatalogCache Size
Catalog Cache Hit Rate
0
20
40
60
80
100
120
Catalog data (compact table descriptors) for the database is cached so that compilingdynamic SQL (and binds) does not cause reads of the database catalog.Monitor Guide suggests: Catalog Cache Hit Ratio = (1 - (Catalog Cache Inserts / CatalogCache Lookups)) which gives a range of (0.0 - 1.0). We use Catalog Cache Hit Rate,which multiplies result by 100% so the range is (0-100%).
For Catalog Cache Hit Rate of < 100%, we expect to see activity on Catalog tables.Since data in the Catalog tables about tables, views and aliases is included in the tabledescriptors, anything that increases the amount of data the optimiser uses in compilingSQL will probably increase the size of the table descriptors. Using a high value forNUMFREQVALUES and the with distribution option on Runstats, we have seen asignificant drop in the Catalog Cache Hit Rate.
Definitions.
Catalog Cache Lookups (cat_cache_lookups at database, application level). Accesses tothe catalog cache. The catalog cache is referenced whenever a table, view, or alias nameis processed during the compilation of an SQL statement.
Catalog Cache Inserts (cat_cache_inserts at database, application level). Number oftimes that table descriptor information was not found in the cache, and so was inserted.
Catalog Cache Size (CATALOGCACHE_SZ) The maximum amount of space that thecatalog cache can use from the database heap (DBHEAP).

Copyright 2003 Grapevine Information Technology Pty Ltd. (# 29)
Catalog Cache Overflows• Choice 1: Get working set in
(cache) memory• (Monitor) Catalog Cache
Overflows♦ (database, application
elements)♦ Increase db cfg:
CATALOGCACHE_SZ forOverflows > ~0
Catalog Cache Overflow (millions)
0
0.1
0.2
0.3
0.4
0.5
0.6
0.7
0.8
Catalog Cache overflows when an insert of descriptor information fails. Usually thismeans the Catalog Cache is too small. Entries in the Catalog Cache are not eligible to beoverlaid until the transactions using it are completed (commit or rollback).
Definitions.
Catalog Cache Overflows (cat_cache_overflows at database, application level). Numberof times that an insert into the catalog cache failed due the catalog cache being full.Cache entries will not be eligible to be removed from the cache until that transaction haseither been committed or rolled back.
Copyright 2003 Grapevine Information Technology Pty Ltd. (# 30)
Catalog Cache Heap Full• Choice 1: Get working set in
(cache) memory• (Monitor) Catalog Cache
Heap Full♦ (database, application
elements)• For Catalog Cache Heap Full
> 0♦ Reduce db cfg:
CATALOGCACHE_SZ♦ Increase db cfg: DBHEAP
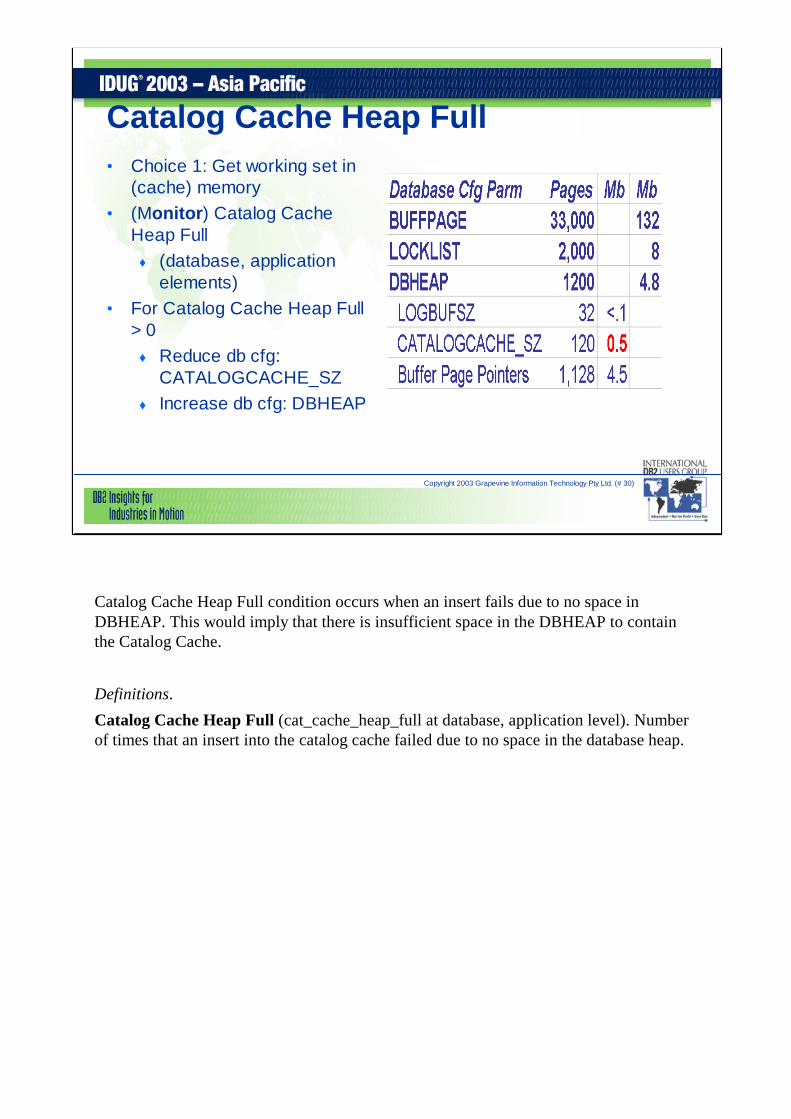
Catalog Cache Heap Full condition occurs when an insert fails due to no space inDBHEAP. This would imply that there is insufficient space in the DBHEAP to containthe Catalog Cache.
Definitions.
Catalog Cache Heap Full (cat_cache_heap_full at database, application level). Numberof times that an insert into the catalog cache failed due to no space in the database heap.

Copyright 2003 Grapevine Information Technology Pty Ltd. (# 31)
Show Stoppers - Connections• goal: Don't Stop• (Trend) Maximum Number of
Concurrent Connections(database element)♦ Change dbm cfg
MAXAPPLS
Connections Top
0
200
400
600
800
1000
1200
1400
1600
1800
If the Maximum Number of Concurrent Connections is equal to MAXAPPLS,connections have probably been refused, returning a negative SQLCODE to theapplication.
MAXAPPLS includes all connected applications. Additional slots are used forconnections during a 2 phase commit (or rollback), in doubt transactions, by DataLinksmanager and in a partitioned database environment.If MAXAPPLS is much larger than Maximum Number of Concurrent Connections,ensure that there are sufficient resources if many more applications connect.
Definitions.Maximum Number of Concurrent Connections (connections_top at database level)Highest number of simultaneous connections to the database since the database wasactivated.
Maximum Number of Active Applications (MAXAPPLS) Maximum number ofconcurrent applications that can be connected (both local and remote) to a database.

Copyright 2003 Grapevine Information Technology Pty Ltd. (# 32)
Show Stoppers - Agents• goal: Don't Stop• (Trend) Maximum Agents
Registered (db2 snapshot)♦ Change dbm cfg
MAXAGENTS• (Monitor) Maximum Agent
Overflows (db snapshot)♦ Increase dbm cfg
MAXAGENTS for > 0♦ Change dbm cfg
INTRA_PARALLEL to NO♦ Decrease workload at this
node
Maximum Number of Agents Registered
0
200
400
600
800
1000
1200
1400
1600
1800
If Maximum Agents Registered reaches MAXAGENTS, no more agents are available forapplication requests. Maximum Agent Overflows records the number of times this occursat the database level.
Definitions.
Maximum Agent Overflows (max_agent_overflows at database level) Number of timesa request to create a new agent was received when the maxagents configurationparameter had already been reached.
Maximum Number of Agents Registered (agents_registered_top at db2 level).Maximum number of agents that the database manager has ever registered, at the sametime, since it was started (coordinator agents and subagents).Maximum Number of Agents (MAXAGENTS) The maximum number of databasemanager agents, whether coordinating agents or subagents, available at any given time toaccept application requests.
Enable Intra-Partition Parallelism (INTRA_PARALLEL) Specifies whether thedatabase manager can use intra-partition parallelism.
Default Degree (DFT_DEGREE) The default value for the CURRENT DEGREE specialregister and the DEGREE bind option. A value of 1 means no intra-partition parallelism.A value of -1 means the optimiser determines the degree of intra-partition parallelismbased on the number of processors and the type of query.

Copyright 2003 Grapevine Information Technology Pty Ltd. (# 33)
Show Stoppers - Agents• (Trend) Maximum Number of
Coordinating Agents (db2 anddatabase snapshot)♦ Change dbm cfg
MAX_COORDAGENTS• (Monitor) Agents Waiting for
a Token (db2 snapshot)♦ Increase dbm cfg
MAXCAGENTS for > 0
Maximum Number of Coordinating Agents
0
200
400
600
800
1000
1200
1400
1600
1800
If the number of Coordinating Agents is approaching MAX_COORDAGENTS, increasethe dbm cfg value for MAX_COORDAGENTS. This enables more applications toconnect to a database.
If this would place too high a load on the machine, you could use MAXCAGENTS tolimit resource allocation to the number of agents specified. This means Agents Waitingfor a Token > 0, and so agents will wait. This solution is not without it's own problems.Definitions.
Maximum Number of Coordinating Agents (coord_agents_top at db2 and databasesnapshot level) Maximum number of coordinating agents working at one time.
Agents Waiting for a Token (agents_waiting_on_token at db2 snapshot level) Numberof agents waiting for a token so they can execute a << transaction >> in the databasemanager.
Maximum Number of Concurrent Agents (MAXCAGENTS) The maximum number ofdatabase manager coordinator agents that can be concurrently executing a databasemanager transaction.
Maximum Number of Coordinating Agents (MAX_COORDAGENTS) The maximumnumber of coordinating agents that can exist at one time on a server in a partitioned ornon-partitioned database environment. One coordinating agent is acquired for each localor remote application that connects to a database or attaches to an instance.

Copyright 2003 Grapevine Information Technology Pty Ltd. (# 34)
Agent Pool• (Monitor) %Agents Created =
Agents Created Due to EmptyAgent Pool / Agents AssignedFrom Pool * 100% (db2snapshot elements)♦ Change dbm cfg
NUM_POOLAGENTS(increase for high;decrease for low)
%Agents Created
0
10
20
30
40
50
60
70
80
%Agents Created = Agents Created Due to Empty Agent Pool / Agents Assigned FromPool * 100%If %Agents Created is high, it may indicate that the NUM_POOLAGENTS configurationparameter should be increased. If %Agents Created is low, num_poolagents may be settoo high, and some of the agents in the pool are rarely used and are wasting systemresources.
Definitions.
Agents Created Due to Empty Agent Pool (agents_created_empty_pool at db2 snapshotlevel) Number of agents created because the agent pool was empty.Agents Assigned From Pool (agents_from_pool at db2 snapshot level) Number of agentsassigned from the agent pool.
Agent Pool Size (NUM_POOLAGENTS) If more agents are created than is indicated bythe value of this parameter, they will be terminated when they finish executing theircurrent request, rather than be returned to the pool. The agent pool contains subagentsand idle agents. Idle agents can be used as parallel subagents or as coordinating agents.

Copyright 2003 Grapevine Information Technology Pty Ltd. (# 35)
Out of the Box Changes - dbm cfg•update dbm cfg using PARM = value•CATALOG_NOAUTH = NO (set to YES for Client) (V7
default is YES for all)•SYSADM_GROUP = (NT. set to group for instance***)
♦ update admin cfg using SYSADM_GROUP = (NT.set to group for instance***)
•DFTDBPATH = change it (Unix)•DFT_MON_BUFPOOL, DFT_MON_LOCK,
DFT_MON_SORT, DFT_MON_STMT,DFT_MON_TABLE, DFT_MON_UOW♦ DFT_MON_… = OFF (set to ON)
(***) For NT, set to a local group. Add the install userid to this group. Add the domainuserid for the DBA to this group (see NT security on a slide below).For NT, we like to put the admin instance and the db2 instances in the same group.
(***) For Unix, the install process sets this to the group of the instance owner, and, foreach instance, adds the admin group as a secondary group.
CATALOG_NOAUTH allows cataloguing of databases and nodes without SYSADM orSYSCTRL authority. Unfortunately the update CLI command still requires SYSADM.
SYSADM_GROUP is the SYSADM group name
DFTDBPATH is the Default database path. It is used as the default for CATSPACE,TEMPSPACE1 and USERSPACE1 tablespaces. The default on Unix is in the instanceowner home directory. This is seldom a good choice. The default on NT is the drive onwhich the DB2 software is installed. We like to set it to the drive used for data.
DFT_MON_LOCK, DFT_MON_SORT and DFT_MON_UOW are the default monitorsettings for Lock, Sort and Unit of work.
Copyright 2003 Grapevine Information Technology Pty Ltd. (# 36)
Out of the Box Changes - db cfg•update database cfg using PARM = value•LOCKTIMEOUT = -1 (set to 15)•LOGSECOND = 2 (set to 125)•NEWLOGPATH = (Path to log files)
LOCKTIMEOUT is Lock timeout (sec). The default of no lock timeout means user canwait ... forever.LOGSECOND is Number of secondary log files. Maximum for a single unit of work. Ok,it should be big enough, but:
-import a table of ? Mbytes will do it (<< is import as smart as load to avoid this bycommitting at log full and continuing?>>) -initial load -may be select into table ... (select from ...)
-just set it high and the database does not stop just because someone has done a longupdate transaction.
NEWLOGPATH is Changed path to log files. Default is database/sqlogdir/. Change itunless you really want the log files going to the same place as the tables.

Copyright 2003 Grapevine Information Technology Pty Ltd. (# 37)
Out of the Box Changes - Registry•db2set -g PARM=value (to change settings)•DB2_RR_TO_RS=ON•DB2SYSTEM=real node name (Unix MPP)•DB2NTNOCACHE=YES (NT only)•For RAID-5 (single disk array)
♦ DB2_PARALLEL_IO=* or list of tablespaces♦ DB2_STRIPED_CONTAINERS=on
•db2set -all (display installed settings)•db2set -lr (display available settings)
In version 7 Administration Guide, see Appendix D. DB2 Registry and EnvironmentVariables.The change of DB2_RR_TO_RS is reduce next key locks. This can be used if you haveno applications using Repeatable Read isolation. The manual says the option is YES, butON works.
The change of DB2SYSTEM is for the Control Centre, not monitoring. For MPP systemslike RS6000 High node, the default tcpip node name is the internal switch rather than theIP address used by the applications..
For the change to DB2NTNOCACHE, we expect less use of the NT file cache fordatabase table data, and thus improved system performance.For the RAID-5 changes, we expect better I/O throughput.

Copyright 2003 Grapevine Information Technology Pty Ltd. (# 38)
Out of the Box Chgs-NT Admin Sec.•DB2 servers on NT•Add NT local group, say db2adm
♦ Add db2 installer, say db2admin, as local user♦ Add dba, probably a domain user or global group
•update dbm cfg using SYSADM db2adm•update admin cfg using SYSADM db2adm•db2set -g DB2_GRP_LOOKUP=LOCAL
•dba on workstations can use Control Center

Copyright 2003 Grapevine Information Technology Pty Ltd. (# 39)
Out of the Box Chgs - DB2 Client•db2cli.ini
♦ CLI/ODBC Settings tab♦ or update cli cfg for section database using ...
• locking (use ur - uncommitted read as a default)♦ update cli ... using TXNISOLATION 1
•sqllib\db2cli.opt for settings for Lotus Approach, MSAccess and MS Visual Basic
•Leave autocommit on
Also, can rebind utilities (using UR) but this is not recommended unless you have aproblem.
sqllib\db2cli.opt contents.
[Lotus Approach]
LONGDATACOMPAT=1
LOBMAXCOLUMNSIZE=33554431[Microsoft Access]
LONGDATACOMPAT=1
LOBMAXCOLUMNSIZE=1048575
PATCH1=131072
[Microsoft Visual Basic]LONGDATACOMPAT=1
LOBMAXCOLUMNSIZE=1048575
PATCH1=1024
PATCH2=6
Leave autocommit on to avoid Catalog locks for the DBA

Copyright 2003 Grapevine Information Technology Pty Ltd. (# 40)
Turning the Screws on DB2Session: C2
Bruce [email protected]
Grapevine Information Technologywww.grapevineit.com.au