turning up the heat - standard chartered · wealth management advisory 1 turning up the heat 2018...
TRANSCRIPT

Wealth Management Advisory
1
Turning up
the heat
2018 Outlook

2 / Outlook 2018
Table of contents
1
2
3
STRATEGY 12 Turning up the heat
14 Investment implications and
key themes
WELCOME 05 Welcome to 2018 outlook
06 Our diversity-driven, adaptive
approach to investment
decisions
MACRO OVERVIEW 16 Macro overview – At a glance
17 A subtle shift towards reflation

Outlook 2018 / 3
4
5
ASSET CLASSES 29 FX
37 Commodities
6 IMPORTANT INFORMATION 49 Disclaimer
APPENDIX 45 2018 key events
46 Meet the team
47 Contact Information
48 Investment view generation –
Our adaptive process
Published on December 2017.

4 / Outlook 2018

Outlook 2018 / 5
Welcome to 2018 Outlook
2017 surprised on the upside and was a great year for investors.
Global equities rallied over 20%, while commodities, bonds and
alternative strategies also generated positive returns.
Our recommended gradual pivot towards more growth areas
of the equity market – away from high dividend yielding
equities and corporate bonds – paid off. As an example, our
Asia-focused tactical asset allocation model for a moderate
risk investor rose 14.2% since our Outlook 2017 publication,
significantly outperforming its strategic benchmark.
Meanwhile, our preferred multi-asset income allocation still
rose a very healthy 11.4% over the same period. Of course,
not all our views worked as we expected, but even where our
relative preferences did not play out, they generally delivered
positive returns for investors.
So, what about the outlook for 2018? Investors are
understandably concerned about high valuations in both
equity and bond markets, including corporate bonds.
In the Goldilocks (“not too hot, not too cold”) economic
environment we have been experiencing, where global
growth has become more synchronised, inflation pressures
are still muted and central banks have remained
accommodative, one can find solid arguments to justify the
high levels of valuation. However, we are cognisant that such
an environment cannot go on forever.
In 2017, we predicted a pivot to a more reflationary outcome
combining stronger economic growth with rising inflation.
Growth accelerated in 2017, but inflation did not. We believe
this process is still under way and that a gradual ‘heating up’
of the global economy is likely in 2018.
Global growth is expected to remain relatively strong,
weakening somewhat in China, but accelerating in the US
and in Emerging Markets excluding China. Meanwhile, rising
commodity prices and declining slack in the global economy,
whether it be in labour markets or product markets, are likely
to be tailwinds for inflation.
Rising inflation is likely to put upward pressure on interest
rates and bond yields. Our core scenario is this happens
gradually, but even then, it will be increasingly difficult for
investors relying predominantly on bonds to generate the
level of total returns witnessed in the recent past, even on a
leveraged basis, as rising yields will lead to lower prices.
Against this backdrop of waning support for income assets,
we have two overarching suggestions for investors. First, we
believe investors should continue pivoting towards pro-
growth areas of the markets as we recommended in 2017.
Despite elevated valuations, we believe equity markets will
continue to do well. Still-strong growth and relatively modest
increase in inflation are likely to support global corporate
earnings growth of 10% in 2018.
Second, as we move even more clearly into the late stage of
the global economic cycle, we believe it is time to start
thinking about protecting against sharp drawdowns once the
cycle turns. Our central scenario is that a recession is
unlikely in 2018 given significant excess capacity in many
major economies (eg. southern Europe, China, India, Brazil
and Russia) and very well-anchored inflation expectations
after years of low inflation. However, we are also cognisant
that predicting recessions is incredibly difficult and, by the
time a recession becomes apparent, the damage to
investment portfolios is already severe.
Against this backdrop, in addition to pivoting to pro-growth
assets, we would consider increasing, as the year
progresses, our allocation to less volatile, less correlated and
relative investment strategies. In particular, a diversified
allocation to alternative strategies can help improve the risk-
reward profile of investment allocations over the long run and
can be particularly valuable in times of stress. For now, given
our constructive view on global equities, we would continue
to have a tilt to Equity Hedge strategies, but this should not
be at the expense of a more diversified approach, including
Global Macro strategies, which can offer insurance-like
characteristics in times of severe risk-off environments.
Alexis Calla
Global Head Investment Advisory and Strategy &
Chief Investment Officer

6 / Outlook 2018
Our diversity-driven, adaptive approach to investment decisions
Alexis Calla
When meeting our clients, we are often
asked how we come up with our
investment views and what makes us
different. We thought this annual Outlook
publication was a good opportunity to
share our approach to investment
decision-making with a wider audience.
Our current process originated in 2011,
when we started researching the
theoretical challenges and behavioural
biases both individuals and committees
face when making decisions in an
environment of significant complexity
and uncertainty. This included extensive
research of academic behavioural
finance literature, but also included non-
finance areas such as decision-making
cognitive psychology, the intelligence
field and studies into how superior
forecasters operate.
Of course, theory is fine in theory, but
the key was to turn these insights into
practical processes which lead to
superior outcomes.
Here are some of the concepts that over
the years have become absolutely key to
our decision-making process. On the
following two pages, we discuss some of
our core beliefs that differentiate us from
most other investment advisory firms.
There is a plethora of data, views, research, analysis, and
information that we have access to. We scout and scour an
immense amount of material constantly to identify different
ways of looking at the key questions faced by our clients
and uncover valuable insights. This 'open source' approach
means we are agnostic as to the source of insight
(academia, institutional research, independent research,
fund manager views, magazines and newspapers). All we
care about is whether its helps to enrich the investment
committee’s discussions.
We actively seek various sources of diversity, but require
that all our investment committee members understand
that nobody (including themselves) knows with certainty
what is going to happen in the future, are always trying to
learn and are open to different perspectives and sources
of input. This sounds obvious, but it is not actually a
natural characteristic within the research/analyst universe
where it is taught very early that having high conviction in
your views is a positive attribute.
Building on the unique footprint of Standard Chartered Bank, we
have deliberately formed an investment committee that is very
diverse in terms of expertise, geographic experience and, more
importantly, ways of thinking, as well as legacy diversity such as
gender, race and nationality. This helps to ensure the
discussions uncover many different perspectives.
Human Diversity
Open Source
Open Mindedness

Outlook 2018 / 7
This is a key distinction to make. The Outside View can be thought of as a helicopter view that helps provide a
probabilistic perspective on different outcomes based on past or related information from a class of events
similar to the one being analysed. This often involves a quantitative approach. For example, one of the Outside
Views generated for this publication was looking at the historical probability distribution for equity returns taking
into account valuations similar to current levels. We are constantly scouring research for potential areas where
we can refine the Outside View. Of course, the Outside View is only a starting point. The Inside View, which is
like the view from the ground and is often more qualitative in nature, then tries to understand what are the
current or unique factors that might skew the likelihood of an event or outcome one way or another.
Outside View vs Inside View
This is the core of our investment process. It drives our Inside View.
We actively seek and discuss different views in order to understand
different perspectives and arguments. This not only makes sure that
we consider alternative views to our own individual and collective
view, but also encourages us to keep an eye on arguments that we
initially disagree with.
Dialectic Debate
In the investment committee, hierarchy does not matter. What is
important is how each member contributes their knowledge,
diversity and perspectives to the process, irrespective of seniority.
Importantly, each member’s vote is cast anonymously the day after
the committee concludes, to allow individuals to make up their own
mind without external interference and to give members time to
reflect on the information presented and debated.
No Hierarchy, Full Anonymity
The above process is all about uncovering very diverse sources of information
and analytical frameworks, but is not about producing a consensus. It helps
feed everybody’s analytical framework with the information they require to come
up with a view. This helps reduce both the individual error while also reducing
the collective error through embracing diversity of input, debate and cognitive
frameworks. This also helps ensure that we can adapt quickly and methodically
to changing market conditions and drivers.
Not Seeking Consensus

8 / Outlook 2018
Our core investment beliefs
Alexis Calla
1 Santa Fe Institute
2 “Cognitive biases are tendencies to think in certain ways that can lead to systematic deviations from a standard of rationality or good judgment, and are often
studied in psychology and behavioural economics,” Wikipedia.
We believe markets are a complex ecosystem that cannot be entirely modelled as
relationships are not always stable and linear. In an ecosystem, “complexity arises as
many agents interact and adapt to one another and their environments. These interactions
and adaptations result in evolutionary processes and often surprising ‘emergent’
behaviours at the macro level.”1 This presents opportunities for investors who can adapt
to the current and future market conditions, rather than relying solely on quantitative
models or on the opinions of overly specialised individual experts. This is not to say that
quantitative models cannot add value. However, we believe we need to keep an eye out
for potential changes in well-established relationships.
Adaptive markets require an adaptive process
This is probably one of the more controversial beliefs. We have been brought up to believe
that if you have a problem to solve you should seek expert advice. If your chest hurts, you
see a doctor (preferably quickly). If your car breaks down, you consult a mechanic.
Assuming you can trust them to give you an unbiased opinion, this is rational.
However, as the complexity and uncertainty surrounding a problem we are trying to solve
increases, evidence suggests the value of an individual expert diminishes. There are
several reasons for this, but a key one is the ability to digest the copious amount of
information in a way that is as free from cognitive biases2.
A growing number of recent academic studies have highlighted that a diverse set of
individuals is likely to think about the problem in different ways, seek out different types of
information and reduce the risk of collective error. Our investment process aims to reduce
both individual errors as well as the collective error by maximising diversity.
Collective diversity more important than individual expertise

Outlook 2018 / 9
Collective error =
individual error – prediction diversity
In the Information Age, a key challenge is how to manage the volume of information that is available.
Just to try to put this in context, every day we put together a summary of research that our team
members found interesting. In October alone, these summaries totalled over 500 pages. While not all
these reports are widely available to individual investors, investment practitioners generally have
access to a lot of this material. In themselves, they are unlikely to be a source of competitive
advantage. We believe the true potential source of differentiation is how to incorporate available
information into the decision-making process.
Decision making more important than information gathering
How do we try to reduce ‘individual errors’? One of the key biases when it comes to individual
decision-making is confirmation bias. We all have views on different topics, either consciously
or sub-consciously. Meanwhile, we tend to place excessive weight on information that
reaffirms these views.
To address these biases, we run a thorough “dialectic” debate of the pros and cons so that
everyone in our committee is forced to consider an alternative outcome to their current outlook.
This is achieved by actively seeking the rationale for views on both sides of any question we
are asking ourselves.
Diversity of perspectives key
Our decision making process is also aimed at addressing Committee biases, which
can be dominated by the most senior or last or most vocal speaker in the room.
To address these biases, our Investment Committee members vote anonymously the
day after the discussions take place to give them time to process the huge volume of
information they have digested and to limit the influence of any individual. Meanwhile,
our process is aimed at ensuring diversity of input so members are not unaware of the
opposite point of view and can incorporate it into their decision-making process.
Debiasing critical to success

STRATEGY


12 / Outlook 2018
Turning up the heat
Steve Brice | Manpreet Gill
2017 proved to be a very positive year for financial markets
against a Goldilocks (ie. not too hot, not too cold) economic
backdrop. The strong performance of equities and corporate
bonds was led by earnings growth across major regions,
range-bound government bond yields and rising valuations.
The fact that inflation in the US and Euro area has remained
contained meant that worries over excessive monetary policy
tightening and a turn in direction towards unwinding
monetary stimulus failed to derail markets. Emerging Market
assets fared very well amid this environment of optimism,
especially as the US Dollar softened.
Recent strong economic data suggests this “Goldilocks”
environment can spill over at least into the start of 2018.
Having said that, we are cognizant that Goldilocks
environments cannot carry on forever. Our Group Investment
Committee continues to be of the view that we are at a fairly
late stage in the business cycle, with the US further along
than the Euro area or Asia ex-Japan. The historical
perspective that equities tend to see some of the strongest
gains in the final stages of the business cycle is one key
factor behind our preference for equity markets. This largely
holds true for other pro-cyclical assets like corporate bonds
as well.
However, it is extremely difficult to time the end of the cycle.
The fact that US equities and high yield bond markets have
historically peaked six to nine months ahead of a US
recession makes the investment decision even harder.
Therefore, we believe there is value in starting the year
continuing to favour equities, while also starting to think
about managing downside risks by allocating to alternative
strategies which have lower drawdown risks and correlations
with traditional asset classes.
• Economic growth continues to simmer: The “Goldilocks” environment (ie. not too
hot, not too cold) of strong growth and limited inflation is likely to extend into the
early part of 2018. Continued earnings growth means equities and corporate bonds
have room to extend gains going into 2018, in our view.
• Turning up the heat on inflation: Inflation is the main risk to this “Goldilocks”
scenario, especially further into 2018. A larger-than-expected rise in inflation would
mean the environment could turn too hot, forcing central banks to slam on the
brakes.
• Investment implications: Our view is that we are at a mature stage in the US
business cycle. Equities tend to do very well late in the cycle, a trend which is behind
our preference for equities. Our view that the US Dollar will weaken modestly
supports our preference for bonds in Emerging Markets – specifically USD sovereign
and Asia corporate bonds. However, we believe there is value in staying nimble as
we go through 2018. An allocation towards Alternative Strategies is likely to help
maintain exposure to our preferred asset classes while starting to contain potential
downside risks, in our view.
Outlook 2018 / 13
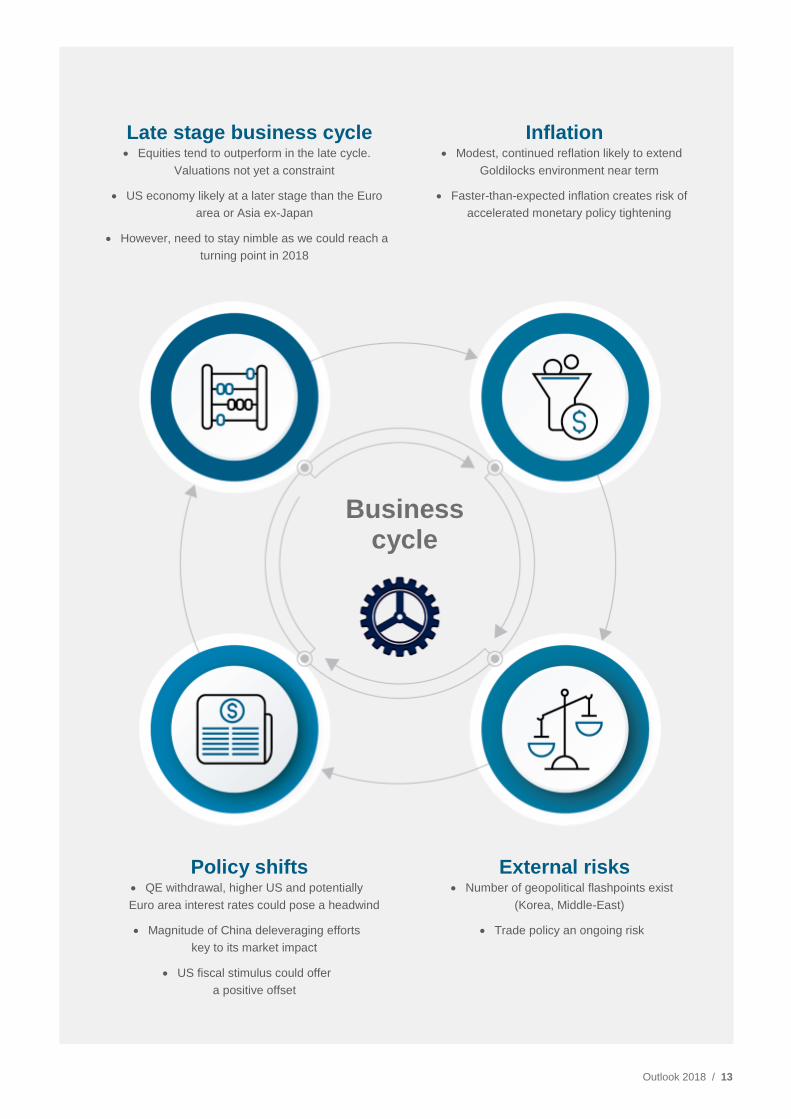
Late stage business cycle
• Equities tend to outperform in the late cycle.
Valuations not yet a constraint
• US economy likely at a later stage than the Euro
area or Asia ex-Japan
• However, need to stay nimble as we could reach a
turning point in 2018
Inflation • Modest, continued reflation likely to extend
Goldilocks environment near term
• Faster-than-expected inflation creates risk of
accelerated monetary policy tightening
Policy shifts
• QE withdrawal, higher US and potentially
Euro area interest rates could pose a headwind
• Magnitude of China deleveraging efforts
key to its market impact
• US fiscal stimulus could offer
a positive offset
External risks • Number of geopolitical flashpoints exist
(Korea, Middle-East)
• Trade policy an ongoing risk
Business cycle

Outlook 2018 / 14
Investment implications and key themes
CURRENCIES
Modest USD weakness to drive FX markets
Key themes
• US Dollar to weaken modestly
• EM currencies to gain against the USD
• EUR, KRW to strengthen against the USD
• JPY to weaken against the USD
We believe the USD is likely to continue to weaken modestly in 2018, short-term reversals
notwithstanding. A greater room for monetary policy surprises in Europe is largely responsible for
this view given further Fed rate hikes are unlikely to dramatically surprise the market, while the
start of European Central Bank (ECB) rate hikes would likely be a surprise.
The context of this US Dollar view means that we expect the EUR to extend gains, especially if
the ECB remains on the path of gradually removing monetary policy accommodation. The JPY,
though, is unlikely to benefit from this support given what appears to be a continued lack of
domestic inflation.
A softer US Dollar is also likely to be beneficial for the broad Emerging Market currency
universe. Within this, though, we believe the KRW is likely to be one of the biggest beneficiaries
as the Korean economy benefits from continued improvement in US growth via exports.

MACRO OVERVIEW

Outlook 2018 / 16
Macro overview at a glance
Rajat Bhattacharya
Key
themes
Global growth is expected to accelerate in 2018 for the second straight year, led by the US and Latin
America, while China, Japan and the Euro area stabilise after a strong pick-up in 2017. We expect the
ongoing synchronised economic expansion across regions to continue, on the back of still-easy financial
conditions and robust consumer and business confidence.
We expect a modest upturn in core inflation worldwide, especially in the US, as tightening labour markets
fuel wage pressures and spare productive capacity narrows.
Monetary policy outlook is turning less accommodative. We expect the Fed and some Asian central banks
to raise rates at a gradual pace over the coming year. However, inflation-adjusted policy rates are likely to
remain negative in major economies, including the Euro area and Japan.
The key risk scenarios, we believe, are two-fold: 1. Inflationary downside, or a sharp upturn in inflation,
eventually leading to tighter monetary policies and a growth downturn (15% probability). 2. Return to
deflation, likely caused by a hard-landing in China or a too-early/too-fast pace of Fed rate hikes (10%
probability).
Key
chart
Figure 1
Monetary policy is likely to tighten gradually worldwide; this is likely to be offset by less stringent fiscal policies
Source: Bloomberg, Fitch Ratings, Standard Chartered
Key
drivers
Region Growth Inflation Benchmark
Rates
Fiscal
Deficit
Comments
US
Growth to accelerate for second year. Fed to stick to gradual rate hikes under Powell amid muted inflation. Risk of overheating from tax cut
Euro Area
Synchronised expansion to continue. Inflation to remain tepid amid slack in southern Europe. ECB to withdraw stimulus, but rate hikes unlikely
UK
Brexit uncertainty remains key risk. Purchasing power further hit by rising inflation, slowing wages. BoE likely guided by Brexit talk outcome
Japan
Abe’s re-election positive for stimulus, growth. BoJ to maintain easy monetary policy as inflation remains well below target, despite recent uptick
Asia ex-Japan
President Xi to focus on quality of growth, while ensuring financial stability. India’s growth to recover. South Korea expected to hike rates
Emerging Markets exAsia
Brazil and Russia rate cutting cycle coming to a close as inflation rebounds. Mexico to cut rates
Source: Standard Chartered Global Investment Committee
Legend: Supportive of risk assets | Neutral | Not supportive of risk assets

17 / Outlook 2018
A subtle shift towards reflation
A year ago, we noted subtle shifts in
the world economy which promised to
lift growth and inflation gradually above
the lacklustre levels seen since the
Global Financial Crisis. We expect the
process to continue in 2018.
Core scenarios (75% probability)
While world economic activity has indeed picked up almost in
sync across most regions, making 2017 the strongest year
for global growth since 2014, inflation has largely remained
subdued. The continued lack of widespread inflationary
pressures leaves our Global Investment Committee split
between envisioning ‘muddle-through’ (mediocre growth,
low inflation) and ‘reflation’ (accelerating growth, rising
inflation) as the dominant theme for the global economy in
2018. We assign a combined 75% probability to the two
scenarios unfolding over the coming year, with a GROWING
bias towards ‘reflation’ (40% vs 35% a year ago and 15% in
early 2016).
So, what would move the needle towards an outright
reflationary environment? For one, the US would need to see
a modest pick-up in inflation in 2018, while sustaining this
year’s above-trend growth. This is possible, especially if the
proposed tax cuts fuel consumer demand and business
spending at a time when the economy is arguably running
above its potential and is at the late stage of its expansion
cycle. For now, we expect any such fiscal stimulus to be
modest. Such a controlled-reflationary environment is likely
to allow the Federal Reserve (Fed) to raise interest rates
gradually (two-to-three times) over the course of 2018.
The other route to global reflation could be a pick-up in
inflation in the Euro area and Japan due to the whittling away
of excess productive capacity and tightening labour markets.
This is possible, especially if the two regions continue to
grow above their potential for a second straight year, aided
by extremely accommodative monetary policies, less
restrictive fiscal policies and still-robust outlook for global
trade (albeit growing at a slower pace than in 2017). A global
economy increasingly powered by the Euro area would make
the ongoing global expansion more sustainable given that
the region is in an earlier stage of its business cycle
compared with the US or China.
While we expect the Euro area to continue growing above
potential for a second year, we see inflation pressures rising
only modestly, given the still-substantial under-employment
across southern European economies such as Italy, Spain
and Portugal.
Meanwhile, in Japan, although excess productive capacities
have disappeared and labour markets are tight, structural
issues, such as aging demographics as well as the controlled
process of wage negotiations in the manufacturing sector,
are likely to keep wage growth subdued.
In many ways, China holds the key to whether the world
economy decisively shifts from years of muddle-through to a
reflationary regime, or falls back towards deflation. China,
and more broadly Asia, has been a key driver of global
growth since the Global Financial Crisis. China’s credit-
fuelled, investment-led growth helped offset the substantial
slack in the developed economies after the crisis, keeping
global growth humming along, albeit at a slower pace than

Outlook 2018 / 18
before the financial crisis. However, this growth model has
resulted in a surge in China’s corporate sector leverage,
which is clearly unsustainable. With growth in the rest of the
world picking up, there is a window for China to once again
focus on rebalancing its economy from investment towards
domestic consumption. We believe President Xi Jinping’s
consolidation of power at the recent Chinese Communist
Party Congress will provide his administration the necessary
political influence to renew its efforts to deleverage the
economy.
We, however, expect this process to be gradual and well-
controlled, with China’s economic growth settling in the 6.0-
6.5% range over the next two years, from 6.5-7.0% range
over the past couple of years. This cautiously constructive
outlook for China, which should also be moderately positive
for Asia, commodity prices, as well as the major commodity-
producing Emerging Markets such as Brazil and Russia,
informs our view that the world economy will continue to
slowly pivot towards reflation.
Inflationary downside risk (15% probability)
However, there is an outside risk that US income tax cuts
stoke consumption and wage pressures to such an extent
that the Fed needs to raise interest rates at a much faster
pace than currently forecast. This would eventually cause a
sharp slowdown in the US economy, with the inevitable
impact on the rest of the world.
The other source of inflationary risk could be a flare-up in
geopolitical tensions, whether around North Korea or South
China Sea, leading to a trade war between the US and
China. Such an outcome would disrupt global supply chains,
causing shortages in some markets (especially in the US)
and excess productive capacities in others (especially in
Asia). For now, we assign a low (15%) probability for this
extreme risk scenario.
Deflationary downside risk (10% probability)
The other downside risk to our constructive scenario is a
sharp slowdown in growth in China, in the event it struggles
to manage a gradual economic deceleration. Such an
outcome would be deflationary for the world. The other likely
sources of deflationary risks would be a policy mistake by the
Fed or the ECB in the event they raise rates too quickly,
causing a downturn in their economies. Alternatively, a
political crisis in Italy, Spain, the UK or Germany, which
renews concerns about the stability of the Euro area, could
revive deflationary pressures. For now, we assign a low
(10%) probability to this extreme outcome.
Figure 2
The world’s major economies are transitioning between Muddle-through and Reflation scenarios, with China and US in an advanced
stage of their business cycles
The percentages refer to Global Investment Committee’s assigned probability on each of the scenarios for the global economy in 2018
Source: Standard Chartered Global Investment Committee
10% 35% 40% 15%
• Slower growth
• Lower inflation
• Tighter fiscal policies
• Eventually leads to
easier monetary
policies
Deflationary
Downside Muddle-through Reflation
Inflationary
Downside
• Mediocre growth
• Low inflation
• Accommodative
monetary policies
• Neutral fiscal policies
• Accelerating growth
and rising inflation
• Easier fiscal policies
• Still-accommodative
monetary policies
• Mediocre or slowing
growth
• Rising inflation
• Easier fiscal policies
• Eventually leads to
tighter monetary
policies
Goldilocks
Japan
Europe
US
China
Gro
wth
Lifecycle

19 / Outlook 2018
US Late cycle, but some room to grow • US growth to accelerate for second year on the back of consumer and business spending, making it the second-
longest expansion in modern history
• We expect the Fed to stick to its gradual pace of rate hikes (2-3 25bps hikes in 2018) under Chair Jerome Powell, in
line with a gradual pick-up in inflation
• There is a risk of the economy overheating because of potential tax cuts, forcing the Fed to hike rates at a faster pace
• USD expected to weaken modestly as policy divergence comes to an end
The US economy is expected to grow 2.5% in 2018,
accelerating for the second straight year and up from 2.2%
growth in 2017. This is well above the economy’s 1.6%
potential growth rate estimated by the Congressional Budget
Office and suggests a step-up in the pace after mediocre 2%
trend growth since the financial crisis. Part of the
acceleration over the past year has been due to a boost to
business investment, mainly in the energy sector, which
added to continued robust consumer spending on the back
of the strongest job market in a decade.
Business investment and consumer spending are likely to
remain strong over the coming year. This is especially so if
the Republicans succeed in enacting personal income and
corporate tax cuts over the coming months. Although the
fiscal boost is likely to be modest and temporary, given the
limitations of sticking to the government debt ceiling, it is
likely to stimulate wages and corporate spending, lifting
growth at the margin.
Housing investment, which has slowed lately, is also likely to
get a boost over the next few quarters from rebuilding and
renovation activity following the recent hurricanes, adding
another leg to growth. Finally, government spending is
expected to contribute positively in 2018, after being a drag
in 2017, especially if the Trump administration increases
spending on defence and infrastructure as promised
(although this is likely to be partly offset by cuts in other
government departments).
The continued growth of the US economy above its potential
rate points to a gradual pick-up in inflation over the course of
2018, especially if tax cuts are enacted. Although inflation
has underwhelmed this year, most of the drag came from a
temporary softness in telecom and medicine prices. We
expect these factors to fall away, helping revive underlying
inflationary pressures at some point over the coming year.
The USD’s weakness and the recovery in oil prices over the
past year are also likely to help revive price pressures, with a
6-12-month lag. The latest data suggests core inflation has
started to turn higher on a quarter-on-quarter basis. Wage
pressures are also likely to build up as unemployment falls
below the equilibrium level.
Figure 3
US business confidence indicators are close to their highest in
more than a decade
US manufacturing and services sector business confidence
Source: Bloomberg, Standard Chartered

Outlook 2018 / 20
Figure 4
Monetary policy in the US is set to turn less accommodative for the first time since the financial crisis as the Fed’s policy rate rises
above inflation
US core inflation, unemployment rate and Fed policy rate under various Fed Chairs over the past 40 years
Source: Bloomberg, Standard Chartered
Late-cycle dynamics
There is a risk that continued above-potential economic
growth could stoke price and wage pressures. This is
especially so as the US is at a late stage of its business
cycle (If the current cycle extends to Q2 of 2018, it would
make it the US’s second-longest modern history expansion.
If it stretches until Q2 of 2019, it would be the longest in
modern history). This is where the Fed’s policy reaction is
likely to be a key determinant for the sustainability of the US
economic expansion. The Fed will need to tighten policy just
enough to prevent the economy and the job market from
overheating and financial imbalances from developing,
without choking the underlying growth drivers. We expect
this balancing act to become more challenging over the
coming 12-18 months.
The nomination of Jerome Powell as the next Fed Chair
replacing Janet Yellen suggests the Trump administration
favours policy continuity at the central bank. This, we
believe, points to 2-3 more 25bps rate hikes in 2018. To put
this in context, the Fed raised rates by an average 225 bps a
year in the past four rate hiking cycles. This hints at the risk
of a faster pace of Fed rate hikes if growth and/or inflation
surprise on the upside and unemployment continues to
decline.
For now, we expect the Fed to err on the side of caution and
act only when it is more confident of inflation sustainably
picking up. This is especially so, given that financial
conditions are likely to start tightening somewhat by the
middle of 2018 as the Fed gradually reduces the size of its
bond holdings accumulated through its quantitative easing
programme following the financial crisis.
Apart from sharp monetary policy tightening, economic
cycles could also end due to severe imbalances. We see
little sign of such imbalances in the US economy for now.
Overall borrowing by households has been restrained since
the financial crisis. While corporate leverage has risen, this is
against the backdrop of rising profitability and very low
interest rates, which have helped keep debt-servicing ratios
at sustainable levels. Meanwhile, the US current account
deficit has halved from pre-crisis levels and has remained
stable in recent years. Against this backdrop, we assign a
25% probability to a US recession in the next 12 months,
same as a year ago.
US domestic politics or external shocks are the other
possible sources of risk for the US economy. President
Trump has so far struggled to implement some of his key
political and economic agenda through the US Congress,
despite a Republican majority in both houses. Any shift in
control of the US House or the Senate towards Democrats
after the mid-term elections in Q4 2018 could lead to
legislative logjams, reducing the chances of any economic or
regulatory reform.
An electoral setback in Congress or further escalation in the
Federal investigation on Russia’s alleged meddling in the last
US elections could encourage the administration to step up
trade disputes with US neighbours (NAFTA) or with Asian
trade partners. This could hurt global trade at a time when
the economic expansion is already mature. For now, we
assign a low probability to this outcome.
AD
AP
TIV
E P
RO
CE
SS
S
TR
AT
EG
Y
MA
CR
O O
VE
RV
IEW
M
UL
TI-A
SS
ET
B
ON
DS
E
QU
ITY
F
X
CO
MM
OD
ITIE
S
ALT
ER
NA
TIV
ES
ST
RA
TE
GIE
S
AP
PE
ND
IX

21 / Outlook 2018
Euro area Growing above potential • The Euro area’s synchronised expansion is likely to continue for a second year amid easy monetary and financial
conditions
• Inflation is likely to remain tepid because of substantial slack across southern Europe
• The ECB is likely to withdraw stimulus gradually, as planned, but rate hikes are unlikely at least until 2019
• The main risk to the region is political, with upcoming elections in Italy potentially causing short-term uncertainty
• The EUR is likely to extend gains on the back of strong growth and contained political risks
The Euro area provided one of the biggest positive surprises to global growth in 2017, expanding at an
above-potential 2.2% (based on consensus estimates), aided by extremely easy monetary and financial
conditions. A strong pick-up in domestic consumer spending emerged as a key driver of growth as job
markets continued to improve, leading to a synchronised expansion across southern and northern
Europe for the first time since the financial crisis. While a rebound in the EUR in the first half of the year
provided a limited headwind, continued strength in global demand helped support exports. Meanwhile,
fiscal policy remained less restrictive across the region, providing additional support.
Consensus estimates suggest the Euro area, like the US, will continue to grow above its potential for the
second straight year in 2018, albeit at a slightly slower pace (of 1.9%) compared with 2017. Consumer
confidence is currently at its strongest level since 2001, despite the recent recovery in oil prices and
political uncertainty in Spain, Italy and Germany. This points to another robust year for consumption.
Strong and synchronised global growth is likely to keep supporting exports. Meanwhile, there are
growing expectations of fiscal easing, albeit on the margin, across major economies, including possible
tax cuts in Germany, France, the Netherlands and Austria.
We expect Euro area monetary policy to remain extremely accommodative over the next 12 months,
with inflation remaining well below the ECB’s 2% target despite picking up from very low levels in recent
months. Although Germany and other northern European economies have substantially narrowed
excess productive capacities, labour markets in Italy, Spain and other major economies in southern
Europe are still saddled with significant levels of under-employment. This leads us to believe that the
ECB is unlikely to raise rates at least until 2019, despite announcing further cuts to its bond-buying
programme over the coming year. Given this, inflation-adjusted interest rates are likely to stay negative
over the coming quarters, providing a significant boost to economic activity.
We expect the EUR to extend gains over the coming year on the back of the region’s improving growth,
which is boosting demand for the region’s assets, and contained political risks following the defeat of
Eurosceptic parties in the elections in France and the Netherlands earlier this year. However,
broadening and deepening domestic growth is likely to offset the impact of a stronger currency.
Political risks
The main risks to this constructive outlook are political. The recent election in Catalonia (Spain) and
Germany point to the challenges facing centrist parties across the region. We are less concerned about
Spain as the issue is likely to be eventually resolved with a greater transfer of fiscal powers from the federal
POSSIBLE
TAX CUTS IN
GERMANY,
FRANCE, THE
NETHERLANDS &
AUSTRIA

Outlook 2018 / 22
to the provincial governments. The possibility of a minority government in Germany, while
unprecedented, is unlikely to lead to any significant changes in economic policy.
However, the upcoming elections in Italy – which must be held by May – could potentially lead to
uncertainty, albeit for the short term. The bar for Eurosceptic parties to win in Italy is high, given their
lack of agreement on a common agenda. Most Eurosceptic parties have backed away from their
demand for a referendum on whether to remain in the Euro area. Even if they come to power and still
want Italy to leave the Euro area, they will need to change the constitution to allow for such a binding
referendum. Meanwhile, the ongoing economic recovery in Italy, enabled by the recapitalisation and
aggressive bad loan write-offs at some of its weakest banks earlier this year, is likely to provide support
for more moderate and centrist political parties at the polls. Thus, we continue to believe that political
risks are likely to be contained in Italy as well as the Euro area over the coming year.
Figure 5
The Euro area has seen broad-based growth upgrades across
the region
Consensus 2018 growth estimates for Euro area economies
Source: Bloomberg, Standard Chartered
Figure 6
Job markets have improved across the Euro area, especially in
southern Europe, as business confidence recovered
Euro area unemployment rate and PMI
Source: Bloomberg, Standard Chartered
0.5
1.0
1.5
2.0
2.5
3.0
Jul-17 Aug-17 Sep-17 Oct-17 Nov-17 Dec-17
% y
/y
Germany France Italy Spain
50
51
52
53
54
55
56
57
58
Dec-14 Jul-15 Feb-16 Sep-16 Apr-17 Nov-17
%
Inde
x
Unemployment rate (RHS) PMI

UK Brexit woes • The UK continues to face uncertainty around the terms of Brexit, undermining its growth outlook
• Purchasing power is likely to be further hit by rising inflation caused by the GBP’s earlier weakness and slowing
wages
• The BoE has raised rates for the first time since the financial crisis, but is likely to be guided by the outcome of Brexit
talks going forward
• The GBP is unlikely to extend gains into 2018, unless Brexit issues are resolved
The UK economy is an exception to our overall positive economic outlook for the major regions. With the
outcome for Brexit talks still uncertain, the economy faces a double-whammy from high inflation, caused
by the earlier depreciation of the GBP, and falling real incomes, as wages fail to keep up with inflation.
The resulting decline in purchasing power has already led to a slowdown in consumption, previously the
main driver of the economy. Continued Brexit uncertainty could encourage more companies to shift their
operations to the Euro area, dealing a blow to already-weak business sentiment.
The outcome of Brexit talks is likely to be a key determinant for the outlook. For now, consensus
estimates point to a slowdown in growth to around 1.4% in 2018, from 1.5% in 2017 and 1.8% in 2016.
Any agreement that would allow an extension of the UK’s existing trade and financial transaction
arrangements with the European Union beyond the 2019 deadline (the UK has sought a two-year
extension until 2021), would help significantly reduce business uncertainty. However, there is a risk of
further instability in the current minority UK government, given deep divisions within the cabinet, which
could hamper the UK’s ability to negotiate a favourable agreement. The UK’s opposition to the free
movement of labour among European Union members is likely to be a key sticking point. The status of
the existing ‘soft’ border between the Republic of Ireland and the UK territory of Northern Ireland
following Brexit is another potentially vexing issue.
Monetary policy remains accommodative, but has turned less supportive lately. The Bank of England
raised interest rates for the first time since the financial crisis in response to rising inflation, which has
stayed well above its 2% target for almost a year. Although the GBP has gained in 2017, we do not
expect the gains to extend into 2018 as the outlook for monetary policy remains uncertain and is likely to
be data-driven, given the ambiguity around Brexit talks.

Outlook 2018 / 24
Japan Abenomics 2.0 • Japan’s economy is expected to continue growing above trend, making it the longest expansion in recent history
• Prime Minister Abe’s re-election is positive for the continuation of monetary and fiscal stimulus and structural reform
• The BoJ is likely to maintain easy monetary policy as inflation remains well below target, despite the recent uptick
• We expect the JPY to weaken as the BoJ’s extremely easy monetary policy contrasts with less accommodative
policies elsewhere
As in the US and Euro area, Japan’s economy expanded
above its potential in 2017, growing an estimated 1.5%.
Barring external shocks caused by geopolitics or any slump
in global trade, growth is likely to remain above potential at
around 1.2% in 2018, based on consensus, which would
make the current expansion the longest in Japan’s post
World War II history. An extremely easy monetary policy, the
JPY’s prior weakness and robust global demand is helping
support exports. Meanwhile, multi-decade low
unemployment rates have helped revive domestic
consumption and modest inflation pressures. The
combination of strong external and domestic demand has
helped close the excess productive capacities, encouraging
companies to boost investment to expand.
Prime Minister Abe’s recent victory at the snap general
elections should give him the political backing to continue
with his policy of aggressive monetary easing, supportive
fiscal policies and structural reform to boost productivity and
encourage wider labour participation. This implies BoJ
Governor Haruhiko Kuroda is likely to get an extension after
his current term expires in April, enabling him to continue
with the BoJ’s easy monetary policy. As a result, we expect
the JPY to weaken against the backdrop of less
accommodative central banks elsewhere. A weaker JPY is
likely to keep supporting exports.
The key question is whether Japan’s economy has reached
‘escape velocity’. The pick-up in inflation this year suggests a
reversal in trend, although inflation is likely to stay well below
the BoJ’s medium-term target of 2% for the foreseeable
future. Any upside surprise to inflation, given the tight
productive capacities and labour markets, could lead the BoJ
to turn less accommodative. For now, we assign a low
probability to such an outcome, but would remain watchful of
evolving inflation trends.
Record low unemployment rates have
helped revive domestic consumption
and modest inflation pressures.
Figure 7
Japan and other major export-oriented economies in Asia are benefitting from a robust lift to global trade
Export growth in key Asian economies, rolling 3-month moving average
Source: Bloomberg, Standard Chartered

25 / Outlook 2018
Asia ex-Japan Boosted by strong global trade • Asia ex-Japan is benefitting from robust global trade and a domestic recovery in major economies such as India and
South Korea
• China’s growth to slow modestly as it focuses on the quality of growth, while ensuring financial stability and long-term
sustainability
• India’s growth to recover from twin shocks of demonetisation and roll-out of goods and services tax (GST), aided by
increased government spending and a revival in bank lending
• South Korea’s growth outlook has improved since the election of the new government. The central bank is expected
to hike rates only gradually
Asia ex-Japan remained the biggest regional contributor to
global growth in 2017, powered by a stronger-than-expected
expansion in China and a pick-up in global trade. We expect
China’s growth to slow moderately in 2018, but remain
strong enough to keep supporting global demand. This, in
turn, is likely to be supportive for the more open Asian
economies such as South Korea, Taiwan, Malaysia and
Singapore. Meanwhile, the more domestic-oriented
economies such as India, Indonesia and the Philippines are
likely to benefit from a mix of increased government
spending and a revival in bank lending.
China’s outlook remains critical for the region. We believe
China’s economy will slow modestly from the 6.5-7.0%
growth rates seen over the past couple of years to a more
sustainable 6.0-6.5% rate as President Xi Jinping, following
his recent consolidation of power, renews the focus on the
quality of growth. This necessarily means a moderate
slowdown in property investment, with the slack taken over
by continued strong growth in services and consumption.
China’s reforms would entail cuts to excess industrial
capacities, more stringent environmental regulations and
tighter credit to certain sectors (reflected in the recent rise in
bond yields). However, we note that a key fallout of
shuttering of excess capacities has been a strong pick-up in
producer prices over the past couple of years, after a period
of deflation, which has boosted industrial profit margins.
Sustained strong corporate earnings should help support
business investment. Meanwhile, the ‘new economy’ areas
are benefitting from strong domestic consumption, driven by
continued urbanisation and expansion of the middle class.
Additionally, China’s One-Belt-One-Road initiative to revive
ancient trade routes across Asia is likely positive for
infrastructure investment in the broader region over the
coming years, especially across Southeast Asia. Fixed asset
investment across Asia is likely to help offset slowing
investment growth in China as it deleverages.
China’s high, and rising debt levels, remains a key risk to the
global outlook, with the IMF forecasting non-financial debt to
rise to 298% of GDP by 2022 from 236% in 2016. However,
we note that most of the leverage is in the corporate sector,
while government debt remains relatively low. This means
the government has the room to write-off bad debts to
underperforming state-linked companies and entities, should
it choose to do so, shielding the overall economy from
excessive stress.
Figure 8
China’s domestic consumption growth has remained robust,
while investment growth has slowed
China’s growth in retail sales and fixed asset investment
Source: Bloomberg, Standard Chartered
0
5
10
15
20
25
30
Oct-11 Oct-12 Oct-13 Oct-14 Oct-15 Oct-16 Oct-17
% y
/y
Fixed asset investment Retail sales

Outlook 2018 / 26
Outlook improving for rest of Asia
In India, there are signs of a revival in the economy after the
twin shocks of demonetisation and implementation of GST
slowed growth to multi-year lows earlier this year. The
government’s reform efforts are helping ease some structural
bottlenecks, as seen from the latest rise in India’s ranking in
the World Bank’s ‘Ease of Doing Business’. The recent move
to recapitalise banks and unveil a highway construction
programme are positive for bank lending and economic
growth in the coming quarters, especially in the run-up to the
general elections in 2019.
South Korea’s growth outlook has improved since the
formation of the new government earlier in 2017, with
consensus estimates pointing to around 3% GDP growth for
2017 and 2018. The growth pick-up has been driven by
supportive fiscal policies, a rise in minimum wages and
improved relations with China (following the temporary
impasse around the US’s deployment of the THAAD missile
defence system earlier in 2017), which has helped revive
tourist inflows from China. The improved outlook has led the
Bank of Korea to raise rates for the first time since 2011. We
expect future rate hikes to be limited, given still subdued
inflation and high household debt levels. Policymakers will
also be restrained, lest higher rates lead to further strength in
the KRW, hurting export competitiveness.
Overall, Asia ex-Japan is likely to grow 5.8% in 2018, vs
6.0% in 2017, per consensus estimates. Continued strong
growth is likely to lift inflation moderately, especially with the
recent recovery in oil prices. Meanwhile, a weaker USD is
helping sustain capital flows to the region. Hence, there are
growing expectations of a likely turn in monetary policy
trends, with most central banks across the region shifting to
a tightening bias for the first time in years. Consensus
forecasts point to 25-50 bps rate hikes by Asian central
banks over the next 12 months, led by 2-3 hikes in South
Korea. In India, the window for further rate cuts has likely
closed, although it would take a sustained rise in inflation for
the central bank to raise rates.
Figure 9
The growth differential between EM and DM is expected to
widen gradually as the global expansion broadens and
becomes more synchronised
Growth in Emerging Markets and Developed Markets and their
differential
Source: Bloomberg, Standard Chartered
0.0
1.0
2.0
3.0
4.0
5.0
6.0
2014 2015 2016 2017F 2018F 2019F
%
Growth differential Emerging markets Developed markets
2013

27 / Outlook 2018
Emerging Markets ex-Asia Recovery aided by modest gains in commodity
prices, weak USD
• Emerging Market growth likely to be supported by strong global trade environment, modest gains in commodity prices
and weak USD
• Brazil’s and Russia are likely getting close to the end of their easing cycles as inflation rebounds, although Mexico is
likely to cut rates as inflation peaks
• The main risk to the region is political, given upcoming elections in Mexico, Brazil and South Africa
Emerging Markets outside Asia posted a turnaround in 2017,
with major commodity-producing economies such as Brazil
and Russia returning to growth after two years of contraction.
The positive surprise in China’s growth, driven by continued
strength in the construction sector, helped sustain demand
for raw materials. The agreement between OPEC and
Russia to curtail crude oil production helped revive oil prices,
benefitting Russia and other major oil producers. Meanwhile,
the USD’s weakness through 2017 has helped keep financial
conditions easy across Emerging Markets. We expect the
growth differential between EM and DM to widen gradually
as the global expansion broadens and becomes more
synchronised.
Consensus estimates point to a continued recovery in Latin
America over the coming year on the back of constructive
global growth and supportive commodity prices. All major
economies, except for Venezuela, are likely to see
acceleration in growth, although the region is likely to
continue underperforming other major Emerging Markets.
Inflation appears to have bottomed in most markets (except
in Mexico, Argentina and Venezuela), which is likely to
constrain central banks from cutting interest rates
significantly. However, monetary policy is likely to remain
broadly accommodative, given substantial economic slack,
stable currencies and improved external balances. In
Mexico, inflation appears to have peaked, which should
enable the central bank to cut rates.
Politics remains a key risk across Latin America, with
upcoming elections in Mexico (July) and Brazil (October). In
Mexico, the front-runner Andres Manuel Lopez Obrador has
promised to unwind key structural reforms and review some
state contracts, increasing investor uncertainty. Any decision
by the US to pull out of NAFTA would deal a blow to
Mexico’s nascent recovery. In Brazil, populist candidates are
rising in the polls, putting at risk further fiscal consolidation
which is critical for the economy’s medium-term
sustainability.
In Eastern Europe, Russia’s growth is likely to plateau at
around 1.8% in 2018, after a sharp recovery this year from
two years of recession. Oil prices are likely to remain
supportive. A key focus would be the direction of economic
reform after the March elections when President Putin is
expected to return for another term in office. A fall in inflation
has enabled the central bank to cut rates in 2017; the
window for further rate cuts has narrowed, although the
market still expects 1-2 more cuts.
Among Emerging Markets, Turkey and South Africa remain
the most vulnerable to any significant rise in global interest
rates, given their negative external imbalances. In South
Africa, the outcome of the ANC presidential election will be
closely watched for the path of future policy and economic
reform after President Jacob Zuma steps down from power.
Figure 10
Rate cuts in Brazil and Russia may be coming to a close as
inflation bottoms
Central bank benchmark rates
Source: Bloomberg, Standard Chartered
0
4
8
12
16
20
Sep-13 Sep-14 Sep-15 Sep-16 Sep-17
% y
/y
Russia Key Rate Brazil Selic Rate

Outlook 2018 / 28
The key risks
US monetary policy mistake
For now, this is primarily centred around the Fed and how it
reacts to evolving inflation. There are two potential pitfalls:
• The Fed raises rates too early/too fast: The US
economy is at the late stage of its business cycle after
expanding for 8 years. However, inflation has remained
subdued. There is a risk the Fed raises rates at a much
faster pace than current market estimates to stay ahead
of the curve (financial markets point to 1-2, 25bps Fed
rate hikes, while the Fed expects 75bps increase in
2018), causing a sharp economic slowdown.
• The Fed is too slow to react to inflation: There is the
counter-risk that the Fed waits too long to raise rates,
even as a tightening job market builds up wage
pressures, leading to a significant surge in inflation.
Alternatively, the Trump administration’s proposed tax
cuts could lead to an overheating of the economy. In
these cases, the Fed may be forced to accelerate the
pace of rate hikes, potentially causing a sharp slowdown
in the economy.
We expect the Fed under new Chair Jerome Powell to
continue erring on the side of caution and stick with the
current pace of gradual rate hikes until policymakers are
convinced of a sustainable upturn in inflation.
US domestic policies and trade protectionism
President Trump’s administration has had little success so
far in terms of legislative wins, despite the Republican party’s
majority in both houses of Congress. There is risk that the
Republicans lose control of one or both Houses of Congress
following the mid-term elections late in 2018, scuppering the
President’s economic reform agenda. Alternatively, the
investigations on Russia’s alleged interference in US
elections could implicate senior US administration officials.
Such events could encourage the President to focus on
external issues, including renegotiating, or even abandoning,
existing trade agreements with major trade partners such as
Mexico and economies across Asia. Such an outcome would
hurt global trade, clouding the outlook for Emerging Markets
and the export-oriented economies of Europe.
Hard-landing in China
China’s debt levels, especially in the corporate sector, have
continued to rise significantly, increasing financial stability
risks. Rising bond yields could pose additional challenges for
overleveraged companies.
However, policymakers have been reasonably successful in
recent years in gradually rebalancing the economy from
investment to domestic consumption. We believe President
Xi Jinping’s administration now has the political might to
tackle the debt problem head-on. The administration’s record
of maintaining a stable growth environment, even as it
pursues structural reform, gives us confidence that it is likely
to succeed in stabilising the economy at a slightly slower rate
of growth.
Global politics/geopolitics
• Multi-polar world: Geopolitical risks have increased over
the past year. We believe this is part of an evolving
structural trend as the world becomes increasingly multi-
polar, whereby multiple countries are competing for
international influence. The US’s economic and military
power, unchallenged since the end of the cold war, is
likely to be gradually eroded as China’s economic and
military strength increases. The US withdrawal from the
Trans-Pacific Partnership and the Paris Climate Accord
offers further opportunity for China and the European
Union to expand their sphere of influence. History
teaches us multi-polarity can often lead to extreme ‘black
swan’ events.
• North Korea: More immediately, North Korea’s
increased belligerence could lead to a flare-up in
tensions in North Asia, including direct confrontation
between the US and China.
• Middle East: The domestic and regional fallout of the
recent political changes in Saudi Arabia remains
uncertain. A region-wide conflagration involving other
Middle East economies could lead to further rise in oil
prices, causing a significant tightening of global financial
conditions.
• Italy: The upcoming general election in Italy could yet
lead to short-term uncertainty if Eurosceptic parties win.
So far, most parties have stepped back from their earlier
calls for a referendum. The ongoing upturn in Italy’s
economy and success of pro-European parties in
elections in France and the Netherlands earlier this year
is likely to dampen the Euroscepticism of Italian voters.

FX

Outlook 2018 / 30
FX at a glance
Tariq Ali, CFA | Manpreet Gill
Key
themes
We expect a modest decline in the USD index, mostly as a result of a stronger EUR and marginally offset
by a weaker JPY.
GBP and AUD likely to trade in a broad range as risks remain balanced.
EM currencies likely to strengthen further on a widening EM-DM growth differential, higher commodity
prices and a modestly weaker USD.
Key
chart
Figure 1
End of a bullish USD super cycle?
USD real effective exchange rate
Source: Bloomberg, Standard Chartered
Key
drivers
Currency Outlook Real Interest
Rate
Differentials
Risk
Sentiment
Commodity
Prices
Broad USD
Strength
Comments
USD ▼ n/a n/a
US monetary policy divergence with the rest of the world likely peaking, interest rate differentials to narrow
EUR ▲ n/a n/a
Increasing likelihood of an earlier ECB stimulus withdrawal to support EUR. Political risks contained
JPY ▼ n/a n/a
BoJ likely to maintain easing policy, further widening of interest rate differentials to weaken JPY
GBP ◆ n/a n/a
Further BoE rate hikes remain at risk from Brexit-related uncertainty and its potential impact on growth
AUD ◆
Supportive risk environment balanced by likely status quo in monetary policy
EM FX ▲ n/a
A weaker USD, moderately higher commodity prices and positive risk sentiment to support EM FX
Source: Bloomberg, Standard Chartered
Legend: ▲ Bullish | ▼ Bearish | ◆ Neutral | Not Supportive | Neutral | Supportive
31 / Outlook 2018
No longer just about the Fed
In our view, the USD is likely to
weaken modestly in 2018 as we
believe the possibility of the Fed
hiking interest rates faster than
market expectations is remote
given the current US inflation
backdrop. On the other hand, there
is greater potential for other central
banks, including the European
Central Bank, to withdraw stimulus
faster than consensus
expectations.

Outlook 2018 / 32
US DOLLAR (USD) |
The USD index extended its weakness in 2017, despite the
fact that the Fed hiked interest rates three times during the
year. This may imply that expectations of policy elsewhere in
the world are now dominating the USD outlook. With robust
economic momentum and a significant reduction in
perceived political risk in Europe, the European Central Bank
(ECB) now appears more confident in contemplating
stimulus withdrawal. Elsewhere, the Bank of England (BoE)
and the Bank of Canada (BoC) hiked interest rates in 2017
after further improvements in their respective labour markets.
The only exception among the major central banks here is
the Bank of Japan (BoJ), which continues to communicate
status quo for the foreseeable future.
In our view, the USD is likely to weaken modestly in 2018 as
we believe the possibility of the Fed hiking interest rates
faster than market expectations is remote given the current
US inflation backdrop. On the other hand, there is greater
potential for other central banks, including the European
Central Bank, to withdraw stimulus faster than consensus
expectations. Hence, we expect narrowing real interest rate
differentials between the US and major peers, which is likely
to be moderately negative for the USD. From a long term
perspective, the USD trade weighted index, adjusted for
inflation, is still near its peak levels.
Risks to our USD outlook include the realisation of the two
extreme scenarios highlighted in the Macro overview section.
A surge in US inflation expectations might compel the Fed to
hike interest rates more aggressively. Similarly, a return to a
deflationary scenario would likely increase flight to safety
from risk assets and increase demand for the USD. Outside
of these scenarios, major developments on tax reform that
lead to a repatriation of capital back into the US could drive
short term USD gains.
EUROPEAN EURO (EURO) |
We expect the EUR to extend gains in 2018, albeit more
moderately than in 2017. We believe cyclical and political
factors are likely to impact the outlook for the EUR.
With respect to cyclical factors, we believe the EUR has
room to extend gains as the economy gathers pace, resulting
in further clarity with respect to ECB stimulus withdrawal and
potential rate hikes. We believe the initiation of ECB’s
Quantitative Easing (QE) had excessively weakened the
EUR through 2015-2016. This can be gauged from the fact
that interest rate differentials with the US still remain close to
historical lows Hence, any withdrawal of QE is likely to
reverse these trends to some extent.
Global investors and central banks further re-allocating
capital towards Euro area assets should once again become
a source of EUR support. With greater confidence in the
Euro area economy and potential ECB stimulus withdrawal,
we are likely to see an improving net balance of payments,
which is fundamentally positive for the EUR.
Finally, political risks are still important, even though these
have diminished significantly over the past year. Elections in
Italy H1 2018 could cause short term volatility, although as of
now, the possibility on non-mainstream party gaining
significant ground remains low.
Figure 2
Germany-US real yield differentials still at low levels historically
Germany-US 10 year real yield differentials
Source: Bloomberg, Standard Chartered
1.0
1.1
1.2
1.3
1.4
1.5
1.6
Jan-10 Jan-12 Jan-14 Jan-16 Jan-18
-2.0
-1.7
-1.4
-1.1
-0.8
-0.5
-0.2
0.1
0.4
0.7
EUR/U
SD
%10 yr Ger-US yield differential EUR/USD (RHS)

33 / Outlook 2018
JAPANESE YEN (JPY) |
We expect the JPY to weaken in 2018. Both internal and
external factors influence our thinking regarding the JPY
outlook.
With respect to internal factors, a continuation of the Bank of
Japan’s Yield Curve Control (YCC) policy of keeping Japan
10 year yield close to zero is critical, as it can potentially lead
to a further widening of real interest rate differentials in
favour of a weaker JPY. This year, the BoJ has reiterated its
commitment to maintaining the current policy with no
guidance on a potential exit strategy. While PM Abe’s re-
election has diminished challenges to ‘Abenomics’ and the
continuation of excessive easing policy, any significant shift
here remains the main domestic risk to our weaker JPY view.
Among external factors, our view of a modest rise in US
long-end yields is likely to further weaken the JPY. With
yields in Japan on hold, US 10-year yields have been the
most significant variable affecting the real interest rate
differential between the US and Japan. Other than this, a low
volatility environment similar to 2017 is supportive of
continued capital outflows from Japan towards risky assets
and the continued use of JPY as a funding currency.
Conversely, a rise in volatility or increased deflationary
concerns pose a risk to our weaker JPY outlook.
Figure 3
US 10-year yield remains a key driver of the JPY
US 10 year Treasury yields and USD/JPY
Source: Bloomberg, Standard Chartered
POUND STERLING (GBP) |
While the GBP has recovered from its post ‘Brexit’ lows, we
doubt these gains can extend much further into 2018. Key
issues include the lack of a transitional trade agreement with
the EU and a weak balance of payments profile.
In 2017, market expectations for modest Bank of England
(BoE) rate hikes in 2018 have supported the GBP.
Nevertheless, we believe the BoE’s approach is likely to
remain fluid in view of the evolving Brexit-related and
economic risks. In this regard, a transitional agreement
ahead of the March 2019 deadline is critical. Should an
agreement be reached, we are likely to see reduced
uncertainty, leading to further GBP gains. Although an
agreement is ultimately our base-case scenario, the
possibility of a ‘no deal’ prompts a more cautious approach.
The UK’s balance of payments’ position remains challenging,
especially as the weaker GBP has not resulted in a
significant improvement in export growth. Furthermore, the
current account deficit remains close to record levels and
hence any significant capital outflows are likely to weigh on
the exchange rate. In this context, we believe the GBP’s
‘undervaluation’ is justified once the impact of this notably
weaker balance of payment profile is incorporated.
Figure 4
Scaling back of UK interest rate hike expectations poses a risk
to the GBP
UK-US 2-year nominal yield differentials and GBP/USD
Source: Bloomberg, Standard Chartered
USD/JPY US 10y yields (RHS)
%
USD
/JPY
1.9
2.0
2.1
2.2
2.3
2.4
2.5
2.6
2.7
105
107
109
111
113
115
117
119
Dec-16 Feb-17 Apr-17 Jun-17 Aug-17 Oct-17 Dec-17 -1.5
-1.2
-0.9
-0.6
-0.3
0.0
0.3
0.6
0.9
1.18
1.28
1.38
1.48
1.58
1.68
1.78
Sep-12 Jun-14 Mar-16 Dec-17
%
GBP/U
SD
GBP/USD 2y UK-US nominal yield differential (RHS)

Outlook 2018 / 34
AUSTRALIAN DOLLAR (AUD) |
While the AUD trended modestly higher in 2017, it traded in
one of its tightest ranges relative to the last two decades.
Looking ahead into 2018, we see little reason for the AUD to
rally strongly as risks remain balanced. The outlook for the
AUD remains dependent upon three key factors: Reserve
Bank of Australia’s (RBA) policy and real interest rate
differentials, the outlook for iron ore prices and global
financial market volatility.
The RBA has continued to highlight its preference for steady
monetary policy settings. However, it has left room open for
rate hikes should the economy gain further ground and
inflationary pressures rise. Overall, the case for a rate hike
looks balanced. Business confidence is improving and the
labour market is tightening, which argues for a less
accommodative policy, whereas high household leverage
coupled with flat wage growth suggests rates should not go
higher.
Higher iron ore prices have been a source of support for the
AUD since bottoming in 2016. However, we expect this to
fade as we go into 2018. Supply side issues in the iron-ore
market as well as a modest slowdown in China’s growth
suggest consolidation.
The excessively low volatility environment has also been a
major source of support for the AUD in 2017. In general, we
remain constructive on risk assets in 2018 and this factor is
likely to be limit downside for the pro-cyclical AUD.
Figure 5
Iron ore prices unlikely to strongly support AUD in 2018
China iron ore price and AUD/USD
Source: Bloomberg, Standard Chartered
EMERGING MARKET CURRENCIES |
We believe the overall macroeconomic environment in 2018
remains supportive for EM currencies, although we do not
expect the same magnitude of gains as in 2017. Broadly,
three factors drive our positive view on EM currencies; a
modestly weaker USD, higher commodity prices and a
bottoming of the EM-DM growth differential. Our view on
individual currency pairs is as follows:
• We expect the KRW to strengthen further amid further
recovery in the global economy, a hawkish shift by the
Korean central bank and a weaker USD.
• We expect modest gains in the SGD and MYR, in line
with our view of a weaker USD, a pick-up in global
growth and supportive domestic monetary policies.
• We expect the CNY and INR to trade largely range-
bound. Policy bias to favour exchange rate stability in
China while a slower pace of capital inflows into India to
limit INR gains.
SOUTH KOREAN WON (KRW) |
We believe there are three factors that will likely drive further
KRW gains. First, through the export channel, the KRW is
heavily exposed to global growth. With a strong
synchronised pick-up in global growth indicators and PMI’s
near cyclical highs, we believe there is potential for further
KRW appreciation.
Second, the hawkish turn by the Bank of Korea (BoK) amid
strong domestic consumption and export growth is likely to
improve the currently thin interest rate differential with the
US.
Finally, the modest weakening trend in the USD is likely to
allow further room for appreciation.
We believe policymakers in Korea are likely to tolerate
further KRW strength as long as the balance of payments
situation continues to improve. Tensions with North Korea
remain a potential risk, although similar to this year, we do
not think investors will pay much attention to this outside of
an extreme scenario.
AUD/USD China iron ore prices (RHS)
Iron
ore
price
/ton
ne
AUD
/USD
20
70
120
170
0.7
0.8
0.9
1.0
1.1
1.2
Jan-11 Jun-14 Nov-17

35 / Outlook 2018
MALAYSIAN RINGGIT (MYR) |
We believe the outlook for commodity prices and the USD
are the most significant driver of the MYR. Given our view of
modest USD weakness and higher commodity prices, we
expect modest MYR appreciation to continue into 2018.
Furthermore, we believe significant undervaluation and
possible increase in investor allocation to Malaysian debt is
likely to be a further tailwind. Arguably, sentiment towards
the MYR and local assets is likely to improve following a
continued improvement in the country’s balance of payments
and a gradual build-up of FX reserves.
As a risk, a hard landing in China and/or a marked slowdown
in global growth would likely result in MYR
underperformance with respect to regional currencies.
Among major Asian economies, Malaysia has one the lowest
FX reserves to protect against a potential EM crisis.
Figure 6
Modestly positive commodity price outlook to support MYR
Global commodity price index and USD/MYR
Source: Bloomberg, Standard Chartered
SINGAPORE DOLLAR (SGD) |
The outlook for the SGD is likely to be shaped by the
Monetary Authority of Singapore’s (MAS) policy bias as well
as the USD trend. On the first point, we believe there is a
reasonable probability of the MAS modifying its policy to
support a slight appreciation in the Singapore trade-weighted
exchange rate basket. In our view, the more balanced
outlook on growth and core inflation suggested in the last
policy review, paves the way for this adjustment in 2018.
Furthermore, with a shift towards a less accommodative
policy in many key trade partners it is natural for a small
open economy like Singapore to follow suit.
SGD strength has been strongly correlated with USD
weakness and we expect this to continue in 2018. Our
expectations for further gains in the EUR and MYR, which
likely account for approximately 30% of Singapore’s trade-
weighted exchange rate basket, is likely to support further
modest SGD appreciation.
Figure 7
USD and MAS policy outlook key for SGD direction
USD index and USD/SGD (top); SGD trade-weighted exchange rate
and policy band estimate (bottom)
Source: Bloomberg, Standard Chartered
2.8
3.3
3.8
4.3
60
83
106
129
152
175
Nov-09 Nov-11 Nov-13 Nov-15 Nov-17
USD
/MYR
Inde
x
Commodity index USD/MYR (inverse scale, RHS)
126
116
136
Jan-13 Jan-14 Jan-15 Jan-16 Jan-17
Inde
x
SGD trade-weighted basket SGD policy band (estimate)
1.2
1.3
1.4
1.5
75
82
89
96
103
110
USD
/SGD
Inde
x
USD index USD/SGD (RHS)

Outlook 2018 / 36
CHINESE YUAN (CNY) |
The CNY stabilised in 2017 amid a stabilisation in China’s
growth and capital outflows and a weaker USD. Since the
introduction of the China Foreign Exchange Trading
System’s trade-weighted policy basket, we observe that the
correlation between the USD/CNY and the USD index has
improved significantly. Hence, in our view, in addition to
PBoC’s policy bias, the outlook for the USD is now key.
We expect policy makers to prefer a broadly stable CNY
relative to trade partner currencies. This is due to the
profound impact of the exchange rate on China’s domestic
monetary conditions. We expect authorities to favour a
balance between reform and growth which does not favour
significant monetary tightening from current levels. Against
the backdrop of a stable exchange rate policy, we expect the
USD to be the main driver of the CNY. An outlook for a
modestly weaker USD is also likely to discourage further
capital outflows with the potential for some repatriation going
forward.
Figure 8
Policy bias likely to favour a sideways trend in the trade-
weighted CNY
CFETS CNY trade weighted index and USD/CNY
Source: Bloomberg, Standard Chartered
INDIA RUPEE (INR) |
The INR gained strongly in 2017. This has been mainly due
to strong capital inflows amid a stellar performance in the
local equity and bond markets. However, going forward, we
expect the INR to be range-bound as some of these factors
are likely to turn less supportive in 2018.
High valuations in the domestic equity market coupled with
foreign debt ownership quotas are likely to limit additional
capital inflows. In addition, some deterioration in the current
account can be expected amid recent gains in oil prices.
Nevertheless, a still relatively healthy balance of payments
position is likely to limit significant INR weakness. We also
expect the Reserve Bank of India (RBI) to continue to
manage volatility resulting in a fairly stable INR in 2018. A
significant surge in oil prices remains the main downside risk,
in our view.
Figure 9
India’s FX reserve position has improved over time, reducing
vulnerability to external shocks
India FX reserves and FX reserves as a multiple of monthly imports
Source: Bloomberg, Standard Chartered
6.1
6.3
6.5
6.7
6.9
7.190
95
100
105
Sep-15 Jun-16 Mar-17 Dec-17
USD
/CN
Y
Inde
x
CFETS CNY trade-weighted index USD/CNY (RHS)
5
7
9
11
13
15
17
19
Dec-07 Aug-09 Apr-11 Dec-12 Aug-14 Apr-16
X Im
por
ts
200
250
300
350
400
450
USD
bn
India FX Reserves (LHS) FX Reserves/Imports

COMMODITIES

Outlook 2018 / 38
Commodities at a glance
Tariq Ali, CFA | Manpreet Gill
Key
themes
We expect commodity prices to rise modestly in 2018, amid a moderately positive demand environment,
but still elevated supply levels in many cases.
Gold prices to rise modestly, most likely trading in the USD 1250–1350 per ounce range amid a slightly
weaker USD, balanced with largely range-bound real yields.
Oil prices likely to remain broadly range-bound, most likely trading in the USD55–65 per barrel range.
Key
chart
Figure 1
Outlook for China growth still a key driver of commodity prices
China leading indicator and Bloomberg commodity index
Source: Bloomberg, Standard Chartered
Key
drivers
Commodity View Inventory Production Demand Real
Interest
Rates
USD Risk
Sentiment
Comments
Oil n/a
OPEC cut backs
likely to be offset
by US production
increase.
Inventories remain
elevated
Gold
US rate increases
expected to be in-
line with inflation
Metals n/a
China demand a
support; market
still over supplied
Source: Bloomberg, Standard Chartered
Legend: Neutral | Not supportive | Neutral | Supportive
50
100
150
200
250
Jan-00 Aug-02 Mar-05 Oct-07 May-10 Dec-12 Jul-15
96
98
100
102
104
106
108
110
Inde
x
Inde
x
China leading indicator Bloomberg commodity index (LHS)
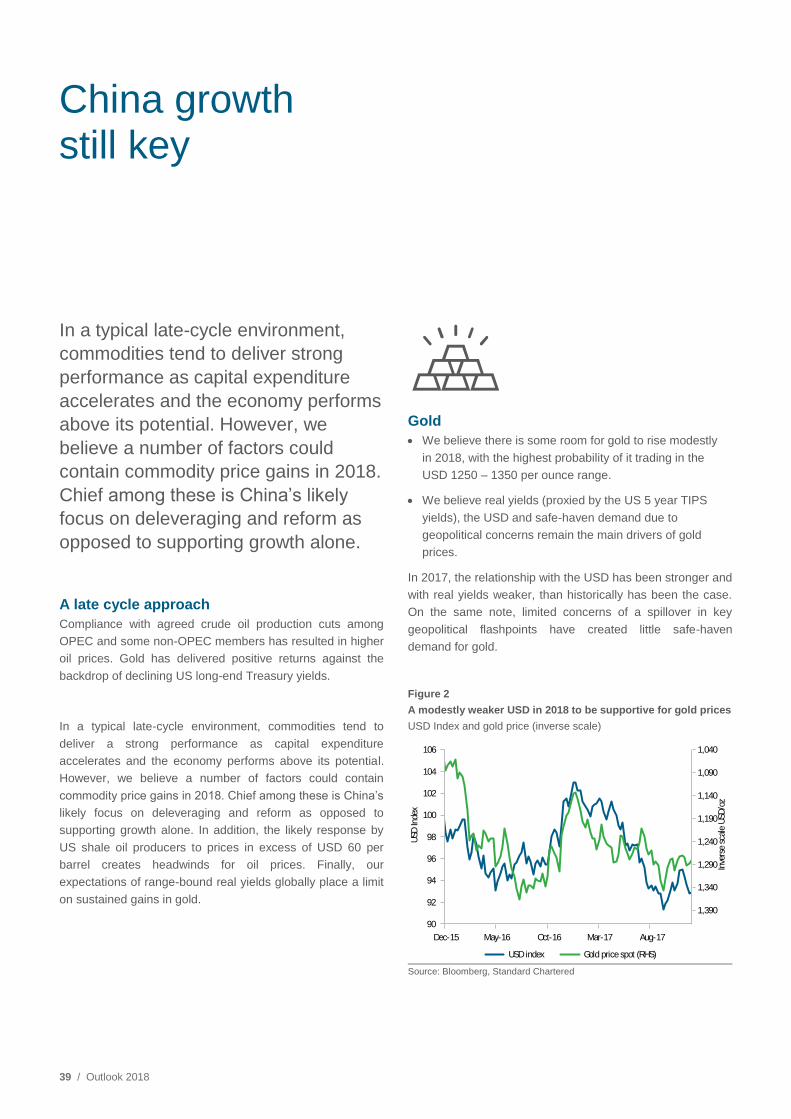
39 / Outlook 2018
China growth still key
In a typical late-cycle environment,
commodities tend to deliver strong
performance as capital expenditure
accelerates and the economy performs
above its potential. However, we
believe a number of factors could
contain commodity price gains in 2018.
Chief among these is China’s likely
focus on deleveraging and reform as
opposed to supporting growth alone.
A late cycle approach
Compliance with agreed crude oil production cuts among
OPEC and some non-OPEC members has resulted in higher
oil prices. Gold has delivered positive returns against the
backdrop of declining US long-end Treasury yields.
In a typical late-cycle environment, commodities tend to
deliver a strong performance as capital expenditure
accelerates and the economy performs above its potential.
However, we believe a number of factors could contain
commodity price gains in 2018. Chief among these is China’s
likely focus on deleveraging and reform as opposed to
supporting growth alone. In addition, the likely response by
US shale oil producers to prices in excess of USD 60 per
barrel creates headwinds for oil prices. Finally, our
expectations of range-bound real yields globally place a limit
on sustained gains in gold.
Gold
• We believe there is some room for gold to rise modestly
in 2018, with the highest probability of it trading in the
USD 1250 – 1350 per ounce range.
• We believe real yields (proxied by the US 5 year TIPS
yields), the USD and safe-haven demand due to
geopolitical concerns remain the main drivers of gold
prices.
In 2017, the relationship with the USD has been stronger and
with real yields weaker, than historically has been the case.
On the same note, limited concerns of a spillover in key
geopolitical flashpoints have created little safe-haven
demand for gold.
Figure 2
A modestly weaker USD in 2018 to be supportive for gold prices
USD Index and gold price (inverse scale)
Source: Bloomberg, Standard Chartered
1,040
1,090
1,140
1,190
1,240
1,290
1,340
1,390
90
92
94
96
98
100
102
104
106
Dec-15 May-16 Oct-16 Mar-17 Aug-17
Inve
rse
scal
e USD
/oz
USD
Inde
x
USD index Gold price spot (RHS)

Outlook 2018 / 40
Moving into 2018, we believe modest USD weakness is likely
to provide support to gold prices. However, real yields are
likely to remain range-bound; hence we do not see strong
gains in gold prices. For real yields to rise substantially,
central banks would have to hike rates ahead of inflation,
which we do not think is likely as data so far has been
disappointing. For real yields to fall substantially, we would
need to see central banks letting inflation get ahead before
raising rates; we also doubt is likely at this stage of the
business cycle. As a result, real yields are likely to remain
largely range-bound.
With a number of potential flashpoints, geopolitics remains
an area which we would monitor closely in 2018. Hence, we
would not discount gold’s role as a hedge against uncertainty
but would limit any allocation to 2-5%.
Figure 3
Real yields to remain range-bound in 2018
US 5-year TIPS yield (inverse scale) and gold
Source: Bloomberg, Standard Chartered
400
600
800
1,000
1,200
1,400
1,600
1,800
2,000
Sep-06 Dec-08 Mar-11 Jun-13 Sep-15 Dec-17
Inve
rse
Sca
le (%
)
Gold price spot US 5y TIPS yield (RHS)
USD
/oz

41 / Outlook 2018
Oil
• We expect oil prices to be generally capped at USD65
per barrel in 2018.
• We believe the outlook for oil prices is likely to be
determined mainly by supply-side factors; the extension
of OPEC cuts and compliance and the response of US
shale oil producers to higher oil prices.
Oil prices recovered in 2017, amid a narrowing of the supply-
demand imbalance. We believe two main factors have
contributed to this. First, in a break from the past, compliance
with OPEC cuts has been in excess of 90%. Second, US
shale oil production growth has slowed, owing to a decline in
productivity from wells. Finally, weather-related disruption in
the Gulf of Mexico also contributed to curtailing supply
growth in the short term.
In the year ahead, we believe OPEC producers as well as
some non-OPEC members, including Russia, are likely to
follow through with their commitment to cap production. In
2017, Saudi Arabia took the leadership role, delivering output
cutbacks well in excess of its quota. In 2018, compliance is
likely to remain firm, as gradually rising oil prices appear
consistent with a number of goals of the Saudi leadership.
Nevertheless, there are risks to compliance. For example, it
may be difficult to hold back Russian firms should they feel
their market share is being threatened.
Increasing output by US shale producers could dampen the
impact of the OPEC cut extension. We believe US crude
production is likely to increase further as many firms are able
to produce profitably at above USD60 per barrel.
Nevertheless, we also highlight declining well productivity
amid rising costs to extract more geologically challenging
assets will eventually put a cap on US production growth.
We believe demand growth is likely to be supportive in 2018,
though this will likely have a modest impact. In our view,
higher growth in Developed Markets could be offset by
slightly slower growth in China.
Finally, while geopolitics has not played a very significant
role in 2017, this should not be ignored going into 2018. A
number of key geopolitical flashpoints including Saudi-Iran
tensions and its manifestations through the region remain a
source of upside risk to our view in 2018.
Figure 4
US production growth to remain healthy while inventories still remain elevated
US total crude oil production (top); US total inventories and 5 year ranges (bottom)
Increasing output
by shale producers
could dampen the
impact of OPEC cut
extension.
Source: Bloomberg, Standard Chartered

Outlook 2018 / 42
Industrial metals
• We expect industrial metal prices to consolidate in 2018,
following strong gains in 2017, amid moderating China
fixed asset investment indicators.
• Most major industrial metal markets including copper,
aluminium and iron ore are still experiencing excess
supply, which is likely to limit further price gains.
Industrial metals have outperformed commodities in general
this year, rising over 15%. However, we doubt such a stellar
performance can continue in 2018. One of the biggest
supportive factors has been China’s growth surprises in 2017
and we expect these to moderate in 2018. In particular, data
related to fixed asset investment, credit growth and the
property sector, which has a strong relationship with
industrial metals, has been deteriorating. Hence, we believe
some of the gains in industrial metals may have an element
of speculation and other short term factors.
In addition to this, we believe supply side factors are likely to
be less supportive heading into 2018. Copper and aluminium
prices have been the main contributors to the rally in metal
prices. With respect to copper, a temporary disruption of
supplies and low inventories in China has supported the
exceptionally strong performance. However, in the year
ahead, we see a high probability of the copper market
returning to surplus. Aluminium has been boosted by the
unprecedented production caps on production by China
which could continue into 2018. However, despite this, the
market is in surplus as a result of high inventory levels so
any further gains are likely to be modest.
With respect to nickel, stainless steel production comprises
of the majority of demand. In this regard, a cut-back in
China’s steel capacity is likely to reduce demand. While
nickel is also the main beneficiary with respect to rising
demand for electric cars, as of now, the battery sector
accounts for only a small section of the global nickel demand
with. On the same note, iron ore prices are unlikely to
recover substantially in 2018 with China inventories swelling
with record supply levels, while steel demand is likely to cool.
Figure 5
Industrial metal prices diverging from fundamentals
Bloomberg industrial metals sub-index and China fixed asset investment – real estate
Source: Bloomberg, Standard Chartered


APPENDIX

Outlook 2018 / 45
2018 key events
Source: MSCI, JP Morgan, Barclays, Citigroup, Dow Jones, HFRX, FTSE, Bloomberg, Standard Chartered
*All performance shown in USD terms, unless otherwise stated.
The column ‘2017 Year to date’ indicates performance from 31 December 2016 to 5 December 2017.
The column ‘2016’
YE
AR
20
18
23 BoJ Policy decision
25 ECB Policy decision
X Taiwan central bank
Governor Perng’s term ends
01 FOMC Policy Decision
X Italy elections likely
X PBoC Governor Zhou’s term ends
08 ECB Policy decision
09 BoJ Policy decision
18 Russia Presidential elections
22 FOMC Policy Decision
08 BoJ Governor Kuroda’s current term ends; he may get another term
26 ECB Policy decision
27 BoJ Policy decision
03 FOMC Policy Decision
14 FOMC Policy Decision
14 ECB Policy decision
15 BoJ Policy decision
01 Mexico Presidential and Parliamentary elections
26 ECB Policy decision
31 BoJ Policy decision
02 FOMC Policy Decision
24 Malaysia elections due
X Japan LDP President election where Prime Minister Abe faces challengers
13 ECB Policy decision
19 BoJ Policy decision
27 FOMC Policy decision
7 Brazil elections – 1st round
25 ECB policy decision
28 Brazil elections – 2nd round
31 BoJ policy decision
X Thailand elections due
06 US House (all 435 seats) and Senate (33 out of 100 seats) elections
09 FOMC policy decision
12-18 APEC Summit
13 ECB Policy Decision
20 FOMC Policy Decision
20 BoJ Policy Decision
DECEMBER
NOVEMBER
OCTOBER
SEPTEMBER
AUGUST
JULY
JUNE
MAY
APRIL
MARCH
FEBRUARY
JANUARY
Legend: X – Date not confirmed | ECB – European Central Bank | FOMC – Federal Open Market Committee (US) | BoJ – Bank of Japan

46 / Outlook 2018
Meet the team
Alexis Calla
Chief Investment Officer
Steve Brice
Chief Investment Strategist
Clive McDonnell
Head
Equity Investment Strategy
Aditya Monappa, CFA
Head
Asset Allocation and Portfolio Solutions
Christian Abuide
Head
Discretionary Portfolio Management
Manpreet Gill
Head
FICC Investment Strategy
Arun Kelshiker, CFA
Senior Investment Strategist
Asset Allocation and Portfolio Solutions
Daniel Lam, CFA
Senior Investment Strategist
Asset Allocation and Portfolio Solutions
Belle Chan
Senior Investment Strategist
Rajat Bhattacharya
Senior Investment Strategist
Ajay Saratchandran
Discretionary Portfolio Manager
Samuel Seah, CFA
Discretionary Portfolio Manager
Audrey Goh, CFA
Senior Investment Strategist
Asset Allocation and Portfolio Solutions
Tariq Ali, CFA
Investment Strategist
Francis Lim
Quantitative Investment Strategist
Jill Yip, CFA
Senior Investment Strategist
Abhilash Narayan
Investment Strategist
Cedric Lam
Investment Strategist
Trang Nguyen
Analyst
Asset Allocation and Portfolio Solutions
Jeff Chen
Analyst
Asset Allocation and Portfolio Solutions
DJ Cheong
Investment Strategist

47 / Outlook 2018
Contacts Information
Wealth Management, Vietnam
Do Lan Anh
Head of Wealth Management
Nguyen Anh Tuan
Associate Director,
WMPS, WM
Chu Thi Minh Anh
WMPS Dealer
Mach Khoi Tin, CFA
WMPS Dealer
Nguyen Thanh Tung, CFA
Treasury Specialist
Tran Quyen Bieu
Treasury Specialist

Outlook 2018 / 48
Investment view generation Our adaptive process
We have a robust advisory process ensuring we deliver high-quality insights and solutions to our clients.
06
Revie
w
START
Third party views as diverse as possible are curated from
leading research boutiques, banks and asset management
companies to harness the collective intelligence of our
network
OPEN-PLATFORM
INPUTS
DISCUSS &
DEBATE
Once a month, these curated questions, insights and
analysis are shared and digested by the GIC members
through a rigorous debating process to ensure full
consideration is given to the diverse perspectives
Decisions are not a consensus. Global Investment Committee (GIC) members vote anonymously on key questions and decisions to form final house views. Voting process involves a detailed questionnaire and all individual results are tracked to identify key trends associated with house views
INVESTMENT
STRATEGY
DECISIONS
The results of the vote are organised to form our “House
Views” and articulated by our Investment Strategists through
investment publications; they are communicated immediately
to all our global and local product teams
RELEVANT &
ACTIONABLE
CONVICTIONS
Our “House views” and conviction-based investment
opportunities reach our clients through our various
publications, relationship managers and investment advisors
THOROUGH
REVIEW
ADVISORY
COMMUNICATION
GIC ideas and themes are discussed with product and
country teams to formulate conviction lists of relevant
investment opportunities for our clients
COMMUNICATION
TO CLIENTS
Investment results of our house views and conviction-based
opportunities are thoroughly reviewed together with all the
quantitative data collected during the voting process
01
02
03
04
05
07
FINISH

49 / Outlook 2018
Important information
THIS IS NOT A RESEARCH REPORT AND HAS NOT BEEN PRODUCED BY A RESEARCH UNIT.
This document is not research material and it has not been prepared in accordance with legal requirements designed to promote the independence of investment
research and is not subject to any prohibition on dealing ahead of the dissemination of investment research. This document does not necessarily represent the
views of every function within Standard Chartered Bank, particularly those of the Global Research function.
Standard Chartered Bank is incorporated in England with limited liability by Royal Charter 1853 Reference Number ZC18. The Principal Office of the Company is
situated in England at 1 Basinghall Avenue, London, EC2V 5DD. Standard Chartered Bank is authorised by the Prudential Regulation Authority and regulated by
the Financial Conduct Authority and Prudential Regulation Authority.
Banking activities may be carried out internationally by different Standard Chartered Bank branches, subsidiaries and affiliates (collectively “SCB”) according to
local regulatory requirements. With respect to any jurisdiction in which there is a SCB entity, this document is distributed in such jurisdiction by, and is attributable
to, such local SCB entity. Recipients in any jurisdiction should contact the local SCB entity in relation to any matters arising from, or in connection with, this
document. Not all products and services are provided by all SCB entities.
This document is being distributed for general information only and it does not constitute an offer, recommendation or solicitation to enter into any transaction or
adopt any hedging, trading or investment strategy, in relation to any securities or other financial instruments. This document is for general evaluation only, it does
not take into account the specific investment objectives, financial situation or particular needs of any particular person or class of persons and it has not been
prepared for any particular person or class of persons.
Investment involves risks. The prices of investment products fluctuate, sometimes dramatically. The price of investment products may move up or down, and may
become valueless. It is as likely that losses will be incurred rather than profit made as a result of buying and selling investment products. You should not rely on any
contents of this document in making any investment decisions. Before making any investment, you should carefully read the relevant offering documents and seek
independent legal, tax and regulatory advice. In particular, we recommend you to seek advice regarding the suitability of the investment product, taking into
account your specific investment objectives, financial situation or particular needs, before you make a commitment to purchase the investment product.
Opinions, projections and estimates are solely those of SCB at the date of this document and subject to change without notice. Past performance is not indicative
of future results and no representation or warranty is made regarding future performance. Any forecast contained herein as to likely future movements in rates or
prices or likely future events or occurrences constitutes an opinion only and is not indicative of actual future movements in rates or prices or actual future events or
occurrences (as the case may be). This document has not been and will not be registered as a prospectus in any jurisdiction and it is not authorised by any
regulatory authority under any regulations.
SCB makes no representation or warranty of any kind, express, implied or statutory regarding, but not limited to, the accuracy of this document or the
completeness of any information contained or referred to in this document. This document is distributed on the express understanding that, whilst the information in
it is believed to be reliable, it has not been independently verified by us. SCB accepts no liability and will not be liable for any loss or damage arising directly or
indirectly (including special, incidental or consequential loss or damage) from your use of this document, howsoever arising, and including any loss, damage or
expense arising from, but not limited to, any defect, error, imperfection, fault, mistake or inaccuracy with this document, its contents or associated services, or due
to any unavailability of the document or any part thereof or any contents.
SCB, and/or a connected company, may at any time, to the extent permitted by applicable law and/or regulation, be long or short any securities, currencies or
financial instruments referred to on this document or have a material interest in any such securities or related investment, or may be the only market maker in
relation to such investments, or provide, or have provided advice, investment banking or other services, to issuers of such investments. Accordingly, SCB, its
affiliates and/or subsidiaries may have a conflict of interest that could affect the objectivity of this document. This document must not be reproduced, forwarded or
otherwise made available to any other person without the express written consent of SCB, nor should it be distributed into any other jurisdiction unless permitted by
the local laws and regulations of that jurisdiction. Neither SCB nor any of its directors, employees or agents accept any liability whatsoever for the actions of third
parties in this respect.
Copyright: Standard Chartered Bank 2017. Copyright in all materials, text, articles and information contained herein is the property of, and may only be reproduced
with permission of an authorised signatory of, Standard Chartered Bank. Copyright in materials created by third parties and the rights under copyright of such
parties are hereby acknowledged. Copyright in all other materials not belonging to third parties and copyright in these materials as a compilation vests and shall
remain at all times copyright of Standard Chartered Bank and should not be reproduced or used except for business purposes on behalf of Standard Chartered
Bank or save with the express prior written consent of an authorised signatory of Standard Chartered Bank. All rights reserved. © Standard Chartered Bank 2017.

Outlook 2018 / 50
Standard Chartered Private Bank is the private banking division of SCB. Private banking activities may be carried out internationally by different SCB legal entities
and affiliates according to local regulatory requirements. Not all products and services are provided by all SCB branches, subsidiaries and affiliates. Some of the
SCB entities and affiliates only act as representatives of the Standard Chartered Private Bank, and may not be able to offer products and services, or offer advice
to clients. They serve as points of contact only.
Country Specific Disclosures
Botswana: This document is being distributed in Botswana by, and is attributable to, Standard Chartered Bank Botswana Limited which is a financial institution
licensed under the Section 6 of the Banking Act CAP 46.04 and is listed in the Botswana Stock Exchange.
China: This document is being distributed in China by, and is attributable to, Standard Chartered Bank (China) Limited which is mainly regulated by China Banking
Regulatory Commission (CBRC), State Administration of Foreign Exchange (SAFE), and People’s Bank of China (PBOC).
Ghana: Standard Chartered Bank Ghana Limited accepts no liability and will not be liable for any loss or damage arising directly or indirectly (including special,
incidental or consequential loss or damage) from your use of these documents. Past performance is not indicative of future results and no representation or
warranty is made regarding future performance. You should seek advice from a financial adviser on the suitability of an investment for you, taking into account
these factors before making a commitment to invest in an investment. Please do not reply to this email. Call our Priority Banking on 0302610750 for any questions
or service queries. You are advised not to send any confidential and/or important information to the Bank via e-mail, as the Bank makes no representations or
warranties as to the security or accuracy of any information transmitted via e-mail. The Bank shall not be responsible for any loss or damage suffered by you
arising from your decision to use e-mail to communicate with the Bank.
Hong Kong: In Hong Kong, this document, except for any portion advising on or facilitating any decision on futures contracts trading, is distributed by Standard
Chartered Bank (Hong Kong) Limited (“SCBHK”), a subsidiary of Standard Chartered Bank. SCBHK has its registered address at 32/F, Standard Chartered Bank
Building, 4-4A Des Voeux Road Central, Hong Kong and is regulated by the Hong Kong Monetary Authority and registered with the Securities and Futures
Commission (“SFC”) to carry on Type 1 (dealing in securities), Type 4 (advising on securities), Type 6 (advising on corporate finance) and Type 9 (asset
management) regulated activity under the Securities and Futures Ordinance (Cap. 571) (“SFO”) (CE No. AJI614). The contents of this document have not been
reviewed by any regulatory authority in Hong Kong and you are advised to exercise caution in relation to any offer set out herein. If you are in doubt about any of
the contents of this document, you should obtain independent professional advice. Any product named herein may not be offered or sold in Hong Kong by means
of any document at any time other than to “professional investors” as defined in the SFO and any rules made under that ordinance. In addition, this document may
not be issued or possessed for the purposes of issue, whether in Hong Kong or elsewhere, and any interests may not be disposed of, to any person unless such
person is outside Hong Kong or is a “professional investor” as defined in the SFO and any rules made under that ordinance, or as otherwise may be permitted by
that ordinance. In Hong Kong, Standard Chartered Private Bank is the private banking division of Standard Chartered Bank (Hong Kong) Limited.
India: Standard Chartered Bank is registered with Securities and Exchange Board of India as an Investment Advisor (Registration Number: INA000002249) under
the Securities and Exchange Board of India (Investment Advisers) Regulations, 2013. You can avail of investment advisory services of Standard Chartered Bank
only upon (i) executing separate documents with the Investment Advisory Group of Standard Chartered Bank for availing 'Investment Advice’ (as defined in the
Securities and Exchange Board of India (Investment Advisers) Regulations, 2013); and (ii) paying specific fees (if applied by Standard Chartered Bank ) for such
‘Investment Advice’. Standard Chartered Bank acts as a distributor of mutual funds and referrer of other third party financial products, for which Standard Chartered
Bank receives commission / referral fees from the product provider.
Jersey: In Jersey, Standard Chartered Private Bank is the Registered Business Name of the Jersey Branch of Standard Chartered Bank. The Jersey Branch of
Standard Chartered Bank is regulated by the Jersey Financial Services Commission. Copies of the latest audited accounts of Standard Chartered Bank are
available from its principal place of business in Jersey: PO Box 80, 15 Castle Street, St Helier, Jersey JE4 8PT. Standard Chartered Bank is incorporated in
England with limited liability by Royal Charter in 1853 Reference Number ZC 18. The Principal Office of the Company is situated in England at 1 Basinghall
Avenue, London, EC2V 5DD. Standard Chartered Bank is authorised by the Prudential Regulation Authority and regulated by the Financial Conduct Authority and
Prudential Regulation Authority. The Jersey Branch of Standard Chartered Bank is also an authorised financial services provider under license number 44946
issued by the Financial Services Board of the Republic of South Africa. Jersey is not part of the United Kingdom and all business transacted with Standard
Chartered Bank, Jersey Branch and other Standard Chartered Group Offices outside of the United Kingdom, are not subject to some or any of the investor
protection and compensation schemes available under United Kingdom law.
Kenya: Investment Products and Services are distributed by Standard Chartered Investment Services Limited, a wholly owned subsidiary of Standard Chartered
Bank Kenya Limited (Standard Chartered Bank/the Bank) that is licensed by the Capital Markets Authority as a Fund Manager. Standard Chartered Bank Kenya
Limited is regulated by the Central Bank of Kenya.
Singapore SCBSL: This document is being distributed in Singapore by, and is attributable to, Standard Chartered Bank (Singapore) Limited (“SCBSL”). Recipients
in Singapore should contact SCBSL in relation to any matters arising from, or in connection with, this document. SCBSL is an indirect wholly-owned subsidiary of
Standard Chartered Bank and is licensed to conduct banking business in Singapore under the Singapore Banking Act, Chapter 19. IN RELATION TO ANY FIXED
INCOME AND STRUCTURED SECURITIES REFERRED TO IN THIS DOCUMENT (IF ANY), THIS DOCUMENT TOGETHER WITH THE ISSUER
DOCUMENTATION SHALL BE DEEMED AN INFORMATION MEMORANDUM (AS DEFINED IN SECTION 275 OF THE SECURITIES AND FUTURES ACT,
CHAPTER 289 (“SFA”). IT IS INTENDED FOR DISTRIBUTION TO ACCREDITED INVESTORS, AS DEFINED IN SECTION 4A OF THE SFA, OR ON TERMS
THAT THE SECURITIES MAY ONLY BE ACQUIRED AT A CONSIDERATION OF NOT LESS THAN S$200,000 (OR ITS EQUIVALENT IN A FOREIGN
CURRENCY) FOR EACH TRANSACTION. Further, in relation to fixed income and structured securities mentioned (if any), neither this document nor the Issuer
Documentation have been, and will not be, registered as a prospectus with the Monetary Authority of Singapore under the SFA. Accordingly, this document and
any other document or material in connection with the offer or sale, or invitation for subscription or purchase, of the product may not be circulated or distributed, nor
may the product be offered or sold, or be made the subject of an invitation for subscription or purchase, whether directly or indirectly, to persons other than a
relevant person pursuant to section 275(1) of the SFA, or any person pursuant to section 275(1A) of the SFA, and in accordance with the conditions, specified in
section 275 of the SFA, or pursuant to, and in accordance with the conditions of, any other applicable provision of the SFA. Singapore dollar deposits of non-bank
depositors are insured by the Singapore Deposit Insurance Corporation, for up to S$50,000 in aggregate per depositor per Scheme member by law. Foreign
currency deposits, dual currency investments, structured deposits and other investment products are not insured.

51 / Outlook 2018
Singapore SCB, Singapore Branch: This document is being distributed in Singapore by SCB, Singapore branch only to accredited investors, expert investors or
institutional investors, as defined in the Securities and Futures Act, Chapter 289 of Singapore. Recipients in Singapore should contact SCB, Singapore branch in
relation to any matters arising from, or in connection with, this document. In Singapore, Standard Chartered Private Bank is the Private Banking division of SCB,
Singapore branch. SCB, Singapore branch (Registration No. S16FC0027L) (GST Registration No.: MR-8500053-0) is licensed to conduct banking business under
the Banking Act, Chapter 19 of Singapore. IN RELATION TO ANY FIXED INCOME AND STRUCTURED SECURITIES REFERRED TO IN THIS DOCUMENT (IF
ANY), THIS DOCUMENT TOGETHER WITH THE ISSUER DOCUMENTATION SHALL BE DEEMED AN INFORMATION MEMORANDUM (AS DEFINED IN
SECTION 275 OF THE SFA). IT IS INTENDED FOR DISTRIBUTION TO ACCREDITED INVESTORS, AS DEFINED IN SECTION 4A OF THE SFA. Further, in
relation to fixed income and structured securities mentioned (if any), neither this document nor the Issuer Documentation have been, and will not be, registered as
a prospectus with the Monetary Authority of Singapore under the SFA. Accordingly, this document and any other document or material in connection with the offer
or sale, or invitation for subscription or purchase, of the product may not be circulated or distributed, nor may the product be offered or sold, or be made the subject
of an invitation for subscription or purchase, whether directly or indirectly, to persons other than a relevant person pursuant to section 275(1) of the SFA, and in
accordance with the conditions, specified in section 275 of the SFA, or pursuant to, and in accordance with the conditions of, any other applicable provision of the
SFA. Singapore dollar deposits of non-bank depositors are insured by the Singapore Deposit Insurance Corporation, for up to S$50,000 in aggregate per depositor
per Scheme member by law. Foreign currency deposits, dual currency investments, structured deposits and other investment products are not insured. In relation
to any collective investment schemes referred to in this document (if any), this document is for general information purposes only and is not an offering document
or prospectus (as defined in the SFA). This document is not, nor is it intended to be (i) an offer or solicitation of an offer to buy or sell any financial product; or (ii) an
advertisement of an offer or intended offer of any financial product.
Thailand: Please study the Scheme Information Documents carefully e.g. investment policy, risks, fund performance before investing.
UAE: DIFC – Standard Chartered Bank, Dubai International Financial Centre (SCB DIFC) having its offices at Dubai International Financial Centre, Building 1,
Gate Precinct, P.O. Box 999, Dubai, UAE is a branch of Standard Chartered Bank and is regulated by the Dubai Financial Services Authority (“DFSA”). This
document is intended for use only by Professional Clients and is not directed at Retail Clients as defined by the DFSA Rulebook. In the DIFC we are authorized to
provide financial services only to clients who qualify as Professional Clients and Market Counterparties and not to Retail Clients. As a Professional Client you will
not be given the higher retail client protection and compensation rights and if you use your right to be classified as a Retail Client we will be unable to provide
financial services and products to you as we do not hold the required license to undertake such activities. For Islamic transactions, we are acting under the
supervision of our Shariah Supervisory Committee. Relevant information on our Shariah Supervisory Committee is currently available on the Standard Chartered
Bank website in the Islamic banking section here.
UAE: For residents of the UAE – Standard Chartered Bank UAE does not provide financial analysis or consultation services in or into the UAE within the meaning
of UAE Securities and Commodities Authority Decision No. 48/r of 2008 concerning financial consultation and financial analysis.
Uganda: Our Investment products and services are distributed by Standard Chartered Bank Uganda Limited, which is licensed by the Capital Markets Authority as
an investment adviser.
United Kingdom: Standard Chartered Bank (trading as Standard Chartered Private Bank) is an authorised financial services provider (licence number 45747) in
terms of the South African Financial Advisory and Intermediary Services Act, 2002.
Zambia: This document is distributed by Standard Chartered Bank Zambia Plc, a company incorporated in Zambia and registered as a commercial bank and
licensed by the Bank of Zambia under the Banking and Financial Services Act Chapter 387 of the Laws of Zambia.
Market Abuse Regulation (MAR) Disclaimer
Standard Chartered Bank is incorporated in England with limited liability by Royal Charter 1853 Reference Number ZC18. The Principal Office of the Company is
situated in England at 1 Basinghall Avenue, London, EC2V 5DD. Standard Chartered Bank is authorised by the Prudential Regulation Authority and regulated by
the Financial Conduct Authority and Prudential Regulation Authority. Banking activities may be carried out internationally by different Standard Chartered Bank
branches, subsidiaries and affiliates (collectively “SCB”) according to local regulatory requirements. Opinions may contain outright "buy", "sell", "hold" or other
opinions. The time horizon of this opinion is dependent on prevailing market conditions and there is no planned frequency for updates to the opinion.
This opinion is not independent of SCB’s own trading strategies or positions. SCB and/or its affiliates or its respective officers, directors, employee benefit
programmes or employees, including persons involved in the preparation or issuance of this document may at any time, to the extent permitted by applicable law
and/or regulation, be long or short any securities or financial instruments referred to in this document or have material interest in any such securities or related
investments. Therefore, it is possible, and you should assume, that SCB has a material interest in one or more of the financial instruments mentioned herein. If
specific companies are mentioned in this communication, please note that SCB may at times do business or seek to do business with the companies covered in
this communication; hold a position in, or have economic exposure to, such companies; and/or invest in the financial products issued by these companies. Further,
SCB may be involved in activities such as dealing in, holding, acting as market makers or liquidity providers, or performing financial or advisory services including
but not limited to, lead manager or co-lead manager in relation to any of the products referred to in this communication. SCB may have received compensation for
these services and activities. Accordingly, SCB may have a conflict of interest that could affect the objectivity of this communication.
SCB has in place policies and procedures, logical access controls and physical information walls to help ensure confidential information, including material non-
public or inside information is not disclosed unless in line with its policies and procedures and the rules of its regulators.
Please refer to https://www.sc.com/en/banking-services/market-disclaimer.html for more detailed disclosures, including past opinions in the last 12 months and
conflict of interests, as well as disclaimers. This document must not be forwarded or otherwise made available to any other person without the express written
consent of SCB.
THIS IS NOT A RESEARCH REPORT AND HAS NOT BEEN PRODUCED BY A RESEARCH UNIT.
