turningpoint - office 2007otl.du.edu/.../2013/06/user-guide_turningpoint_pc.pdf · setup install...
TRANSCRIPT
User Guide

© 2011 Turning Technologies, LLC. Portions Responsive Innovations, LLC and Microsoft Corporation.
No part of this document may be reproduced or transmitted in any form or by any means, electronic or mechanical, for any purpose, without the express written permission of Turning Technologies, LLC. All rights reserved.
Turning Technologies, LLC, 255 West Federal Street, Youngstown, OH 44503 USA.
TurningPoint® is a registered trademark of Turning Technologies, LLC. Other trademarked product names mentioned in this manual are owned by their respective companies.
The following regulatory statements apply to radio frequency and XL infrared transmitters and receivers mentioned in this manual, including the ResponseCard RF, ResponseCard XL, and their respective receivers.
FCC Statement
This product has been tested and found to comply with Part 15 of the FCC Rules. Operation is subject to the following conditions: it may not cause harmful interference and must accept interference received, including interference that may cause undesired operations.
Changes or modifications not expressly approved by the party responsible for compliance could void the user’s authority to operate the equipment.
Canada Statement
This Class B digital apparatus complies with Canadian ICES-003.
Cet appareil numérique de la classe B est conforme à la norme NMB-003 du Canada.
Turning TechnologiesTurningPoint 4.3 3
Contents
1 About TurningPoint. . . . . . . . . . . . . . . . . . . . . . 7Product Introduction . . . . . . . . . . . . . . . . . . . . . . . . . . . . . . . . . 7
System Requirements . . . . . . . . . . . . . . . . . . . . . . . . . . . . . . . . 8
Requirements for Hardware . . . . . . . . . . . . . . . . . . . . . . . . . 8
Requirements for Software . . . . . . . . . . . . . . . . . . . . . . . . . . 8
Compatible Response Devices . . . . . . . . . . . . . . . . . . . . . . . 8
Setup . . . . . . . . . . . . . . . . . . . . . . . . . . . . . . . . . . . . . . . . . . . . . 9
Install TurningPoint . . . . . . . . . . . . . . . . . . . . . . . . . . . . . . . . . . 9
Configure Automatic Updates . . . . . . . . . . . . . . . . . . . . . . . . . 10
Open TurningPoint with PowerPoint . . . . . . . . . . . . . . . . . . . . 11
Tour of the TurningPoint Ribbon . . . . . . . . . . . . . . . . . . . . . . . 12
Customer Support Resources . . . . . . . . . . . . . . . . . . . . . . . . . 14
Online Assistance . . . . . . . . . . . . . . . . . . . . . . . . . . . . . . . . 14
Customer Support. . . . . . . . . . . . . . . . . . . . . . . . . . . . . . 14
2 Getting Started with TurningPoint. . . . . . . . . 15Five Steps to Presentation Success . . . . . . . . . . . . . . . . . . . . 15
Step One: Create Presentation Slides. . . . . . . . . . . . . . . . . . . 16
Step Two: Set Up the Response Devices . . . . . . . . . . . . . . . . 18
Step Three: Create a Participant List . . . . . . . . . . . . . . . . . . . 22
Step Four: Run a Presentation Session . . . . . . . . . . . . . . . . . 26
Step Five: Save Session Results . . . . . . . . . . . . . . . . . . . . . . 29
3 Creating and Saving Slides . . . . . . . . . . . . . . . 30Creating Slides . . . . . . . . . . . . . . . . . . . . . . . . . . . . . . . . . . . . 30
Insert a Slide . . . . . . . . . . . . . . . . . . . . . . . . . . . . . . . . . . . . 30
Save the Presentation Slides . . . . . . . . . . . . . . . . . . . . . . . 31
Types of Slides . . . . . . . . . . . . . . . . . . . . . . . . . . . . . . . . . . . . 32
Chart Slides . . . . . . . . . . . . . . . . . . . . . . . . . . . . . . . . . . 32
Competition Slides . . . . . . . . . . . . . . . . . . . . . . . . . . . . . 37
Template Slides . . . . . . . . . . . . . . . . . . . . . . . . . . . . . . . 44
Special Slides . . . . . . . . . . . . . . . . . . . . . . . . . . . . . . . . . 49
Insert Special Slides . . . . . . . . . . . . . . . . . . . . . . . . . . . . . . . . 57
Insert a Numeric Response Slide . . . . . . . . . . . . . . . . . . . . 57
Insert a Priority Ranking Slide. . . . . . . . . . . . . . . . . . . . . . . 58
Insert a Demographic Comparison Slide . . . . . . . . . . . . . . 60
Insert a Comparative Links Slide . . . . . . . . . . . . . . . . . . . . 62
Modify Slides . . . . . . . . . . . . . . . . . . . . . . . . . . . . . . . . . . . . . . 63
Designate a Demographic Slide . . . . . . . . . . . . . . . . . . . . . 64
Change Chart Types . . . . . . . . . . . . . . . . . . . . . . . . . . . . . . 66
Enable Zero-based Polling . . . . . . . . . . . . . . . . . . . . . . . . . 68
Identify a Correct Answer from the Settings Window . . . . . 68
Identify a Correct Answer on a TurningPoint Slide . . . . . . . 69
Turning TechnologiesTurningPoint 4.3 4
Contents
Use Keywords for Fill in the Blank Slides . . . . . . . . . . . . . . 72
Set Point Values from the Settings Window . . . . . . . . . . . . 73
Set Point Values on a TurningPoint Slide . . . . . . . . . . . . . . 77
Clear Answer Values from the Settings Window. . . . . . . . . 78
Clear Answer Values on a TurningPoint Slide . . . . . . . . . . 80
Use Speed Scoring . . . . . . . . . . . . . . . . . . . . . . . . . . . . . . . 81
Create Picture Slides . . . . . . . . . . . . . . . . . . . . . . . . . . . . . 82
Change Chart Colors . . . . . . . . . . . . . . . . . . . . . . . . . . . . . 84
Make a PowerPoint Slide Interactive by Inserting a Chart . 88
Disable Auto Scale in Charts . . . . . . . . . . . . . . . . . . . . . . . 89
Add Objects . . . . . . . . . . . . . . . . . . . . . . . . . . . . . . . . . . . . . . . 91
Add an Answer Now Indicator. . . . . . . . . . . . . . . . . . . . . . . 92
Add a Countdown Indicator. . . . . . . . . . . . . . . . . . . . . . . . . 93
Add a Countdown Sound to a Countdown Indicator . . . . . . 94
Add a Response Counter . . . . . . . . . . . . . . . . . . . . . . . . . . 96
Add a Correct Answer Indicator . . . . . . . . . . . . . . . . . . . . . 97
Add Text Messaging . . . . . . . . . . . . . . . . . . . . . . . . . . . . . . 98
Add Statistics Indicators . . . . . . . . . . . . . . . . . . . . . . . . . . 100
4 Response Device and Settings Management . . . . . . . . . . . . . . . . . . . . . . . . . 102Install Devices . . . . . . . . . . . . . . . . . . . . . . . . . . . . . . . . . . . . 104
Install Infrared Response Device Receiver . . . . . . . . . . . . 104
Install Radio Frequency Response Device Receiver . . . . 106
Obtain the ResponseWare Device Settings . . . . . . . . . . . 107
Response Device Management . . . . . . . . . . . . . . . . . . . . . . 108
Add or Update Response Device Receivers . . . . . . . . . . 108
Enable ResponseWare . . . . . . . . . . . . . . . . . . . . . . . . . . . 109
Configure PresenterCard . . . . . . . . . . . . . . . . . . . . . . . . . 110
Check Device Communication . . . . . . . . . . . . . . . . . . . . . 111
Identify the Number of Devices to be Used. . . . . . . . . . . . 113
Settings. . . . . . . . . . . . . . . . . . . . . . . . . . . . . . . . . . . . . . . . . 116
Response Device Settings . . . . . . . . . . . . . . . . . . . . . . 118
Presentation Settings . . . . . . . . . . . . . . . . . . . . . . . . . . 121
Slide Settings . . . . . . . . . . . . . . . . . . . . . . . . . . . . . . . . 129
Answer Settings . . . . . . . . . . . . . . . . . . . . . . . . . . . . . . 132
5 Track Participants and Teams . . . . . . . . . . . 133Participant List Wizard. . . . . . . . . . . . . . . . . . . . . . . . . . . . . . 133
Create a Participant List Using Participant List Wizard. . . 134
Create a Participant List from a Learning Management System . . . . . . . . . . . . . . . . . . . . . . . . . . . . . . . . . . . . . . . 139
Manage Participant Lists . . . . . . . . . . . . . . . . . . . . . . . . . . . . 140
Modify a Participant List . . . . . . . . . . . . . . . . . . . . . . . . . . 140
Turning TechnologiesTurningPoint 4.3 5
Contents
Verify Participants and Device IDs . . . . . . . . . . . . . . . . . . 146
Delete a Participant List . . . . . . . . . . . . . . . . . . . . . . . . . . 147
Print a Participant List . . . . . . . . . . . . . . . . . . . . . . . . . . . . 148
Set Up Team Competitions . . . . . . . . . . . . . . . . . . . . . . . . . . 149
Add Teams to a Participant List . . . . . . . . . . . . . . . . . . . . 149
Real-Time Registration Tool . . . . . . . . . . . . . . . . . . . . . . . . . 151
How to Use the Real-Time Registration Tool . . . . . . . . . . 151
6 Tools . . . . . . . . . . . . . . . . . . . . . . . . . . . . . . . 153Ranking Wizard . . . . . . . . . . . . . . . . . . . . . . . . . . . . . . . . . . . 153
Create Slides with the Ranking Wizard. . . . . . . . . . . . . . . 154
Standards . . . . . . . . . . . . . . . . . . . . . . . . . . . . . . . . . . . . . . . 160
Assign Standards Using a K-12 Standards List . . . . . . . . 160
Create a Custom Standards List . . . . . . . . . . . . . . . . . . . . 164
Assign Custom Standards to Slides . . . . . . . . . . . . . . . . . 168
QuestionPoint . . . . . . . . . . . . . . . . . . . . . . . . . . . . . . . . . . . . 171
Create Slides from QuestionPoint. . . . . . . . . . . . . . . . . . . 171
Conditional Branching . . . . . . . . . . . . . . . . . . . . . . . . . . . . . . 172
Set Up Conditional Branching . . . . . . . . . . . . . . . . . . . . . . 172
Parser Documents. . . . . . . . . . . . . . . . . . . . . . . . . . . . . . . . . 177
Format QTI Documents . . . . . . . . . . . . . . . . . . . . . . . . 178
Format XML Documents. . . . . . . . . . . . . . . . . . . . . . . . 179
Format Word Documents . . . . . . . . . . . . . . . . . . . . . . . 182
Format Excel Documents . . . . . . . . . . . . . . . . . . . . . . . 184
Import Slides . . . . . . . . . . . . . . . . . . . . . . . . . . . . . . . . . . . . . 186
Import Slides with the TurningPoint Parser. . . . . . . . . . . . 186
Import Slides from TestingPoint . . . . . . . . . . . . . . . . . . . . 187
7 Run Presentations. . . . . . . . . . . . . . . . . . . . . 188Run a Presentation . . . . . . . . . . . . . . . . . . . . . . . . . . . . . . . . 188
Establish the Presentation Settings . . . . . . . . . . . . . . . . . 189
Run the Slide Show. . . . . . . . . . . . . . . . . . . . . . . . . . . . . . 192
View a Response Grid . . . . . . . . . . . . . . . . . . . . . . . . . . . 195
Use the Participant Monitor. . . . . . . . . . . . . . . . . . . . . . . . 196
Add Slides During a Presentation Session . . . . . . . . . . . . 197
Use Data Slicing (View Results by Question) . . . . . . . . . . 199
8 Reports . . . . . . . . . . . . . . . . . . . . . . . . . . . . . 202View a Report . . . . . . . . . . . . . . . . . . . . . . . . . . . . . . . . . . . . 202
View a Report . . . . . . . . . . . . . . . . . . . . . . . . . . . . . . . . . . 203
Types of Reports . . . . . . . . . . . . . . . . . . . . . . . . . . . . . . . . . . 207
Results by Question Reports . . . . . . . . . . . . . . . . . . . . 208
Demographic Reports . . . . . . . . . . . . . . . . . . . . . . . . . . 209
Participant Results Reports . . . . . . . . . . . . . . . . . . . . . 210
Turning TechnologiesTurningPoint 4.3 6
Contents
Results by Participant Reports . . . . . . . . . . . . . . . . . . . 211
Participant List Reports. . . . . . . . . . . . . . . . . . . . . . . . . 212
Standards Reports . . . . . . . . . . . . . . . . . . . . . . . . . . . . 213
Comparative Scoring Reports. . . . . . . . . . . . . . . . . . . . 214
Team Scoring Reports . . . . . . . . . . . . . . . . . . . . . . . . . 215
Percentile Reports . . . . . . . . . . . . . . . . . . . . . . . . . . . . 216
Other Reports . . . . . . . . . . . . . . . . . . . . . . . . . . . . . . . . 217
9 Sessions . . . . . . . . . . . . . . . . . . . . . . . . . . . . . 219Manage and Edit Sessions . . . . . . . . . . . . . . . . . . . . . . . . . . 219
Save Results from a Session . . . . . . . . . . . . . . . . . . . . . . 220
Change the Default Save Location . . . . . . . . . . . . . . . . . . 221
Continue a Previously Saved Session . . . . . . . . . . . . . . . 223
Edit Session Data . . . . . . . . . . . . . . . . . . . . . . . . . . . . . . . 224
Delete Results from a Session . . . . . . . . . . . . . . . . . . . . . 227
10 Export . . . . . . . . . . . . . . . . . . . . . . . . . . . . . 228Export Session Data . . . . . . . . . . . . . . . . . . . . . . . . . . . . . . . 229
Export Session Data as a CSV File. . . . . . . . . . . . . . . . . . . . 235
Export Results Data to a Learning ManagementSystem (LMS) . . . . . . . . . . . . . . . . . . . . . . . . . . . . . . . . . . . . 235
Merge Participant List . . . . . . . . . . . . . . . . . . . . . . . . . . . . . . 236
Merge Session Files . . . . . . . . . . . . . . . . . . . . . . . . . . . . . . . 237
Extract Participant List. . . . . . . . . . . . . . . . . . . . . . . . . . . . . . 239
Extract PowerPoint Presentation. . . . . . . . . . . . . . . . . . . . . . 240
Extract Session Data as XML . . . . . . . . . . . . . . . . . . . . . . . . 241
E-mail Session. . . . . . . . . . . . . . . . . . . . . . . . . . . . . . . . . . . . 242
Turning TechnologiesTurningPoint 4.3 7
Chapter 1: About TurningPoint
About TurningPoint
Welcome to TurningPoint, the easiest, most powerful, fully interactive group response system available. For use with PowerPoint, TurningPoint enables an audience to use response devices to provide instant feedback to a speaker.
TurningPoint then gathers the responses and quickly translates the results into test scores, charts, and graphs. It also can store the data for future reference.
This chapter provides an overview of the product and includes the system requirements, installation instructions, and customer support resources.
Product Introduction
TurningPoint smoothly integrates with PowerPoint to create a more interactive and memorable presentation. TurningPoint was designed to run on Office 2003, Office 2007 and Office 2010. (Find additional information in System Requirements on page 8.)
Once installed, TurningPoint options are accessed through the TurningPoint Ribbon, which can be found in PowerPoint beneath the standard PowerPoint Ribbon. This ribbon displays the options to create interactive slides, set up and run a presentation, and generate reports.
Other TurningPoint features include participant monitoring and reporting tools. TurningPoint also provides the ability to connect to an educational institution’s WebCT, Blackboard or Sakai server or other LMS solution to streamline creating Participant Lists and reporting classroom results and grades.
Additionally, TurningPoint is available in multiple languages. Customers may download a language pack from www.TurningTechnologies.com.

Turning TechnologiesTurningPoint 4.3 8
Chapter 1: About TurningPoint
System Requirements
TurningPoint is designed to function on most computers; however, there are some hardware and software requirements:
Requirements for Hardware
The following hardware specifications are required before installing TurningPoint:
• Intel or AMD 600 MHz class processor (1 GHz or higher recommended)
• 256 MB RAM (256 MB or more of “available” RAM recommended)
• 60 MB hard disk space (an additional 32 MB is required if you do not have Microsoft .NET Framework 2.0 installed)
• 1024x768 resolution at 32-bit color or higher
• Standard USB 1.1/2.0 port
• Ethernet or 802.11 compatible wireless network card (for ResponseWare use)
Requirements for Software
The following software applications are required before installing TurningPoint:
• Microsoft Windows 32-bit or 64-bit XP, Vista, or Windows 7.
• Microsoft Office XP, 2003, 2007, or 2010
• Microsoft .NET 2.0 or higher
Compatible Response Devices
The following response devices are compatible with TurningPoint.
• ResponseCard RF or IR
• ResponseCard XR
• ResponseCard NXT
• ResponseWare
Turning TechnologiesTurningPoint 4.3 9
Chapter 1: About TurningPoint
Setup
Install TurningPoint
Follow the steps below to install TurningPoint.
Before You BeginCheck the hardware and software specifications outlined in System Requirements on page 8.
To install TurningPoint software…
1 Install TurningPoint in one of two ways:
• Download the latest edition of TurningPoint from the Turning Technologies web site.
The Turning Technologies web site is located at http://www.turningtechnologies.com. Click the Download button to the right of the screen and select the TurningPoint link. Complete the download request form and click Submit. Select the TurningPoint link on the next page and save the file to your computer. When the download is complete, double-click the setup icon to launch the InstallShield Wizard.
• Or install from a CD. Insert the CD into the computer. The InstallShield Wizard launches automatically.
2 Click Next.
A window opens and displays the license agreement. Read the license agreement on the screen or click the Print button to send the text to a printer.
3 Select the button labeled “I accept the terms in the license agreement” if you accept the terms.
Accepting the terms of the license agreement permits you to continue to install TurningPoint.
4 Click Next.
A window opens and displays customer information entry fields.
5 Enter your name and organization in the fields.
6 Click Next.
A window opens and displays a message that the computer is ready to install TurningPoint.
7 Click Install.
The computer installs TurningPoint and displays the Finish button on the page when the process is complete.
8 Click Finish.
Select the Launch TurningPoint checkbox if you would like to immediately open the program or double-click the TurningPoint shortcut on the desktop to open the program.
Turning TechnologiesTurningPoint 4.3 10
Chapter 1: About TurningPoint
Configure Automatic Updates
TurningPoint has a new update feature which allows you to update the software without having to uninstall it first. The update feature can also be configured to check for updates each time TurningPoint is opened.
Before You BeginYou must have an active internet connection to check for software updates.
1 Open TurningPoint.
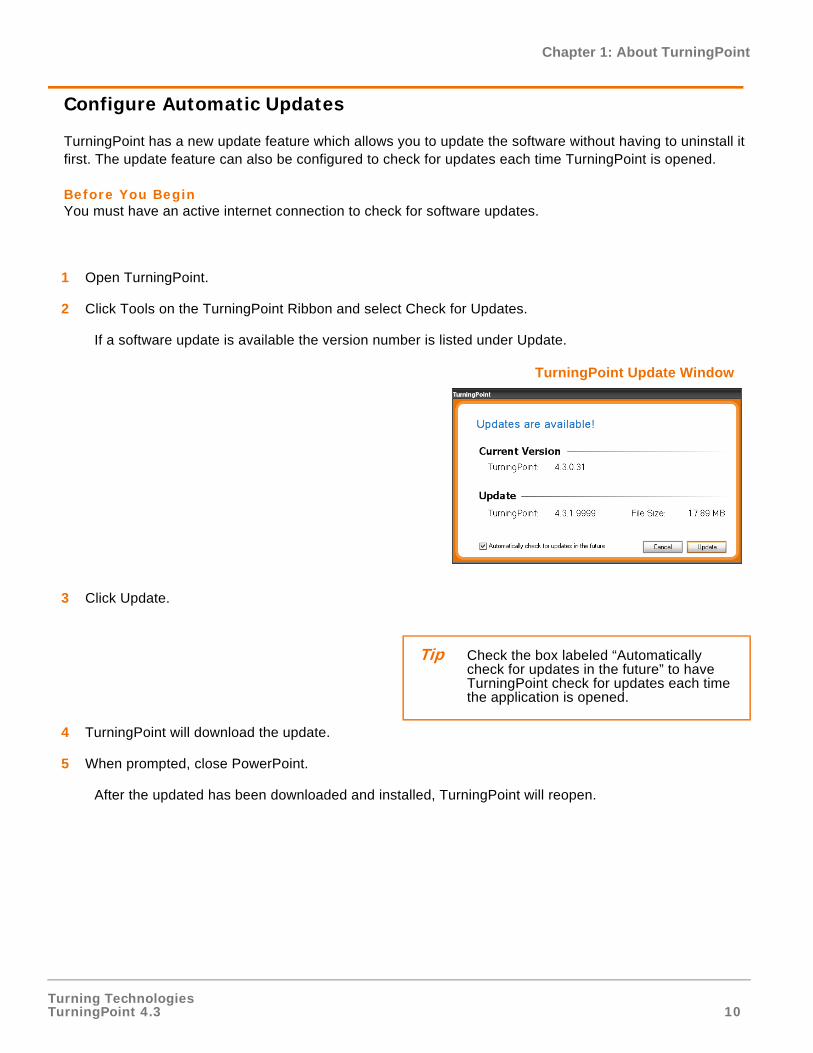
2 Click Tools on the TurningPoint Ribbon and select Check for Updates.
If a software update is available the version number is listed under Update.
TurningPoint Update Window
3 Click Update.
4 TurningPoint will download the update.
5 When prompted, close PowerPoint.
After the updated has been downloaded and installed, TurningPoint will reopen.
Tip Check the box labeled “Automatically check for updates in the future” to have TurningPoint check for updates each time the application is opened.
Turning TechnologiesTurningPoint 4.3 11
Chapter 1: About TurningPoint
Open TurningPoint with PowerPoint
After you install TurningPoint, you can configure it to open automatically when PowerPoint starts.
To toggle the option to automatically load TurningPoint...
1 Double-click the TurningPoint icon.
2 Click Tools on the TurningPoint Ribbon and select Settings.
3 Select Presentation from the Settings Hierarchy.
A specific list of settings options displays in the menu.
4 Scroll down until you see the Misc settings.
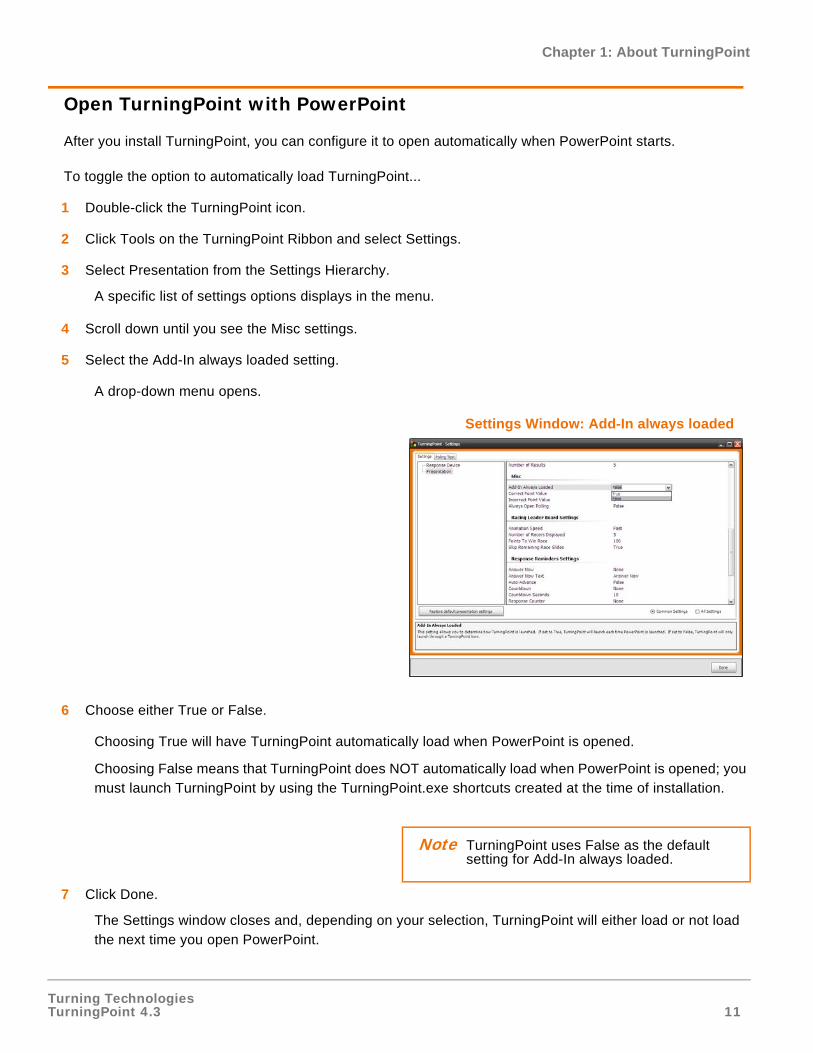
5 Select the Add-In always loaded setting.
A drop-down menu opens.
Settings Window: Add-In always loaded
6 Choose either True or False.
Choosing True will have TurningPoint automatically load when PowerPoint is opened.
Choosing False means that TurningPoint does NOT automatically load when PowerPoint is opened; you must launch TurningPoint by using the TurningPoint.exe shortcuts created at the time of installation.
7 Click Done.
The Settings window closes and, depending on your selection, TurningPoint will either load or not load the next time you open PowerPoint.
Note TurningPoint uses False as the default setting for Add-In always loaded.
Turning TechnologiesTurningPoint 4.3 12
Chapter 1: About TurningPoint
Tour of the TurningPoint Ribbon
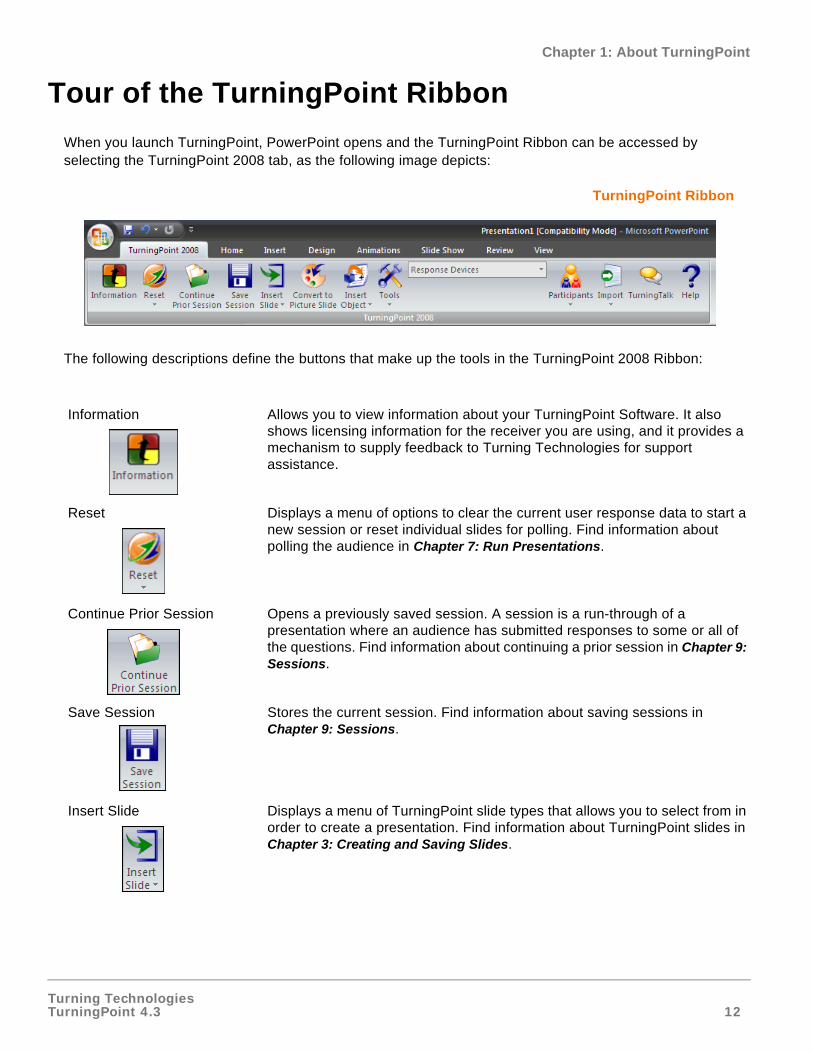
When you launch TurningPoint, PowerPoint opens and the TurningPoint Ribbon can be accessed by selecting the TurningPoint 2008 tab, as the following image depicts:
TurningPoint Ribbon
The following descriptions define the buttons that make up the tools in the TurningPoint 2008 Ribbon:
Information Allows you to view information about your TurningPoint Software. It also shows licensing information for the receiver you are using, and it provides a mechanism to supply feedback to Turning Technologies for support assistance.
Reset Displays a menu of options to clear the current user response data to start a new session or reset individual slides for polling. Find information about polling the audience in Chapter 7: Run Presentations.
Continue Prior Session Opens a previously saved session. A session is a run-through of a presentation where an audience has submitted responses to some or all of the questions. Find information about continuing a prior session in Chapter 9: Sessions.
Save Session Stores the current session. Find information about saving sessions in Chapter 9: Sessions.
Insert Slide Displays a menu of TurningPoint slide types that allows you to select from in order to create a presentation. Find information about TurningPoint slides in Chapter 3: Creating and Saving Slides.
Turning TechnologiesTurningPoint 4.3 13
Chapter 1: About TurningPoint
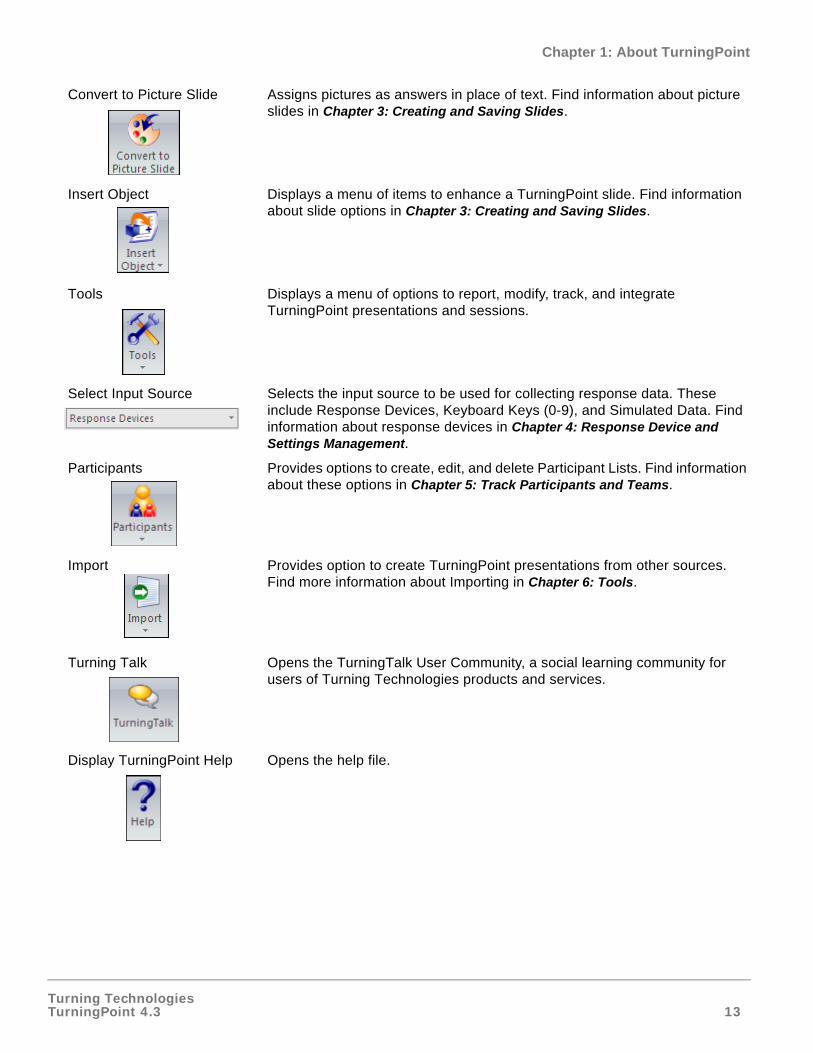
Convert to Picture Slide Assigns pictures as answers in place of text. Find information about picture slides in Chapter 3: Creating and Saving Slides.
Insert Object Displays a menu of items to enhance a TurningPoint slide. Find information about slide options in Chapter 3: Creating and Saving Slides.
Tools Displays a menu of options to report, modify, track, and integrate TurningPoint presentations and sessions.
Select Input Source Selects the input source to be used for collecting response data. These include Response Devices, Keyboard Keys (0-9), and Simulated Data. Find information about response devices in Chapter 4: Response Device and Settings Management.
Participants Provides options to create, edit, and delete Participant Lists. Find information about these options in Chapter 5: Track Participants and Teams.
Import Provides option to create TurningPoint presentations from other sources. Find more information about Importing in Chapter 6: Tools.
Turning Talk Opens the TurningTalk User Community, a social learning community for users of Turning Technologies products and services.
Display TurningPoint Help Opens the help file.
Turning TechnologiesTurningPoint 4.3 14
Chapter 1: About TurningPoint
Customer Support Resources
If you have questions or concerns, additional resources are available online or by calling a Turning Technologies representative.
Online Assistance
Turning Technologies offers online assistance through its web site at http://www.turningtechnologies.com.
Go to the Product Guides and Manuals section of the web site to find more information about using TurningPoint, such as the Quick Start Guide.
Go to the Product Training section of the Turning Technologies web site under Support to find:
• Tutorials
• Online Training
• Onsite Training
• Case Studies
• Presentations
Customer Support
Turning Technologies Customer Service Department offers technical support, which is available Monday - Friday, 7am - 9pm EST. From within the continental United States, call Customer Service toll-free at 1 866 746 3015. If calling from outside the United States, call +(1) 330 746 3015. Customer Service also may be reached via e-mail at [email protected]. Please note that it may take up to 2 business days for a reply if contacted via e-mail.
Mailing Address:
Turning Technologies 255 West Federal Street Youngstown, OH 44503
Turning Technologies offers complete TurningPoint training. Our trainers are available for onsite training at your location, or you may send your team to our training facility in Ohio.
Typical training sessions last from two to six hours, depending on your intended use of TurningPoint and skill level with Microsoft Office products. For Training Services, call 1 866 746 3015 for details.
Turning TechnologiesTurningPoint 4.3 15
Chapter 2: Getting Started with TurningPoint
Getting Started with TurningPoint
The process to create interactive presentations with TurningPoint is very simple. This chapter describes how to successfully build, deliver, and save the results of an interactive presentation in five easy steps.
Five Steps to Presentation Success
Creating an interactive presentation with TurningPoint can be accomplished in five easy steps.
This section describes the five steps to success:
• Step One: Create Presentation Slides
• Step Two: Set Up the Response Devices
• Step Three: Create a Participant List
• Step Four: Run a Presentation Session
• Step Five: Save Session Results
Note The steps below outline the suggested approach to presentation success; however, you are not required to perform the steps in this order, and you may omit steps that do not apply to you.
Turning TechnologiesTurningPoint 4.3 16
Chapter 2: Getting Started with TurningPoint
Step One: Create Presentation Slides
Using TurningPoint to create an interactive presentation requires basic PowerPoint knowledge, such as creating slides. You can add TurningPoint objects to the slides to allow participants to interact with the presentation. TurningPoint’s objects include Answer Now prompts, Countdown and Response Counter shapes.
Before You BeginInstall TurningPoint on the machine to be used to run the presentation.
To create a simple slide…
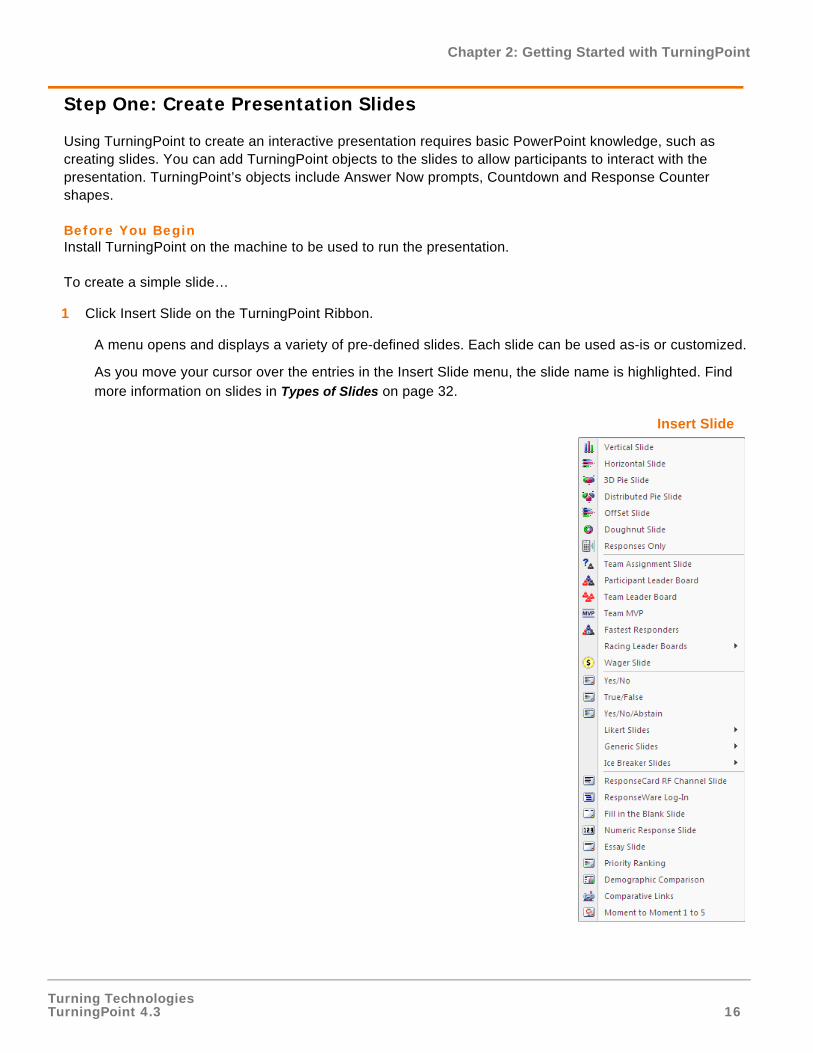
1 Click Insert Slide on the TurningPoint Ribbon.
A menu opens and displays a variety of pre-defined slides. Each slide can be used as-is or customized.
As you move your cursor over the entries in the Insert Slide menu, the slide name is highlighted. Find more information on slides in Types of Slides on page 32.
Insert Slide
Turning TechnologiesTurningPoint 4.3 17
Chapter 2: Getting Started with TurningPoint
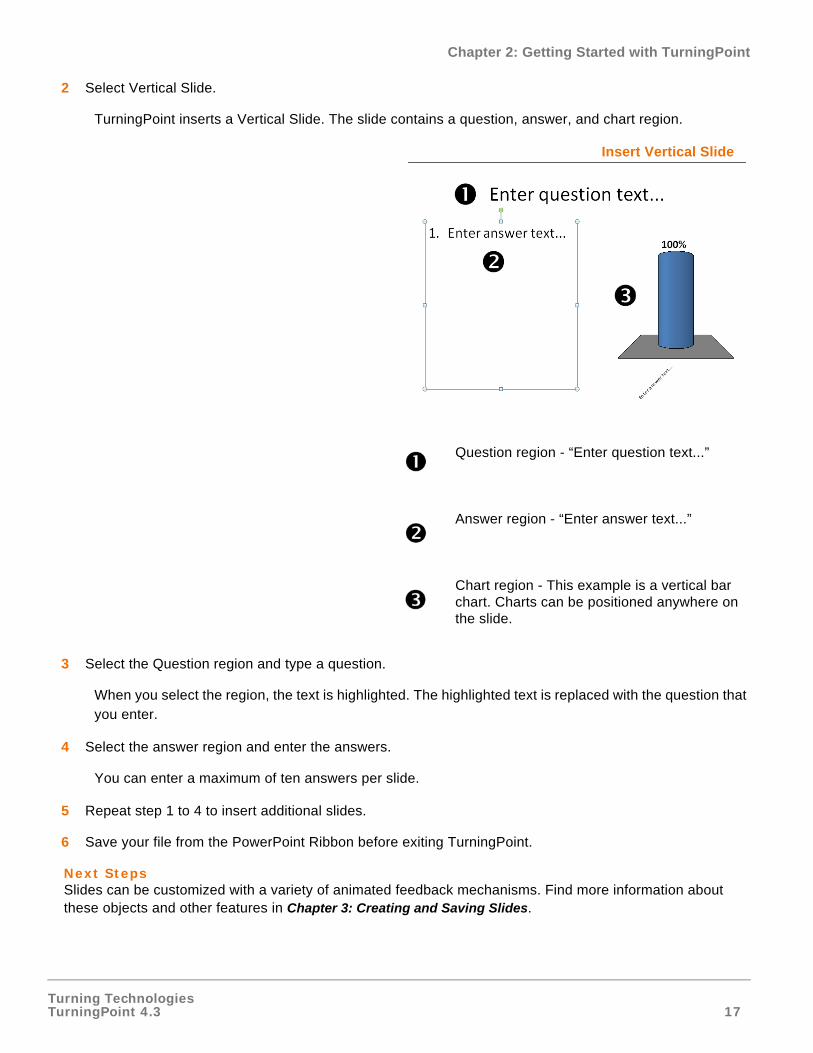
2 Select Vertical Slide.
TurningPoint inserts a Vertical Slide. The slide contains a question, answer, and chart region.
Insert Vertical Slide
3 Select the Question region and type a question.
When you select the region, the text is highlighted. The highlighted text is replaced with the question that you enter.
4 Select the answer region and enter the answers.
You can enter a maximum of ten answers per slide.
5 Repeat step 1 to 4 to insert additional slides.
6 Save your file from the PowerPoint Ribbon before exiting TurningPoint.
Next StepsSlides can be customized with a variety of animated feedback mechanisms. Find more information about these objects and other features in Chapter 3: Creating and Saving Slides.
Question region - “Enter question text...”
Answer region - “Enter answer text...”
Chart region - This example is a vertical bar chart. Charts can be positioned anywhere on the slide.

Turning TechnologiesTurningPoint 4.3 18
Chapter 2: Getting Started with TurningPoint
Step Two: Set Up the Response Devices
Each audience participant uses a response device to respond to the questions asked during the presentation.
TurningPoint supports a variety of response devices including infrared and radio frequency ResponseCards as well as ResponseWare.
Before You BeginTurningPoint must be installed on the computer to be used for the presentations. You also must have the USB Response Device Receivers and Response Devices available for testing.
To set up the response devices…
1 Connect the device receiver to the USB port of the presentation computer.
Connect the USB Response Device Receiver to your computer. Windows detects the receiver and installs the proper drivers. The device is now ready for use.
Infrared and Radio Frequency Response Device Receivers
If you are using a response device licensed for TurningPoint 2003 or 2006, you must upgrade the license code for the receiver. Contact your Account Executive to receive a new license code for TurningPoint version 4.0 and higher.
2 If required, Upgrade your Response Device. Otherwise, go step 3.
Note TurningPoint supports only the ResponseCard family of keypads.
Turning TechnologiesTurningPoint 4.3 19
Chapter 2: Getting Started with TurningPoint
If you have not already upgraded your response device receiver, you must complete this step.
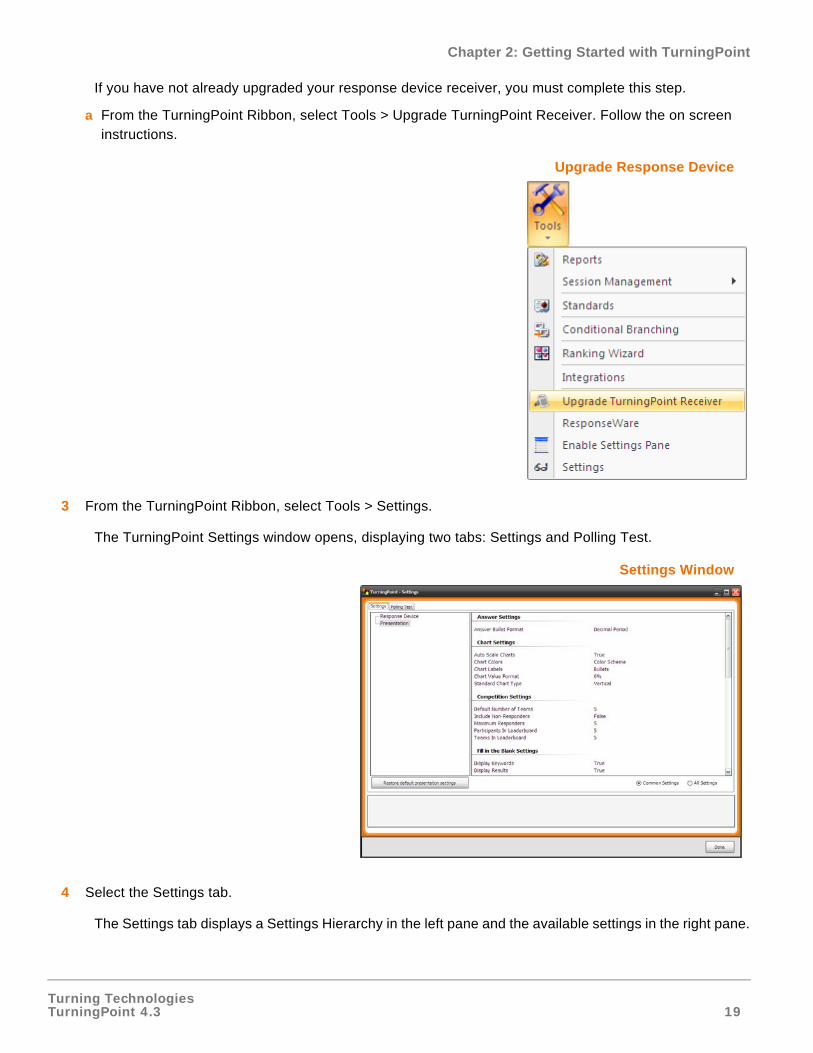
a From the TurningPoint Ribbon, select Tools > Upgrade TurningPoint Receiver. Follow the on screen instructions.
Upgrade Response Device
3 From the TurningPoint Ribbon, select Tools > Settings.
The TurningPoint Settings window opens, displaying two tabs: Settings and Polling Test.
Settings Window
4 Select the Settings tab.
The Settings tab displays a Settings Hierarchy in the left pane and the available settings in the right pane.
Turning TechnologiesTurningPoint 4.3 20
Chapter 2: Getting Started with TurningPoint
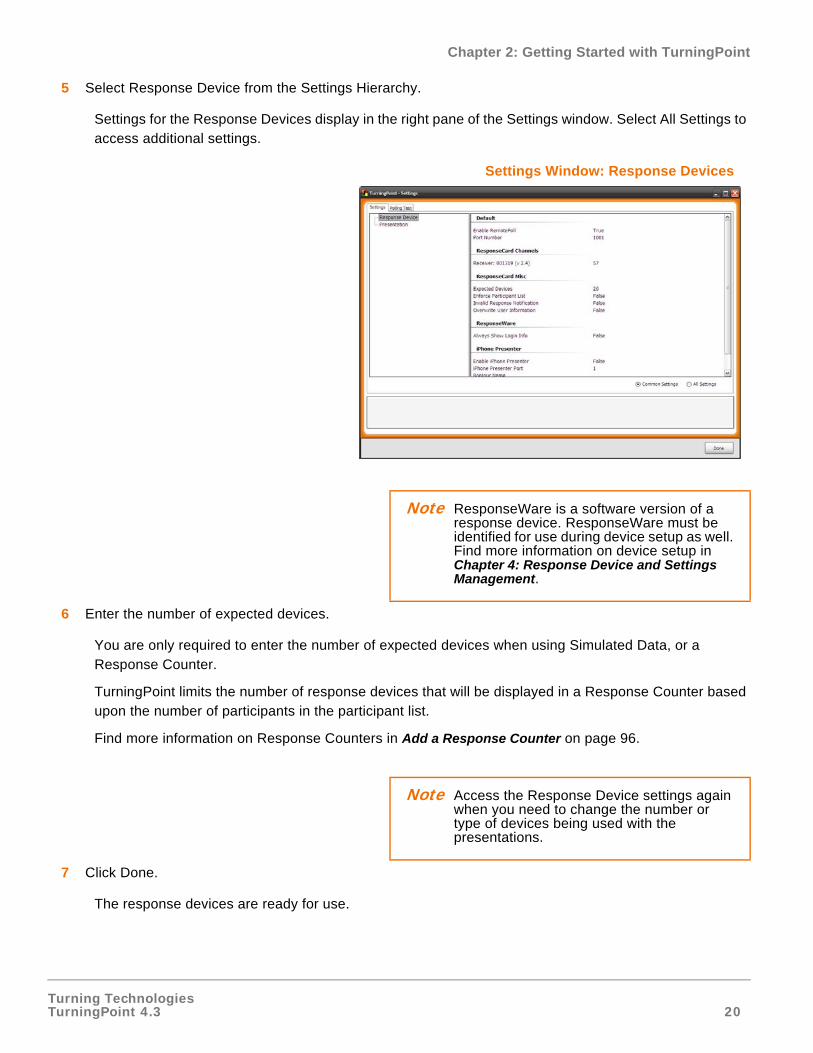
5 Select Response Device from the Settings Hierarchy.
Settings for the Response Devices display in the right pane of the Settings window. Select All Settings to access additional settings.
Settings Window: Response Devices
6 Enter the number of expected devices.
You are only required to enter the number of expected devices when using Simulated Data, or a Response Counter.
TurningPoint limits the number of response devices that will be displayed in a Response Counter based upon the number of participants in the participant list.
Find more information on Response Counters in Add a Response Counter on page 96.
7 Click Done.
The response devices are ready for use.
Note ResponseWare is a software version of a response device. ResponseWare must be identified for use during device setup as well. Find more information on device setup in Chapter 4: Response Device and Settings Management.
Note Access the Response Device settings again when you need to change the number or type of devices being used with the presentations.
Turning TechnologiesTurningPoint 4.3 21
Chapter 2: Getting Started with TurningPoint
Next StepsFind more information about Response Devices and the Settings available in the TurningPoint User Guide in Chapter 4: Response Device and Settings Management.
If an audience member’s device is not being accepted, check the device’s ability to communicate. Radio Frequency and ResponseWare response devices provide on-screen confirmation that responses have been received. For infrared response devices, the use of a Response Counter, or Response Grid will help to alert you of a non-communicating device. Find more information in Add a Response Counter on page 96, orView a Response Grid on page 195.
To Check Device Communication...
1 From the TurningPoint Ribbon, select Tools > Settings.
The TurningPoint Settings window opens, displaying two tabs: Settings and Polling Test.
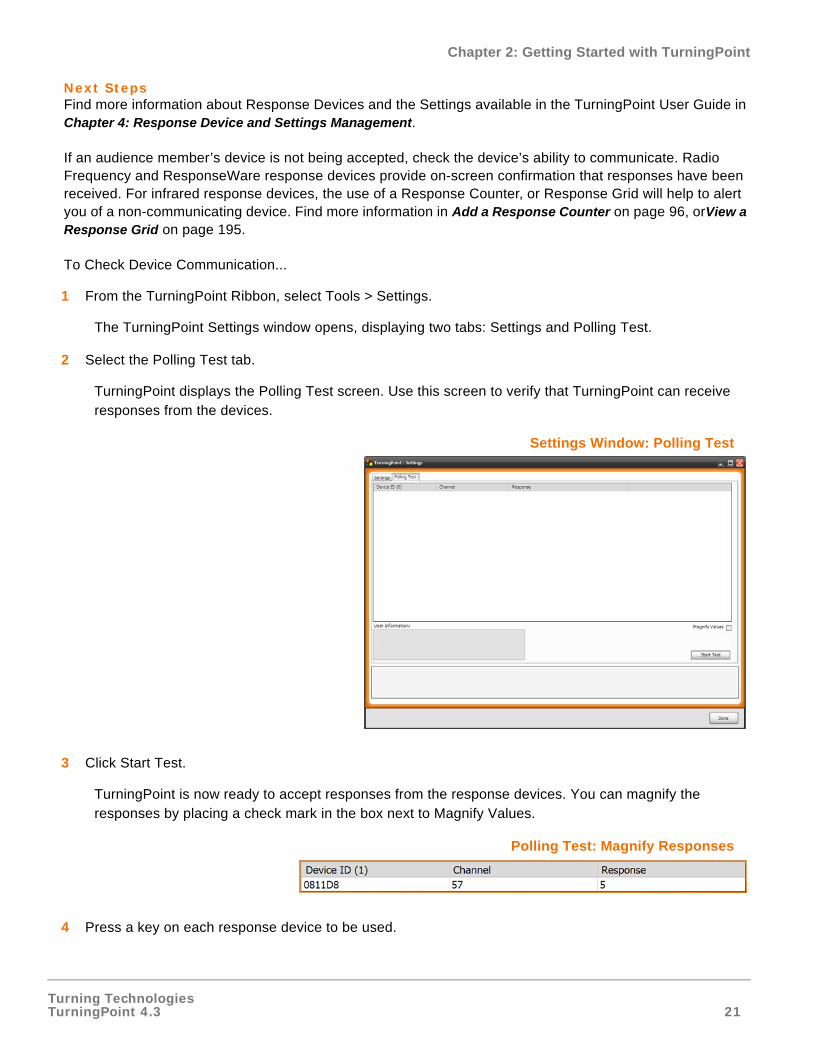
2 Select the Polling Test tab.
TurningPoint displays the Polling Test screen. Use this screen to verify that TurningPoint can receive responses from the devices.
Settings Window: Polling Test
3 Click Start Test.
TurningPoint is now ready to accept responses from the response devices. You can magnify the responses by placing a check mark in the box next to Magnify Values.
Polling Test: Magnify Responses
4 Press a key on each response device to be used.
Turning TechnologiesTurningPoint 4.3 22
Chapter 2: Getting Started with TurningPoint
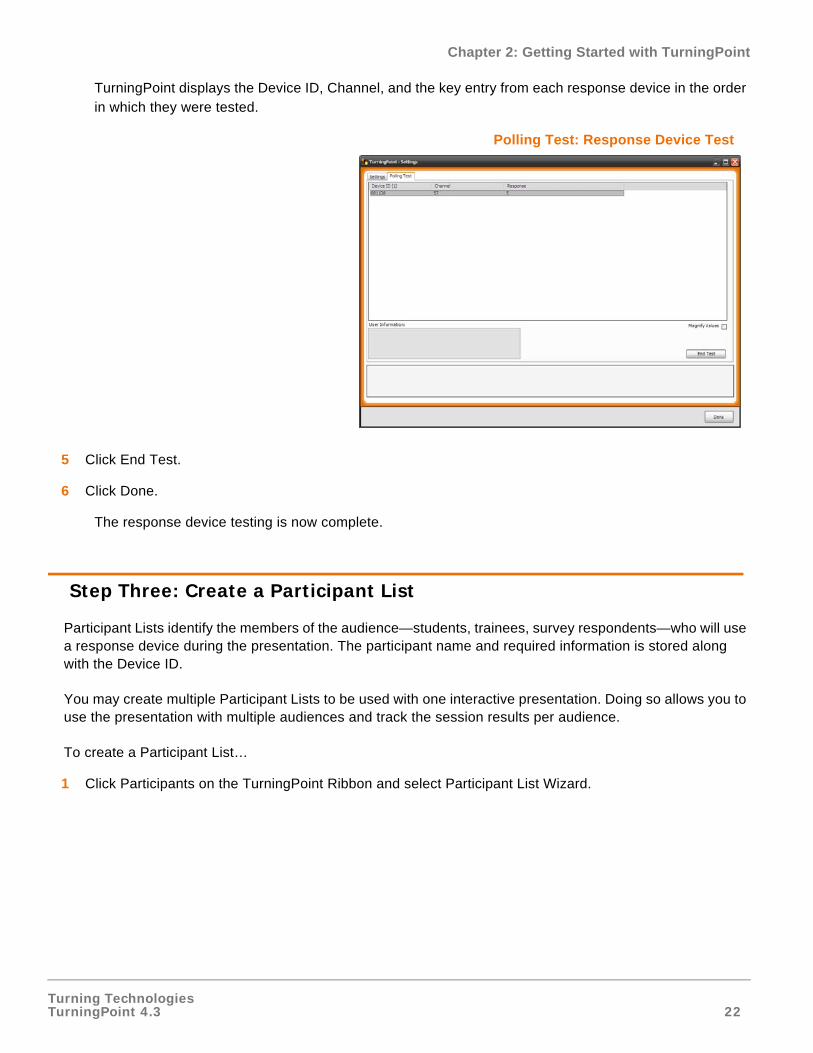
TurningPoint displays the Device ID, Channel, and the key entry from each response device in the order in which they were tested.
Polling Test: Response Device Test
5 Click End Test.
6 Click Done.
The response device testing is now complete.
Step Three: Create a Participant List
Participant Lists identify the members of the audience—students, trainees, survey respondents—who will use a response device during the presentation. The participant name and required information is stored along with the Device ID.
You may create multiple Participant Lists to be used with one interactive presentation. Doing so allows you to use the presentation with multiple audiences and track the session results per audience.
To create a Participant List…
1 Click Participants on the TurningPoint Ribbon and select Participant List Wizard.
Turning TechnologiesTurningPoint 4.3 23
Chapter 2: Getting Started with TurningPoint
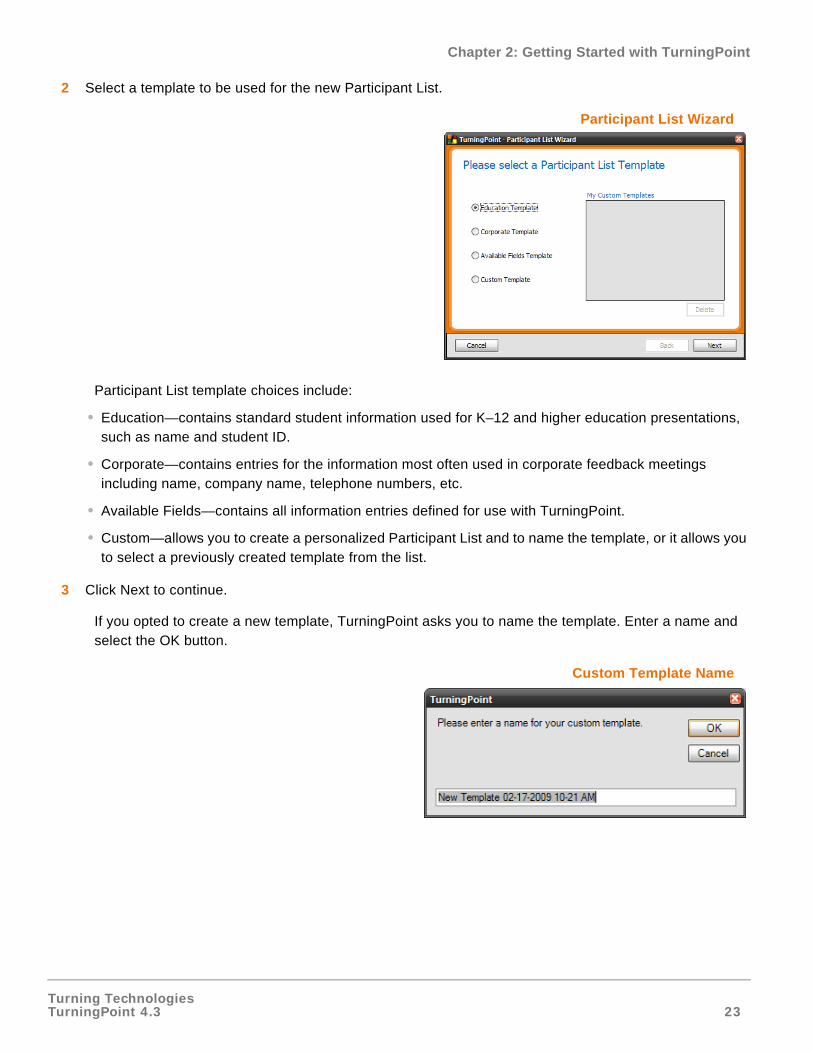
2 Select a template to be used for the new Participant List.
Participant List Wizard
Participant List template choices include:
• Education—contains standard student information used for K–12 and higher education presentations, such as name and student ID.
• Corporate—contains entries for the information most often used in corporate feedback meetings including name, company name, telephone numbers, etc.
• Available Fields—contains all information entries defined for use with TurningPoint.
• Custom—allows you to create a personalized Participant List and to name the template, or it allows you to select a previously created template from the list.
3 Click Next to continue.
If you opted to create a new template, TurningPoint asks you to name the template. Enter a name and select the OK button.
Custom Template Name
Turning TechnologiesTurningPoint 4.3 24
Chapter 2: Getting Started with TurningPoint
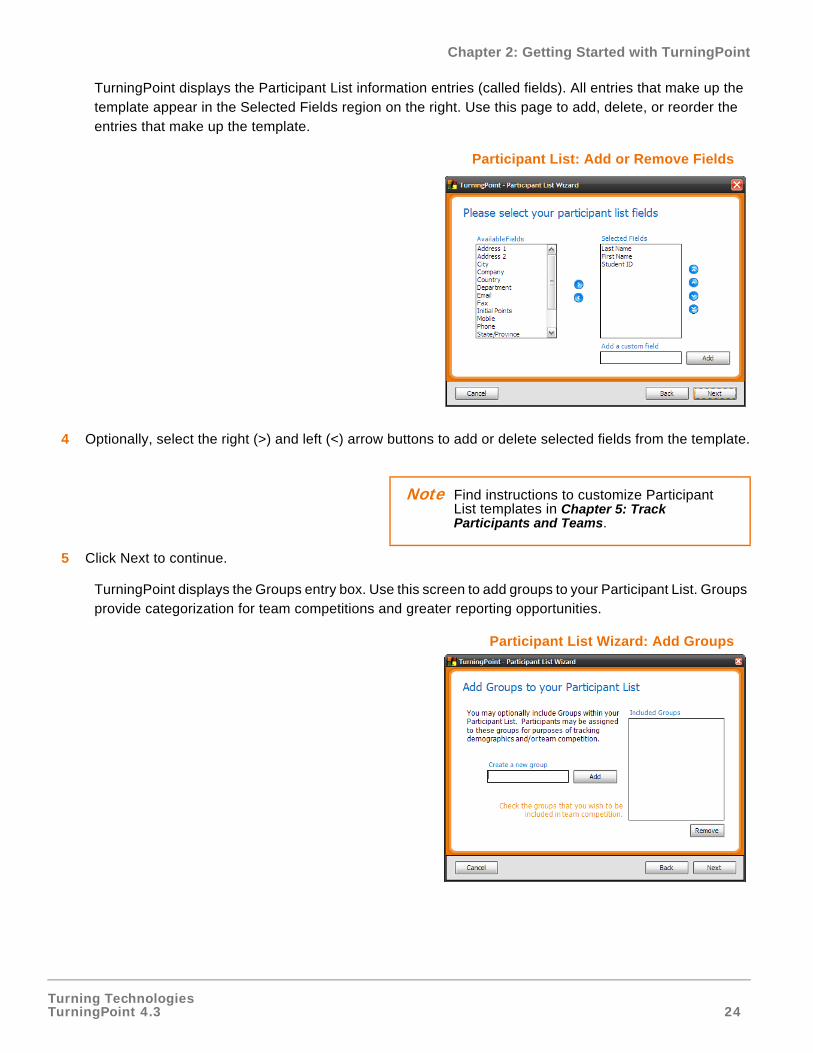
TurningPoint displays the Participant List information entries (called fields). All entries that make up the template appear in the Selected Fields region on the right. Use this page to add, delete, or reorder the entries that make up the template.
Participant List: Add or Remove Fields
4 Optionally, select the right (>) and left (<) arrow buttons to add or delete selected fields from the template.
5 Click Next to continue.
TurningPoint displays the Groups entry box. Use this screen to add groups to your Participant List. Groups provide categorization for team competitions and greater reporting opportunities.
Participant List Wizard: Add Groups
Note Find instructions to customize Participant List templates in Chapter 5: Track Participants and Teams.
Turning TechnologiesTurningPoint 4.3 25
Chapter 2: Getting Started with TurningPoint
6 Optionally, enter a group name and click Add.
TurningPoint displays all groups in the Included Groups box. Place a check mark next to the group name to include it in team competition. Find more information on team competitions in Set Up Team
Competitions on page 149.
• Repeat this step to add additional groups.
7 Click Next.
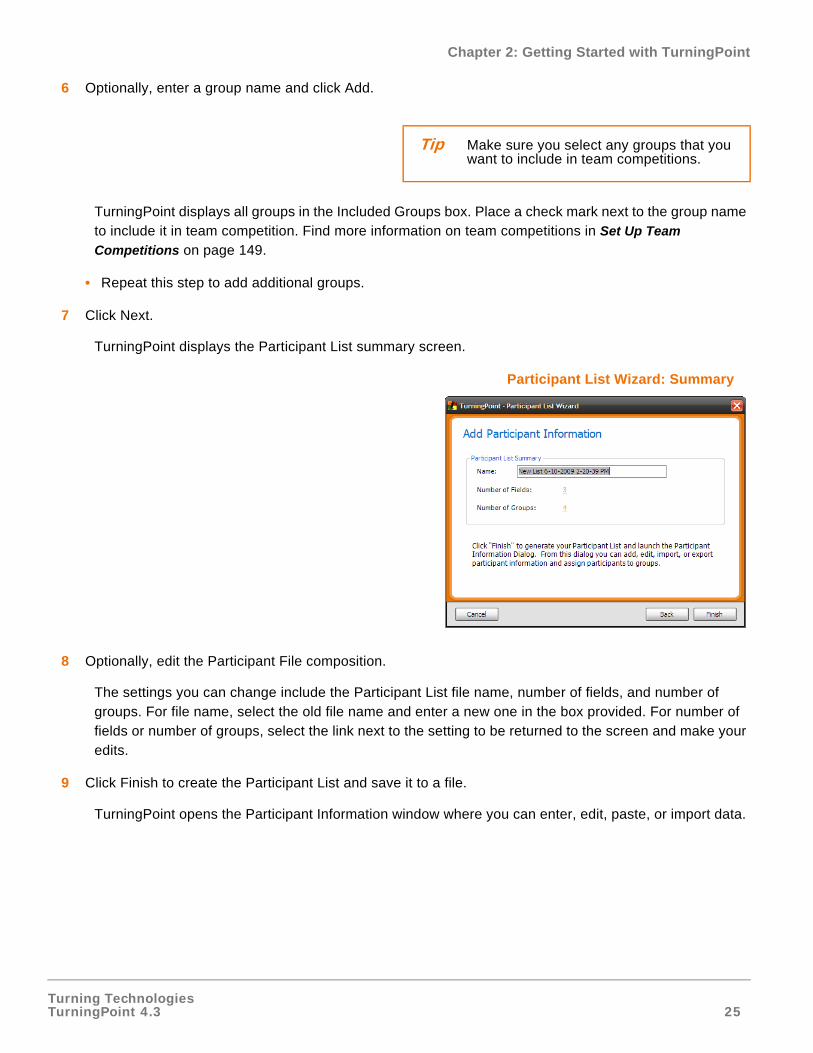
TurningPoint displays the Participant List summary screen.
Participant List Wizard: Summary
8 Optionally, edit the Participant File composition.
The settings you can change include the Participant List file name, number of fields, and number of groups. For file name, select the old file name and enter a new one in the box provided. For number of fields or number of groups, select the link next to the setting to be returned to the screen and make your edits.
9 Click Finish to create the Participant List and save it to a file.
TurningPoint opens the Participant Information window where you can enter, edit, paste, or import data.
Tip Make sure you select any groups that you want to include in team competitions.
Turning TechnologiesTurningPoint 4.3 26
Chapter 2: Getting Started with TurningPoint
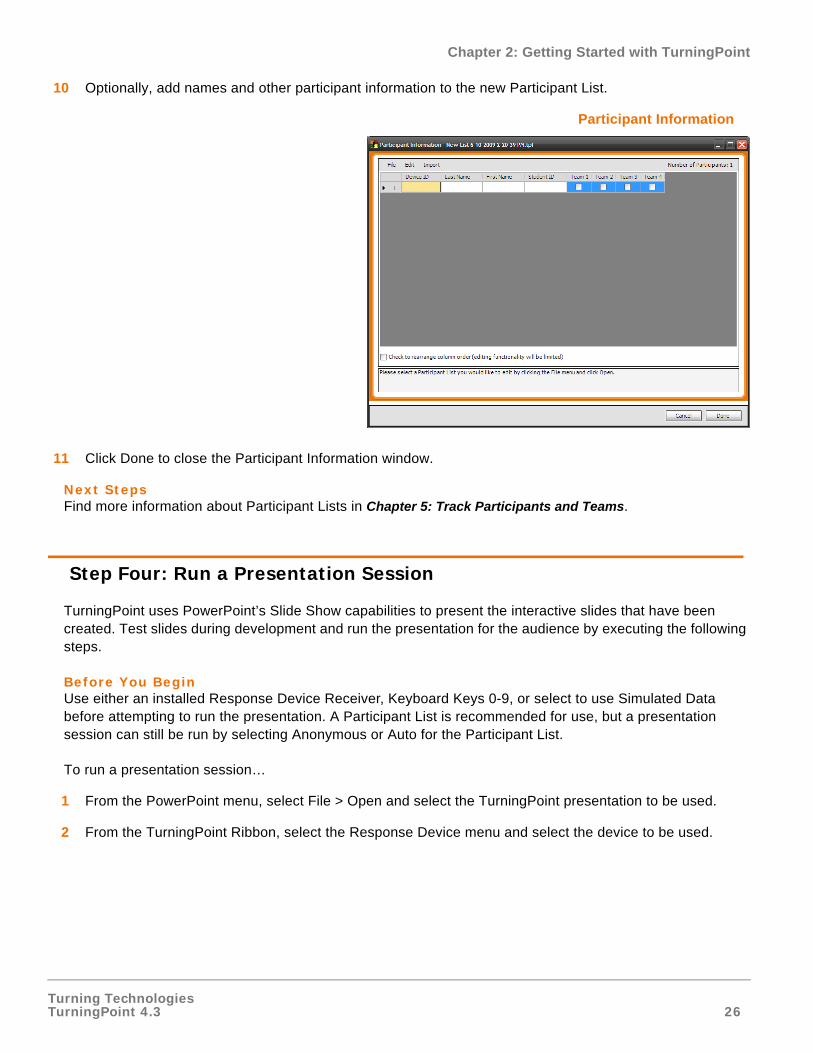
10 Optionally, add names and other participant information to the new Participant List.
Participant Information
11 Click Done to close the Participant Information window.
Next StepsFind more information about Participant Lists in Chapter 5: Track Participants and Teams.
Step Four: Run a Presentation Session
TurningPoint uses PowerPoint’s Slide Show capabilities to present the interactive slides that have been created. Test slides during development and run the presentation for the audience by executing the following steps.
Before You BeginUse either an installed Response Device Receiver, Keyboard Keys 0-9, or select to use Simulated Data before attempting to run the presentation. A Participant List is recommended for use, but a presentation session can still be run by selecting Anonymous or Auto for the Participant List.
To run a presentation session…
1 From the PowerPoint menu, select File > Open and select the TurningPoint presentation to be used.
2 From the TurningPoint Ribbon, select the Response Device menu and select the device to be used.
Turning TechnologiesTurningPoint 4.3 27
Chapter 2: Getting Started with TurningPoint
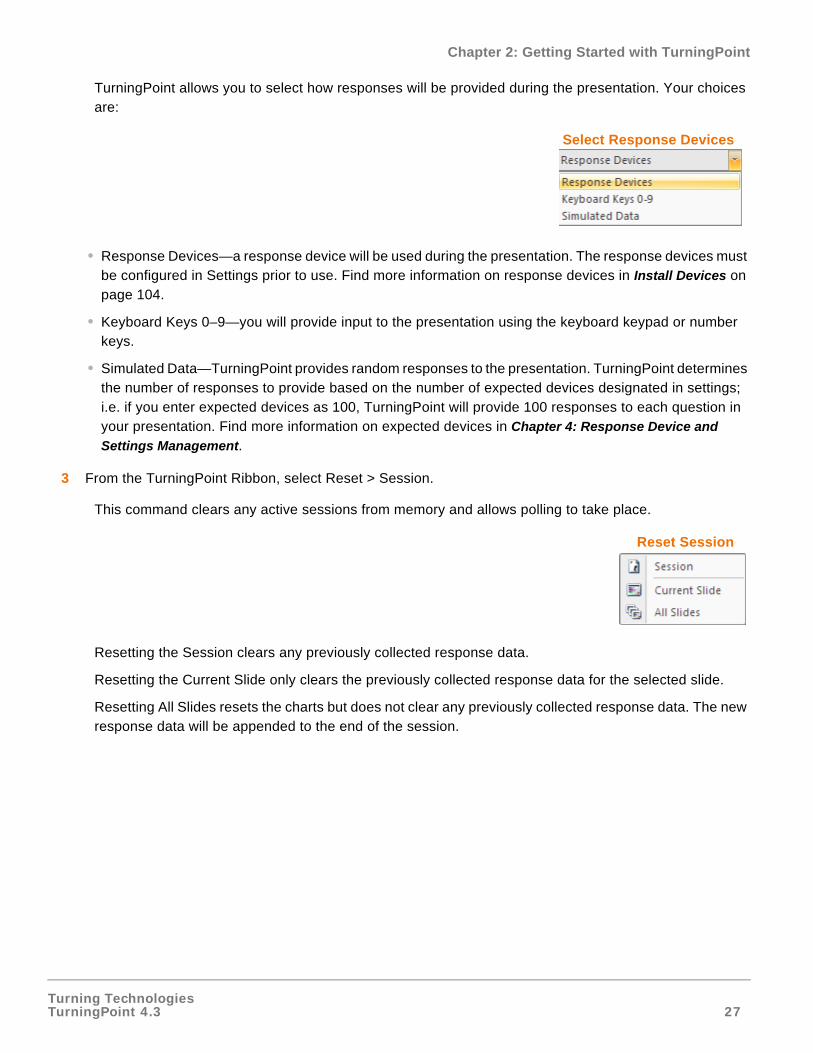
TurningPoint allows you to select how responses will be provided during the presentation. Your choices are:
Select Response Devices
• Response Devices—a response device will be used during the presentation. The response devices must be configured in Settings prior to use. Find more information on response devices in Install Devices on page 104.
• Keyboard Keys 0–9—you will provide input to the presentation using the keyboard keypad or number keys.
• Simulated Data—TurningPoint provides random responses to the presentation. TurningPoint determines the number of responses to provide based on the number of expected devices designated in settings; i.e. if you enter expected devices as 100, TurningPoint will provide 100 responses to each question in your presentation. Find more information on expected devices in Chapter 4: Response Device and
Settings Management.
3 From the TurningPoint Ribbon, select Reset > Session.
This command clears any active sessions from memory and allows polling to take place.
Reset Session
Resetting the Session clears any previously collected response data.
Resetting the Current Slide only clears the previously collected response data for the selected slide.
Resetting All Slides resets the charts but does not clear any previously collected response data. The new response data will be appended to the end of the session.
Turning TechnologiesTurningPoint 4.3 28
Chapter 2: Getting Started with TurningPoint
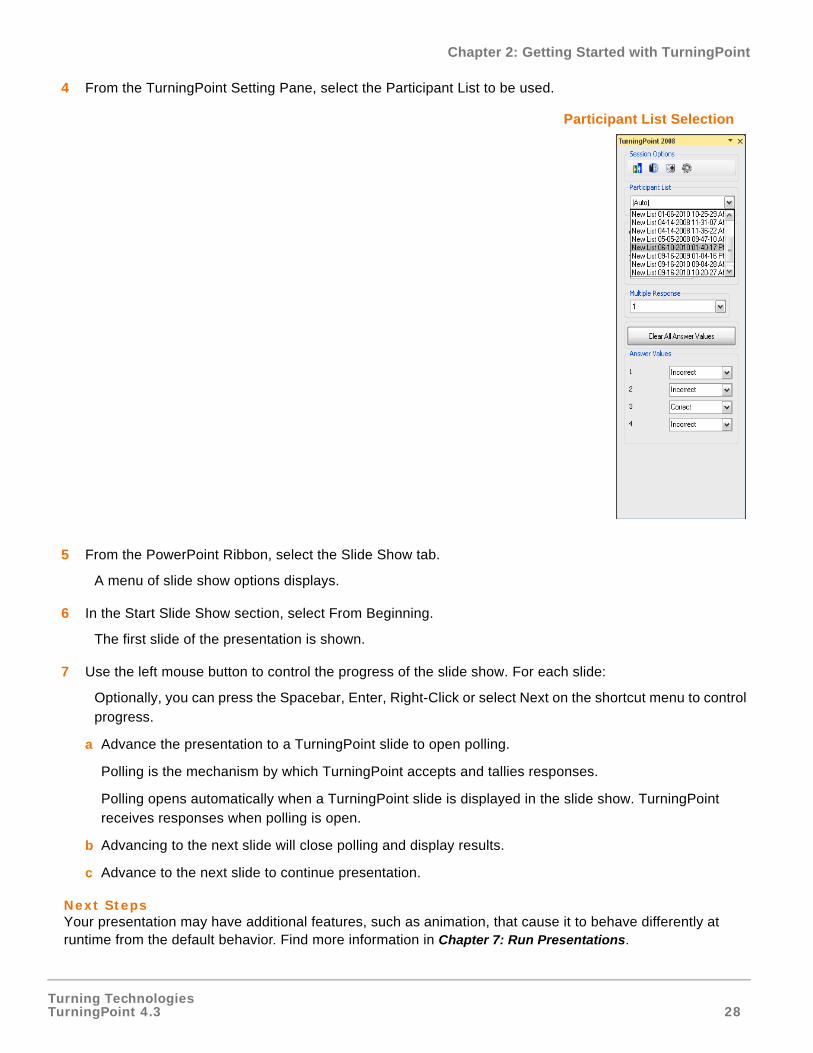
4 From the TurningPoint Setting Pane, select the Participant List to be used.
Participant List Selection
5 From the PowerPoint Ribbon, select the Slide Show tab.
A menu of slide show options displays.
6 In the Start Slide Show section, select From Beginning.
The first slide of the presentation is shown.
7 Use the left mouse button to control the progress of the slide show. For each slide:
Optionally, you can press the Spacebar, Enter, Right-Click or select Next on the shortcut menu to control progress.
a Advance the presentation to a TurningPoint slide to open polling.
Polling is the mechanism by which TurningPoint accepts and tallies responses.
Polling opens automatically when a TurningPoint slide is displayed in the slide show. TurningPoint receives responses when polling is open.
b Advancing to the next slide will close polling and display results.
c Advance to the next slide to continue presentation.
Next StepsYour presentation may have additional features, such as animation, that cause it to behave differently at runtime from the default behavior. Find more information in Chapter 7: Run Presentations.
Turning TechnologiesTurningPoint 4.3 29
Chapter 2: Getting Started with TurningPoint
Step Five: Save Session Results
TurningPoint stores the session results temporarily, but you can save the results into a file so they can be reviewed later and used with TurningPoint’s reporting feature.
When you save a session, the PowerPoint presentation is saved by default with your TurningPoint file. You have the option to exclude the PowerPoint presentation from the TurningPoint session file. This function allows you to save the TurningPoint results data. If you do NOT wish to include the PowerPoint presentation in your TurningPoint session file, navigate to the Settings menu, select the Presentation settings, then under the Misc heading, change ‘Include Presentation’ from True to False. Find more information in Settings on page 116.
To save the session results…
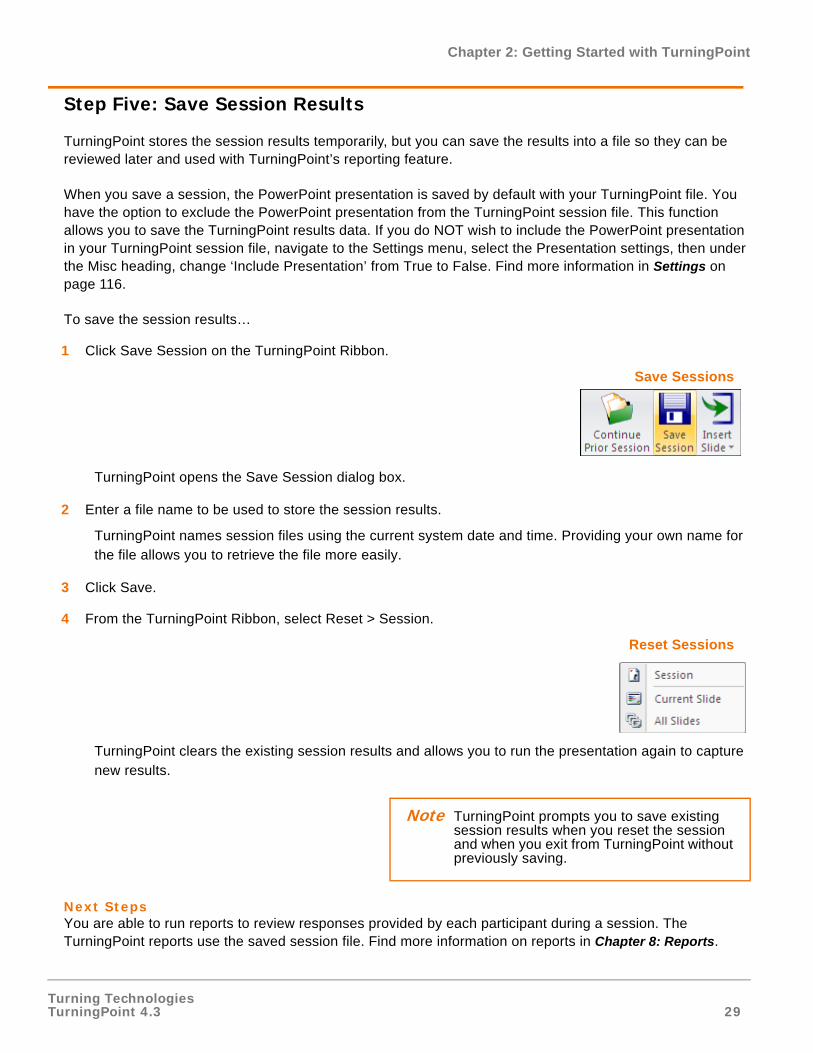
1 Click Save Session on the TurningPoint Ribbon.
Save Sessions
TurningPoint opens the Save Session dialog box.
2 Enter a file name to be used to store the session results.
TurningPoint names session files using the current system date and time. Providing your own name for the file allows you to retrieve the file more easily.
3 Click Save.
4 From the TurningPoint Ribbon, select Reset > Session.
Reset Sessions
TurningPoint clears the existing session results and allows you to run the presentation again to capture new results.
Next StepsYou are able to run reports to review responses provided by each participant during a session. The TurningPoint reports use the saved session file. Find more information on reports in Chapter 8: Reports.
Note TurningPoint prompts you to save existing session results when you reset the session and when you exit from TurningPoint without previously saving.
Turning TechnologiesTurningPoint 4.3 30
Chapter 3: Creating and Saving Slides
Creating and Saving Slides
In Chapter 2: Getting Started with TurningPoint, you learned the basic steps for creating TurningPoint presentations. This chapter expands on those steps and details the powerful features of TurningPoint.
Creating Slides
There are two ways to create a slide:
• Insert a TurningPoint template slide using the Insert Slide menu.
• Convert an existing PowerPoint slide into a TurningPoint slide.
Insert a Slide
To insert a slide into a presentation…
1 Open TurningPoint.
2 Open a presentation or create a new presentation.
3 Click Insert Slide on the TurningPoint Ribbon.
4 Select the slide type from the Insert Slide menu.
• TurningPoint inserts the new slide into the presentation.
• Depending on the type of slide selected, the new slide may contain question, answer, and chart regions.
Find information about the different slide types in Types of Slides on page 32.
Depending on the TurningPoint settings, the slide may contain an interactive shape such as an Answer Now prompt Countdown or, Response Counters. Find more information on adding or changing these objects in Add Objects on page 91.
5 Edit the text in the question region to reflect the question for the audience.
6 Edit the text in the answer region to reflect the choices the participants will have when responding to the question.
• Enter up to ten answers in the answer region.
• Repeat this procedure as many times as needed to create the interactive presentation.
Turning TechnologiesTurningPoint 4.3 31
Chapter 3: Creating and Saving Slides
Save the Presentation Slides
Since TurningPoint slides are native PowerPoint slides, they are saved as part of the presentation file (.pptx). This file can be shared with other TurningPoint and PowerPoint users.
To save the presentation...
1 Click the Office Button and select Save As from the PowerPoint menu.
2 Select a location to save the file and type a filename for the file in the space provided.
Keep the .pptx extension in the filename to ensure that PowerPoint opens the presentation file.
3 Click Save.
TurningPoint saves all of the presentation-level settings defined in the Settings menu with the interactive presentation. When the presentation is opened on a different computer, the saved presentation settings are used instead of the computer’s default settings. This function preserves the custom settings so they do not have to be reapplied every time the presentation is opened on a different computer with TurningPoint installed. Find more information on settings in Chapter 4: Response Device and Settings
Management.
Note The presentation can safely be opened on computers without TurningPoint installed. Do not edit the TurningPoint slides on a computer without TurningPoint installed. Otherwise, the slides may not function properly the next time the interactive presentation is run.
Note Restore the computer’s settings when using any presentation. In the Settings menu, select Presentation in the left pane. A Restore default presentation settings button displays in the bar below the settings options. Select this button, and a dialog box opens with this statement: “This will restore the presentation settings back to the default installation state.” Select Yes to restore the default settings.
Turning TechnologiesTurningPoint 4.3 32
Chapter 3: Creating and Saving Slides
Types of Slides
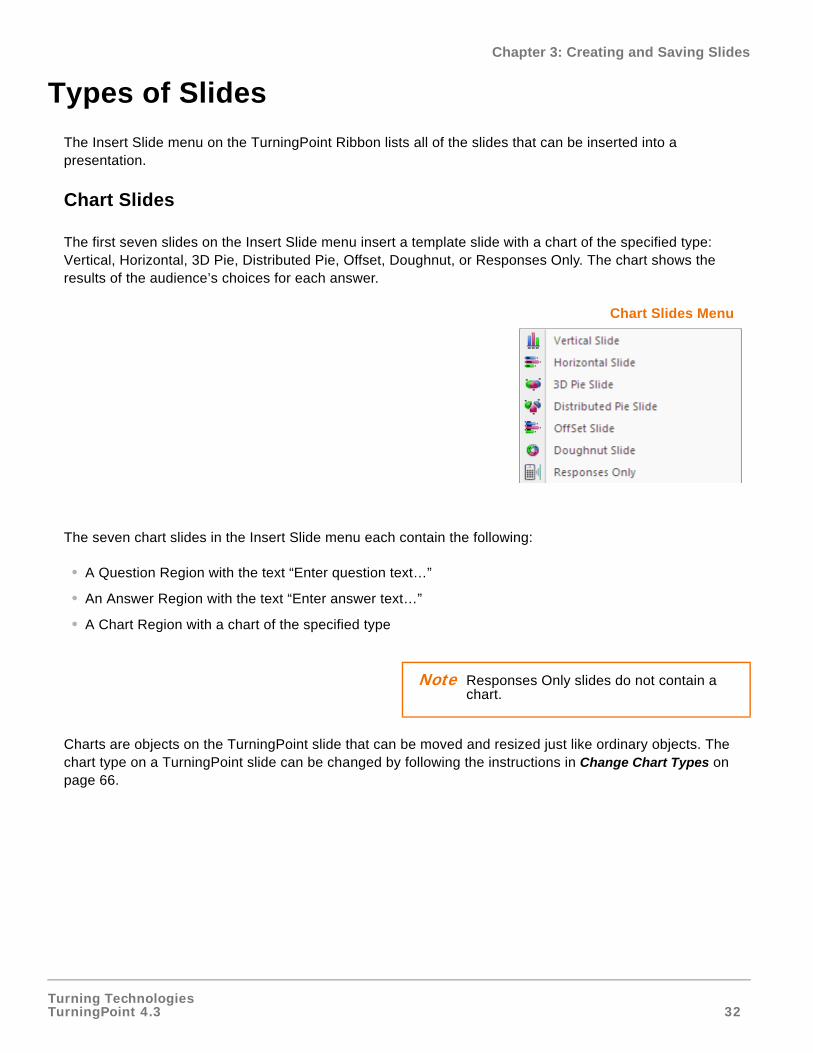
The Insert Slide menu on the TurningPoint Ribbon lists all of the slides that can be inserted into a presentation.
Chart Slides
The first seven slides on the Insert Slide menu insert a template slide with a chart of the specified type: Vertical, Horizontal, 3D Pie, Distributed Pie, Offset, Doughnut, or Responses Only. The chart shows the results of the audience’s choices for each answer.
Chart Slides Menu
The seven chart slides in the Insert Slide menu each contain the following:
• A Question Region with the text “Enter question text…”
• An Answer Region with the text “Enter answer text…”
• A Chart Region with a chart of the specified type
Charts are objects on the TurningPoint slide that can be moved and resized just like ordinary objects. The chart type on a TurningPoint slide can be changed by following the instructions in Change Chart Types on page 66.
Note Responses Only slides do not contain a chart.
Turning TechnologiesTurningPoint 4.3 33
Chapter 3: Creating and Saving Slides
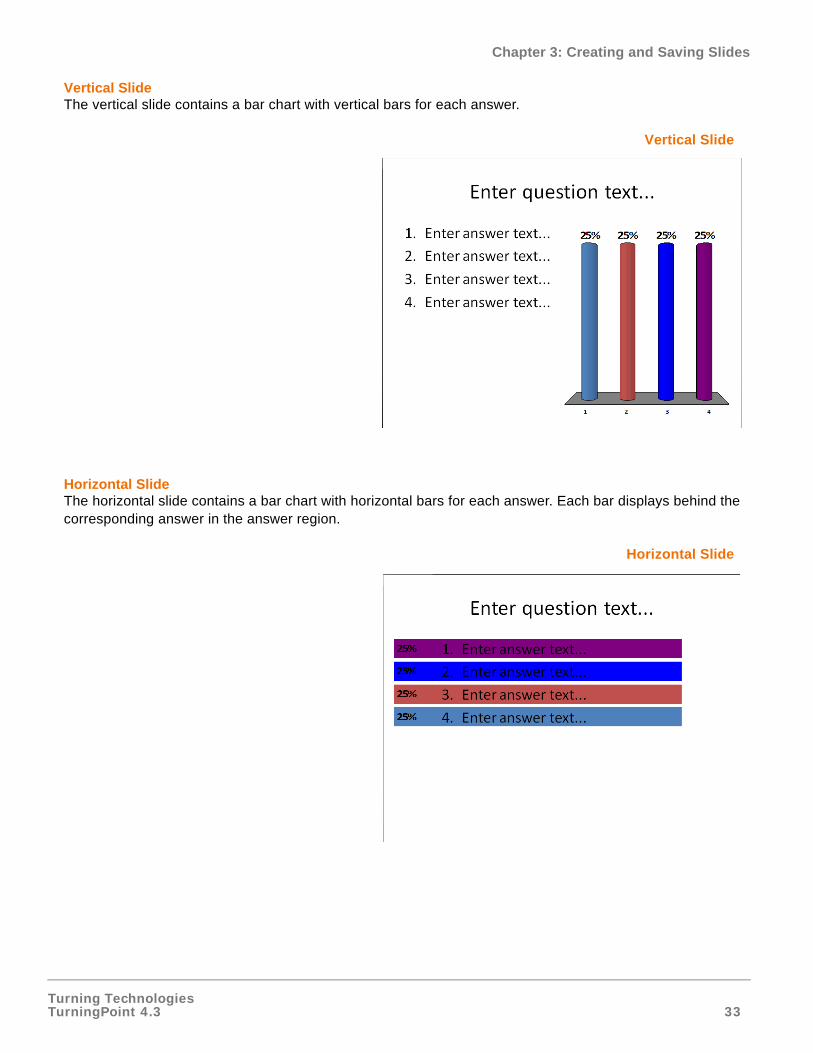
Vertical SlideThe vertical slide contains a bar chart with vertical bars for each answer.
Vertical Slide
Horizontal SlideThe horizontal slide contains a bar chart with horizontal bars for each answer. Each bar displays behind the corresponding answer in the answer region.
Horizontal Slide
Turning TechnologiesTurningPoint 4.3 34
Chapter 3: Creating and Saving Slides
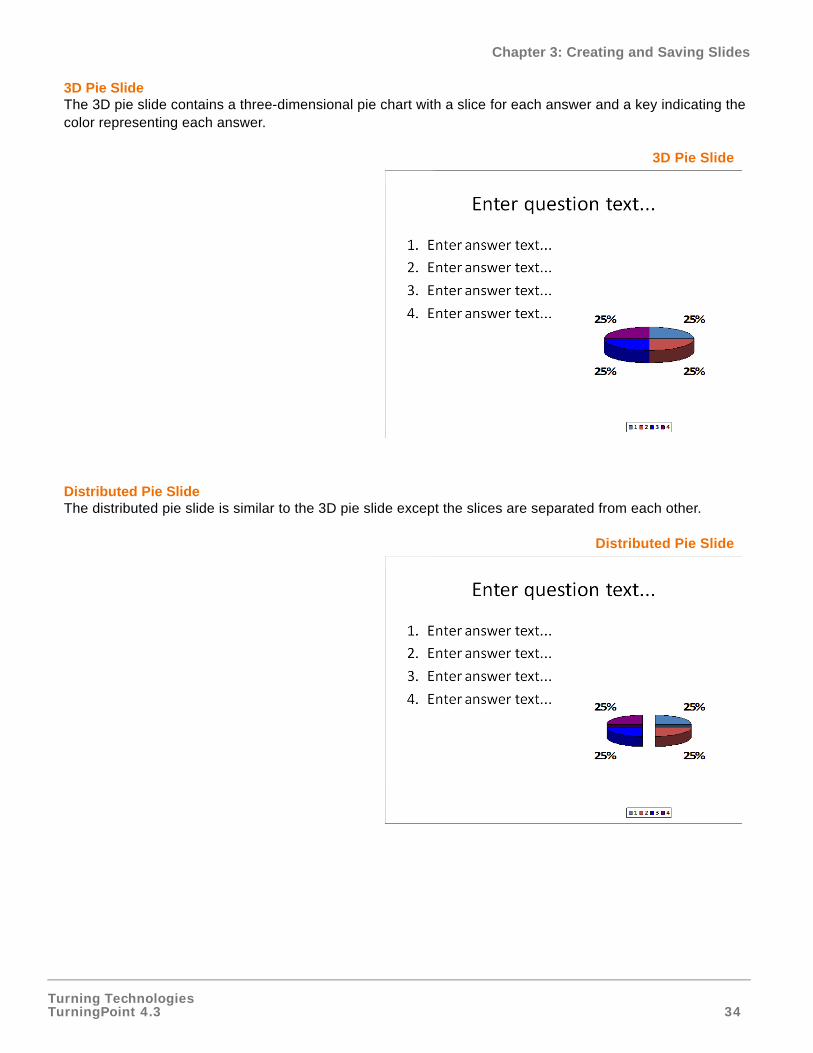
3D Pie SlideThe 3D pie slide contains a three-dimensional pie chart with a slice for each answer and a key indicating the color representing each answer.
3D Pie Slide
Distributed Pie SlideThe distributed pie slide is similar to the 3D pie slide except the slices are separated from each other.
Distributed Pie Slide
Turning TechnologiesTurningPoint 4.3 35
Chapter 3: Creating and Saving Slides
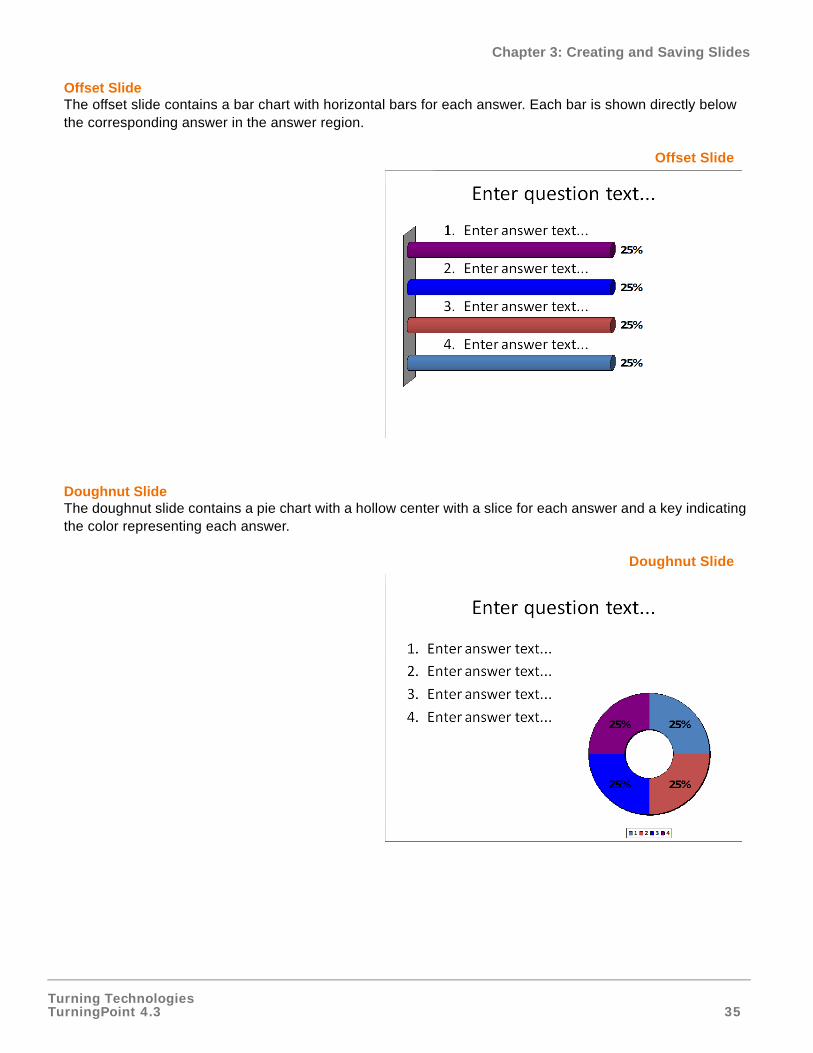
Offset SlideThe offset slide contains a bar chart with horizontal bars for each answer. Each bar is shown directly below the corresponding answer in the answer region.
Offset Slide
Doughnut SlideThe doughnut slide contains a pie chart with a hollow center with a slice for each answer and a key indicating the color representing each answer.
Doughnut Slide

Turning TechnologiesTurningPoint 4.3 36
Chapter 3: Creating and Saving Slides
Responses Only SlideThe responses only slide displays only the text results of responses. Depending on the settings, the results are display as a percentage or a vote count. No graph is displayed.
Responses Only Slide
Turning TechnologiesTurningPoint 4.3 37
Chapter 3: Creating and Saving Slides
Competition Slides
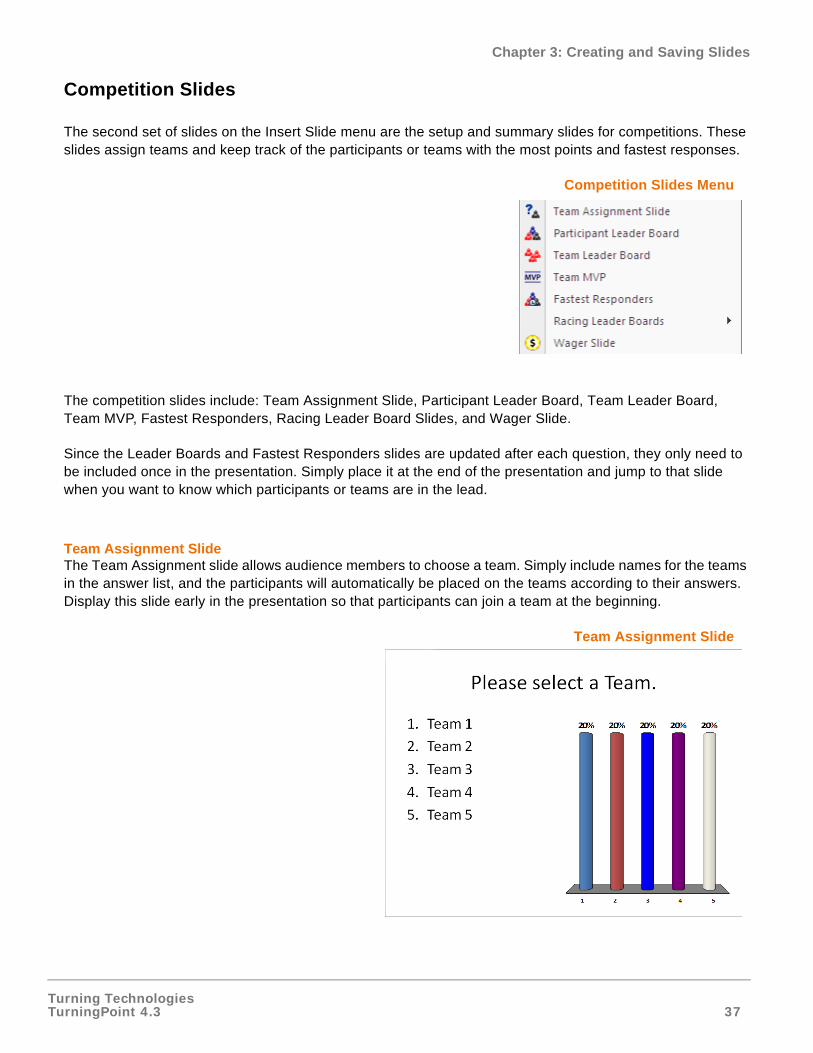
The second set of slides on the Insert Slide menu are the setup and summary slides for competitions. These slides assign teams and keep track of the participants or teams with the most points and fastest responses.
Competition Slides Menu
The competition slides include: Team Assignment Slide, Participant Leader Board, Team Leader Board, Team MVP, Fastest Responders, Racing Leader Board Slides, and Wager Slide.
Since the Leader Boards and Fastest Responders slides are updated after each question, they only need to be included once in the presentation. Simply place it at the end of the presentation and jump to that slide when you want to know which participants or teams are in the lead.
Team Assignment SlideThe Team Assignment slide allows audience members to choose a team. Simply include names for the teams in the answer list, and the participants will automatically be placed on the teams according to their answers. Display this slide early in the presentation so that participants can join a team at the beginning.
Team Assignment Slide

Turning TechnologiesTurningPoint 4.3 38
Chapter 3: Creating and Saving Slides
The Team Assignment slide allows teams to be assigned dynamically, while assigning groups in the Participant List ensures that the same participants are always on the same teams. Find more information on setting up a competition in Chapter 5: Track Participants and Teams.
Participant Leader Board The Participant Leader Board displays the top individual participants ranked by their total points. This slide updates dynamically after each question.
Participant Leader Board
Use TurningPoint settings to specify the number of participants to show on the slide in the TurningPoint settings. Specify whether the point totals should be cumulative, or for the most recent question. Find more information on modifying settings in Chapter 4: Response Device and Settings Management.
Turning TechnologiesTurningPoint 4.3 39
Chapter 3: Creating and Saving Slides
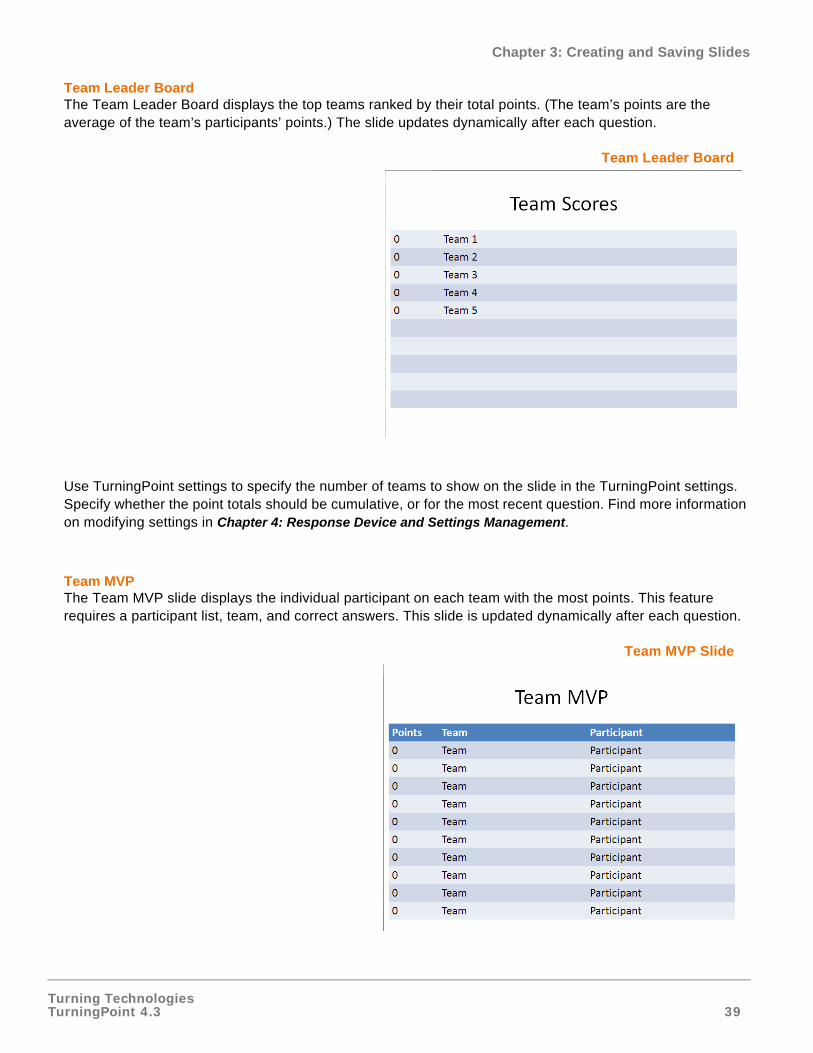
Team Leader Board The Team Leader Board displays the top teams ranked by their total points. (The team’s points are the average of the team’s participants’ points.) The slide updates dynamically after each question.
Team Leader Board
Use TurningPoint settings to specify the number of teams to show on the slide in the TurningPoint settings. Specify whether the point totals should be cumulative, or for the most recent question. Find more information on modifying settings in Chapter 4: Response Device and Settings Management.
Team MVPThe Team MVP slide displays the individual participant on each team with the most points. This feature requires a participant list, team, and correct answers. This slide is updated dynamically after each question.
Team MVP Slide
Turning TechnologiesTurningPoint 4.3 40
Chapter 3: Creating and Saving Slides
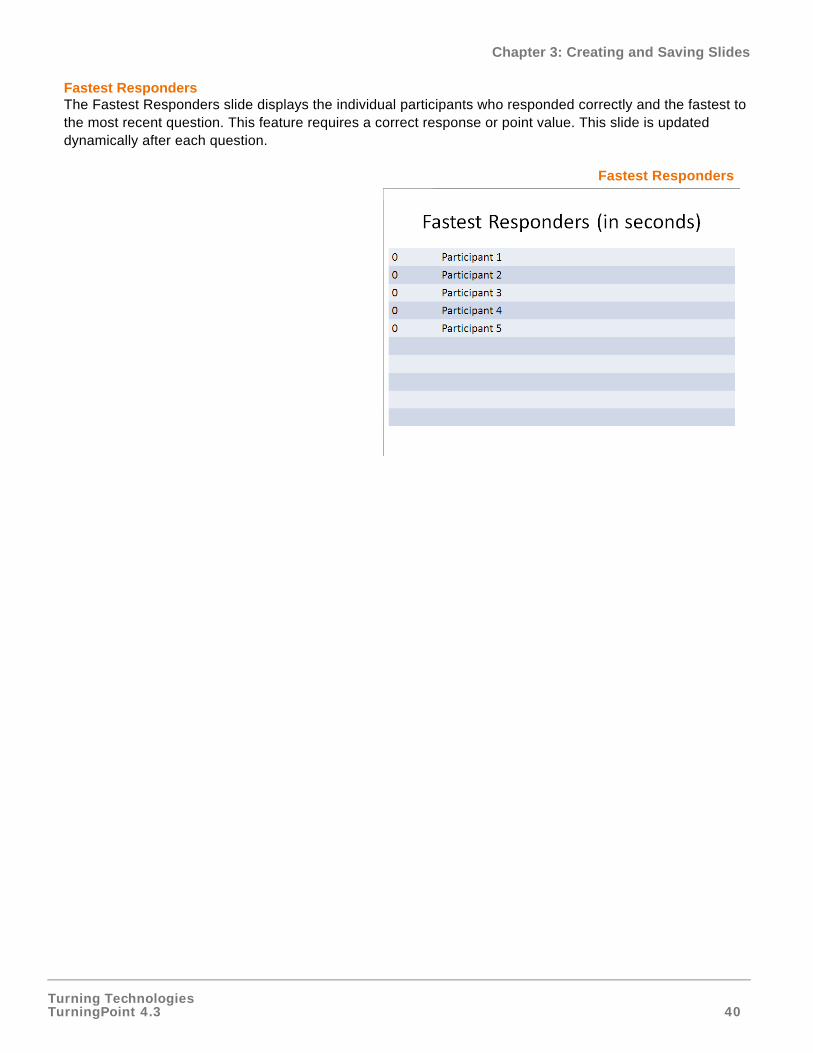
Fastest RespondersThe Fastest Responders slide displays the individual participants who responded correctly and the fastest to the most recent question. This feature requires a correct response or point value. This slide is updated dynamically after each question.
Fastest Responders
Turning TechnologiesTurningPoint 4.3 41
Chapter 3: Creating and Saving Slides
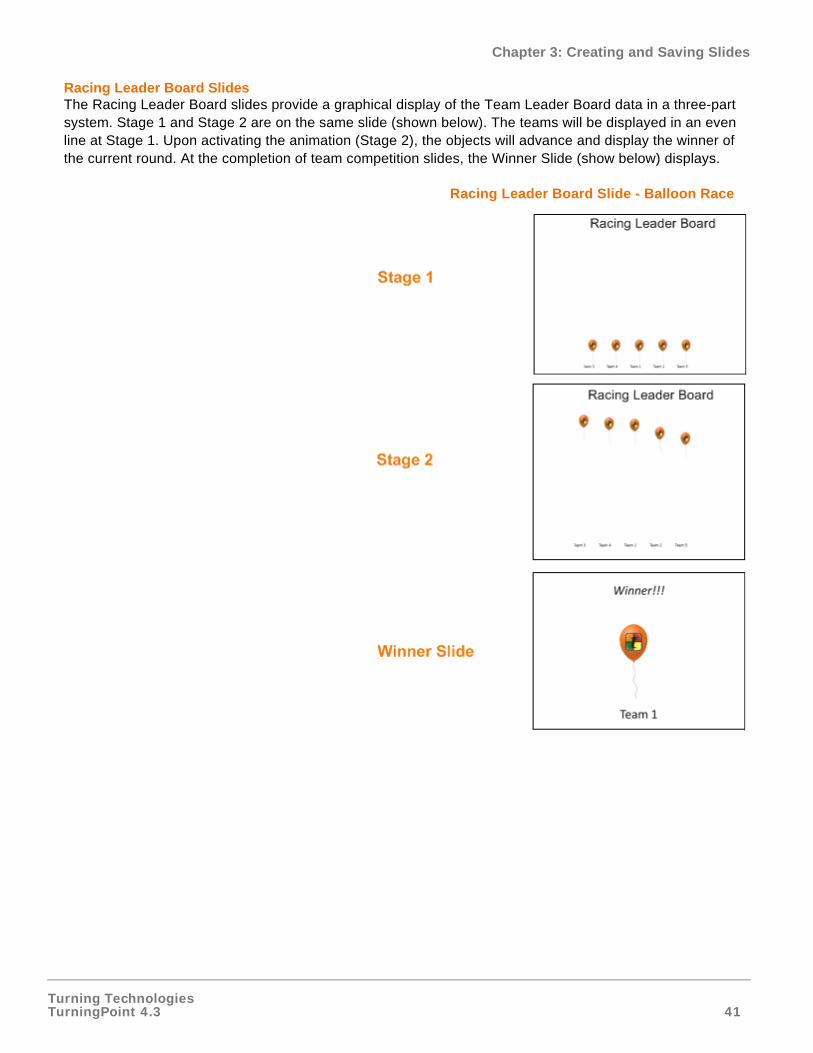
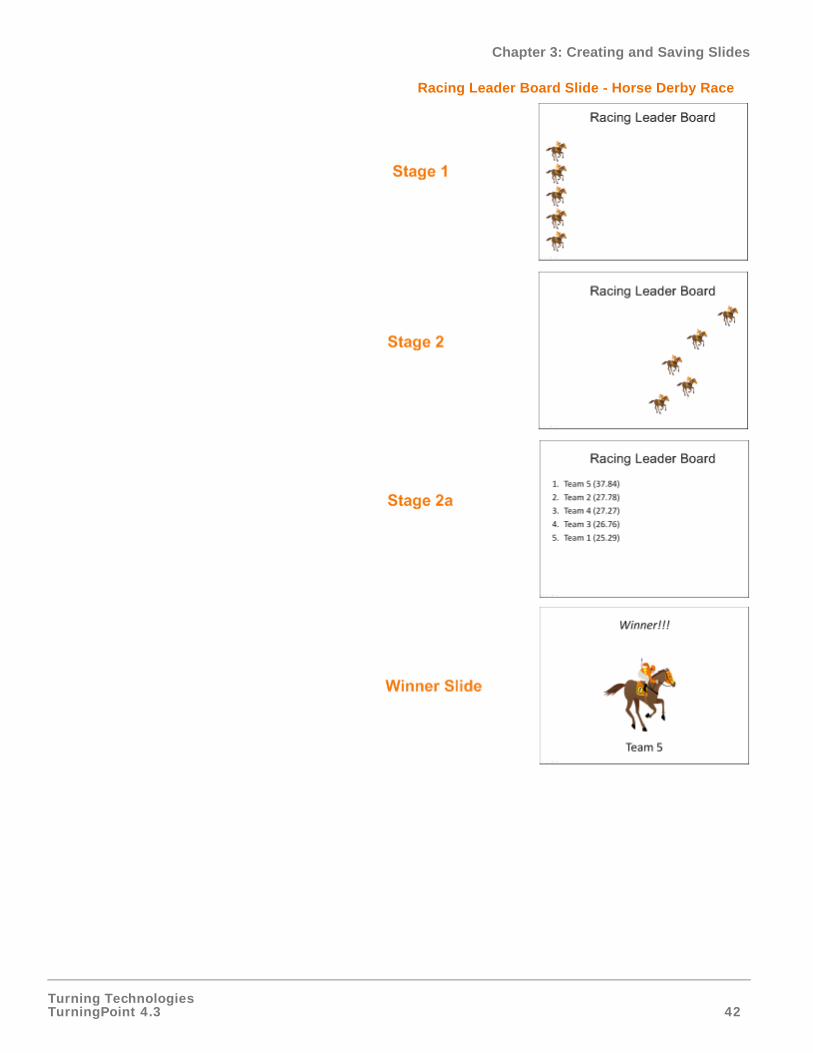
Racing Leader Board SlidesThe Racing Leader Board slides provide a graphical display of the Team Leader Board data in a three-part system. Stage 1 and Stage 2 are on the same slide (shown below). The teams will be displayed in an even line at Stage 1. Upon activating the animation (Stage 2), the objects will advance and display the winner of the current round. At the completion of team competition slides, the Winner Slide (show below) displays.
Racing Leader Board Slide - Balloon Race
Turning TechnologiesTurningPoint 4.3 42
Chapter 3: Creating and Saving Slides
Racing Leader Board Slide - Horse Derby Race

Turning TechnologiesTurningPoint 4.3 43
Chapter 3: Creating and Saving Slides
Wager SlideThe Wager Slide allows participants to wager a percentage of their points on the next question slide. If the participant fails to correctly answer the slide, the amount of points wagered is lost. If the participant successfully answers the question, they are awarded that percentage of points.
Wager Slide
Turning TechnologiesTurningPoint 4.3 44
Chapter 3: Creating and Saving Slides
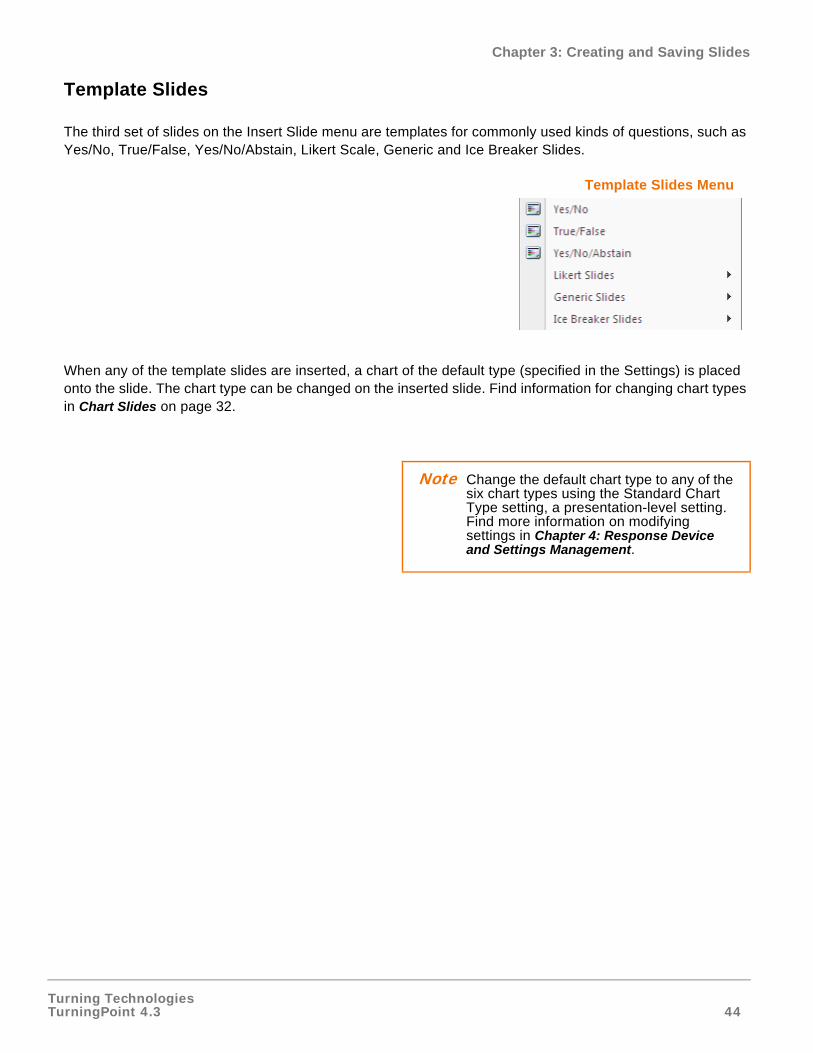
Template Slides
The third set of slides on the Insert Slide menu are templates for commonly used kinds of questions, such as Yes/No, True/False, Yes/No/Abstain, Likert Scale, Generic and Ice Breaker Slides.
Template Slides Menu
When any of the template slides are inserted, a chart of the default type (specified in the Settings) is placed onto the slide. The chart type can be changed on the inserted slide. Find information for changing chart types in Chart Slides on page 32.
Note Change the default chart type to any of the six chart types using the Standard Chart Type setting, a presentation-level setting. Find more information on modifying settings in Chapter 4: Response Device and Settings Management.
Turning TechnologiesTurningPoint 4.3 45
Chapter 3: Creating and Saving Slides
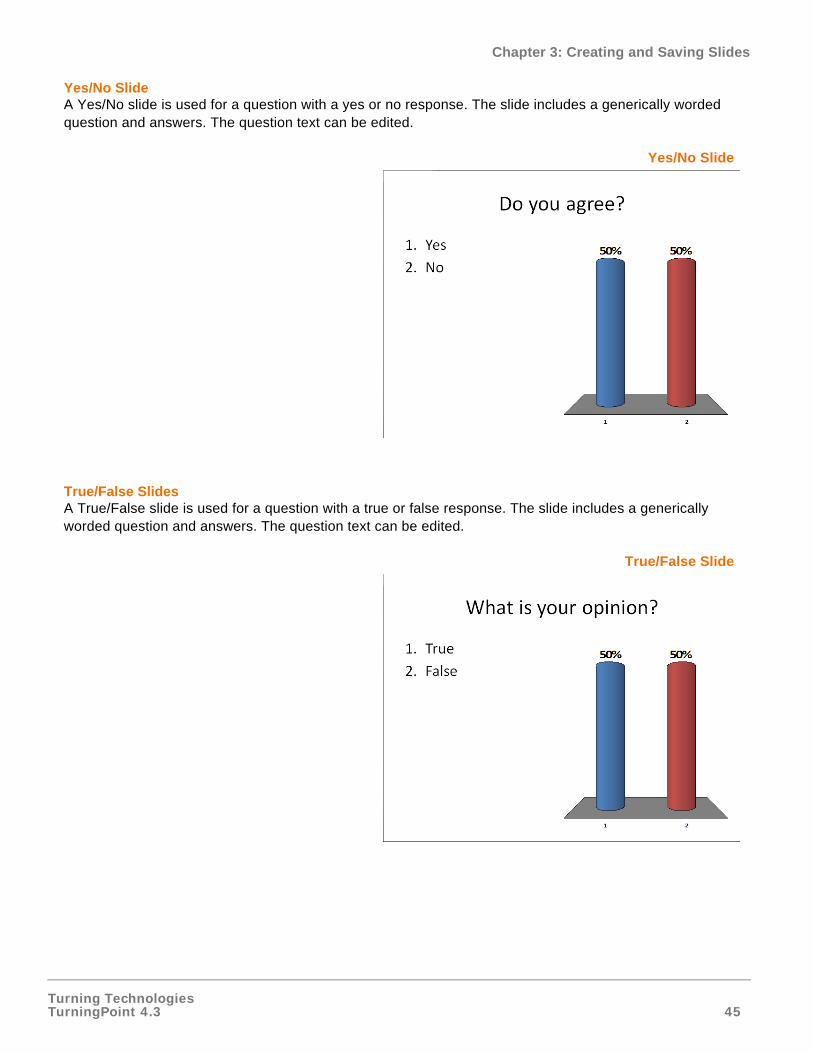
Yes/No SlideA Yes/No slide is used for a question with a yes or no response. The slide includes a generically worded question and answers. The question text can be edited.
Yes/No Slide
True/False SlidesA True/False slide is used for a question with a true or false response. The slide includes a generically worded question and answers. The question text can be edited.
True/False Slide
Turning TechnologiesTurningPoint 4.3 46
Chapter 3: Creating and Saving Slides
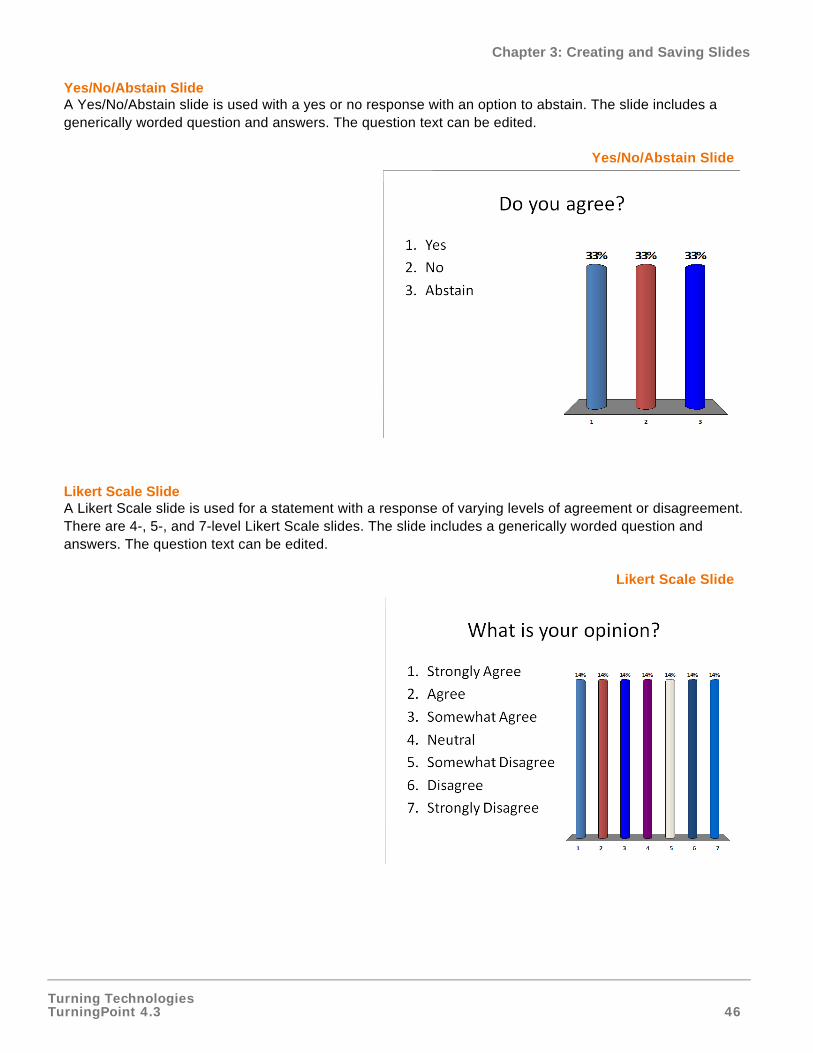
Yes/No/Abstain SlideA Yes/No/Abstain slide is used with a yes or no response with an option to abstain. The slide includes a generically worded question and answers. The question text can be edited.
Yes/No/Abstain Slide
Likert Scale SlideA Likert Scale slide is used for a statement with a response of varying levels of agreement or disagreement. There are 4-, 5-, and 7-level Likert Scale slides. The slide includes a generically worded question and answers. The question text can be edited.
Likert Scale Slide
Turning TechnologiesTurningPoint 4.3 47
Chapter 3: Creating and Saving Slides
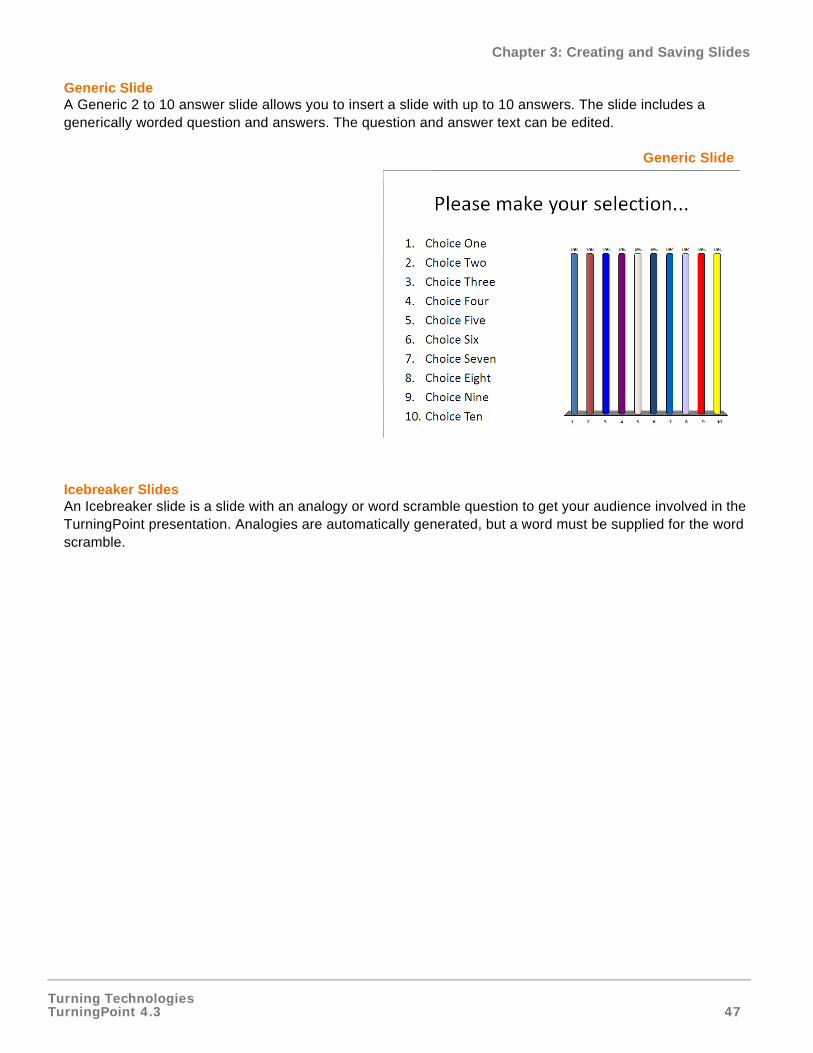
Generic SlideA Generic 2 to 10 answer slide allows you to insert a slide with up to 10 answers. The slide includes a generically worded question and answers. The question and answer text can be edited.
Generic Slide
Icebreaker SlidesAn Icebreaker slide is a slide with an analogy or word scramble question to get your audience involved in the TurningPoint presentation. Analogies are automatically generated, but a word must be supplied for the word scramble.
Turning TechnologiesTurningPoint 4.3 48
Chapter 3: Creating and Saving Slides
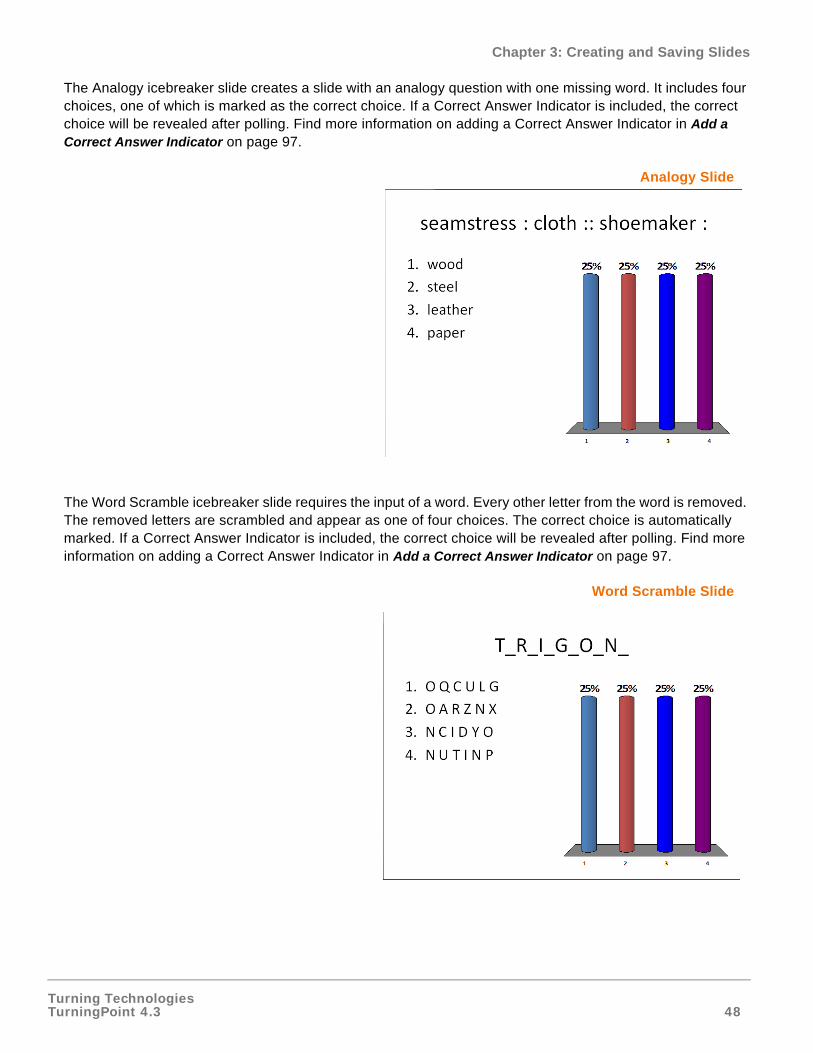
The Analogy icebreaker slide creates a slide with an analogy question with one missing word. It includes four choices, one of which is marked as the correct choice. If a Correct Answer Indicator is included, the correct choice will be revealed after polling. Find more information on adding a Correct Answer Indicator in Add a Correct Answer Indicator on page 97.
Analogy Slide
The Word Scramble icebreaker slide requires the input of a word. Every other letter from the word is removed. The removed letters are scrambled and appear as one of four choices. The correct choice is automatically marked. If a Correct Answer Indicator is included, the correct choice will be revealed after polling. Find more information on adding a Correct Answer Indicator in Add a Correct Answer Indicator on page 97.
Word Scramble Slide
Turning TechnologiesTurningPoint 4.3 49
Chapter 3: Creating and Saving Slides
Special Slides
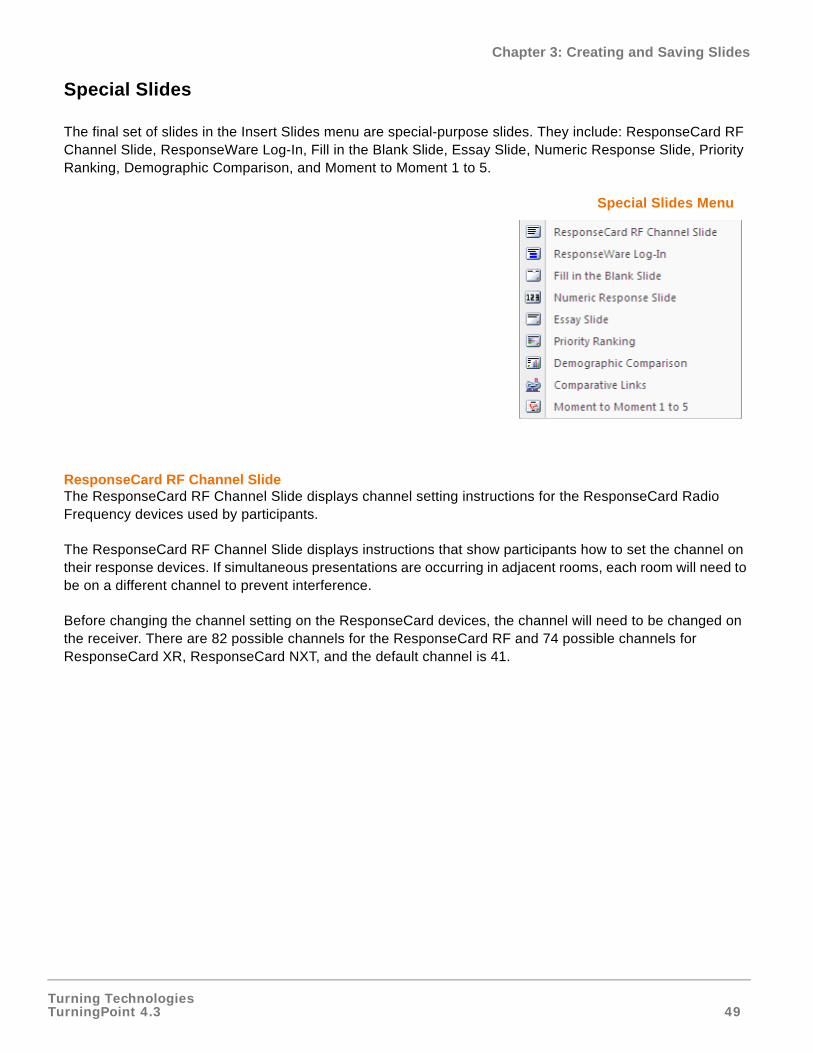
The final set of slides in the Insert Slides menu are special-purpose slides. They include: ResponseCard RF Channel Slide, ResponseWare Log-In, Fill in the Blank Slide, Essay Slide, Numeric Response Slide, Priority Ranking, Demographic Comparison, and Moment to Moment 1 to 5.
Special Slides Menu
ResponseCard RF Channel SlideThe ResponseCard RF Channel Slide displays channel setting instructions for the ResponseCard Radio Frequency devices used by participants.
The ResponseCard RF Channel Slide displays instructions that show participants how to set the channel on their response devices. If simultaneous presentations are occurring in adjacent rooms, each room will need to be on a different channel to prevent interference.
Before changing the channel setting on the ResponseCard devices, the channel will need to be changed on the receiver. There are 82 possible channels for the ResponseCard RF and 74 possible channels for ResponseCard XR, ResponseCard NXT, and the default channel is 41.
Turning TechnologiesTurningPoint 4.3 50
Chapter 3: Creating and Saving Slides
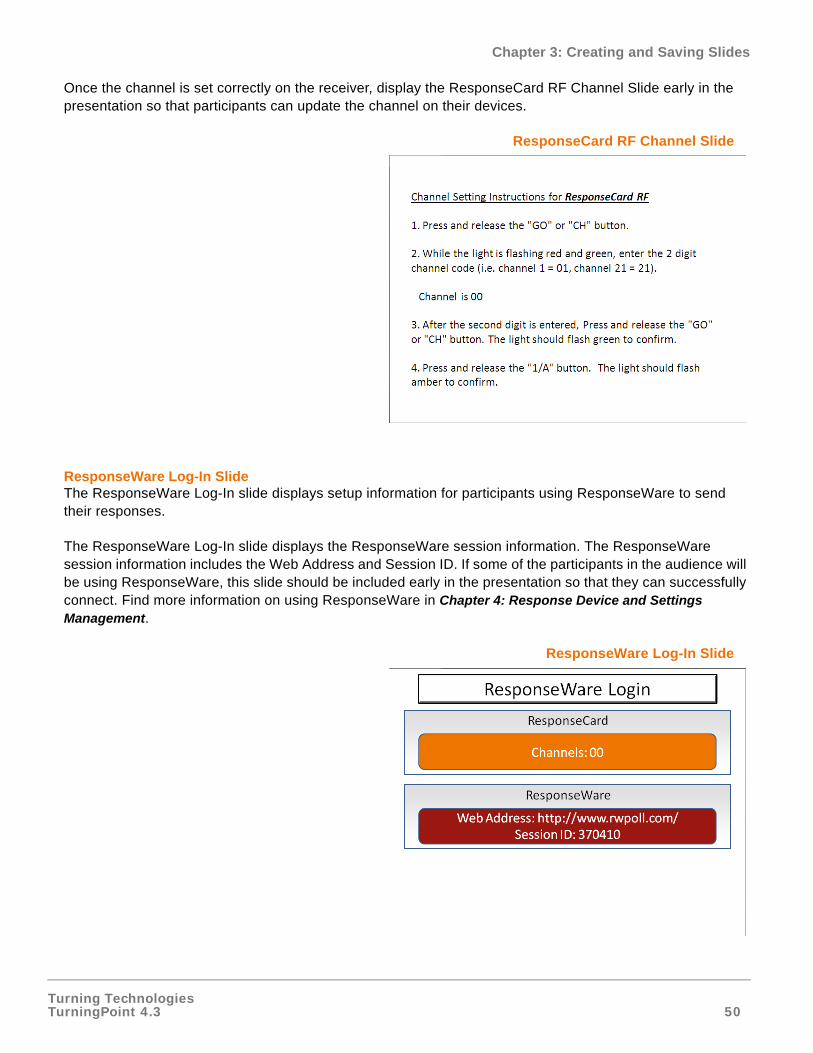
Once the channel is set correctly on the receiver, display the ResponseCard RF Channel Slide early in the presentation so that participants can update the channel on their devices.
ResponseCard RF Channel Slide
ResponseWare Log-In SlideThe ResponseWare Log-In slide displays setup information for participants using ResponseWare to send their responses.
The ResponseWare Log-In slide displays the ResponseWare session information. The ResponseWare session information includes the Web Address and Session ID. If some of the participants in the audience will be using ResponseWare, this slide should be included early in the presentation so that they can successfully connect. Find more information on using ResponseWare in Chapter 4: Response Device and Settings Management.
ResponseWare Log-In Slide
Turning TechnologiesTurningPoint 4.3 51
Chapter 3: Creating and Saving Slides
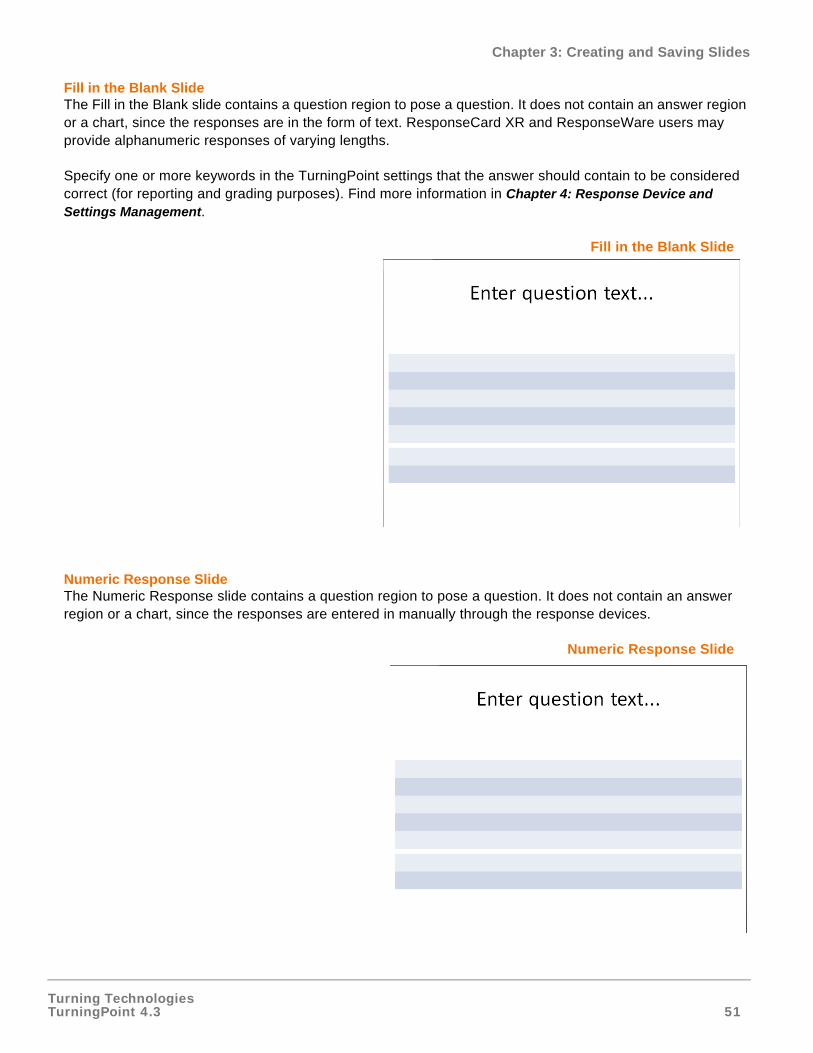
Fill in the Blank SlideThe Fill in the Blank slide contains a question region to pose a question. It does not contain an answer region or a chart, since the responses are in the form of text. ResponseCard XR and ResponseWare users may provide alphanumeric responses of varying lengths.
Specify one or more keywords in the TurningPoint settings that the answer should contain to be considered correct (for reporting and grading purposes). Find more information in Chapter 4: Response Device and Settings Management.
Fill in the Blank Slide
Numeric Response SlideThe Numeric Response slide contains a question region to pose a question. It does not contain an answer region or a chart, since the responses are entered in manually through the response devices.
Numeric Response Slide
Turning TechnologiesTurningPoint 4.3 52
Chapter 3: Creating and Saving Slides
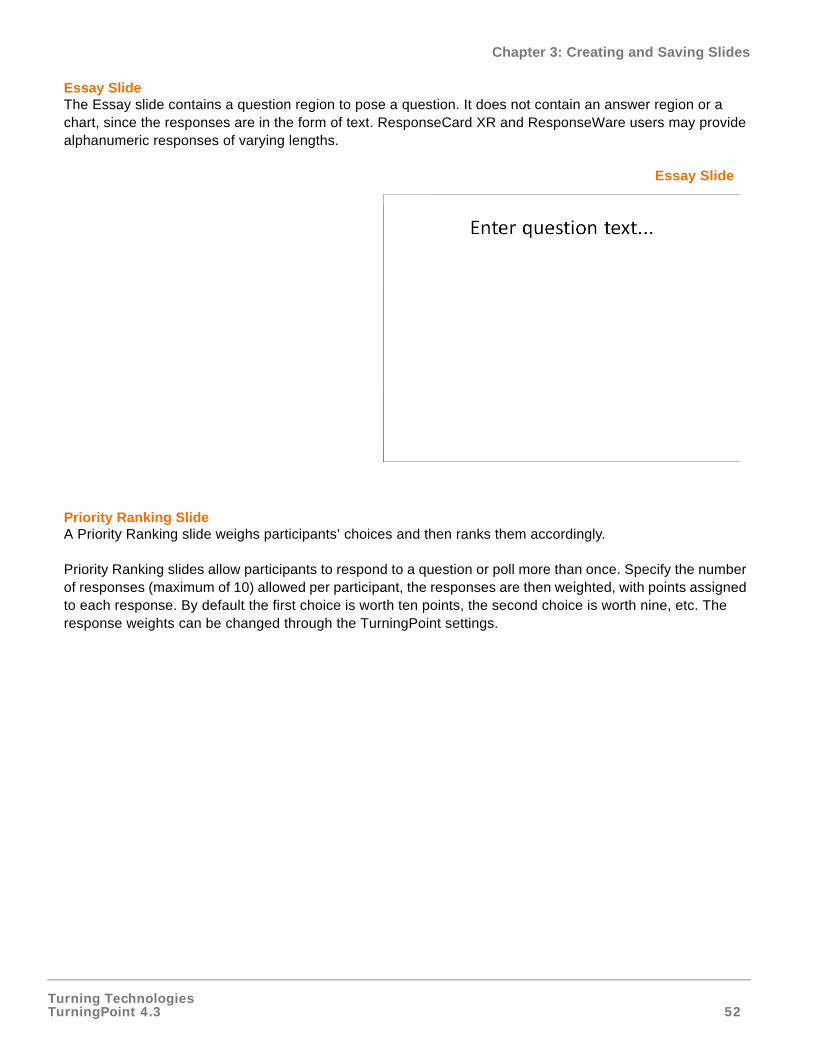
Essay SlideThe Essay slide contains a question region to pose a question. It does not contain an answer region or a chart, since the responses are in the form of text. ResponseCard XR and ResponseWare users may provide alphanumeric responses of varying lengths.
Essay Slide
Priority Ranking SlideA Priority Ranking slide weighs participants’ choices and then ranks them accordingly.
Priority Ranking slides allow participants to respond to a question or poll more than once. Specify the number of responses (maximum of 10) allowed per participant, the responses are then weighted, with points assigned to each response. By default the first choice is worth ten points, the second choice is worth nine, etc. The response weights can be changed through the TurningPoint settings.
Turning TechnologiesTurningPoint 4.3 53
Chapter 3: Creating and Saving Slides
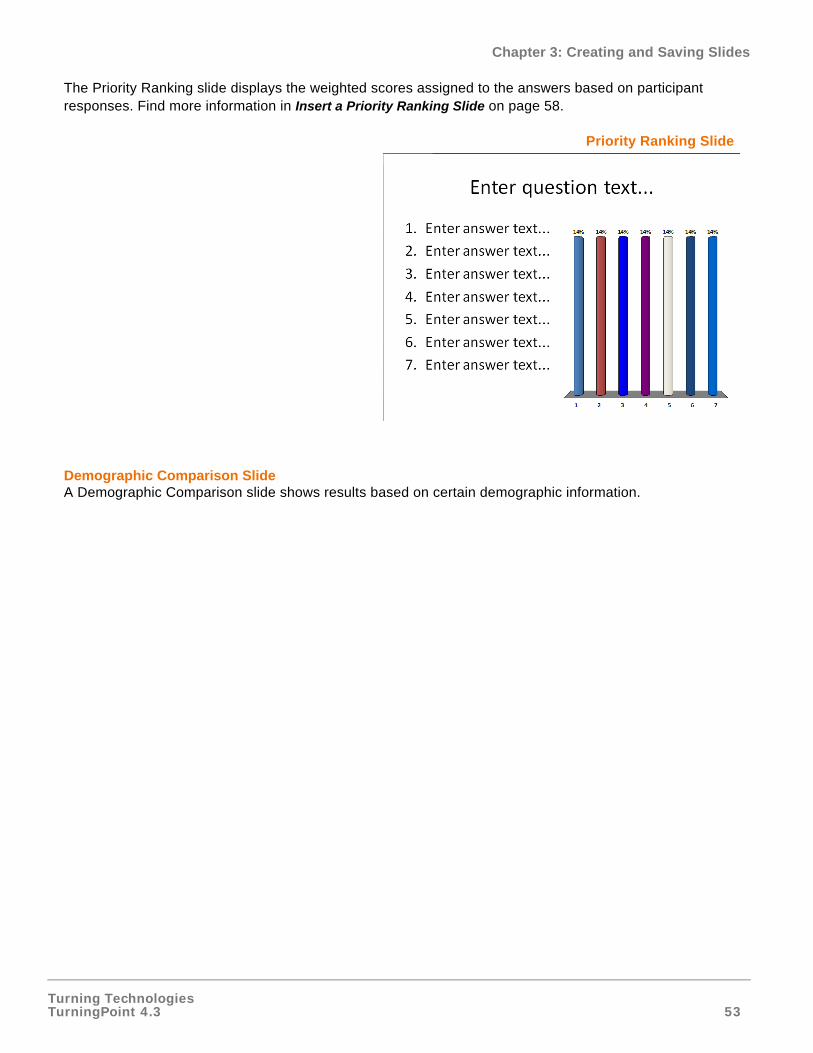
The Priority Ranking slide displays the weighted scores assigned to the answers based on participant responses. Find more information in Insert a Priority Ranking Slide on page 58.
Priority Ranking Slide
Demographic Comparison SlideA Demographic Comparison slide shows results based on certain demographic information.
Turning TechnologiesTurningPoint 4.3 54
Chapter 3: Creating and Saving Slides
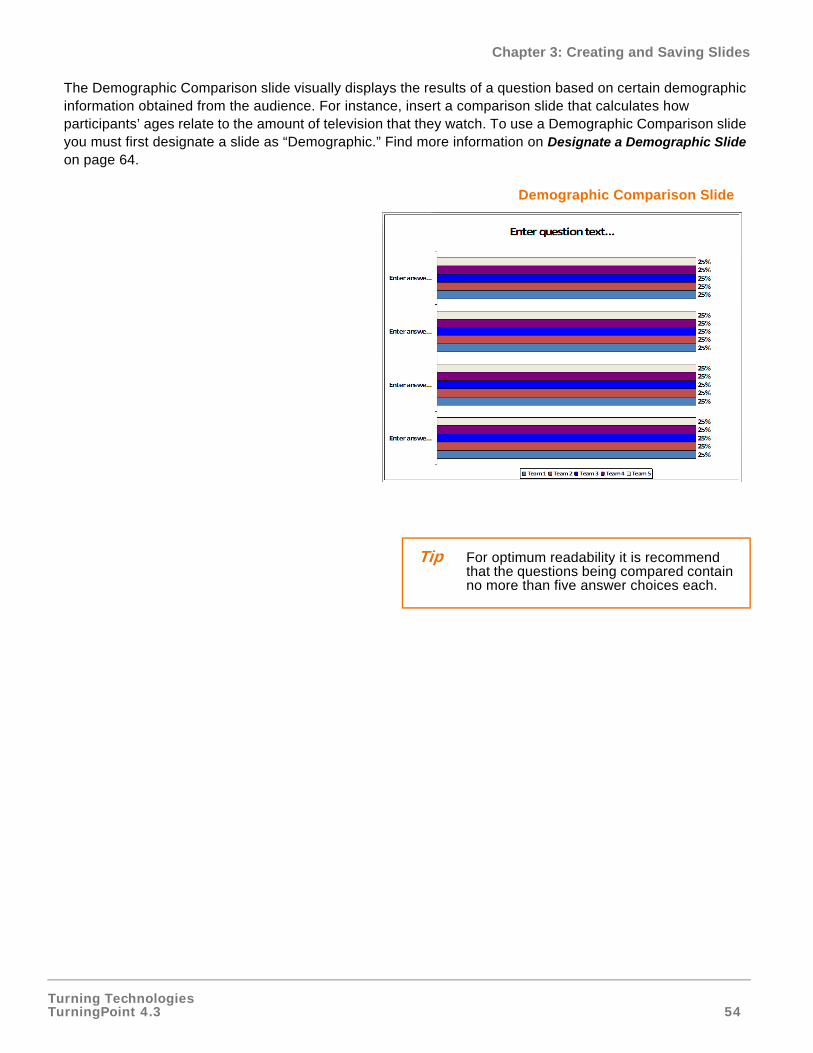
The Demographic Comparison slide visually displays the results of a question based on certain demographic information obtained from the audience. For instance, insert a comparison slide that calculates how participants’ ages relate to the amount of television that they watch. To use a Demographic Comparison slide you must first designate a slide as “Demographic.” Find more information on Designate a Demographic Slide on page 64.
Demographic Comparison Slide
Tip For optimum readability it is recommend that the questions being compared contain no more than five answer choices each.
Turning TechnologiesTurningPoint 4.3 55
Chapter 3: Creating and Saving Slides
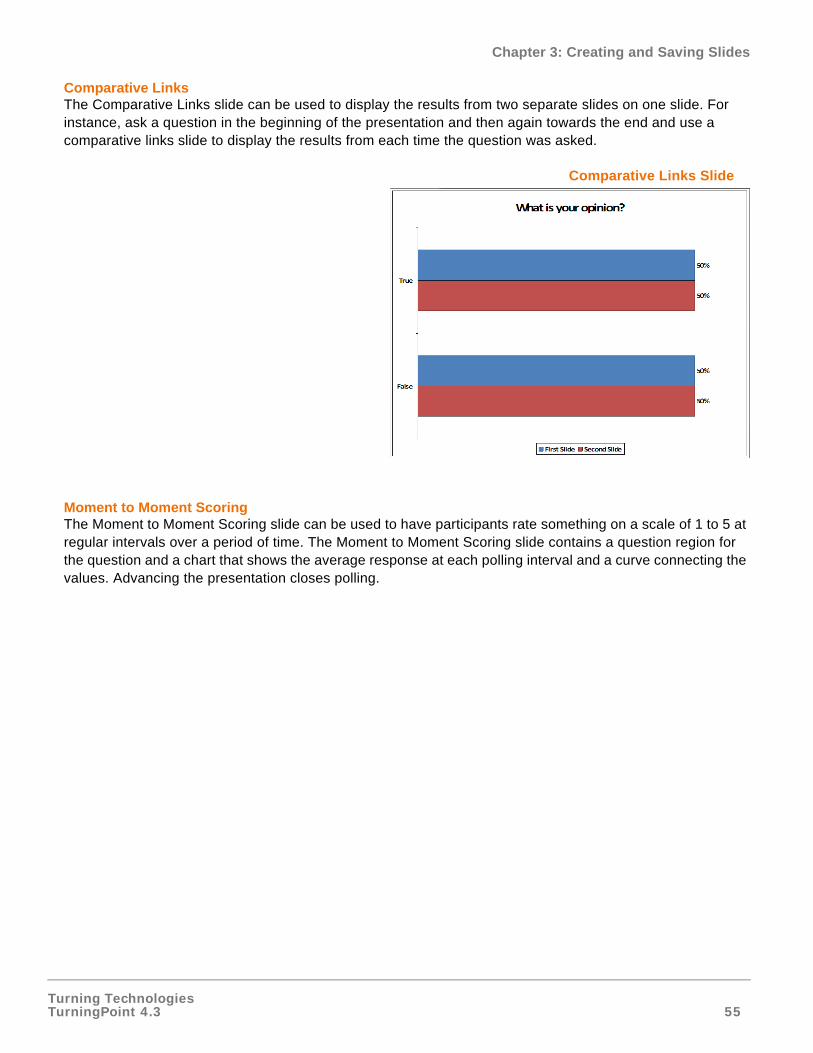
Comparative LinksThe Comparative Links slide can be used to display the results from two separate slides on one slide. For instance, ask a question in the beginning of the presentation and then again towards the end and use a comparative links slide to display the results from each time the question was asked.
Comparative Links Slide
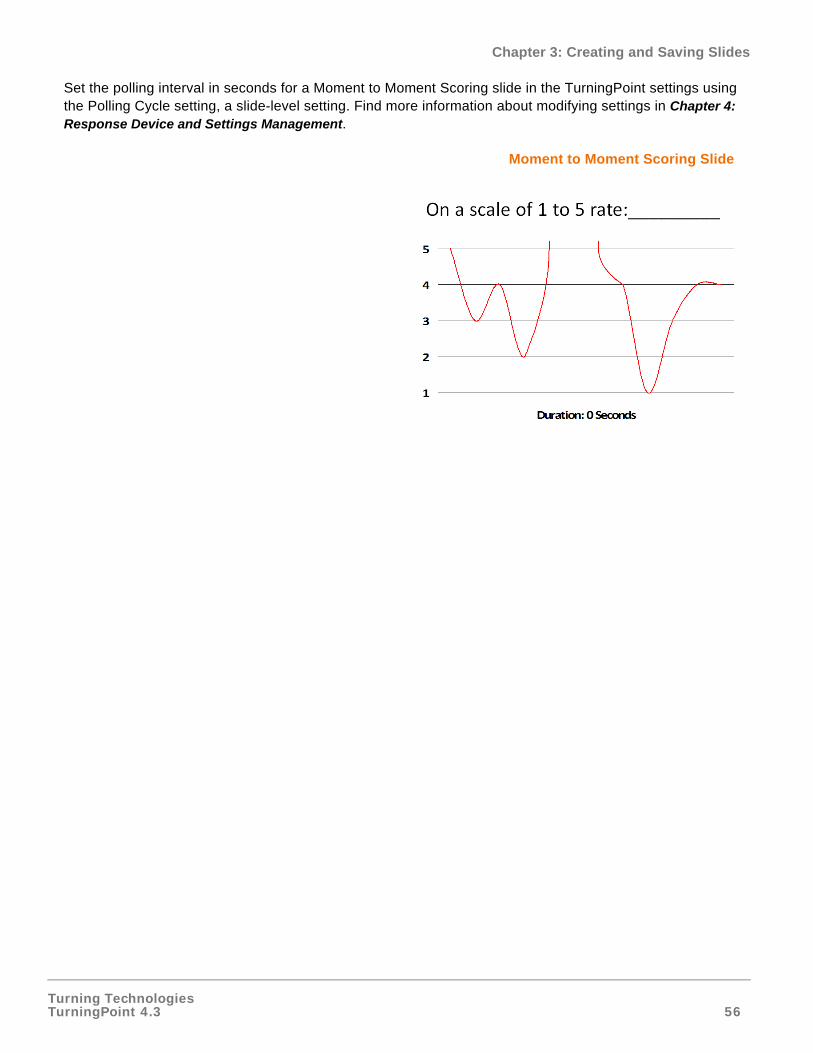
Moment to Moment ScoringThe Moment to Moment Scoring slide can be used to have participants rate something on a scale of 1 to 5 at regular intervals over a period of time. The Moment to Moment Scoring slide contains a question region for the question and a chart that shows the average response at each polling interval and a curve connecting the values. Advancing the presentation closes polling.
Turning TechnologiesTurningPoint 4.3 56
Chapter 3: Creating and Saving Slides
Set the polling interval in seconds for a Moment to Moment Scoring slide in the TurningPoint settings using the Polling Cycle setting, a slide-level setting. Find more information about modifying settings in Chapter 4: Response Device and Settings Management.
Moment to Moment Scoring Slide
Turning TechnologiesTurningPoint 4.3 57
Chapter 3: Creating and Saving Slides
Insert Special Slides
Inserting some Special Slides differs from inserting Chart, Competition, Template, and other Special slides as outlined in Insert a Slide on page 30. These slides require additional information or changes to settings to function properly.
This section describes how to:
• Insert a Numeric Response Slide
• Insert a Priority Ranking Slide
• Insert a Demographic Comparison Slide
• Insert a Comparative Links Slide
Insert a Numeric Response Slide
One use for Numeric Response slide would be to pose a mathematical question to your participants. Instead of a multiple choice question where the participants would be able to guess the correct answer, they would have to use their response device to enter in a value they have determined on their own.
To insert a Numeric Response slide...
1 Navigate to the slide you would like the Numeric Response slide to be inserted after.
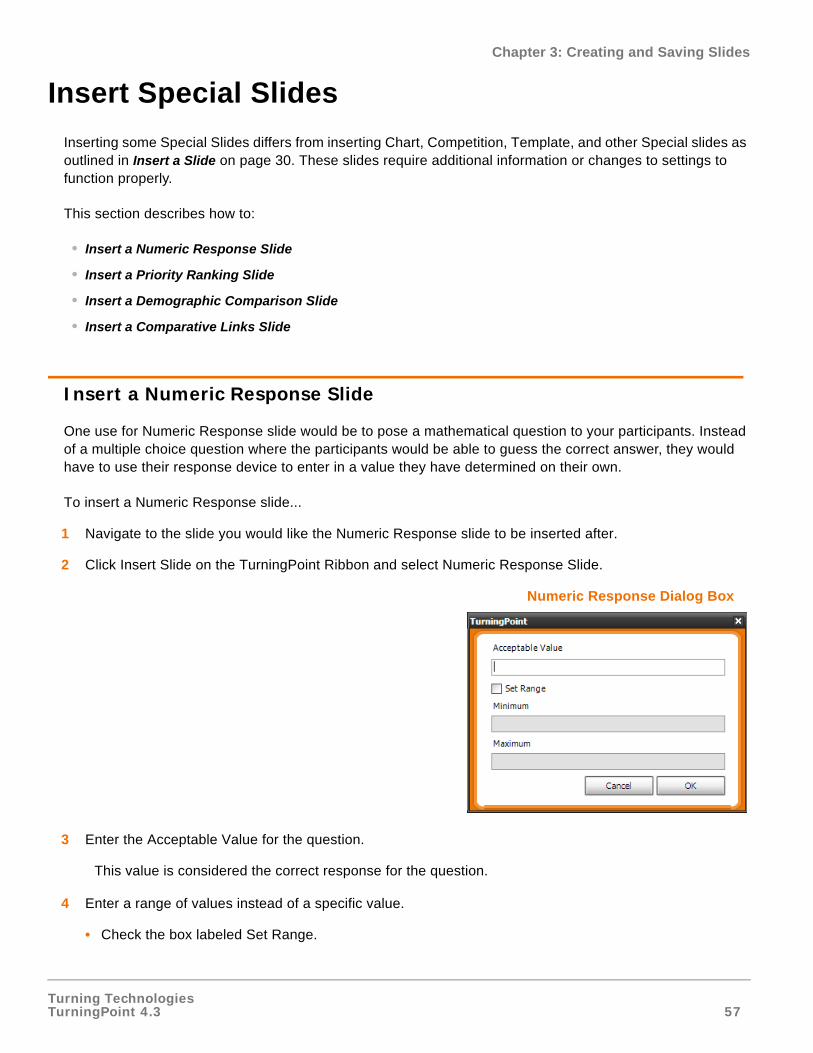
2 Click Insert Slide on the TurningPoint Ribbon and select Numeric Response Slide.
Numeric Response Dialog Box
3 Enter the Acceptable Value for the question.
This value is considered the correct response for the question.
4 Enter a range of values instead of a specific value.
• Check the box labeled Set Range.
Turning TechnologiesTurningPoint 4.3 58
Chapter 3: Creating and Saving Slides
• Enter the Minimum value.
• Enter the Maximum value.
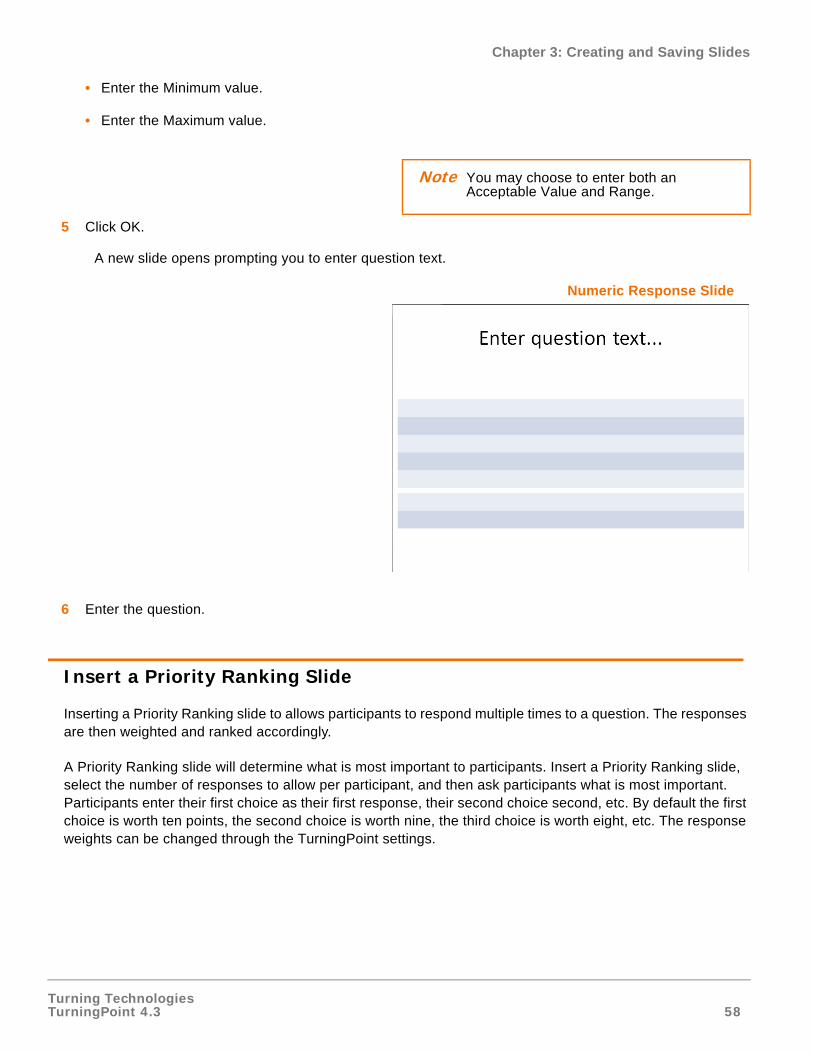
5 Click OK.
A new slide opens prompting you to enter question text.
Numeric Response Slide
6 Enter the question.
Insert a Priority Ranking Slide
Inserting a Priority Ranking slide to allows participants to respond multiple times to a question. The responses are then weighted and ranked accordingly.
A Priority Ranking slide will determine what is most important to participants. Insert a Priority Ranking slide, select the number of responses to allow per participant, and then ask participants what is most important. Participants enter their first choice as their first response, their second choice second, etc. By default the first choice is worth ten points, the second choice is worth nine, the third choice is worth eight, etc. The response weights can be changed through the TurningPoint settings.
Note You may choose to enter both an Acceptable Value and Range.
Turning TechnologiesTurningPoint 4.3 59
Chapter 3: Creating and Saving Slides
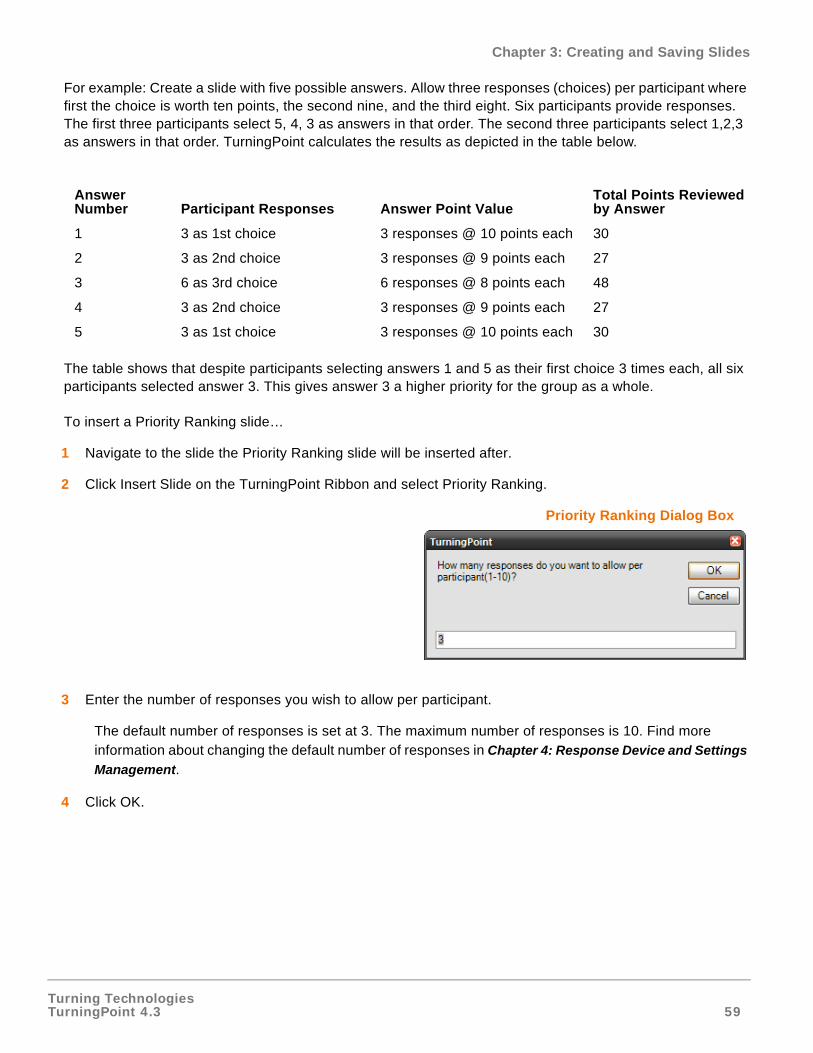
For example: Create a slide with five possible answers. Allow three responses (choices) per participant where first the choice is worth ten points, the second nine, and the third eight. Six participants provide responses. The first three participants select 5, 4, 3 as answers in that order. The second three participants select 1,2,3 as answers in that order. TurningPoint calculates the results as depicted in the table below.
The table shows that despite participants selecting answers 1 and 5 as their first choice 3 times each, all six participants selected answer 3. This gives answer 3 a higher priority for the group as a whole.
To insert a Priority Ranking slide…
1 Navigate to the slide the Priority Ranking slide will be inserted after.
2 Click Insert Slide on the TurningPoint Ribbon and select Priority Ranking.
Priority Ranking Dialog Box
3 Enter the number of responses you wish to allow per participant.
The default number of responses is set at 3. The maximum number of responses is 10. Find more information about changing the default number of responses in Chapter 4: Response Device and Settings
Management.
4 Click OK.
Answer Number Participant Responses Answer Point Value
Total Points Reviewed by Answer
1 3 as 1st choice 3 responses @ 10 points each 30
2 3 as 2nd choice 3 responses @ 9 points each 27
3 6 as 3rd choice 6 responses @ 8 points each 48
4 3 as 2nd choice 3 responses @ 9 points each 27
5 3 as 1st choice 3 responses @ 10 points each 30
Turning TechnologiesTurningPoint 4.3 60
Chapter 3: Creating and Saving Slides
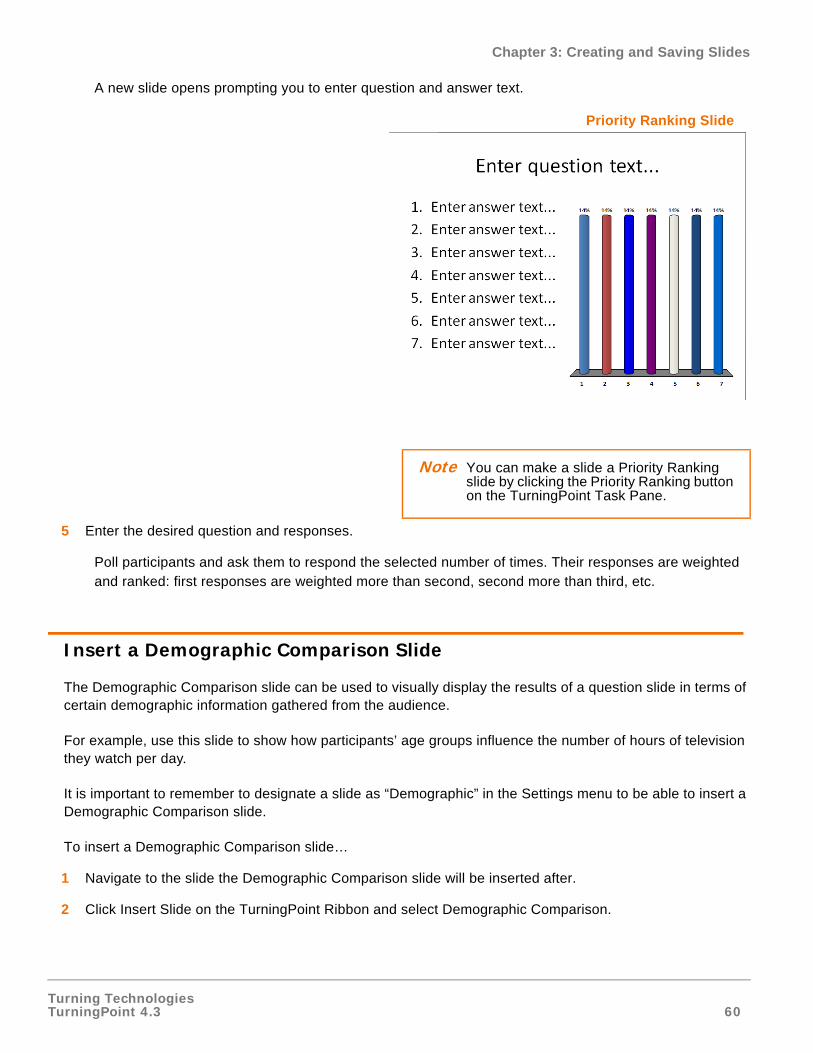
A new slide opens prompting you to enter question and answer text.
Priority Ranking Slide
5 Enter the desired question and responses.
Poll participants and ask them to respond the selected number of times. Their responses are weighted and ranked: first responses are weighted more than second, second more than third, etc.
Insert a Demographic Comparison Slide
The Demographic Comparison slide can be used to visually display the results of a question slide in terms of certain demographic information gathered from the audience.
For example, use this slide to show how participants’ age groups influence the number of hours of television they watch per day.
It is important to remember to designate a slide as “Demographic” in the Settings menu to be able to insert a Demographic Comparison slide.
To insert a Demographic Comparison slide…
1 Navigate to the slide the Demographic Comparison slide will be inserted after.
2 Click Insert Slide on the TurningPoint Ribbon and select Demographic Comparison.
Note You can make a slide a Priority Ranking slide by clicking the Priority Ranking button on the TurningPoint Task Pane.
Turning TechnologiesTurningPoint 4.3 61
Chapter 3: Creating and Saving Slides
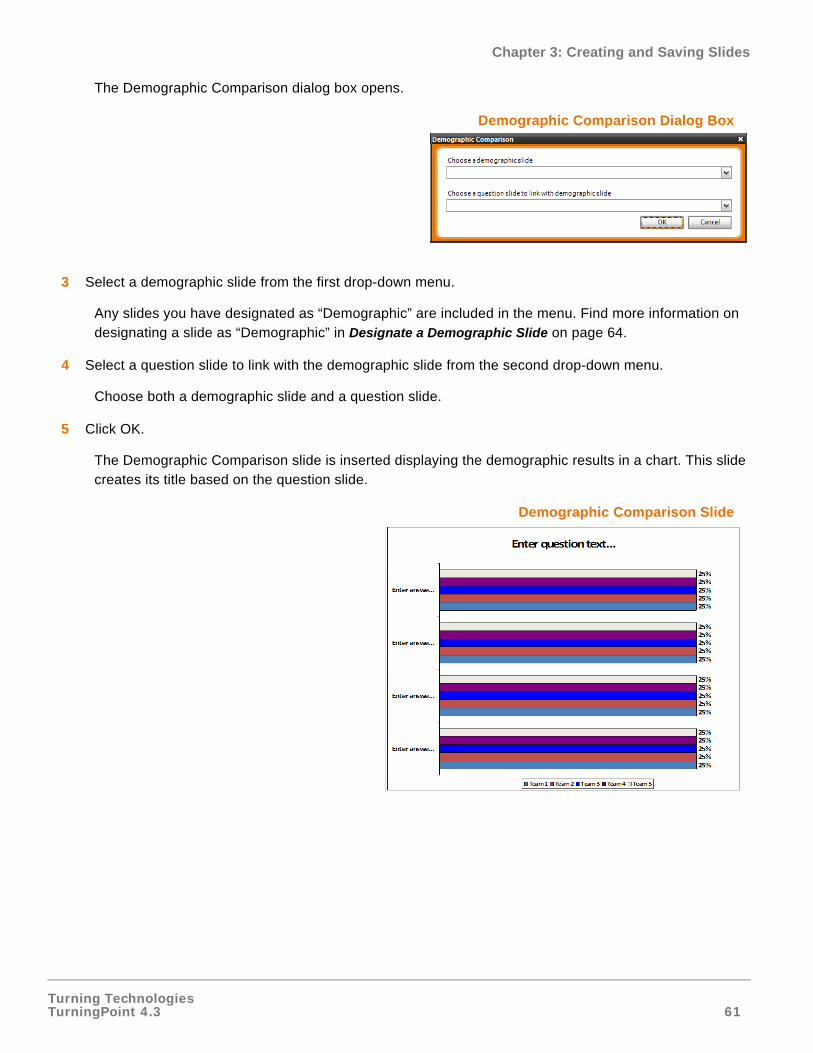
The Demographic Comparison dialog box opens.
Demographic Comparison Dialog Box
3 Select a demographic slide from the first drop-down menu.
Any slides you have designated as “Demographic” are included in the menu. Find more information on designating a slide as “Demographic” in Designate a Demographic Slide on page 64.
4 Select a question slide to link with the demographic slide from the second drop-down menu.
Choose both a demographic slide and a question slide.
5 Click OK.
The Demographic Comparison slide is inserted displaying the demographic results in a chart. This slide creates its title based on the question slide.
Demographic Comparison Slide
Turning TechnologiesTurningPoint 4.3 62
Chapter 3: Creating and Saving Slides
Insert a Comparative Links Slide
The Comparative Links slide can be used to display the results from two separate slides on one slide.
Before You BeginBefore setting up a comparative link, first create the slides you would like to compare. Generally, the slides being compared should each have the same number of answers. The slide on which the comparison will be displayed should come after the slides it is being compared to, so that the results of those slides are available for display.
To create a comparative link...
1 Click Insert Slide on the TurningPoint Ribbon and select Comparative Links.
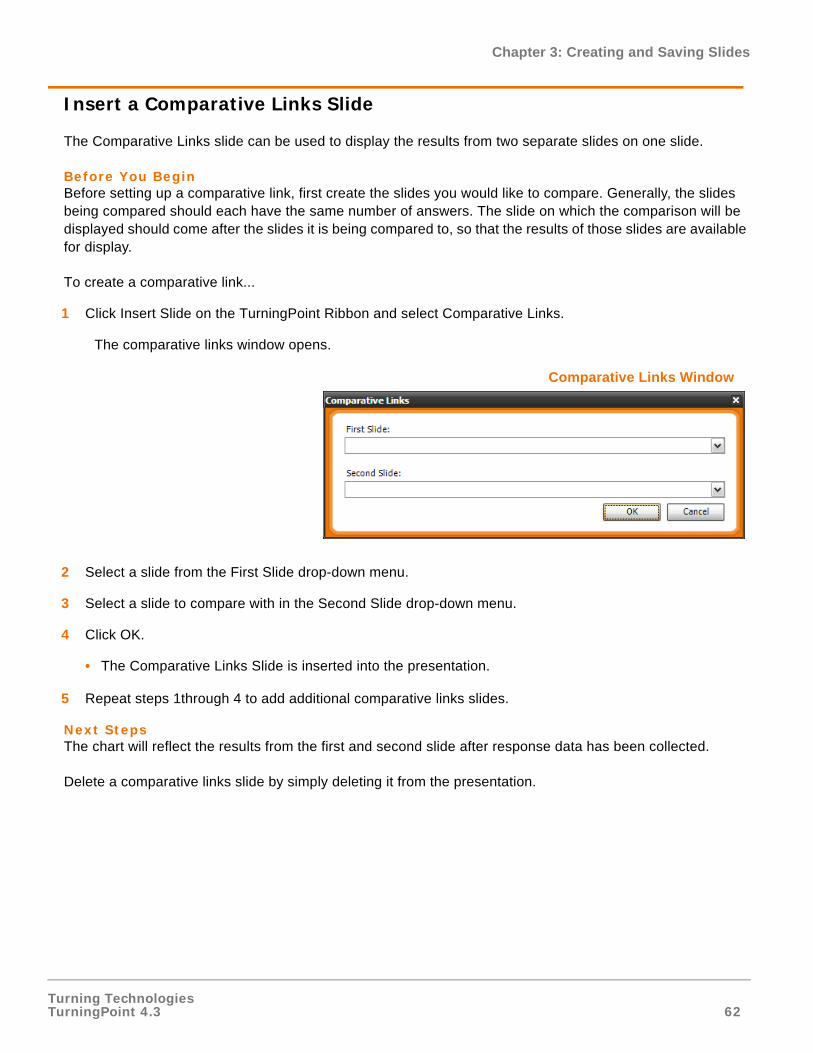
The comparative links window opens.
Comparative Links Window
2 Select a slide from the First Slide drop-down menu.
3 Select a slide to compare with in the Second Slide drop-down menu.
4 Click OK.
• The Comparative Links Slide is inserted into the presentation.
5 Repeat steps 1through 4 to add additional comparative links slides.
Next StepsThe chart will reflect the results from the first and second slide after response data has been collected.
Delete a comparative links slide by simply deleting it from the presentation.
Turning TechnologiesTurningPoint 4.3 63
Chapter 3: Creating and Saving Slides
Modify Slides
TurningPoint slides are simply ordinary PowerPoint slides with extra features, customize them as you would an ordinary PowerPoint slide. Reorder slides, move objects, add text and pictures, apply fonts and color schemes, and use animations.
Modify the features TurningPoint adds to your slides by changing chart types and colors, using pictures for answers, and adding Correct Answer Indicators.
This section describes how to:
• Designate a Demographic Slide
• Change Chart Types
• Enable Zero-based Polling
• Identify a Correct Answer from the Settings Window
• Identify a Correct Answer on a TurningPoint Slide
• Use Keywords for Fill in the Blank Slides
• Set Point Values from the Settings Window
• Set Point Values on a TurningPoint Slide
• Clear Answer Values from the Settings Window
• Clear Answer Values on a TurningPoint Slide
• Use Speed Scoring
• Create Picture Slides
• Change Chart Colors
• Make a PowerPoint Slide Interactive by Inserting a Chart
• Disable Auto Scale in Charts
Note Chart settings will retain any modifications made, even after adding or removing answers on the modified chart slides.
Turning TechnologiesTurningPoint 4.3 64
Chapter 3: Creating and Saving Slides
Designate a Demographic Slide
You can designate a slide as demographic to see how a certain group in your audience responds to certain questions. Slides designated as Demographic can be used in conjunction with Demographic Comparison Slides or Demographic Reports.
To designate a slide as “Demographic”...
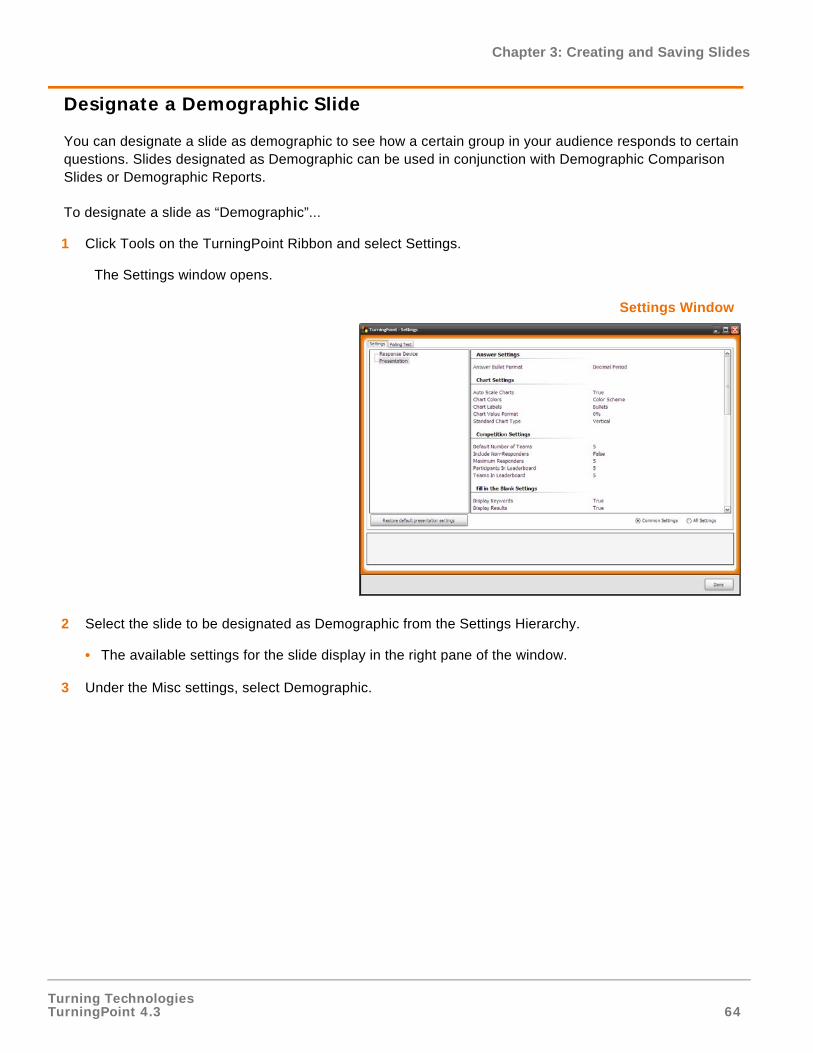
1 Click Tools on the TurningPoint Ribbon and select Settings.
The Settings window opens.
Settings Window
2 Select the slide to be designated as Demographic from the Settings Hierarchy.
• The available settings for the slide display in the right pane of the window.
3 Under the Misc settings, select Demographic.
Turning TechnologiesTurningPoint 4.3 65
Chapter 3: Creating and Saving Slides
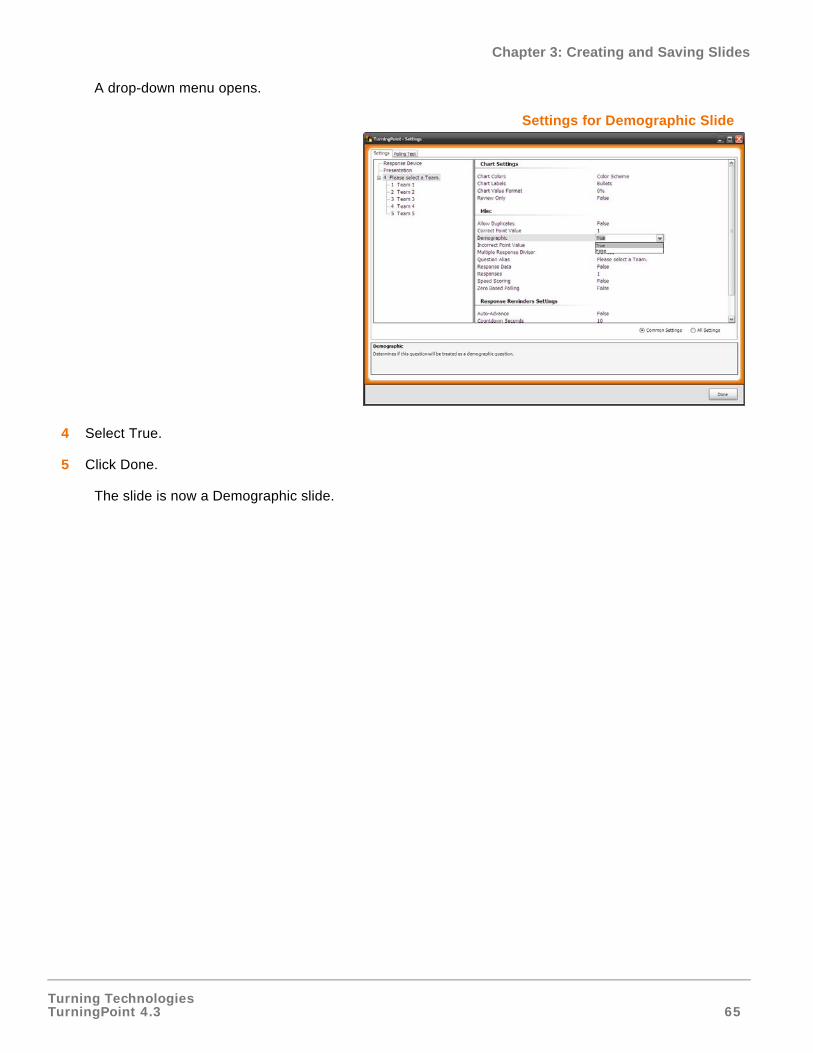
A drop-down menu opens.
Settings for Demographic Slide
4 Select True.
5 Click Done.
The slide is now a Demographic slide.
Turning TechnologiesTurningPoint 4.3 66
Chapter 3: Creating and Saving Slides
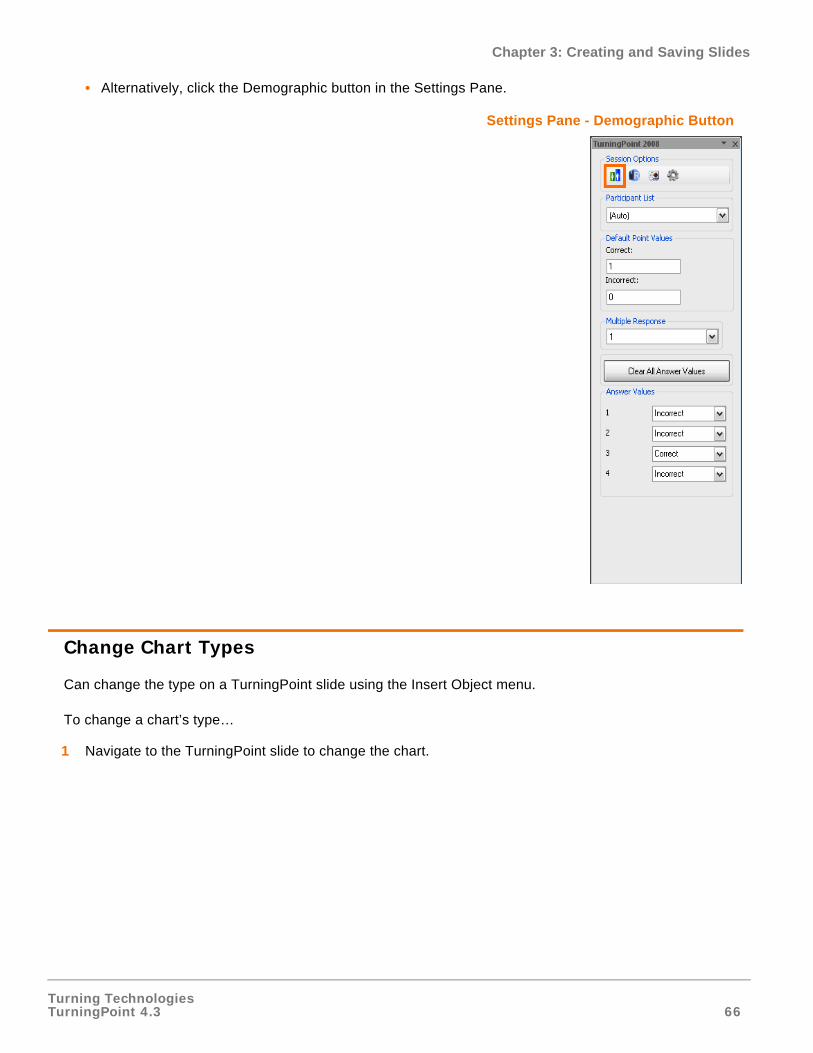
• Alternatively, click the Demographic button in the Settings Pane.
Settings Pane - Demographic Button
Change Chart Types
Can change the type on a TurningPoint slide using the Insert Object menu.
To change a chart’s type…
1 Navigate to the TurningPoint slide to change the chart.
Turning TechnologiesTurningPoint 4.3 67
Chapter 3: Creating and Saving Slides
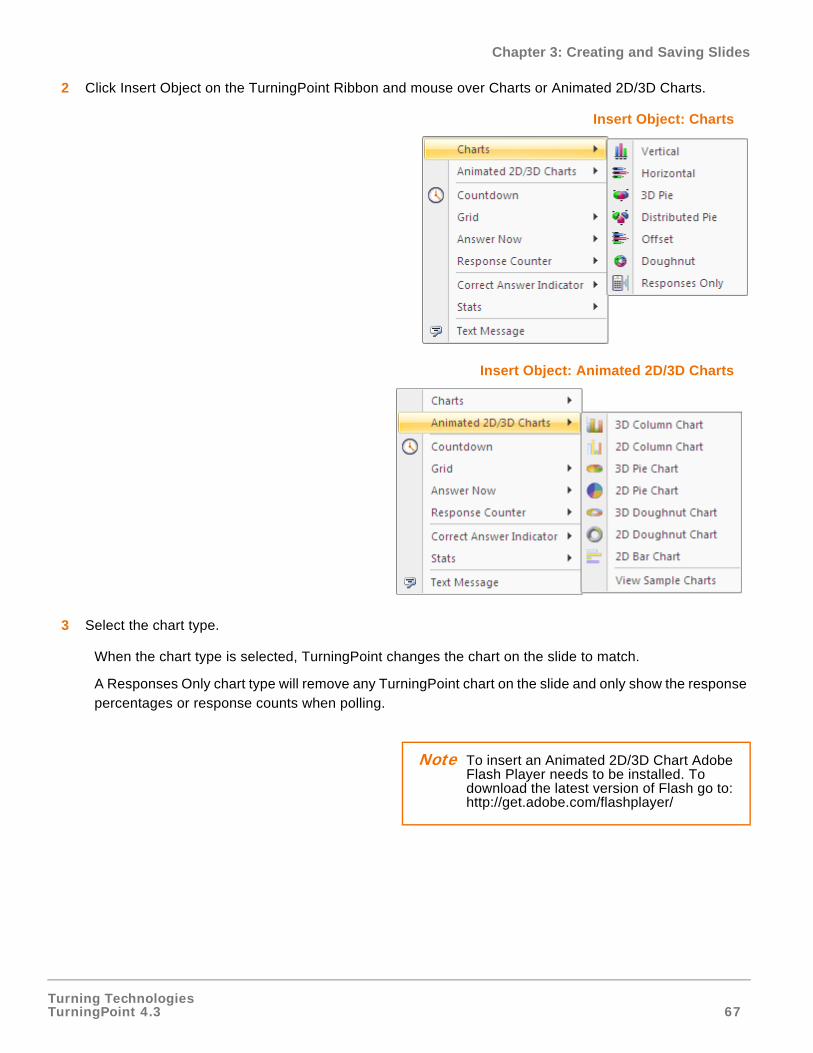
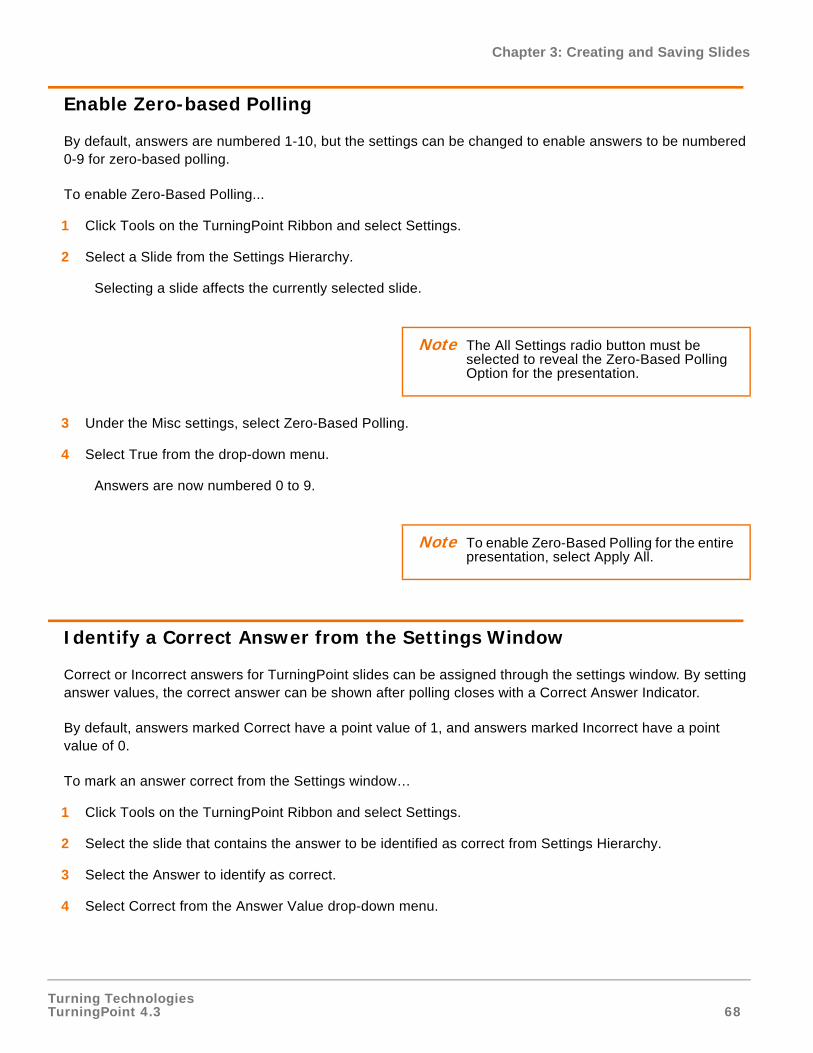
2 Click Insert Object on the TurningPoint Ribbon and mouse over Charts or Animated 2D/3D Charts.
Insert Object: Charts
Insert Object: Animated 2D/3D Charts
3 Select the chart type.
When the chart type is selected, TurningPoint changes the chart on the slide to match.
A Responses Only chart type will remove any TurningPoint chart on the slide and only show the response percentages or response counts when polling.
Note To insert an Animated 2D/3D Chart Adobe Flash Player needs to be installed. To download the latest version of Flash go to: http://get.adobe.com/flashplayer/
Turning TechnologiesTurningPoint 4.3 68
Chapter 3: Creating and Saving Slides
Enable Zero-based Polling
By default, answers are numbered 1-10, but the settings can be changed to enable answers to be numbered 0-9 for zero-based polling.
To enable Zero-Based Polling...
1 Click Tools on the TurningPoint Ribbon and select Settings.
2 Select a Slide from the Settings Hierarchy.
Selecting a slide affects the currently selected slide.
3 Under the Misc settings, select Zero-Based Polling.
4 Select True from the drop-down menu.
Answers are now numbered 0 to 9.
Identify a Correct Answer from the Settings Window
Correct or Incorrect answers for TurningPoint slides can be assigned through the settings window. By setting answer values, the correct answer can be shown after polling closes with a Correct Answer Indicator.
By default, answers marked Correct have a point value of 1, and answers marked Incorrect have a point value of 0.
To mark an answer correct from the Settings window…
1 Click Tools on the TurningPoint Ribbon and select Settings.
2 Select the slide that contains the answer to be identified as correct from Settings Hierarchy.
3 Select the Answer to identify as correct.
4 Select Correct from the Answer Value drop-down menu.
Note The All Settings radio button must be selected to reveal the Zero-Based Polling Option for the presentation.
Note To enable Zero-Based Polling for the entire presentation, select Apply All.
Turning TechnologiesTurningPoint 4.3 69
Chapter 3: Creating and Saving Slides
TurningPoint sets the selected answer as Correct and automatically sets all other answers on that slide as Incorrect.
More than one correct answer on a slide can be set by repeating these steps on another answer.
Change an answer you marked as Correct to Incorrect by repeating these steps and selecting Incorrect from the drop-down menu.
Identify a Correct Answer on a TurningPoint Slide
By default, answers marked Correct have a point value of 1, and answers marked Incorrect have a point value of 0.
To mark an answer correct…
1 Navigate to the slide to mark a Correct Answer.
2 Place the cursor in the Answer Region of the slide.
Note The Answer Value can be set to Correct or Incorrect from the slide. Find more information in Identify a Correct Answer on a TurningPoint Slide on page 69.
Turning TechnologiesTurningPoint 4.3 70
Chapter 3: Creating and Saving Slides
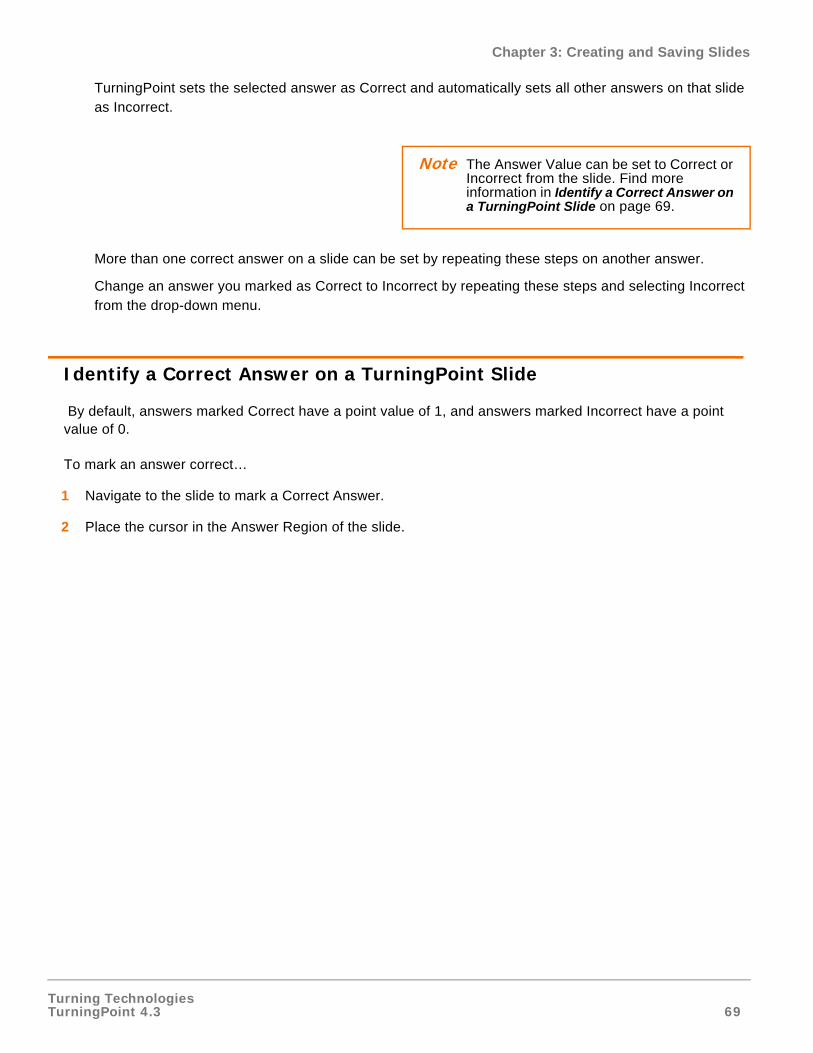
An Answer Values Task Pane opens and displays a list of the answers and their current answer values.
Settings Pane - Answer Values
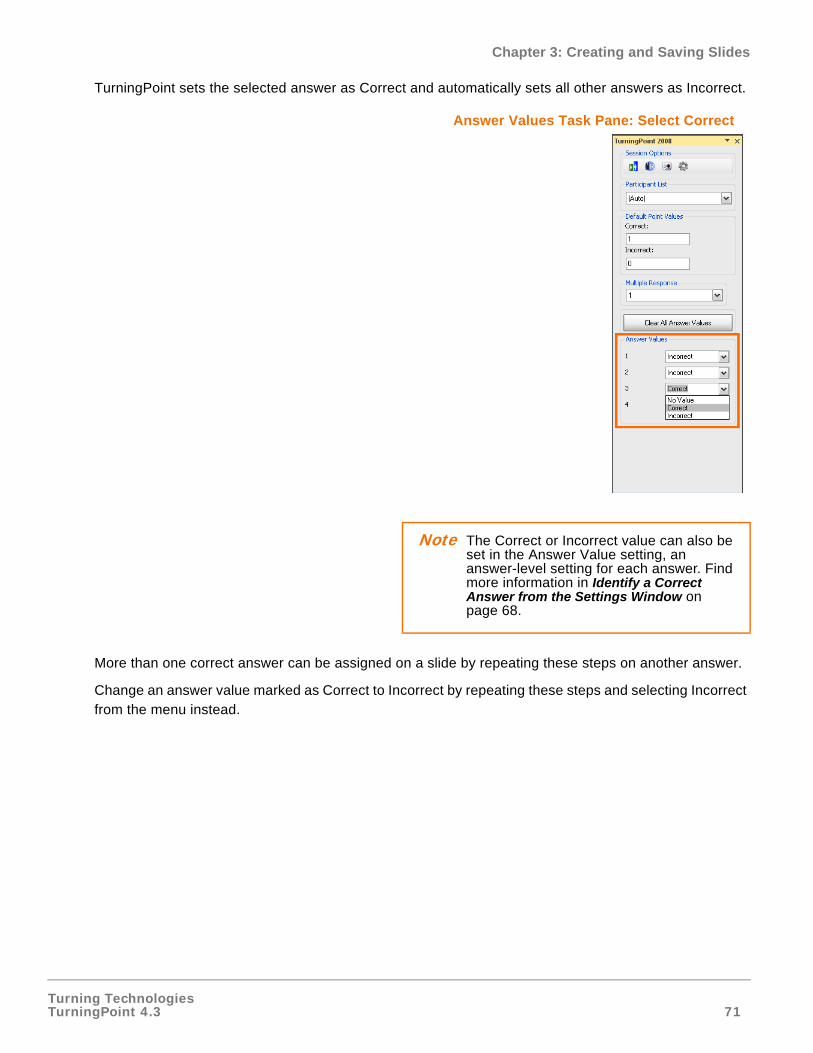
3 Select Correct from the Answer Value drop-down menu.
Turning TechnologiesTurningPoint 4.3 71
Chapter 3: Creating and Saving Slides
TurningPoint sets the selected answer as Correct and automatically sets all other answers as Incorrect.
Answer Values Task Pane: Select Correct
More than one correct answer can be assigned on a slide by repeating these steps on another answer.
Change an answer value marked as Correct to Incorrect by repeating these steps and selecting Incorrect from the menu instead.
Note The Correct or Incorrect value can also be set in the Answer Value setting, an answer-level setting for each answer. Find more information in Identify a Correct Answer from the Settings Window on page 68.
Turning TechnologiesTurningPoint 4.3 72
Chapter 3: Creating and Saving Slides
Use Keywords for Fill in the Blank Slides
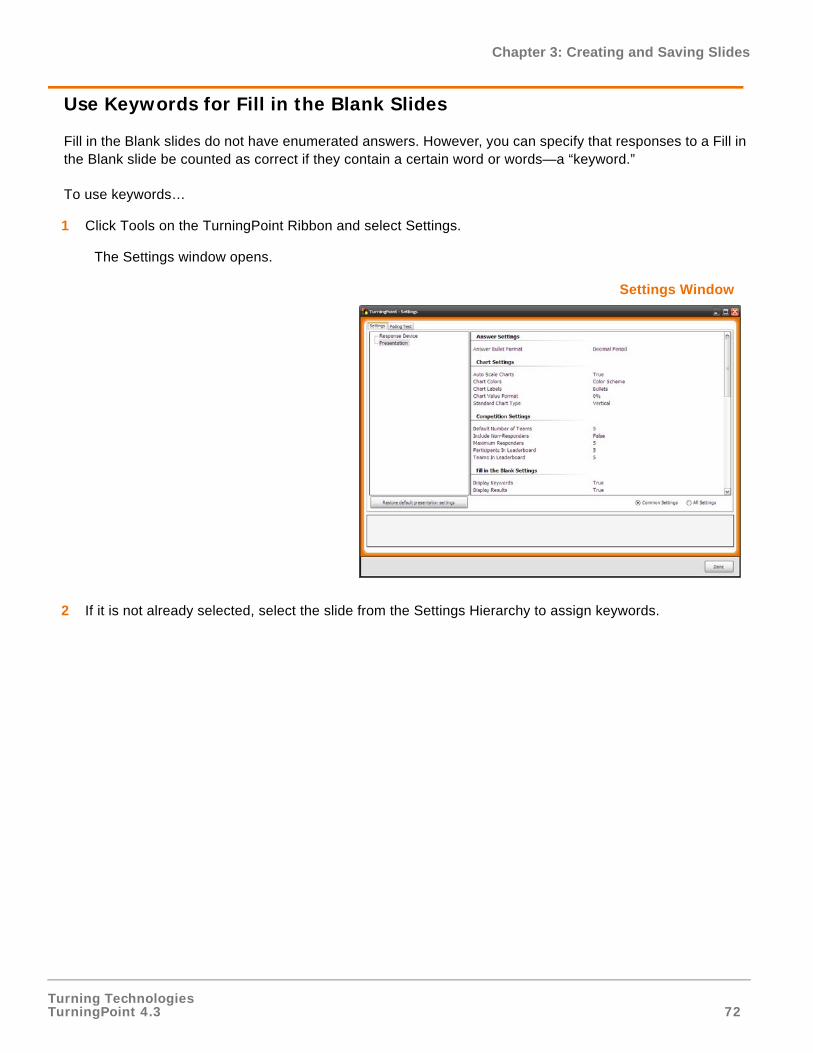
Fill in the Blank slides do not have enumerated answers. However, you can specify that responses to a Fill in the Blank slide be counted as correct if they contain a certain word or words—a “keyword.”
To use keywords…
1 Click Tools on the TurningPoint Ribbon and select Settings.
The Settings window opens.
Settings Window
2 If it is not already selected, select the slide from the Settings Hierarchy to assign keywords.
Turning TechnologiesTurningPoint 4.3 73
Chapter 3: Creating and Saving Slides
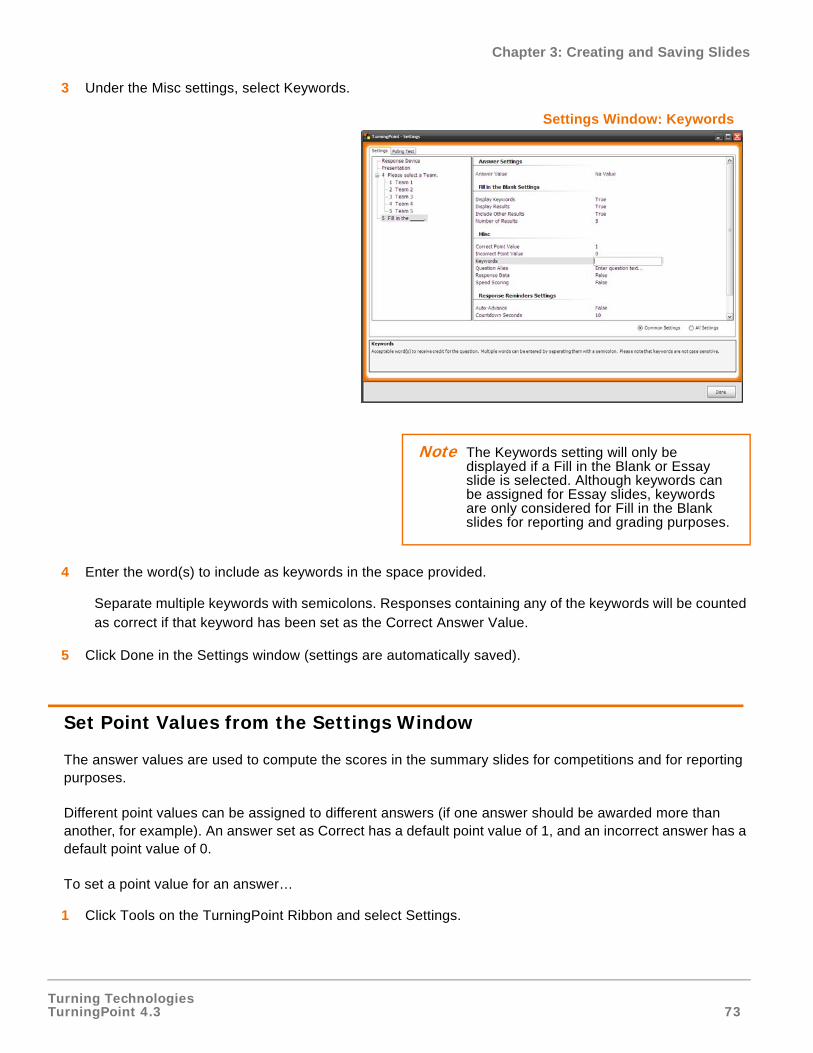
3 Under the Misc settings, select Keywords.
Settings Window: Keywords
4 Enter the word(s) to include as keywords in the space provided.
Separate multiple keywords with semicolons. Responses containing any of the keywords will be counted as correct if that keyword has been set as the Correct Answer Value.
5 Click Done in the Settings window (settings are automatically saved).
Set Point Values from the Settings Window
The answer values are used to compute the scores in the summary slides for competitions and for reporting purposes.
Different point values can be assigned to different answers (if one answer should be awarded more than another, for example). An answer set as Correct has a default point value of 1, and an incorrect answer has a default point value of 0.
To set a point value for an answer…
1 Click Tools on the TurningPoint Ribbon and select Settings.
Note The Keywords setting will only be displayed if a Fill in the Blank or Essay slide is selected. Although keywords can be assigned for Essay slides, keywords are only considered for Fill in the Blank slides for reporting and grading purposes.
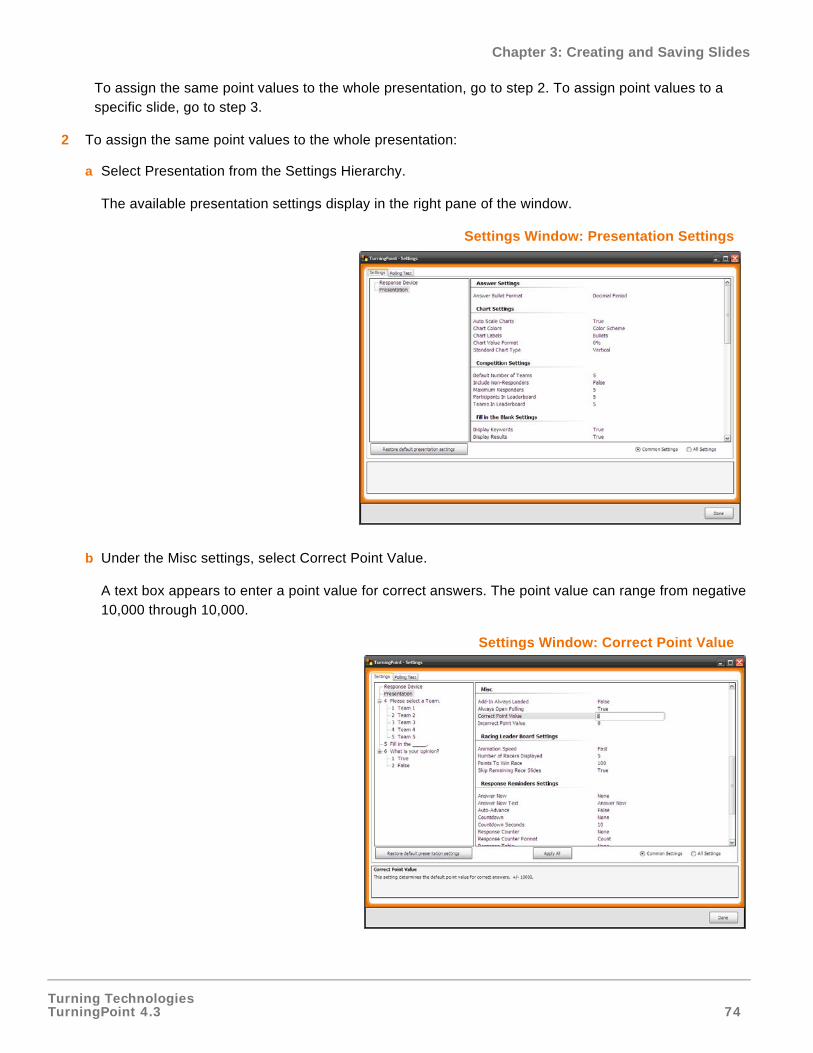
Turning TechnologiesTurningPoint 4.3 74
Chapter 3: Creating and Saving Slides
To assign the same point values to the whole presentation, go to step 2. To assign point values to a specific slide, go to step 3.
2 To assign the same point values to the whole presentation:
a Select Presentation from the Settings Hierarchy.
The available presentation settings display in the right pane of the window.
Settings Window: Presentation Settings
b Under the Misc settings, select Correct Point Value.
A text box appears to enter a point value for correct answers. The point value can range from negative 10,000 through 10,000.
Settings Window: Correct Point Value
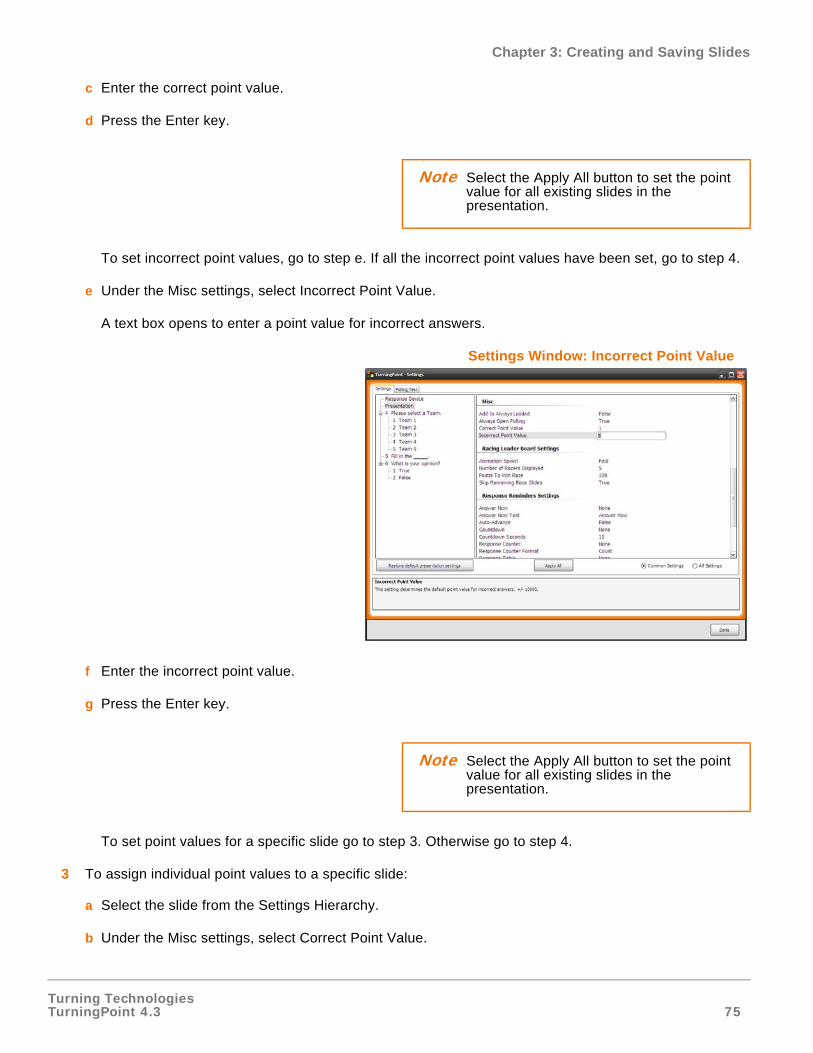
Turning TechnologiesTurningPoint 4.3 75
Chapter 3: Creating and Saving Slides
c Enter the correct point value.
d Press the Enter key.
To set incorrect point values, go to step e. If all the incorrect point values have been set, go to step 4.
e Under the Misc settings, select Incorrect Point Value.
A text box opens to enter a point value for incorrect answers.
Settings Window: Incorrect Point Value
f Enter the incorrect point value.
g Press the Enter key.
To set point values for a specific slide go to step 3. Otherwise go to step 4.
3 To assign individual point values to a specific slide:
a Select the slide from the Settings Hierarchy.
b Under the Misc settings, select Correct Point Value.
Note Select the Apply All button to set the point value for all existing slides in the presentation.
Note Select the Apply All button to set the point value for all existing slides in the presentation.
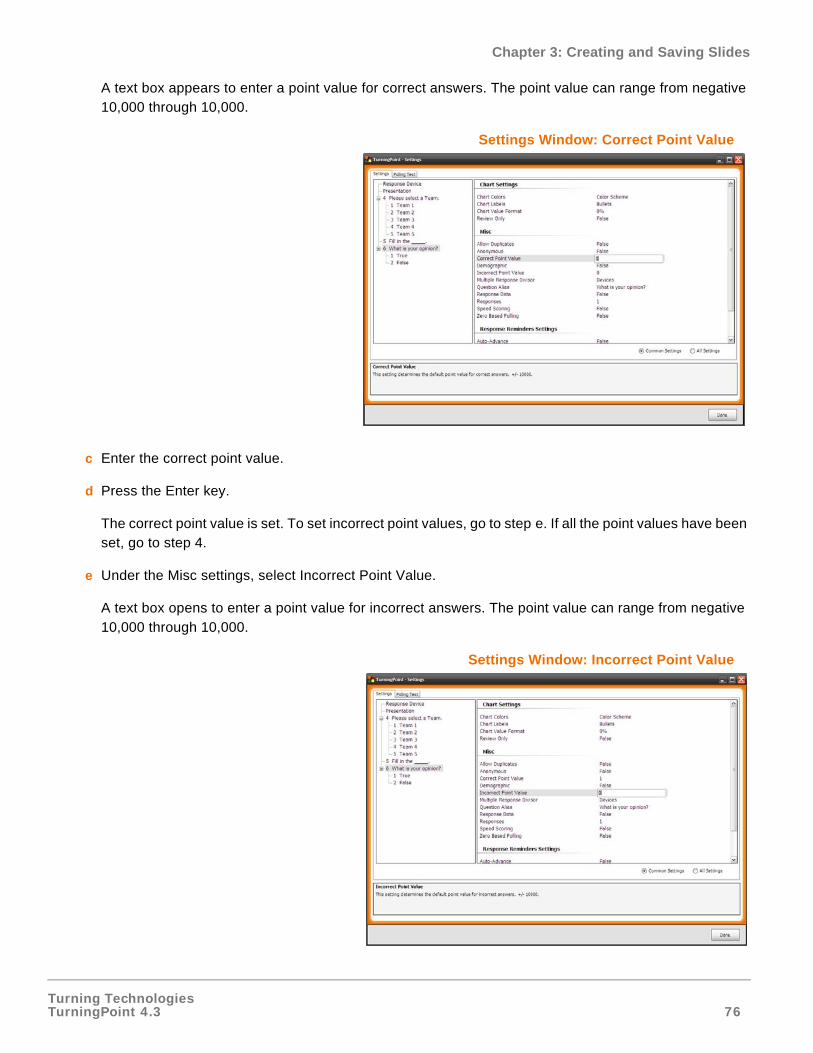
Turning TechnologiesTurningPoint 4.3 76
Chapter 3: Creating and Saving Slides
A text box appears to enter a point value for correct answers. The point value can range from negative 10,000 through 10,000.
Settings Window: Correct Point Value
c Enter the correct point value.
d Press the Enter key.
The correct point value is set. To set incorrect point values, go to step e. If all the point values have been set, go to step 4.
e Under the Misc settings, select Incorrect Point Value.
A text box opens to enter a point value for incorrect answers. The point value can range from negative 10,000 through 10,000.
Settings Window: Incorrect Point Value
Turning TechnologiesTurningPoint 4.3 77
Chapter 3: Creating and Saving Slides
f Enter the incorrect point value.
g Press the Enter key.
The incorrect point value is set.
Repeat step 3 for each slide to assign individual point values. When finished setting the point values, go to step 4.
Change the point value by repeating these steps on the same slide and entering a new point value.
4 Click Done.
Use speed scoring to award points for answers proportionally to fastest responders on an individual basis or in team competitions. Find more information in Use Speed Scoring on page 81.
Set Point Values on a TurningPoint Slide
Answer values are used to calculate individual and team scores from summary slides used during competitions and for reporting purposes.
Different point values can be assigned to different answers (if one answer should be awarded more than another, for example). An answer set as Correct has a default point value of 1, and an incorrect answer has a default value of 0.
To set a point value for an answer…
1 Navigate to the slide on which to set point values.
2 Make sure the settings Task Pane is enabled.
Note The point value can also be set directly on a TurningPoint slide. Find more information in Set Point Values on a TurningPoint Slide on page 77.
Note If negative points have been assigned to a correct answer or positive points to an incorrect answer, use the Point Value reports. The Percentage Reports treat the correct answers with negative point values as incorrect answers and incorrect answer with positive point values as correct answers.
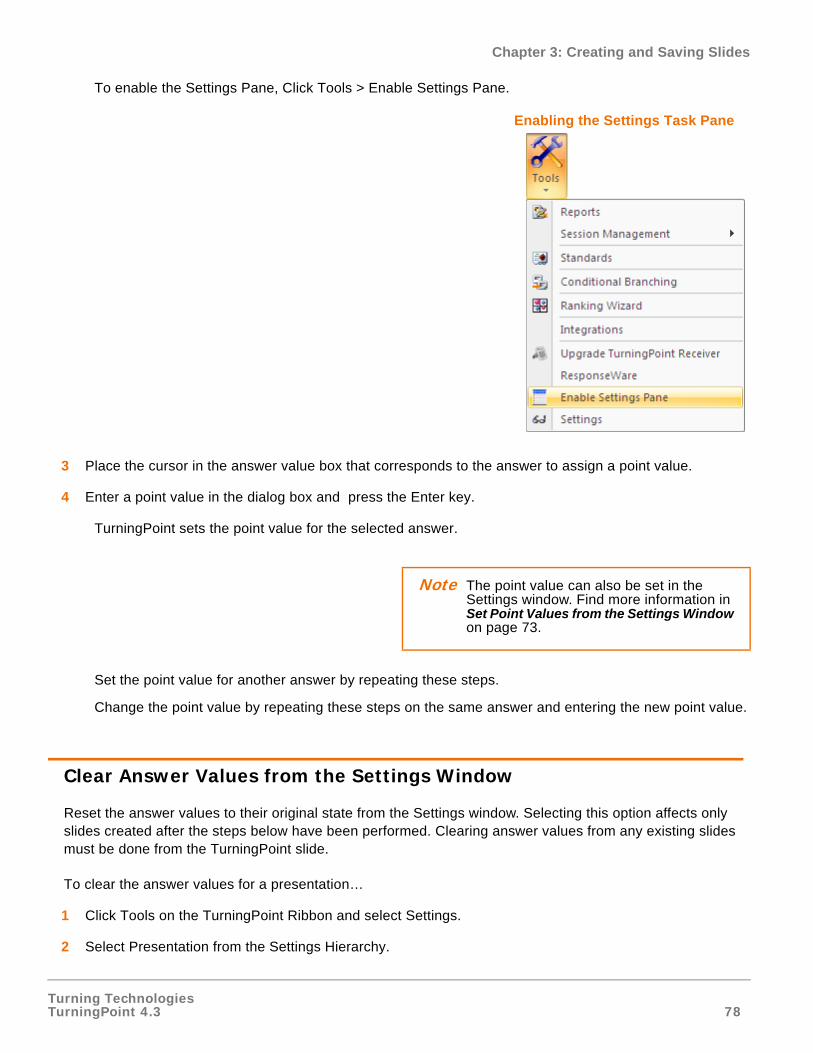
Turning TechnologiesTurningPoint 4.3 78
Chapter 3: Creating and Saving Slides
To enable the Settings Pane, Click Tools > Enable Settings Pane.
Enabling the Settings Task Pane
3 Place the cursor in the answer value box that corresponds to the answer to assign a point value.
4 Enter a point value in the dialog box and press the Enter key.
TurningPoint sets the point value for the selected answer.
Set the point value for another answer by repeating these steps.
Change the point value by repeating these steps on the same answer and entering the new point value.
Clear Answer Values from the Settings Window
Reset the answer values to their original state from the Settings window. Selecting this option affects only slides created after the steps below have been performed. Clearing answer values from any existing slides must be done from the TurningPoint slide.
To clear the answer values for a presentation…
1 Click Tools on the TurningPoint Ribbon and select Settings.
2 Select Presentation from the Settings Hierarchy.
Note The point value can also be set in the Settings window. Find more information in Set Point Values from the Settings Window on page 73.
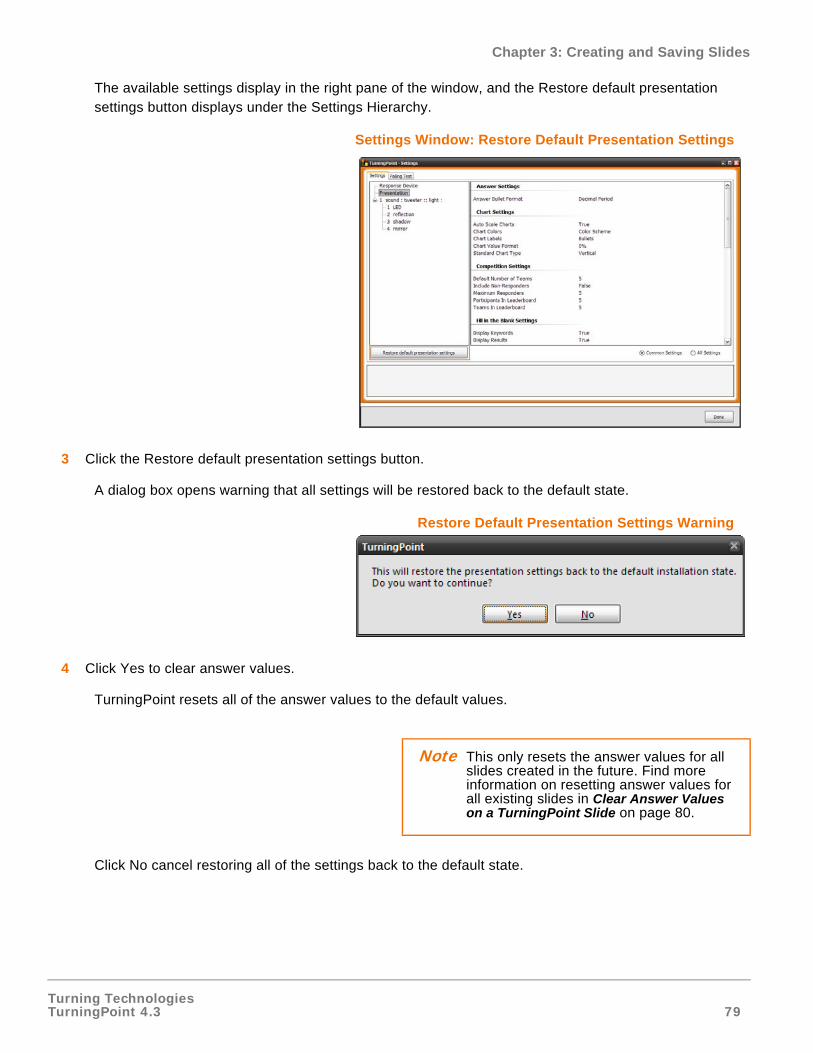
Turning TechnologiesTurningPoint 4.3 79
Chapter 3: Creating and Saving Slides
The available settings display in the right pane of the window, and the Restore default presentation settings button displays under the Settings Hierarchy.
Settings Window: Restore Default Presentation Settings
3 Click the Restore default presentation settings button.
A dialog box opens warning that all settings will be restored back to the default state.
Restore Default Presentation Settings Warning
4 Click Yes to clear answer values.
TurningPoint resets all of the answer values to the default values.
Click No cancel restoring all of the settings back to the default state.
Note This only resets the answer values for all slides created in the future. Find more information on resetting answer values for all existing slides in Clear Answer Values on a TurningPoint Slide on page 80.
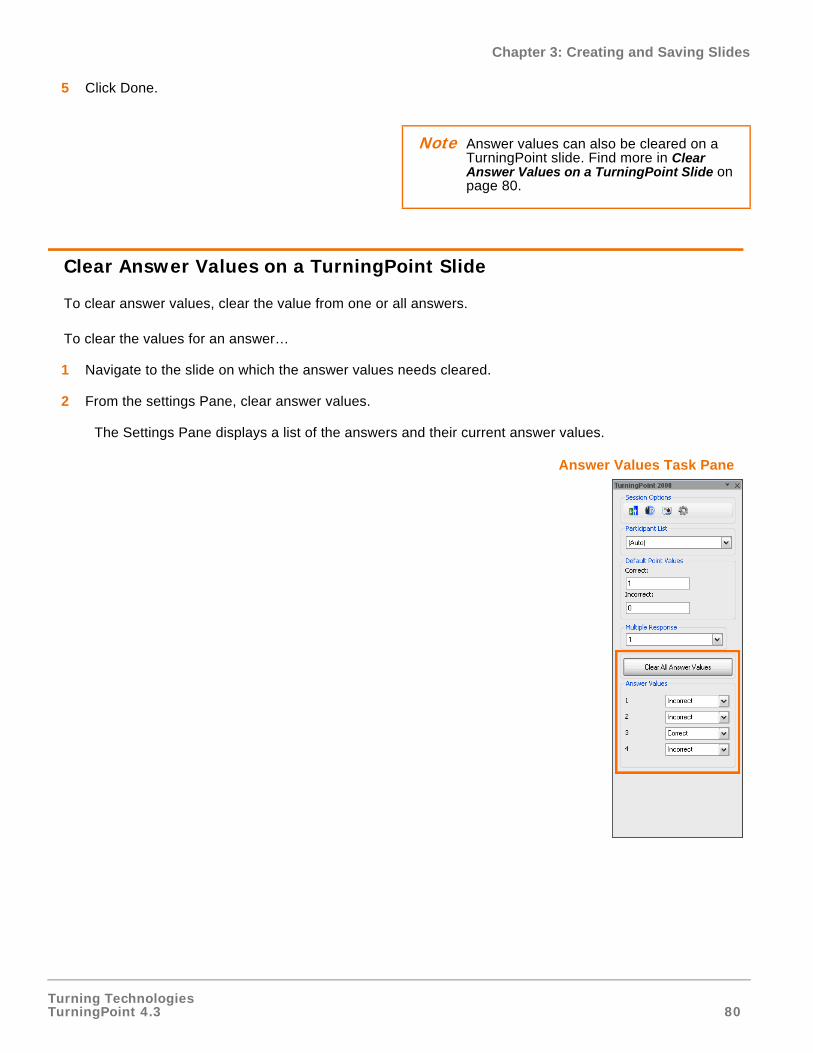
Turning TechnologiesTurningPoint 4.3 80
Chapter 3: Creating and Saving Slides
5 Click Done.
Clear Answer Values on a TurningPoint Slide
To clear answer values, clear the value from one or all answers.
To clear the values for an answer…
1 Navigate to the slide on which the answer values needs cleared.
2 From the settings Pane, clear answer values.
The Settings Pane displays a list of the answers and their current answer values.
Answer Values Task Pane
Note Answer values can also be cleared on a TurningPoint slide. Find more in Clear Answer Values on a TurningPoint Slide on page 80.
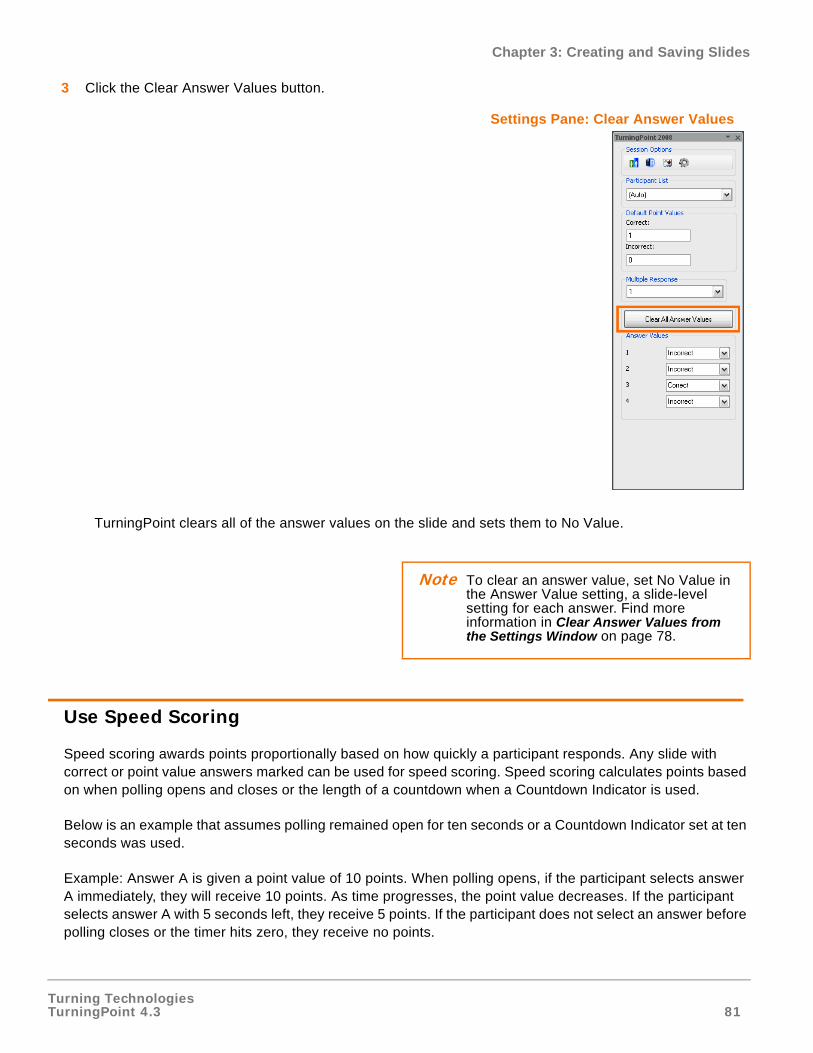
Turning TechnologiesTurningPoint 4.3 81
Chapter 3: Creating and Saving Slides
3 Click the Clear Answer Values button.
Settings Pane: Clear Answer Values
TurningPoint clears all of the answer values on the slide and sets them to No Value.
Use Speed Scoring
Speed scoring awards points proportionally based on how quickly a participant responds. Any slide with correct or point value answers marked can be used for speed scoring. Speed scoring calculates points based on when polling opens and closes or the length of a countdown when a Countdown Indicator is used.
Below is an example that assumes polling remained open for ten seconds or a Countdown Indicator set at ten seconds was used.
Example: Answer A is given a point value of 10 points. When polling opens, if the participant selects answer A immediately, they will receive 10 points. As time progresses, the point value decreases. If the participant selects answer A with 5 seconds left, they receive 5 points. If the participant does not select an answer before polling closes or the timer hits zero, they receive no points.
Note To clear an answer value, set No Value in the Answer Value setting, a slide-level setting for each answer. Find more information in Clear Answer Values from the Settings Window on page 78.
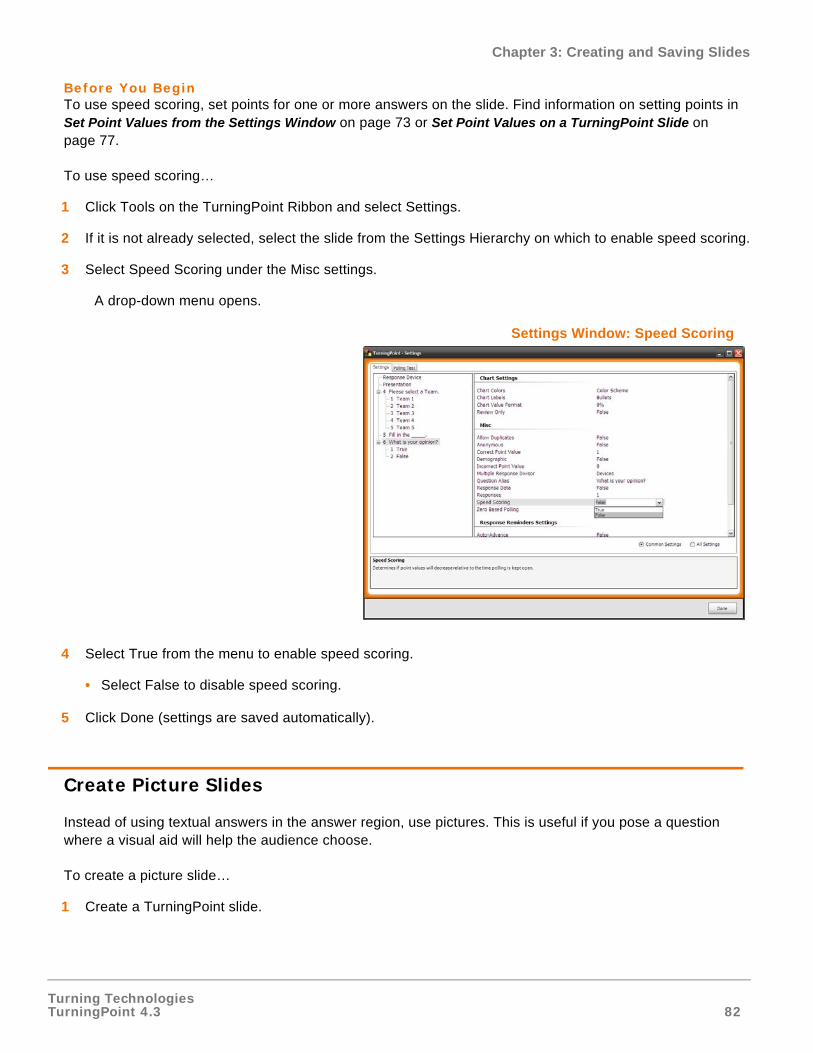
Turning TechnologiesTurningPoint 4.3 82
Chapter 3: Creating and Saving Slides
Before You BeginTo use speed scoring, set points for one or more answers on the slide. Find information on setting points in Set Point Values from the Settings Window on page 73 or Set Point Values on a TurningPoint Slide on page 77.
To use speed scoring…
1 Click Tools on the TurningPoint Ribbon and select Settings.
2 If it is not already selected, select the slide from the Settings Hierarchy on which to enable speed scoring.
3 Select Speed Scoring under the Misc settings.
A drop-down menu opens.
Settings Window: Speed Scoring
4 Select True from the menu to enable speed scoring.
• Select False to disable speed scoring.
5 Click Done (settings are saved automatically).
Create Picture Slides
Instead of using textual answers in the answer region, use pictures. This is useful if you pose a question where a visual aid will help the audience choose.
To create a picture slide…
1 Create a TurningPoint slide.
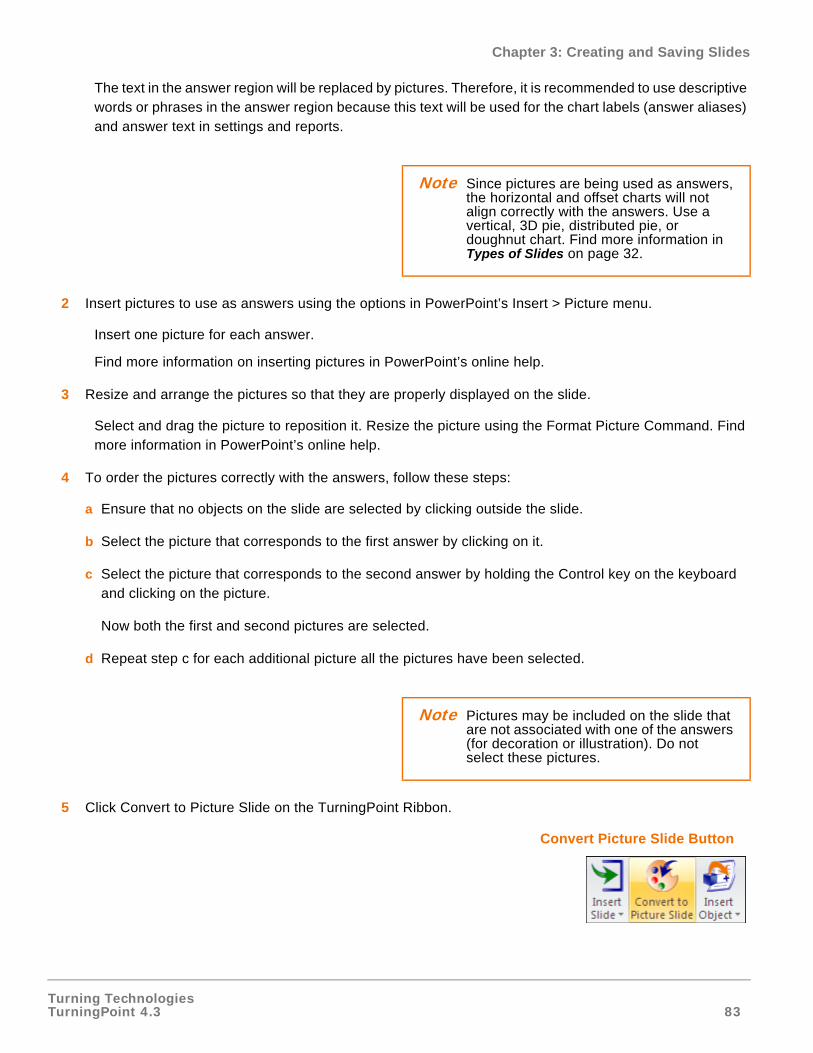
Turning TechnologiesTurningPoint 4.3 83
Chapter 3: Creating and Saving Slides
The text in the answer region will be replaced by pictures. Therefore, it is recommended to use descriptive words or phrases in the answer region because this text will be used for the chart labels (answer aliases) and answer text in settings and reports.
2 Insert pictures to use as answers using the options in PowerPoint’s Insert > Picture menu.
Insert one picture for each answer.
Find more information on inserting pictures in PowerPoint’s online help.
3 Resize and arrange the pictures so that they are properly displayed on the slide.
Select and drag the picture to reposition it. Resize the picture using the Format Picture Command. Find more information in PowerPoint’s online help.
4 To order the pictures correctly with the answers, follow these steps:
a Ensure that no objects on the slide are selected by clicking outside the slide.
b Select the picture that corresponds to the first answer by clicking on it.
c Select the picture that corresponds to the second answer by holding the Control key on the keyboard and clicking on the picture.
Now both the first and second pictures are selected.
d Repeat step c for each additional picture all the pictures have been selected.
5 Click Convert to Picture Slide on the TurningPoint Ribbon.
Convert Picture Slide Button
Note Since pictures are being used as answers, the horizontal and offset charts will not align correctly with the answers. Use a vertical, 3D pie, distributed pie, or doughnut chart. Find more information in Types of Slides on page 32.
Note Pictures may be included on the slide that are not associated with one of the answers (for decoration or illustration). Do not select these pictures.
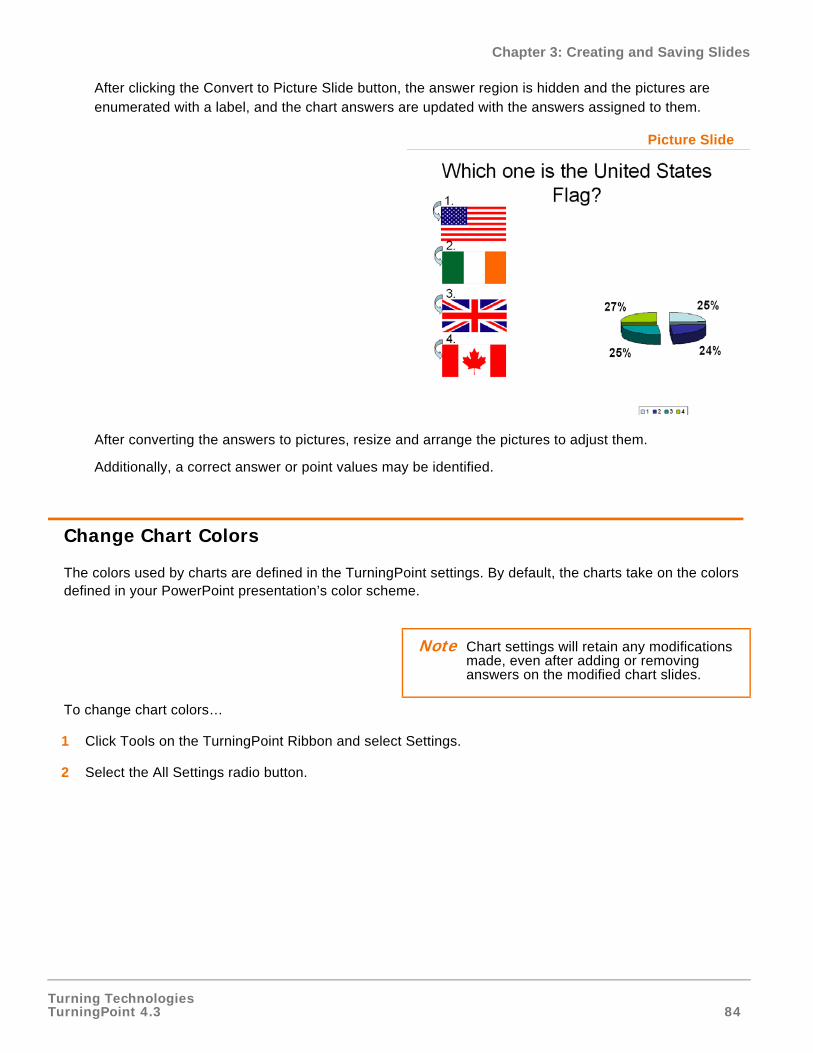
Turning TechnologiesTurningPoint 4.3 84
Chapter 3: Creating and Saving Slides
After clicking the Convert to Picture Slide button, the answer region is hidden and the pictures are enumerated with a label, and the chart answers are updated with the answers assigned to them.
Picture Slide
After converting the answers to pictures, resize and arrange the pictures to adjust them.
Additionally, a correct answer or point values may be identified.
Change Chart Colors
The colors used by charts are defined in the TurningPoint settings. By default, the charts take on the colors defined in your PowerPoint presentation’s color scheme.
To change chart colors…
1 Click Tools on the TurningPoint Ribbon and select Settings.
2 Select the All Settings radio button.
Note Chart settings will retain any modifications made, even after adding or removing answers on the modified chart slides.
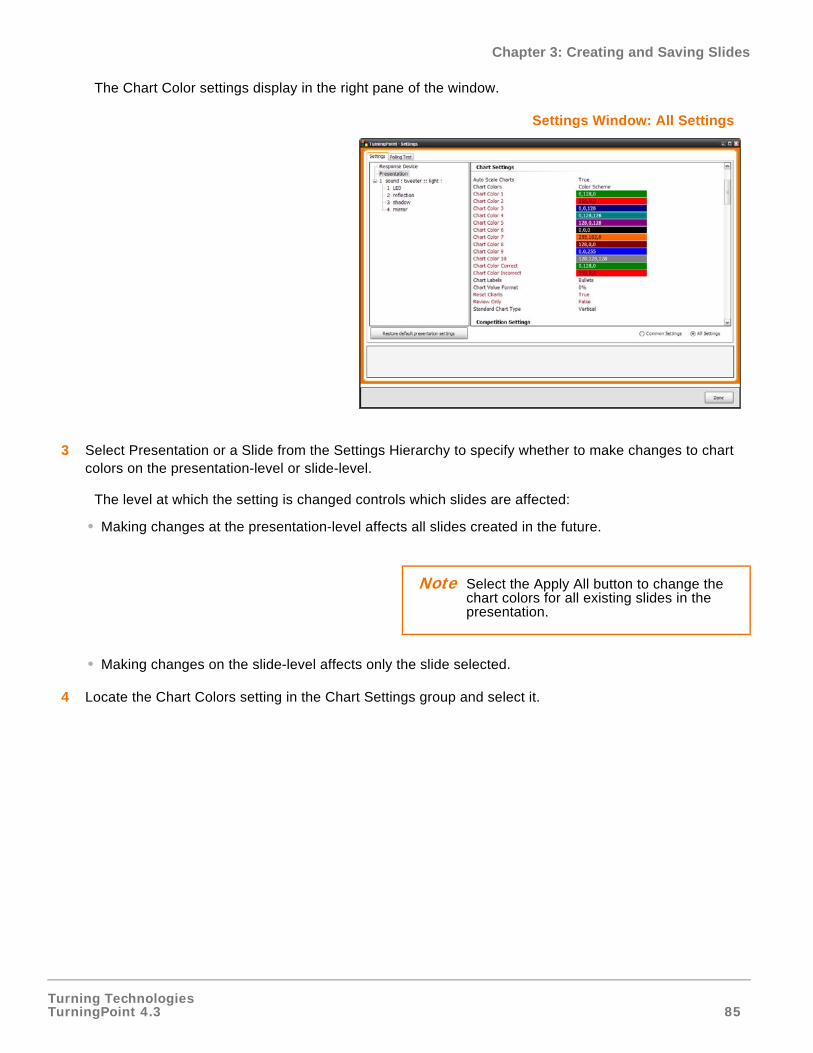
Turning TechnologiesTurningPoint 4.3 85
Chapter 3: Creating and Saving Slides
The Chart Color settings display in the right pane of the window.
Settings Window: All Settings
3 Select Presentation or a Slide from the Settings Hierarchy to specify whether to make changes to chart colors on the presentation-level or slide-level.
The level at which the setting is changed controls which slides are affected:
• Making changes at the presentation-level affects all slides created in the future.
• Making changes on the slide-level affects only the slide selected.
4 Locate the Chart Colors setting in the Chart Settings group and select it.
Note Select the Apply All button to change the chart colors for all existing slides in the presentation.
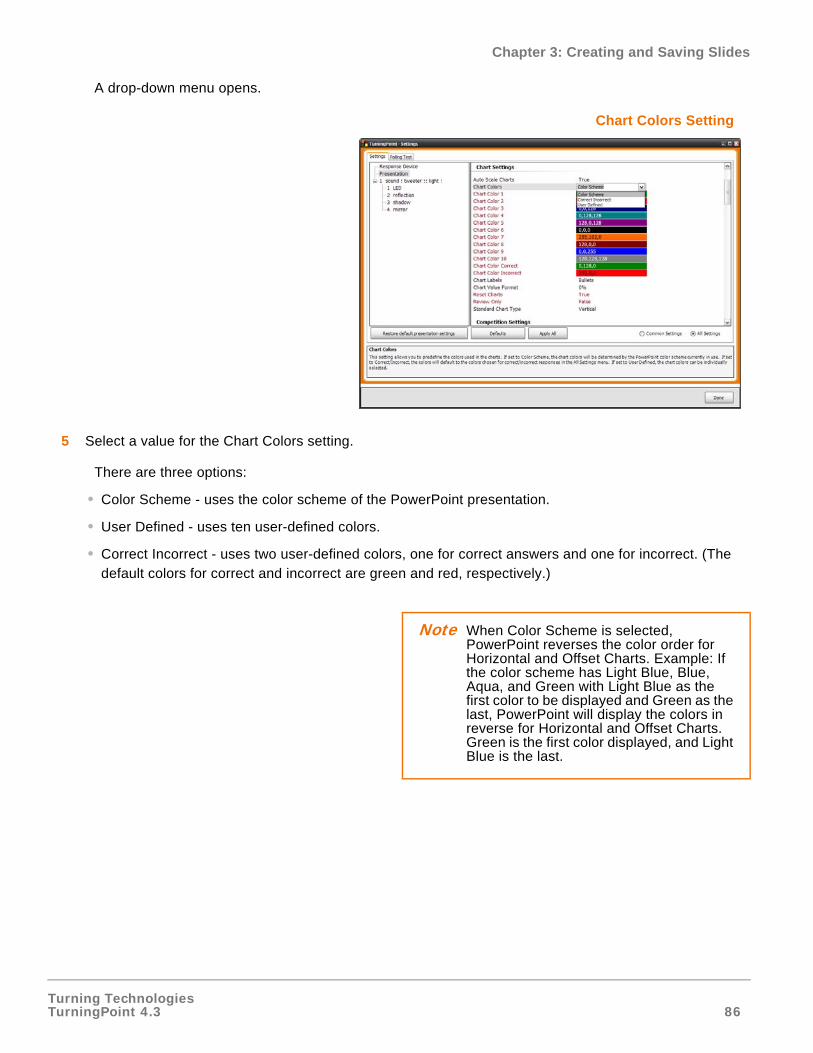
Turning TechnologiesTurningPoint 4.3 86
Chapter 3: Creating and Saving Slides
A drop-down menu opens.
Chart Colors Setting
5 Select a value for the Chart Colors setting.
There are three options:
• Color Scheme - uses the color scheme of the PowerPoint presentation.
• User Defined - uses ten user-defined colors.
• Correct Incorrect - uses two user-defined colors, one for correct answers and one for incorrect. (The default colors for correct and incorrect are green and red, respectively.)
Note When Color Scheme is selected, PowerPoint reverses the color order for Horizontal and Offset Charts. Example: If the color scheme has Light Blue, Blue, Aqua, and Green with Light Blue as the first color to be displayed and Green as the last, PowerPoint will display the colors in reverse for Horizontal and Offset Charts. Green is the first color displayed, and Light Blue is the last.
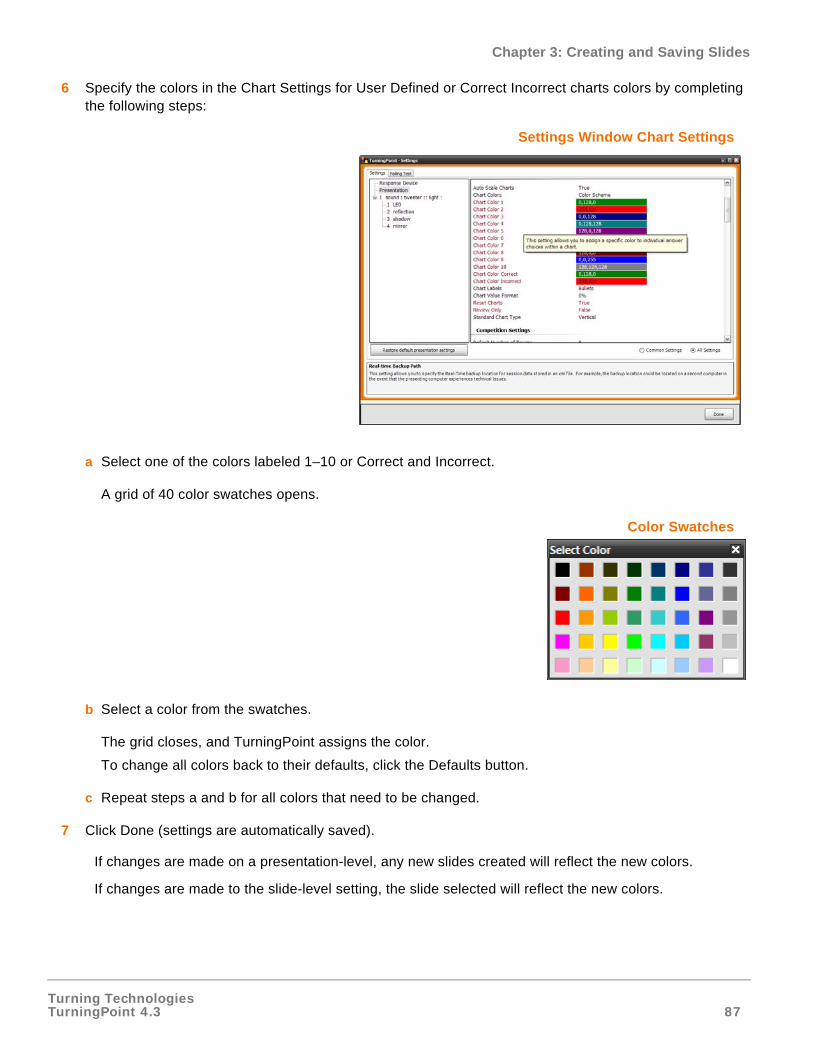
Turning TechnologiesTurningPoint 4.3 87
Chapter 3: Creating and Saving Slides
6 Specify the colors in the Chart Settings for User Defined or Correct Incorrect charts colors by completing the following steps:
Settings Window Chart Settings
a Select one of the colors labeled 1–10 or Correct and Incorrect.
A grid of 40 color swatches opens.
Color Swatches
b Select a color from the swatches.
The grid closes, and TurningPoint assigns the color.
To change all colors back to their defaults, click the Defaults button.
c Repeat steps a and b for all colors that need to be changed.
7 Click Done (settings are automatically saved).
If changes are made on a presentation-level, any new slides created will reflect the new colors.
If changes are made to the slide-level setting, the slide selected will reflect the new colors.
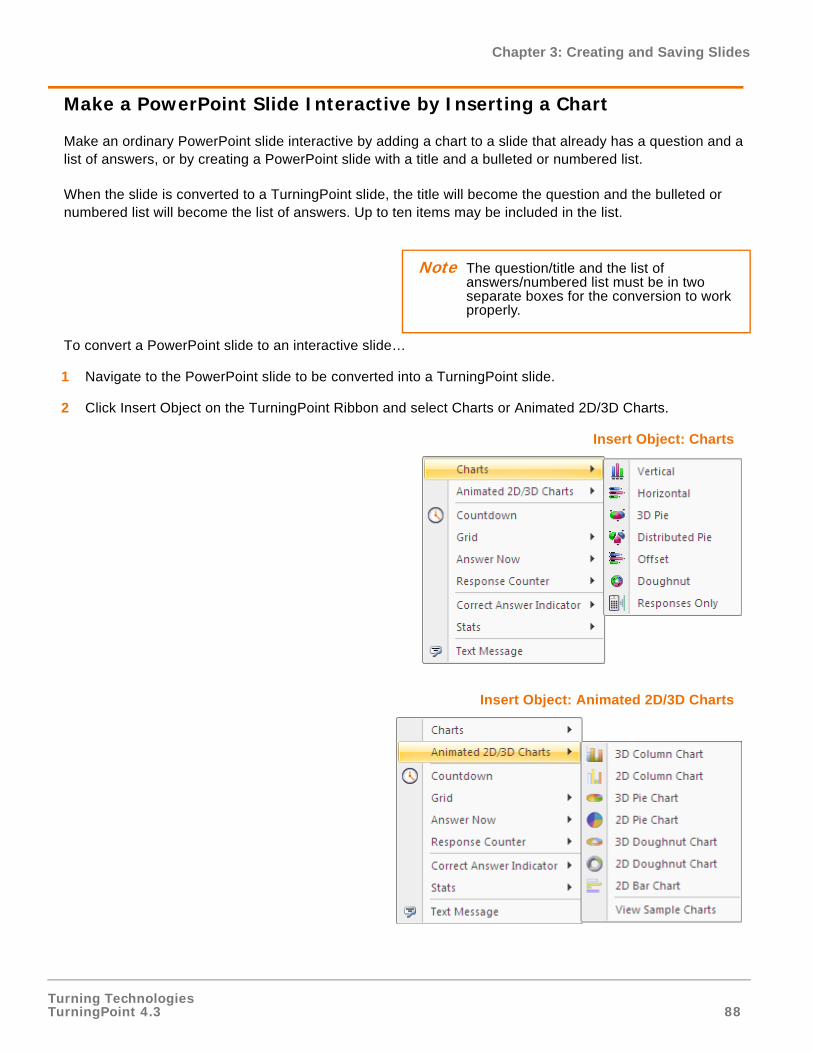
Turning TechnologiesTurningPoint 4.3 88
Chapter 3: Creating and Saving Slides
Make a PowerPoint Slide Interactive by Inserting a Chart
Make an ordinary PowerPoint slide interactive by adding a chart to a slide that already has a question and a list of answers, or by creating a PowerPoint slide with a title and a bulleted or numbered list.
When the slide is converted to a TurningPoint slide, the title will become the question and the bulleted or numbered list will become the list of answers. Up to ten items may be included in the list.
To convert a PowerPoint slide to an interactive slide…
1 Navigate to the PowerPoint slide to be converted into a TurningPoint slide.
2 Click Insert Object on the TurningPoint Ribbon and select Charts or Animated 2D/3D Charts.
Insert Object: Charts
Insert Object: Animated 2D/3D Charts
Note The question/title and the list of answers/numbered list must be in two separate boxes for the conversion to work properly.
Turning TechnologiesTurningPoint 4.3 89
Chapter 3: Creating and Saving Slides
3 Select a chart to add to the slide.
When the chart has been selected, TurningPoint converts the title of the slide to the question, the bulleted or numbered list to the answers, and adds the chart to the slide. If Responses Only is selected, a chart will not be placed on the slide, the response percentages and response counts will display when polling closes.
Disable Auto Scale in Charts
When slides are inserted in TurningPoint, vertical charts are set to auto scale according to their percentages. In some cases, the vertical charts do not display polling results proportionately. Vertical charts can be made to display on a proportionate scale by disabling the Auto Scale Charts setting.
To disable Auto Scaling...
1 Click Tools on the TurningPoint Ribbon and select Settings.
2 Select Presentation from the Settings Hierarchy.
3 Under the Chart Settings, select Auto Scale Charts.
Note The bulleted or numbered answer list is re-numbered according to the TurningPoint settings.
Numbering schemes can be modified for answers in the Answer Bullet Format setting, a presentation-level setting. Find more information about modifying settings in Chapter 4: Response Device and Settings Management.
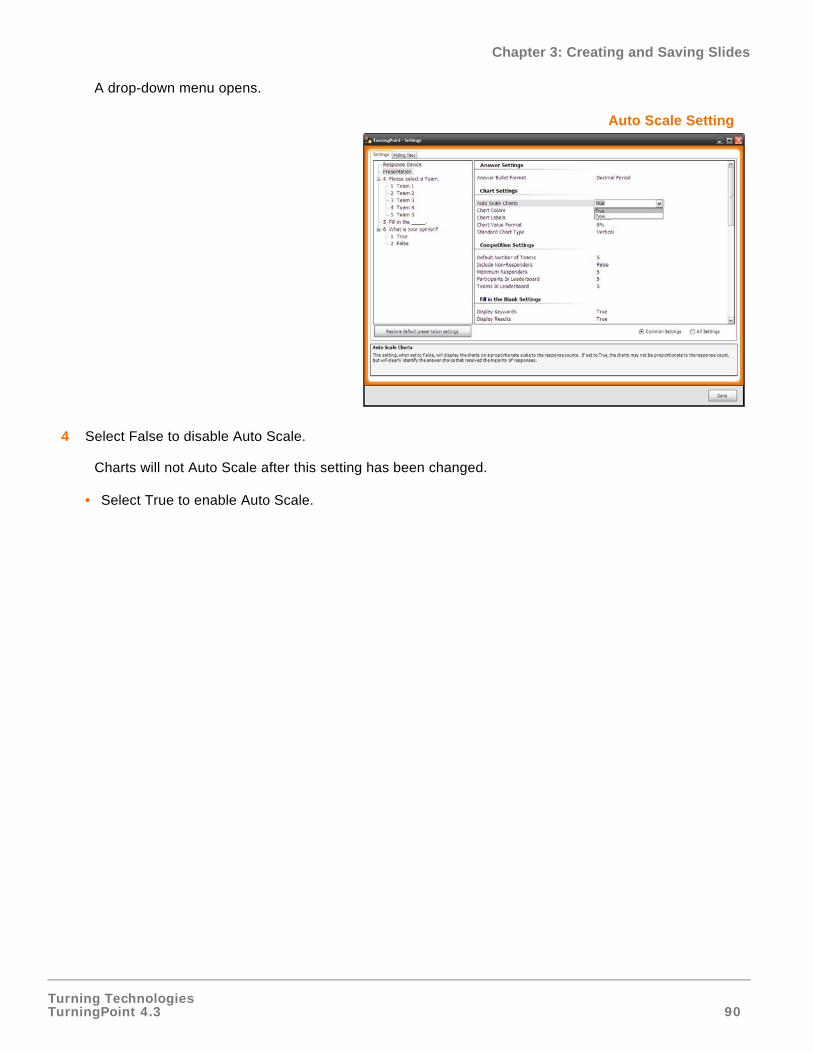
Turning TechnologiesTurningPoint 4.3 90
Chapter 3: Creating and Saving Slides
A drop-down menu opens.
Auto Scale Setting
4 Select False to disable Auto Scale.
Charts will not Auto Scale after this setting has been changed.
• Select True to enable Auto Scale.
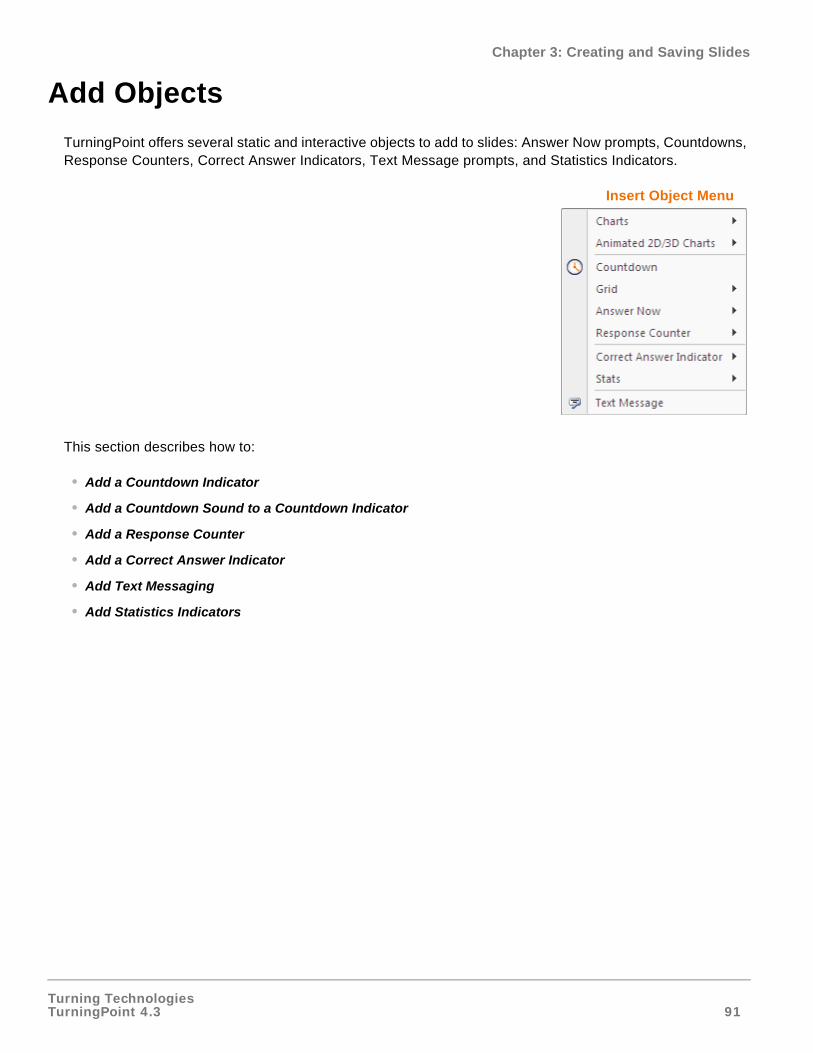
Turning TechnologiesTurningPoint 4.3 91
Chapter 3: Creating and Saving Slides
Add Objects
TurningPoint offers several static and interactive objects to add to slides: Answer Now prompts, Countdowns, Response Counters, Correct Answer Indicators, Text Message prompts, and Statistics Indicators.
Insert Object Menu
This section describes how to:
• Add a Countdown Indicator
• Add a Countdown Sound to a Countdown Indicator
• Add a Response Counter
• Add a Correct Answer Indicator
• Add Text Messaging
• Add Statistics Indicators
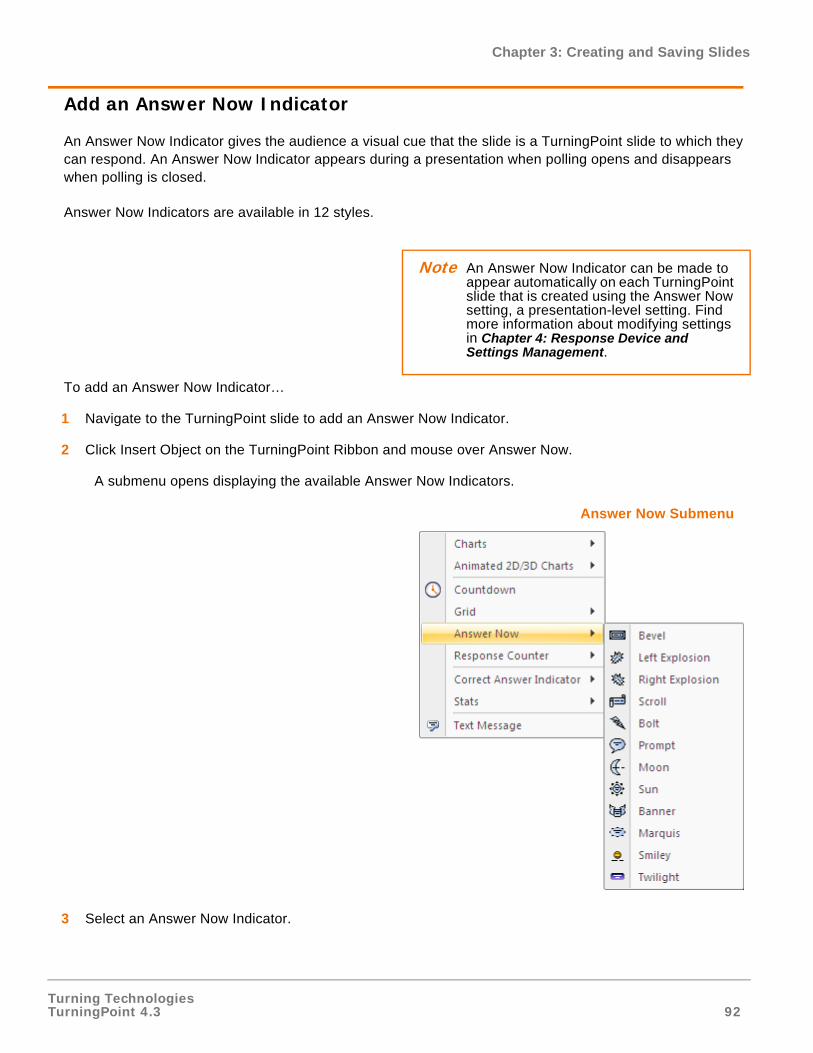
Turning TechnologiesTurningPoint 4.3 92
Chapter 3: Creating and Saving Slides
Add an Answer Now Indicator
An Answer Now Indicator gives the audience a visual cue that the slide is a TurningPoint slide to which they can respond. An Answer Now Indicator appears during a presentation when polling opens and disappears when polling is closed.
Answer Now Indicators are available in 12 styles.
To add an Answer Now Indicator…
1 Navigate to the TurningPoint slide to add an Answer Now Indicator.
2 Click Insert Object on the TurningPoint Ribbon and mouse over Answer Now.
A submenu opens displaying the available Answer Now Indicators.
Answer Now Submenu
3 Select an Answer Now Indicator.
Note An Answer Now Indicator can be made to appear automatically on each TurningPoint slide that is created using the Answer Now setting, a presentation-level setting. Find more information about modifying settings in Chapter 4: Response Device and Settings Management.
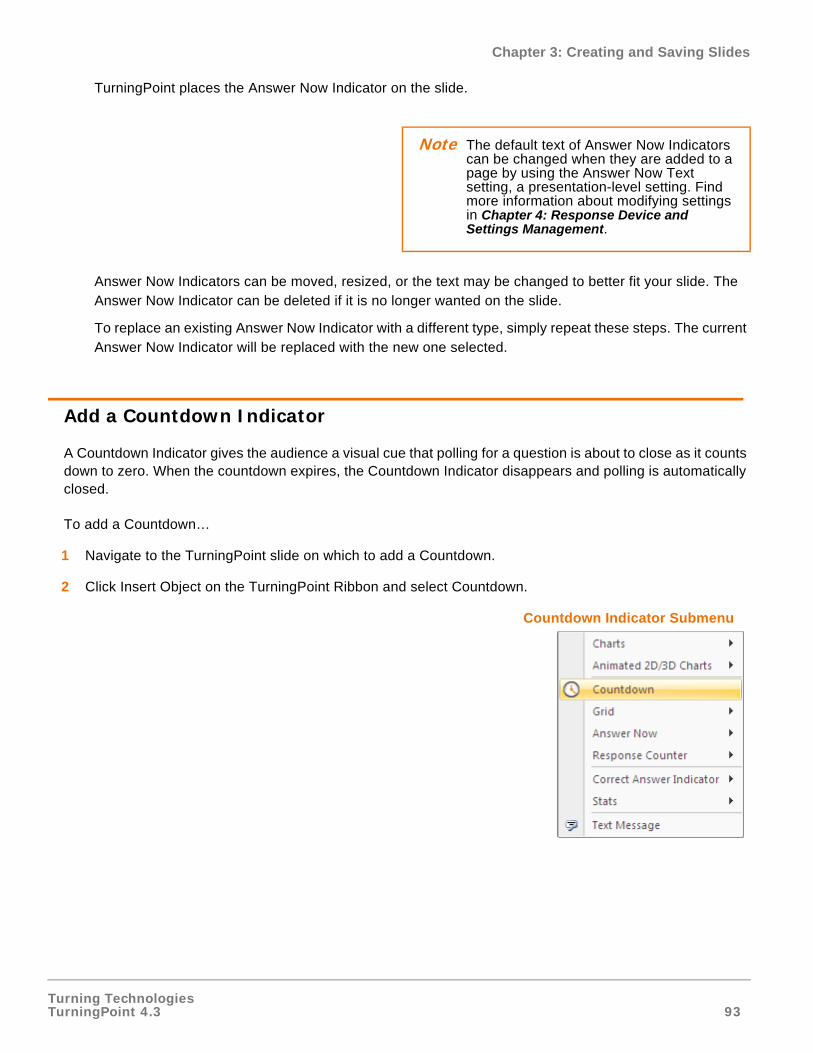
Turning TechnologiesTurningPoint 4.3 93
Chapter 3: Creating and Saving Slides
TurningPoint places the Answer Now Indicator on the slide.
Answer Now Indicators can be moved, resized, or the text may be changed to better fit your slide. The Answer Now Indicator can be deleted if it is no longer wanted on the slide.
To replace an existing Answer Now Indicator with a different type, simply repeat these steps. The current Answer Now Indicator will be replaced with the new one selected.
Add a Countdown Indicator
A Countdown Indicator gives the audience a visual cue that polling for a question is about to close as it counts down to zero. When the countdown expires, the Countdown Indicator disappears and polling is automatically closed.
To add a Countdown…
1 Navigate to the TurningPoint slide on which to add a Countdown.
2 Click Insert Object on the TurningPoint Ribbon and select Countdown.
Countdown Indicator Submenu
Note The default text of Answer Now Indicators can be changed when they are added to a page by using the Answer Now Text setting, a presentation-level setting. Find more information about modifying settings in Chapter 4: Response Device and Settings Management.
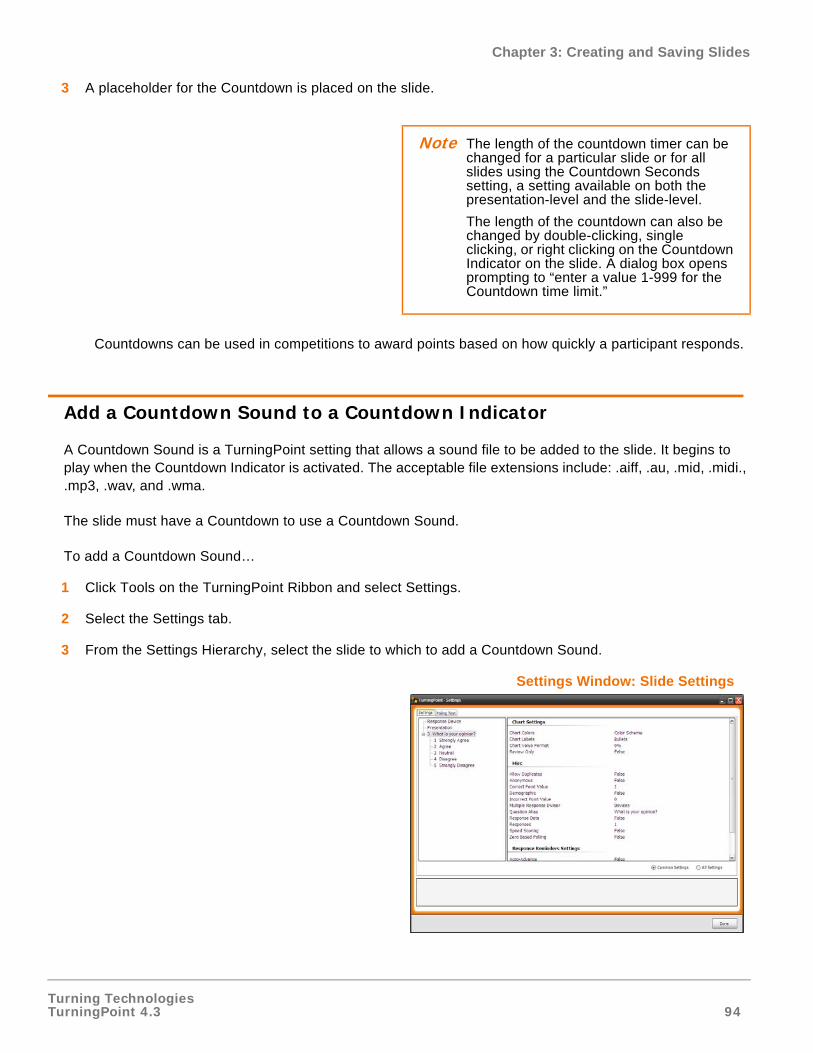
Turning TechnologiesTurningPoint 4.3 94
Chapter 3: Creating and Saving Slides
3 A placeholder for the Countdown is placed on the slide.
Countdowns can be used in competitions to award points based on how quickly a participant responds.
Add a Countdown Sound to a Countdown Indicator
A Countdown Sound is a TurningPoint setting that allows a sound file to be added to the slide. It begins to play when the Countdown Indicator is activated. The acceptable file extensions include: .aiff, .au, .mid, .midi., .mp3, .wav, and .wma.
The slide must have a Countdown to use a Countdown Sound.
To add a Countdown Sound…
1 Click Tools on the TurningPoint Ribbon and select Settings.
2 Select the Settings tab.
3 From the Settings Hierarchy, select the slide to which to add a Countdown Sound.
Settings Window: Slide Settings
Note The length of the countdown timer can be changed for a particular slide or for all slides using the Countdown Seconds setting, a setting available on both the presentation-level and the slide-level.
The length of the countdown can also be changed by double-clicking, single clicking, or right clicking on the Countdown Indicator on the slide. A dialog box opens prompting to “enter a value 1-999 for the Countdown time limit.”
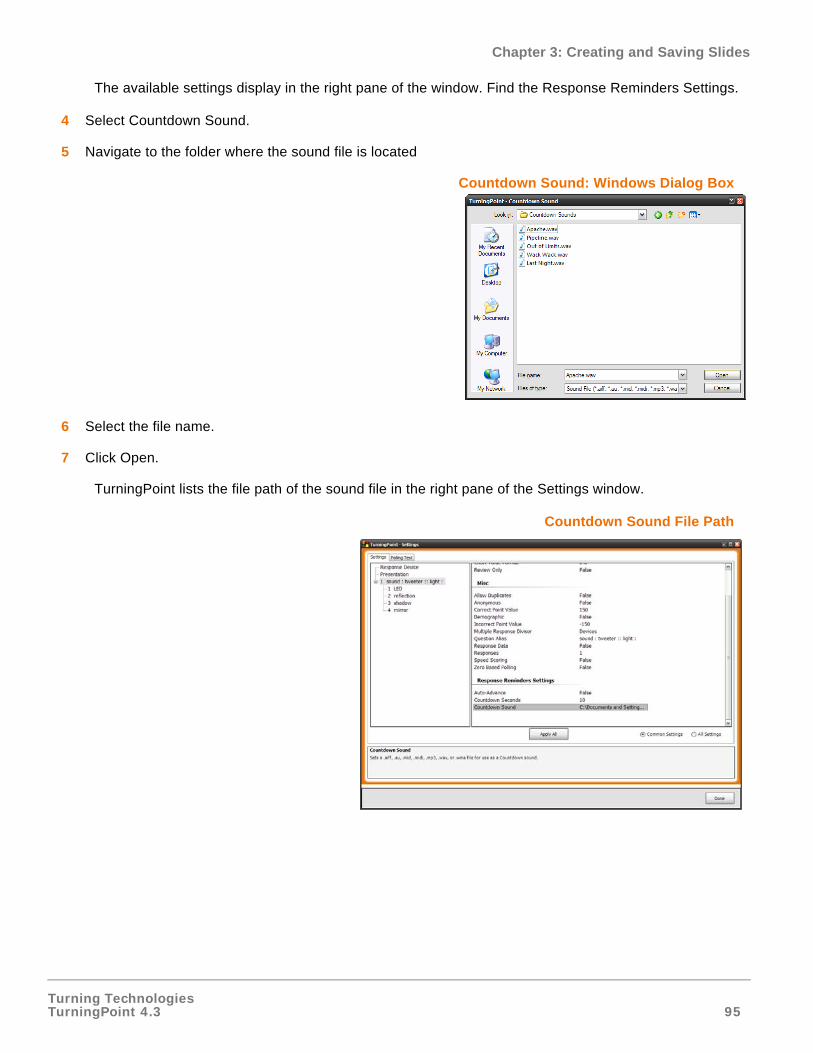
Turning TechnologiesTurningPoint 4.3 95
Chapter 3: Creating and Saving Slides
The available settings display in the right pane of the window. Find the Response Reminders Settings.
4 Select Countdown Sound.
5 Navigate to the folder where the sound file is located
Countdown Sound: Windows Dialog Box
6 Select the file name.
7 Click Open.
TurningPoint lists the file path of the sound file in the right pane of the Settings window.
Countdown Sound File Path
Turning TechnologiesTurningPoint 4.3 96
Chapter 3: Creating and Saving Slides
8 Click Done.
Add a Response Counter
A Response Counter keeps track of how many participants have submitted a response. A Response Counter appears during a presentation when polling opens and disappears when polling is closed.
Response Counters are available in six styles.
To add a Response Counter…
1 Navigate to the TurningPoint slide on which to add a Response Counter.
2 Click Insert Object on the TurningPoint Ribbon and mouse over Response Counter.
A submenu opens displaying the available Response Counters.
3 Select a Response Counter.
Note If the presentation will be used on a different computer, ensure that the Countdown Sound (sound file) is on the presentation computer and that it has the same file path. Otherwise, the presentation computer will not be able to use the Countdown Sound. For example, if the file path for the Countdown Sound is C:\Documents and Settings\My Documents\Explosion.wav, it must be ensured that the Countdown Sound is located at the same file path on the presenting computer.
Note The Response Counter can display either the number or percentage of participants who have responded (or both) using the Response Counter Format setting, a presentation-level setting. Find more information about modifying settings in Chapter 4: Response Device and Settings Management.
Turning TechnologiesTurningPoint 4.3 97
Chapter 3: Creating and Saving Slides
TurningPoint places the Response Counter on the slide.
The Response Counter can be moved or resized to better fit the slide. The Response Counter can be deleted if it is no longer needed on the slide.
To replace an existing Response Counter with a different type, simply repeat these steps. The current Response Counter will be replaced with the new one.
Add a Correct Answer Indicator
A Correct Answer Indicator points out the correct answer(s) to the audience after polling for a question is finished. The indicator appears during a presentation when you advance the slide after displaying the chart.
Correct Answer Indicators are available in seven styles.
To add a Correct Answer Indicator…
1 Navigate to the TurningPoint slide on which to add a Correct Answer Indicator.
2 Click Insert Object on the TurningPoint Ribbon and mouse over Correct Answer Indicator.
Note Specify that a Response Counter should appear automatically on each TurningPoint slide that is created using the Response Counter setting, a presentation-level setting. Find more information about modifying settings in Chapter 4: Response Device and Settings Management.
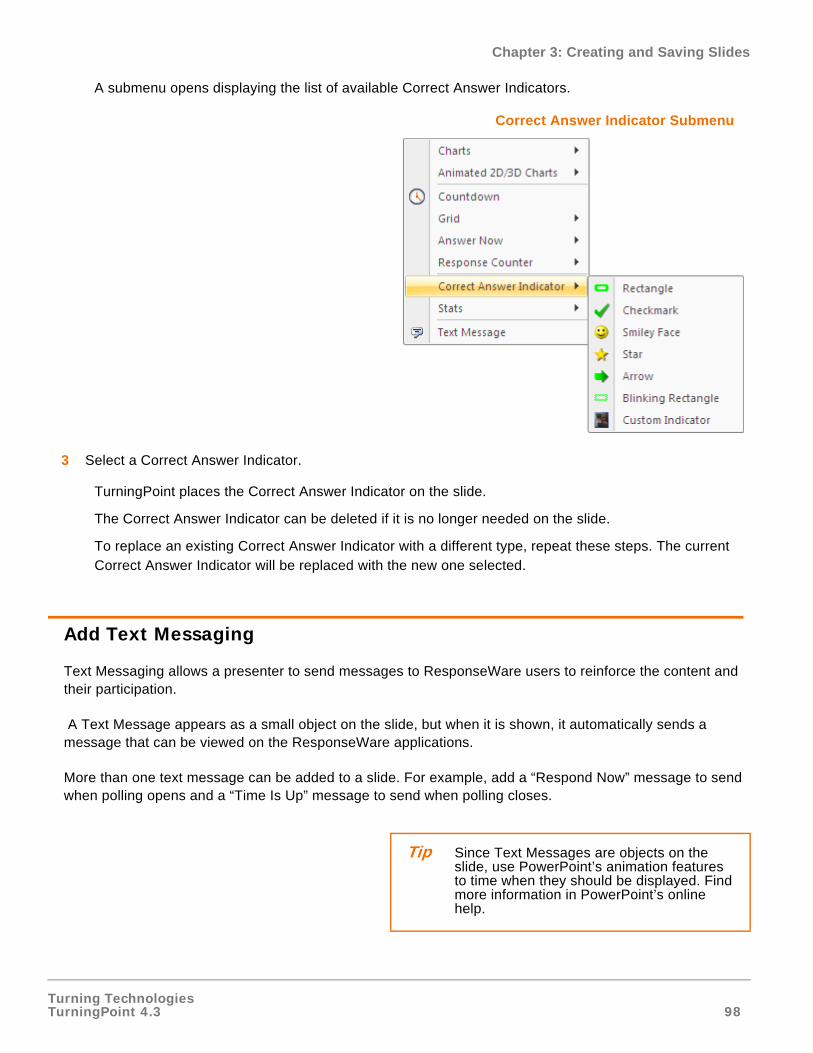
Turning TechnologiesTurningPoint 4.3 98
Chapter 3: Creating and Saving Slides
A submenu opens displaying the list of available Correct Answer Indicators.
Correct Answer Indicator Submenu
3 Select a Correct Answer Indicator.
TurningPoint places the Correct Answer Indicator on the slide.
The Correct Answer Indicator can be deleted if it is no longer needed on the slide.
To replace an existing Correct Answer Indicator with a different type, repeat these steps. The current Correct Answer Indicator will be replaced with the new one selected.
Add Text Messaging
Text Messaging allows a presenter to send messages to ResponseWare users to reinforce the content and their participation.
A Text Message appears as a small object on the slide, but when it is shown, it automatically sends a message that can be viewed on the ResponseWare applications.
More than one text message can be added to a slide. For example, add a “Respond Now” message to send when polling opens and a “Time Is Up” message to send when polling closes.
Tip Since Text Messages are objects on the slide, use PowerPoint’s animation features to time when they should be displayed. Find more information in PowerPoint’s online help.
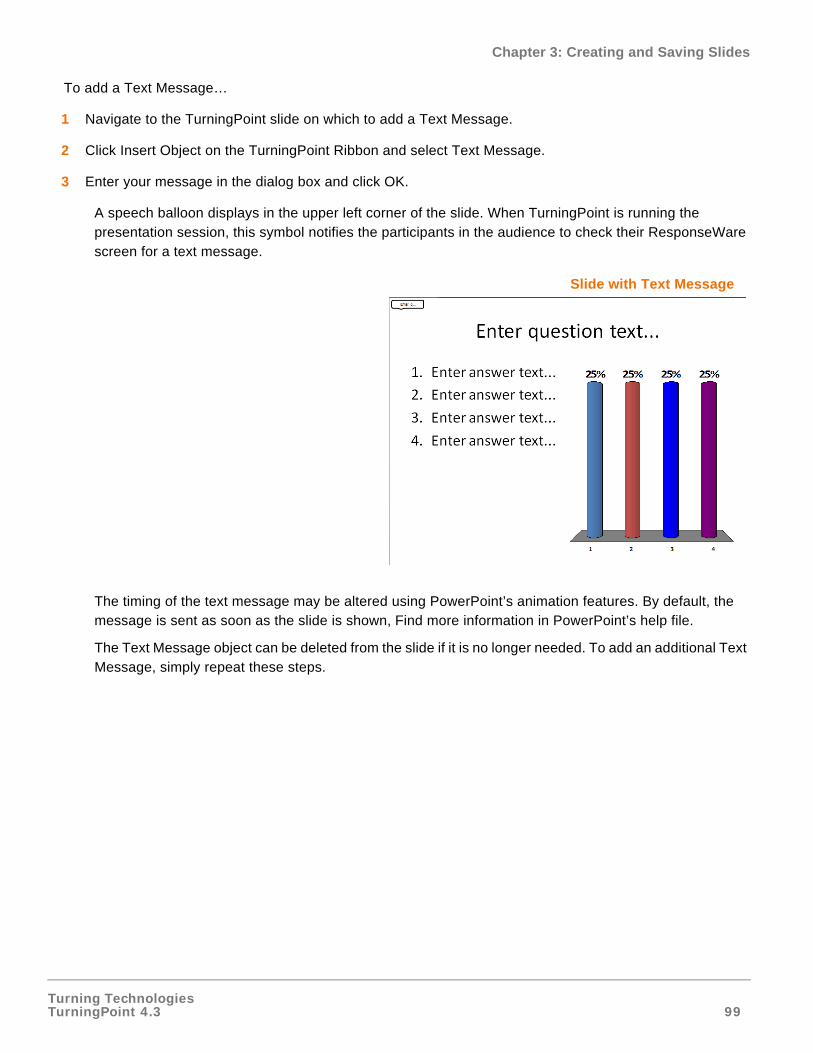
Turning TechnologiesTurningPoint 4.3 99
Chapter 3: Creating and Saving Slides
To add a Text Message…
1 Navigate to the TurningPoint slide on which to add a Text Message.
2 Click Insert Object on the TurningPoint Ribbon and select Text Message.
3 Enter your message in the dialog box and click OK.
A speech balloon displays in the upper left corner of the slide. When TurningPoint is running the presentation session, this symbol notifies the participants in the audience to check their ResponseWare screen for a text message.
Slide with Text Message
The timing of the text message may be altered using PowerPoint’s animation features. By default, the message is sent as soon as the slide is shown, Find more information in PowerPoint’s help file.
The Text Message object can be deleted from the slide if it is no longer needed. To add an additional Text Message, simply repeat these steps.
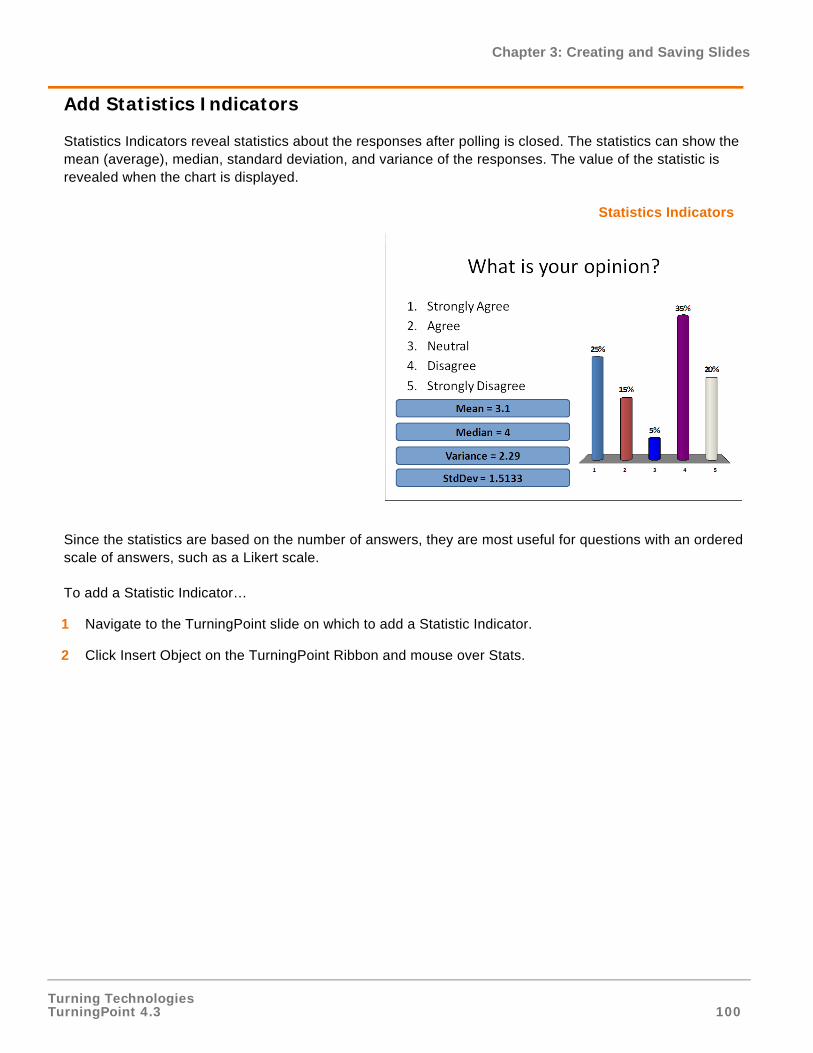
Turning TechnologiesTurningPoint 4.3 100
Chapter 3: Creating and Saving Slides
Add Statistics Indicators
Statistics Indicators reveal statistics about the responses after polling is closed. The statistics can show the mean (average), median, standard deviation, and variance of the responses. The value of the statistic is revealed when the chart is displayed.
Statistics Indicators
Since the statistics are based on the number of answers, they are most useful for questions with an ordered scale of answers, such as a Likert scale.
To add a Statistic Indicator…
1 Navigate to the TurningPoint slide on which to add a Statistic Indicator.
2 Click Insert Object on the TurningPoint Ribbon and mouse over Stats.
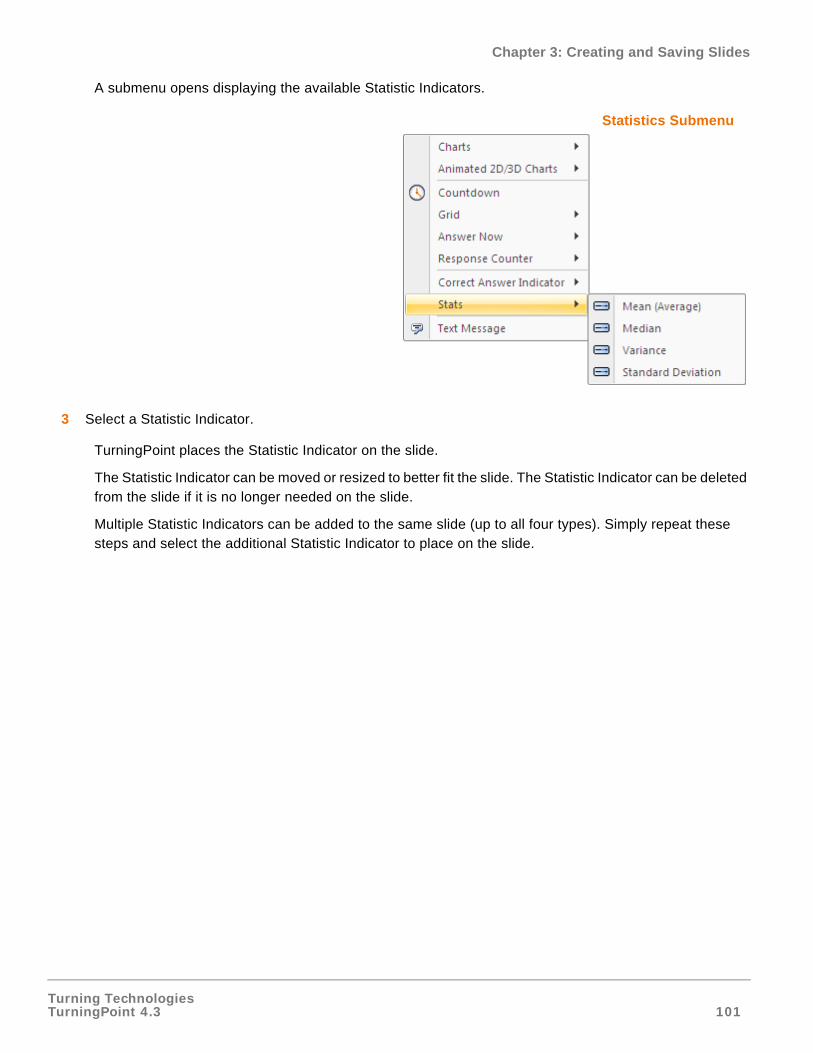
Turning TechnologiesTurningPoint 4.3 101
Chapter 3: Creating and Saving Slides
A submenu opens displaying the available Statistic Indicators.
Statistics Submenu
3 Select a Statistic Indicator.
TurningPoint places the Statistic Indicator on the slide.
The Statistic Indicator can be moved or resized to better fit the slide. The Statistic Indicator can be deleted from the slide if it is no longer needed on the slide.
Multiple Statistic Indicators can be added to the same slide (up to all four types). Simply repeat these steps and select the additional Statistic Indicator to place on the slide.

Turning TechnologiesTurningPoint 4.3 102
Chapter 4: Response Device and Settings Management
Response Device and Settings Management
This chapter discusses the installation and management of the Response Devices available to the audience. Additionally, this chapter describes the set up of the ResponseCard Presenter device, and various settings available for customizing a presentation.
The audience responds to interactive presentations with a response device. The response devices can be licensed from Turning Technologies for use with TurningPoint. These response devices include:
Response Device Description
Turning Technologies’ ResponseCard IR—a compact response device that uses infrared technology to send audience responses.
Turning Technologies’ ResponseCard XL—a compact response device that uses infrared technology to send audience responses. It also allows for self-paced testing, which lets students enter responses to many different questions on the card’s LCD then transmit all the answers at once.
Turning Technologies’ ResponseCard RF—a compact response device that uses radio frequency technology to send audience responses.
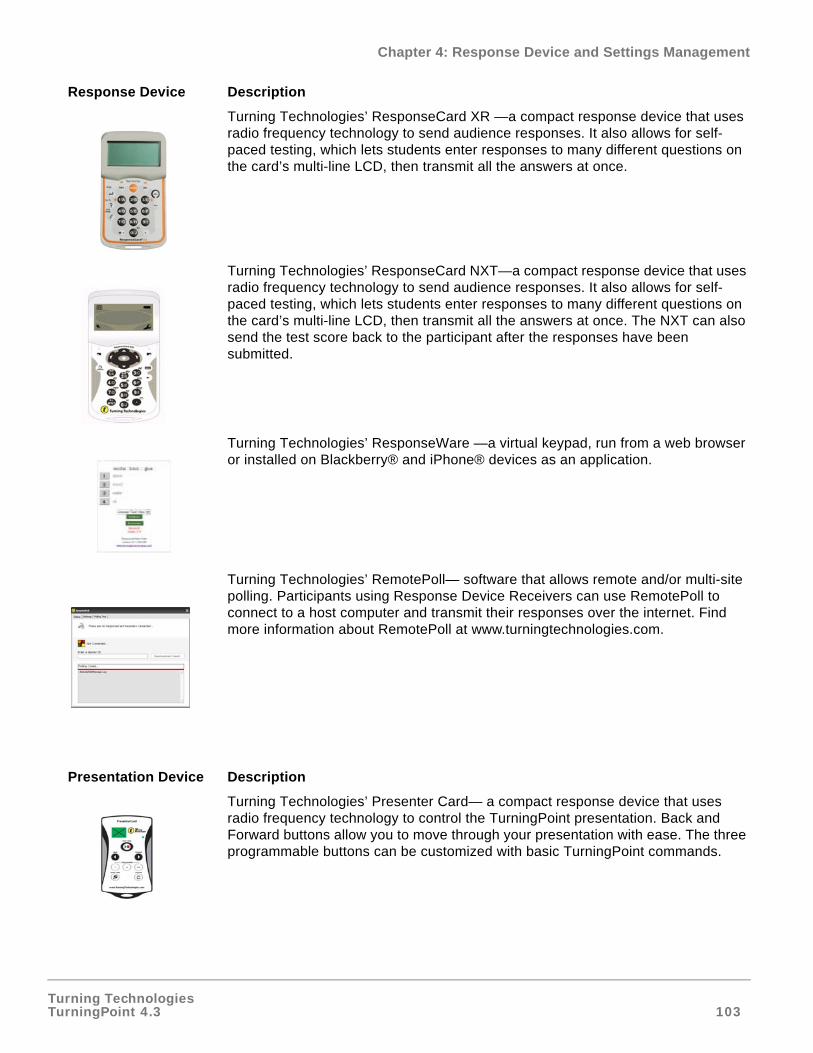
Turning TechnologiesTurningPoint 4.3 103
Chapter 4: Response Device and Settings Management
Turning Technologies’ ResponseCard XR —a compact response device that uses radio frequency technology to send audience responses. It also allows for self-paced testing, which lets students enter responses to many different questions on the card’s multi-line LCD, then transmit all the answers at once.
Turning Technologies’ ResponseCard NXT—a compact response device that uses radio frequency technology to send audience responses. It also allows for self-paced testing, which lets students enter responses to many different questions on the card’s multi-line LCD, then transmit all the answers at once. The NXT can also send the test score back to the participant after the responses have been submitted.
Turning Technologies’ ResponseWare —a virtual keypad, run from a web browser or installed on Blackberry® and iPhone® devices as an application.
Turning Technologies’ RemotePoll— software that allows remote and/or multi-site polling. Participants using Response Device Receivers can use RemotePoll to connect to a host computer and transmit their responses over the internet. Find more information about RemotePoll at www.turningtechnologies.com.
Presentation Device Description
Turning Technologies’ Presenter Card— a compact response device that uses radio frequency technology to control the TurningPoint presentation. Back and Forward buttons allow you to move through your presentation with ease. The three programmable buttons can be customized with basic TurningPoint commands.
Response Device Description

Turning TechnologiesTurningPoint 4.3 104
Chapter 4: Response Device and Settings Management
Install Devices
Users interact with a TurningPoint presentation using response devices that communicate through a receiver or the internet.
Response device receivers are connected directly to the computer that will be used to run the presentation. This section includes instructions to install the device receivers.
This section describes how to:
• Install Infrared Response Device Receiver
• Install Radio Frequency Response Device Receiver
• Obtain the ResponseWare Device Settings
Install Infrared Response Device Receiver
The ResponseCards IR and XL communicate with TurningPoint using infrared technology. The receiver accepts the signal produced by the individual ResponseCards and passes the response to TurningPoint.
ResponseCard IR and ResponseCard XL
Before You BeginThe receiver must be installed on the machine that will be used to run the presentation.
To install the infrared response device receiver…
1 Connect the device receiver to the USB port of the presentation computer.
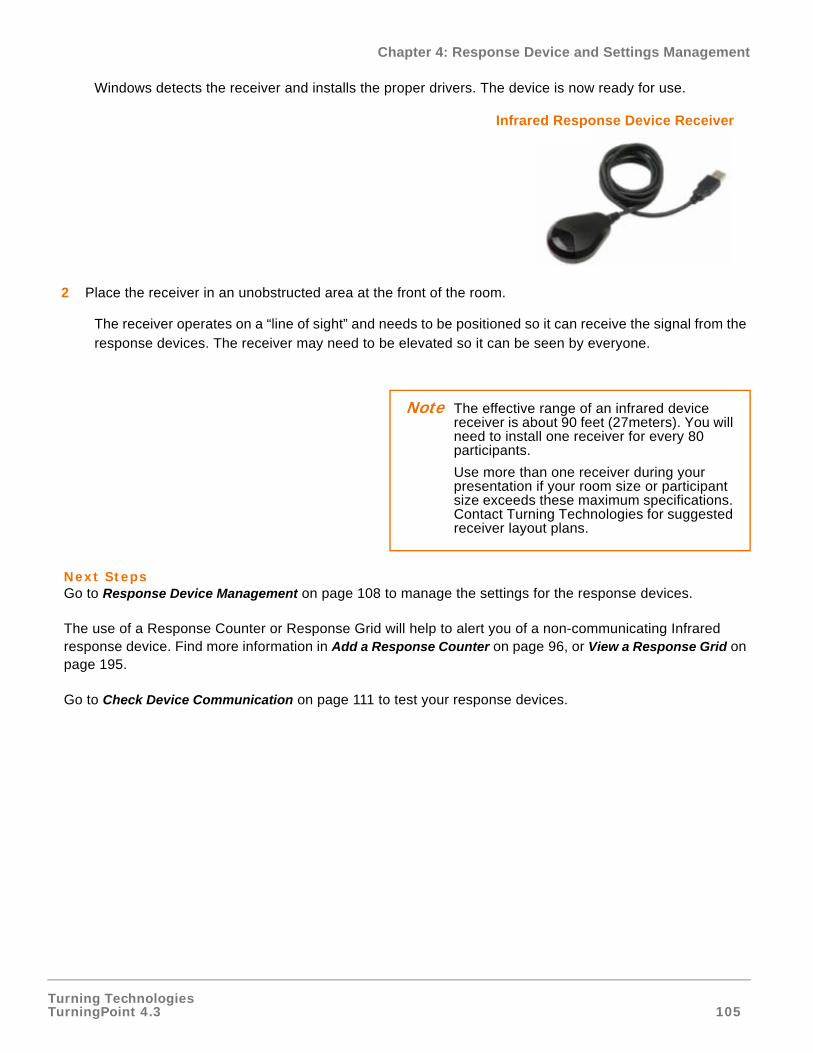
Turning TechnologiesTurningPoint 4.3 105
Chapter 4: Response Device and Settings Management
Windows detects the receiver and installs the proper drivers. The device is now ready for use.
Infrared Response Device Receiver
2 Place the receiver in an unobstructed area at the front of the room.
The receiver operates on a “line of sight” and needs to be positioned so it can receive the signal from the response devices. The receiver may need to be elevated so it can be seen by everyone.
Next StepsGo to Response Device Management on page 108 to manage the settings for the response devices.
The use of a Response Counter or Response Grid will help to alert you of a non-communicating Infrared response device. Find more information in Add a Response Counter on page 96, or View a Response Grid on page 195.
Go to Check Device Communication on page 111 to test your response devices.
Note The effective range of an infrared device receiver is about 90 feet (27meters). You will need to install one receiver for every 80 participants.
Use more than one receiver during your presentation if your room size or participant size exceeds these maximum specifications. Contact Turning Technologies for suggested receiver layout plans.

Turning TechnologiesTurningPoint 4.3 106
Chapter 4: Response Device and Settings Management
Install Radio Frequency Response Device Receiver
The ResponseCards RF, XR, NXT and PresenterCard communicate with TurningPoint using a radio frequency. The receiver accepts the signal produced by the individual ResponseCards and passes the response to TurningPoint.
ResponseCard RF, ResponseCard XR, ResponseCard NXT and PresenterCard
Before You BeginThe receiver must be connected to the machine that will be used to run the presentation.
To install the radio frequency response device receiver…
1 Connect the device receiver to the USB port of the presentation computer.
Radio Frequency Response Device Receiver
Note The effective range of most RF Receivers is about 200 feet (60 meters) and the Long Range Receiver is about 400 feet (120 meters). A single receiver is sufficient for up to 1000 ResponseCards, and a direct line of sight between the receiver and the ResponseCard is not necessary.
Use more than one receiver during the presentation if the room size or participant size exceeds these maximum specifications. Contact Turning Technologies for suggested receiver layout plans.
Turning TechnologiesTurningPoint 4.3 107
Chapter 4: Response Device and Settings Management
2 The device is ready to use.
Next StepsGo to Response Device Management on page 108 to manage the settings for the response devices.
If an audience member’s device is not being accepted, check the device’s ability to communicate.
Go to Check Device Communication on page 111 to test your response devices.
Obtain the ResponseWare Device Settings
The ResponseWare response device acts as a browser-based virtual response device. Audience members use ResponseWare from desktop or laptop computers, BlackBerry®, or iPhone® devices that communicates with ResponseWare through a URL connection.
ResponseWare exhibits the same response behavior as ResponseCards. ResponseWare can be opened and closed during the presentation and retain the same Device ID.
To use ResponseWare during a presentation...
1 Contact your Turning Technologies Sales Representative to set up a ResponseWare Account.
Turning Technologies will provide a login and password with which to log in through ResponseWare under “Tools” in TurningPoint, then invite the audience to log in to the presentation through their devices, by entering the assigned session ID on rwpoll.com or within their ResponseWare application.
Next StepsGo to Response Device Settings on page 118 to manage the ResponseWare settings.
Turning TechnologiesTurningPoint 4.3 108
Chapter 4: Response Device and Settings Management
Response Device Management
Each audience participant uses a device to respond to questions asked during the presentation. TurningPoint needs to know what type of response devices will be used before the presentation is ran. Access the Response Device settings to confirm TurningPoint is configured properly.
This section describes how to:
• Add or Update Response Device Receivers
• Enable ResponseWare
• Configure PresenterCard
• Check Device Communication
• Identify the Number of Devices to be Used
Add or Update Response Device Receivers
The Response Device settings may need to be accessed the response device receivers have been changed.
Before You BeginTurningPoint must be installed on the computer to be used for the presentations and response device receiver and ResponseCards at hand.
1 Connect the device receiver to the USB port of the presentation computer.
Windows detects the receiver. The device is now ready for use.
Next StepsIf an audience member’s device is not being accepted, check the device’s ability to communicate. Find more information in Check Device Communication on page 111. The use of a Response Counter or Response Grid will help to alert you of a non-communicating device. Find more information in Add a Response Counter on page 96, or View a Response Grid on page 195.
Note More than one USB Receiver may be needed for larger audiences (over 80 people for infrared or over 1,000 people for radio frequency).
If there is more than one RF USB Receiver plugged in each receiver must be set to their own channel to prevent interference. For example, if one receiver is set to channel 41 then the second receiver should be set to channel 51. Some of the audience members will need to program their ResponseCards to channel 41 and some will need to program their ResponseCards to channel 51.

Turning TechnologiesTurningPoint 4.3 109
Chapter 4: Response Device and Settings Management
Enable ResponseWare
This section will cover the steps to setup TurningPoint for communication between the application and the ResponseWare server.
1 Click Tools on the TurningPoint Ribbon and select ResponseWare.
The main ResponseWare screen opens.
ResponseWare
2 Enter your ResponseWare Username and Password.
3 If you are connecting through a proxy server, check the box to enter the proxy settings.
a Click Settings.
b Select Automatically detect proxy settings or Manually configure proxy settings to enter the Address and Port.
c If required, enter the Authentication information.
d Click Test to test the connection to the proxy server.
e Click Done.
4 Select to Allow Guests or Require Login.
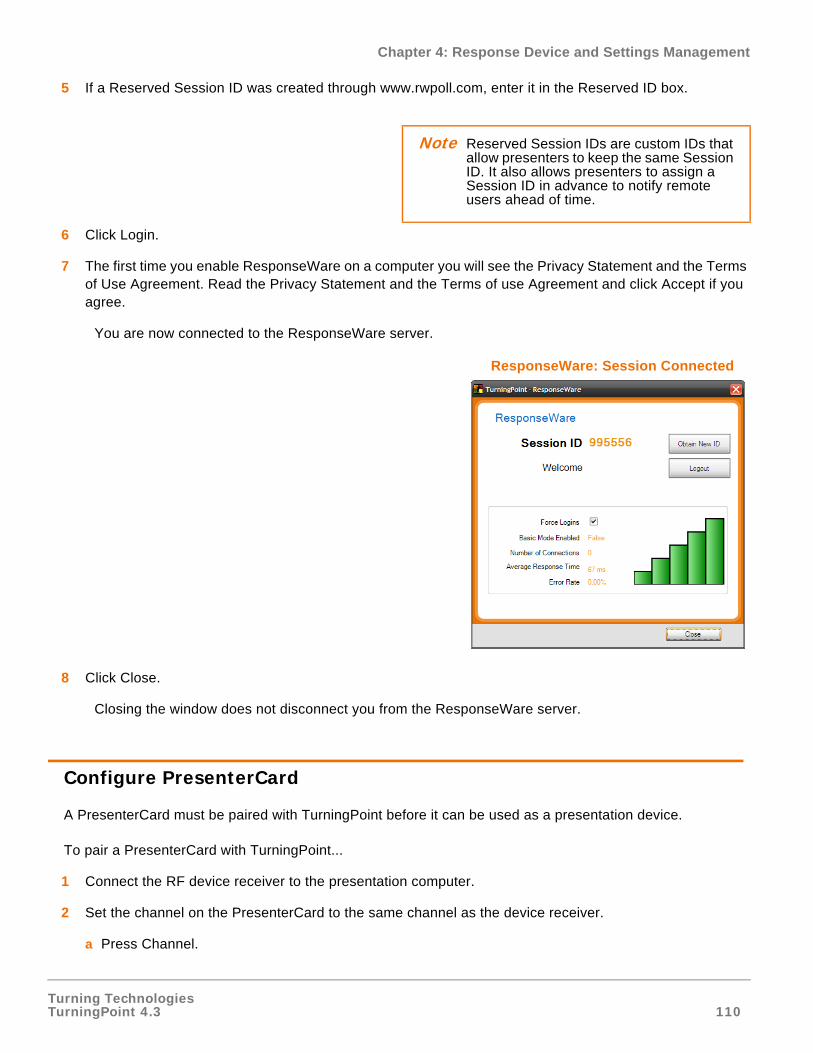
Turning TechnologiesTurningPoint 4.3 110
Chapter 4: Response Device and Settings Management
5 If a Reserved Session ID was created through www.rwpoll.com, enter it in the Reserved ID box.
6 Click Login.
7 The first time you enable ResponseWare on a computer you will see the Privacy Statement and the Terms of Use Agreement. Read the Privacy Statement and the Terms of use Agreement and click Accept if you agree.
You are now connected to the ResponseWare server.
ResponseWare: Session Connected
8 Click Close.
Closing the window does not disconnect you from the ResponseWare server.
Configure PresenterCard
A PresenterCard must be paired with TurningPoint before it can be used as a presentation device.
To pair a PresenterCard with TurningPoint...
1 Connect the RF device receiver to the presentation computer.
2 Set the channel on the PresenterCard to the same channel as the device receiver.
a Press Channel.
Note Reserved Session IDs are custom IDs that allow presenters to keep the same Session ID. It also allows presenters to assign a Session ID in advance to notify remote users ahead of time.
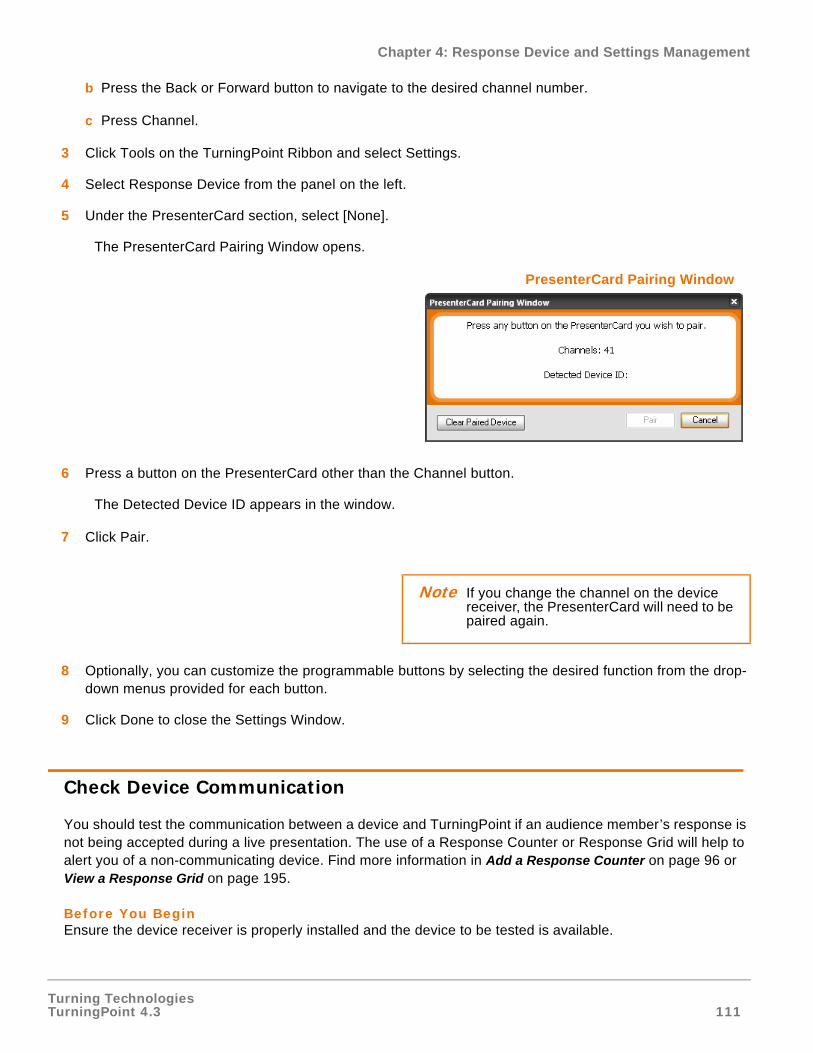
Turning TechnologiesTurningPoint 4.3 111
Chapter 4: Response Device and Settings Management
b Press the Back or Forward button to navigate to the desired channel number.
c Press Channel.
3 Click Tools on the TurningPoint Ribbon and select Settings.
4 Select Response Device from the panel on the left.
5 Under the PresenterCard section, select [None].
The PresenterCard Pairing Window opens.
PresenterCard Pairing Window
6 Press a button on the PresenterCard other than the Channel button.
The Detected Device ID appears in the window.
7 Click Pair.
8 Optionally, you can customize the programmable buttons by selecting the desired function from the drop-down menus provided for each button.
9 Click Done to close the Settings Window.
Check Device Communication
You should test the communication between a device and TurningPoint if an audience member’s response is not being accepted during a live presentation. The use of a Response Counter or Response Grid will help to alert you of a non-communicating device. Find more information in Add a Response Counter on page 96 or View a Response Grid on page 195.
Before You BeginEnsure the device receiver is properly installed and the device to be tested is available.
Note If you change the channel on the device receiver, the PresenterCard will need to be paired again.
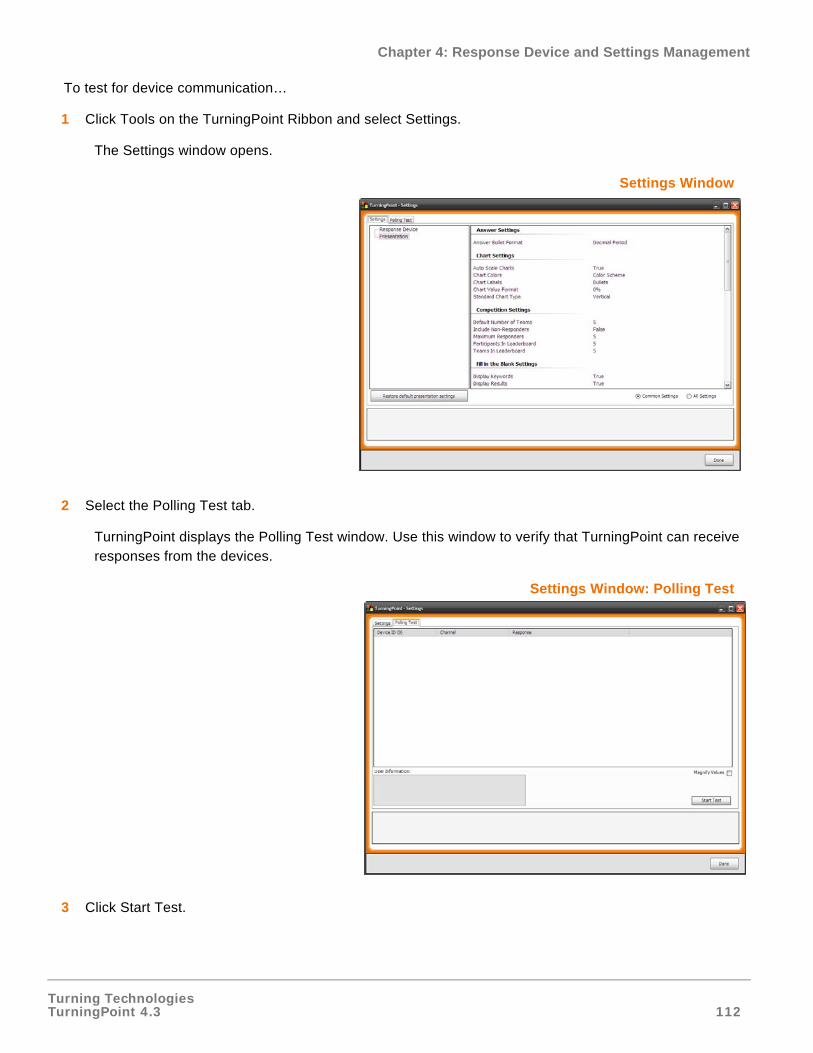
Turning TechnologiesTurningPoint 4.3 112
Chapter 4: Response Device and Settings Management
To test for device communication…
1 Click Tools on the TurningPoint Ribbon and select Settings.
The Settings window opens.
Settings Window
2 Select the Polling Test tab.
TurningPoint displays the Polling Test window. Use this window to verify that TurningPoint can receive responses from the devices.
Settings Window: Polling Test
3 Click Start Test.
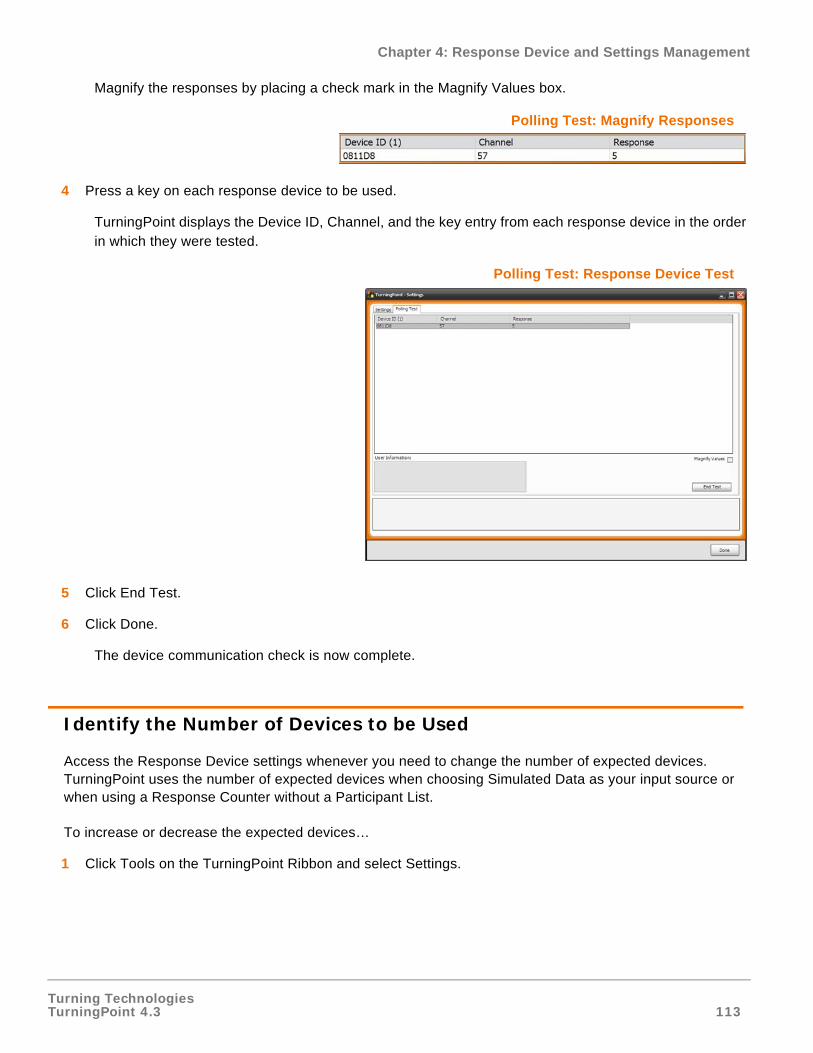
Turning TechnologiesTurningPoint 4.3 113
Chapter 4: Response Device and Settings Management
Magnify the responses by placing a check mark in the Magnify Values box.
Polling Test: Magnify Responses
4 Press a key on each response device to be used.
TurningPoint displays the Device ID, Channel, and the key entry from each response device in the order in which they were tested.
Polling Test: Response Device Test
5 Click End Test.
6 Click Done.
The device communication check is now complete.
Identify the Number of Devices to be Used
Access the Response Device settings whenever you need to change the number of expected devices. TurningPoint uses the number of expected devices when choosing Simulated Data as your input source or when using a Response Counter without a Participant List.
To increase or decrease the expected devices…
1 Click Tools on the TurningPoint Ribbon and select Settings.
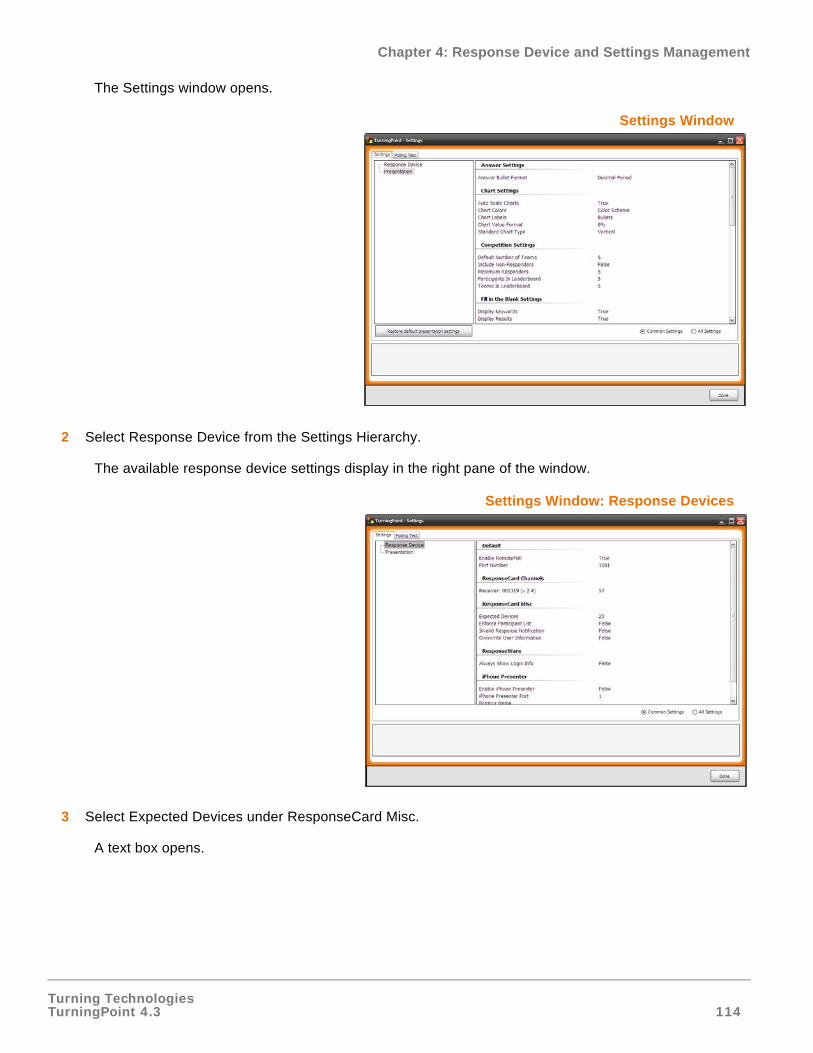
Turning TechnologiesTurningPoint 4.3 114
Chapter 4: Response Device and Settings Management
The Settings window opens.
Settings Window
2 Select Response Device from the Settings Hierarchy.
The available response device settings display in the right pane of the window.
Settings Window: Response Devices
3 Select Expected Devices under ResponseCard Misc.
A text box opens.
Turning TechnologiesTurningPoint 4.3 115
Chapter 4: Response Device and Settings Management
4 Enter the number of expected devices.
5 Press the Enter key.
6 Click Done.
The expected number of response devices has been updated.
Next StepsOptionally, test your response device communication by selecting the Polling Test tab from the Settings window. Find more information in Check Device Communication on page 111.
Note You cannot exceed the number of licensed devices. For example, if you enter the number of expected devices as 60 in this region, but TurningPoint is licensed for 50 devices, only 50 devices can be used during the presentation.
This does not apply to presenters with an unlimited license. They can use as many response devices as they choose.
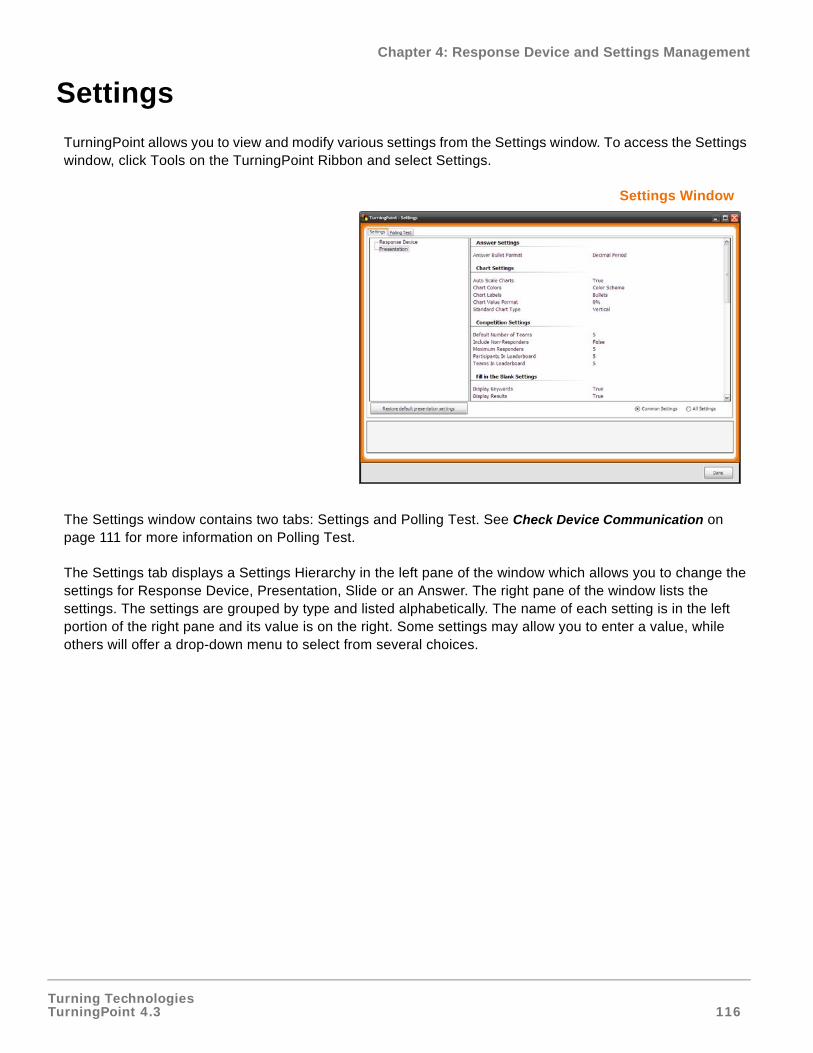
Turning TechnologiesTurningPoint 4.3 116
Chapter 4: Response Device and Settings Management
Settings
TurningPoint allows you to view and modify various settings from the Settings window. To access the Settings window, click Tools on the TurningPoint Ribbon and select Settings.
Settings Window
The Settings window contains two tabs: Settings and Polling Test. See Check Device Communication on page 111 for more information on Polling Test.
The Settings tab displays a Settings Hierarchy in the left pane of the window which allows you to change the settings for Response Device, Presentation, Slide or an Answer. The right pane of the window lists the settings. The settings are grouped by type and listed alphabetically. The name of each setting is in the left portion of the right pane and its value is on the right. Some settings may allow you to enter a value, while others will offer a drop-down menu to select from several choices.
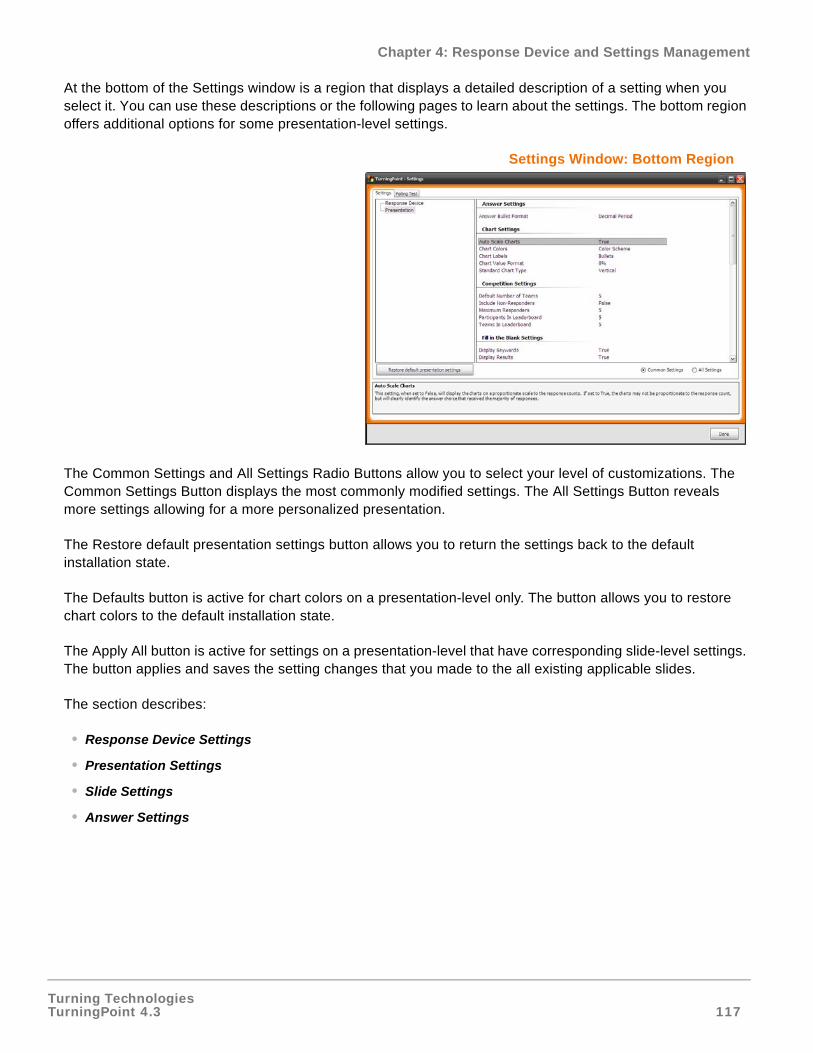
Turning TechnologiesTurningPoint 4.3 117
Chapter 4: Response Device and Settings Management
At the bottom of the Settings window is a region that displays a detailed description of a setting when you select it. You can use these descriptions or the following pages to learn about the settings. The bottom region offers additional options for some presentation-level settings.
Settings Window: Bottom Region
The Common Settings and All Settings Radio Buttons allow you to select your level of customizations. The Common Settings Button displays the most commonly modified settings. The All Settings Button reveals more settings allowing for a more personalized presentation.
The Restore default presentation settings button allows you to return the settings back to the default installation state.
The Defaults button is active for chart colors on a presentation-level only. The button allows you to restore chart colors to the default installation state.
The Apply All button is active for settings on a presentation-level that have corresponding slide-level settings. The button applies and saves the setting changes that you made to the all existing applicable slides.
The section describes:
• Response Device Settings
• Presentation Settings
• Slide Settings
• Answer Settings
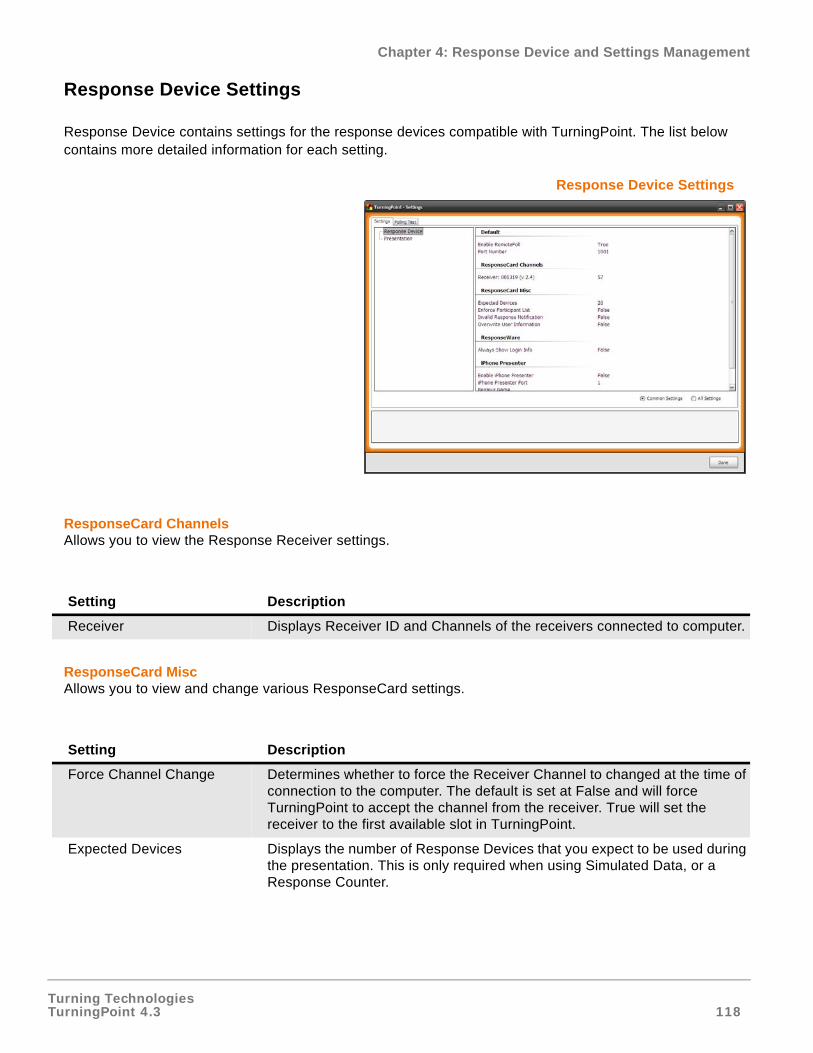
Turning TechnologiesTurningPoint 4.3 118
Chapter 4: Response Device and Settings Management
Response Device Settings
Response Device contains settings for the response devices compatible with TurningPoint. The list below contains more detailed information for each setting.
Response Device Settings
ResponseCard ChannelsAllows you to view the Response Receiver settings.
ResponseCard MiscAllows you to view and change various ResponseCard settings.
Setting Description
Receiver Displays Receiver ID and Channels of the receivers connected to computer.
Setting Description
Force Channel Change Determines whether to force the Receiver Channel to changed at the time of connection to the computer. The default is set at False and will force TurningPoint to accept the channel from the receiver. True will set the receiver to the first available slot in TurningPoint.
Expected Devices Displays the number of Response Devices that you expect to be used during the presentation. This is only required when using Simulated Data, or a Response Counter.
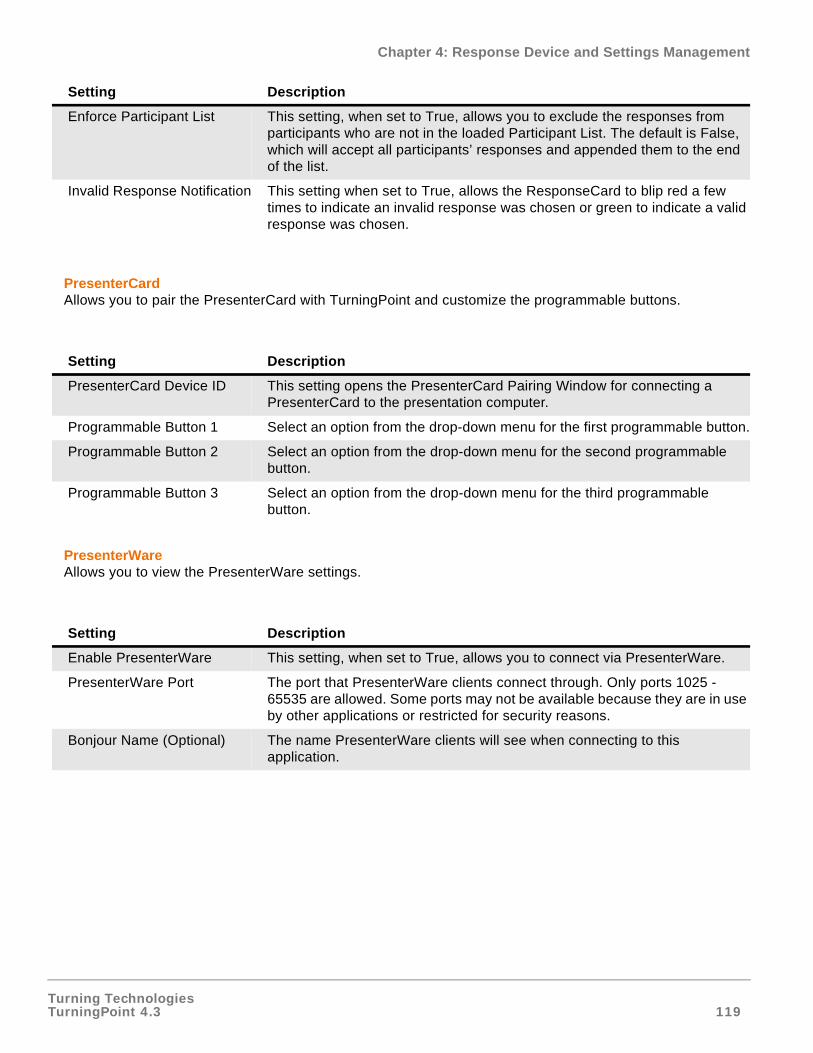
Turning TechnologiesTurningPoint 4.3 119
Chapter 4: Response Device and Settings Management
PresenterCardAllows you to pair the PresenterCard with TurningPoint and customize the programmable buttons.
PresenterWareAllows you to view the PresenterWare settings.
Enforce Participant List This setting, when set to True, allows you to exclude the responses from participants who are not in the loaded Participant List. The default is False, which will accept all participants’ responses and appended them to the end of the list.
Invalid Response Notification This setting when set to True, allows the ResponseCard to blip red a few times to indicate an invalid response was chosen or green to indicate a valid response was chosen.
Setting Description
PresenterCard Device ID This setting opens the PresenterCard Pairing Window for connecting a PresenterCard to the presentation computer.
Programmable Button 1 Select an option from the drop-down menu for the first programmable button.
Programmable Button 2 Select an option from the drop-down menu for the second programmable button.
Programmable Button 3 Select an option from the drop-down menu for the third programmable button.
Setting Description
Enable PresenterWare This setting, when set to True, allows you to connect via PresenterWare.
PresenterWare Port The port that PresenterWare clients connect through. Only ports 1025 - 65535 are allowed. Some ports may not be available because they are in use by other applications or restricted for security reasons.
Bonjour Name (Optional) The name PresenterWare clients will see when connecting to this application.
Setting Description
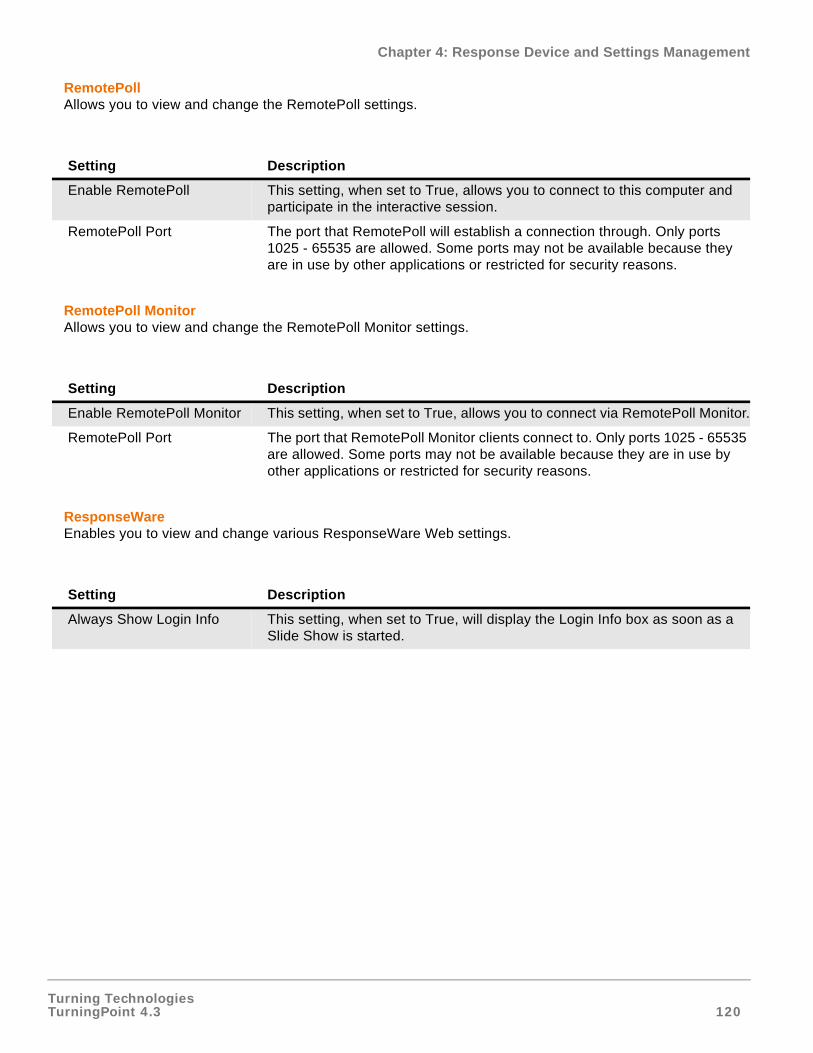
Turning TechnologiesTurningPoint 4.3 120
Chapter 4: Response Device and Settings Management
RemotePollAllows you to view and change the RemotePoll settings.
RemotePoll MonitorAllows you to view and change the RemotePoll Monitor settings.
ResponseWare Enables you to view and change various ResponseWare Web settings.
Setting Description
Enable RemotePoll This setting, when set to True, allows you to connect to this computer and participate in the interactive session.
RemotePoll Port The port that RemotePoll will establish a connection through. Only ports 1025 - 65535 are allowed. Some ports may not be available because they are in use by other applications or restricted for security reasons.
Setting Description
Enable RemotePoll Monitor This setting, when set to True, allows you to connect via RemotePoll Monitor.
RemotePoll Port The port that RemotePoll Monitor clients connect to. Only ports 1025 - 65535 are allowed. Some ports may not be available because they are in use by other applications or restricted for security reasons.
Setting Description
Always Show Login Info This setting, when set to True, will display the Login Info box as soon as a Slide Show is started.
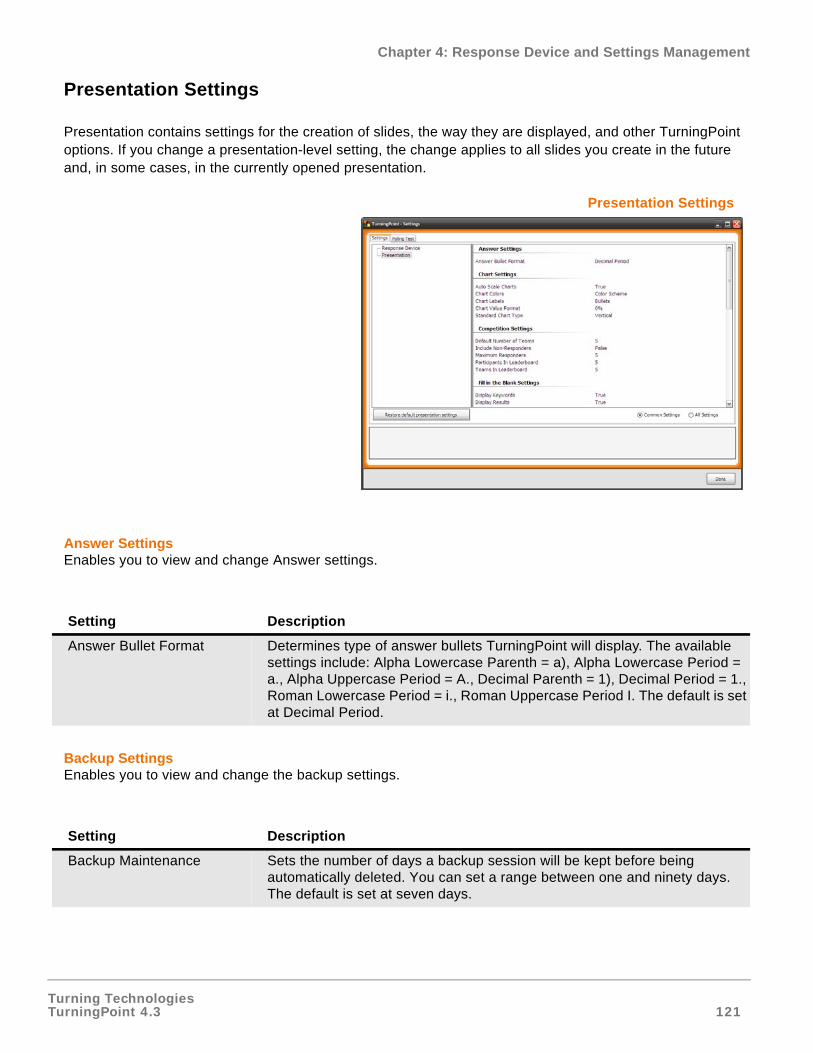
Turning TechnologiesTurningPoint 4.3 121
Chapter 4: Response Device and Settings Management
Presentation Settings
Presentation contains settings for the creation of slides, the way they are displayed, and other TurningPoint options. If you change a presentation-level setting, the change applies to all slides you create in the future and, in some cases, in the currently opened presentation.
Presentation Settings
Answer SettingsEnables you to view and change Answer settings.
Backup SettingsEnables you to view and change the backup settings.
Setting Description
Answer Bullet Format Determines type of answer bullets TurningPoint will display. The available settings include: Alpha Lowercase Parenth = a), Alpha Lowercase Period = a., Alpha Uppercase Period = A., Decimal Parenth = 1), Decimal Period = 1., Roman Lowercase Period = i., Roman Uppercase Period I. The default is set at Decimal Period.
Setting Description
Backup Maintenance Sets the number of days a backup session will be kept before being automatically deleted. You can set a range between one and ninety days. The default is set at seven days.
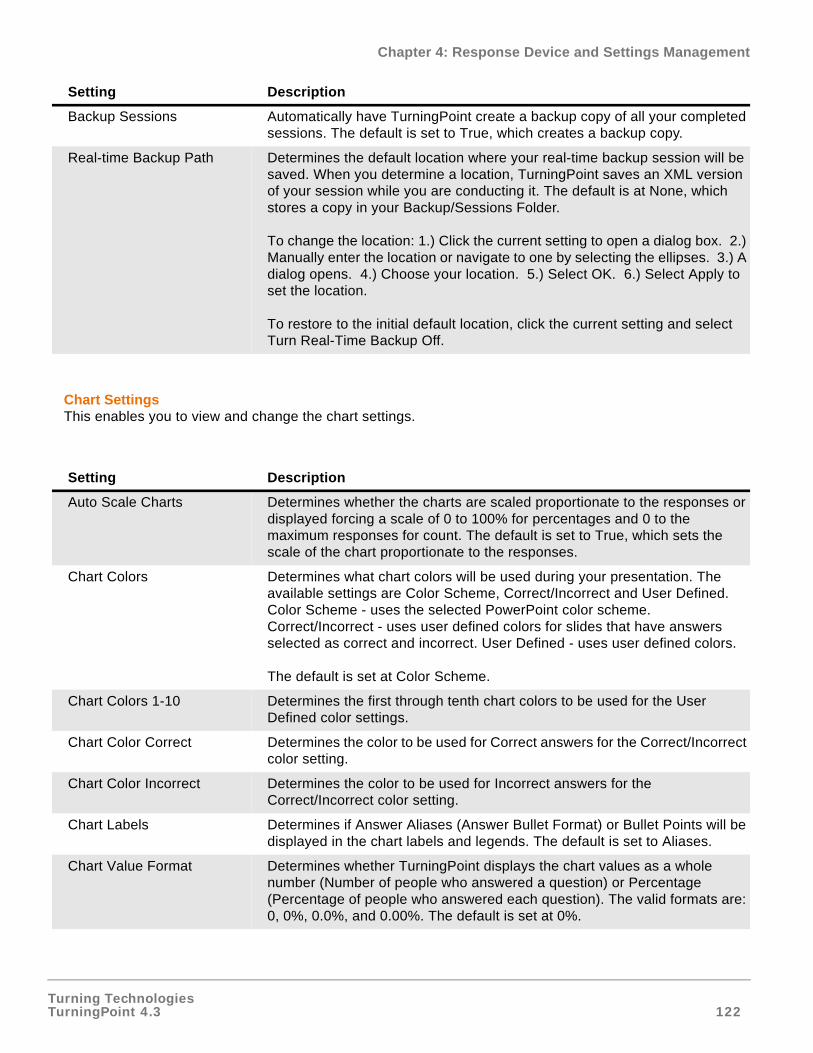
Turning TechnologiesTurningPoint 4.3 122
Chapter 4: Response Device and Settings Management
Chart SettingsThis enables you to view and change the chart settings.
Backup Sessions Automatically have TurningPoint create a backup copy of all your completed sessions. The default is set to True, which creates a backup copy.
Real-time Backup Path Determines the default location where your real-time backup session will be saved. When you determine a location, TurningPoint saves an XML version of your session while you are conducting it. The default is at None, which stores a copy in your Backup/Sessions Folder.
To change the location: 1.) Click the current setting to open a dialog box. 2.) Manually enter the location or navigate to one by selecting the ellipses. 3.) A dialog opens. 4.) Choose your location. 5.) Select OK. 6.) Select Apply to set the location.
To restore to the initial default location, click the current setting and select Turn Real-Time Backup Off.
Setting Description
Auto Scale Charts Determines whether the charts are scaled proportionate to the responses or displayed forcing a scale of 0 to 100% for percentages and 0 to the maximum responses for count. The default is set to True, which sets the scale of the chart proportionate to the responses.
Chart Colors Determines what chart colors will be used during your presentation. The available settings are Color Scheme, Correct/Incorrect and User Defined. Color Scheme - uses the selected PowerPoint color scheme. Correct/Incorrect - uses user defined colors for slides that have answers selected as correct and incorrect. User Defined - uses user defined colors.
The default is set at Color Scheme.
Chart Colors 1-10 Determines the first through tenth chart colors to be used for the User Defined color settings.
Chart Color Correct Determines the color to be used for Correct answers for the Correct/Incorrect color setting.
Chart Color Incorrect Determines the color to be used for Incorrect answers for the Correct/Incorrect color setting.
Chart Labels Determines if Answer Aliases (Answer Bullet Format) or Bullet Points will be displayed in the chart labels and legends. The default is set to Aliases.
Chart Value Format Determines whether TurningPoint displays the chart values as a whole number (Number of people who answered a question) or Percentage (Percentage of people who answered each question). The valid formats are: 0, 0%, 0.0%, and 0.00%. The default is set at 0%.
Setting Description
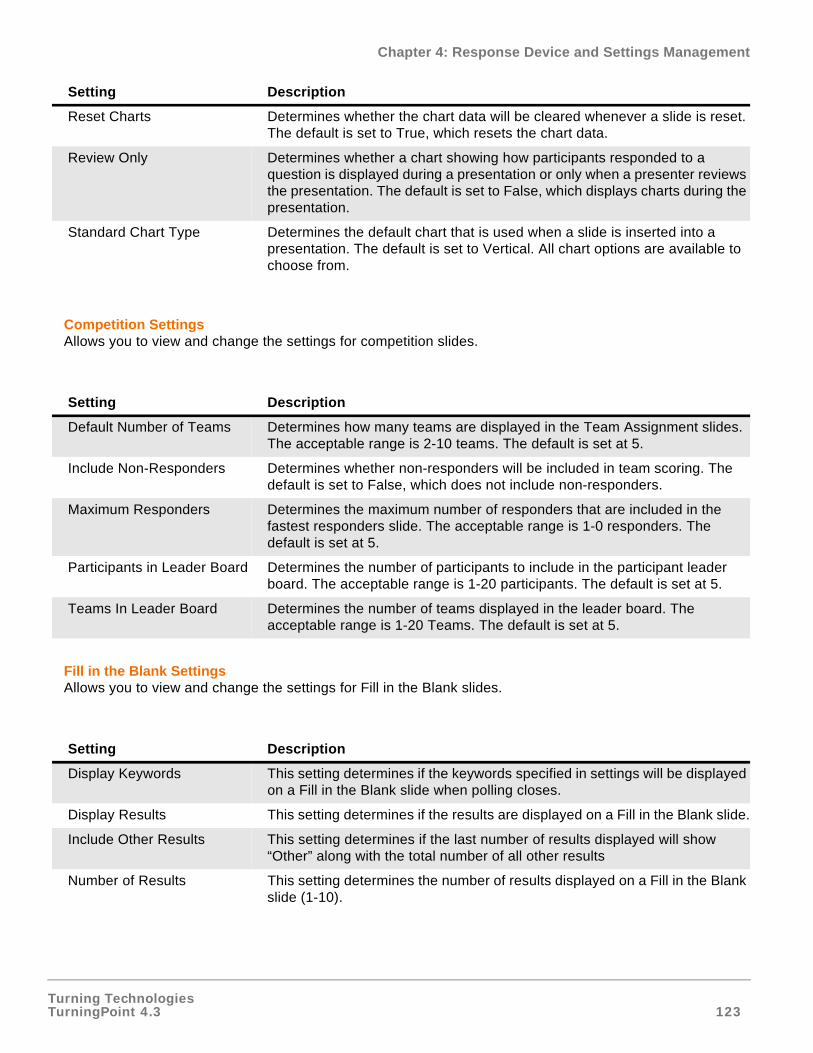
Turning TechnologiesTurningPoint 4.3 123
Chapter 4: Response Device and Settings Management
Competition SettingsAllows you to view and change the settings for competition slides.
Fill in the Blank SettingsAllows you to view and change the settings for Fill in the Blank slides.
Reset Charts Determines whether the chart data will be cleared whenever a slide is reset. The default is set to True, which resets the chart data.
Review Only Determines whether a chart showing how participants responded to a question is displayed during a presentation or only when a presenter reviews the presentation. The default is set to False, which displays charts during the presentation.
Standard Chart Type Determines the default chart that is used when a slide is inserted into a presentation. The default is set to Vertical. All chart options are available to choose from.
Setting Description
Default Number of Teams Determines how many teams are displayed in the Team Assignment slides. The acceptable range is 2-10 teams. The default is set at 5.
Include Non-Responders Determines whether non-responders will be included in team scoring. The default is set to False, which does not include non-responders.
Maximum Responders Determines the maximum number of responders that are included in the fastest responders slide. The acceptable range is 1-0 responders. The default is set at 5.
Participants in Leader Board Determines the number of participants to include in the participant leader board. The acceptable range is 1-20 participants. The default is set at 5.
Teams In Leader Board Determines the number of teams displayed in the leader board. The acceptable range is 1-20 Teams. The default is set at 5.
Setting Description
Display Keywords This setting determines if the keywords specified in settings will be displayed on a Fill in the Blank slide when polling closes.
Display Results This setting determines if the results are displayed on a Fill in the Blank slide.
Include Other Results This setting determines if the last number of results displayed will show “Other” along with the total number of all other results
Number of Results This setting determines the number of results displayed on a Fill in the Blank slide (1-10).
Setting Description
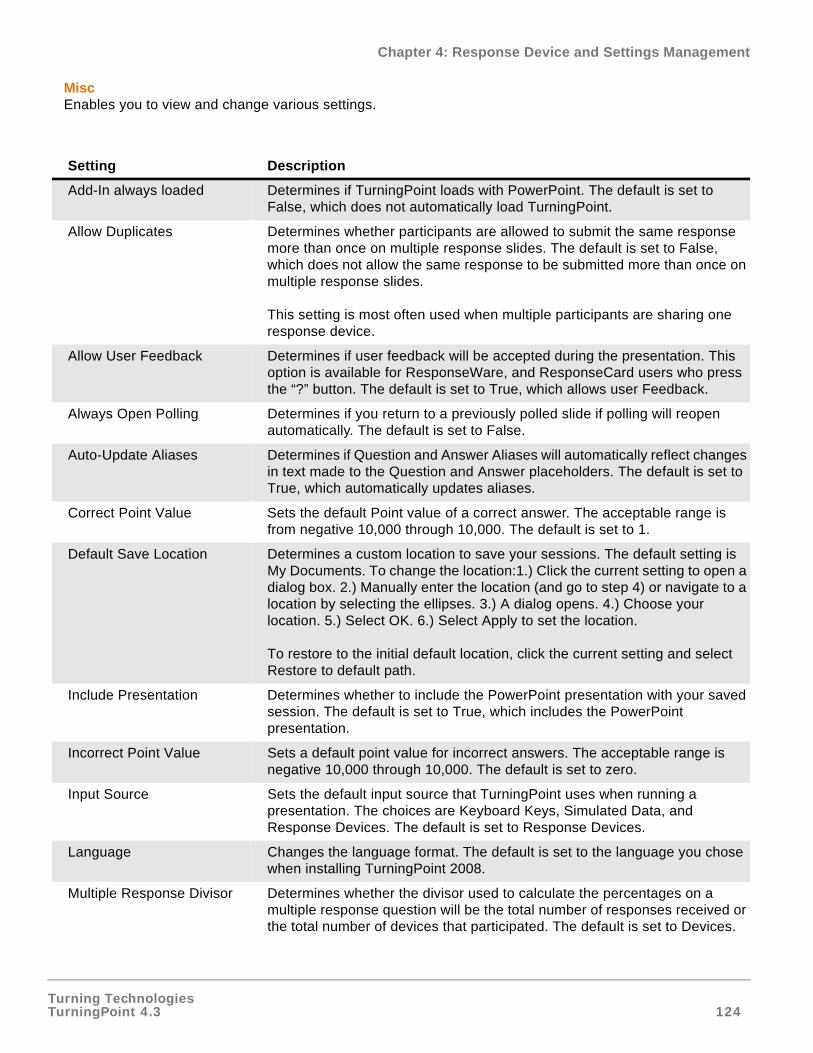
Turning TechnologiesTurningPoint 4.3 124
Chapter 4: Response Device and Settings Management
MiscEnables you to view and change various settings.
Setting Description
Add-In always loaded Determines if TurningPoint loads with PowerPoint. The default is set to False, which does not automatically load TurningPoint.
Allow Duplicates Determines whether participants are allowed to submit the same response more than once on multiple response slides. The default is set to False, which does not allow the same response to be submitted more than once on multiple response slides.
This setting is most often used when multiple participants are sharing one response device.
Allow User Feedback Determines if user feedback will be accepted during the presentation. This option is available for ResponseWare, and ResponseCard users who press the “?” button. The default is set to True, which allows user Feedback.
Always Open Polling Determines if you return to a previously polled slide if polling will reopen automatically. The default is set to False.
Auto-Update Aliases Determines if Question and Answer Aliases will automatically reflect changes in text made to the Question and Answer placeholders. The default is set to True, which automatically updates aliases.
Correct Point Value Sets the default Point value of a correct answer. The acceptable range is from negative 10,000 through 10,000. The default is set to 1.
Default Save Location Determines a custom location to save your sessions. The default setting is My Documents. To change the location:1.) Click the current setting to open a dialog box. 2.) Manually enter the location (and go to step 4) or navigate to a location by selecting the ellipses. 3.) A dialog opens. 4.) Choose your location. 5.) Select OK. 6.) Select Apply to set the location.
To restore to the initial default location, click the current setting and select Restore to default path.
Include Presentation Determines whether to include the PowerPoint presentation with your saved session. The default is set to True, which includes the PowerPoint presentation.
Incorrect Point Value Sets a default point value for incorrect answers. The acceptable range is negative 10,000 through 10,000. The default is set to zero.
Input Source Sets the default input source that TurningPoint uses when running a presentation. The choices are Keyboard Keys, Simulated Data, and Response Devices. The default is set to Response Devices.
Language Changes the language format. The default is set to the language you chose when installing TurningPoint 2008.
Multiple Response Divisor Determines whether the divisor used to calculate the percentages on a multiple response question will be the total number of responses received or the total number of devices that participated. The default is set to Devices.
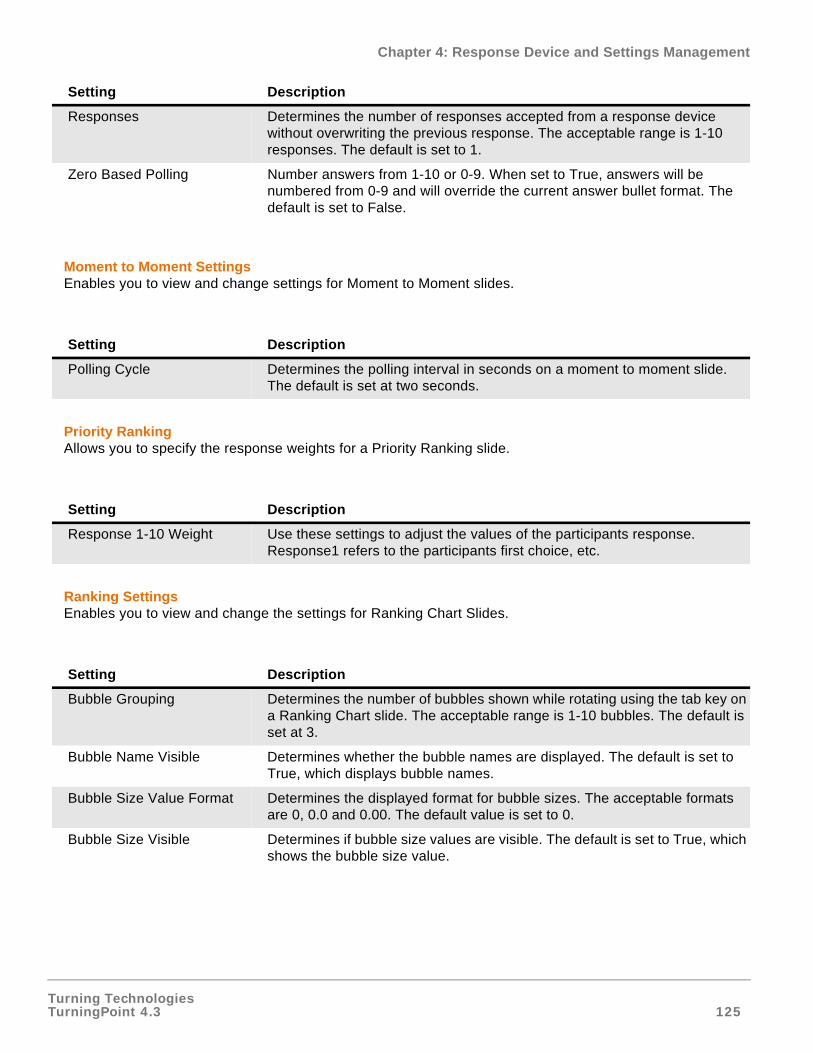
Turning TechnologiesTurningPoint 4.3 125
Chapter 4: Response Device and Settings Management
Moment to Moment SettingsEnables you to view and change settings for Moment to Moment slides.
Priority RankingAllows you to specify the response weights for a Priority Ranking slide.
Ranking SettingsEnables you to view and change the settings for Ranking Chart Slides.
Responses Determines the number of responses accepted from a response device without overwriting the previous response. The acceptable range is 1-10 responses. The default is set to 1.
Zero Based Polling Number answers from 1-10 or 0-9. When set to True, answers will be numbered from 0-9 and will override the current answer bullet format. The default is set to False.
Setting Description
Polling Cycle Determines the polling interval in seconds on a moment to moment slide. The default is set at two seconds.
Setting Description
Response 1-10 Weight Use these settings to adjust the values of the participants response. Response1 refers to the participants first choice, etc.
Setting Description
Bubble Grouping Determines the number of bubbles shown while rotating using the tab key on a Ranking Chart slide. The acceptable range is 1-10 bubbles. The default is set at 3.
Bubble Name Visible Determines whether the bubble names are displayed. The default is set to True, which displays bubble names.
Bubble Size Value Format Determines the displayed format for bubble sizes. The acceptable formats are 0, 0.0 and 0.00. The default value is set to 0.
Bubble Size Visible Determines if bubble size values are visible. The default is set to True, which shows the bubble size value.
Setting Description

Turning TechnologiesTurningPoint 4.3 126
Chapter 4: Response Device and Settings Management
Racing Leader Board SettingsEnables you to view and change settings for Racing Leader Board slides.
Response Reminders SettingsEnables you to view and set Response Reminders settings.
Setting Description
Animation Speed Sets the speed at which the teams move across the slide.
Number of Racers Displayed Sets the maximum number of teams to show up on a slide. A maximum of 10 teams can be displayed.
Points To Win Race Sets the number of points required to be earned by a team to win the race.
Skip Remaining Race Slides Skips the remaining racing slides if the point level has been reached that is set in the Points To Win Race setting.
Setting Description
Answer Now Select the default Answer Now object that will be automatically added to new slides. The default is set to None, which does not automatically add an Answer Now Indicator. All Answer Now objects are available to choose from.
Answer Now Text Change the Answer Now text that is displayed in the Answer Now object. The default text is Answer Now.
Auto-Advance Determines whether the Slide Show will automatically advance to the next animation if polling is closed by a Countdown Indicator or Response Counter object. The default is set to False, which does not automatically advance the Slide Show.
Countdown Determines if a Countdown object will be automatically added to new slides. The default is set to None, which does not automatically add a Countdown object to new slides. All Countdown objects are available to choose from.
Countdown Seconds Set the number of seconds a Countdown object will display. The acceptable range is 1-999. The default is set at 10 seconds.
Response Counter Determines whether a Response Counter object is automatically added to new slides. The default is set at None, which does not automatically add a Response Counter. All Response Counter objects are available to choose from.
Response Counter Format Determines the format for new Response Counter objects. The acceptable formats are Count (number of responses), Percent, or Both (Count and Percent). The default is set to Count.
Rotation Interval Determines the number of seconds that a Rotating table will pause between intervals. The acceptable range is 1-10 seconds. The default is set to two seconds.
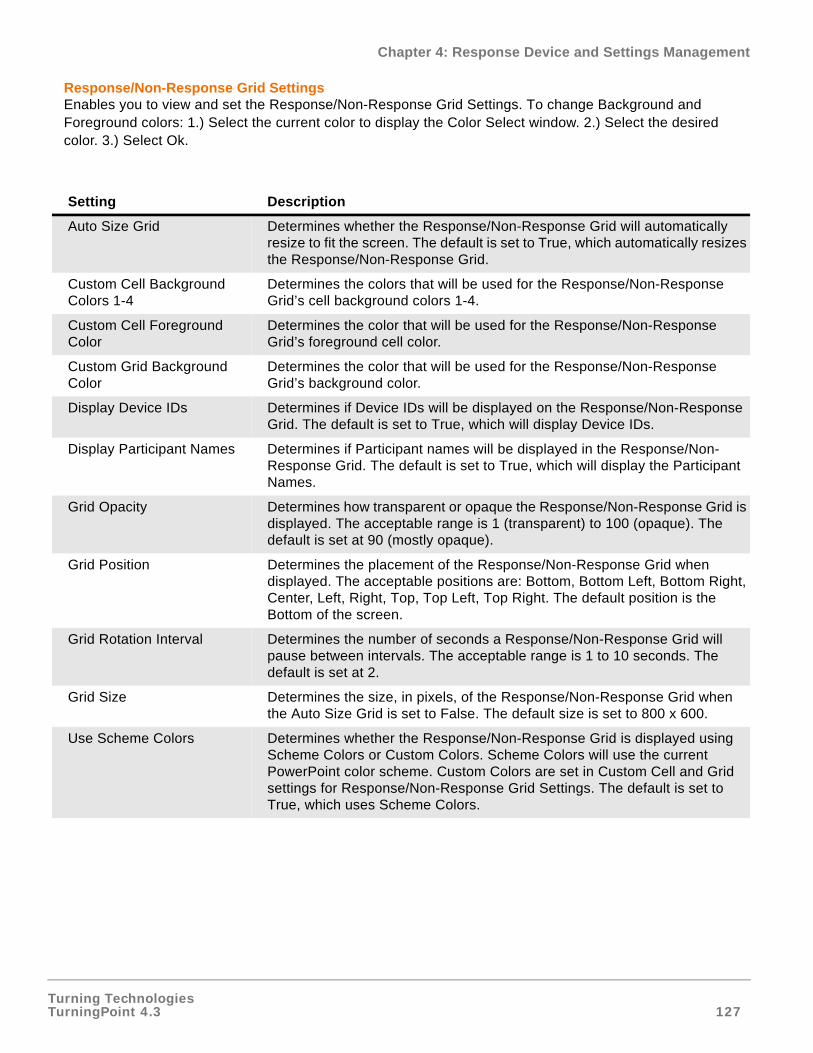
Turning TechnologiesTurningPoint 4.3 127
Chapter 4: Response Device and Settings Management
Response/Non-Response Grid SettingsEnables you to view and set the Response/Non-Response Grid Settings. To change Background and Foreground colors: 1.) Select the current color to display the Color Select window. 2.) Select the desired color. 3.) Select Ok.
Setting Description
Auto Size Grid Determines whether the Response/Non-Response Grid will automatically resize to fit the screen. The default is set to True, which automatically resizes the Response/Non-Response Grid.
Custom Cell Background Colors 1-4
Determines the colors that will be used for the Response/Non-Response Grid’s cell background colors 1-4.
Custom Cell Foreground Color
Determines the color that will be used for the Response/Non-Response Grid’s foreground cell color.
Custom Grid Background Color
Determines the color that will be used for the Response/Non-Response Grid’s background color.
Display Device IDs Determines if Device IDs will be displayed on the Response/Non-Response Grid. The default is set to True, which will display Device IDs.
Display Participant Names Determines if Participant names will be displayed in the Response/Non-Response Grid. The default is set to True, which will display the Participant Names.
Grid Opacity Determines how transparent or opaque the Response/Non-Response Grid is displayed. The acceptable range is 1 (transparent) to 100 (opaque). The default is set at 90 (mostly opaque).
Grid Position Determines the placement of the Response/Non-Response Grid when displayed. The acceptable positions are: Bottom, Bottom Left, Bottom Right, Center, Left, Right, Top, Top Left, Top Right. The default position is the Bottom of the screen.
Grid Rotation Interval Determines the number of seconds a Response/Non-Response Grid will pause between intervals. The acceptable range is 1 to 10 seconds. The default is set at 2.
Grid Size Determines the size, in pixels, of the Response/Non-Response Grid when the Auto Size Grid is set to False. The default size is set to 800 x 600.
Use Scheme Colors Determines whether the Response/Non-Response Grid is displayed using Scheme Colors or Custom Colors. Scheme Colors will use the current PowerPoint color scheme. Custom Colors are set in Custom Cell and Grid settings for Response/Non-Response Grid Settings. The default is set to True, which uses Scheme Colors.
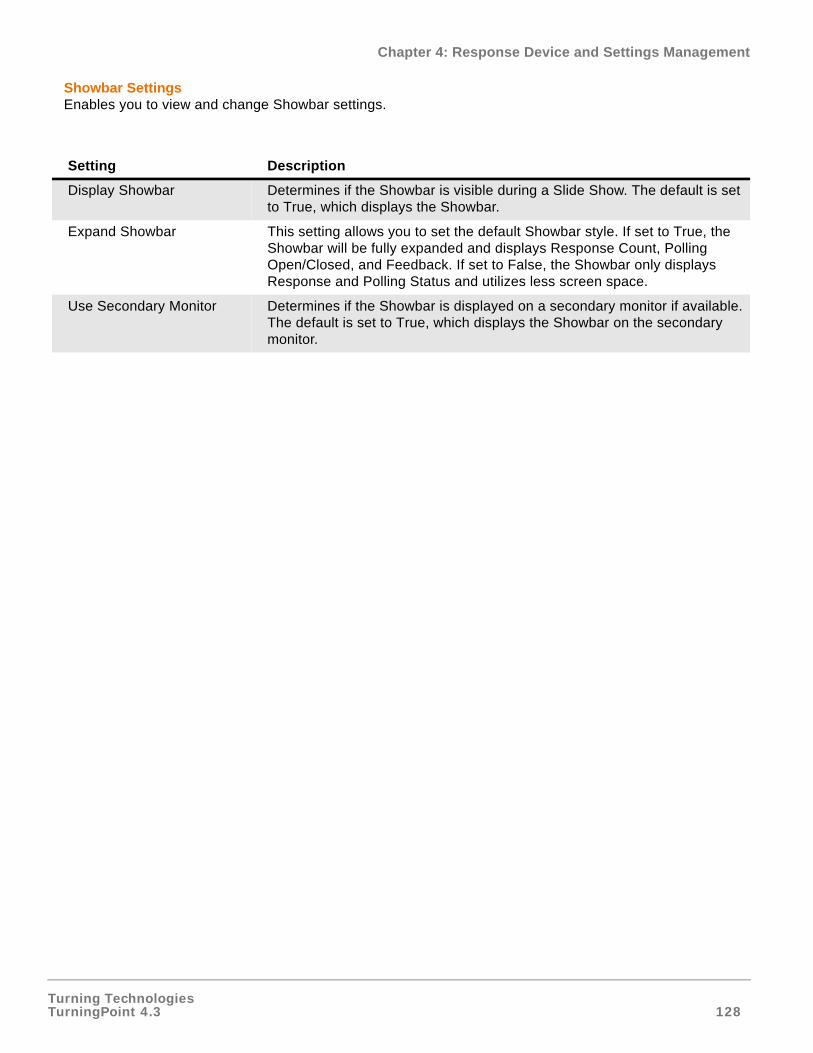
Turning TechnologiesTurningPoint 4.3 128
Chapter 4: Response Device and Settings Management
Showbar SettingsEnables you to view and change Showbar settings.
Setting Description
Display Showbar Determines if the Showbar is visible during a Slide Show. The default is set to True, which displays the Showbar.
Expand Showbar This setting allows you to set the default Showbar style. If set to True, the Showbar will be fully expanded and displays Response Count, Polling Open/Closed, and Feedback. If set to False, the Showbar only displays Response and Polling Status and utilizes less screen space.
Use Secondary Monitor Determines if the Showbar is displayed on a secondary monitor if available. The default is set to True, which displays the Showbar on the secondary monitor.
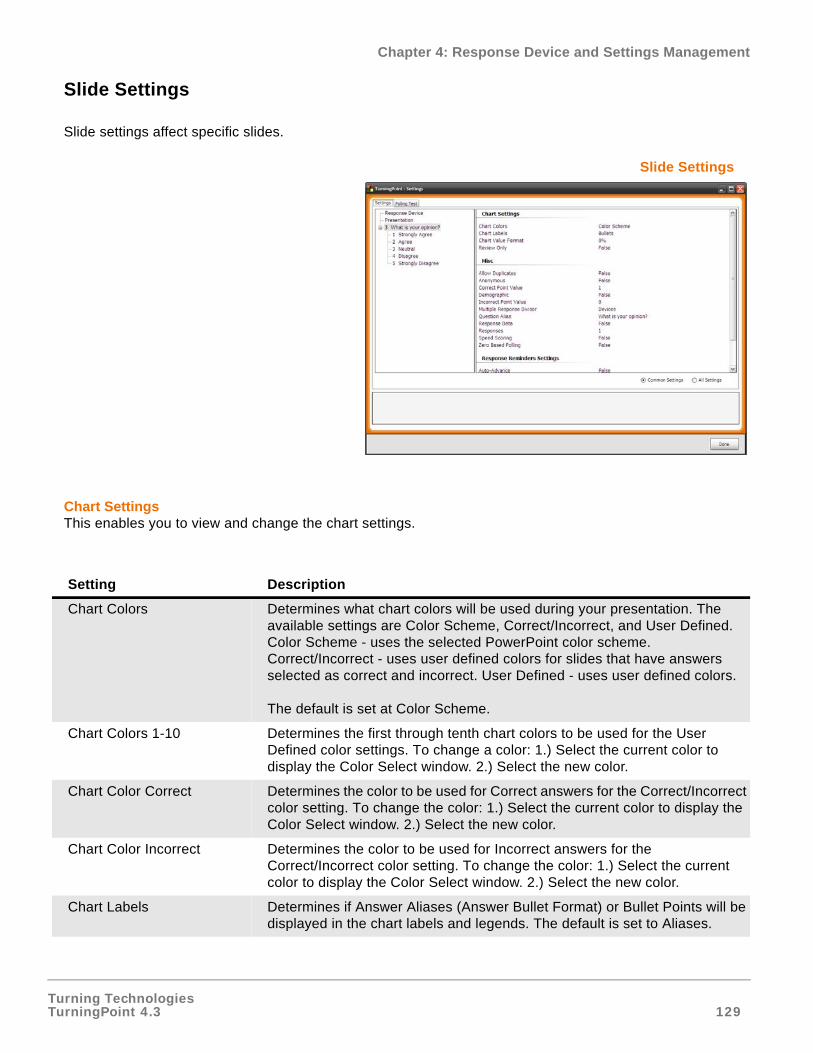
Turning TechnologiesTurningPoint 4.3 129
Chapter 4: Response Device and Settings Management
Slide Settings
Slide settings affect specific slides.
Slide Settings
Chart SettingsThis enables you to view and change the chart settings.
Setting Description
Chart Colors Determines what chart colors will be used during your presentation. The available settings are Color Scheme, Correct/Incorrect, and User Defined. Color Scheme - uses the selected PowerPoint color scheme. Correct/Incorrect - uses user defined colors for slides that have answers selected as correct and incorrect. User Defined - uses user defined colors.
The default is set at Color Scheme.
Chart Colors 1-10 Determines the first through tenth chart colors to be used for the User Defined color settings. To change a color: 1.) Select the current color to display the Color Select window. 2.) Select the new color.
Chart Color Correct Determines the color to be used for Correct answers for the Correct/Incorrect color setting. To change the color: 1.) Select the current color to display the Color Select window. 2.) Select the new color.
Chart Color Incorrect Determines the color to be used for Incorrect answers for the Correct/Incorrect color setting. To change the color: 1.) Select the current color to display the Color Select window. 2.) Select the new color.
Chart Labels Determines if Answer Aliases (Answer Bullet Format) or Bullet Points will be displayed in the chart labels and legends. The default is set to Aliases.
Turning TechnologiesTurningPoint 4.3 130
Chapter 4: Response Device and Settings Management
MiscEnables you to view and change various uncategorized settings.
Chart Value Format Determines whether TurningPoint displays the chart values as a whole number (number of people who answered a question) or percentage (percentage of people who answer each question). The valid formats are: 0, 0%, 0.0%, and 0.00%. The default is set at 0%.
Review Only Determines whether a chart showing how participants responded to a question is displayed during a presentation or only when a presenter reviews the presentation. The default is set to False, which displays charts during the presentation.
Setting Description
Allow Duplicates Determines whether participants are allowed to submit the same response more than once on multiple response slides. The default is set to False, which does not allow the same response to be submitted more than once on multiple response slides.
This setting is most often used when multiple participants are sharing one response device.
Anonymous Designates a slide as anonymous when polled. The default is set to False, which does not make the selected slide Anonymous.
Correct Point Value Sets the default Point value of a correct answer. The acceptable range is from negative 10,000 through 10,000. The default is set to 100.
Demographic Determines if the question on the selected slide is treated as a demographic question. The default is set to False, which does not treat the question as demographic.
Incorrect Point Value Sets a default point value for incorrect answers. The acceptable range is negative 10,000 through 10,000. The default is set to zero.
Multiple Response Divisor Determines whether the divisor used to calculate the percentages on a multiple response question will be the total number of responses received or the total number of devices that participated. The default is set to Devices.
Question Alias Determines how the question is labeled. This only applies when running some reports. The default is set to how the question appears on the slide.
Response Data Determines whether a slide contains response data. When set to True, the slide has polled data and will not be polled again. When set to False, the slide can be polled again. The default is set to True.
Responses Determines the number of responses accepted from a response device without overwriting the previous response. The acceptable range is 1-10 responses. The default is set to 1.
Setting Description
Turning TechnologiesTurningPoint 4.3 131
Chapter 4: Response Device and Settings Management
Response Reminders SettingEnables you to view and set Response Reminders settings.
Speed Scoring Determines whether point values will decrease relative to the time polling is kept open. The default is set to False, which will not decrease point values relative to the time polling is kept open.
Zero Based Polling Number answers from 1-10 or 0-9. When set to True, answers will be number from 0-9 and will override the current answer bullet format. The default is set to False.
Setting Description
Auto-Advance Determines whether the Slide Show will automatically advance to the next animation if polling is closed by a Countdown Indicator or Response Counter object. The default is set to False, which does not automatically advance the Slide Show.
Countdown Seconds Set the number of seconds a Countdown object will display. The acceptable range is 1-999. The default is set at 10 seconds.
Countdown Sound Use a sound file for a Countdown Sound. To add a Countdown Sound: 1.) Click the current setting to open a dialog. 2.) Navigate to the folder containing the sound file. 3.) Select the file name. 4.) Select open. 5.) Select done.
The default is set to (None). The acceptable file extensions include: .aiff, .au, .mid, .midi, .mp3, .wav, and .wma.
Setting Description
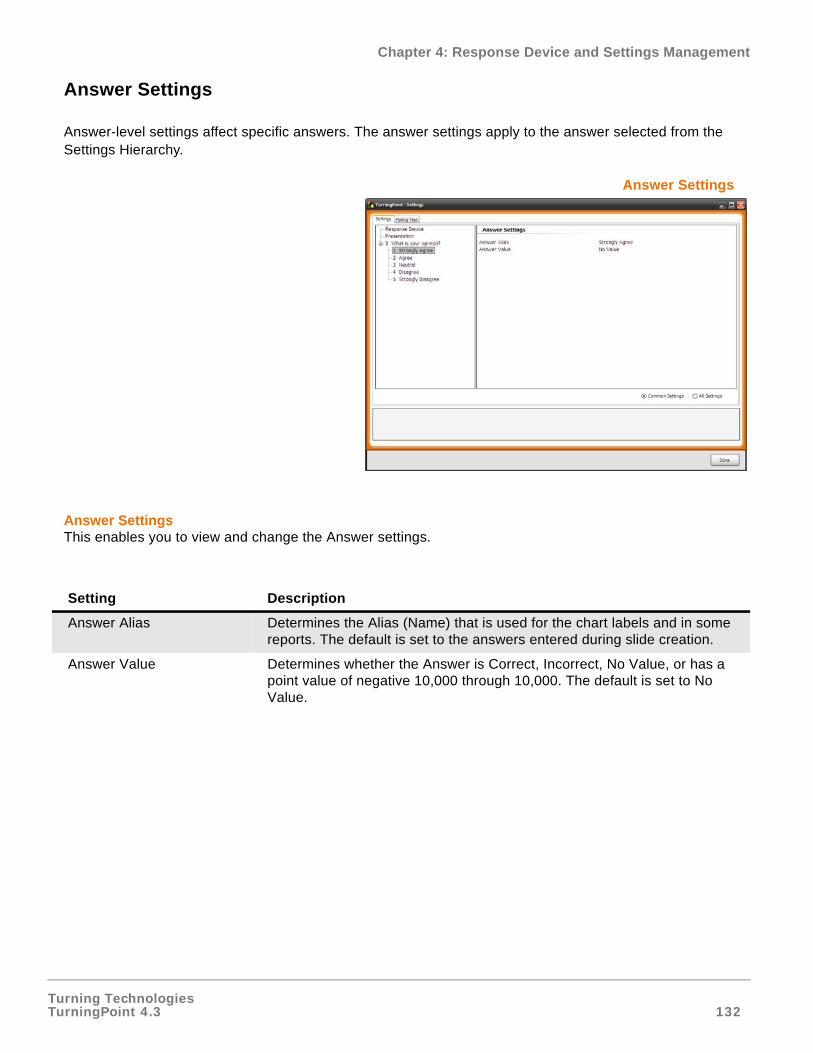
Turning TechnologiesTurningPoint 4.3 132
Chapter 4: Response Device and Settings Management
Answer Settings
Answer-level settings affect specific answers. The answer settings apply to the answer selected from the Settings Hierarchy.
Answer Settings
Answer SettingsThis enables you to view and change the Answer settings.
Setting Description
Answer Alias Determines the Alias (Name) that is used for the chart labels and in some reports. The default is set to the answers entered during slide creation.
Answer Value Determines whether the Answer is Correct, Incorrect, No Value, or has a point value of negative 10,000 through 10,000. The default is set to No Value.

Turning TechnologiesTurningPoint 4.3 133
Chapter 5: Track Participants and Teams
Track Participants and Teams
Participant Lists identify the members of your audience who will use a response device to respond to questions during your presentation.
The participant name and other required information is stored along with the Device ID, a unique identifier for a response device. The Device ID is printed on the device tag, which is located on the back of the device (unless you are using ResponseWare software).
This chapter discusses creating and managing a Participant List.
Participant List Wizard
Create a Participant List using the Participant List Wizard or Learning Management Systems by Web CT, Blackboard, Sakai, and Turning Technologies On-line Roster.
You may create multiple Participant Lists to be used with the same interactive presentation. One Participant List contains information about one audience group. Creating multiple Participant Lists allows you to capture responses from multiple audiences.
• Create a Participant List Using Participant List Wizard
• Create a Participant List from a Learning Management System
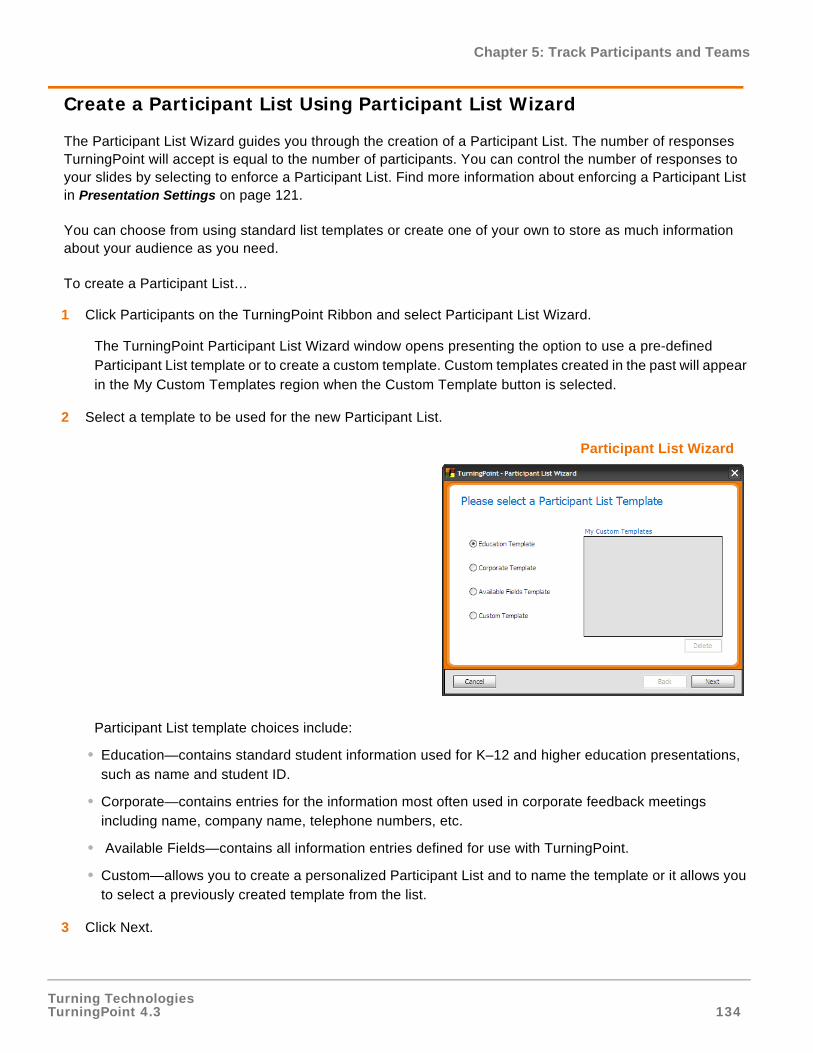
Turning TechnologiesTurningPoint 4.3 134
Chapter 5: Track Participants and Teams
Create a Participant List Using Participant List Wizard
The Participant List Wizard guides you through the creation of a Participant List. The number of responses TurningPoint will accept is equal to the number of participants. You can control the number of responses to your slides by selecting to enforce a Participant List. Find more information about enforcing a Participant List in Presentation Settings on page 121.
You can choose from using standard list templates or create one of your own to store as much information about your audience as you need.
To create a Participant List…
1 Click Participants on the TurningPoint Ribbon and select Participant List Wizard.
The TurningPoint Participant List Wizard window opens presenting the option to use a pre-defined Participant List template or to create a custom template. Custom templates created in the past will appear in the My Custom Templates region when the Custom Template button is selected.
2 Select a template to be used for the new Participant List.
Participant List Wizard
Participant List template choices include:
• Education—contains standard student information used for K–12 and higher education presentations, such as name and student ID.
• Corporate—contains entries for the information most often used in corporate feedback meetings including name, company name, telephone numbers, etc.
• Available Fields—contains all information entries defined for use with TurningPoint.
• Custom—allows you to create a personalized Participant List and to name the template or it allows you to select a previously created template from the list.
3 Click Next.

Turning TechnologiesTurningPoint 4.3 135
Chapter 5: Track Participants and Teams
If you opted to create a custom template, TurningPoint prompts you to name the template. Enter a name and click OK.
Save Custom Template Dialog Box
TurningPoint displays the Participant List information entries (called fields). All entries that make up the template appear in the Selected Fields region on the right. Use this page to add, delete, or reorder the entries that make up the template.
Participant List Fields
4 You may choose to customize the list of Selected Fields.
• To remove an entry from the template, select it under the Selected Fields region and click the left arrow button (<).
Note Alternatively, double click on an entry to remove it from the Select Fields region.
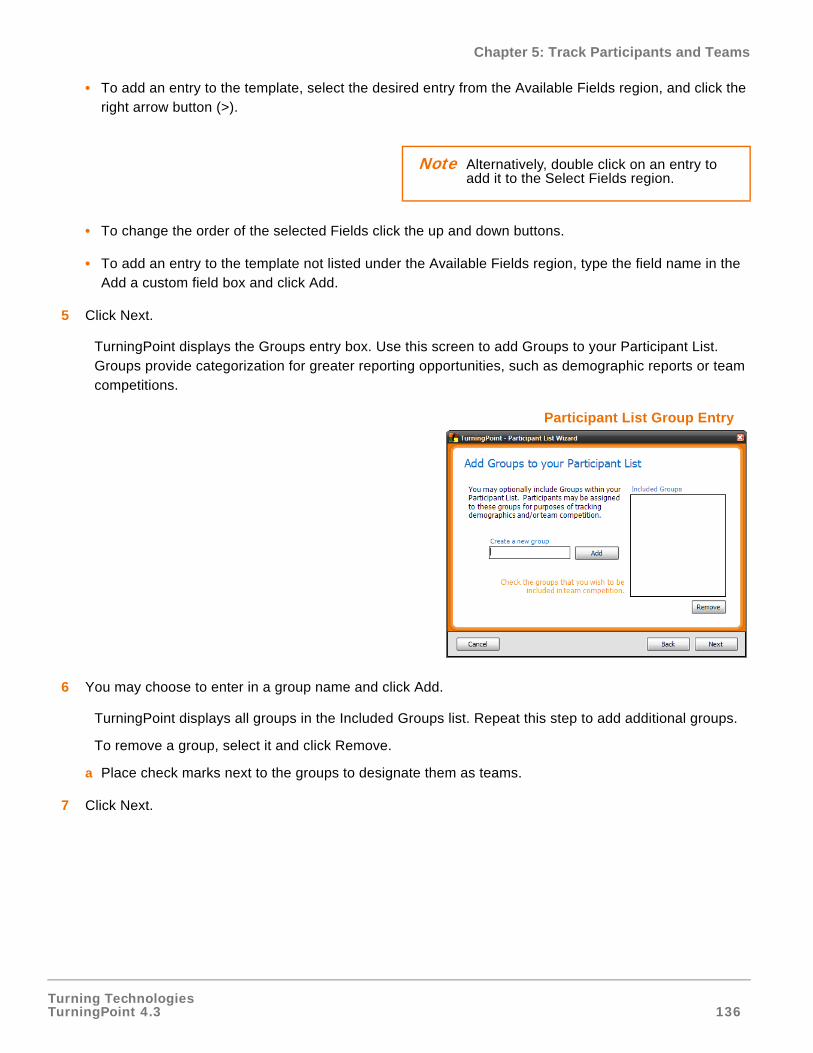
Turning TechnologiesTurningPoint 4.3 136
Chapter 5: Track Participants and Teams
• To add an entry to the template, select the desired entry from the Available Fields region, and click the right arrow button (>).
• To change the order of the selected Fields click the up and down buttons.
• To add an entry to the template not listed under the Available Fields region, type the field name in the Add a custom field box and click Add.
5 Click Next.
TurningPoint displays the Groups entry box. Use this screen to add Groups to your Participant List. Groups provide categorization for greater reporting opportunities, such as demographic reports or team competitions.
Participant List Group Entry
6 You may choose to enter in a group name and click Add.
TurningPoint displays all groups in the Included Groups list. Repeat this step to add additional groups.
To remove a group, select it and click Remove.
a Place check marks next to the groups to designate them as teams.
7 Click Next.
Note Alternatively, double click on an entry to add it to the Select Fields region.
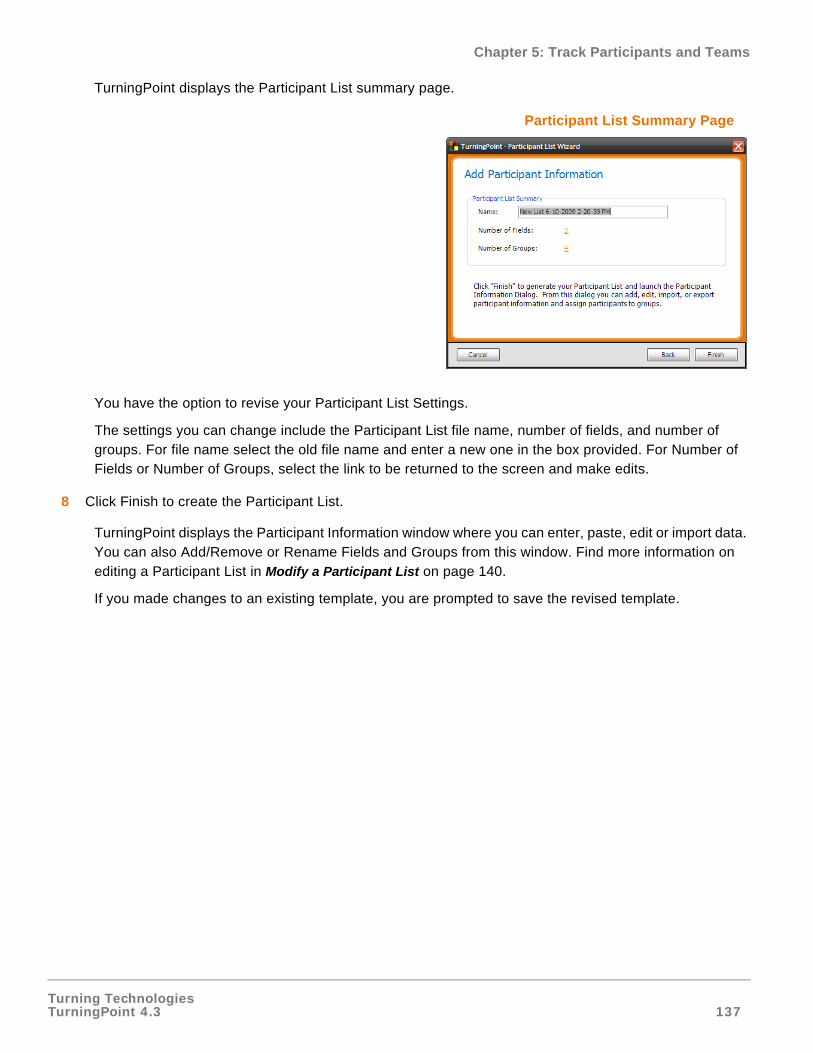
Turning TechnologiesTurningPoint 4.3 137
Chapter 5: Track Participants and Teams
TurningPoint displays the Participant List summary page.
Participant List Summary Page
You have the option to revise your Participant List Settings.
The settings you can change include the Participant List file name, number of fields, and number of groups. For file name select the old file name and enter a new one in the box provided. For Number of Fields or Number of Groups, select the link to be returned to the screen and make edits.
8 Click Finish to create the Participant List.
TurningPoint displays the Participant Information window where you can enter, paste, edit or import data. You can also Add/Remove or Rename Fields and Groups from this window. Find more information on editing a Participant List in Modify a Participant List on page 140.
If you made changes to an existing template, you are prompted to save the revised template.
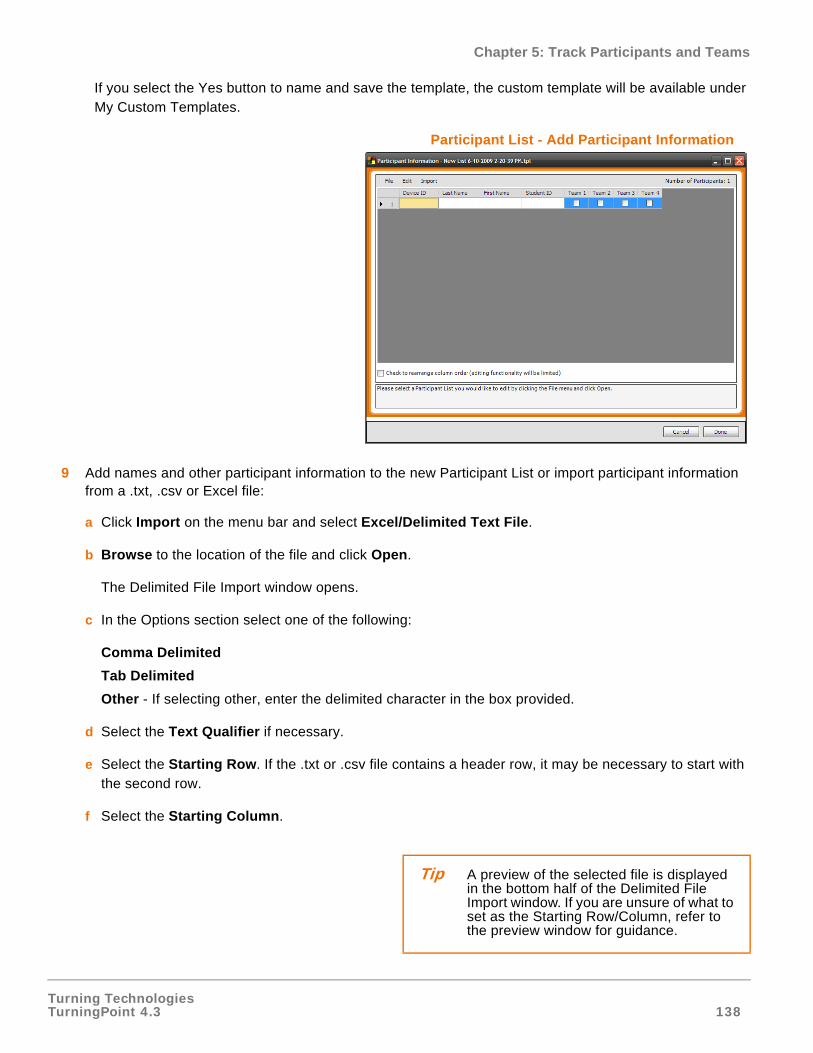
Turning TechnologiesTurningPoint 4.3 138
Chapter 5: Track Participants and Teams
If you select the Yes button to name and save the template, the custom template will be available under My Custom Templates.
Participant List - Add Participant Information
9 Add names and other participant information to the new Participant List or import participant information from a .txt, .csv or Excel file:
a Click Import on the menu bar and select Excel/Delimited Text File.
b Browse to the location of the file and click Open.
The Delimited File Import window opens.
c In the Options section select one of the following:
Comma Delimited
Tab Delimited
Other - If selecting other, enter the delimited character in the box provided.
d Select the Text Qualifier if necessary.
e Select the Starting Row. If the .txt or .csv file contains a header row, it may be necessary to start with the second row.
f Select the Starting Column.
Tip A preview of the selected file is displayed in the bottom half of the Delimited File Import window. If you are unsure of what to set as the Starting Row/Column, refer to the preview window for guidance.

Turning TechnologiesTurningPoint 4.3 139
Chapter 5: Track Participants and Teams
g Click Import.
The file is imported and displayed in the Participant Information window.
h Optionally, edit student information as necessary.
10 Click Done or File > Save to save the data in the Participant List.
TurningPoint adds the new Participant List to TurningPoint Ribbon in the Select a Participant List drop-down menu.
Next StepsFind more information on editing and deleting your Participant Lists in Manage Participant Lists on page 140.
Create a Participant List from a Learning Management System
TurningPoint has been integrated with the following Learning Management Systems.
• Blackboard (7, 8, and 9)
• WebCT (CE 6.0, Vista 3, 4, or 8)
• Sakai
• Turning Technologies On-line Roster
For instructions on creating a Participant List from a LMS, please refer to the LMS User guide downloaded from the Turning Technologies website.
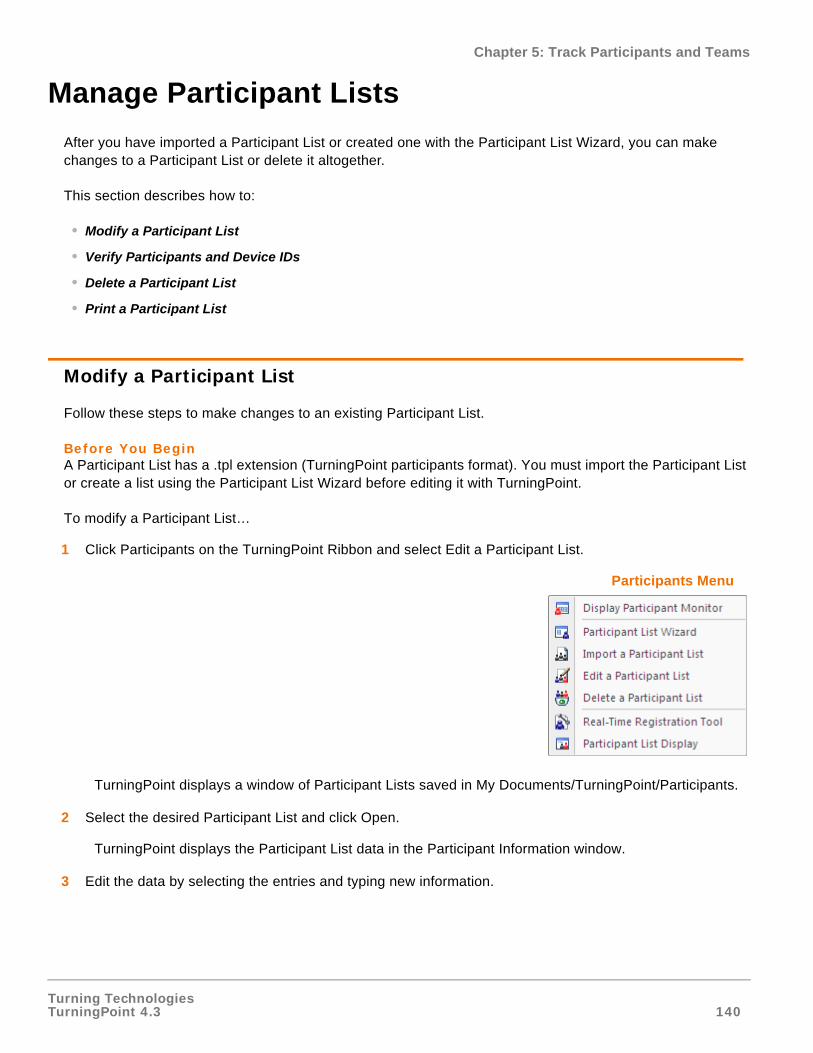
Turning TechnologiesTurningPoint 4.3 140
Chapter 5: Track Participants and Teams
Manage Participant Lists
After you have imported a Participant List or created one with the Participant List Wizard, you can make changes to a Participant List or delete it altogether.
This section describes how to:
• Modify a Participant List
• Verify Participants and Device IDs
• Delete a Participant List
• Print a Participant List
Modify a Participant List
Follow these steps to make changes to an existing Participant List.
Before You BeginA Participant List has a .tpl extension (TurningPoint participants format). You must import the Participant List or create a list using the Participant List Wizard before editing it with TurningPoint.
To modify a Participant List…
1 Click Participants on the TurningPoint Ribbon and select Edit a Participant List.
Participants Menu
TurningPoint displays a window of Participant Lists saved in My Documents/TurningPoint/Participants.
2 Select the desired Participant List and click Open.
TurningPoint displays the Participant List data in the Participant Information window.
3 Edit the data by selecting the entries and typing new information.
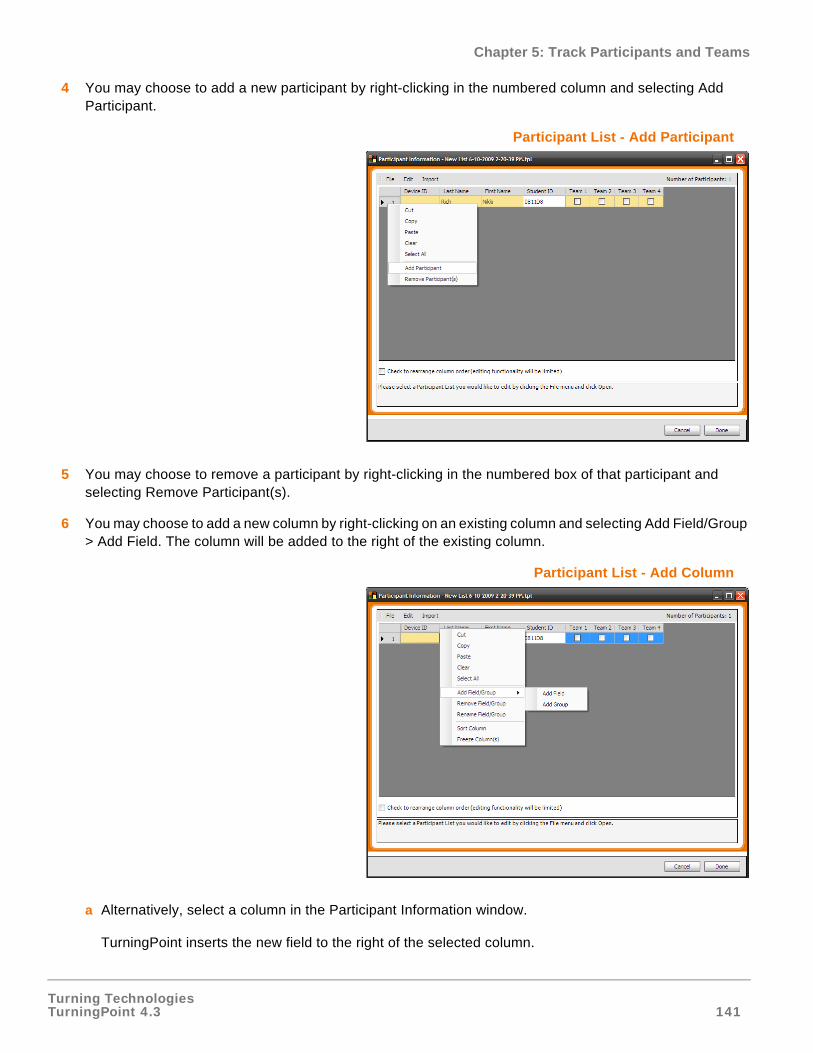
Turning TechnologiesTurningPoint 4.3 141
Chapter 5: Track Participants and Teams
4 You may choose to add a new participant by right-clicking in the numbered column and selecting Add Participant.
Participant List - Add Participant
5 You may choose to remove a participant by right-clicking in the numbered box of that participant and selecting Remove Participant(s).
6 You may choose to add a new column by right-clicking on an existing column and selecting Add Field/Group > Add Field. The column will be added to the right of the existing column.
Participant List - Add Column
a Alternatively, select a column in the Participant Information window.
TurningPoint inserts the new field to the right of the selected column.
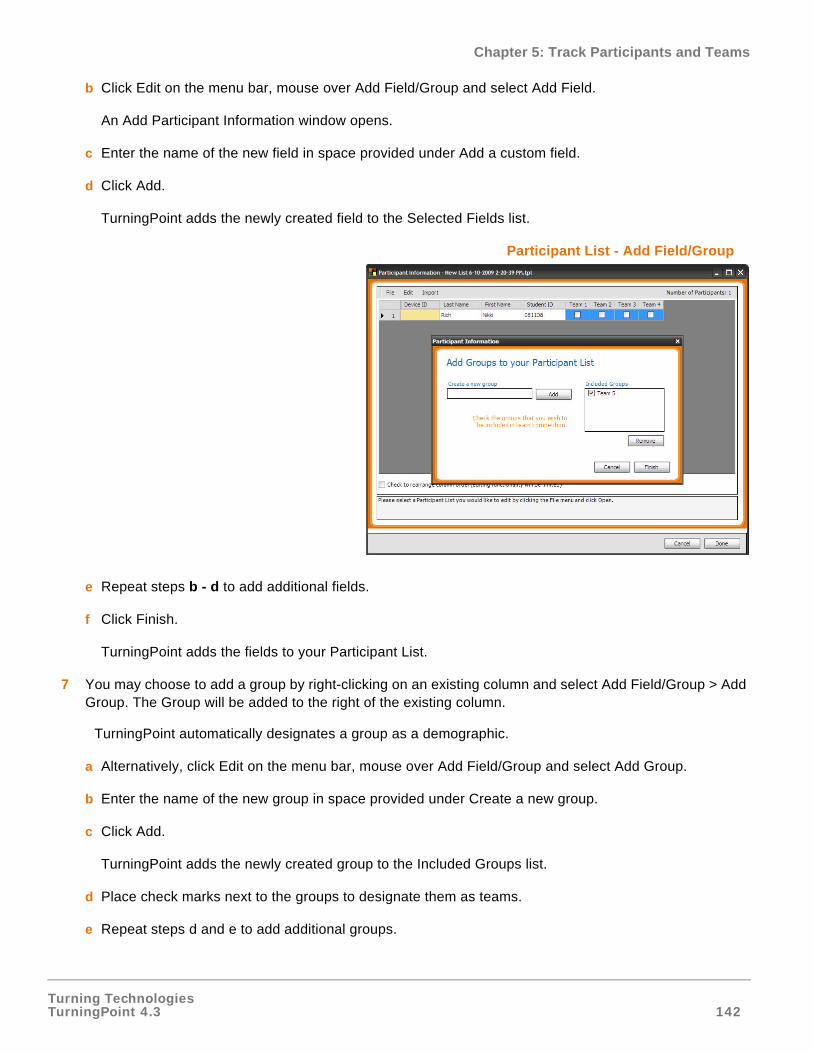
Turning TechnologiesTurningPoint 4.3 142
Chapter 5: Track Participants and Teams
b Click Edit on the menu bar, mouse over Add Field/Group and select Add Field.
An Add Participant Information window opens.
c Enter the name of the new field in space provided under Add a custom field.
d Click Add.
TurningPoint adds the newly created field to the Selected Fields list.
Participant List - Add Field/Group
e Repeat steps b - d to add additional fields.
f Click Finish.
TurningPoint adds the fields to your Participant List.
7 You may choose to add a group by right-clicking on an existing column and select Add Field/Group > Add Group. The Group will be added to the right of the existing column.
TurningPoint automatically designates a group as a demographic.
a Alternatively, click Edit on the menu bar, mouse over Add Field/Group and select Add Group.
b Enter the name of the new group in space provided under Create a new group.
c Click Add.
TurningPoint adds the newly created group to the Included Groups list.
d Place check marks next to the groups to designate them as teams.
e Repeat steps d and e to add additional groups.
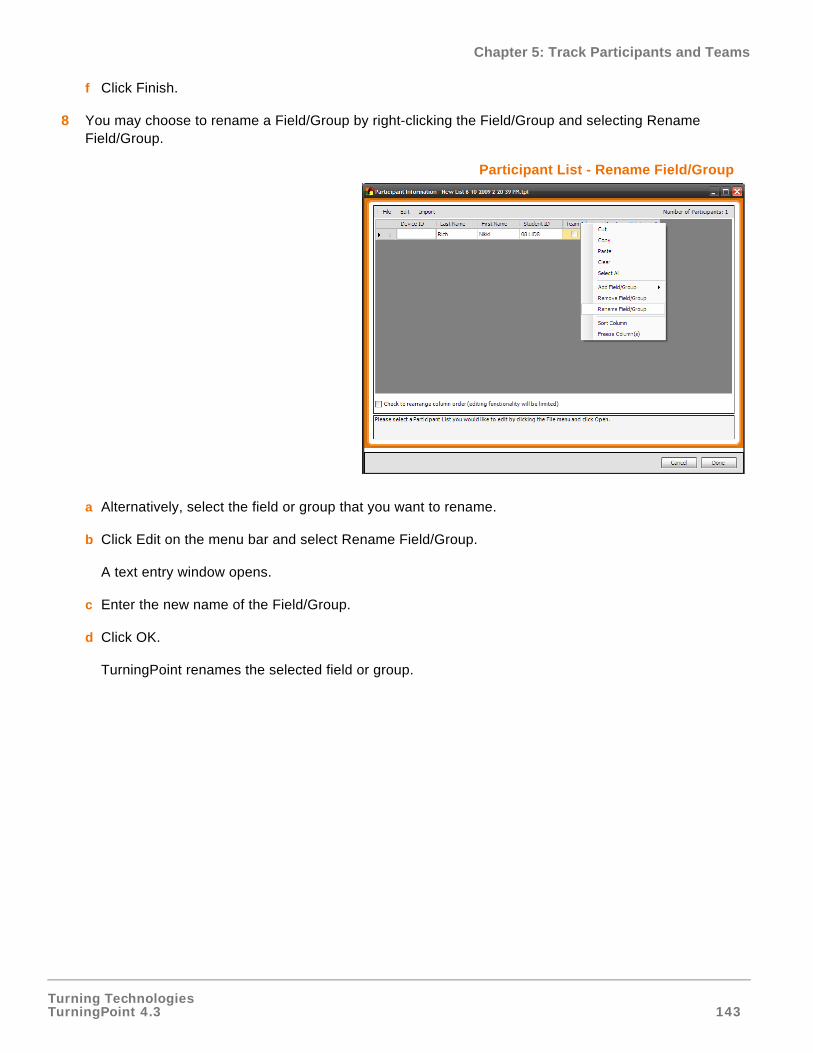
Turning TechnologiesTurningPoint 4.3 143
Chapter 5: Track Participants and Teams
f Click Finish.
8 You may choose to rename a Field/Group by right-clicking the Field/Group and selecting Rename Field/Group.
Participant List - Rename Field/Group
a Alternatively, select the field or group that you want to rename.
b Click Edit on the menu bar and select Rename Field/Group.
A text entry window opens.
c Enter the new name of the Field/Group.
d Click OK.
TurningPoint renames the selected field or group.
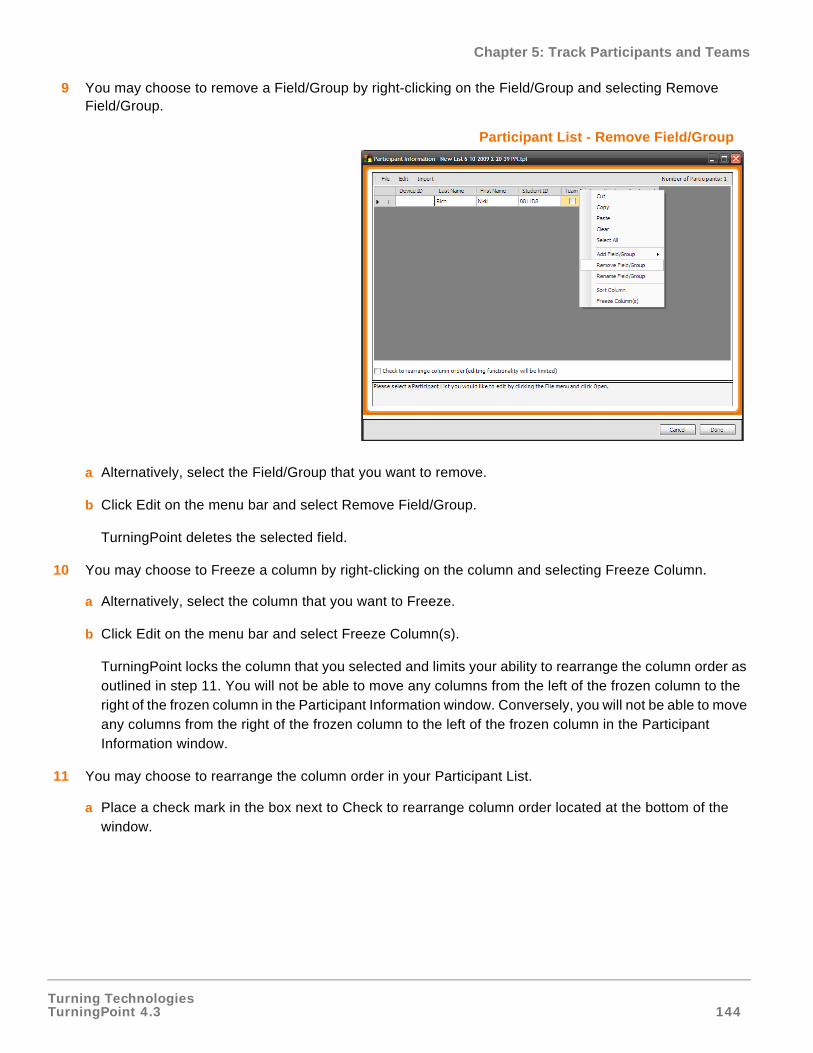
Turning TechnologiesTurningPoint 4.3 144
Chapter 5: Track Participants and Teams
9 You may choose to remove a Field/Group by right-clicking on the Field/Group and selecting Remove Field/Group.
Participant List - Remove Field/Group
a Alternatively, select the Field/Group that you want to remove.
b Click Edit on the menu bar and select Remove Field/Group.
TurningPoint deletes the selected field.
10 You may choose to Freeze a column by right-clicking on the column and selecting Freeze Column.
a Alternatively, select the column that you want to Freeze.
b Click Edit on the menu bar and select Freeze Column(s).
TurningPoint locks the column that you selected and limits your ability to rearrange the column order as outlined in step 11. You will not be able to move any columns from the left of the frozen column to the right of the frozen column in the Participant Information window. Conversely, you will not be able to move any columns from the right of the frozen column to the left of the frozen column in the Participant Information window.
11 You may choose to rearrange the column order in your Participant List.
a Place a check mark in the box next to Check to rearrange column order located at the bottom of the window.
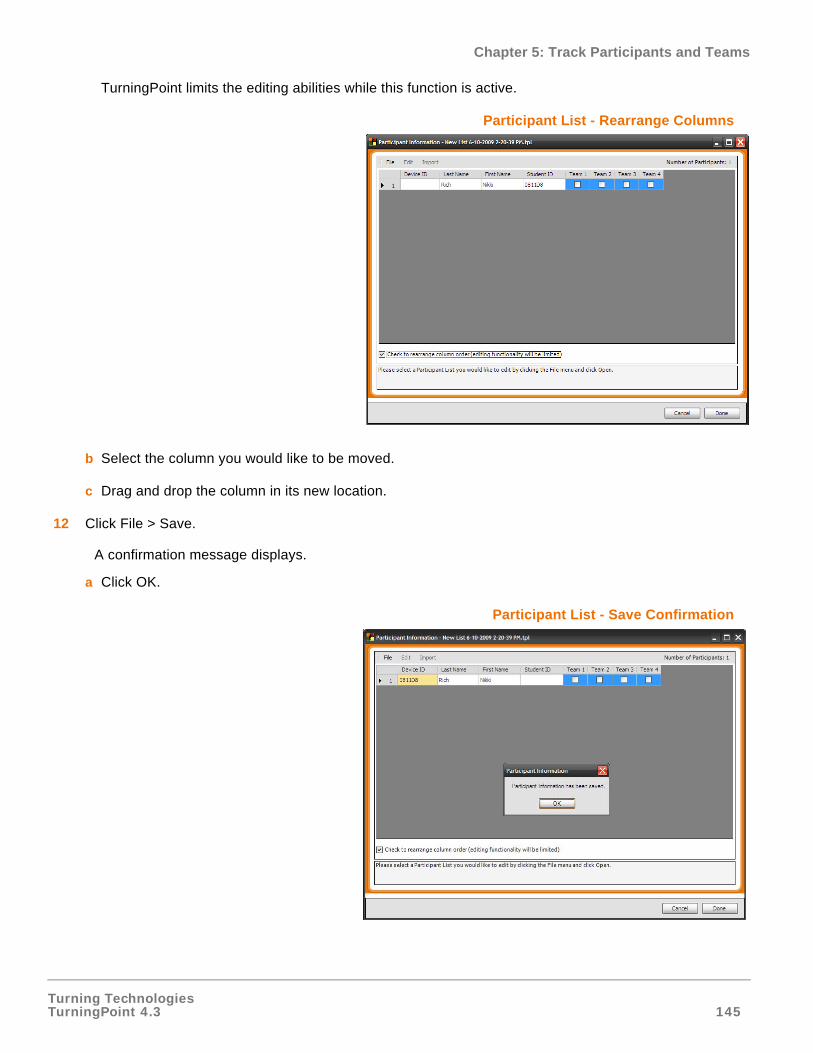
Turning TechnologiesTurningPoint 4.3 145
Chapter 5: Track Participants and Teams
TurningPoint limits the editing abilities while this function is active.
Participant List - Rearrange Columns
b Select the column you would like to be moved.
c Drag and drop the column in its new location.
12 Click File > Save.
A confirmation message displays.
a Click OK.
Participant List - Save Confirmation
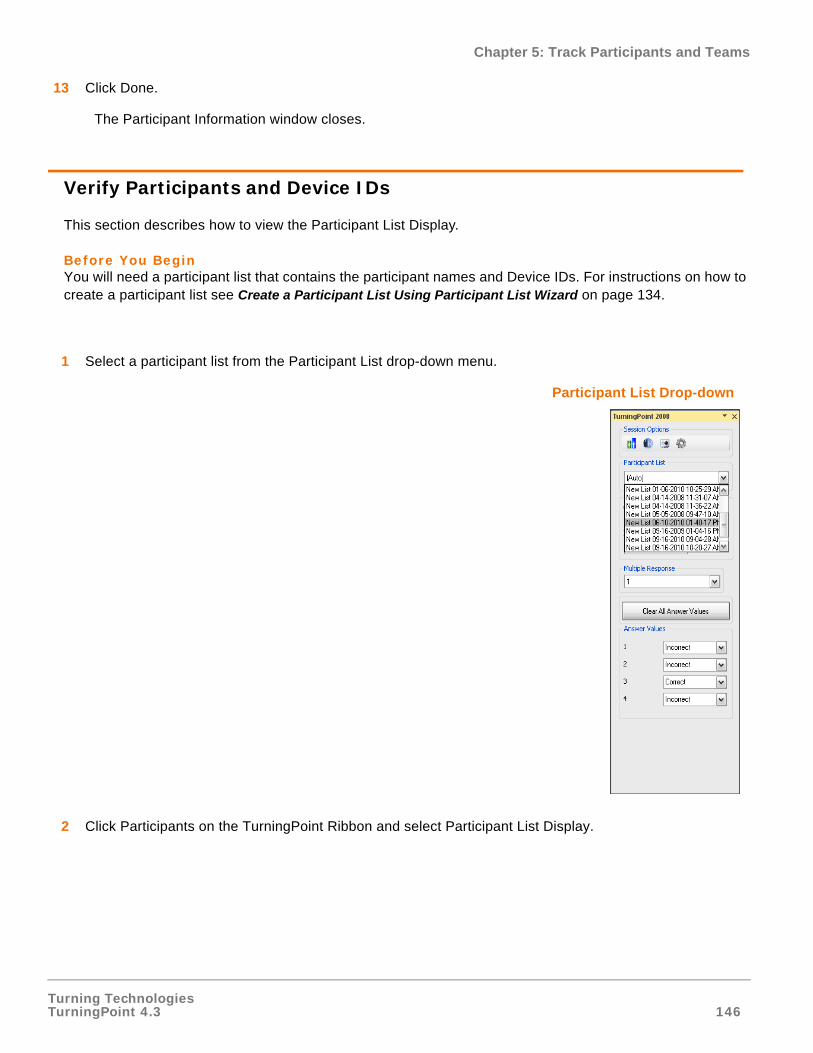
Turning TechnologiesTurningPoint 4.3 146
Chapter 5: Track Participants and Teams
13 Click Done.
The Participant Information window closes.
Verify Participants and Device IDs
This section describes how to view the Participant List Display.
Before You BeginYou will need a participant list that contains the participant names and Device IDs. For instructions on how to create a participant list see Create a Participant List Using Participant List Wizard on page 134.
1 Select a participant list from the Participant List drop-down menu.
Participant List Drop-down
2 Click Participants on the TurningPoint Ribbon and select Participant List Display.
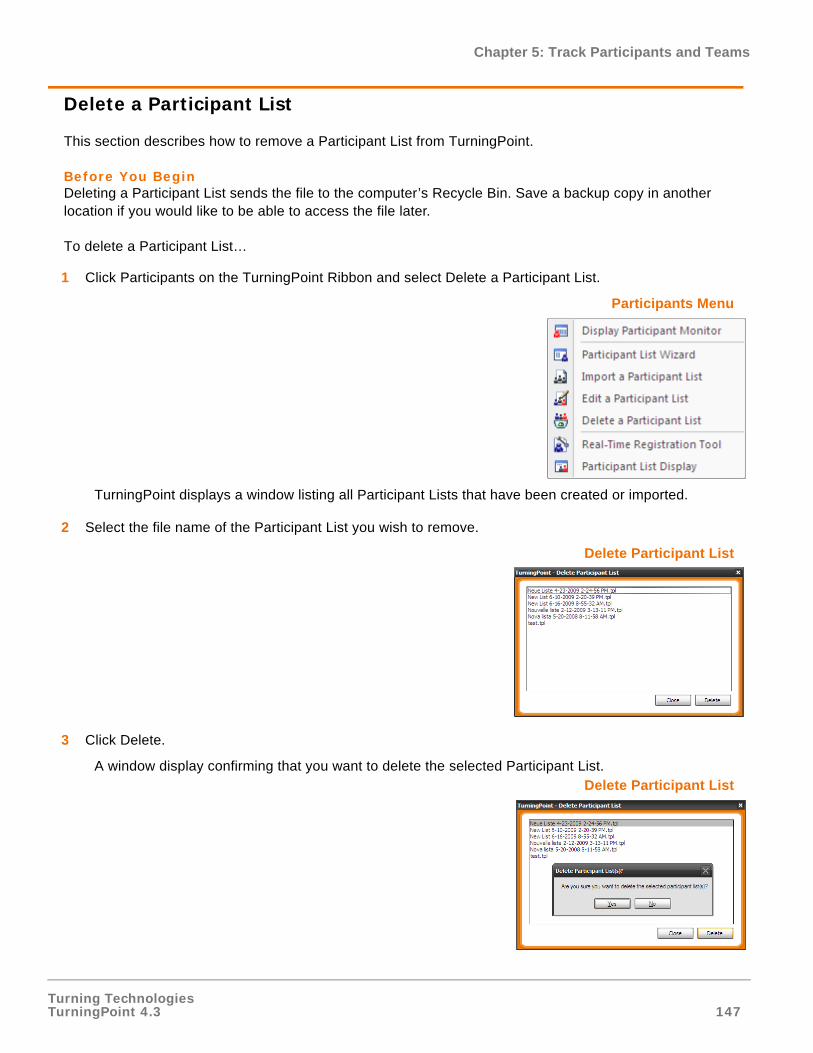
Turning TechnologiesTurningPoint 4.3 147
Chapter 5: Track Participants and Teams
Delete a Participant List
This section describes how to remove a Participant List from TurningPoint.
Before You BeginDeleting a Participant List sends the file to the computer’s Recycle Bin. Save a backup copy in another location if you would like to be able to access the file later.
To delete a Participant List…
1 Click Participants on the TurningPoint Ribbon and select Delete a Participant List.
Participants Menu
TurningPoint displays a window listing all Participant Lists that have been created or imported.
2 Select the file name of the Participant List you wish to remove.
Delete Participant List
3 Click Delete.
A window display confirming that you want to delete the selected Participant List. Delete Participant List
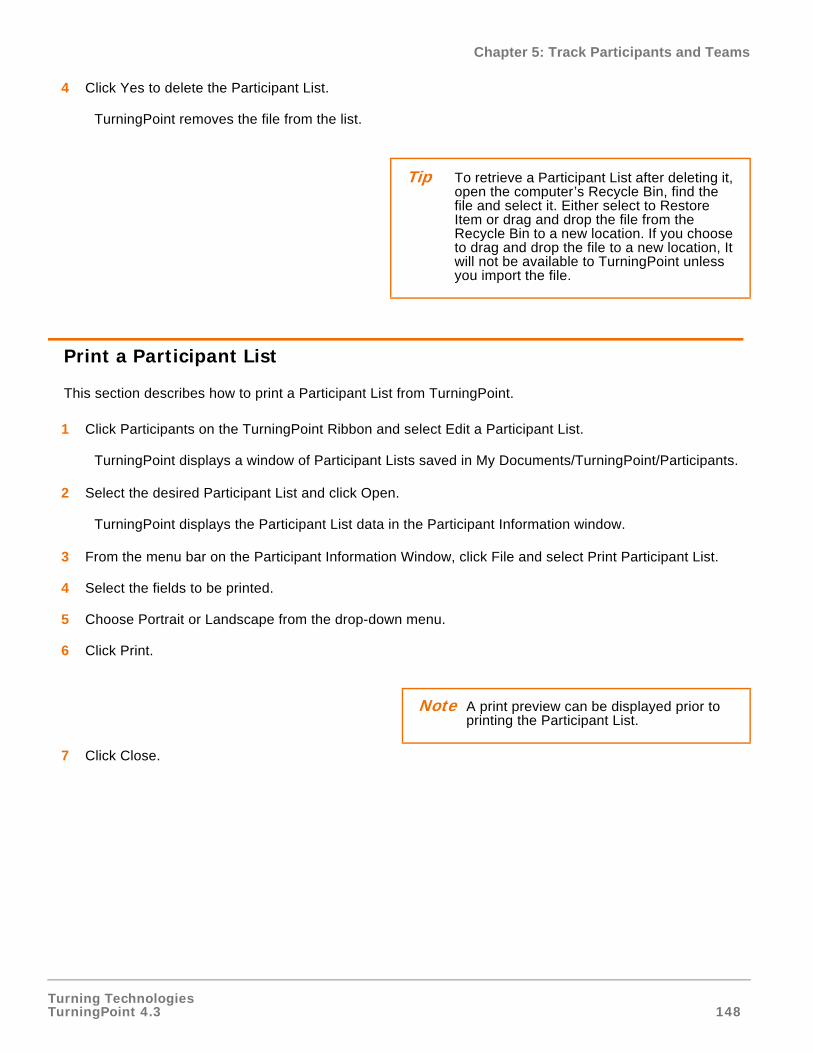
Turning TechnologiesTurningPoint 4.3 148
Chapter 5: Track Participants and Teams
4 Click Yes to delete the Participant List.
TurningPoint removes the file from the list.
Print a Participant List
This section describes how to print a Participant List from TurningPoint.
1 Click Participants on the TurningPoint Ribbon and select Edit a Participant List.
TurningPoint displays a window of Participant Lists saved in My Documents/TurningPoint/Participants.
2 Select the desired Participant List and click Open.
TurningPoint displays the Participant List data in the Participant Information window.
3 From the menu bar on the Participant Information Window, click File and select Print Participant List.
4 Select the fields to be printed.
5 Choose Portrait or Landscape from the drop-down menu.
6 Click Print.
7 Click Close.
Tip To retrieve a Participant List after deleting it, open the computer’s Recycle Bin, find the file and select it. Either select to Restore Item or drag and drop the file from the Recycle Bin to a new location. If you choose to drag and drop the file to a new location, It will not be available to TurningPoint unless you import the file.
Note A print preview can be displayed prior to printing the Participant List.

Turning TechnologiesTurningPoint 4.3 149
Chapter 5: Track Participants and Teams
Set Up Team Competitions
TurningPoint can enhance group interaction. Team competitions are a fun way to encourage this interaction. Set up team competitions through the Participant List Wizard. You can create a Participant List that enables you to assign participants to teams who will compete for the highest score during your presentation.
You can also edit an existing Participant List and add Groups as teams using the Add Group feature, and checking the appropriate check boxes next to the Group names.
For participants or teams to accumulate scores, you will have to assign point values to correct answers. You can even assign points based on how quickly participants respond using speed scoring.
TurningPoint offers several slides to keep track of participant and team point totals and which participants respond most quickly. Find more information in Creating and Saving Slides on page 30.
This section describes how to:
• Add Teams to a Participant List
Add Teams to a Participant List
You can create a Participant List that can enable team competitions by following the steps below. You can also edit an existing Participant List and add Groups as teams using the Add Group feature, and checking the appropriate check boxes next to the Group names.
Before You BeginThese steps create a new Participant List that assigns participants to teams before the presentation, and allows you to edit a existing Participant List to include Teams.
If you would like to pick teams on the fly during the presentation, you need to insert a Team Assignment slide. Find information about this special slide in Competition Slides on page 37.
To set up team competitions…
1 Follow step 1 through step 5 in Create a Participant List Using Participant List Wizard on page 134.
In the Participant List Wizard window, TurningPoint displays the Groups entry box. Use this page to add groups to your Participant List.
2 Enter a group name in the Create a new group field, and click Add. Repeat for all desired team names.
TurningPoint displays all groups in the Included Groups list. These groups can represent any type of grouping you wish to assign participants to, such as teams, class level, or any other demographic information.
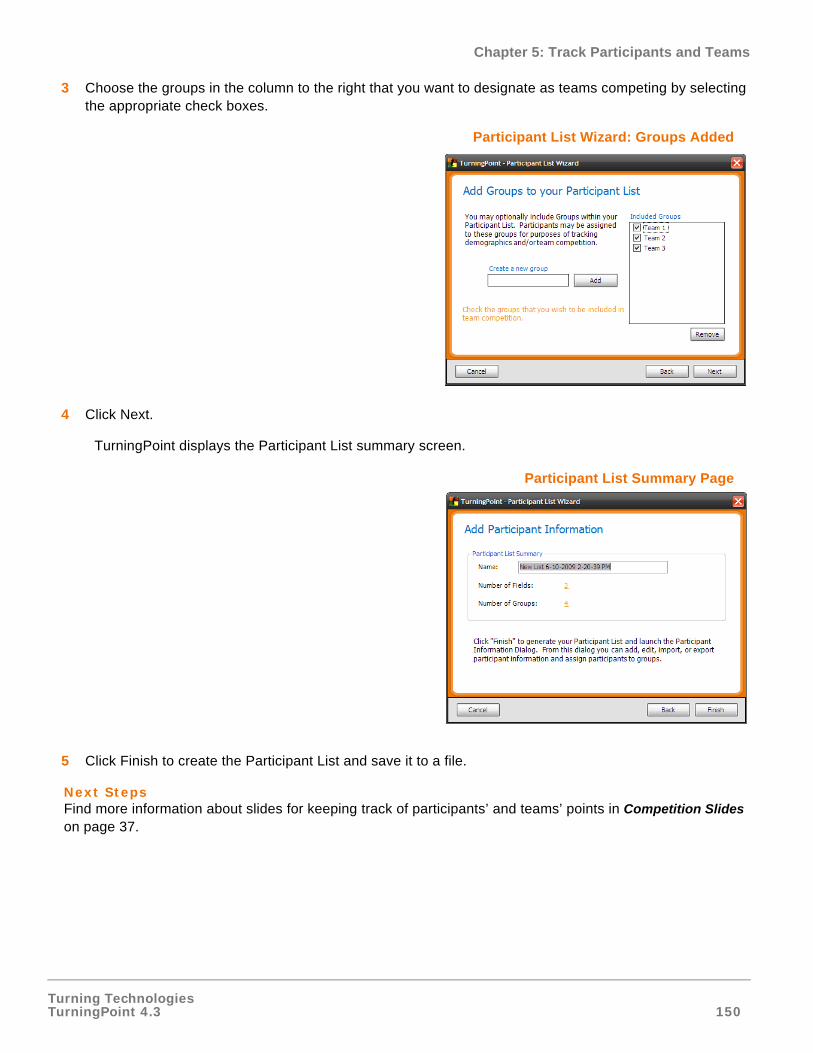
Turning TechnologiesTurningPoint 4.3 150
Chapter 5: Track Participants and Teams
3 Choose the groups in the column to the right that you want to designate as teams competing by selecting the appropriate check boxes.
Participant List Wizard: Groups Added
4 Click Next.
TurningPoint displays the Participant List summary screen.
Participant List Summary Page
5 Click Finish to create the Participant List and save it to a file.
Next StepsFind more information about slides for keeping track of participants’ and teams’ points in Competition Slides on page 37.
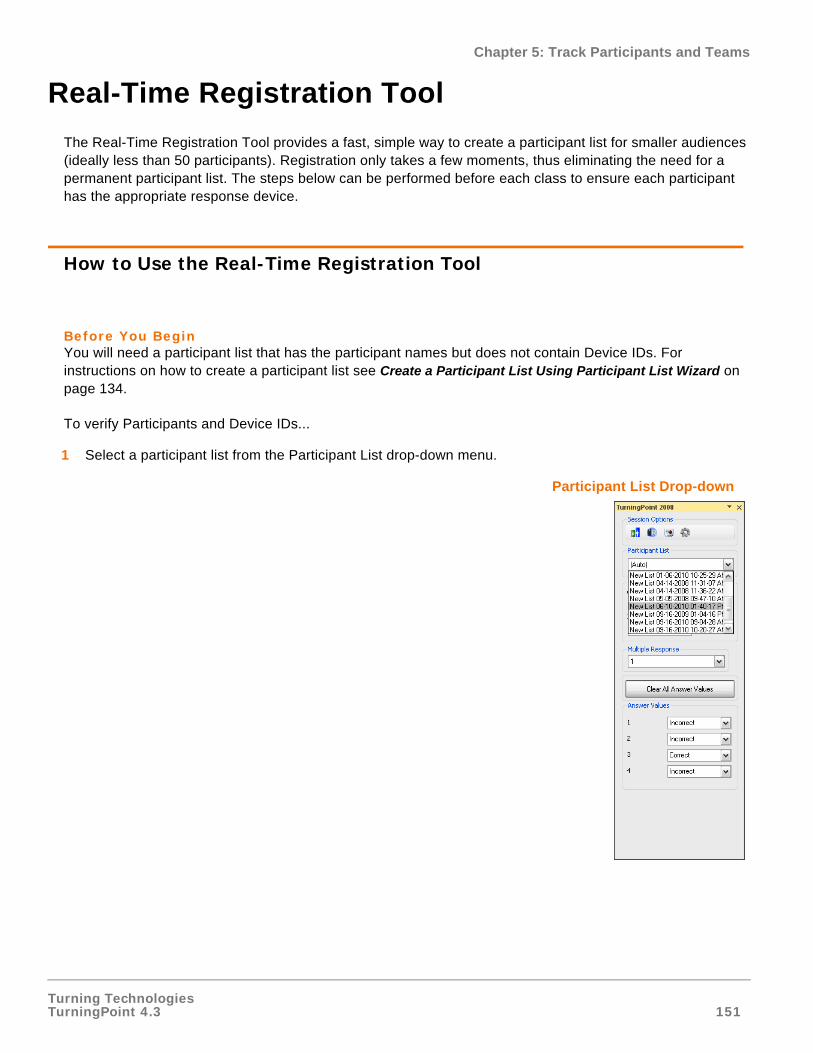
Turning TechnologiesTurningPoint 4.3 151
Chapter 5: Track Participants and Teams
Real-Time Registration Tool
The Real-Time Registration Tool provides a fast, simple way to create a participant list for smaller audiences (ideally less than 50 participants). Registration only takes a few moments, thus eliminating the need for a permanent participant list. The steps below can be performed before each class to ensure each participant has the appropriate response device.
How to Use the Real-Time Registration Tool
Before You BeginYou will need a participant list that has the participant names but does not contain Device IDs. For instructions on how to create a participant list see Create a Participant List Using Participant List Wizard on page 134.
To verify Participants and Device IDs...
1 Select a participant list from the Participant List drop-down menu.
Participant List Drop-down

Turning TechnologiesTurningPoint 4.3 152
Chapter 5: Track Participants and Teams
2 Click Participants on the TurningPoint Ribbon and select Real-Time Registration Tool.
Real-Time Registration Tool
3 Click Registration Closed. The button label changes to “Registration Open” and the participants can begin to register their devices.
4 Each participant will need to locate their name.
5 Each participant must press the number on their response device that corresponds with the number to the left of their name.
The Device ID for the participant will now appear in the Device ID column.
If more than 10 participants are in the Participant List, use the forward and back buttons to scroll page by page to see the remaining participants. Clicking the play button will automatically scroll through the participants.
6 Once all of the participants have responded, click Registration Open.
7 Close the Real-Time Registration Tool by clicking the red (X) in the upper right-hand corner of the window.
8 Click Yes to save the participant list with the updated participant information.
The Real-Time Registration Tool window closes.
Turning TechnologiesTurningPoint 4.3 153
Chapter 6: Tools
Tools
TurningPoint offers several tools that allow you to use powerful advanced features:
• Create slides to rank items
• Create and assign standards for evaluating participants
• Create slides aligned to state standards using QuestionPoint
• Use conditional branching to control the order of slides in your presentation based on responses
• Create slides from imported files
Ranking Wizard
You can quickly and easily create slides that support decision-making, prioritization, or other kinds of ranking with TurningPoint’s Ranking Wizard. The Ranking Wizard automatically creates slides to compare items on one to three criteria, then summarizes the results in a chart.
For example, suppose you wanted to prioritize several projects you are considering. You might compare them on the basis of cost, impact, and urgency.
You can choose to rank each item on a numerical scale for each criterion. For example, one slide would ask you to rank Project A on urgency from least (1) to most (10). You can use a scale beginning with 1 and ending with any number up to 10.
Alternatively, you can choose to compare items on the criteria by pairs. For example, one slide would ask you whether Project A or Project B is more urgent.
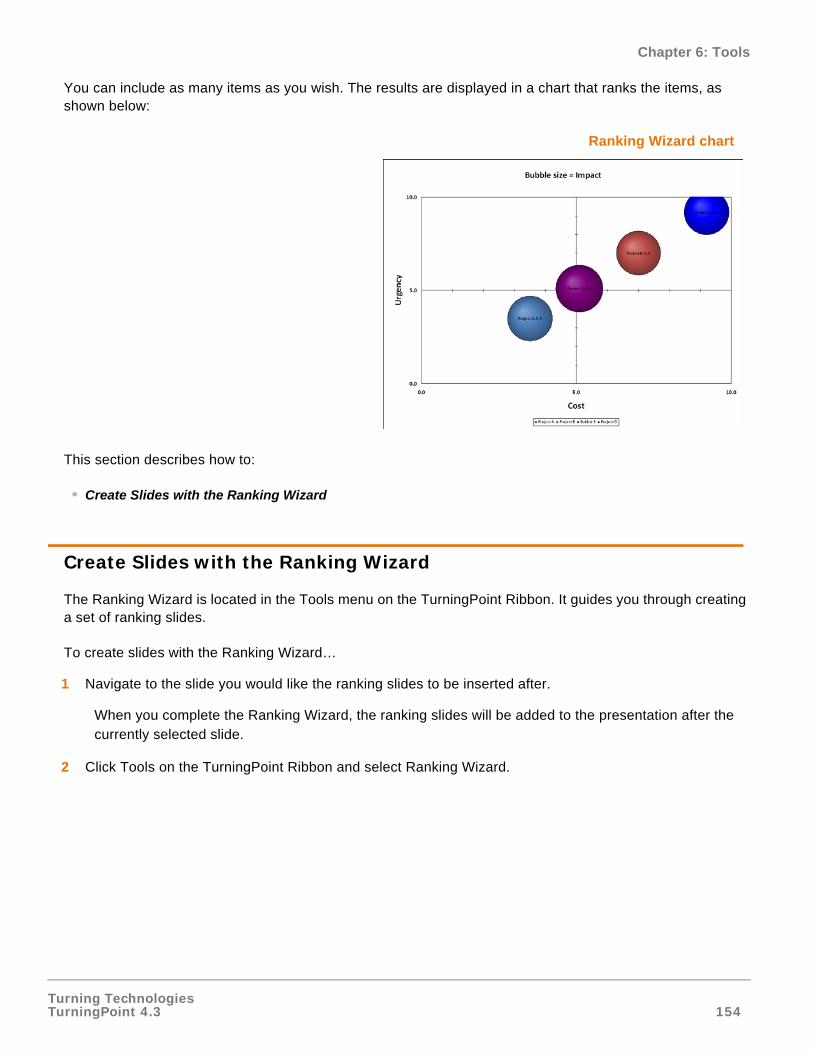
Turning TechnologiesTurningPoint 4.3 154
Chapter 6: Tools
You can include as many items as you wish. The results are displayed in a chart that ranks the items, as shown below:
Ranking Wizard chart
This section describes how to:
• Create Slides with the Ranking Wizard
Create Slides with the Ranking Wizard
The Ranking Wizard is located in the Tools menu on the TurningPoint Ribbon. It guides you through creating a set of ranking slides.
To create slides with the Ranking Wizard…
1 Navigate to the slide you would like the ranking slides to be inserted after.
When you complete the Ranking Wizard, the ranking slides will be added to the presentation after the currently selected slide.
2 Click Tools on the TurningPoint Ribbon and select Ranking Wizard.
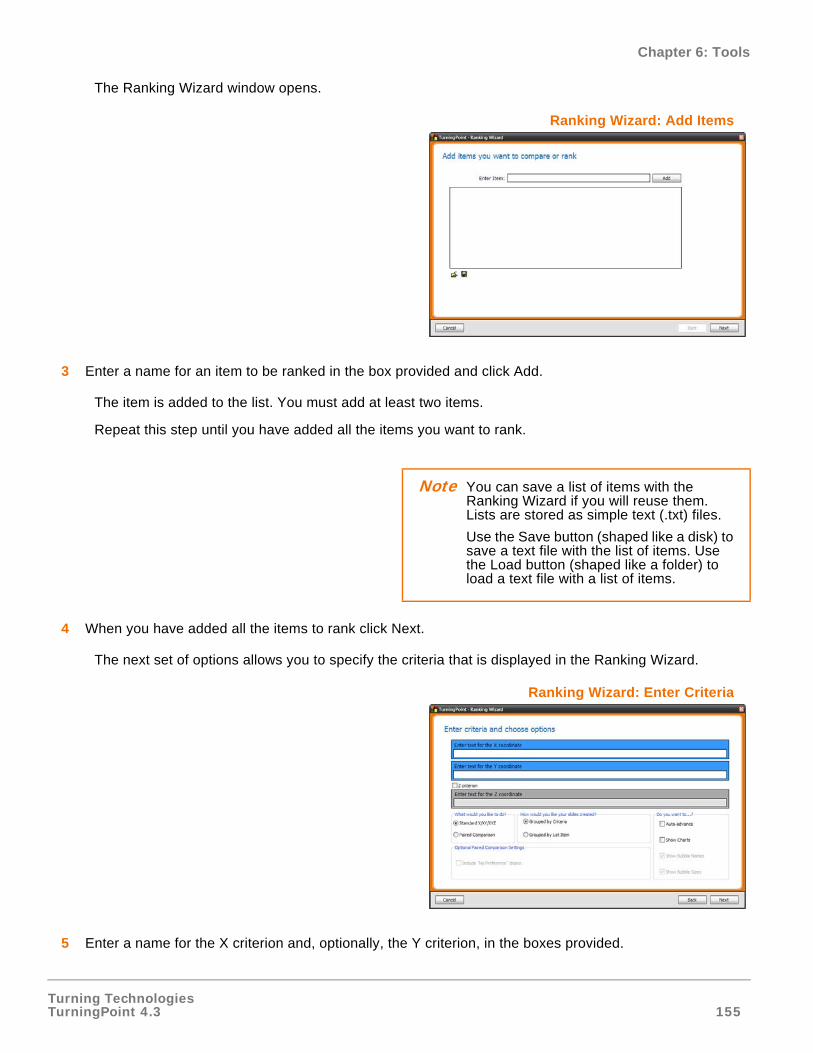
Turning TechnologiesTurningPoint 4.3 155
Chapter 6: Tools
The Ranking Wizard window opens.
Ranking Wizard: Add Items
3 Enter a name for an item to be ranked in the box provided and click Add.
The item is added to the list. You must add at least two items.
Repeat this step until you have added all the items you want to rank.
4 When you have added all the items to rank click Next.
The next set of options allows you to specify the criteria that is displayed in the Ranking Wizard.
Ranking Wizard: Enter Criteria
5 Enter a name for the X criterion and, optionally, the Y criterion, in the boxes provided.
Note You can save a list of items with the Ranking Wizard if you will reuse them. Lists are stored as simple text (.txt) files.
Use the Save button (shaped like a disk) to save a text file with the list of items. Use the Load button (shaped like a folder) to load a text file with a list of items.
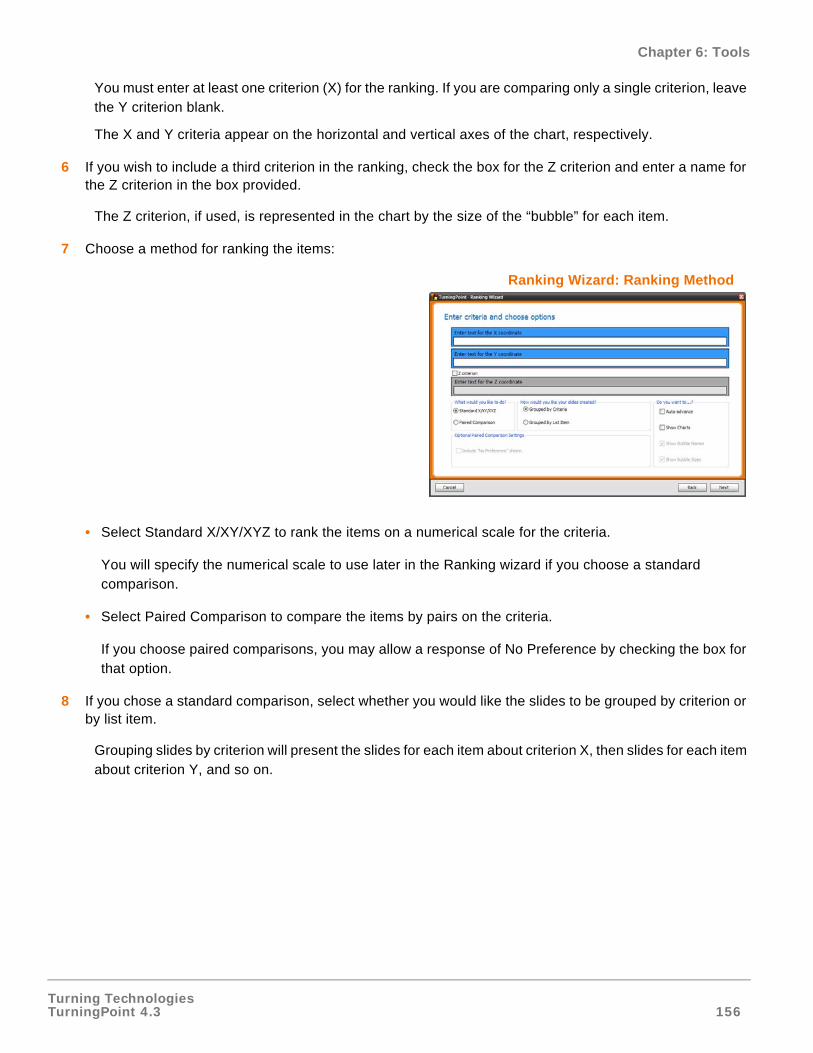
Turning TechnologiesTurningPoint 4.3 156
Chapter 6: Tools
You must enter at least one criterion (X) for the ranking. If you are comparing only a single criterion, leave the Y criterion blank.
The X and Y criteria appear on the horizontal and vertical axes of the chart, respectively.
6 If you wish to include a third criterion in the ranking, check the box for the Z criterion and enter a name for the Z criterion in the box provided.
The Z criterion, if used, is represented in the chart by the size of the “bubble” for each item.
7 Choose a method for ranking the items:
Ranking Wizard: Ranking Method
• Select Standard X/XY/XYZ to rank the items on a numerical scale for the criteria.
You will specify the numerical scale to use later in the Ranking wizard if you choose a standard comparison.
• Select Paired Comparison to compare the items by pairs on the criteria.
If you choose paired comparisons, you may allow a response of No Preference by checking the box for that option.
8 If you chose a standard comparison, select whether you would like the slides to be grouped by criterion or by list item.
Grouping slides by criterion will present the slides for each item about criterion X, then slides for each item about criterion Y, and so on.
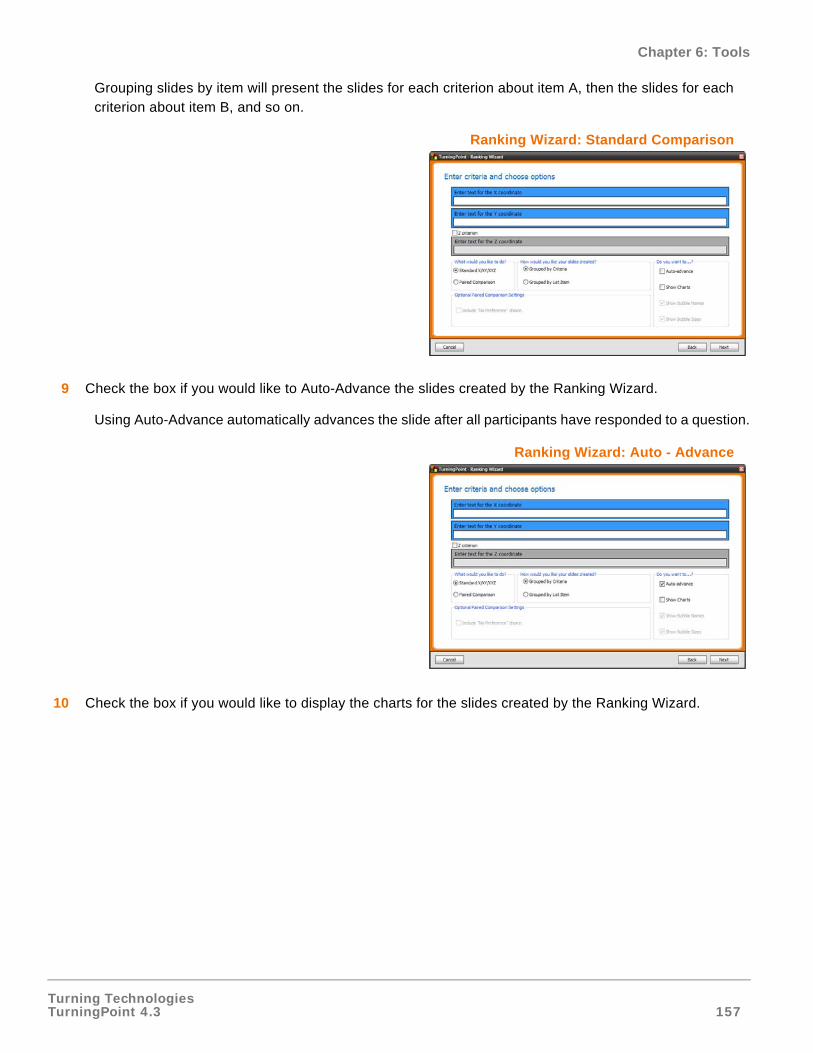
Turning TechnologiesTurningPoint 4.3 157
Chapter 6: Tools
Grouping slides by item will present the slides for each criterion about item A, then the slides for each criterion about item B, and so on.
Ranking Wizard: Standard Comparison
9 Check the box if you would like to Auto-Advance the slides created by the Ranking Wizard.
Using Auto-Advance automatically advances the slide after all participants have responded to a question.
Ranking Wizard: Auto - Advance
10 Check the box if you would like to display the charts for the slides created by the Ranking Wizard.
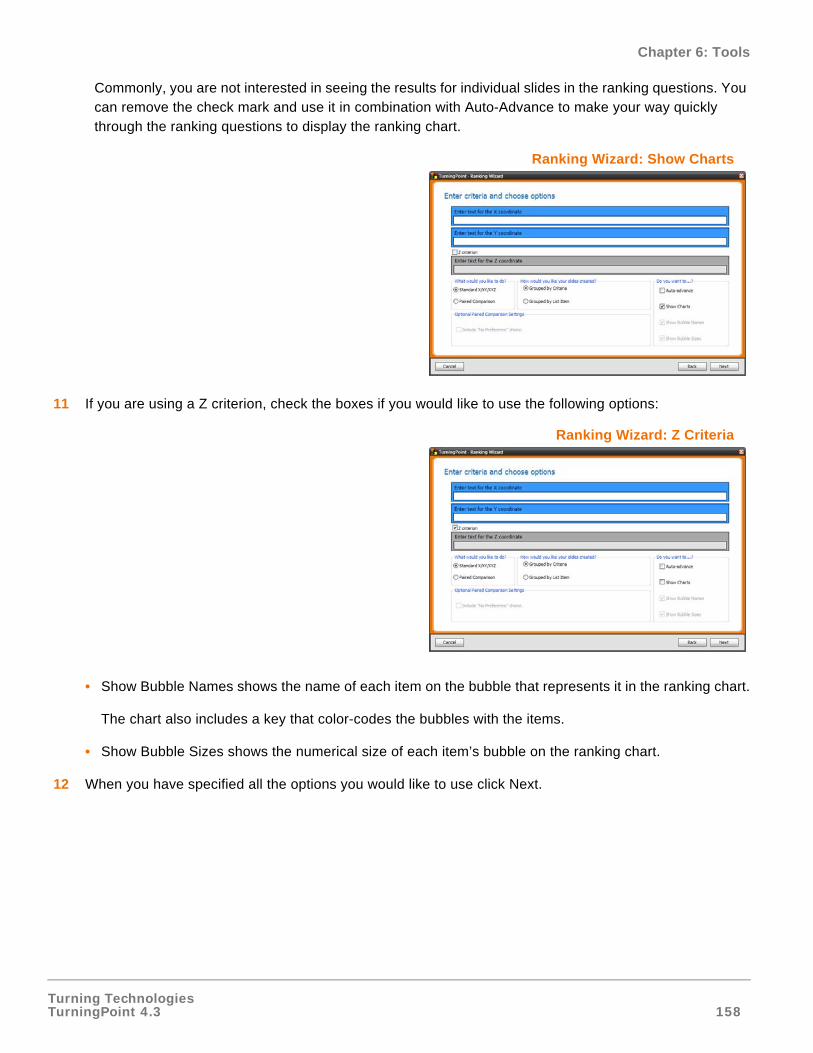
Turning TechnologiesTurningPoint 4.3 158
Chapter 6: Tools
Commonly, you are not interested in seeing the results for individual slides in the ranking questions. You can remove the check mark and use it in combination with Auto-Advance to make your way quickly through the ranking questions to display the ranking chart.
Ranking Wizard: Show Charts
11 If you are using a Z criterion, check the boxes if you would like to use the following options:
Ranking Wizard: Z Criteria
• Show Bubble Names shows the name of each item on the bubble that represents it in the ranking chart.
The chart also includes a key that color-codes the bubbles with the items.
• Show Bubble Sizes shows the numerical size of each item’s bubble on the ranking chart.
12 When you have specified all the options you would like to use click Next.
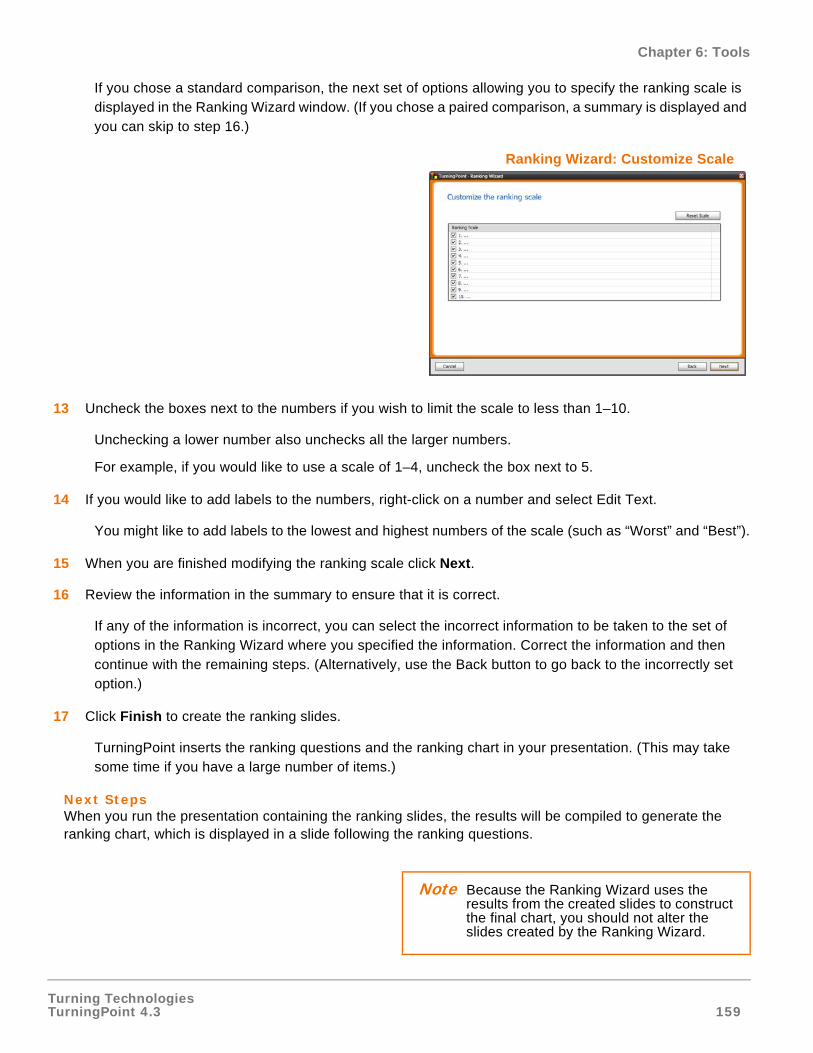
Turning TechnologiesTurningPoint 4.3 159
Chapter 6: Tools
If you chose a standard comparison, the next set of options allowing you to specify the ranking scale is displayed in the Ranking Wizard window. (If you chose a paired comparison, a summary is displayed and you can skip to step 16.)
Ranking Wizard: Customize Scale
13 Uncheck the boxes next to the numbers if you wish to limit the scale to less than 1–10.
Unchecking a lower number also unchecks all the larger numbers.
For example, if you would like to use a scale of 1–4, uncheck the box next to 5.
14 If you would like to add labels to the numbers, right-click on a number and select Edit Text.
You might like to add labels to the lowest and highest numbers of the scale (such as “Worst” and “Best”).
15 When you are finished modifying the ranking scale click Next.
16 Review the information in the summary to ensure that it is correct.
If any of the information is incorrect, you can select the incorrect information to be taken to the set of options in the Ranking Wizard where you specified the information. Correct the information and then continue with the remaining steps. (Alternatively, use the Back button to go back to the incorrectly set option.)
17 Click Finish to create the ranking slides.
TurningPoint inserts the ranking questions and the ranking chart in your presentation. (This may take some time if you have a large number of items.)
Next StepsWhen you run the presentation containing the ranking slides, the results will be compiled to generate the ranking chart, which is displayed in a slide following the ranking questions.
Note Because the Ranking Wizard uses the results from the created slides to construct the final chart, you should not alter the slides created by the Ranking Wizard.
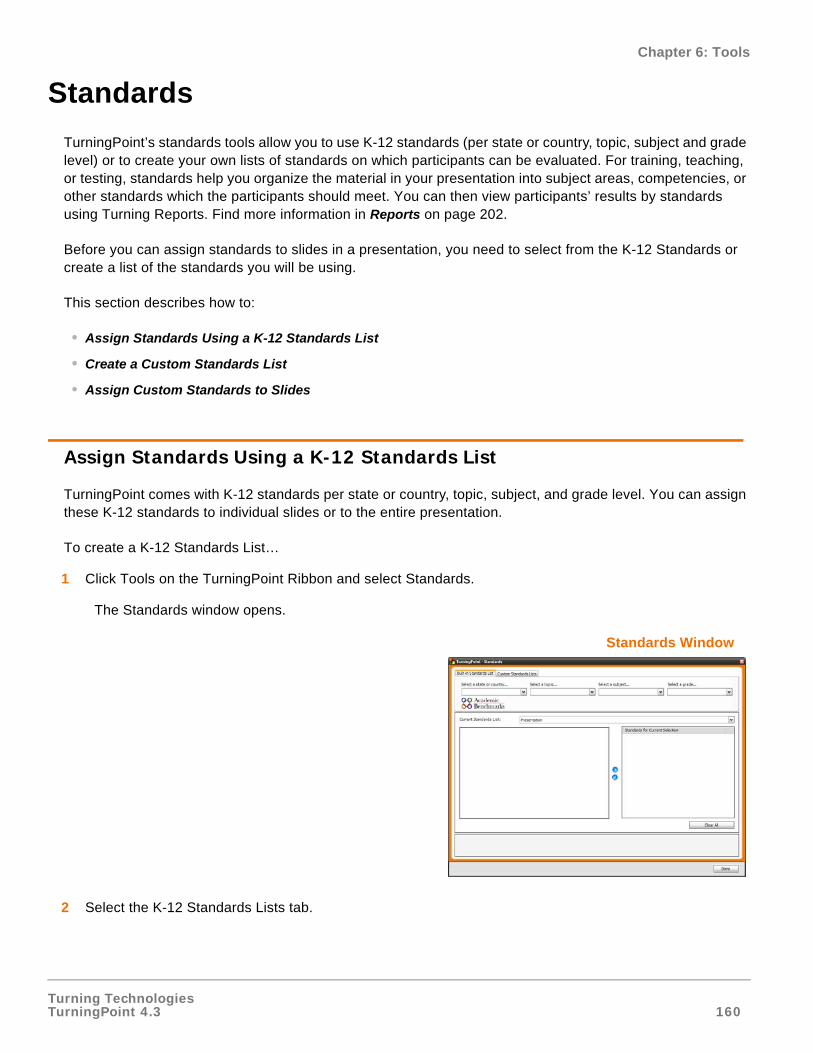
Turning TechnologiesTurningPoint 4.3 160
Chapter 6: Tools
Standards
TurningPoint’s standards tools allow you to use K-12 standards (per state or country, topic, subject and grade level) or to create your own lists of standards on which participants can be evaluated. For training, teaching, or testing, standards help you organize the material in your presentation into subject areas, competencies, or other standards which the participants should meet. You can then view participants’ results by standards using Turning Reports. Find more information in Reports on page 202.
Before you can assign standards to slides in a presentation, you need to select from the K-12 Standards or create a list of the standards you will be using.
This section describes how to:
• Assign Standards Using a K-12 Standards List
• Create a Custom Standards List
• Assign Custom Standards to Slides
Assign Standards Using a K-12 Standards List
TurningPoint comes with K-12 standards per state or country, topic, subject, and grade level. You can assign these K-12 standards to individual slides or to the entire presentation.
To create a K-12 Standards List…
1 Click Tools on the TurningPoint Ribbon and select Standards.
The Standards window opens.
Standards Window
2 Select the K-12 Standards Lists tab.
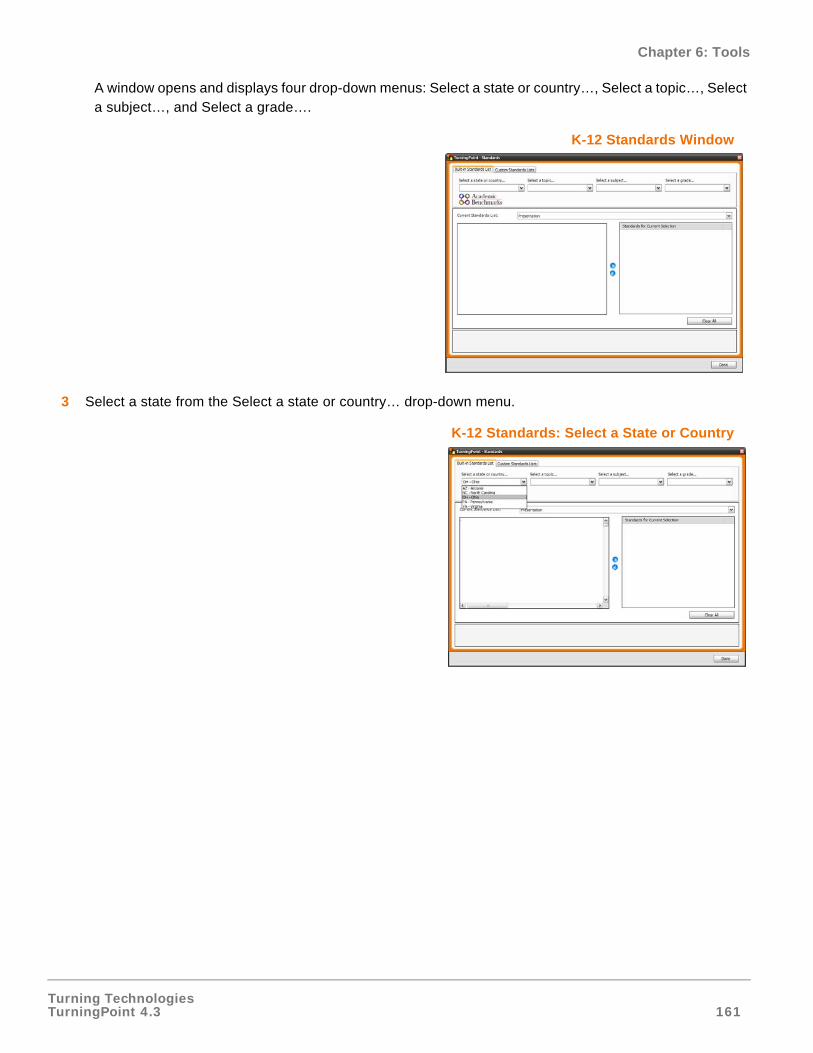
Turning TechnologiesTurningPoint 4.3 161
Chapter 6: Tools
A window opens and displays four drop-down menus: Select a state or country…, Select a topic…, Select a subject…, and Select a grade….
K-12 Standards Window
3 Select a state from the Select a state or country… drop-down menu.
K-12 Standards: Select a State or Country
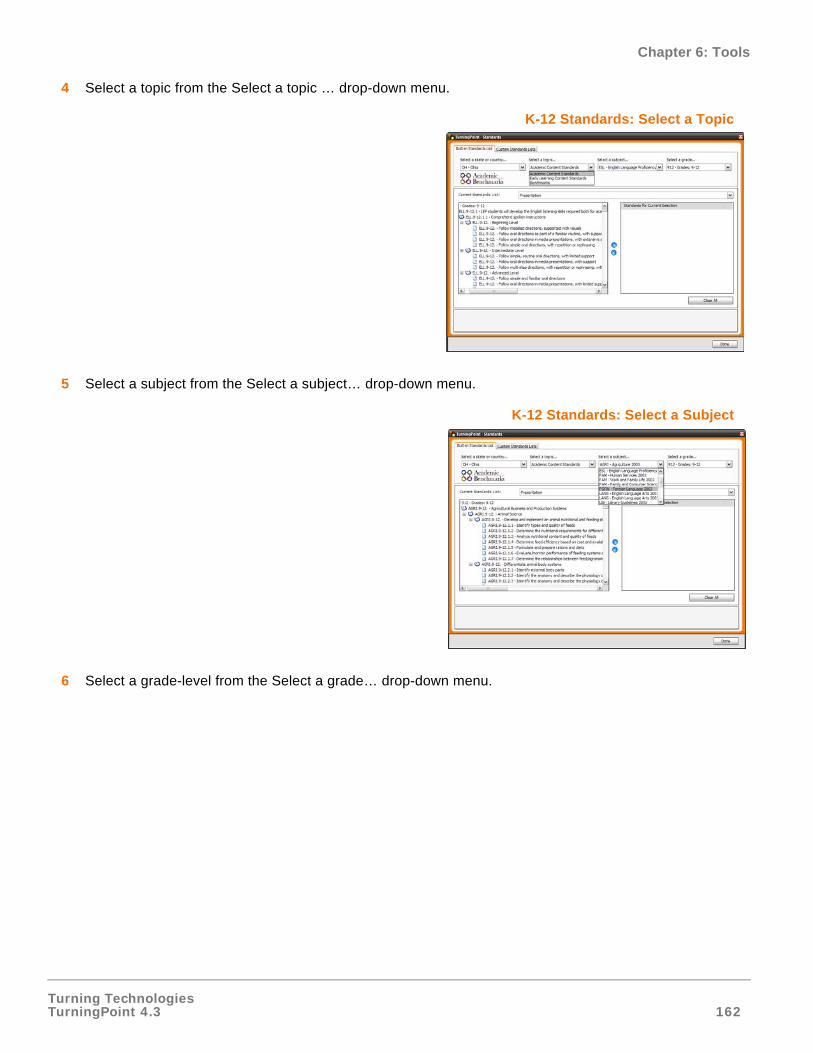
Turning TechnologiesTurningPoint 4.3 162
Chapter 6: Tools
4 Select a topic from the Select a topic … drop-down menu.
K-12 Standards: Select a Topic
5 Select a subject from the Select a subject… drop-down menu.
K-12 Standards: Select a Subject
6 Select a grade-level from the Select a grade… drop-down menu.
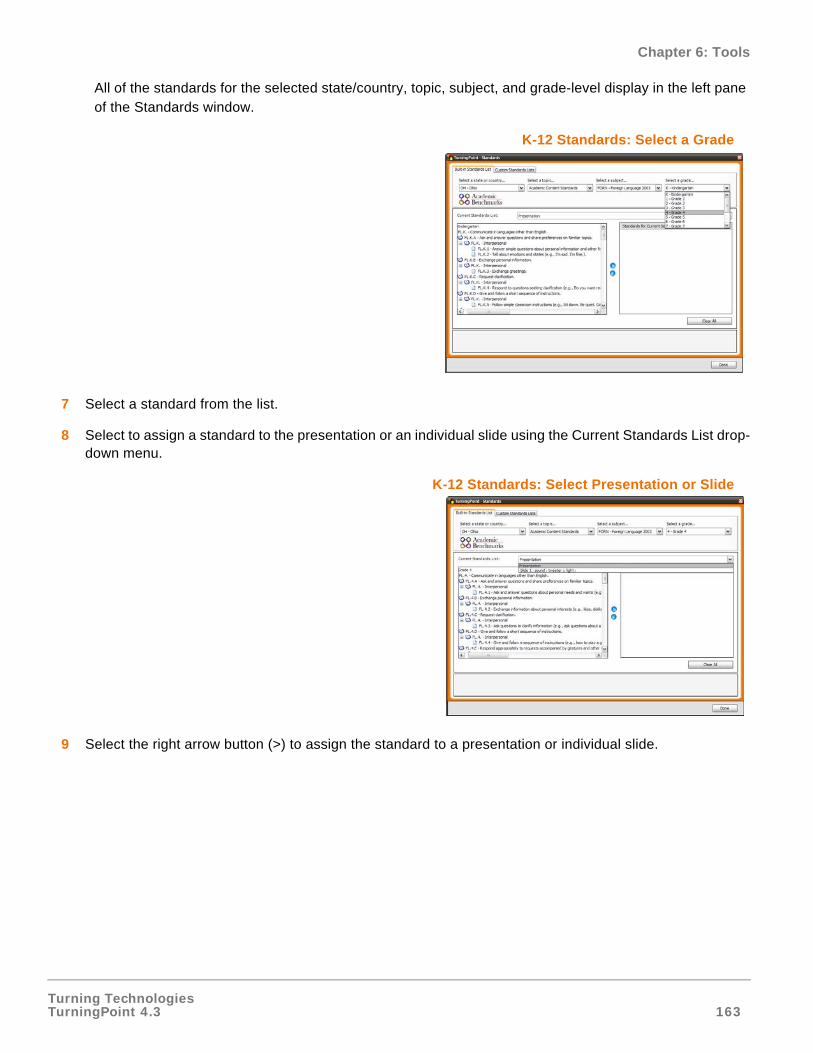
Turning TechnologiesTurningPoint 4.3 163
Chapter 6: Tools
All of the standards for the selected state/country, topic, subject, and grade-level display in the left pane of the Standards window.
K-12 Standards: Select a Grade
7 Select a standard from the list.
8 Select to assign a standard to the presentation or an individual slide using the Current Standards List drop-down menu.
K-12 Standards: Select Presentation or Slide
9 Select the right arrow button (>) to assign the standard to a presentation or individual slide.
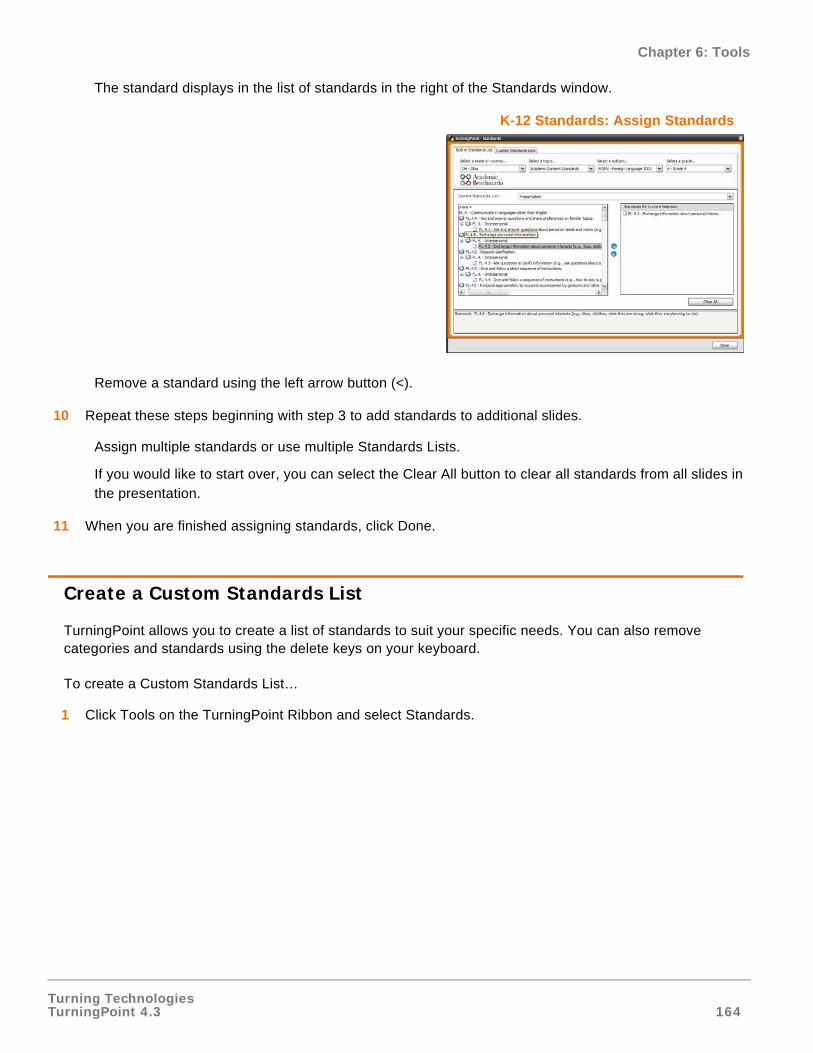
Turning TechnologiesTurningPoint 4.3 164
Chapter 6: Tools
The standard displays in the list of standards in the right of the Standards window.
K-12 Standards: Assign Standards
Remove a standard using the left arrow button (<).
10 Repeat these steps beginning with step 3 to add standards to additional slides.
Assign multiple standards or use multiple Standards Lists.
If you would like to start over, you can select the Clear All button to clear all standards from all slides in the presentation.
11 When you are finished assigning standards, click Done.
Create a Custom Standards List
TurningPoint allows you to create a list of standards to suit your specific needs. You can also remove categories and standards using the delete keys on your keyboard.
To create a Custom Standards List…
1 Click Tools on the TurningPoint Ribbon and select Standards.
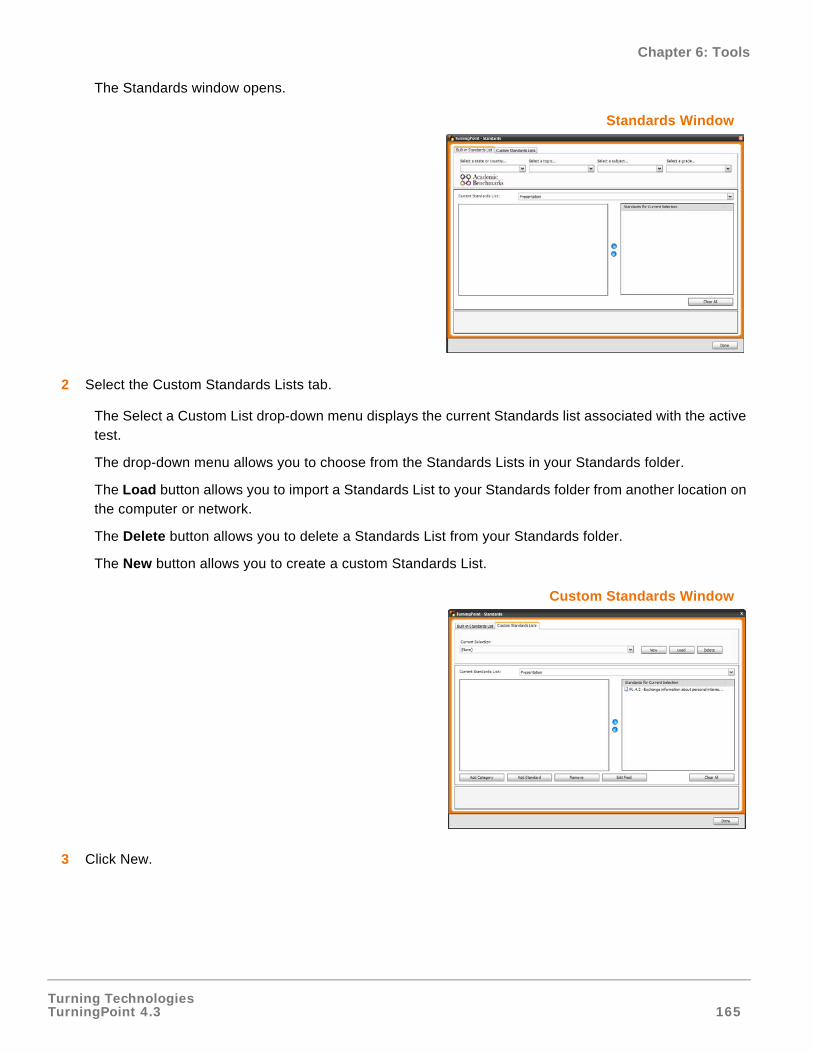
Turning TechnologiesTurningPoint 4.3 165
Chapter 6: Tools
The Standards window opens.
Standards Window
2 Select the Custom Standards Lists tab.
The Select a Custom List drop-down menu displays the current Standards list associated with the active test.
The drop-down menu allows you to choose from the Standards Lists in your Standards folder.
The Load button allows you to import a Standards List to your Standards folder from another location on the computer or network.
The Delete button allows you to delete a Standards List from your Standards folder.
The New button allows you to create a custom Standards List.
Custom Standards Window
3 Click New.
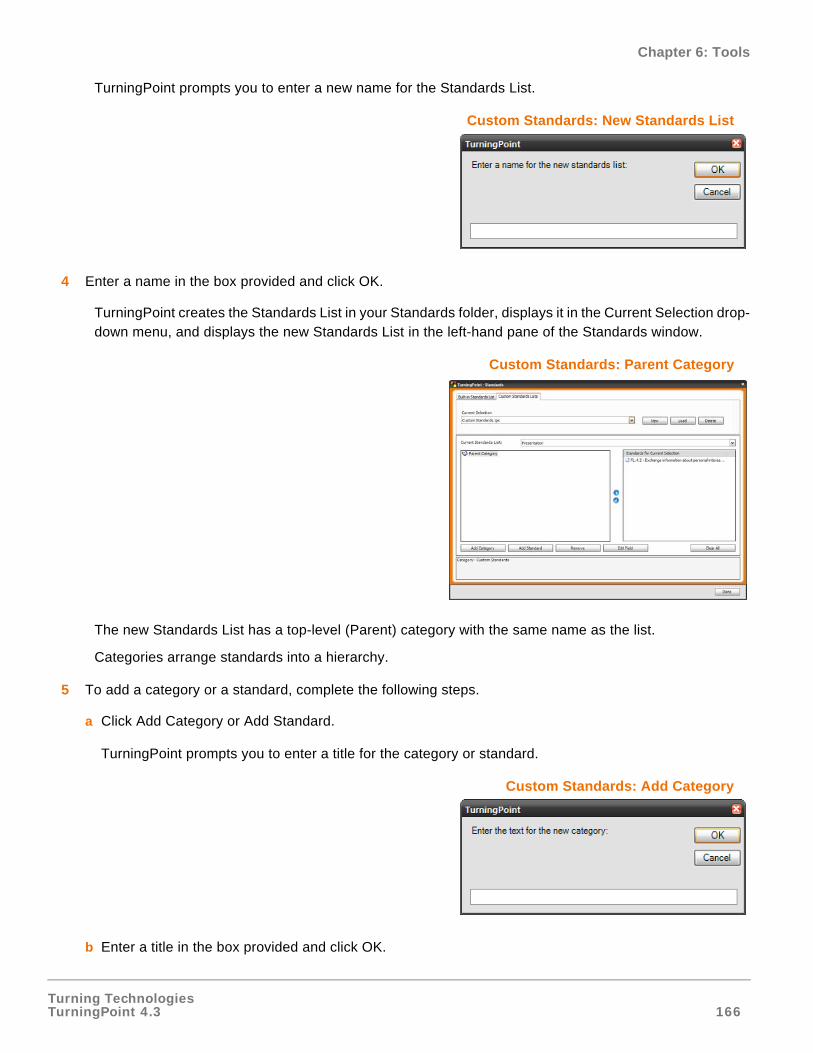
Turning TechnologiesTurningPoint 4.3 166
Chapter 6: Tools
TurningPoint prompts you to enter a new name for the Standards List.
Custom Standards: New Standards List
4 Enter a name in the box provided and click OK.
TurningPoint creates the Standards List in your Standards folder, displays it in the Current Selection drop-down menu, and displays the new Standards List in the left-hand pane of the Standards window.
Custom Standards: Parent Category
The new Standards List has a top-level (Parent) category with the same name as the list.
Categories arrange standards into a hierarchy.
5 To add a category or a standard, complete the following steps.
a Click Add Category or Add Standard.
TurningPoint prompts you to enter a title for the category or standard.
Custom Standards: Add Category
b Enter a title in the box provided and click OK.
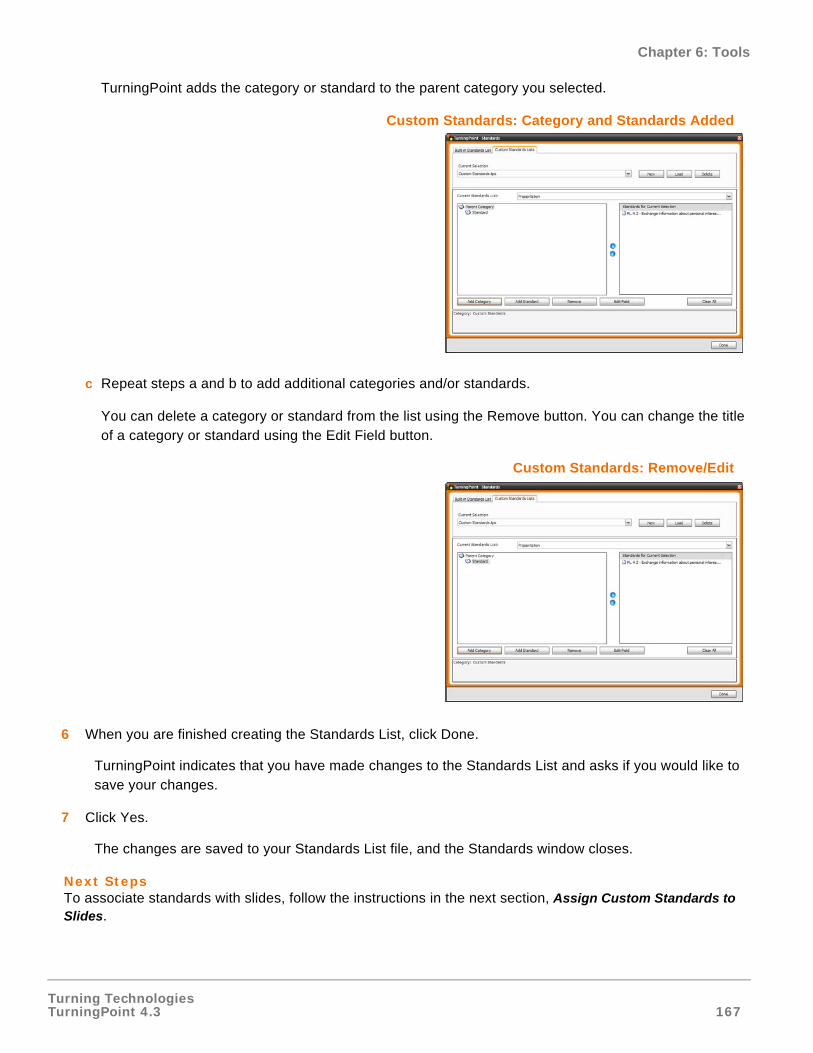
Turning TechnologiesTurningPoint 4.3 167
Chapter 6: Tools
TurningPoint adds the category or standard to the parent category you selected.
Custom Standards: Category and Standards Added
c Repeat steps a and b to add additional categories and/or standards.
You can delete a category or standard from the list using the Remove button. You can change the title of a category or standard using the Edit Field button.
Custom Standards: Remove/Edit
6 When you are finished creating the Standards List, click Done.
TurningPoint indicates that you have made changes to the Standards List and asks if you would like to save your changes.
7 Click Yes.
The changes are saved to your Standards List file, and the Standards window closes.
Next StepsTo associate standards with slides, follow the instructions in the next section, Assign Custom Standards to Slides.
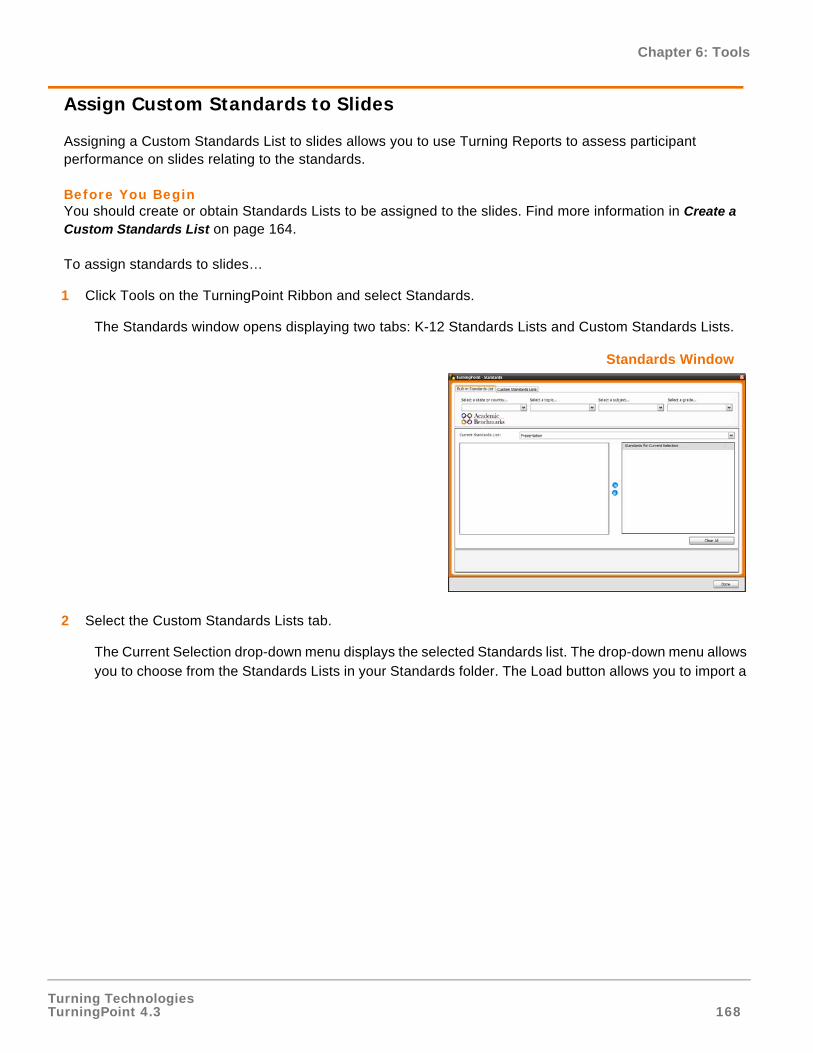
Turning TechnologiesTurningPoint 4.3 168
Chapter 6: Tools
Assign Custom Standards to Slides
Assigning a Custom Standards List to slides allows you to use Turning Reports to assess participant performance on slides relating to the standards.
Before You BeginYou should create or obtain Standards Lists to be assigned to the slides. Find more information in Create a Custom Standards List on page 164.
To assign standards to slides…
1 Click Tools on the TurningPoint Ribbon and select Standards.
The Standards window opens displaying two tabs: K-12 Standards Lists and Custom Standards Lists.
Standards Window
2 Select the Custom Standards Lists tab.
The Current Selection drop-down menu displays the selected Standards list. The drop-down menu allows you to choose from the Standards Lists in your Standards folder. The Load button allows you to import a
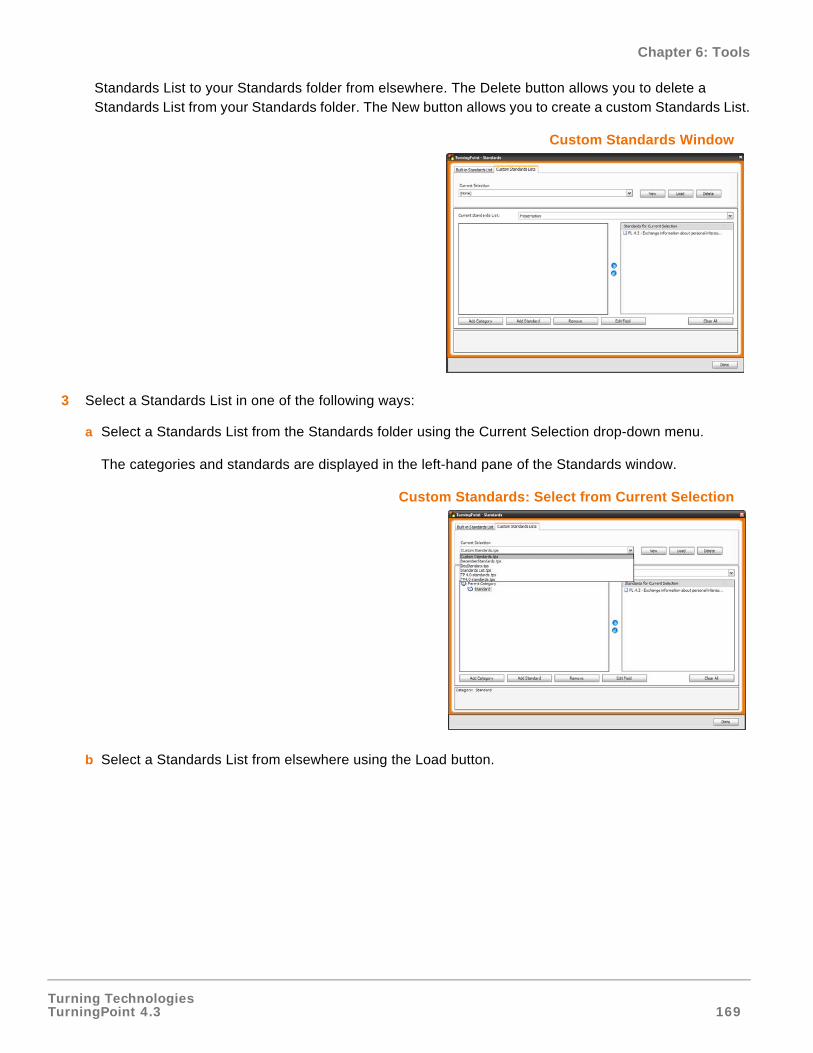
Turning TechnologiesTurningPoint 4.3 169
Chapter 6: Tools
Standards List to your Standards folder from elsewhere. The Delete button allows you to delete a Standards List from your Standards folder. The New button allows you to create a custom Standards List.
Custom Standards Window
3 Select a Standards List in one of the following ways:
a Select a Standards List from the Standards folder using the Current Selection drop-down menu.
The categories and standards are displayed in the left-hand pane of the Standards window.
Custom Standards: Select from Current Selection
b Select a Standards List from elsewhere using the Load button.
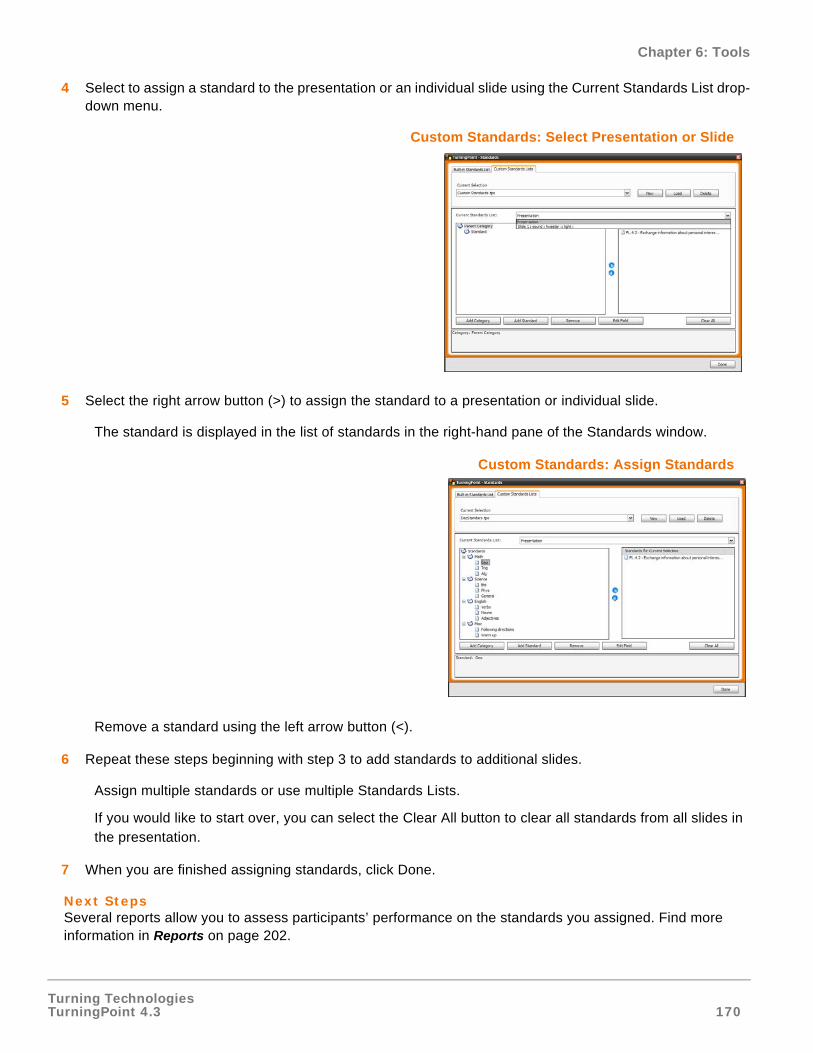
Turning TechnologiesTurningPoint 4.3 170
Chapter 6: Tools
4 Select to assign a standard to the presentation or an individual slide using the Current Standards List drop-down menu.
Custom Standards: Select Presentation or Slide
5 Select the right arrow button (>) to assign the standard to a presentation or individual slide.
The standard is displayed in the list of standards in the right-hand pane of the Standards window.
Custom Standards: Assign Standards
Remove a standard using the left arrow button (<).
6 Repeat these steps beginning with step 3 to add standards to additional slides.
Assign multiple standards or use multiple Standards Lists.
If you would like to start over, you can select the Clear All button to clear all standards from all slides in the presentation.
7 When you are finished assigning standards, click Done.
Next StepsSeveral reports allow you to assess participants’ performance on the standards you assigned. Find more information in Reports on page 202.

Turning TechnologiesTurningPoint 4.3 171
Chapter 6: Tools
QuestionPoint
QuestionPoint is a question bank of 30,000 assessment items aligned to state standards and sorted by grade and subject. This bank of questions enables teachers and administrators to easily generate assessments and create interactive presentations from those assessments.
This section describes how to:
• Create Slides from QuestionPoint
Create Slides from QuestionPoint
QuestionPoint has been integrated with the TurningTalk user community. You can use the content found in QuestionPoint to create an interactive presentation. For complete information on how to use QuestionPoint, please refer to the QuestionPoint User Guide which can be downloaded from the Turning Technologies website.
To generate a presentation using QuestionPoint…
1 Click Import on the TurningPoint Ribbon and select QuestionPoint.
2 Select the QuestionPoint content file (.tqz)
3 Click Open.
4 Click Yes to add content to the current presentation, No to add content to a new presentation.
5 The QuestionPoint content is now included in the presentation.
Next StepsFind information about running your TurningPoint presentation in Run Presentations on page 188. Customize your slides by adding a variety of animated feedback mechanisms. Find information about these different presentation objects and a variety of other slide features in Creating and Saving Slides on page 30.
Turning TechnologiesTurningPoint 4.3 172
Chapter 6: Tools
Conditional Branching
Conditional branching allows you to control the order of slides in your presentation based on the responses received from the audience.
For example, at the beginning of your presentation you might ask the participants to vote whether you’ll cover topic A or topic B. Depending on the results of the vote, the presentation will skip ahead to the slides for topic A or topic B.
Or, you might ask a question covering a specific subject area to assess whether the participants understand the subject. If most of the participants respond correctly, you can skip ahead to the next section of material.
This section describes how to:
• Set Up Conditional Branching
Set Up Conditional Branching
You set up conditional branching by defining a condition, which, if satisfied, advances to the slide you specify. Each condition consists of a comparison. The number or percentage of responses for a particular answer (or all correct answers) is compared with a specific value, or with the majority of responses for that slide.
Set up conditional branching using the Conditional Branching window, available from the Tools menu in the TurningPoint Ribbon.
Before You BeginBefore setting up conditional branching, you should create the slides for the branches of your presentation and plan their order.
To set up conditional branching…
1 Click Tools on the TurningPoint Ribbon and select Conditional Branching.
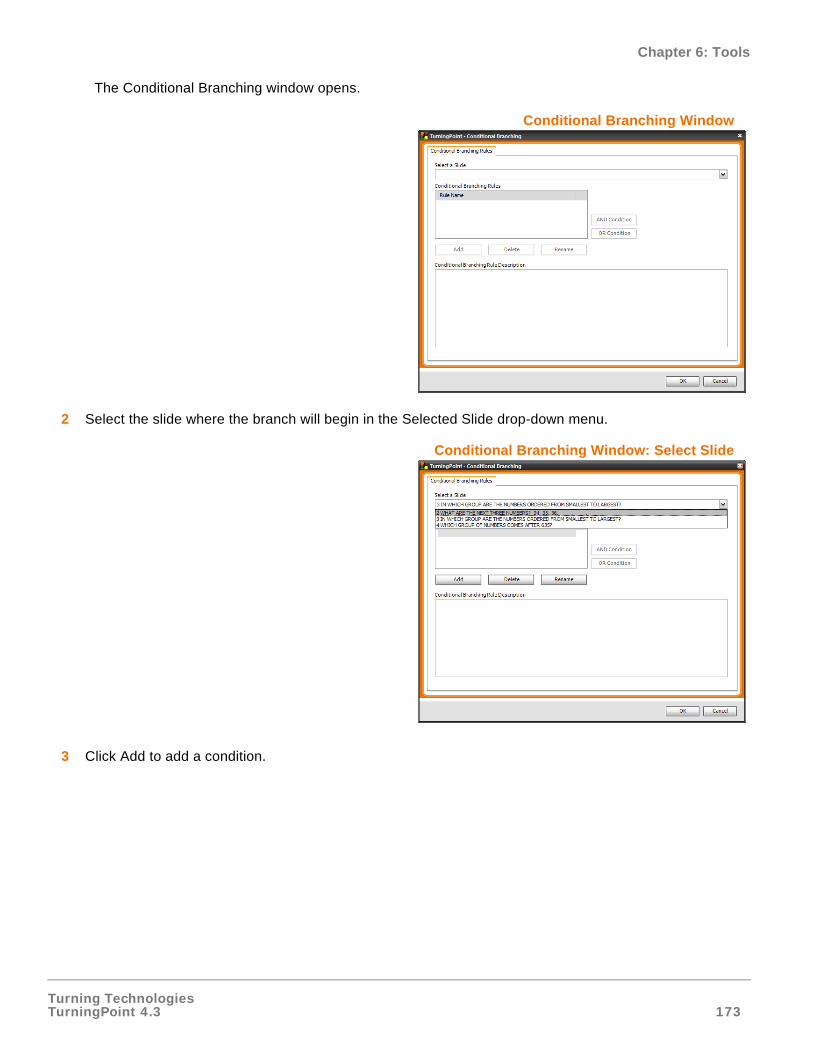
Turning TechnologiesTurningPoint 4.3 173
Chapter 6: Tools
The Conditional Branching window opens.
Conditional Branching Window
2 Select the slide where the branch will begin in the Selected Slide drop-down menu.
Conditional Branching Window: Select Slide
3 Click Add to add a condition.
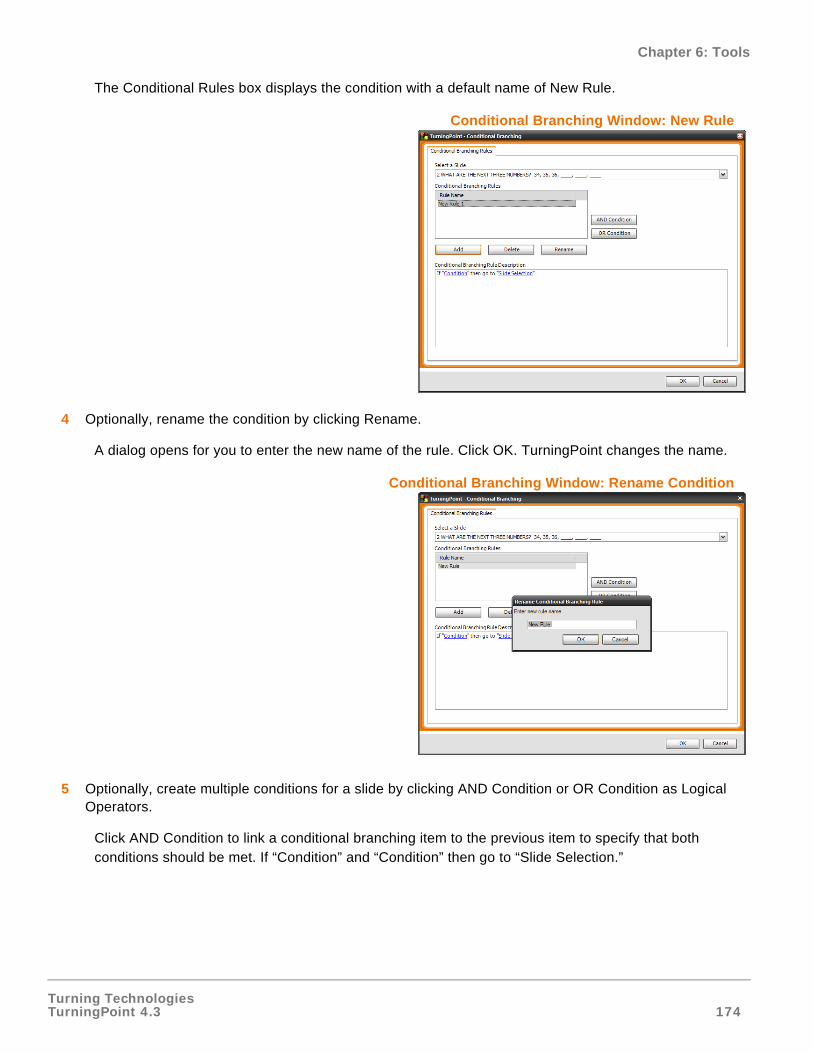
Turning TechnologiesTurningPoint 4.3 174
Chapter 6: Tools
The Conditional Rules box displays the condition with a default name of New Rule.
Conditional Branching Window: New Rule
4 Optionally, rename the condition by clicking Rename.
A dialog opens for you to enter the new name of the rule. Click OK. TurningPoint changes the name.
Conditional Branching Window: Rename Condition
5 Optionally, create multiple conditions for a slide by clicking AND Condition or OR Condition as Logical Operators.
Click AND Condition to link a conditional branching item to the previous item to specify that both conditions should be met. If “Condition” and “Condition” then go to “Slide Selection.”
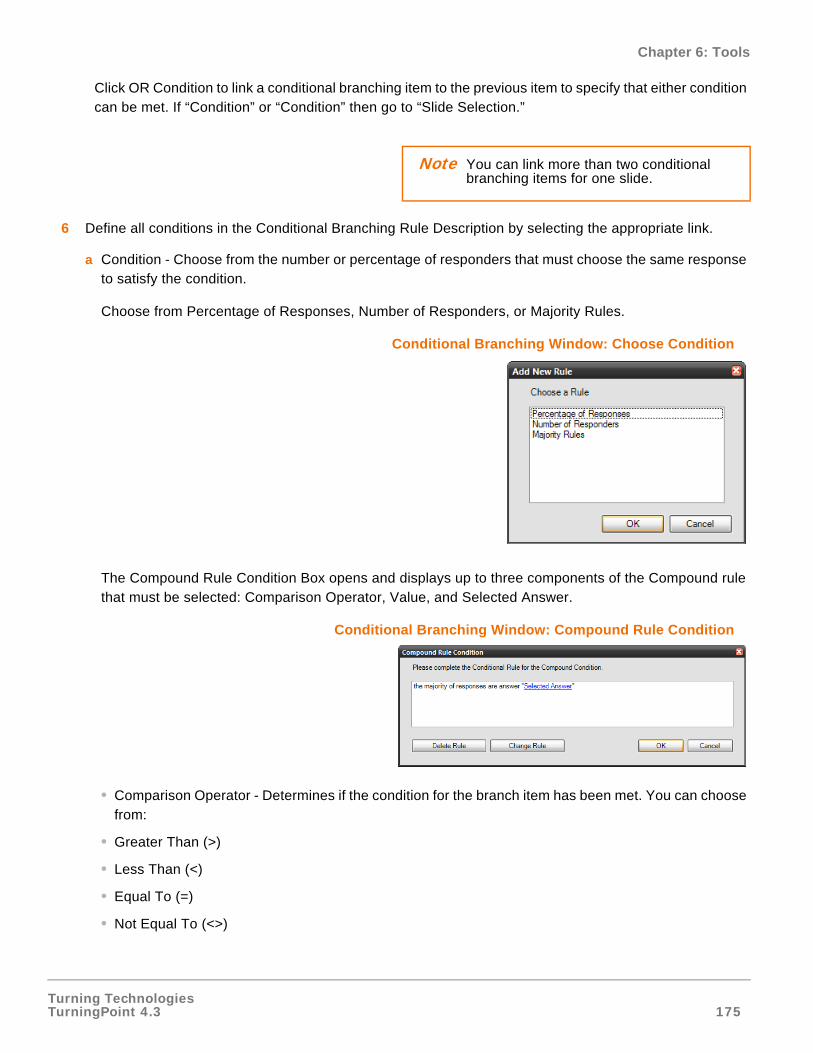
Turning TechnologiesTurningPoint 4.3 175
Chapter 6: Tools
Click OR Condition to link a conditional branching item to the previous item to specify that either condition can be met. If “Condition” or “Condition” then go to “Slide Selection.”
6 Define all conditions in the Conditional Branching Rule Description by selecting the appropriate link.
a Condition - Choose from the number or percentage of responders that must choose the same response to satisfy the condition.
Choose from Percentage of Responses, Number of Responders, or Majority Rules.
Conditional Branching Window: Choose Condition
The Compound Rule Condition Box opens and displays up to three components of the Compound rule that must be selected: Comparison Operator, Value, and Selected Answer.
Conditional Branching Window: Compound Rule Condition
• Comparison Operator - Determines if the condition for the branch item has been met. You can choose from:
• Greater Than (>)
• Less Than (<)
• Equal To (=)
• Not Equal To (<>)
Note You can link more than two conditional branching items for one slide.
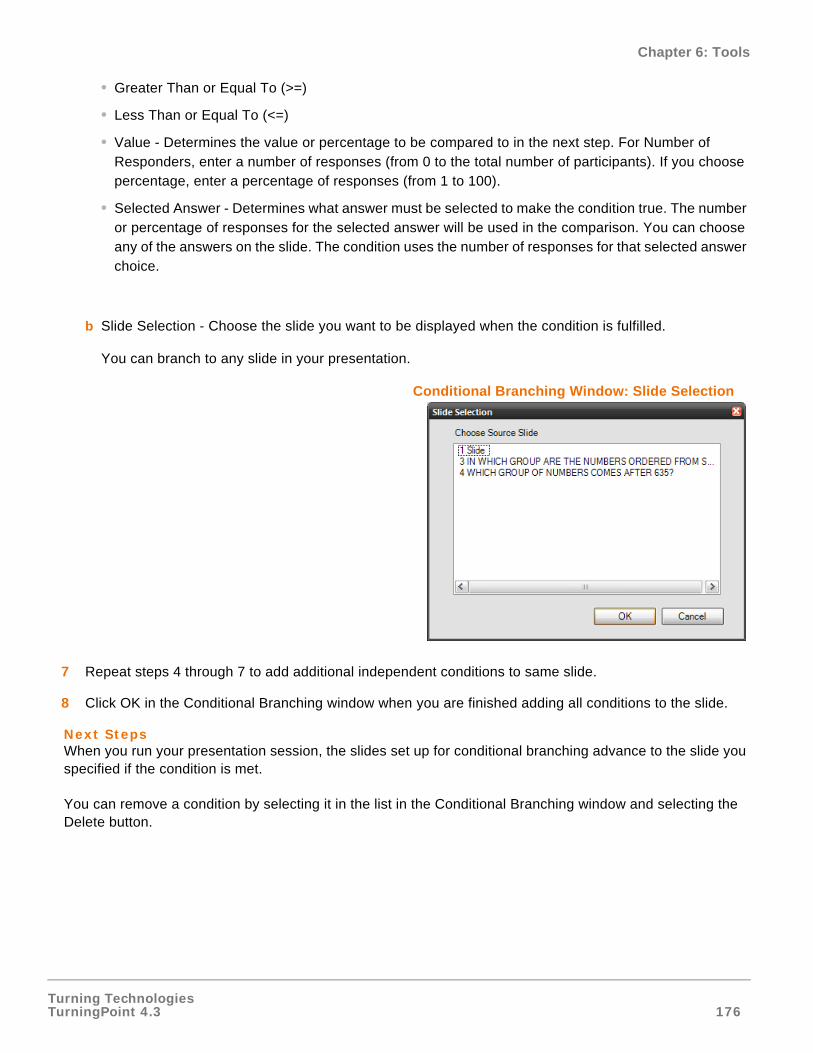
Turning TechnologiesTurningPoint 4.3 176
Chapter 6: Tools
• Greater Than or Equal To (>=)
• Less Than or Equal To (<=)
• Value - Determines the value or percentage to be compared to in the next step. For Number of Responders, enter a number of responses (from 0 to the total number of participants). If you choose percentage, enter a percentage of responses (from 1 to 100).
• Selected Answer - Determines what answer must be selected to make the condition true. The number or percentage of responses for the selected answer will be used in the comparison. You can choose any of the answers on the slide. The condition uses the number of responses for that selected answer choice.
b Slide Selection - Choose the slide you want to be displayed when the condition is fulfilled.
You can branch to any slide in your presentation.
Conditional Branching Window: Slide Selection
7 Repeat steps 4 through 7 to add additional independent conditions to same slide.
8 Click OK in the Conditional Branching window when you are finished adding all conditions to the slide.
Next StepsWhen you run your presentation session, the slides set up for conditional branching advance to the slide you specified if the condition is met.
You can remove a condition by selecting it in the list in the Conditional Branching window and selecting the Delete button.

Turning TechnologiesTurningPoint 4.3 177
Chapter 6: Tools
Parser Documents
The TurningPoint Parser can import certain types of documents:
• a QTI document
• an XML document
• a Microsoft Word document (.doc)
• an Excel spreadsheet (.xls)
To be imported by the TurningPoint Parser, these documents must be formatted in the proper way. The following sections describe the proper formats for documents imported by the Parser.
This section describes how to:
• Format QTI Documents
• Format XML Documents
• Format Word Documents
• Format Excel Documents
Turning TechnologiesTurningPoint 4.3 178
Chapter 6: Tools
Format QTI Documents
TurningPoint can convert your Respondus content into an interactive presentation through the QTI parser. Acceptable question formats are:
• Multiple Choice
• Multiple Response
• True/False
• Fill-in-the-Blank
To format Respondus content for the TurningPoint QTI parser...
1 Open your Respondus software with a current personality of IMS QTI 1.1+.
2 Create or Edit your test.
3 Click the Preview & Publish Tab and select Save QTI XML File.
4 Select QTI XML zip file.
5 Click Save As.
6 Name the file and click Save.
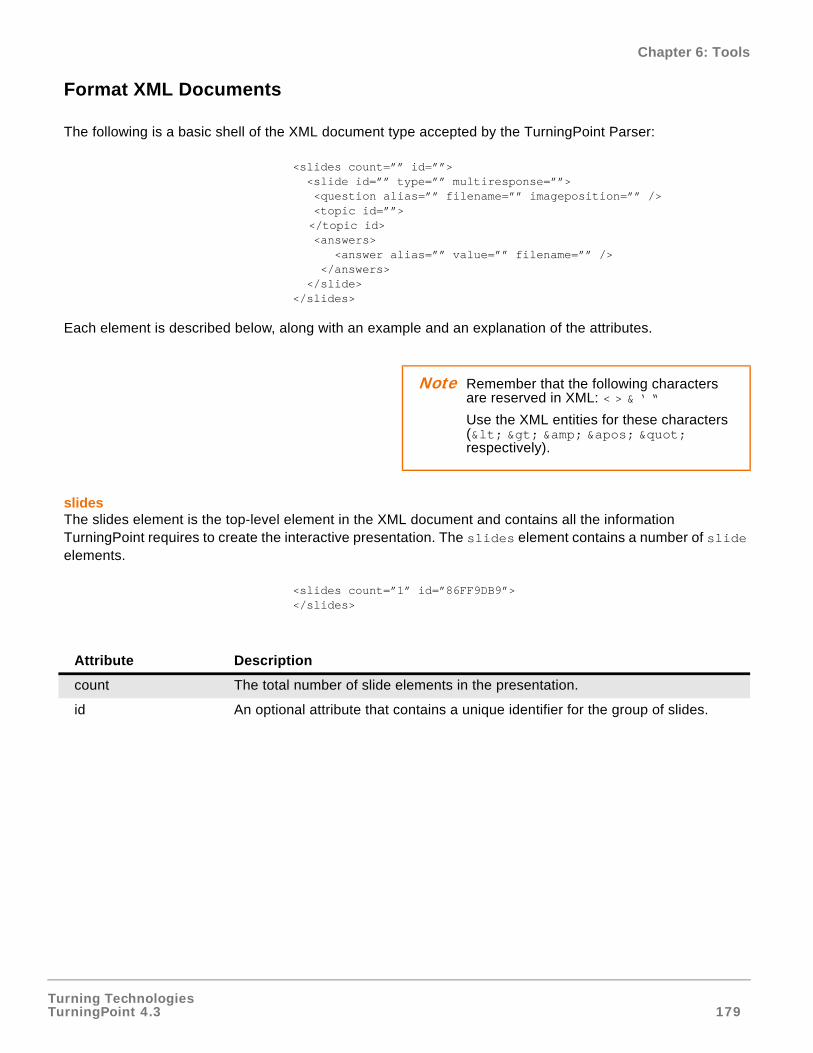
Turning TechnologiesTurningPoint 4.3 179
Chapter 6: Tools
Format XML Documents
The following is a basic shell of the XML document type accepted by the TurningPoint Parser:
<slides count=”” id=””><slide id=”” type=”” multiresponse=””><question alias=”” filename=”” imageposition=”” /><topic id=””> </topic id><answers>
<answer alias=”” value=”” filename=”” /></answers>
</slide></slides>
Each element is described below, along with an example and an explanation of the attributes.
slidesThe slides element is the top-level element in the XML document and contains all the information TurningPoint requires to create the interactive presentation. The slides element contains a number of slide elements.
<slides count=”1” id=”86FF9DB9”></slides>
Note Remember that the following characters are reserved in XML: < > & ‘ “
Use the XML entities for these characters (< > & ' " respectively).
Attribute Description
count The total number of slide elements in the presentation.
id An optional attribute that contains a unique identifier for the group of slides.
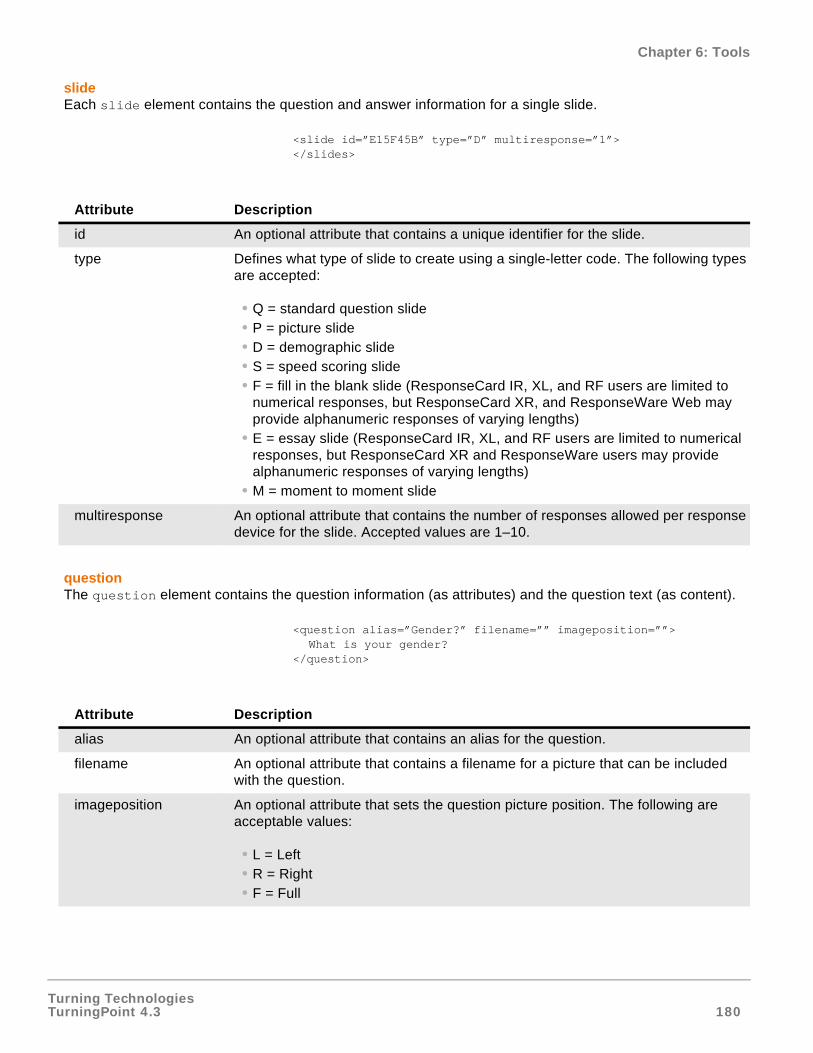
Turning TechnologiesTurningPoint 4.3 180
Chapter 6: Tools
slideEach slide element contains the question and answer information for a single slide.
<slide id=”E15F45B” type=”D” multiresponse=”1”></slides>
questionThe question element contains the question information (as attributes) and the question text (as content).
<question alias=”Gender?” filename=”” imageposition=””>What is your gender?
</question>
Attribute Description
id An optional attribute that contains a unique identifier for the slide.
type Defines what type of slide to create using a single-letter code. The following types are accepted:
• Q = standard question slide• P = picture slide• D = demographic slide• S = speed scoring slide• F = fill in the blank slide (ResponseCard IR, XL, and RF users are limited to
numerical responses, but ResponseCard XR, and ResponseWare Web may provide alphanumeric responses of varying lengths)
• E = essay slide (ResponseCard IR, XL, and RF users are limited to numerical responses, but ResponseCard XR and ResponseWare users may provide alphanumeric responses of varying lengths)
• M = moment to moment slide
multiresponse An optional attribute that contains the number of responses allowed per response device for the slide. Accepted values are 1–10.
Attribute Description
alias An optional attribute that contains an alias for the question.
filename An optional attribute that contains a filename for a picture that can be included with the question.
imageposition An optional attribute that sets the question picture position. The following are acceptable values:
• L = Left• R = Right• F = Full
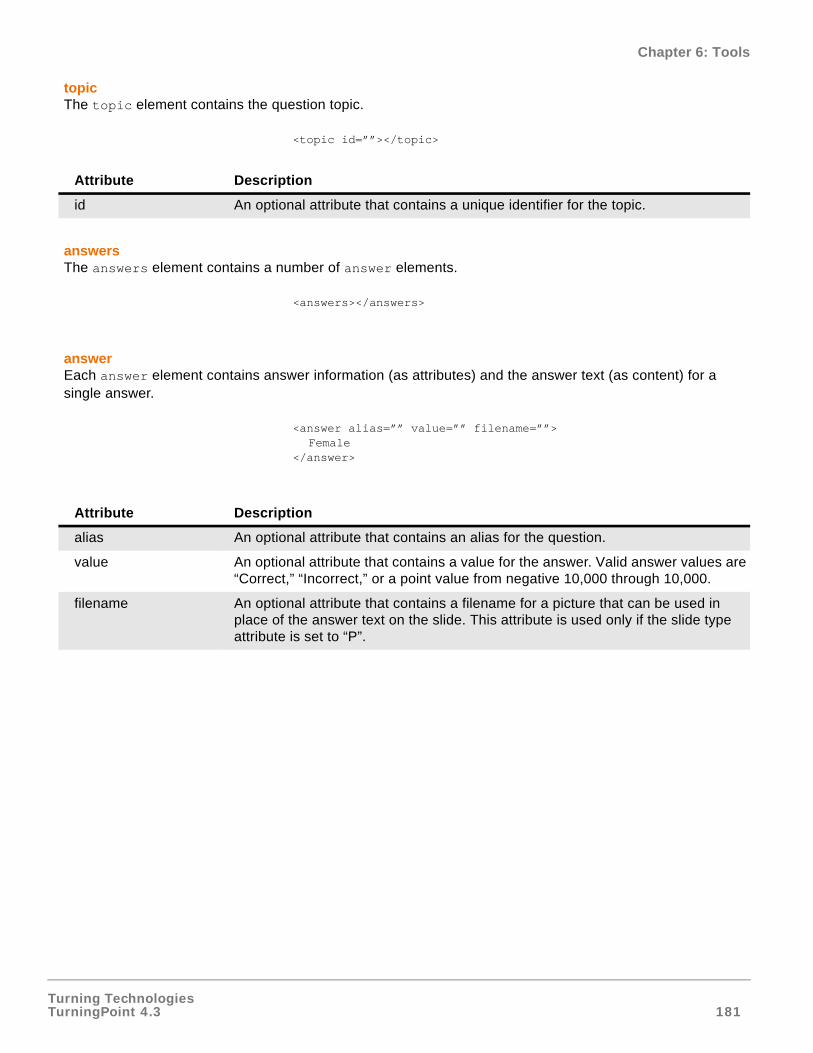
Turning TechnologiesTurningPoint 4.3 181
Chapter 6: Tools
topicThe topic element contains the question topic.
<topic id=””></topic>
answersThe answers element contains a number of answer elements.
<answers></answers>
answerEach answer element contains answer information (as attributes) and the answer text (as content) for a single answer.
<answer alias=”” value=”” filename=””>Female
</answer>
Attribute Description
id An optional attribute that contains a unique identifier for the topic.
Attribute Description
alias An optional attribute that contains an alias for the question.
value An optional attribute that contains a value for the answer. Valid answer values are “Correct,” “Incorrect,” or a point value from negative 10,000 through 10,000.
filename An optional attribute that contains a filename for a picture that can be used in place of the answer text on the slide. This attribute is used only if the slide type attribute is set to “P”.
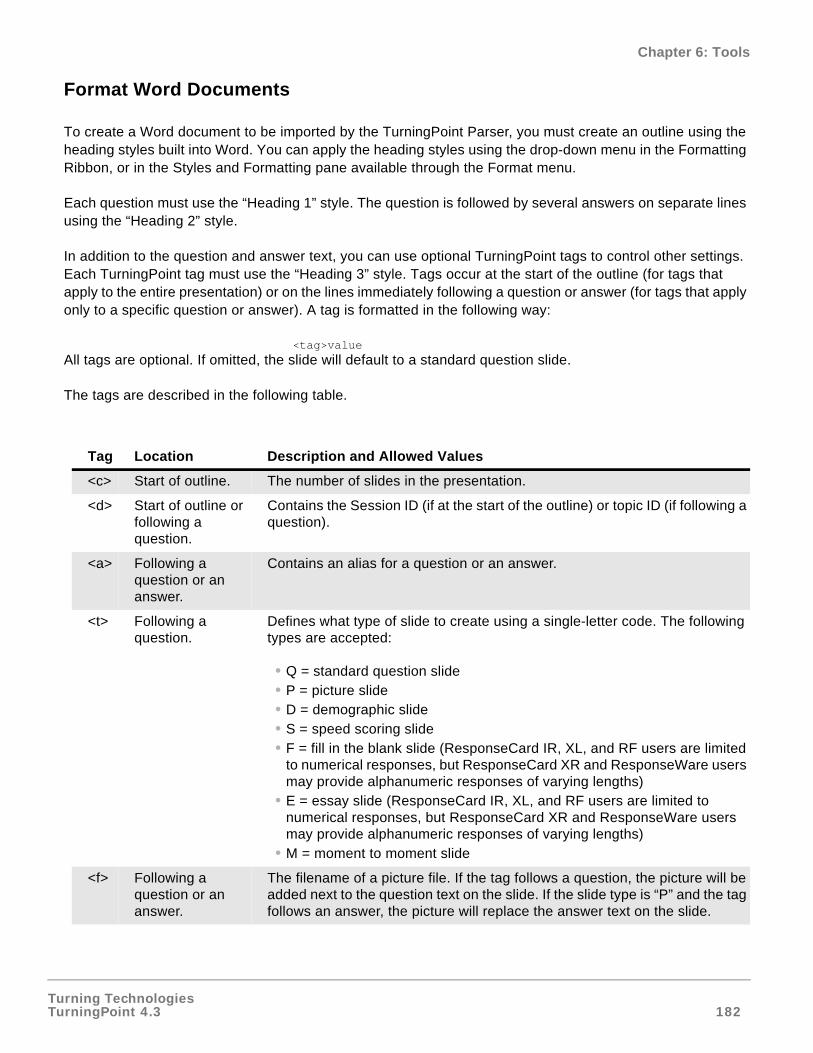
Turning TechnologiesTurningPoint 4.3 182
Chapter 6: Tools
Format Word Documents
To create a Word document to be imported by the TurningPoint Parser, you must create an outline using the heading styles built into Word. You can apply the heading styles using the drop-down menu in the Formatting Ribbon, or in the Styles and Formatting pane available through the Format menu.
Each question must use the “Heading 1” style. The question is followed by several answers on separate lines using the “Heading 2” style.
In addition to the question and answer text, you can use optional TurningPoint tags to control other settings. Each TurningPoint tag must use the “Heading 3” style. Tags occur at the start of the outline (for tags that apply to the entire presentation) or on the lines immediately following a question or answer (for tags that apply only to a specific question or answer). A tag is formatted in the following way:
<tag>valueAll tags are optional. If omitted, the slide will default to a standard question slide.
The tags are described in the following table.
Tag Location Description and Allowed Values
<c> Start of outline. The number of slides in the presentation.
<d> Start of outline or following a question.
Contains the Session ID (if at the start of the outline) or topic ID (if following a question).
<a> Following a question or an answer.
Contains an alias for a question or an answer.
<t> Following a question.
Defines what type of slide to create using a single-letter code. The following types are accepted:
• Q = standard question slide• P = picture slide• D = demographic slide• S = speed scoring slide• F = fill in the blank slide (ResponseCard IR, XL, and RF users are limited
to numerical responses, but ResponseCard XR and ResponseWare users may provide alphanumeric responses of varying lengths)
• E = essay slide (ResponseCard IR, XL, and RF users are limited to numerical responses, but ResponseCard XR and ResponseWare users may provide alphanumeric responses of varying lengths)
• M = moment to moment slide
<f> Following a question or an answer.
The filename of a picture file. If the tag follows a question, the picture will be added next to the question text on the slide. If the slide type is “P” and the tag follows an answer, the picture will replace the answer text on the slide.
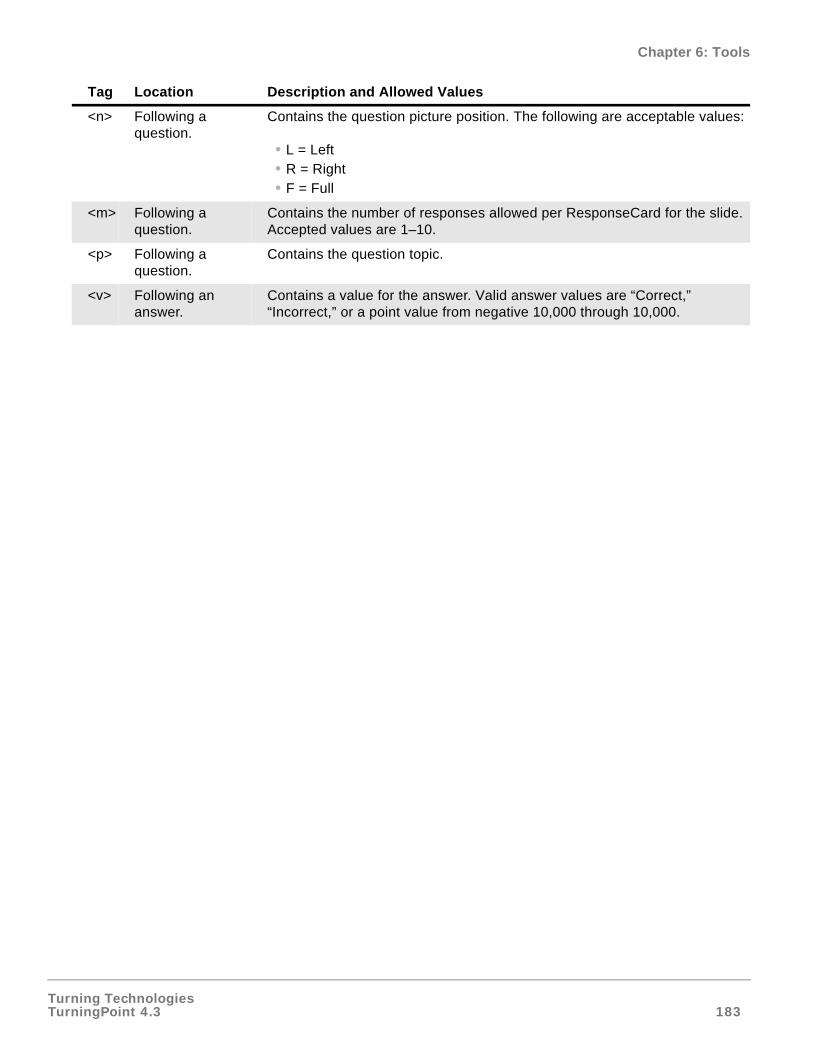
Turning TechnologiesTurningPoint 4.3 183
Chapter 6: Tools
<n> Following a question.
Contains the question picture position. The following are acceptable values:
• L = Left• R = Right• F = Full
<m> Following a question.
Contains the number of responses allowed per ResponseCard for the slide. Accepted values are 1–10.
<p> Following a question.
Contains the question topic.
<v> Following an answer.
Contains a value for the answer. Valid answer values are “Correct,” “Incorrect,” or a point value from negative 10,000 through 10,000.
Tag Location Description and Allowed Values
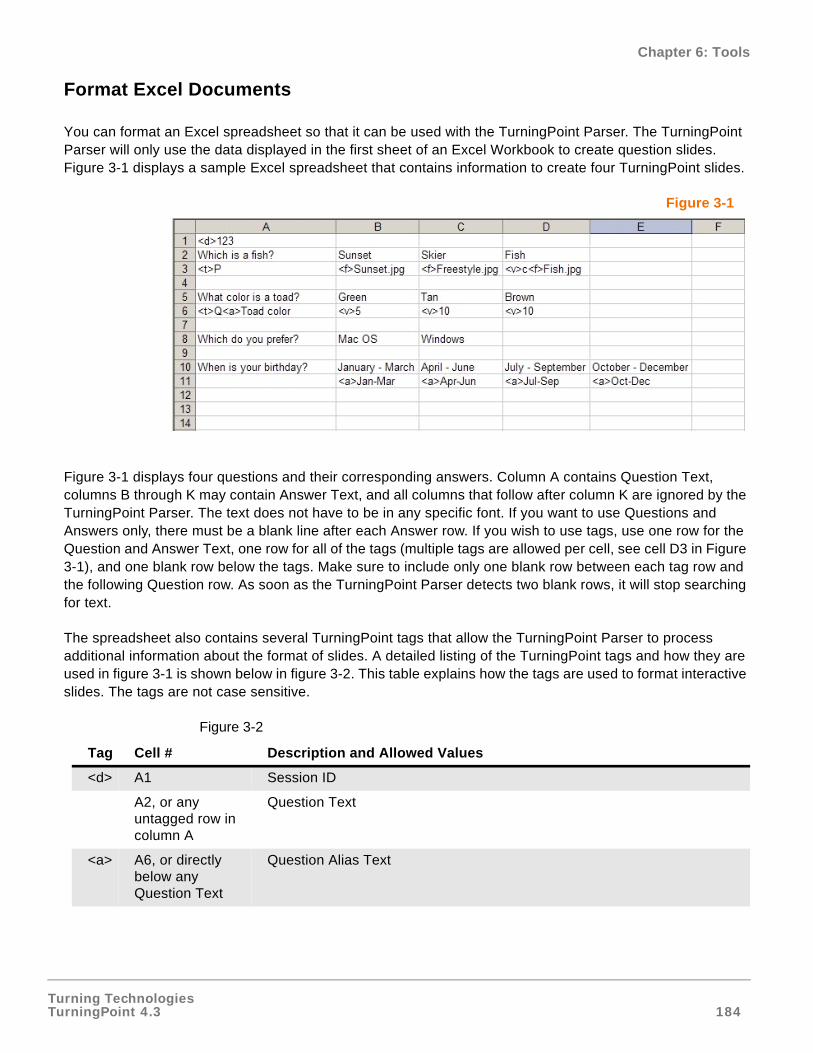
Turning TechnologiesTurningPoint 4.3 184
Chapter 6: Tools
Format Excel Documents
You can format an Excel spreadsheet so that it can be used with the TurningPoint Parser. The TurningPoint Parser will only use the data displayed in the first sheet of an Excel Workbook to create question slides. Figure 3-1 displays a sample Excel spreadsheet that contains information to create four TurningPoint slides.
Figure 3-1
Figure 3-1 displays four questions and their corresponding answers. Column A contains Question Text, columns B through K may contain Answer Text, and all columns that follow after column K are ignored by the TurningPoint Parser. The text does not have to be in any specific font. If you want to use Questions and Answers only, there must be a blank line after each Answer row. If you wish to use tags, use one row for the Question and Answer Text, one row for all of the tags (multiple tags are allowed per cell, see cell D3 in Figure 3-1), and one blank row below the tags. Make sure to include only one blank row between each tag row and the following Question row. As soon as the TurningPoint Parser detects two blank rows, it will stop searching for text.
The spreadsheet also contains several TurningPoint tags that allow the TurningPoint Parser to process additional information about the format of slides. A detailed listing of the TurningPoint tags and how they are used in figure 3-1 is shown below in figure 3-2. This table explains how the tags are used to format interactive slides. The tags are not case sensitive.
Figure 3-2
Tag Cell # Description and Allowed Values
<d> A1 Session ID
A2, or any untagged row in column A
Question Text
<a> A6, or directly below any Question Text
Question Alias Text
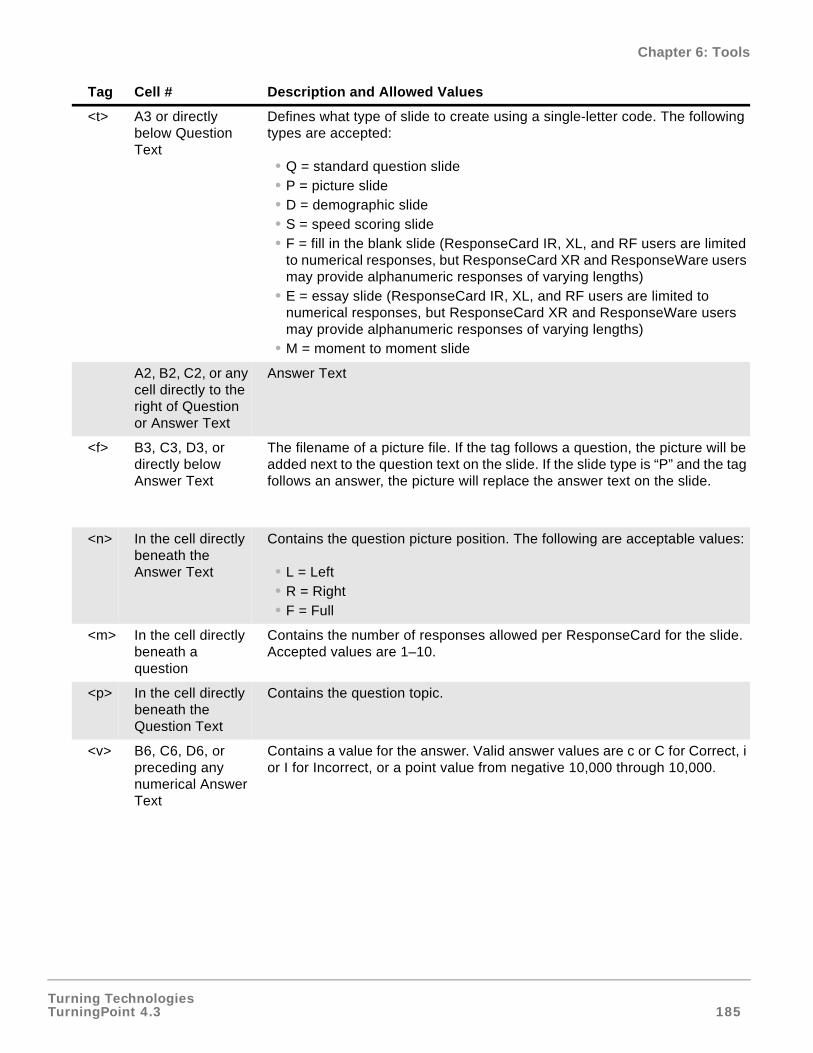
Turning TechnologiesTurningPoint 4.3 185
Chapter 6: Tools
<t> A3 or directly below Question Text
Defines what type of slide to create using a single-letter code. The following types are accepted:
• Q = standard question slide• P = picture slide• D = demographic slide• S = speed scoring slide• F = fill in the blank slide (ResponseCard IR, XL, and RF users are limited
to numerical responses, but ResponseCard XR and ResponseWare users may provide alphanumeric responses of varying lengths)
• E = essay slide (ResponseCard IR, XL, and RF users are limited to numerical responses, but ResponseCard XR and ResponseWare users may provide alphanumeric responses of varying lengths)
• M = moment to moment slide
A2, B2, C2, or any cell directly to the right of Question or Answer Text
Answer Text
<f> B3, C3, D3, or directly below Answer Text
The filename of a picture file. If the tag follows a question, the picture will be added next to the question text on the slide. If the slide type is “P” and the tag follows an answer, the picture will replace the answer text on the slide.
<n> In the cell directly beneath the Answer Text
Contains the question picture position. The following are acceptable values:
• L = Left• R = Right• F = Full
<m> In the cell directly beneath a question
Contains the number of responses allowed per ResponseCard for the slide. Accepted values are 1–10.
<p> In the cell directly beneath the Question Text
Contains the question topic.
<v> B6, C6, D6, or preceding any numerical Answer Text
Contains a value for the answer. Valid answer values are c or C for Correct, i or I for Incorrect, or a point value from negative 10,000 through 10,000.
Tag Cell # Description and Allowed Values
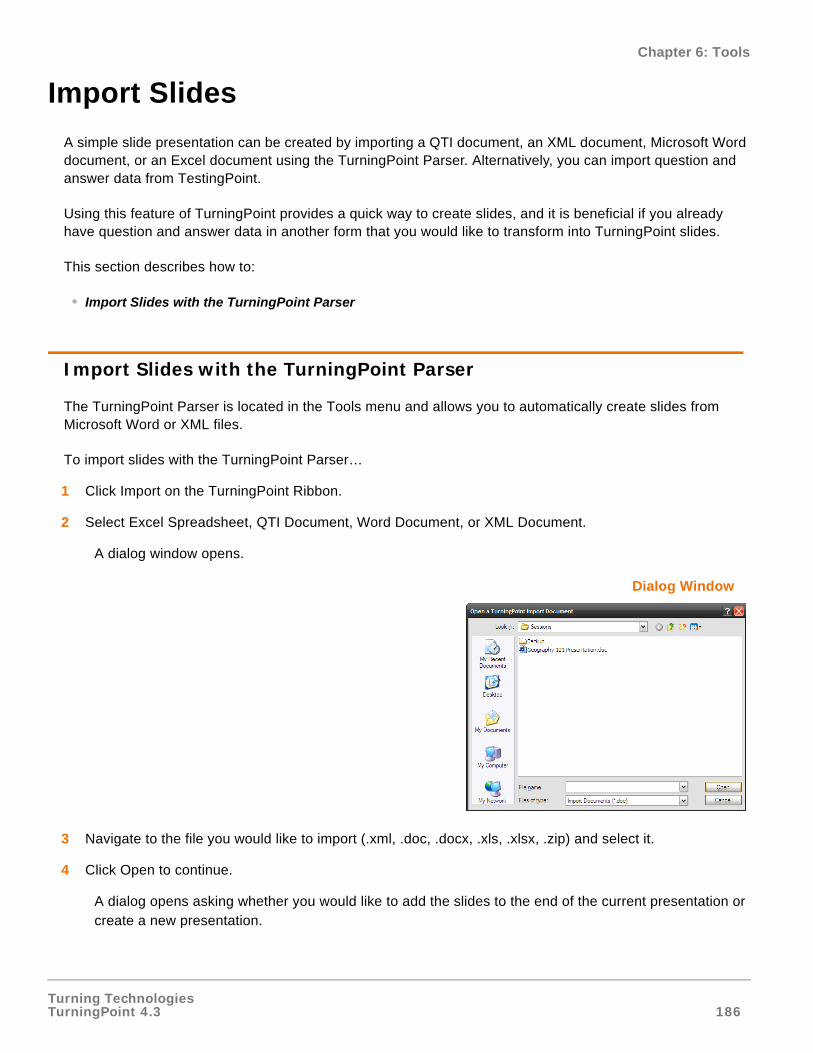
Turning TechnologiesTurningPoint 4.3 186
Chapter 6: Tools
Import Slides
A simple slide presentation can be created by importing a QTI document, an XML document, Microsoft Word document, or an Excel document using the TurningPoint Parser. Alternatively, you can import question and answer data from TestingPoint.
Using this feature of TurningPoint provides a quick way to create slides, and it is beneficial if you already have question and answer data in another form that you would like to transform into TurningPoint slides.
This section describes how to:
• Import Slides with the TurningPoint Parser
Import Slides with the TurningPoint Parser
The TurningPoint Parser is located in the Tools menu and allows you to automatically create slides from Microsoft Word or XML files.
To import slides with the TurningPoint Parser…
1 Click Import on the TurningPoint Ribbon.
2 Select Excel Spreadsheet, QTI Document, Word Document, or XML Document.
A dialog window opens.
Dialog Window
3 Navigate to the file you would like to import (.xml, .doc, .docx, .xls, .xlsx, .zip) and select it.
4 Click Open to continue.
A dialog opens asking whether you would like to add the slides to the end of the current presentation or create a new presentation.
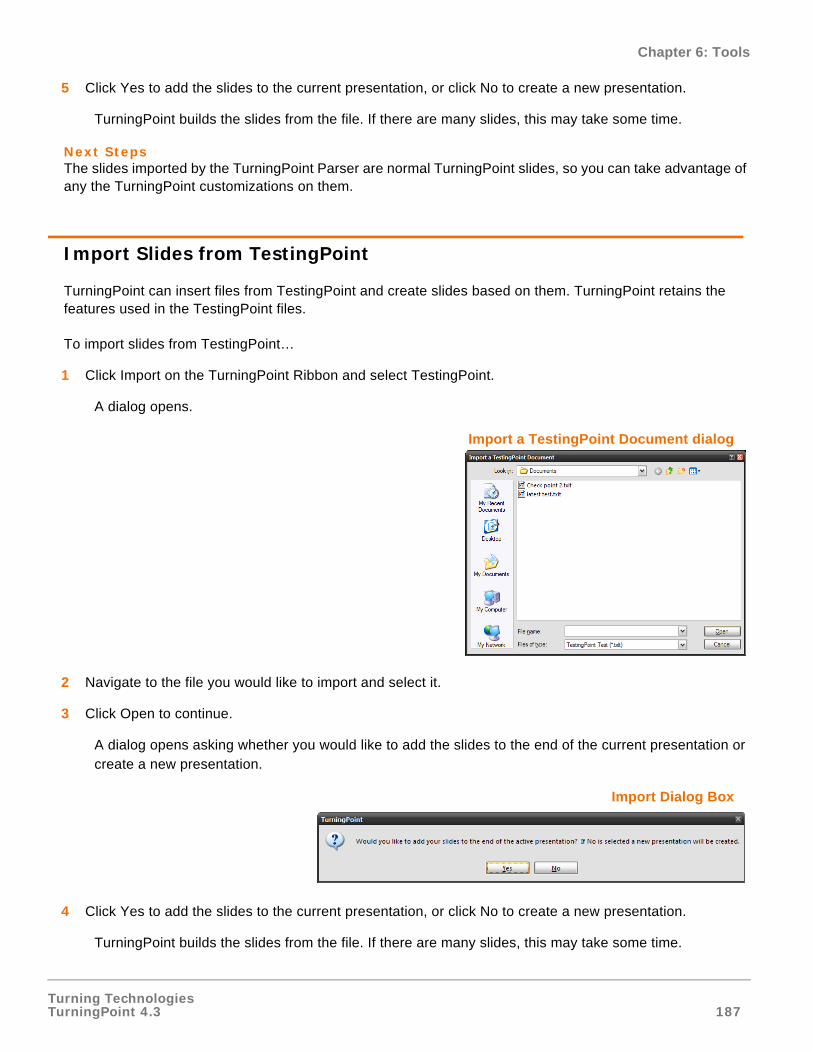
Turning TechnologiesTurningPoint 4.3 187
Chapter 6: Tools
5 Click Yes to add the slides to the current presentation, or click No to create a new presentation.
TurningPoint builds the slides from the file. If there are many slides, this may take some time.
Next StepsThe slides imported by the TurningPoint Parser are normal TurningPoint slides, so you can take advantage of any the TurningPoint customizations on them.
Import Slides from TestingPoint
TurningPoint can insert files from TestingPoint and create slides based on them. TurningPoint retains the features used in the TestingPoint files.
To import slides from TestingPoint…
1 Click Import on the TurningPoint Ribbon and select TestingPoint.
A dialog opens.
Import a TestingPoint Document dialog
2 Navigate to the file you would like to import and select it.
3 Click Open to continue.
A dialog opens asking whether you would like to add the slides to the end of the current presentation or create a new presentation.
Import Dialog Box
4 Click Yes to add the slides to the current presentation, or click No to create a new presentation.
TurningPoint builds the slides from the file. If there are many slides, this may take some time.

Turning TechnologiesTurningPoint 4.3 188
Chapter 7: Run Presentations
Run Presentations
After you have created the slides and objects discussed in Chapter 3: Creating and Saving Slides, you are ready to run an interactive presentation.
This chapter describes how to:
• Run an interactive presentation using the Slide Show functionality.
• Control the presentation using the Showbar.
• Monitor the audience participation.
Run a Presentation
You run an interactive presentation session using PowerPoint’s Slide Show functionality.
You control the presentation session by opening and closing polling. Polling is the mechanism by which TurningPoint accepts and tallies the responses provided by the audience using response devices.
This section describes how to:
• Establish the Presentation Settings
• Run the Slide Show
• View a Response Grid
• Use the Participant Monitor
• Add Slides During a Presentation Session
• Use Data Slicing (View Results by Question)
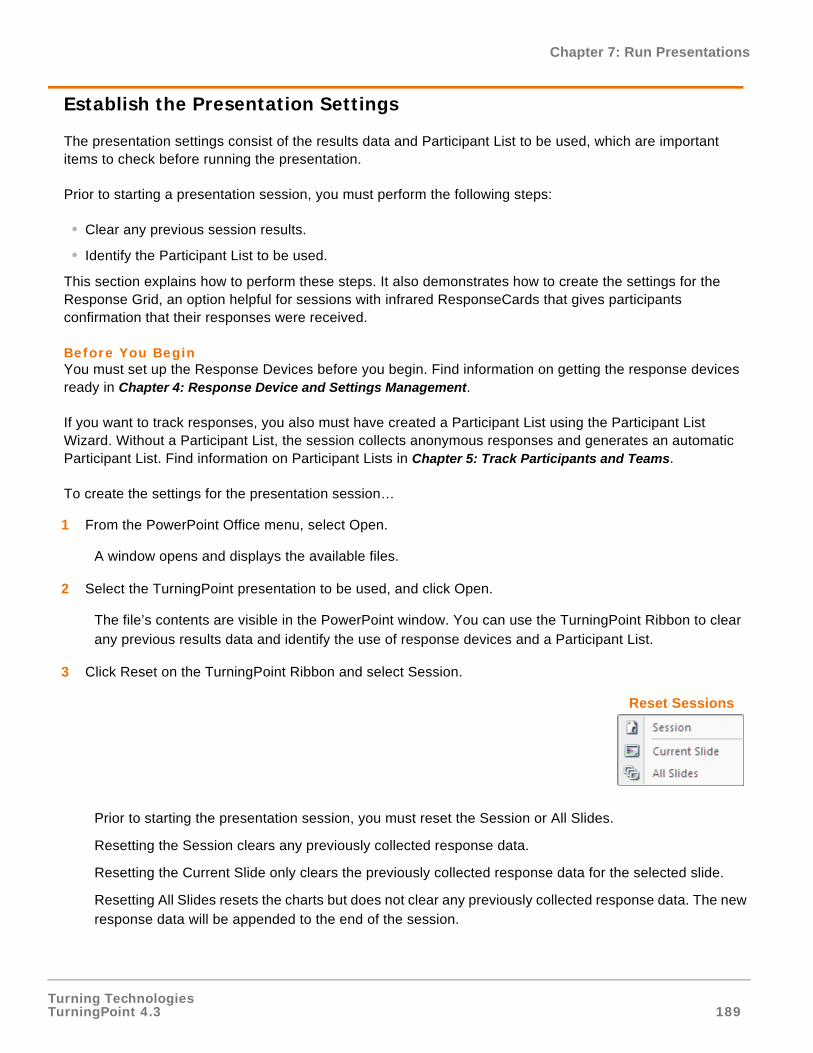
Turning TechnologiesTurningPoint 4.3 189
Chapter 7: Run Presentations
Establish the Presentation Settings
The presentation settings consist of the results data and Participant List to be used, which are important items to check before running the presentation.
Prior to starting a presentation session, you must perform the following steps:
• Clear any previous session results.
• Identify the Participant List to be used.
This section explains how to perform these steps. It also demonstrates how to create the settings for the Response Grid, an option helpful for sessions with infrared ResponseCards that gives participants confirmation that their responses were received.
Before You BeginYou must set up the Response Devices before you begin. Find information on getting the response devices ready in Chapter 4: Response Device and Settings Management.
If you want to track responses, you also must have created a Participant List using the Participant List Wizard. Without a Participant List, the session collects anonymous responses and generates an automatic Participant List. Find information on Participant Lists in Chapter 5: Track Participants and Teams.
To create the settings for the presentation session…
1 From the PowerPoint Office menu, select Open.
A window opens and displays the available files.
2 Select the TurningPoint presentation to be used, and click Open.
The file’s contents are visible in the PowerPoint window. You can use the TurningPoint Ribbon to clear any previous results data and identify the use of response devices and a Participant List.
3 Click Reset on the TurningPoint Ribbon and select Session.
Reset Sessions
Prior to starting the presentation session, you must reset the Session or All Slides.
Resetting the Session clears any previously collected response data.
Resetting the Current Slide only clears the previously collected response data for the selected slide.
Resetting All Slides resets the charts but does not clear any previously collected response data. The new response data will be appended to the end of the session.
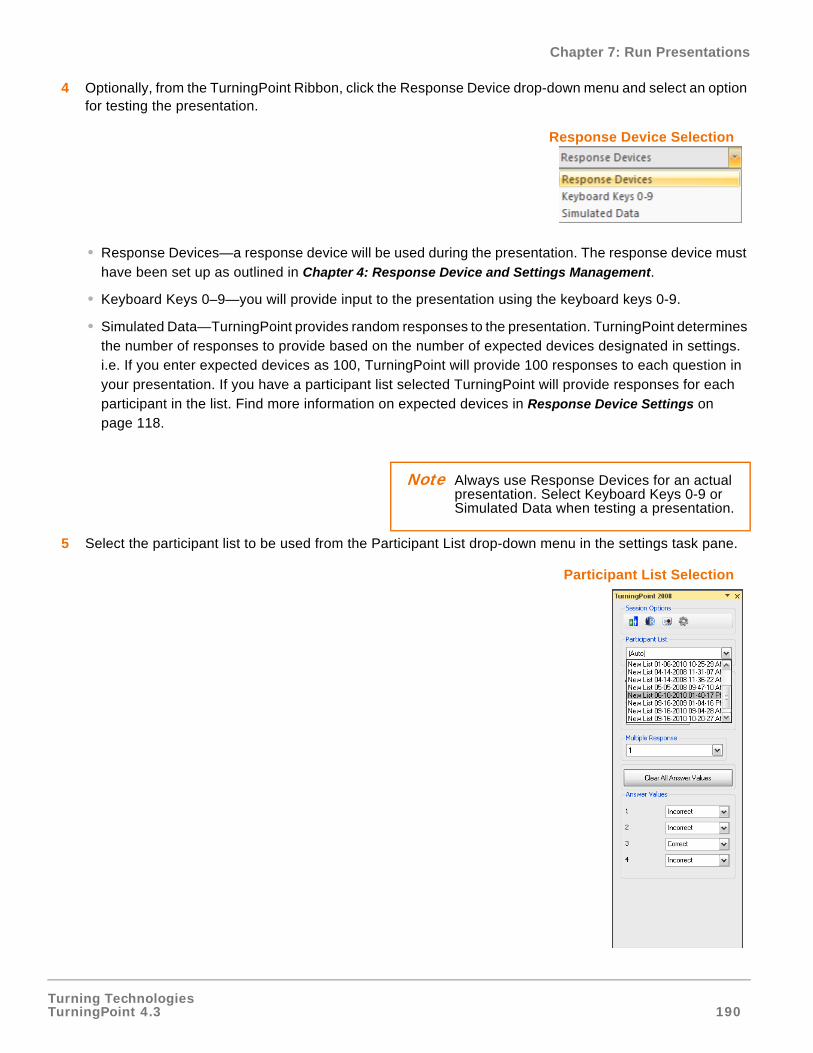
Turning TechnologiesTurningPoint 4.3 190
Chapter 7: Run Presentations
4 Optionally, from the TurningPoint Ribbon, click the Response Device drop-down menu and select an option for testing the presentation.
Response Device Selection
• Response Devices—a response device will be used during the presentation. The response device must have been set up as outlined in Chapter 4: Response Device and Settings Management.
• Keyboard Keys 0–9—you will provide input to the presentation using the keyboard keys 0-9.
• Simulated Data—TurningPoint provides random responses to the presentation. TurningPoint determines the number of responses to provide based on the number of expected devices designated in settings. i.e. If you enter expected devices as 100, TurningPoint will provide 100 responses to each question in your presentation. If you have a participant list selected TurningPoint will provide responses for each participant in the list. Find more information on expected devices in Response Device Settings on page 118.
5 Select the participant list to be used from the Participant List drop-down menu in the settings task pane.
Participant List Selection
Note Always use Response Devices for an actual presentation. Select Keyboard Keys 0-9 or Simulated Data when testing a presentation.
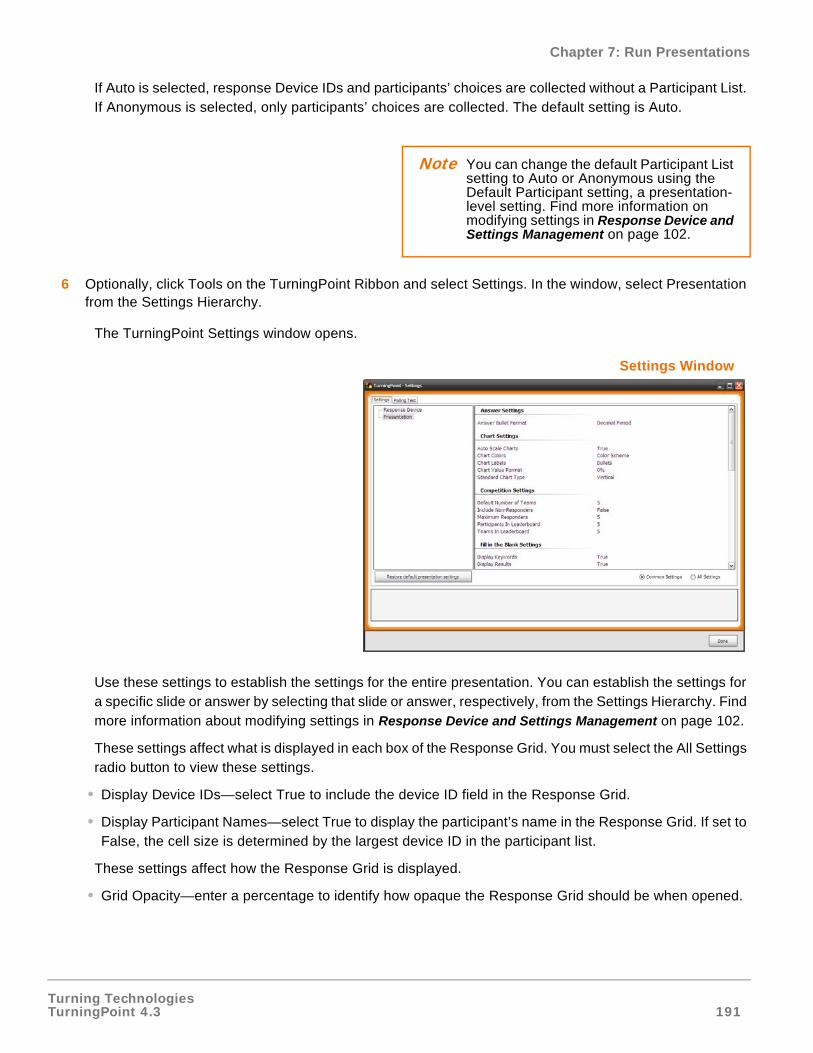
Turning TechnologiesTurningPoint 4.3 191
Chapter 7: Run Presentations
If Auto is selected, response Device IDs and participants’ choices are collected without a Participant List. If Anonymous is selected, only participants’ choices are collected. The default setting is Auto.
6 Optionally, click Tools on the TurningPoint Ribbon and select Settings. In the window, select Presentation from the Settings Hierarchy.
The TurningPoint Settings window opens.
Settings Window
Use these settings to establish the settings for the entire presentation. You can establish the settings for a specific slide or answer by selecting that slide or answer, respectively, from the Settings Hierarchy. Find more information about modifying settings in Response Device and Settings Management on page 102.
These settings affect what is displayed in each box of the Response Grid. You must select the All Settings radio button to view these settings.
• Display Device IDs—select True to include the device ID field in the Response Grid.
• Display Participant Names—select True to display the participant’s name in the Response Grid. If set to False, the cell size is determined by the largest device ID in the participant list.
These settings affect how the Response Grid is displayed.
• Grid Opacity—enter a percentage to identify how opaque the Response Grid should be when opened.
Note You can change the default Participant List setting to Auto or Anonymous using the Default Participant setting, a presentation-level setting. Find more information on modifying settings in Response Device and Settings Management on page 102.
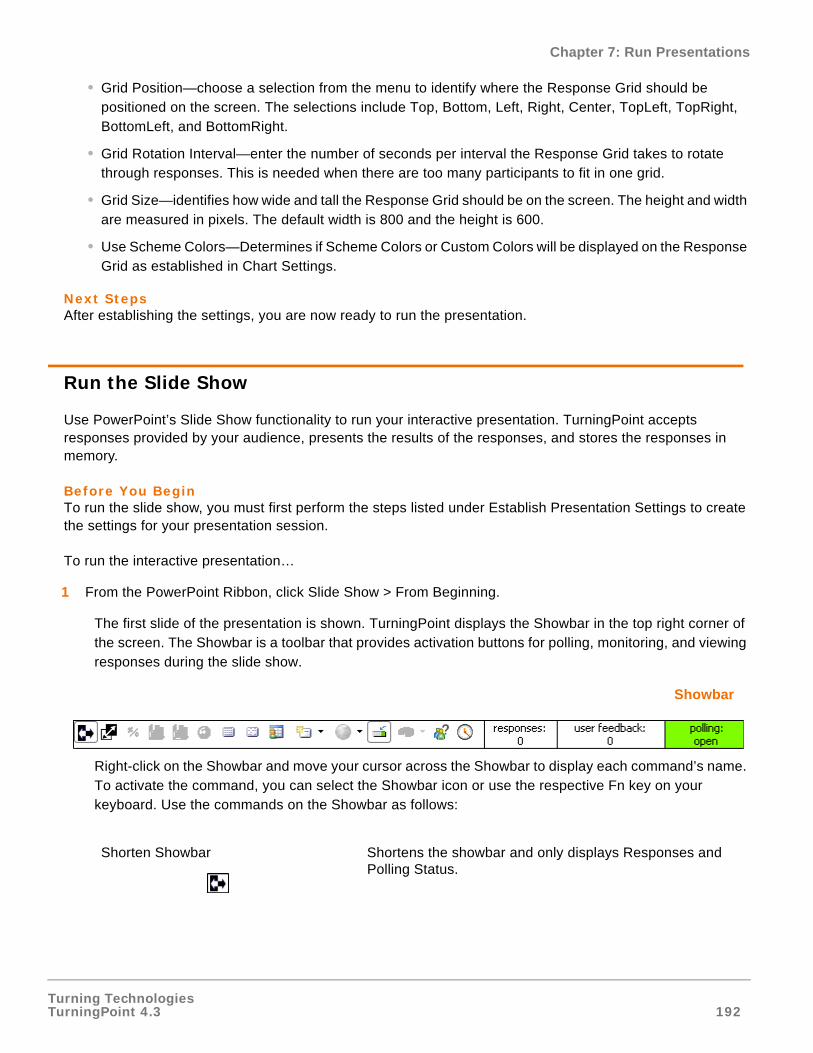
Turning TechnologiesTurningPoint 4.3 192
Chapter 7: Run Presentations
• Grid Position—choose a selection from the menu to identify where the Response Grid should be positioned on the screen. The selections include Top, Bottom, Left, Right, Center, TopLeft, TopRight, BottomLeft, and BottomRight.
• Grid Rotation Interval—enter the number of seconds per interval the Response Grid takes to rotate through responses. This is needed when there are too many participants to fit in one grid.
• Grid Size—identifies how wide and tall the Response Grid should be on the screen. The height and width are measured in pixels. The default width is 800 and the height is 600.
• Use Scheme Colors—Determines if Scheme Colors or Custom Colors will be displayed on the Response Grid as established in Chart Settings.
Next StepsAfter establishing the settings, you are now ready to run the presentation.
Run the Slide Show
Use PowerPoint’s Slide Show functionality to run your interactive presentation. TurningPoint accepts responses provided by your audience, presents the results of the responses, and stores the responses in memory.
Before You BeginTo run the slide show, you must first perform the steps listed under Establish Presentation Settings to create the settings for your presentation session.
To run the interactive presentation…
1 From the PowerPoint Ribbon, click Slide Show > From Beginning.
The first slide of the presentation is shown. TurningPoint displays the Showbar in the top right corner of the screen. The Showbar is a toolbar that provides activation buttons for polling, monitoring, and viewing responses during the slide show.
Showbar
Right-click on the Showbar and move your cursor across the Showbar to display each command’s name. To activate the command, you can select the Showbar icon or use the respective Fn key on your keyboard. Use the commands on the Showbar as follows:
Shorten Showbar Shortens the showbar and only displays Responses and Polling Status.
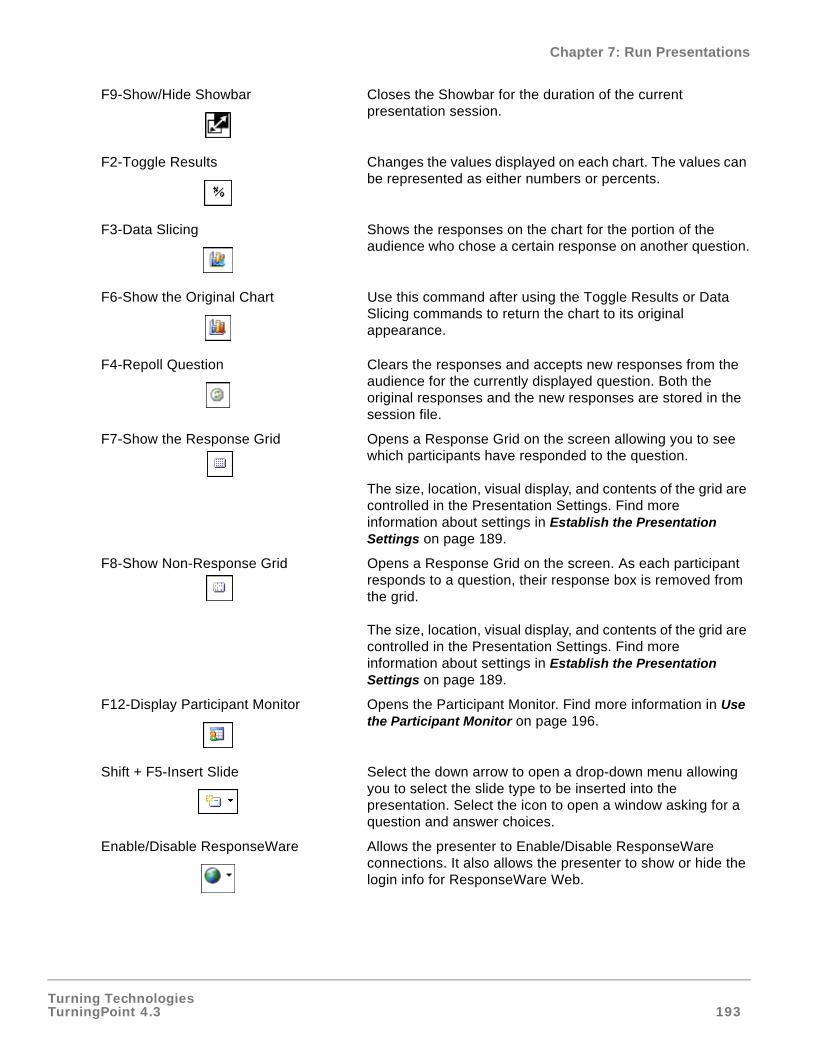
Turning TechnologiesTurningPoint 4.3 193
Chapter 7: Run Presentations
F9-Show/Hide Showbar Closes the Showbar for the duration of the current presentation session.
F2-Toggle Results Changes the values displayed on each chart. The values can be represented as either numbers or percents.
F3-Data Slicing Shows the responses on the chart for the portion of the audience who chose a certain response on another question.
F6-Show the Original Chart Use this command after using the Toggle Results or Data Slicing commands to return the chart to its original appearance.
F4-Repoll Question Clears the responses and accepts new responses from the audience for the currently displayed question. Both the original responses and the new responses are stored in the session file.
F7-Show the Response Grid Opens a Response Grid on the screen allowing you to see which participants have responded to the question.
The size, location, visual display, and contents of the grid are controlled in the Presentation Settings. Find more information about settings in Establish the Presentation Settings on page 189.
F8-Show Non-Response Grid Opens a Response Grid on the screen. As each participant responds to a question, their response box is removed from the grid.
The size, location, visual display, and contents of the grid are controlled in the Presentation Settings. Find more information about settings in Establish the Presentation Settings on page 189.
F12-Display Participant Monitor Opens the Participant Monitor. Find more information in Use the Participant Monitor on page 196.
Shift + F5-Insert Slide Select the down arrow to open a drop-down menu allowing you to select the slide type to be inserted into the presentation. Select the icon to open a window asking for a question and answer choices.
Enable/Disable ResponseWare Allows the presenter to Enable/Disable ResponseWare connections. It also allows the presenter to show or hide the login info for ResponseWare Web.
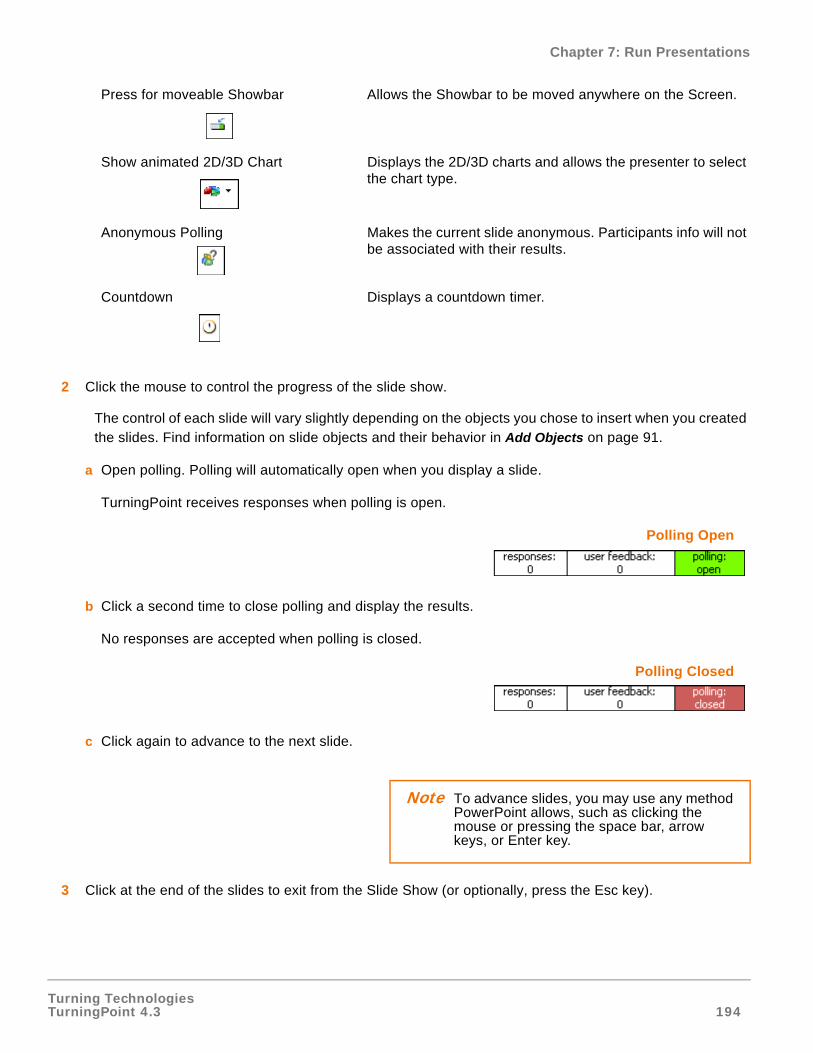
Turning TechnologiesTurningPoint 4.3 194
Chapter 7: Run Presentations
2 Click the mouse to control the progress of the slide show.
The control of each slide will vary slightly depending on the objects you chose to insert when you created the slides. Find information on slide objects and their behavior in Add Objects on page 91.
a Open polling. Polling will automatically open when you display a slide.
TurningPoint receives responses when polling is open.
Polling Open
b Click a second time to close polling and display the results.
No responses are accepted when polling is closed.
Polling Closed
c Click again to advance to the next slide.
3 Click at the end of the slides to exit from the Slide Show (or optionally, press the Esc key).
Press for moveable Showbar Allows the Showbar to be moved anywhere on the Screen.
Show animated 2D/3D Chart Displays the 2D/3D charts and allows the presenter to select the chart type.
Anonymous Polling Makes the current slide anonymous. Participants info will not be associated with their results.
Countdown Displays a countdown timer.
Note To advance slides, you may use any method PowerPoint allows, such as clicking the mouse or pressing the space bar, arrow keys, or Enter key.
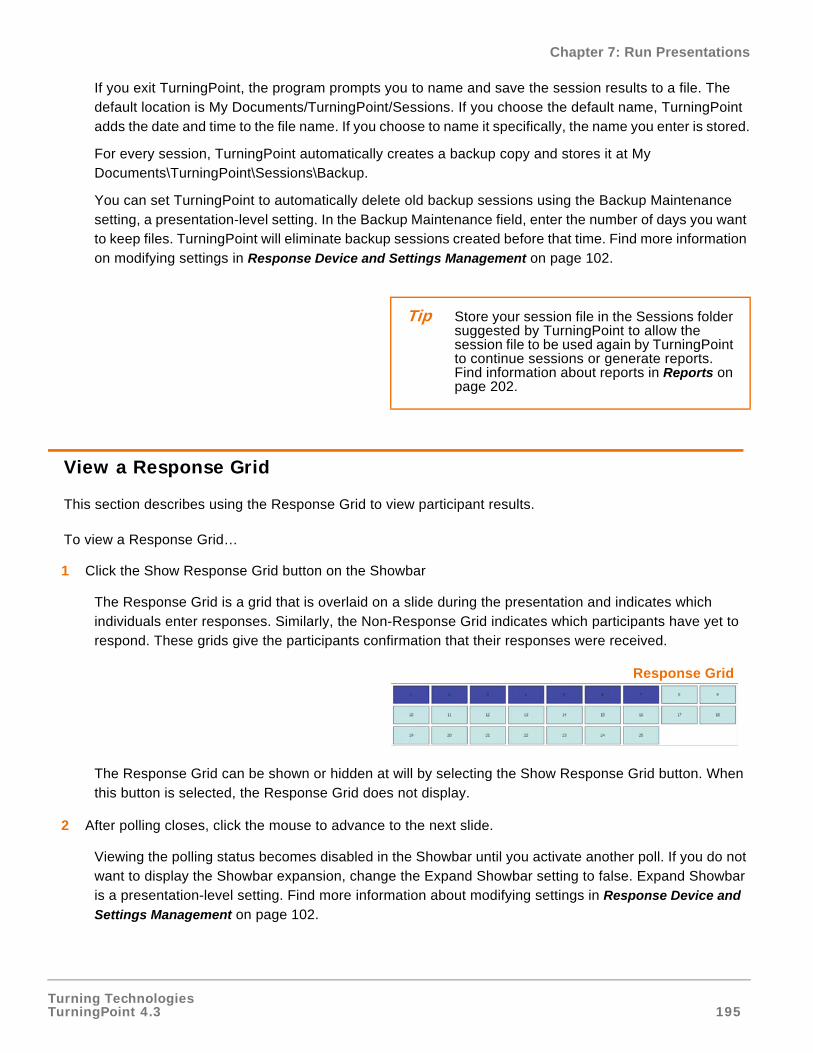
Turning TechnologiesTurningPoint 4.3 195
Chapter 7: Run Presentations
If you exit TurningPoint, the program prompts you to name and save the session results to a file. The default location is My Documents/TurningPoint/Sessions. If you choose the default name, TurningPoint adds the date and time to the file name. If you choose to name it specifically, the name you enter is stored.
For every session, TurningPoint automatically creates a backup copy and stores it at My Documents\TurningPoint\Sessions\Backup.
You can set TurningPoint to automatically delete old backup sessions using the Backup Maintenance setting, a presentation-level setting. In the Backup Maintenance field, enter the number of days you want to keep files. TurningPoint will eliminate backup sessions created before that time. Find more information on modifying settings in Response Device and Settings Management on page 102.
View a Response Grid
This section describes using the Response Grid to view participant results.
To view a Response Grid…
1 Click the Show Response Grid button on the Showbar
The Response Grid is a grid that is overlaid on a slide during the presentation and indicates which individuals enter responses. Similarly, the Non-Response Grid indicates which participants have yet to respond. These grids give the participants confirmation that their responses were received.
Response Grid
The Response Grid can be shown or hidden at will by selecting the Show Response Grid button. When this button is selected, the Response Grid does not display.
2 After polling closes, click the mouse to advance to the next slide.
Viewing the polling status becomes disabled in the Showbar until you activate another poll. If you do not want to display the Showbar expansion, change the Expand Showbar setting to false. Expand Showbar is a presentation-level setting. Find more information about modifying settings in Response Device and
Settings Management on page 102.
Tip Store your session file in the Sessions folder suggested by TurningPoint to allow the session file to be used again by TurningPoint to continue sessions or generate reports. Find information about reports in Reports on page 202.
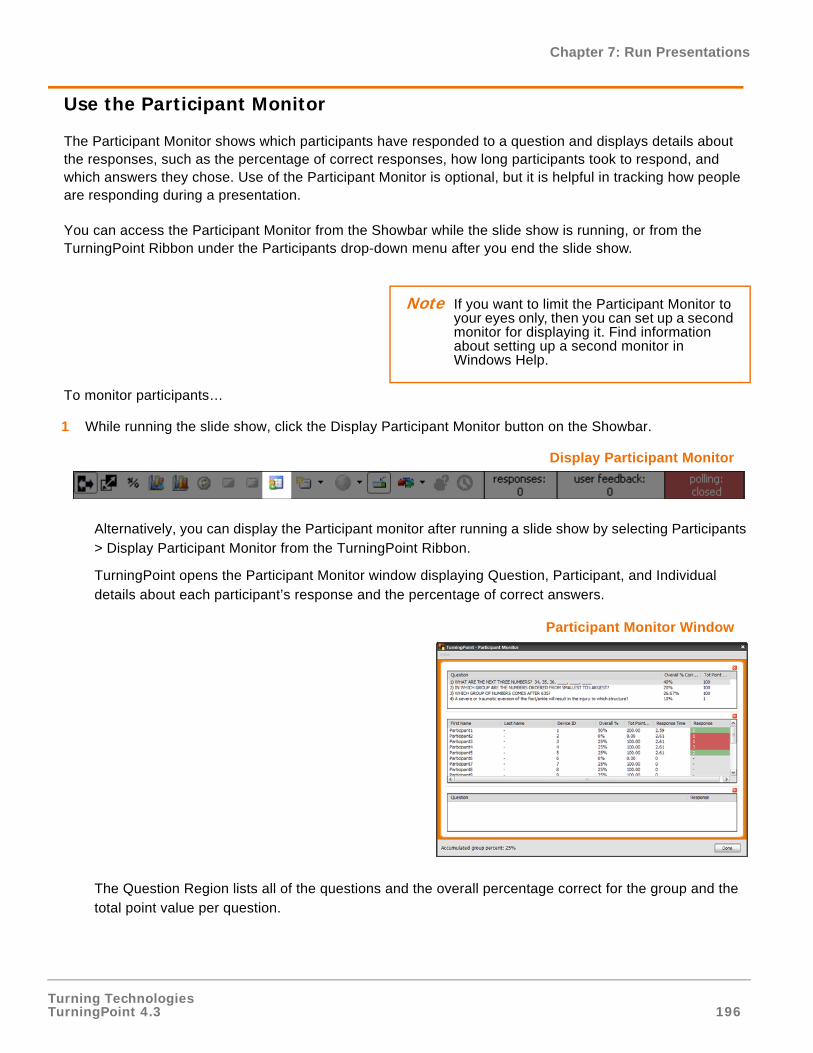
Turning TechnologiesTurningPoint 4.3 196
Chapter 7: Run Presentations
Use the Participant Monitor
The Participant Monitor shows which participants have responded to a question and displays details about the responses, such as the percentage of correct responses, how long participants took to respond, and which answers they chose. Use of the Participant Monitor is optional, but it is helpful in tracking how people are responding during a presentation.
You can access the Participant Monitor from the Showbar while the slide show is running, or from the TurningPoint Ribbon under the Participants drop-down menu after you end the slide show.
To monitor participants…
1 While running the slide show, click the Display Participant Monitor button on the Showbar.
Display Participant Monitor
Alternatively, you can display the Participant monitor after running a slide show by selecting Participants > Display Participant Monitor from the TurningPoint Ribbon.
TurningPoint opens the Participant Monitor window displaying Question, Participant, and Individual details about each participant’s response and the percentage of correct answers.
Participant Monitor Window
The Question Region lists all of the questions and the overall percentage correct for the group and the total point value per question.
Note If you want to limit the Participant Monitor to your eyes only, then you can set up a second monitor for displaying it. Find information about setting up a second monitor in Windows Help.
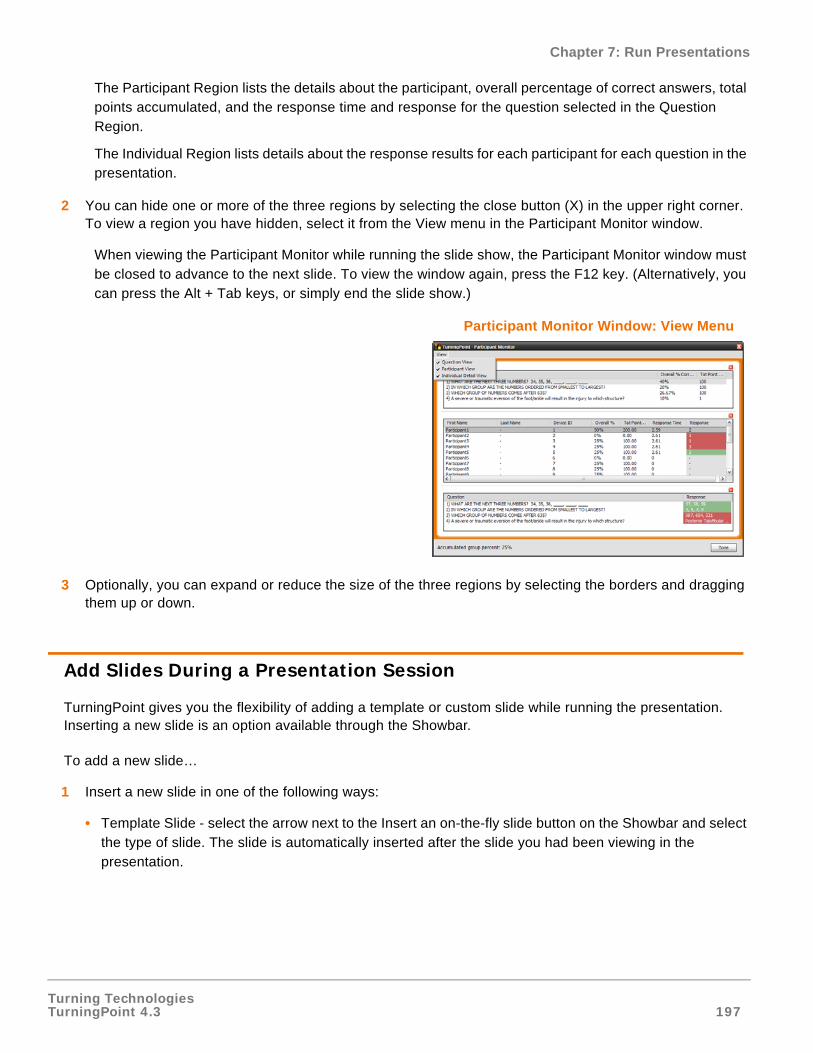
Turning TechnologiesTurningPoint 4.3 197
Chapter 7: Run Presentations
The Participant Region lists the details about the participant, overall percentage of correct answers, total points accumulated, and the response time and response for the question selected in the Question Region.
The Individual Region lists details about the response results for each participant for each question in the presentation.
2 You can hide one or more of the three regions by selecting the close button (X) in the upper right corner. To view a region you have hidden, select it from the View menu in the Participant Monitor window.
When viewing the Participant Monitor while running the slide show, the Participant Monitor window must be closed to advance to the next slide. To view the window again, press the F12 key. (Alternatively, you can press the Alt + Tab keys, or simply end the slide show.)
Participant Monitor Window: View Menu
3 Optionally, you can expand or reduce the size of the three regions by selecting the borders and dragging them up or down.
Add Slides During a Presentation Session
TurningPoint gives you the flexibility of adding a template or custom slide while running the presentation. Inserting a new slide is an option available through the Showbar.
To add a new slide…
1 Insert a new slide in one of the following ways:
• Template Slide - select the arrow next to the Insert an on-the-fly slide button on the Showbar and select the type of slide. The slide is automatically inserted after the slide you had been viewing in the presentation.
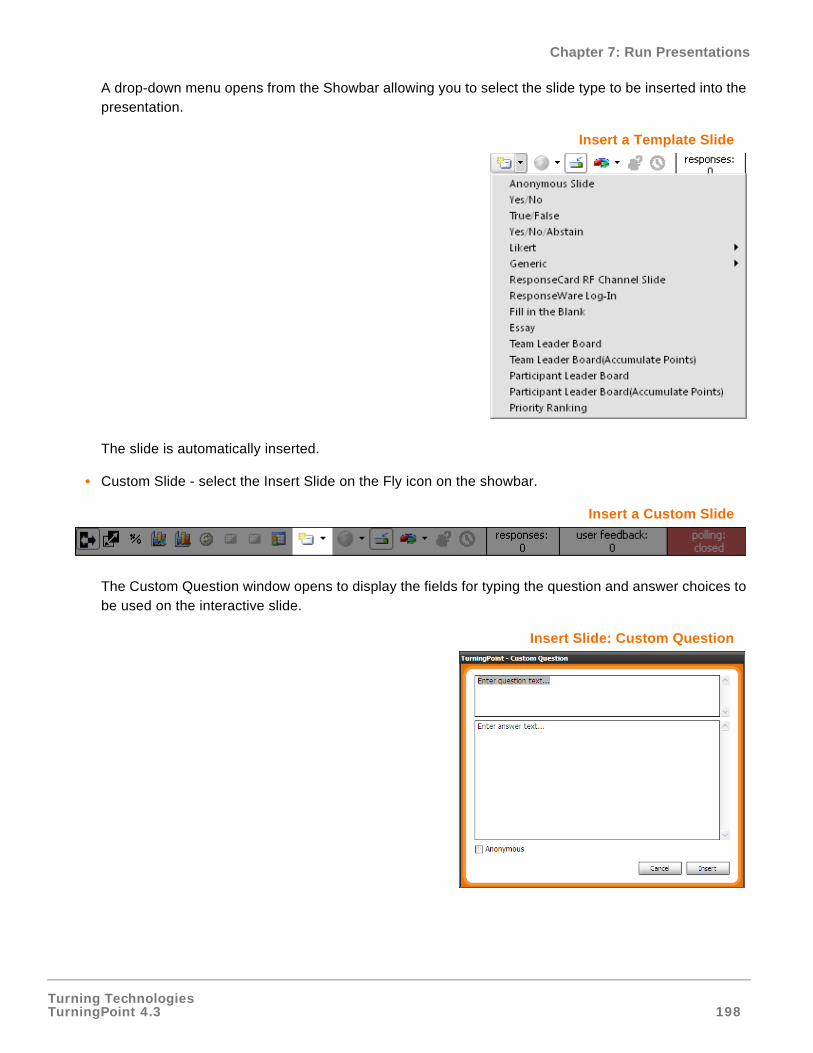
Turning TechnologiesTurningPoint 4.3 198
Chapter 7: Run Presentations
A drop-down menu opens from the Showbar allowing you to select the slide type to be inserted into the presentation.
Insert a Template Slide
The slide is automatically inserted.
• Custom Slide - select the Insert Slide on the Fly icon on the showbar.
Insert a Custom Slide
The Custom Question window opens to display the fields for typing the question and answer choices to be used on the interactive slide.
Insert Slide: Custom Question
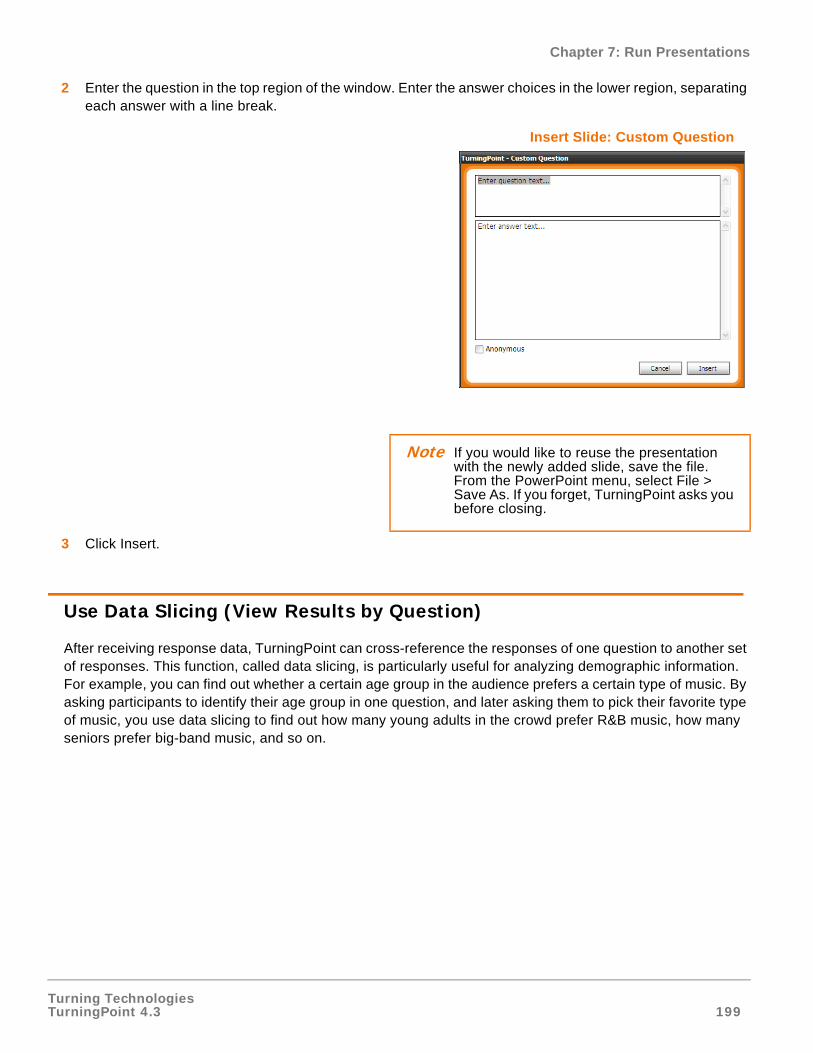
Turning TechnologiesTurningPoint 4.3 199
Chapter 7: Run Presentations
2 Enter the question in the top region of the window. Enter the answer choices in the lower region, separating each answer with a line break.
Insert Slide: Custom Question
3 Click Insert.
Use Data Slicing (View Results by Question)
After receiving response data, TurningPoint can cross-reference the responses of one question to another set of responses. This function, called data slicing, is particularly useful for analyzing demographic information. For example, you can find out whether a certain age group in the audience prefers a certain type of music. By asking participants to identify their age group in one question, and later asking them to pick their favorite type of music, you use data slicing to find out how many young adults in the crowd prefer R&B music, how many seniors prefer big-band music, and so on.
Note If you would like to reuse the presentation with the newly added slide, save the file. From the PowerPoint menu, select File > Save As. If you forget, TurningPoint asks you before closing.
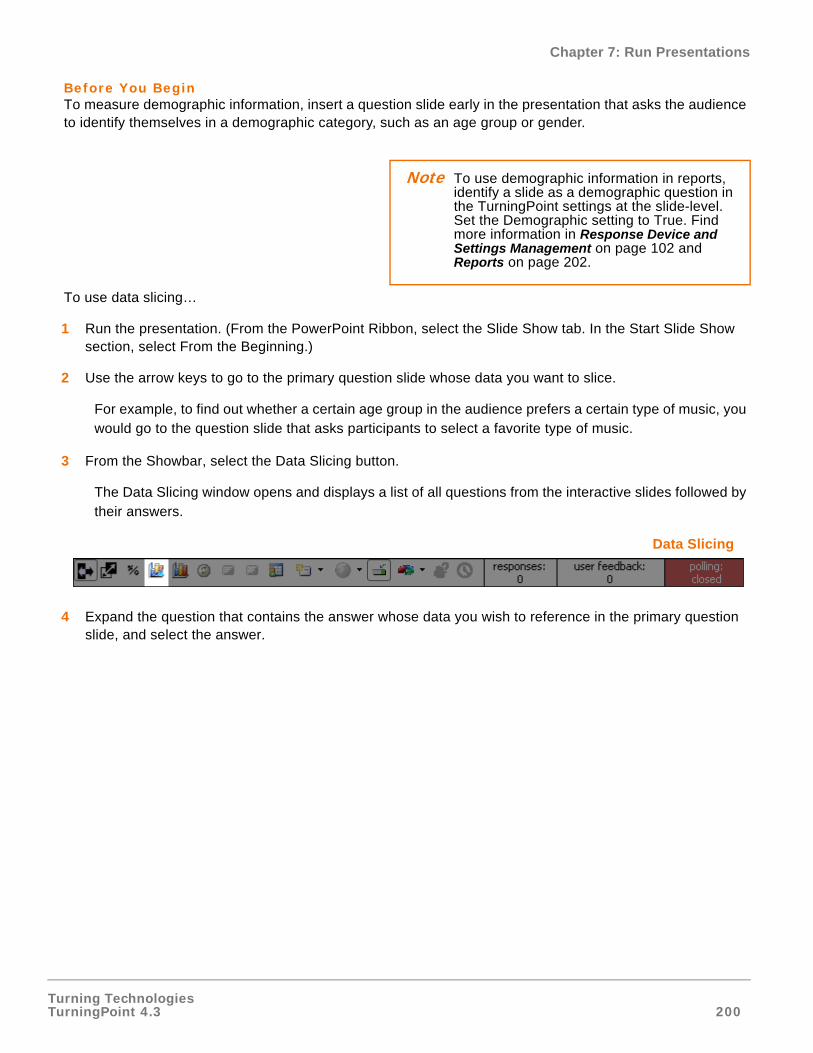
Turning TechnologiesTurningPoint 4.3 200
Chapter 7: Run Presentations
Before You BeginTo measure demographic information, insert a question slide early in the presentation that asks the audience to identify themselves in a demographic category, such as an age group or gender.
To use data slicing…
1 Run the presentation. (From the PowerPoint Ribbon, select the Slide Show tab. In the Start Slide Show section, select From the Beginning.)
2 Use the arrow keys to go to the primary question slide whose data you want to slice.
For example, to find out whether a certain age group in the audience prefers a certain type of music, you would go to the question slide that asks participants to select a favorite type of music.
3 From the Showbar, select the Data Slicing button.
The Data Slicing window opens and displays a list of all questions from the interactive slides followed by their answers.
Data Slicing
4 Expand the question that contains the answer whose data you wish to reference in the primary question slide, and select the answer.
Note To use demographic information in reports, identify a slide as a demographic question in the TurningPoint settings at the slide-level. Set the Demographic setting to True. Find more information in Response Device and Settings Management on page 102 and Reports on page 202.
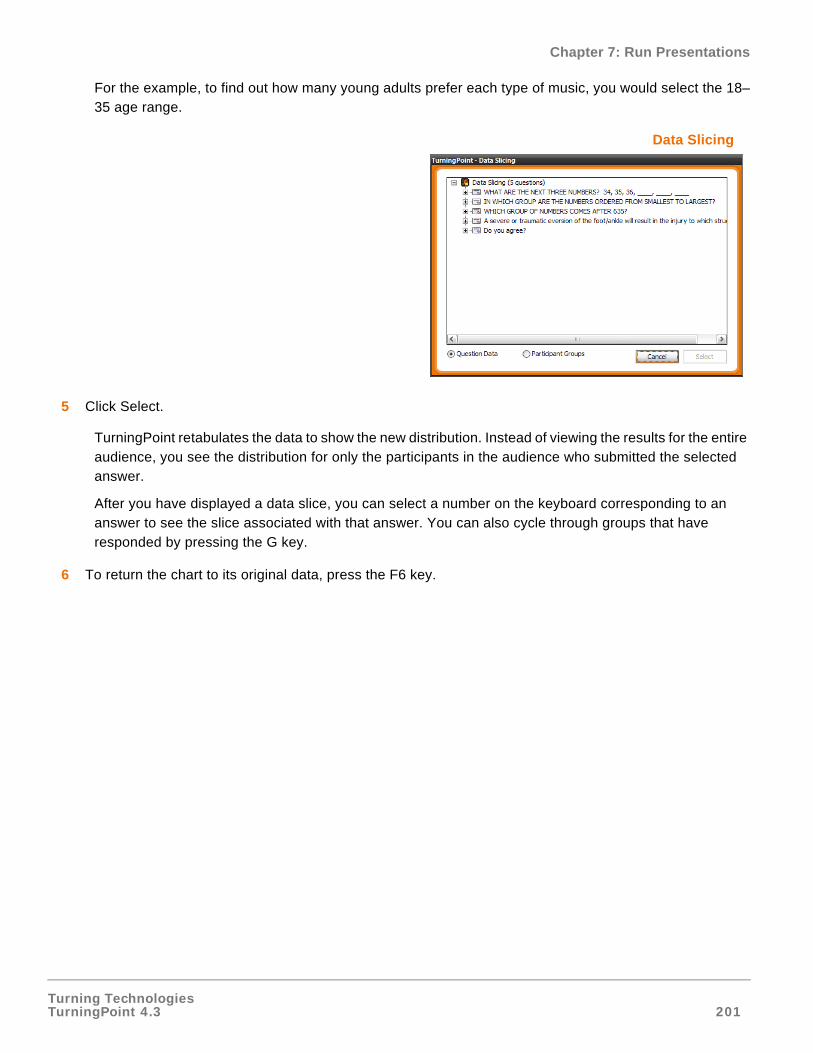
Turning TechnologiesTurningPoint 4.3 201
Chapter 7: Run Presentations
For the example, to find out how many young adults prefer each type of music, you would select the 18–35 age range.
Data Slicing
5 Click Select.
TurningPoint retabulates the data to show the new distribution. Instead of viewing the results for the entire audience, you see the distribution for only the participants in the audience who submitted the selected answer.
After you have displayed a data slice, you can select a number on the keyboard corresponding to an answer to see the slice associated with that answer. You can also cycle through groups that have responded by pressing the G key.
6 To return the chart to its original data, press the F6 key.
Turning TechnologiesTurningPoint 4.3 202
Chapter 8: Reports
Reports
Reports allows you to generate and view a wide variety of reports based on the responses you received during your TurningPoint, TurningPoint Anywhere, or TestingPoint sessions. The reports are generated as printable Word documents or Excel worksheets with information about the questions and answers, participants, and responses gathered in your presentation. Turning Reports displays a hierarchical menu of reports organized by category, such as Results by Question Reports and Demographic Reports. If you click on one of these categories, the Turning Reports screen displays subheadings of specific report titles, and shows samples of each selected report.
Thirty-two reports are available for reporting on the entire audience, by individual participants, by groups, by standards, and on the basis of demographics. If you have specified correct answers or point values, you can “grade” participants and groups, verify that standards are met, and provide valuable feedback to participants.
View a Report
You can create reports using Turning Reports available in the Tools menu in the TurningPointRibbon.
This section describes how to:
• View a Report
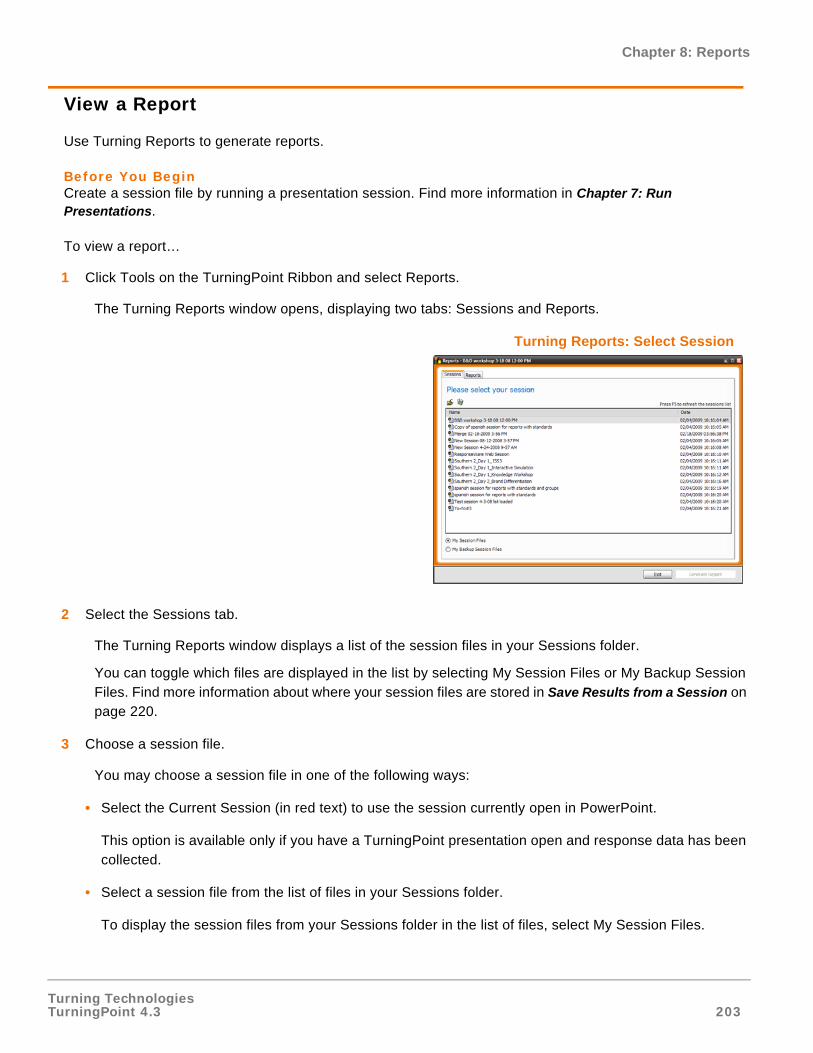
Turning TechnologiesTurningPoint 4.3 203
Chapter 8: Reports
View a Report
Use Turning Reports to generate reports.
Before You BeginCreate a session file by running a presentation session. Find more information in Chapter 7: Run Presentations.
To view a report…
1 Click Tools on the TurningPoint Ribbon and select Reports.
The Turning Reports window opens, displaying two tabs: Sessions and Reports.
Turning Reports: Select Session
2 Select the Sessions tab.
The Turning Reports window displays a list of the session files in your Sessions folder.
You can toggle which files are displayed in the list by selecting My Session Files or My Backup Session Files. Find more information about where your session files are stored in Save Results from a Session on page 220.
3 Choose a session file.
You may choose a session file in one of the following ways:
• Select the Current Session (in red text) to use the session currently open in PowerPoint.
This option is available only if you have a TurningPoint presentation open and response data has been collected.
• Select a session file from the list of files in your Sessions folder.
To display the session files from your Sessions folder in the list of files, select My Session Files.
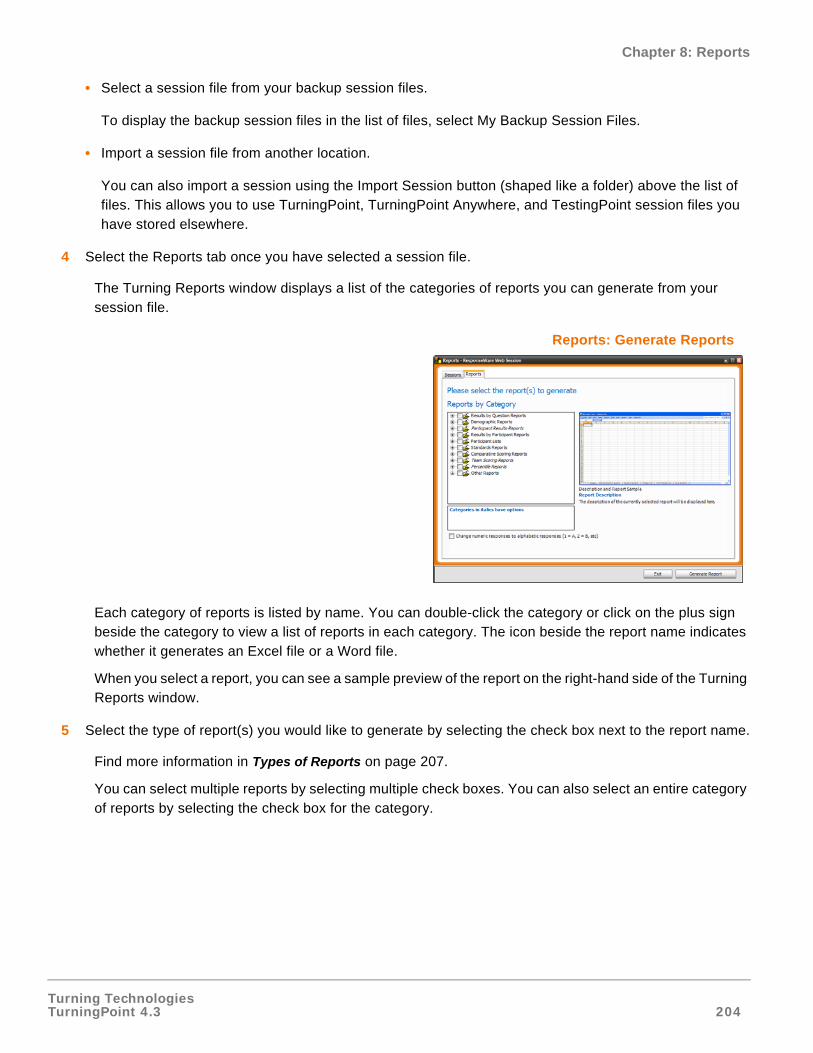
Turning TechnologiesTurningPoint 4.3 204
Chapter 8: Reports
• Select a session file from your backup session files.
To display the backup session files in the list of files, select My Backup Session Files.
• Import a session file from another location.
You can also import a session using the Import Session button (shaped like a folder) above the list of files. This allows you to use TurningPoint, TurningPoint Anywhere, and TestingPoint session files you have stored elsewhere.
4 Select the Reports tab once you have selected a session file.
The Turning Reports window displays a list of the categories of reports you can generate from your session file.
Reports: Generate Reports
Each category of reports is listed by name. You can double-click the category or click on the plus sign beside the category to view a list of reports in each category. The icon beside the report name indicates whether it generates an Excel file or a Word file.
When you select a report, you can see a sample preview of the report on the right-hand side of the Turning Reports window.
5 Select the type of report(s) you would like to generate by selecting the check box next to the report name.
Find more information in Types of Reports on page 207.
You can select multiple reports by selecting multiple check boxes. You can also select an entire category of reports by selecting the check box for the category.
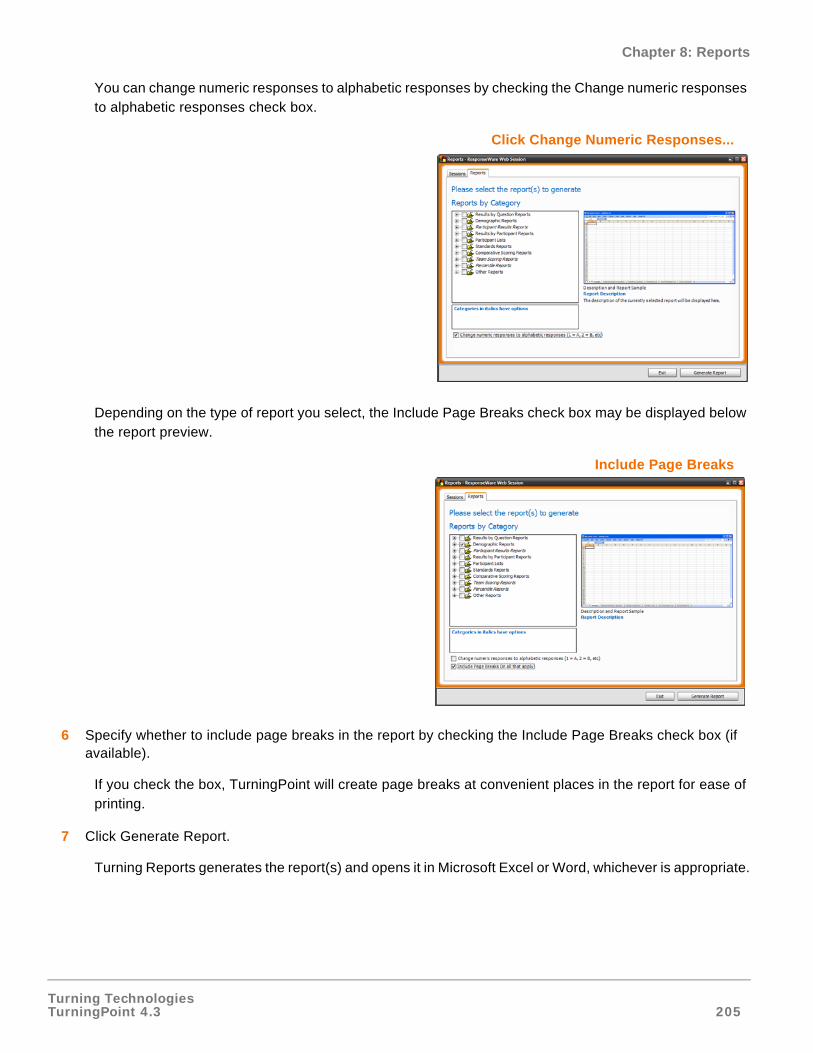
Turning TechnologiesTurningPoint 4.3 205
Chapter 8: Reports
You can change numeric responses to alphabetic responses by checking the Change numeric responses to alphabetic responses check box.
Click Change Numeric Responses...
Depending on the type of report you select, the Include Page Breaks check box may be displayed below the report preview.
Include Page Breaks
6 Specify whether to include page breaks in the report by checking the Include Page Breaks check box (if available).
If you check the box, TurningPoint will create page breaks at convenient places in the report for ease of printing.
7 Click Generate Report.
Turning Reports generates the report(s) and opens it in Microsoft Excel or Word, whichever is appropriate.
Turning TechnologiesTurningPoint 4.3 206
Chapter 8: Reports
This may take some time, especially if you selected to generate a large number of reports or if there are a large number of questions or participants in the session.
You can generate as many reports as you like. When one report is finished being created, select another type of report from the list and select the Generate Report button again.
8 When you are finished creating reports, select the Exit button to close the Turning Reports window.
Next StepsYou can use Excel or Word to edit, save, or print the reports.
Note If you selected to generate multiple reports, one Excel file is created with worksheets for each report.
Note Alternatively, you can generate a report by double clicking on the report name. Only that report will be generated. Any other reports that were selected will have to be generated by double clicking each report or selecting the Generate Report button to generate them all.

Turning TechnologiesTurningPoint 4.3 207
Chapter 8: Reports
Types of Reports
This section describes:
• Results by Question Reports (2 Reports)
• Demographic Reports (2 Reports)
• Participant Results Reports (4 Reports)
• Results by Participant Reports (4 Reports)
• Participant List Reports (2 Reports)
• Standards Reports (3 Reports)
• Comparative Scoring Reports (2 Reports)
• Team Scoring Reports (2 Reports)
• Percentile Reports (2 Reports)
• Other Reports (9 Reports)
• Attendance Report
• Comparative Links Report
• Discrimination/Difficulty Indexes Report
• Moment to Moment Report
• Outline Report
• Participant Questions and Comments Report
• Response Data Export Report
• Ranking Summary Report
• Results by Group Report
• Statistics Report

Turning TechnologiesTurningPoint 4.3 208
Chapter 8: Reports
Results by Question Reports
The Graphical Results by Question and Results by Question Reports show a summary of responses for each question. Each of these reports creates an Excel worksheet.
Graphical Results by Question ReportThe report includes the following information for each question:
• the answers
• an indication of the correct answer(s)
• the number of responses for each answer
• the percentage of responses for each answer
• pie chart with a percentage of the responses per answer
Results by Question ReportThe report includes the following information for each question:
• the answers
• an indication of the correct answer(s)
• the number of responses for each answer
• the percentage of responses for each answer
• the total count of participants that responded to the question
Turning TechnologiesTurningPoint 4.3 209
Chapter 8: Reports
Demographic Reports
The Demographic Comparison and Graphical Demographic Comparison Reports show a summary of responses for each question broken down by demographics. Each of these reports creates an Excel worksheet.
Demographic Comparison ReportThe Demographic Comparison Report includes the following information for each question:
• the answers
• an indication of the correct answer(s)
• the percentage of responses for each answer from each group
Graphical Demographic Comparison ReportThe Graphical Demographic Comparison includes the following information for each question:
• the answers
• an indication of the correct answer(s)
• the percentage of responses for each answer from each group
• a vertical bar chart of the responses for each answer from each group
When generating the Graphical Comparison Report, you have the option of creating page breaks between each question.
Turning TechnologiesTurningPoint 4.3 210
Chapter 8: Reports
Participant Results Reports
The Participant Results, Graded Participant Results (correct/incorrect), Graded Participant Results (point values), and Graded Participant Results (ratio) Reports show a detailed question by question breakdown of responses. When generating these reports you have the option of displaying the entire question or excluding the question text. There is also an option to display response times for the participants. Each of these reports creates an Excel worksheet.
Participant Results ReportThe report includes the following information for each participant:
• Device ID
• fields defined in the Participant List
• the numerical value of the participant’s response to each question
Graded Participant Results (correct/incorrect) ReportThe report includes the following information for each participant:
• Device ID
• fields defined in the Participant List
• the numerical value of the participant’s response to each question
• an indication of whether the response is correct or incorrect
• total percent correct
Graded Participant Results (point values) ReportThe report includes the following information for each participant:
• Device ID
• fields defined in the Participant List
• the numerical value of the participant’s response to each question
• an indication of whether the response is correct or incorrect
• the total number of points
Graded Participant Results (ratio) ReportThe report includes the following information for each participant:
• Device ID
• fields defined in the Participant List
• the numerical value of the participant’s response to each question
• an indication of whether the response is correct or incorrect
• the ratio of correct answers to total number of answers for each question
Turning TechnologiesTurningPoint 4.3 211
Chapter 8: Reports
Results by Participant Reports
The Results by Participant, Results by Participant (Answer Detail), Response by Participant (Response Detail), Results by Participant (Score Detail) show a detailed listing of responses for each question from each individual participant. Each of these reports create an Excel worksheet.
When generating these reports, you have the option of creating page breaks between each participant’s section. There is also an option to add the response times of the participants.
Results by Participant ReportThe report includes the following information for each participant for each question:
• the question
• the numerical value of the participant’s response
• an indication of whether the response is correct or incorrect
• the correct answer
Results by Participant (Answer Detail) ReportThe Answer Detail Report includes a complete list of answers for each question. The list enables you to match the numerical value of the participant’s response (number 1 or 2, etc.) to the actual answer (e.g. yes or no) and highlights the correct answer in green. The report also shows whether responses are correct or incorrect by marking them with a ‘c’ or an ‘i.’
Results by Participant (Response Detail) ReportThe Response Detail Report includes the question along with the participant’s response. The report displays correct answers in green, incorrect answers in red, the correct answer in brackets for incorrect answers, and calculates the percentage of correct answers and the total points accumulated by each participant.
Results by Participant (Score Detail) ReportThe Score Detail Report calculates the percentage of correct answers and total points accumulated by each participant.

Turning TechnologiesTurningPoint 4.3 212
Chapter 8: Reports
Participant List Reports
The Participant List Reports show the participant data from the Participant List in either an Excel worksheet or a Word document.
Participant List (Excel) ReportThe report shows Device ID and any of the fields defined in the Participant List (name, contact information, demographic groups or teams, etc.)
Participant List (Word) Report The report shows Device ID and any of the fields defined in the Participant List (name, contact information, demographic groups or teams, etc.)
Note If you selected to generate the Word document version of the Participant List along with any other report, the Word document is included as a worksheet in the Excel file.
Turning TechnologiesTurningPoint 4.3 213
Chapter 8: Reports
Standards Reports
The Group Standards, Individual, and Overall Standards Reports show response information based on standards identified for each question. Each of these reports creates an Excel worksheet.
Group Standards ReportThe Group Standards Report displays the percentage of correct responses from each group for each standard.
Individual Standards ReportThe Individual Standards Report includes the following information for each individual participant for each standard:
• the participant’s percentage of comprehension for all questions that are associated with the standard
• the questions associated with the standard
• the answers for each question
• an indication of the correct answer(s)
• an indication of the participant’s response and whether it was correct
When generating the Individual Standards Report, you have the option of creating page breaks between each participant’s section.
Overall Standards ReportThe Overall Standards Report is very similar to the Results by Question Report but includes additional information relating to standards. It includes the following information for each standard:
• the percentage of overall comprehension for all questions that are associated with the standard
• the questions associated with the standard
• the answers for each question
• an indication of the correct answer(s)
• the number of responses for each answer
• the total count of participants that responded to the question
• the percentage of responses for each answer
Turning TechnologiesTurningPoint 4.3 214
Chapter 8: Reports
Comparative Scoring Reports
The Individual Scoring and Scoring Distribution Reports show a summary of scoring information based on participant responses in comparison to other participants. Each of these reports creates an Excel worksheet.
Individual Scoring ReportThe Individual Scoring Report includes the following information for each participant:
• numeric response labeled correct or incorrect
• question’s overall percentage correct
• participant’s percentage score
• whether the participant’s score puts him/her above or below the class average
Scoring Distribution ReportThe Scoring Distribution Report includes the following information:
• the total number of participants
• the score ratios for assessment (number of correct answers to questions)
• the number of participants achieving each score ratio
• the answer value (correct, incorrect, points, no value, keywords)
• acceptable answer choices
• number of responses each answer received

Turning TechnologiesTurningPoint 4.3 215
Chapter 8: Reports
Team Scoring Reports
The Team Scoring (Percentage) and the Team Scoring (Points) Reports show overall team results, the correct answer for each questions, the number of responses per answer for each question, the results for each question, and the correct answer highlighted in green. While generating these reports, you have the option to exclude response details. Each of these reports creates an Excel worksheet.
Team Scoring (Percentage) ReportThe Team Scoring Percentage Report includes the following additional information:
• the answers
• the overall percentage of questions each team answered correctly
• the percentage of team members that answered each question correctly
Team Scoring (Points) ReportThe Team Scoring Points Report includes the following additional information:
• the answers
• the total points accumulated by each team
• the points each team received for every question
Turning TechnologiesTurningPoint 4.3 216
Chapter 8: Reports
Percentile Reports
The Percentile (correct/incorrect percentage) and Percentile (points) Reports show how participants’ responses. The reports include the Device ID, first and last name, and the percentile ranking for each participant grouped by percentiles. You can change the percentiles shown by entering the new percentiles separated by a semicolon in the appropriate box. Each of these reports creates an Excel worksheet.
Percentile (correct/incorrect percentage) ReportThe Percentile (correct/incorrect percentage) Report includes the following additional information:
• the total percentage of questions each participant answered correctly
Percentile (points) ReportThe Percentile (points) Report includes the following additional information:
• the total points accumulated by each participant
Turning TechnologiesTurningPoint 4.3 217
Chapter 8: Reports
Other Reports
The Other Reports option TurningPoint offers nine uncategorized reports: Attendance, Comparative Links, Participants Questions/Comments, Moment to Moment, Outline, Response Data Export, Ranking Summary, and Statistics Reports. Each of these reports with the exception of the Outline Report creates an Excel worksheet. The Outline Report creates a Word document.
Attendance ReportThe Attendance Report provides basic participant information, including name and Device ID, and shows who has attended the presentation.
Comparative Links ReportComparative Links report shows slide-by-slide comparison to reflect the corresponding comparative links slide in TurningPoint.
Discrimination/Difficulty Indexes ReportDisplays the discrimination/difficulty index on a per question basis. The indexes are determined by the number of correct responses in the upper half and lower half of the participants, divided by the total responses in the top and lower groups.
Formula for the Difficulty Index:
• D = Difficulty Index
• NH = Number of correct responses in the top 27%* (participants who responded with the most number of correct answers during the session)
• NL = Number of correct responses in lower 27%* (participants who responded with the least number of correct answers during the session)
• T = Number of total responses in the top and lower groups
• D = (NH + NL) / T
Formula for the Discrimination Index:
• D = Discrimination Index
• NH = Number of correct responses in the top 27%* (participants who responded with the most number of correct answers during the session)
• NL = Number of correct responses in lower 27%* (participants who responded with the least number of correct answers during the session)
• T = Number of total responses in the top and lower groups
• D = (NH - NL) / .5(T)
*If there is a tie determining the top and lower percentiles the participants will be sorted based on the Device ID of the response device.
Turning TechnologiesTurningPoint 4.3 218
Chapter 8: Reports
Moment to Moment ReportMoment to Moment Report shows a chart of the moment to moment rating results.
Outline ReportThe Outline Report provides an outline of slide questions and answers. The outline shows all answer values.
Participant Questions and Comments ReportThe Participant Questions and Comments Report shows any comments or questions sent by any participants during the presentation. The report includes the following additional information:
• time the presentation started and ended
• time the slides were polled
• time the presenter sent information to ResponseWare users
• time any participant sent a question or comment or indicated that they had a question or comment
Response Data Export ReportThe Response Data Export Report gives the raw response data. It creates a table of values displaying the numerical response values for each Device ID.
Ranking Summary ReportThe Ranking Summary Report shows a summary of Ranking Slides.
The Ranking Report includes the following information:
• a list of the ranking criteria
• a list of the ranked items and the rank assigned for each criterion
• the chart showing the ranking
Results by Group ReportThe Results by Group Report shows a summary of correct responses for each question by group.
The report includes the following information for each question:
• the answers
• an indication of the correct answer(s)
• the percentage of correct responses from each demographic group
Statistics ReportThe Statistics Report shows the overall correct percentage per participant versus the mean and median.
Turning TechnologiesTurningPoint 4.3 219
Chapter 9: Sessions
Sessions
TurningPoint creates session files whenever you run a TurningPoint presentation, and they are stored temporarily. You can, however, save the session in a file for later access. When you save a session, a default TurningPoint setting automatically includes the PowerPoint presentation with your TurningPoint file. You have the option to exclude the PowerPoint presentation from the TurningPoint session file. This function allows you to save only the TurningPoint results data without the presentation slides. If you do NOT wish to include the PowerPoint presentation in your TurningPoint session file, navigate to the Settings menu and, under the Misc settings, change “Include Presentation” from True to False.
Manage and Edit Sessions
With TurningPoint, you can stop and save a session, and pick up where you left off at a later time. You can also use a TurningPoint setting to create back-up files of your session. Knowing how to save and resume a session gives you greater flexibility during your presentation.
This section describes how to:
• Save Results from a Session
• Change the Default Save Location
• Continue a Previously Saved Session
• Edit Session Data
• Delete Results from a Session
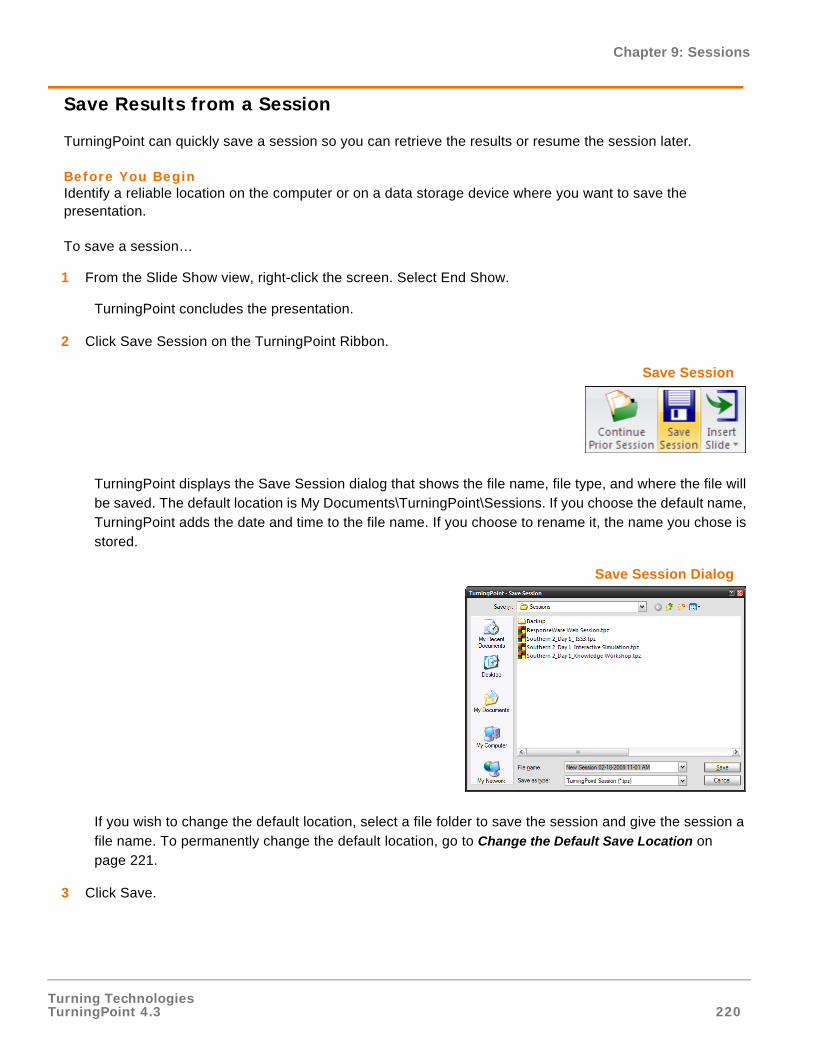
Turning TechnologiesTurningPoint 4.3 220
Chapter 9: Sessions
Save Results from a Session
TurningPoint can quickly save a session so you can retrieve the results or resume the session later.
Before You BeginIdentify a reliable location on the computer or on a data storage device where you want to save the presentation.
To save a session…
1 From the Slide Show view, right-click the screen. Select End Show.
TurningPoint concludes the presentation.
2 Click Save Session on the TurningPoint Ribbon.
Save Session
TurningPoint displays the Save Session dialog that shows the file name, file type, and where the file will be saved. The default location is My Documents\TurningPoint\Sessions. If you choose the default name, TurningPoint adds the date and time to the file name. If you choose to rename it, the name you chose is stored.
Save Session Dialog
If you wish to change the default location, select a file folder to save the session and give the session a file name. To permanently change the default location, go to Change the Default Save Location on page 221.
3 Click Save.
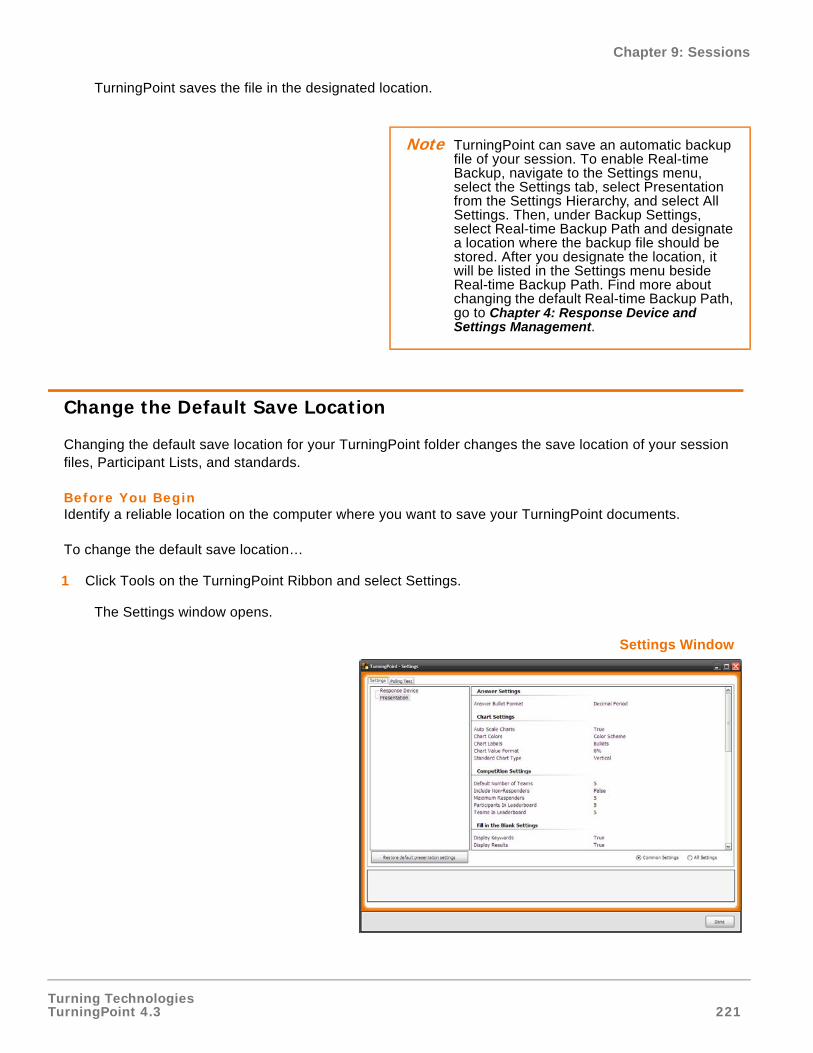
Turning TechnologiesTurningPoint 4.3 221
Chapter 9: Sessions
TurningPoint saves the file in the designated location.
Change the Default Save Location
Changing the default save location for your TurningPoint folder changes the save location of your session files, Participant Lists, and standards.
Before You BeginIdentify a reliable location on the computer where you want to save your TurningPoint documents.
To change the default save location…
1 Click Tools on the TurningPoint Ribbon and select Settings.
The Settings window opens.
Settings Window
Note TurningPoint can save an automatic backup file of your session. To enable Real-time Backup, navigate to the Settings menu, select the Settings tab, select Presentation from the Settings Hierarchy, and select All Settings. Then, under Backup Settings, select Real-time Backup Path and designate a location where the backup file should be stored. After you designate the location, it will be listed in the Settings menu beside Real-time Backup Path. Find more about changing the default Real-time Backup Path, go to Chapter 4: Response Device and Settings Management.
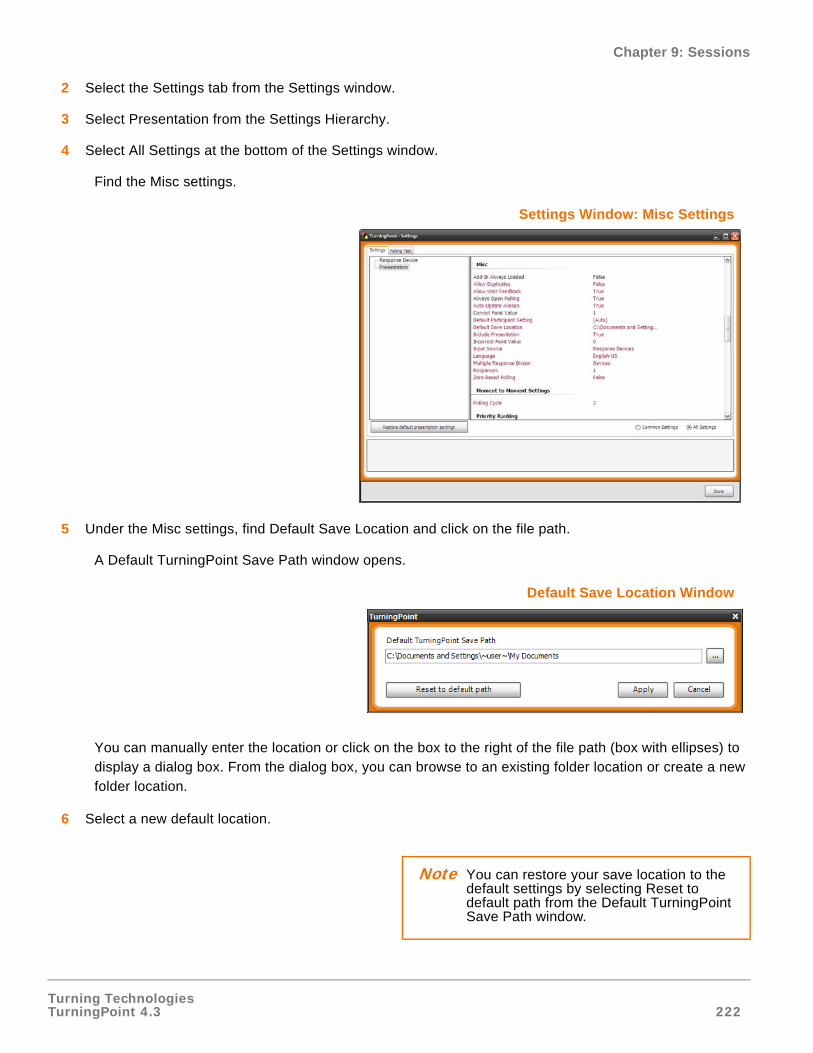
Turning TechnologiesTurningPoint 4.3 222
Chapter 9: Sessions
2 Select the Settings tab from the Settings window.
3 Select Presentation from the Settings Hierarchy.
4 Select All Settings at the bottom of the Settings window.
Find the Misc settings.
Settings Window: Misc Settings
5 Under the Misc settings, find Default Save Location and click on the file path.
A Default TurningPoint Save Path window opens.
Default Save Location Window
You can manually enter the location or click on the box to the right of the file path (box with ellipses) to display a dialog box. From the dialog box, you can browse to an existing folder location or create a new folder location.
6 Select a new default location.
Note You can restore your save location to the default settings by selecting Reset to default path from the Default TurningPoint Save Path window.
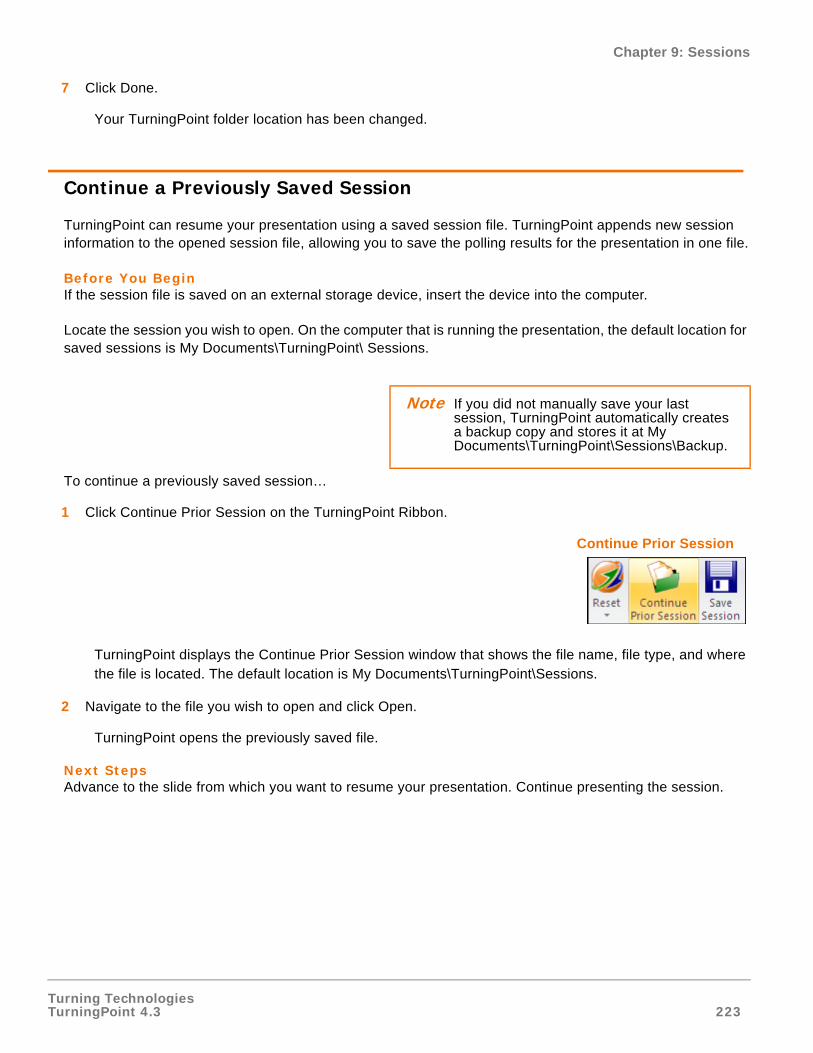
Turning TechnologiesTurningPoint 4.3 223
Chapter 9: Sessions
7 Click Done.
Your TurningPoint folder location has been changed.
Continue a Previously Saved Session
TurningPoint can resume your presentation using a saved session file. TurningPoint appends new session information to the opened session file, allowing you to save the polling results for the presentation in one file.
Before You BeginIf the session file is saved on an external storage device, insert the device into the computer.
Locate the session you wish to open. On the computer that is running the presentation, the default location for saved sessions is My Documents\TurningPoint\ Sessions.
To continue a previously saved session…
1 Click Continue Prior Session on the TurningPoint Ribbon.
Continue Prior Session
TurningPoint displays the Continue Prior Session window that shows the file name, file type, and where the file is located. The default location is My Documents\TurningPoint\Sessions.
2 Navigate to the file you wish to open and click Open.
TurningPoint opens the previously saved file.
Next StepsAdvance to the slide from which you want to resume your presentation. Continue presenting the session.
Note If you did not manually save your last session, TurningPoint automatically creates a backup copy and stores it at My Documents\TurningPoint\Sessions\Backup.
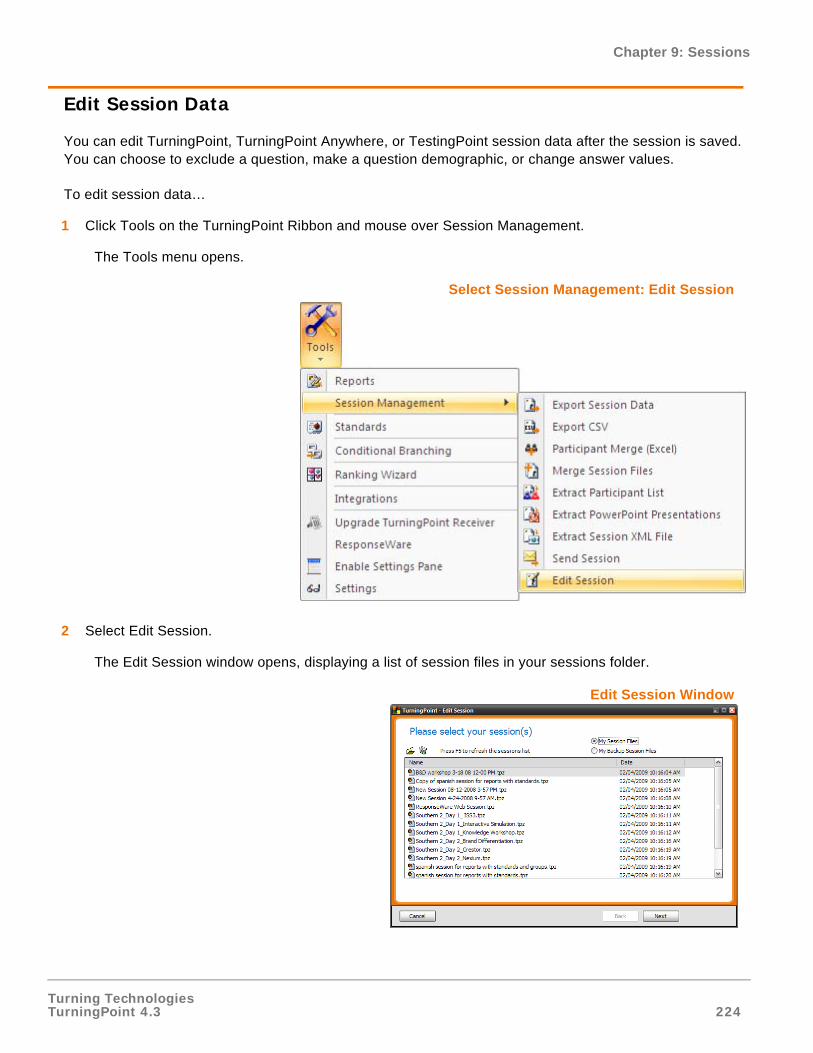
Turning TechnologiesTurningPoint 4.3 224
Chapter 9: Sessions
Edit Session Data
You can edit TurningPoint, TurningPoint Anywhere, or TestingPoint session data after the session is saved. You can choose to exclude a question, make a question demographic, or change answer values.
To edit session data…
1 Click Tools on the TurningPoint Ribbon and mouse over Session Management.
The Tools menu opens.
Select Session Management: Edit Session
2 Select Edit Session.
The Edit Session window opens, displaying a list of session files in your sessions folder.
Edit Session Window
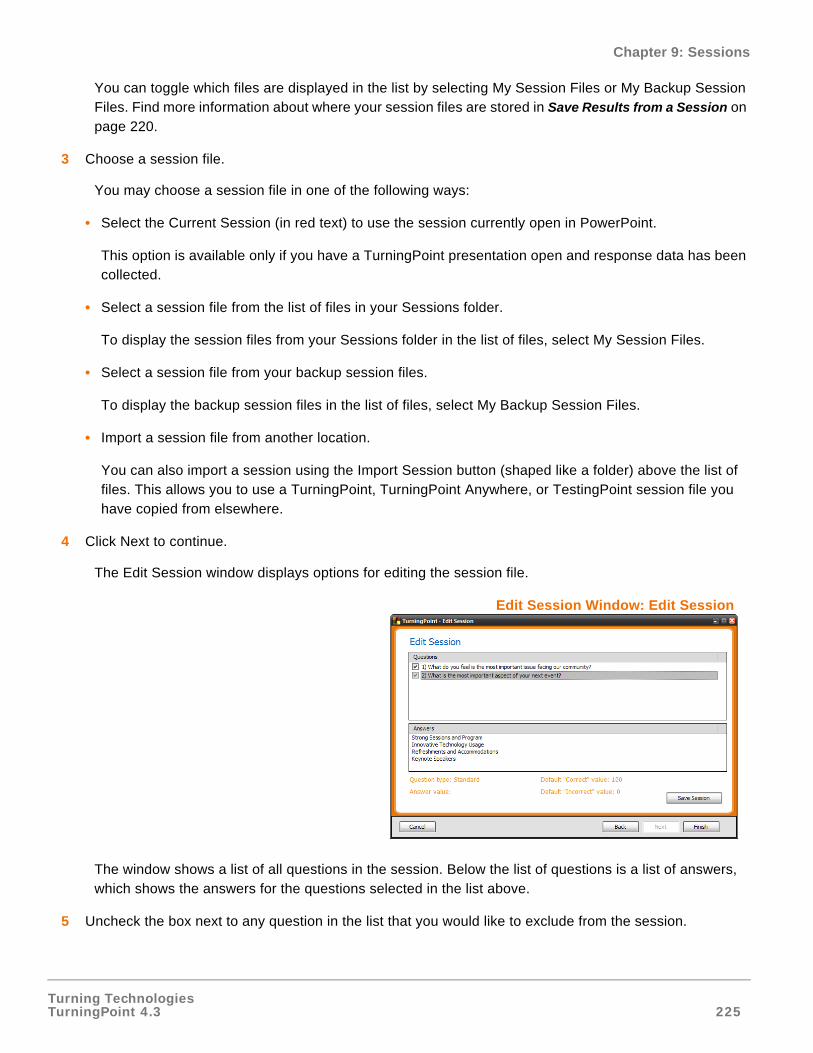
Turning TechnologiesTurningPoint 4.3 225
Chapter 9: Sessions
You can toggle which files are displayed in the list by selecting My Session Files or My Backup Session Files. Find more information about where your session files are stored in Save Results from a Session on page 220.
3 Choose a session file.
You may choose a session file in one of the following ways:
• Select the Current Session (in red text) to use the session currently open in PowerPoint.
This option is available only if you have a TurningPoint presentation open and response data has been collected.
• Select a session file from the list of files in your Sessions folder.
To display the session files from your Sessions folder in the list of files, select My Session Files.
• Select a session file from your backup session files.
To display the backup session files in the list of files, select My Backup Session Files.
• Import a session file from another location.
You can also import a session using the Import Session button (shaped like a folder) above the list of files. This allows you to use a TurningPoint, TurningPoint Anywhere, or TestingPoint session file you have copied from elsewhere.
4 Click Next to continue.
The Edit Session window displays options for editing the session file.
Edit Session Window: Edit Session
The window shows a list of all questions in the session. Below the list of questions is a list of answers, which shows the answers for the questions selected in the list above.
5 Uncheck the box next to any question in the list that you would like to exclude from the session.
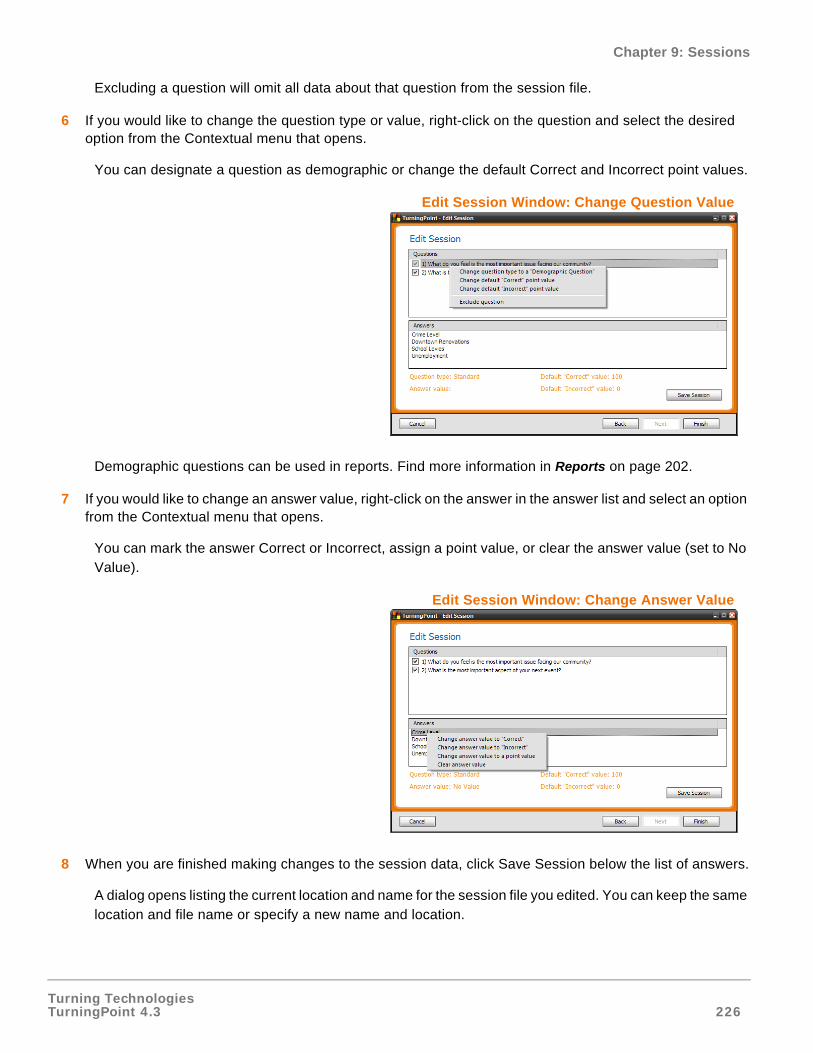
Turning TechnologiesTurningPoint 4.3 226
Chapter 9: Sessions
Excluding a question will omit all data about that question from the session file.
6 If you would like to change the question type or value, right-click on the question and select the desired option from the Contextual menu that opens.
You can designate a question as demographic or change the default Correct and Incorrect point values.
Edit Session Window: Change Question Value
Demographic questions can be used in reports. Find more information in Reports on page 202.
7 If you would like to change an answer value, right-click on the answer in the answer list and select an option from the Contextual menu that opens.
You can mark the answer Correct or Incorrect, assign a point value, or clear the answer value (set to No Value).
Edit Session Window: Change Answer Value
8 When you are finished making changes to the session data, click Save Session below the list of answers.
A dialog opens listing the current location and name for the session file you edited. You can keep the same location and file name or specify a new name and location.
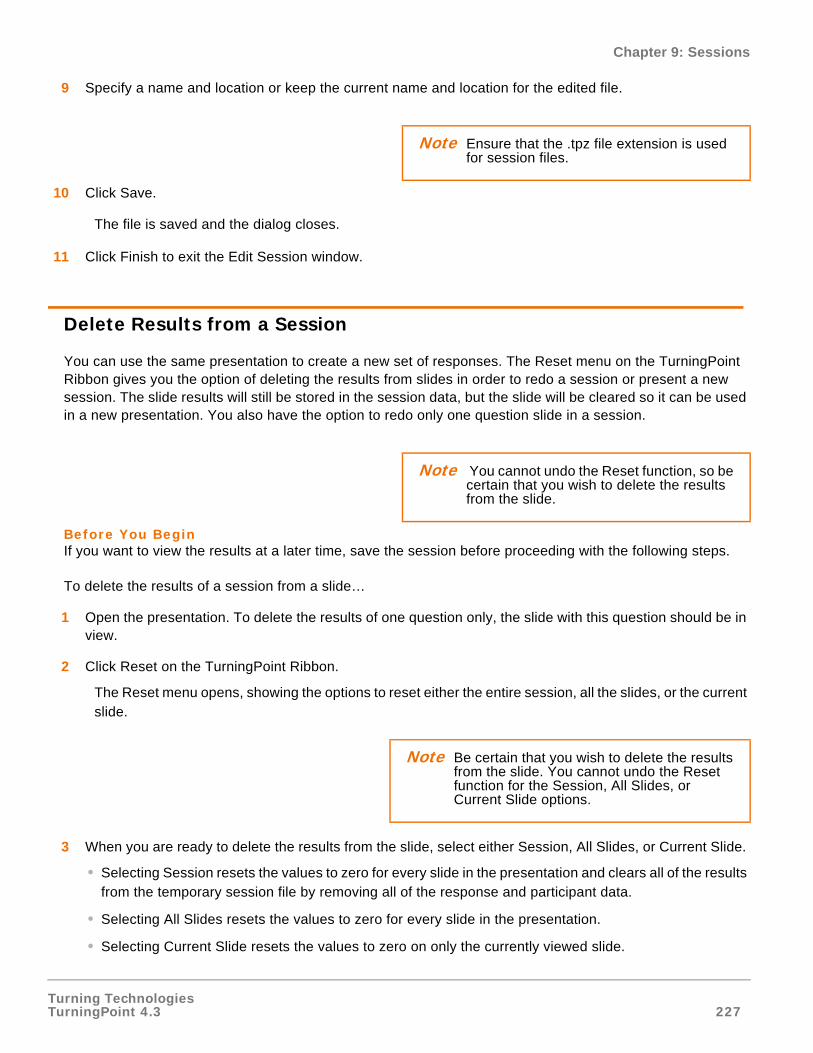
Turning TechnologiesTurningPoint 4.3 227
Chapter 9: Sessions
9 Specify a name and location or keep the current name and location for the edited file.
10 Click Save.
The file is saved and the dialog closes.
11 Click Finish to exit the Edit Session window.
Delete Results from a Session
You can use the same presentation to create a new set of responses. The Reset menu on the TurningPoint Ribbon gives you the option of deleting the results from slides in order to redo a session or present a new session. The slide results will still be stored in the session data, but the slide will be cleared so it can be used in a new presentation. You also have the option to redo only one question slide in a session.
Before You BeginIf you want to view the results at a later time, save the session before proceeding with the following steps.
To delete the results of a session from a slide…
1 Open the presentation. To delete the results of one question only, the slide with this question should be in view.
2 Click Reset on the TurningPoint Ribbon.
The Reset menu opens, showing the options to reset either the entire session, all the slides, or the current slide.
3 When you are ready to delete the results from the slide, select either Session, All Slides, or Current Slide.
• Selecting Session resets the values to zero for every slide in the presentation and clears all of the results from the temporary session file by removing all of the response and participant data.
• Selecting All Slides resets the values to zero for every slide in the presentation.
• Selecting Current Slide resets the values to zero on only the currently viewed slide.
Note Ensure that the .tpz file extension is used for session files.
Note You cannot undo the Reset function, so be certain that you wish to delete the results from the slide.
Note Be certain that you wish to delete the results from the slide. You cannot undo the Reset function for the Session, All Slides, or Current Slide options.
Turning TechnologiesTurningPoint 4.3 228
Chapter 10: Export
Export
When you complete a session, you save the data in a TurningPoint session file (extension.tpz). Find more information on how to save a session in Save Results from a Session on page 220.
The session file contains all the information about your presentation, including the questions and answers, the response data, and the Participant List. This information is used to generate reports (find more information in Reports on page 202).
Session files and can be merged with other session files, and Participant Lists with other Participants Lists to show aggregated results from your presentations. TurningPoint also allows you to share and extract the information in your TurningPoint, TurningPoint Anywhere, or TestingPoint session files by exporting the data into several formats.
This section describes how to:
• Export Session Data
• Export Session Data as a CSV File
• Export Results Data to a Learning Management System (LMS)
• Merge Participant List
• Merge Session Files
• Extract Participant List
• Extract PowerPoint Presentation
• Extract Session Data as XML
• E-mail Session
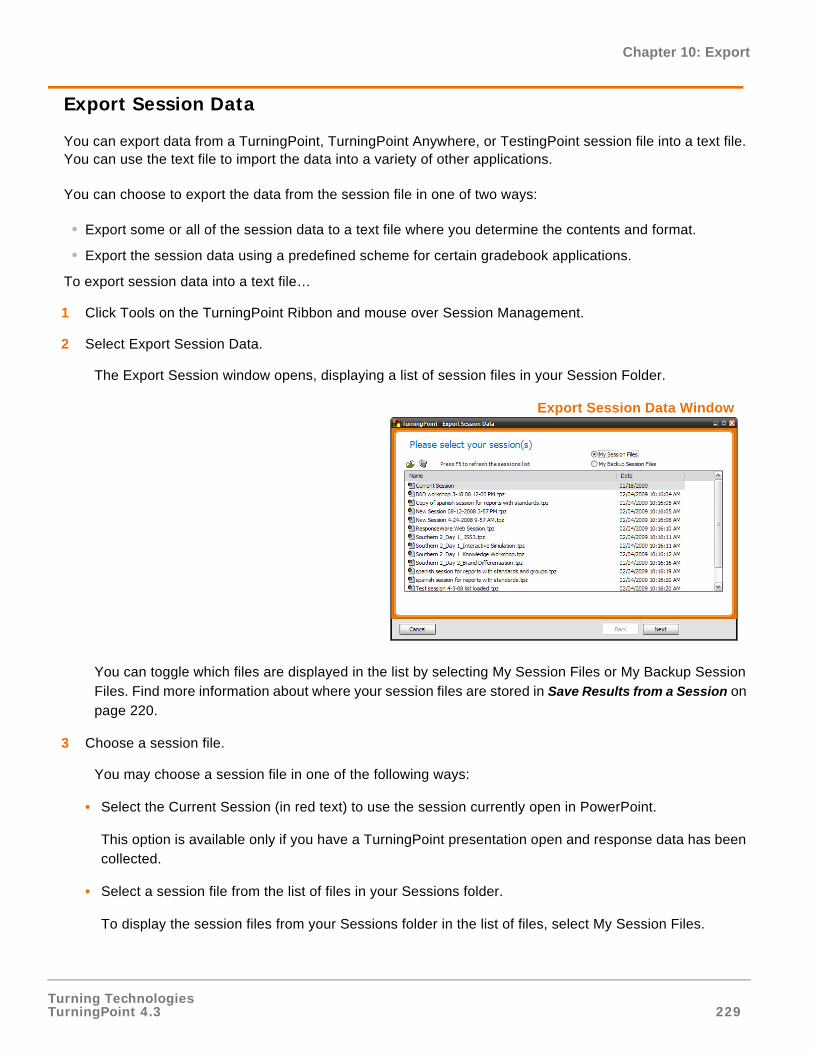
Turning TechnologiesTurningPoint 4.3 229
Chapter 10: Export
Export Session Data
You can export data from a TurningPoint, TurningPoint Anywhere, or TestingPoint session file into a text file. You can use the text file to import the data into a variety of other applications.
You can choose to export the data from the session file in one of two ways:
• Export some or all of the session data to a text file where you determine the contents and format.
• Export the session data using a predefined scheme for certain gradebook applications.
To export session data into a text file…
1 Click Tools on the TurningPoint Ribbon and mouse over Session Management.
2 Select Export Session Data.
The Export Session window opens, displaying a list of session files in your Session Folder.
Export Session Data Window
You can toggle which files are displayed in the list by selecting My Session Files or My Backup Session Files. Find more information about where your session files are stored in Save Results from a Session on page 220.
3 Choose a session file.
You may choose a session file in one of the following ways:
• Select the Current Session (in red text) to use the session currently open in PowerPoint.
This option is available only if you have a TurningPoint presentation open and response data has been collected.
• Select a session file from the list of files in your Sessions folder.
To display the session files from your Sessions folder in the list of files, select My Session Files.
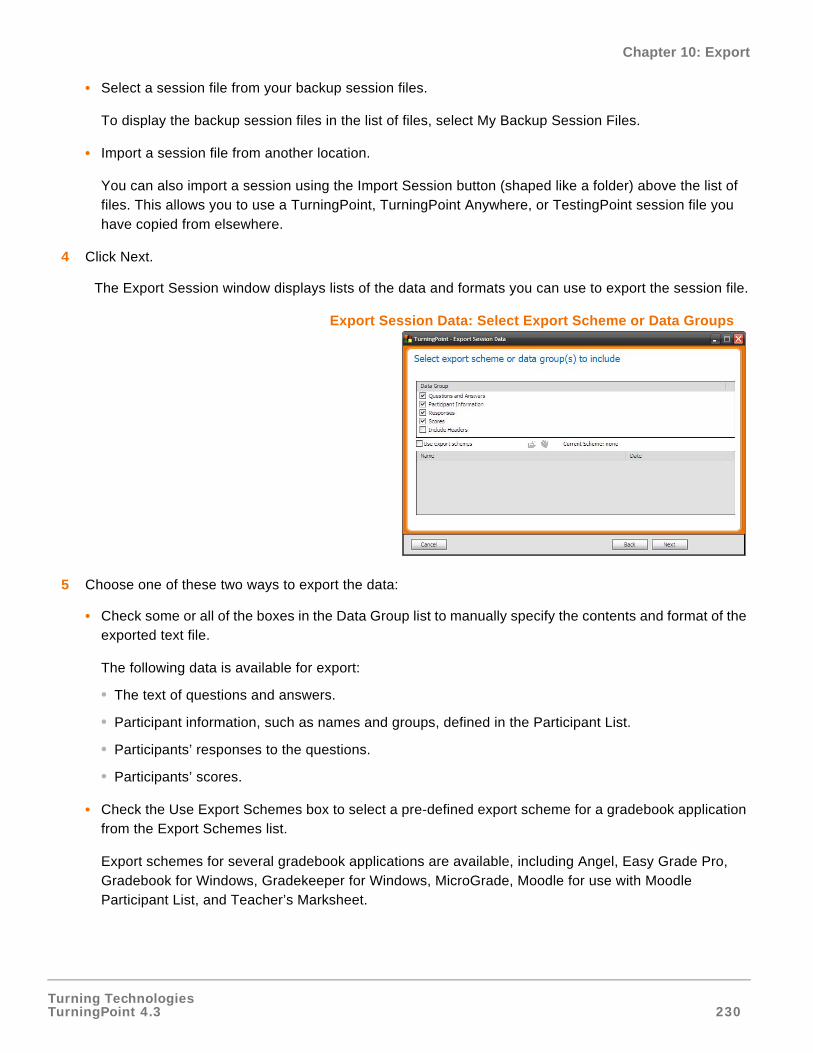
Turning TechnologiesTurningPoint 4.3 230
Chapter 10: Export
• Select a session file from your backup session files.
To display the backup session files in the list of files, select My Backup Session Files.
• Import a session file from another location.
You can also import a session using the Import Session button (shaped like a folder) above the list of files. This allows you to use a TurningPoint, TurningPoint Anywhere, or TestingPoint session file you have copied from elsewhere.
4 Click Next.
The Export Session window displays lists of the data and formats you can use to export the session file.
Export Session Data: Select Export Scheme or Data Groups
5 Choose one of these two ways to export the data:
• Check some or all of the boxes in the Data Group list to manually specify the contents and format of the exported text file.
The following data is available for export:
• The text of questions and answers.
• Participant information, such as names and groups, defined in the Participant List.
• Participants’ responses to the questions.
• Participants’ scores.
• Check the Use Export Schemes box to select a pre-defined export scheme for a gradebook application from the Export Schemes list.
Export schemes for several gradebook applications are available, including Angel, Easy Grade Pro, Gradebook for Windows, Gradekeeper for Windows, MicroGrade, Moodle for use with Moodle Participant List, and Teacher’s Marksheet.
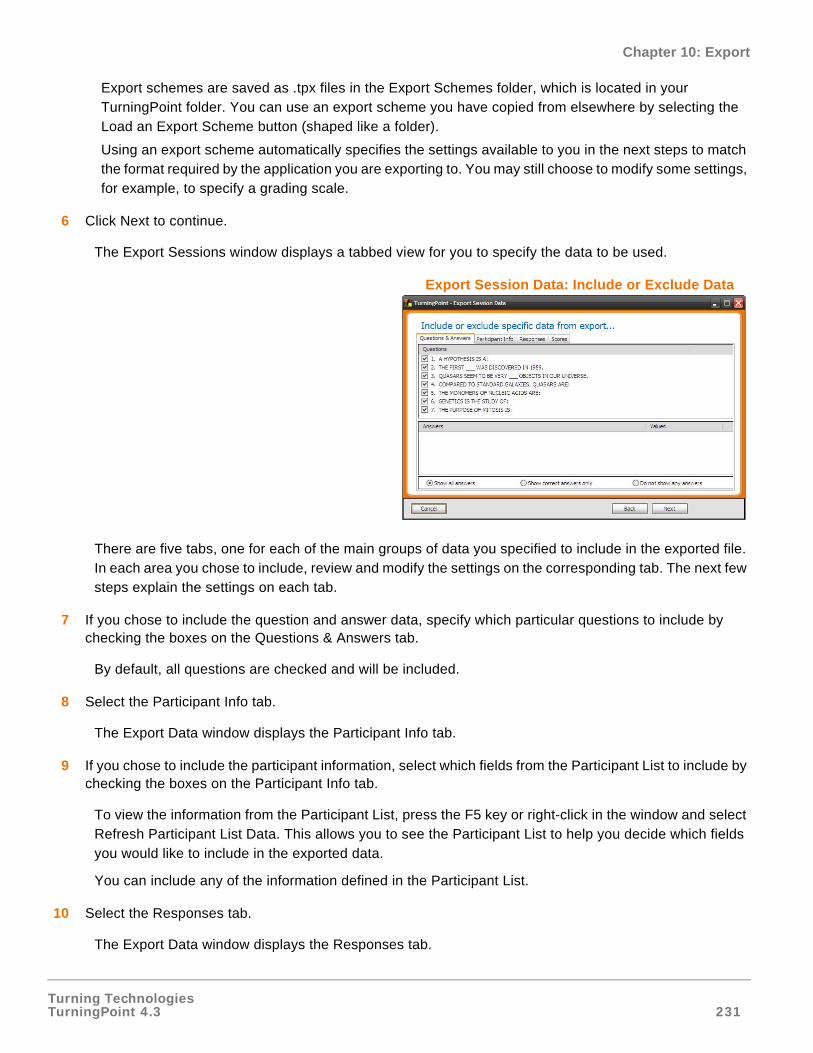
Turning TechnologiesTurningPoint 4.3 231
Chapter 10: Export
Export schemes are saved as .tpx files in the Export Schemes folder, which is located in your TurningPoint folder. You can use an export scheme you have copied from elsewhere by selecting the Load an Export Scheme button (shaped like a folder).
Using an export scheme automatically specifies the settings available to you in the next steps to match the format required by the application you are exporting to. You may still choose to modify some settings, for example, to specify a grading scale.
6 Click Next to continue.
The Export Sessions window displays a tabbed view for you to specify the data to be used.
Export Session Data: Include or Exclude Data
There are five tabs, one for each of the main groups of data you specified to include in the exported file. In each area you chose to include, review and modify the settings on the corresponding tab. The next few steps explain the settings on each tab.
7 If you chose to include the question and answer data, specify which particular questions to include by checking the boxes on the Questions & Answers tab.
By default, all questions are checked and will be included.
8 Select the Participant Info tab.
The Export Data window displays the Participant Info tab.
9 If you chose to include the participant information, select which fields from the Participant List to include by checking the boxes on the Participant Info tab.
To view the information from the Participant List, press the F5 key or right-click in the window and select Refresh Participant List Data. This allows you to see the Participant List to help you decide which fields you would like to include in the exported data.
You can include any of the information defined in the Participant List.
10 Select the Responses tab.
The Export Data window displays the Responses tab.
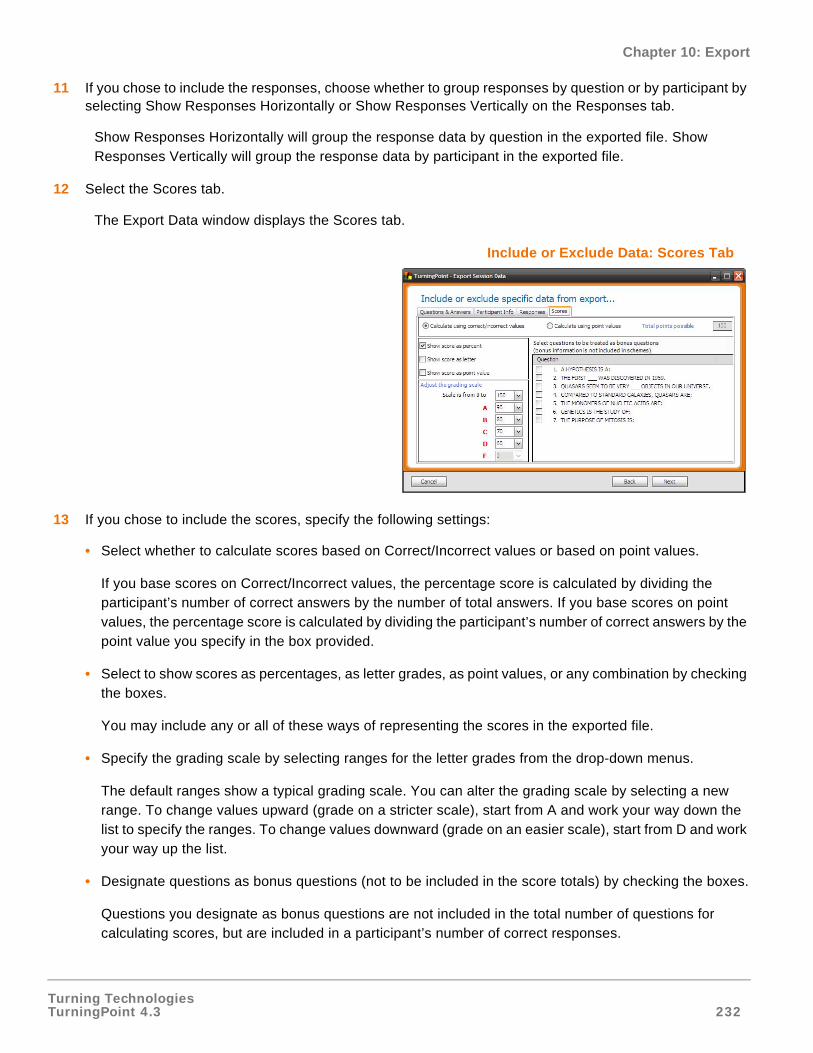
Turning TechnologiesTurningPoint 4.3 232
Chapter 10: Export
11 If you chose to include the responses, choose whether to group responses by question or by participant by selecting Show Responses Horizontally or Show Responses Vertically on the Responses tab.
Show Responses Horizontally will group the response data by question in the exported file. Show Responses Vertically will group the response data by participant in the exported file.
12 Select the Scores tab.
The Export Data window displays the Scores tab.
Include or Exclude Data: Scores Tab
13 If you chose to include the scores, specify the following settings:
• Select whether to calculate scores based on Correct/Incorrect values or based on point values.
If you base scores on Correct/Incorrect values, the percentage score is calculated by dividing the participant’s number of correct answers by the number of total answers. If you base scores on point values, the percentage score is calculated by dividing the participant’s number of correct answers by the point value you specify in the box provided.
• Select to show scores as percentages, as letter grades, as point values, or any combination by checking the boxes.
You may include any or all of these ways of representing the scores in the exported file.
• Specify the grading scale by selecting ranges for the letter grades from the drop-down menus.
The default ranges show a typical grading scale. You can alter the grading scale by selecting a new range. To change values upward (grade on a stricter scale), start from A and work your way down the list to specify the ranges. To change values downward (grade on an easier scale), start from D and work your way up the list.
• Designate questions as bonus questions (not to be included in the score totals) by checking the boxes.
Questions you designate as bonus questions are not included in the total number of questions for calculating scores, but are included in a participant’s number of correct responses.
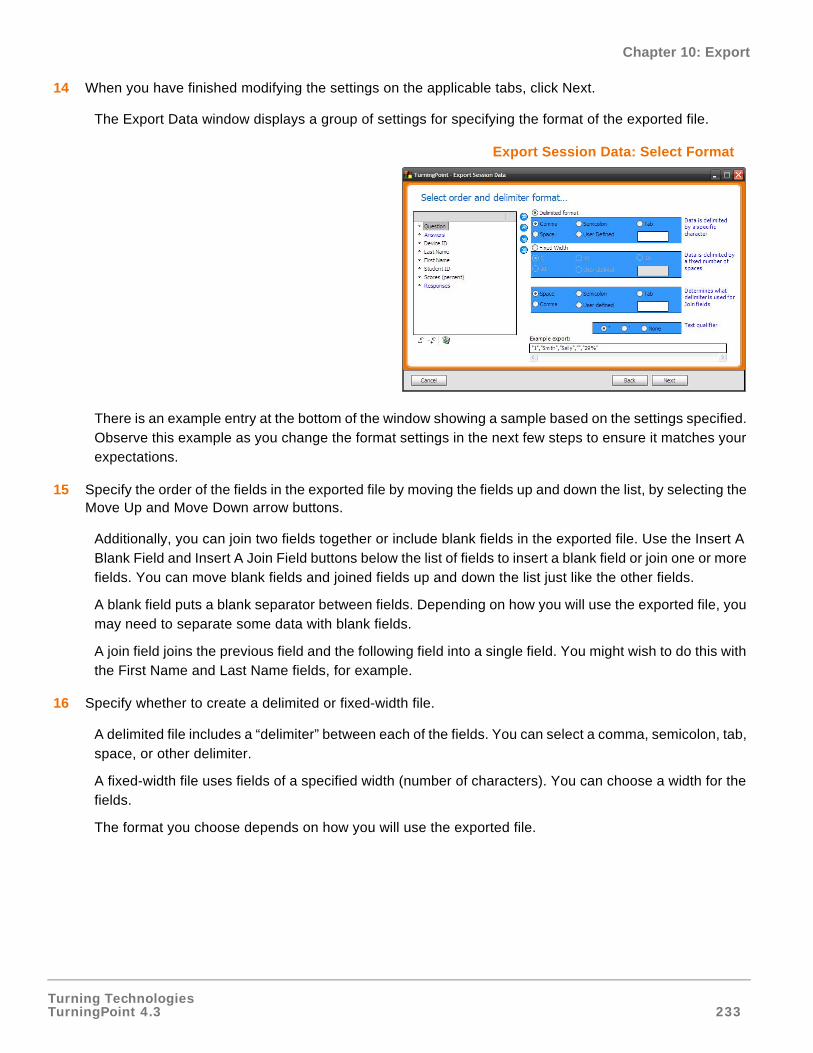
Turning TechnologiesTurningPoint 4.3 233
Chapter 10: Export
14 When you have finished modifying the settings on the applicable tabs, click Next.
The Export Data window displays a group of settings for specifying the format of the exported file.
Export Session Data: Select Format
There is an example entry at the bottom of the window showing a sample based on the settings specified. Observe this example as you change the format settings in the next few steps to ensure it matches your expectations.
15 Specify the order of the fields in the exported file by moving the fields up and down the list, by selecting the Move Up and Move Down arrow buttons.
Additionally, you can join two fields together or include blank fields in the exported file. Use the Insert A Blank Field and Insert A Join Field buttons below the list of fields to insert a blank field or join one or more fields. You can move blank fields and joined fields up and down the list just like the other fields.
A blank field puts a blank separator between fields. Depending on how you will use the exported file, you may need to separate some data with blank fields.
A join field joins the previous field and the following field into a single field. You might wish to do this with the First Name and Last Name fields, for example.
16 Specify whether to create a delimited or fixed-width file.
A delimited file includes a “delimiter” between each of the fields. You can select a comma, semicolon, tab, space, or other delimiter.
A fixed-width file uses fields of a specified width (number of characters). You can choose a width for the fields.
The format you choose depends on how you will use the exported file.
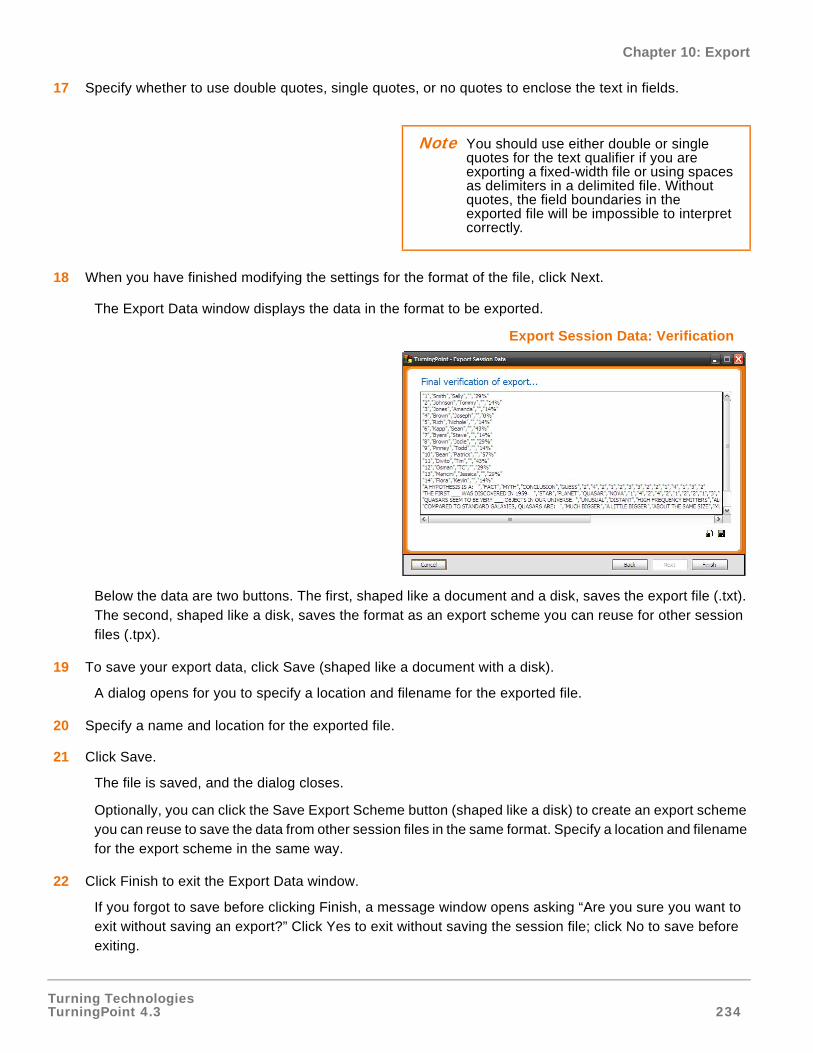
Turning TechnologiesTurningPoint 4.3 234
Chapter 10: Export
17 Specify whether to use double quotes, single quotes, or no quotes to enclose the text in fields.
18 When you have finished modifying the settings for the format of the file, click Next.
The Export Data window displays the data in the format to be exported.
Export Session Data: Verification
Below the data are two buttons. The first, shaped like a document and a disk, saves the export file (.txt). The second, shaped like a disk, saves the format as an export scheme you can reuse for other session files (.tpx).
19 To save your export data, click Save (shaped like a document with a disk).
A dialog opens for you to specify a location and filename for the exported file.
20 Specify a name and location for the exported file.
21 Click Save.
The file is saved, and the dialog closes.
Optionally, you can click the Save Export Scheme button (shaped like a disk) to create an export scheme you can reuse to save the data from other session files in the same format. Specify a location and filename for the export scheme in the same way.
22 Click Finish to exit the Export Data window.
If you forgot to save before clicking Finish, a message window opens asking “Are you sure you want to exit without saving an export?” Click Yes to exit without saving the session file; click No to save before exiting.
Note You should use either double or single quotes for the text qualifier if you are exporting a fixed-width file or using spaces as delimiters in a delimited file. Without quotes, the field boundaries in the exported file will be impossible to interpret correctly.

Turning TechnologiesTurningPoint 4.3 235
Chapter 10: Export
Export Session Data as a CSV File
You can export data from a TurningPoint, TurningPoint Anywhere, or TestingPoint session file into a text file. You can use the text file to import the data into a variety of other applications.
1 Click Tools on the TurningPoint Ribbon and mouse over Session Management.
2 Select Export CSV.
The Select a Session window opens, displaying a list of session files in your Session Folder.
Find more information about where your session files are stored in Save Results from a Session on page 220.
3 Select a session to export to CSV.
4 Choose the format to export the CSV data in.
5 Click Export.
6 Specify a name and location for the exported file.
7 Click Save.
The file is saved, and the dialog closes. A confirmation will be displayed that the data was exported successfully.
8 Click OK to close the confirmation box.
Export Results Data to a Learning Management System (LMS)
TurningPoint has been integrated with the following Learning Management Systems.
• Blackboard (7, 8, and 9)
• WebCT (CE 6.0, Vista 3, 4, or 8)
• Sakai
• Moodle
• Performance Matters
For instructions on exporting to a LMS, please refer to the LMS User guide downloaded from the Turning Technologies website.
Turning TechnologiesTurningPoint 4.3 236
Chapter 10: Export
Merge Participant List
Participant Merge allows you to combine participant results of multiple Participant Lists with multiple sessions to generate a report based on a common field (Student ID, Device ID, etc.). The report shows the total scores of the sessions in an Excel file.
To merge Participant Lists…
1 Click Tools on the TurningPoint Ribbon and mouse over Session Management.
2 Select Participant Merge (Excel).
Participant Merge window opens.
Initially, the left pane is empty. This is where your new column and sessions to be merged will be displayed. Above the left pane is the Available Fields for Merge drop-down box. Below the left pane is the Add Column text box and button. The right pane displays all of the sessions available to be merged. Above the right pane are the Percentage Correct and Points radio buttons.
3 Add a Column.
TurningPoint displays the percentage correct or points in the added column when the sessions are merged.
4 Select the sessions you want to merge from the list of sessions.
Highlight the sessions and use the left (<) button to add the sessions to your column. Use the right (>) to remove sessions from your column.
When selecting session files, hold Shift to select multiple contiguous sessions, or Control to select multiple sessions.
• Select the Current Session (in red text) to use the session currently open in PowerPoint.
This option is available only if you have a TurningPoint presentation open and response data has been collected.
• Select a session file from the list of files in your Sessions folder.
To display the session files from your Sessions folder in the list of files, select My Session Files.
• Import a session file from another location.
Note Alternatively, double-click a session to add it to your column.

Turning TechnologiesTurningPoint 4.3 237
Chapter 10: Export
You can also import a session using the Import Session button (shaped like a folder) above the list of files. This allows you to use a TurningPoint, TurningPoint Anywhere, or TestingPoint session file you have copied from elsewhere.
5 Alternately, remove all of the columns by selecting the button that looks like a trash can.
6 Select the Field you want to merge the Participants Lists under from the Available Fields for Merge drop-down menu.
The sessions will be merged based on the selected value. Only fields that are common between the Participant Lists will be available from the drop-down menu.
7 Select whether the report should display the Percentage Correct or Points.
8 Click Merge.
TurningPoint generates a report in an excel file.
Merge Session Files
You can merge multiple TurningPoint, TurningPoint Anywhere, or TestingPoint session files together to create a single session file, from which you can generate reports and extract data.
This is especially useful if you have session files from multiple presentations given to the same participants. You can aggregate the data from all the presentations into a single file with all the responses from each participant.
Conversely, if you gave the same presentation to several groups of participants, you could aggregate the responses from all participants into a single session file.
Before You BeginThe Import Session button allows you to import session files into your Sessions file (as described in step 3). The list of sessions to choose from in the Merge Session Files window lists the files in your sessions folder.
To merge session files…
1 Click Tools on the TurningPoint Ribbon and mouse over Session Management.
2 Select Merge Session Files.
The Merge Session Files window opens and displays a list of session files in your Sessions folder.
Note Alternatively, double-click on a session to remove it from your column.
Turning TechnologiesTurningPoint 4.3 238
Chapter 10: Export
You can toggle which files are displayed in the list by selecting My Session Files or My Backup Session Files. Find more information about where your session files are stored in Save Results from a Session on page 220.
3 Choose a session file to be merged.
You may choose a session file in one of the following ways:
• Select the Current Session (in red text) to use the session currently open in PowerPoint.
This option is available only if you have a TurningPoint presentation open and response data has been collected.
• Select a session file from the list of files in your Sessions folder.
To display the session files from your Sessions folder in the list of files, select My Session Files.
• Select a session file from your backup session files.
To display the backup session files in the list of files, select My Backup Session Files.
• Import a session file from another location.
You can also import a session using the Import Session button (shaped like a folder) above the list of files. This allows you to use a TurningPoint, TurningPoint Anywhere, or TestingPoint session file you have saved elsewhere. Unless you originally created the session in TurningPoint, TurningPoint Anywhere, or TestingPoint, the session files will not hold a PowerPoint presentation file.
4 Select additional files to be merged in the list by holding Shift to select multiple contiguous files, or Control to select multiple files.
Repeat this step until all the files you would like to merge are selected.
5 Optionally, check the box to include the PowerPoint presentations in the merged session file.
If you include the presentations in the merged session file, the slides from the presentations of each of the merged files are put together into a single presentation saved in the merged session file. This may greatly increase the size of the merged session file.
6 Click Merge below the list of files.
A dialog opens for you to specify a location and filename for the merged session file.
7 Specify a name and location for the exported file.
8 Click Save.
The file is saved, and the dialog closes.
Note Ensure that the .tpz file extension is used for session files.
Turning TechnologiesTurningPoint 4.3 239
Chapter 10: Export
You can access TurningPoint Reports by selecting Open TurningPoint Reports located next to the Finish button.
9 Click Finish to exit the Merge Session Files window.
Extract Participant List
You can extract the Participant List from a TurningPoint, TurningPoint Anywhere, or TestingPoint session file. This is especially useful if you have a session file but have lost the Participant List file or if you set up the list on a different computer.
To extract a Participant List…
1 Click Tools on the TurningPoint Ribbon and mouse over Session Management.
2 Select Extract Participant List.
The Extract Participant List window opens to display the session files in your Sessions folder.
You can toggle which files are displayed in the list by selecting My Session Files or My Backup Session Files. Find more information about where your session files are stored in Save Results from a Session on page 220.
3 Choose a session file.
You may choose a session file in one of the following ways:
• Select the Current Session (in red text) to use the session currently open in PowerPoint.
This option is available only if you have a TurningPoint presentation open and response data has been collected.
• Select a session file from the list of files in your Sessions folder.
To display the session files from your Sessions folder in the list of files, select My Session Files.
• Select a session file from your backup session files.
To display the backup session files in the list of files, select My Backup Session Files.
• Import a session file from another location.
You can also import a session using the Import Session button (shaped like a folder) above the list of files. This allows you to use TurningPoint session files you have saved elsewhere.
4 Select the Extract Participant List button below the list of files.
A dialog opens for you to specify a location and filename for the Participant List file.
Turning TechnologiesTurningPoint 4.3 240
Chapter 10: Export
5 Specify a name and location for the exported file.
6 Click Save.
The file is saved, and the dialog closes.
7 Click Finish to exit the Extract Participant List window.
Next StepsYou can now edit the Participant List or use it in a presentation. Find more information in Chapter 5: Track Participants and Teams.
Extract PowerPoint Presentation
You can extract the PowerPoint presentation from a session file. This is especially useful if you have a session file but have lost the corresponding PowerPoint presentation or if you created the presentation on a different computer.
To extract a PowerPoint presentation…
1 Click Tools on the TurningPoint Ribbon and mouse over Session Management.
2 Select Extract PowerPoint Presentations.
The Extract PowerPoint Presentations window opens to display a list of the session files in your Sessions folder.
You can toggle which files are displayed in the list by selecting My Session Files or My Backup Session Files. Find more information about where your session files are stored in Save Results from a Session on page 220.
3 Choose a session file.
You may choose a session file in one of the following ways:
• Select the Current Session (in red text) to use the session currently open in PowerPoint.
This option is available only if you have a TurningPoint presentation open and response data has been collected.
• Select a session file from the list of files in your Sessions folder.
To display the session files from your Sessions folder in the list of files, select My Session Files.
• Select a session file from your backup session files.
Note Ensure that the .tpl file extension is used for Participant List files.
Turning TechnologiesTurningPoint 4.3 241
Chapter 10: Export
To display the backup session files in the list of files, select My Backup Session Files.
• Import a session file from another location.
You can also import a session using the Import Session button (shaped like a folder) above the list of files. This allows you to use a TurningPoint, TurningPoint Anywhere, or TestingPoint session file you have copied from elsewhere.
4 Click Extract PowerPoint Presentation below the list of files.
A dialog opens for you to specify a location and filename for the PowerPoint presentation.
5 Specify a name and location for the exported file.
6 Click Save.
The file is saved, and the dialog closes.
7 Click Finish to exit the Extract PowerPoint Presentations window.
Extract Session Data as XML
You can extract your TurningPoint, TurningPoint Anywhere, or TestingPoint session data into an XML file. The XML file is a text markup format that you can use to exchange and manipulate the data.
To extract the session data XML file…
1 Click Tools on the TurningPoint Ribbon and mouse over Session Management.
2 Select Extract Session XML File.
The Extract Session XML File window opens, displaying a list of session files in your Sessions folder.
You can also import a session using the Import Session button (shaped like a folder) above the list of files. This allows you to use a TurningPoint, TurningPoint Anywhere, or TestingPoint session file you have copied from elsewhere.
3 Choose a session file.
You may choose a session file in one of the following ways:
• Select the Current Session (in red text) to use the session currently open in PowerPoint.
This option is available only if you have a TurningPoint presentation open and response data has been collected.
Note Ensure that the .pptx file extension is used for PowerPoint presentations.
Turning TechnologiesTurningPoint 4.3 242
Chapter 10: Export
• Select a session file from the list of files in your Sessions folder.
To display the session files from your Sessions folder in the list of files, select My Session Files.
• Select a session file from your backup session files.
To display the backup session files in the list of files, select My Backup Session Files.
• Import a session file from another location.
You can also import a session using the Import Session button (shaped like a folder) above the list of files. This allows you to use a TurningPoint, TurningPoint Anywhere, or TestingPoint session file you have copied from elsewhere.
4 Click Extract Session XML File below the list of files.
A dialog opens for you to specify a location and filename for the XML file.
5 Specify a name and location for the exported file.
6 Click Save.
The file is saved, and the dialog closes.
7 Click Finish to exit the Extract Session XML File window.
E-mail Session
You can use Session Management to quickly and easily send one or more TurningPoint, TurningPoint Anywhere, or TestingPoint session files by e-mail.
Before You BeginTo use this feature, you must have access to the internet on the computer that has TurningPoint installed.
To e-mail a session file using an SMTP client…
1 Click Tools on the TurningPoint Ribbon and mouse over Session Management.
2 Select Send Sessions.
The Send Sessions window opens, displaying a blank e-mail form.
3 Enter the recipient’s e-mail address in the To box for delivery of the session files.
You may enter more than one e-mail address. Separate multiple e-mail addresses with semicolons.
4 Enter your e-mail address in the From box.
5 Enter a subject for the e-mail in the Subject line.
6 Optionally, add a message to the e-mail in the space provided.
Turning TechnologiesTurningPoint 4.3 243
Chapter 10: Export
If you choose not to add a message, the body of the e-mail will be blank for delivery.
7 Select File > Attach Session(s).
This opens a window displaying a list of sessions files from your Sessions folder.
From this window, you can also navigate to any other location where TurningPoint, TurningPoint Anywhere, or TestingPoint session files are located.
8 Choose a session file.
When selecting session files, hold Shift to select multiple contiguous sessions, or Control to select multiple sessions.
9 When you have selected all the files you would like to send, click Open to continue.
TurningPoint attaches the session(s) to the e-mail and displays the session name in the lower portion of the Send Sessions window.
10 Set the SMTP Server.
a Select Tools > Change SMTP Server.
An SMTP Server window opens.
b Enter the SMTP server.
You may need to check with your IT Department for this information.
c Select OK.
Your SMTP server has been set. If you need to change the SMTP Sever, repeat this step.
11 Click Send.
A confirmation message displays indicating that the e-mail was successfully sent.
Turning TechnologiesTurningPoint 4.3 244
Chapter 11: Frequently Asked Questions
Frequently Asked Questions
This appendix offers you a quick reference to common questions that customers have about using the TurningPoint software. If you do not find an answer to your question here, visit the Turning Technologies web site at http://www.turningtechnologies.com or call a Turning Representative toll-free at 1-866-746-3015.
Why can’t I install TurningPoint?
You must be the local administrator to install TurningPoint for the first time using the administrative username and
password.
Where is my product serial number (activation code)?
The product serial number, also called the activation code, is located on a label inside the ResponseCard Kit.
Which response devices are compatible with TurningPoint?
Turning Technologies partners with Responsive Innovations to provide audience response devices that are
specifically designed to support the functionality of TurningPoint. The ResponseCard IR, ResponseCard XL,
ResponseCard RF, ResponseCard XR, and ResponseCard NXT are products that are optimally suited for use with
TurningPoint. Users also have the option of using TurningPoint’s ResponseWare for a virtual keypad.
How do I set up the response devices?
All of the response device settings can be found in the Settings windows. From the TurningPoint Ribbon, select the
Tools > Settings. Find information about Installing Response Devices in Chapter 4: Response Device and
Settings Management.
Where should I put the receiver?
Because the IR device uses infrared technology and line-of-sight communication, place it in a central location in the
front of the room where it is high enough for everyone to see. The effective range of an IR device receiver is about
90 feet (27 meters). You will need to install one receiver for every 80 participants. The effective range of a
ResponseCard RF is about 200 feet (60 meters) and the ResponseCard XR is about 400 feet (120 meters). A
single receiver is sufficient for up to 1000 ResponseCards, and a direct line of sight between the receiver and the
ResponseCard is not necessary. When the receiver is connected, the participant has to simply press the number or
letter on the ResponseCard to send a response. Find information about setting up the receiver in Chapter 4:
Response Device and Settings Management.
Why is a ResponseCard not working?
The correct ResponseCards may not be matched with the receiver. Check your response device settings. Find
information about the response device settings in Chapter 4: Response Device and Settings Management.
The ResponseCard’s batteries may be too low or dead. Press a button on the ResponseCard. The light on the
ResponseCard blinks or does not light up if the batteries need to be replaced.
Turning TechnologiesTurningPoint 4.3 245
Chapter 11: Frequently Asked Questions
The ResponseCard may not be correctly programmed. Refer to the Programming ResponseCards insert in the
TurningPoint kit.
How do I track responses from participants?
Create a Participant List in TurningPoint and then use the Participant Monitor to view the responses from each
participant. You can either create a Participant List using the Participant List Wizard or by importing an existing file.
Find information about Participant Lists in Chapter 5: Track Participants and Teams. Find information about the
Participant Monitor in Chapter 7: Run Presentations.
When running the presentation, why don’t the graphs appear unless I advance to the next slide and then go back?
The animations in the charts vary between Office 2003 and Office 2007. It is likely that Microsoft Office has been
upgraded since TurningPoint was installed. Uninstall TurningPoint, and then reinstall it.
How do I clear data from a session or a slide?
From the TurningPoint Ribbon, select the Reset menu, and then select Session or Current Slide from menu. Find
information about working with sessions in Chapter 9: Sessions.
How do I save a session?
From the TurningPoint Ribbon, select the Save Session button, which looks like a disk. A window opens allowing
you to select a file name and location. Save the file in the Sessions folder, located at My
Documents\TurningPoint\Sessions. Find information about saving a session in Chapter 9: Sessions.
How do I make a report with the data from my session?
TurningPoint enables you to create several types of reports. Find information about your options and instructions
for creating reports in Chapter 8: Reports.