turtle beach reports strong third quarter 2016 …site/... · turtle beach reports third quarter...
TRANSCRIPT

Page 1 of 12
TURTLE BEACH REPORTS STRONG THIRD QUARTER 2016 RESULTS, RAISES
2016 REVENUE OUTLOOK
San Diego, CA – November 10, 2016 – Turtle Beach Corporation (NASDAQ: HEAR), a
leading audio technology company, reported financial results for the third quarter
ended September 30, 2016.
Third Quarter Summary vs. Same Year-Ago Quarter:
Net revenue increased 7% (8% in constant currency) to $38.4 million with new-
gen headset sales up 41%.
Including a charge related to the HyperSound restructuring, gross margin was
10.2% compared to 26.7%. Excluding the charge, gross margin increased 200 basis
points to 28.7% with headset gross margin up 550 basis points to 33.3%.
Including $0.81 per share in charges related to the HyperSound restructuring, net
loss was $(44.8) million or $(0.91) per share, compared to a loss of $(15.9) million
or $(0.38) per share. Excluding the charges, net loss in the third quarter of 2016
improved to $(4.7) million or $(0.10) per share.
Consolidated adjusted EBITDA improved to $0.5 million compared to $(3.3)
million, with headset adjusted EBITDA improving to $3.4 million compared to
$0.3 million.
“The third quarter was yet again driven by strong gains in our new-gen headset
portfolio, led by continued demand for our entry-level RECON series gaming headsets
and initial sell-in of the STEALTH 520 wireless headset,” said Juergen Stark, CEO,
Turtle Beach Corporation. “In fact, new-gen headset sales were up 41%, highlighting
the continued strength of our portfolio, considering the year-ago quarter represented a
significant new-gen sell-in period.
“Recent NPD data confirms that we continued to increase our market share. Year-to-
date, the console market is up 17% on a unit basis, while Turtle Beach is up 26%. On a
retail dollar basis, the market is up 12% and we are up 14%. Given this performance, as
well as our entrance into two burgeoning new markets in Virtual Reality (VR) and
Livestreaming with our STEALTH 350VR and STREAM MIC products, we believe we
are well-positioned to capitalize on the upcoming holiday season with the most

Turtle Beach Reports Third Quarter 2016 Results Announcement
Page 2 of 12
expansive portfolio in our history.
“In our HyperSound business, as previously disclosed, we have taken aggressive but
necessary steps to align costs with our revenue. We are working to evolve HyperSound
to a licensing business and currently have multiple conversations underway. Our goal
remains to get the business to net cash burn breakeven by the end of the second quarter
of 2017. Ultimately, we believe this reduction will further highlight the strength of our
core headset results in 2017 and beyond.”
Third Quarter 2016 Financial Results
Net revenue in the third quarter increased 7% (8% in constant currency)to $38.4 million
compared to $35.9 million in the year-ago quarter. The increase was attributable to a 7%
increase in headset sales due to continued robust sell-through of the new-gen headset
portfolio.
Including a $7.1 million charge for inventory reserves associated with the HyperSound
restructuring, gross margin in the third quarter was 10.2% compared to 26.7% in the
year-ago quarter. Excluding the reserves, consolidated gross margin increased 200 basis
points to 28.7%. Gross margin in the headset segment increased 550 basis points to 33.3%
as higher margin new-gen headsets contributed 92% of revenues in the third quarter, up
from 70% during the same period in 2015.
Including an intangible asset impairment charge and certain reserves related to the
HyperSound restructuring, operating expenses in the third quarter were $46.7 million
compared to $15.3 million in the year-ago quarter. Excluding the impairment charge and
reserves, operating expenses in the third quarter were reduced by 11% to $13.6 million
due to continued cost management across the business.
Including the $0.65 per diluted share intangible asset impairment charge and $0.16 per
diluted share HyperSound-related reserves, net loss in the third quarter was $(44.8)
million or $(0.91) per diluted share, compared to a net loss of $(15.9) million or $(0.38)
per diluted share in the year-ago quarter. Excluding the impairment charge and
reserves, net loss in the third quarter of 2016 improved to $(4.7) million or $(0.10) per
diluted share, compared to a loss of $(5.4) million or $(0.13) per diluted share in the

Turtle Beach Reports Third Quarter 2016 Results Announcement
Page 3 of 12
year-ago quarter, which excluded a $0.25 per diluted share tax valuation allowance. The
third quarter of 2016 included approximately 6.9 million incremental shares compared
to the year ago quarter, primarily due to the February 2016 follow-on public offering of
common stock and concurrent private placement.
Adjusted EBITDA (as defined below in “Non-GAAP Financial Measures”) on a
consolidated basis improved to $0.5 million compared to $(3.3) million in the year-ago
quarter. The improvement was primarily driven by strong new-gen headset sales and
successful business improvement initiatives. Adjusted EBITDA for the headset business
improved to $3.4 million in the third quarter compared to $0.3 million in the year-ago
quarter.
Balance Sheet Highlights
At September 30, 2016, the Company had approximately $3.3 million of cash and cash
equivalents compared to $3.1 million at September 31, 2015. As a result of the
Company’s $60 million revolving credit facility, Turtle Beach generally does not hold
a large cash balance.
As of September 30, 2016, total outstanding debt principal was $59.9 million compared
to $56.3 million at September 30, 2015.
HyperSound Strategic Options Exploration
In addition to exploring new, more consumer/retail-oriented sales channels for
HyperSound Clear 500P and developing the Tinnitus capability for hearing healthcare
professionals, the Company continues to evaluate HyperSound business model
modifications. As such, the Company continues to work with Piper Jaffray & Co. in
evaluating strategic alternatives.
Increased 2016 Outlook
As reported on September 26, actions have been taken to significantly reduce
HyperSound operating expenses beginning in October and monthly net cash burn
related to the HyperSound segment is expected to be below $350,000 by January 2017.
Turtle Beach is targeting to be net cash burn breakeven with respect to its HyperSound
segment by the end of the second quarter of 2017. The outlook provided below factors

Turtle Beach Reports Third Quarter 2016 Results Announcement
Page 4 of 12
in these considerations and is based on a variety of business assumptions.
For the fourth quarter of 2016, Turtle Beach expects net revenue to range between $78-
$86 million compared to $84.6 million in the fourth quarter of 2015. Adjusted EBITDA
is expected to increase 31%-51% and range between $13-$15 million compared to $9.9
million in the fourth quarter of 2015. Net income for the fourth quarter is expected to
range between $0.13-$0.17 per diluted share, compared to a net loss of $(1.09) per
diluted share in the fourth quarter of 2015. The fourth quarter of 2015 included a $49.8
million goodwill impairment charge. Excluding this charge, net income in the fourth
quarter of 2015 was $0.08 per diluted share.
For the full year 2016, Turtle Beach now expects net revenue to increase 4%-9% and
range between $170-$178 million (up from $168-$178 million in its August 8, 2016
outlook) compared to $162.7 million in 2015. The Company now expects to generate
$1.0-$3.0 million in consolidated adjusted EBITDA in 2016 (up from $0.5-$2.5 million in
the August 8, 2016 outlook) compared to $(11.4) million in 2015. Net loss in 2016 is
expected to range between $(1.87)-$(1.91) per diluted share based upon 48.6 million
diluted shares outstanding, compared to a net loss of $(1.96) per diluted share in 2015.
Excluding $1.45 per diluted share in year-to-date goodwill impairment charges and
inventory reserves associated with the HyperSound restructuring, net loss is now
expected to range between $(0.42)-$(0.46) per diluted share (up from $(0.45)-$(0.49) per
diluted share in the August outlook). This would be comparable to a net loss in 2015 of
$(24.6) million or $(0.58) per diluted share, which excludes a tax valuation expense and
goodwill impairment.
With respect to the Company's adjusted EBITDA outlook for the fourth quarter and full
year 2016, a reconciliation to its net loss outlook for the same periods has not been
provided because of the variability, complexity and lack of visibility with respect to
certain reconciling items between adjusted EBITDA and net loss, including other income
(expense), provision for income taxes and stock-based compensation. These items cannot
be reasonably and accurately predicted without the investment of undue time, cost and
other resources and, accordingly, a reconciliation of the Company’s adjusted EBITDA
outlook to its net loss outlook for such periods is not available without unreasonable
effort. These reconciling items could be material to the Company’s actual results for such

Turtle Beach Reports Third Quarter 2016 Results Announcement
Page 5 of 12
periods.
Conference Call Details
Turtle Beach Corporation will hold a conference call today, November 10, 2016, at 2:00
p.m. Pacific time (5:00 p.m. Eastern) to discuss its third quarter 2016 results.
CEO Juergen Stark and CFO John Hanson will host the call, followed by a question and
answer session.
Date: Thursday, November 10, 2016
Time: 2:00 p.m. PT / 5:00 p.m. ET
Toll-Free Dial-in Number: (877) 303-9855
International Dial-in Number: (408) 337-0154
Conference ID: 3042340
Please dial-in 5-10 minutes prior to the start time of the conference call and an operator
will register your name and organization. If you have any difficulty with the conference
call, please contact Liolios at (949) 574-3860.
The conference call will be broadcast live and available for replay here and via the
investor relations section of the Company’s website at www.turtlebeachcorp.com.
A replay of the conference call will be available after 8:00 p.m. PT on the same day
through November 17, 2016.
Toll-Free Replay Number: (855) 859-2056
International Replay Number: (404) 537-3406
Replay ID: 3042340
Non-GAAP Financial Measures
In addition to its reported results, the Company has included in this earnings release
certain financial results, including adjusted EBITDA, that the Securities and Exchange
Commission defines as "non-GAAP financial measures." Management believes that such
non-GAAP financial measures, when read in conjunction with the Company's reported
results, can provide useful supplemental information for investors analyzing period to

Turtle Beach Reports Third Quarter 2016 Results Announcement
Page 6 of 12
period comparisons of the Company's results. “Adjusted EBITDA” is defined by the
Company as net income (loss) before interest, taxes, depreciation and amortization, stock-
based compensation (non-cash), and certain special items that we believe are not
representative of core operations. See a reconciliation of GAAP results to adjusted
EBITDA included below for the three months ended September 30, 2016 and 2015.
About Turtle Beach Corporation
Turtle Beach Corporation (http://corp.turtlebeach.com) designs innovative, market-
leading audio products for the consumer, healthcare and commercial sectors. Under
its award-winning Turtle Beach brand (www.turtlebeach.com), the Company has been
the clear market share leader for the past five-plus years with its wide selection of
acclaimed gaming headsets for use with Xbox One and PlayStation®4, as well as personal
computers and mobile/tablet devices. Under the HyperSound brand
(www.hypersound.com), the Company markets pioneering directed audio solutions
that have applications in hearing healthcare, digital signage and kiosks and consumer
electronics. The Company's shares are traded on the NASDAQ Exchange under the
symbol: HEAR. Cautionary Note on Forward-Looking Statements
This press release includes forward-looking information and statements within the meaning of the federal
securities laws. Except for historical information contained in this release, statements in this release may
constitute forward-looking statements regarding assumptions, projections, expectations, targets,
intentions or beliefs about future events. Statements containing the words “may”, “could”, “would”,
“should”, “believe”, “expect”, “anticipate”, “plan”, “estimate”, “target”, “project”, “intend” and similar
expressions constitute forward-looking statements. Forward-looking statements involve known and
unknown risks and uncertainties, which could cause actual results to differ materially from those
contained in any forward-looking statement. Forward-looking statements are based on management’s
current belief, as well as assumptions made by, and information currently available to, management.
While the Company believes that its expectations are based upon reasonable assumptions, there can be no
assurances that its goals and strategy will be realized. Numerous factors, including risks and uncertainties,
may affect actual results and may cause results to differ materially from those expressed in forward-
looking statements made by the Company or on its behalf. Some of these factors include, but are not
limited to, risks related to the Company’s liquidity, the substantial uncertainties inherent in the acceptance
of existing and future products, the difficulty of commercializing and protecting new technology, the
impact of competitive products and pricing, general business and economic conditions, risks associated
with the expansion of our business including the implementation of any businesses we acquire, our
indebtedness, the outcome of our HyperSound strategic review process and other factors discussed in our
public filings, including the risk factors included in the Company’s most recent Annual Report on Form
10-K and the Company’s other periodic reports. Except as required by applicable law, including the
securities laws of the United States and the rules and regulations of the Securities and Exchange

Turtle Beach Reports Third Quarter 2016 Results Announcement
Page 7 of 12
Commission, the Company is under no obligation to publicly update or revise any forward-looking
statement after the date of this release whether as a result of new information, future developments or
otherwise.
All trademarks are the property of their respective owners.
###
For Investor Information, Contact: For Media Information, Contact:
Cody Slach MacLean Marshall
Investor Relations PR/Communications Director
Liolios Turtle Beach Corp.
949.574.3860 858.914.5093

Turtle Beach Reports Third Quarter 2016 Results Announcement
Page 8 of 12
Turtle Beach Corporation
Condensed Consolidated Balance Sheets
(in thousands, except par value and share amounts)
Table 1.
September 30,
2016
December 31,
2015
ASSETS (unaudited)
Current Assets:
Cash and cash equivalents $ 3,277 $ 7,114
Accounts receivable, net 28,454 57,192
Inventories 45,493 26,146
Prepaid income taxes 260 260
Prepaid expenses and other current assets 6,002 4,191
Total Current Assets 83,486 94,903
Property and equipment, net 4,644 6,859
Goodwill — 31,152
Intangible assets, net 1,805 37,956
Deferred income taxes 481 —
Other assets 1,418 1,590
Total Assets $ 91,834 $ 172,460
LIABILITIES AND STOCKHOLDERS' EQUITY
Current Liabilities:
Revolving credit facilities $ 26,299 $ 32,453
Term loan 4,814 4,814
Accounts payable 38,186 17,680
Other current liabilities 10,387 14,236
Total Current Liabilities 79,686 69,183
Term loan, long-term portion 8,633 12,174
Series B redeemable preferred stock 17,134 16,145
Deferred income taxes — 4
Subordinated notes - related party 17,213 15,365
Other liabilities 2,778 2,937
Total Liabilities 125,444 115,808
Commitments and Contingencies Stockholders' Equity
Common stock, $0.001 par value - 100,000,000 shares authorized; 49,229,502 and
42,529,502 shares issued and outstanding as of September 30, 2016 and December 31, 2015, respectively 49
43
Additional paid-in capital 145,877 136,693
Retained earnings (accumulated deficit) (179,001 ) (79,618 )
Accumulated other comprehensive loss (535 ) (466 )
Total Stockholders' Equity (33,610 ) 56,652
Total Liabilities and Stockholders' Equity $ 91,834 $ 172,460

Turtle Beach Reports Third Quarter 2016 Results Announcement
Page 9 of 12
Turtle Beach Corporation
Condensed Consolidated Statements of Operations
(in thousands, except per-share data)
(unaudited)
Table 2.
Three Months Ended Nine Months Ended
September 30,
2016 September 30,
2015 September 30,
2016 September 30,
2015
Net Revenue $ 38,384 $ 35,887 $ 91,774 $ 78,188
Cost of Revenue 34,457 26,323 79,372 62,106
Gross Profit 3,927 9,564 12,402 16,082
Operating expenses:
Selling and marketing 7,016 7,142 19,737 21,849
Research and development 2,637 2,963 6,701 8,641
General and administrative 4,591 5,393 15,161 16,124
Goodwill and intangible asset impairment 32,084 — 63,236 —
Restructuring charges 339 (173 ) 564 336
Total operating expenses 46,667 15,325 105,399 46,950
Operating loss (42,740 ) (5,761 ) (92,997 ) (30,868 )
Interest expense 1,866 1,540 5,331 3,158
Other non-operating expense, net 326 347 1,395 629
Loss before income tax expense (benefit) (44,932 ) (7,648 ) (99,723 ) (34,655 )
Income tax expense (benefit) (133 ) 8,232 (340 ) 1,716
Net loss $ (44,799 ) $ (15,880 ) $ (99,383 ) $ (36,371 )
Net loss per share:
Basic $ (0.91 ) $ (0.38 ) $ (2.05 ) $ (0.86 )
Diluted $ (0.91 ) $ (0.38 ) $ (2.05 ) $ (0.86 )
Weighted average number of shares:
Basic 49,230 42,325 48,371 42,185
Diluted 49,230 42,325 48,371 42,185

Turtle Beach Reports Third Quarter 2016 Results Announcement
Page 10 of 12
Turtle Beach Corporation
Reconciliation of GAAP and Non-GAAP Measures
(in thousands, except per-share data)
(unaudited)
Table 3.
Three Months Ended Nine Months Ended
September 30,
2016 September 30,
2015 September 30,
2016 September 30,
2015
Net Income (Loss)
GAAP Net Income (Loss) $ (44,799 ) $ (15,880 ) $ (99,383 ) $ (36,371 )
Goodwill and intangible asset impairment 32,084 — 63,236 —
Business transition charges (1) 8,049 — 8,049 —
Tax Valuation Allowance — 10,478 — 2,314
Non-GAAP Earnings (4,666 ) (5,402 ) (28,098 ) (34,057 )
Diluted Earnings Per Share
GAAP - Diluted $ (0.91 ) $ (0.38 ) $ (2.05 ) $ (0.86 )
Goodwill and intangible asset impairment $ 0.65 $ — $ 1.31 $ —
Business transition charges $ 0.16 $ — $ 0.17 $ —
Tax Valuation Allowance $ — $ 0.25 $ — $ 0.05
Non-GAAP - Diluted $ (0.10 ) $ (0.13 ) $ (0.57 ) $ (0.81 )
(1) Includes inventory reserves, assets write-off and headcount reduction costs.
Turtle Beach Reports Third Quarter 2016 Results Announcement
Page 11 of 12
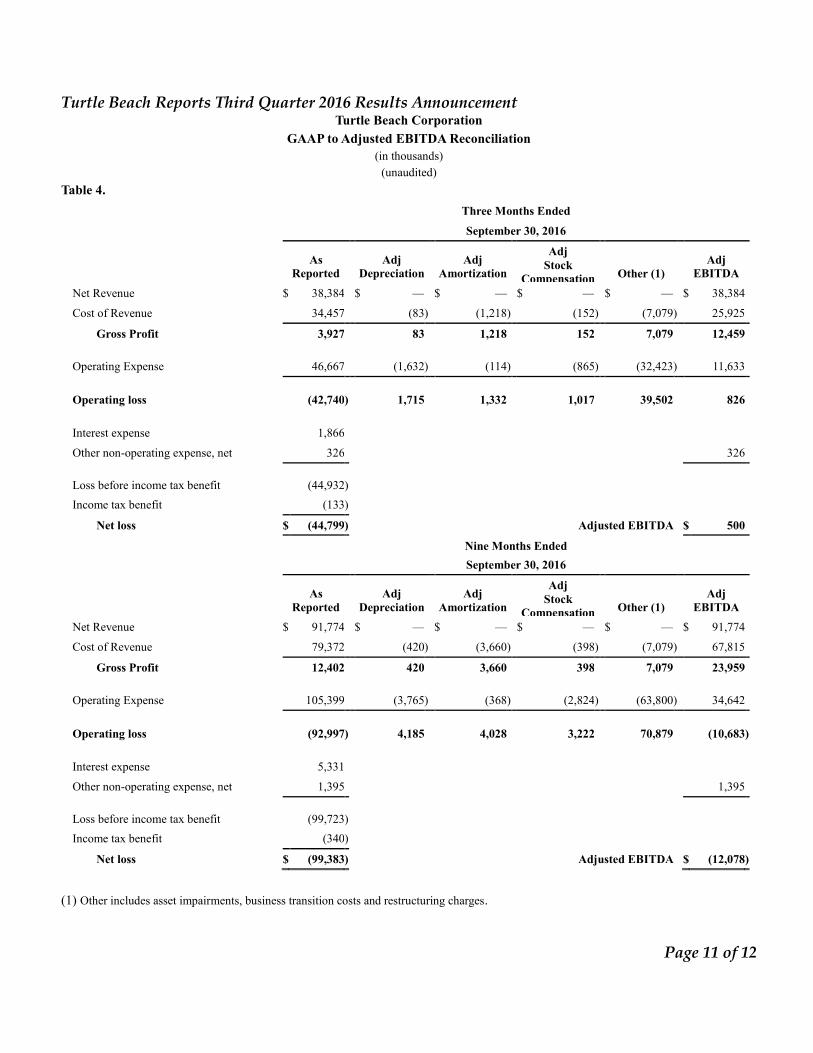
Turtle Beach Corporation
GAAP to Adjusted EBITDA Reconciliation
(in thousands)
(unaudited)
Table 4.
Three Months Ended
September 30, 2016
As
Reported Adj
Depreciation Adj
Amortization
Adj
Stock
Compensation Other (1)
Adj
EBITDA
Net Revenue $ 38,384 $ — $ — $ — $ — $ 38,384
Cost of Revenue 34,457 (83 ) (1,218 ) (152 ) (7,079 ) 25,925
Gross Profit 3,927 83 1,218 152 7,079 12,459
Operating Expense 46,667 (1,632 ) (114 ) (865 ) (32,423 ) 11,633
Operating loss (42,740 ) 1,715 1,332 1,017 39,502 826
Interest expense 1,866
Other non-operating expense, net 326 326
Loss before income tax benefit (44,932 )
Income tax benefit (133 )
Net loss $ (44,799 ) Adjusted EBITDA $ 500
Nine Months Ended
September 30, 2016
As
Reported Adj
Depreciation Adj
Amortization
Adj
Stock
Compensation Other (1)
Adj
EBITDA
Net Revenue $ 91,774 $ — $ — $ — $ — $ 91,774
Cost of Revenue 79,372 (420 ) (3,660 ) (398 ) (7,079 ) 67,815
Gross Profit 12,402 420 3,660 398 7,079 23,959
Operating Expense 105,399 (3,765 ) (368 ) (2,824 ) (63,800 ) 34,642
Operating loss (92,997 ) 4,185 4,028 3,222 70,879 (10,683 )
Interest expense 5,331
Other non-operating expense, net 1,395 1,395
Loss before income tax benefit (99,723 )
Income tax benefit (340 )
Net loss $ (99,383 ) Adjusted EBITDA $ (12,078 )
(1) Other includes asset impairments, business transition costs and restructuring charges.

Turtle Beach Reports Third Quarter 2016 Results Announcement
Page 12 of 12
Table 4. (continued)
Three Months Ended
September 30, 2015
As
Reported Adj
Depreciation Adj
Amortization
Adj
Stock
Compensation Other (2)
Adj
EBITDA
Net Revenue $ 35,887 $ — $ — $ — $ — $ 35,887
Cost of Revenue 26,323 (325 ) (28 ) (185 ) — 25,785
Gross Profit 9,564 325 28 185 — 10,102
Operating Expense 15,325 (1,142 ) (205 ) (1,068 ) 173 13,083
Operating loss (5,761 ) 1,467 233 1,253 (173 ) (2,981 )
Interest expense 1,540
Other non-operating expense, net 347 347
Loss before income tax expense (7,648 )
Income tax expense 8,232
Net loss $ (15,880 ) Adjusted EBITDA $ (3,328 )
Nine Months Ended
September 30, 2015
As
Reported Adj
Depreciation Adj
Amortization
Adj
Stock
Compensation Other (2)
Adj
EBITDA
Net Revenue $ 78,188 $ — $ — $ — $ — $ 78,188
Cost of Revenue 62,106 (503 ) (55 ) (727 ) — 60,821
Gross Profit 16,082 503 55 727 — 17,367
Operating Expense 46,950 (4,040 ) (631 ) (3,921 ) (336 ) 38,022
Operating loss (30,868 ) 4,543 686 4,648 336 (20,655 )
Interest expense 3,158
Other non-operating expense, net 629 629
Loss before income tax expense (34,655 )
Income tax expense 1,716
Net loss $ (36,371 ) Adjusted EBITDA $ (21,284 )
(2) Other includes restructuring charges.