tutorial: building an application - oracle · about this tutorial in oracle application express...
TRANSCRIPT
Oracle® Application ExpressTutorial: Building an Application
Release 19.1F13756-02July 2019

Oracle Application Express Tutorial: Building an Application, Release 19.1
F13756-02
Copyright © 2017, 2019, Oracle and/or its affiliates. All rights reserved.
Primary Author: John Godfrey
Contributors: David Peake, Terri Jennings, Shakeeb Rahman
This software and related documentation are provided under a license agreement containing restrictions onuse and disclosure and are protected by intellectual property laws. Except as expressly permitted in your li‐cense agreement or allowed by law, you may not use, copy, reproduce, translate, broadcast, modify, license,transmit, distribute, exhibit, perform, publish, or display any part, in any form, or by any means. Reverse engi‐neering, disassembly, or decompilation of this software, unless required by law for interoperability, is prohibit‐ed.
The information contained herein is subject to change without notice and is not warranted to be error-free. Ifyou find any errors, please report them to us in writing.
If this is software or related documentation that is delivered to the U.S. Government or anyone licensing it onbehalf of the U.S. Government, then the following notice is applicable:
U.S. GOVERNMENT END USERS: Oracle programs, including any operating system, integrated software,any programs installed on the hardware, and/or documentation, delivered to U.S. Government end users are"commercial computer software" pursuant to the applicable Federal Acquisition Regulation and agency-spe‐cific supplemental regulations. As such, use, duplication, disclosure, modification, and adaptation of the pro‐grams, including any operating system, integrated software, any programs installed on the hardware, and/ordocumentation, shall be subject to license terms and license restrictions applicable to the programs. No otherrights are granted to the U.S. Government.
This software or hardware is developed for general use in a variety of information management applications.It is not developed or intended for use in any inherently dangerous applications, including applications thatmay create a risk of personal injury. If you use this software or hardware in dangerous applications, then youshall be responsible to take all appropriate fail-safe, backup, redundancy, and other measures to ensure itssafe use. Oracle Corporation and its affiliates disclaim any liability for any damages caused by use of thissoftware or hardware in dangerous applications.
Oracle and Java are registered trademarks of Oracle and/or its affiliates. Other names may be trademarks oftheir respective owners.
Intel and Intel Xeon are trademarks or registered trademarks of Intel Corporation. All SPARC trademarks areused under license and are trademarks or registered trademarks of SPARC International, Inc. AMD, Opteron,the AMD logo, and the AMD Opteron logo are trademarks or registered trademarks of Advanced Micro Devi‐ces. UNIX is a registered trademark of The Open Group.
This software or hardware and documentation may provide access to or information about content, products,and services from third parties. Oracle Corporation and its affiliates are not responsible for and expressly dis‐claim all warranties of any kind with respect to third-party content, products, and services unless otherwiseset forth in an applicable agreement between you and Oracle. Oracle Corporation and its affiliates will not beresponsible for any loss, costs, or damages incurred due to your access to or use of third-party content, prod‐ucts, or services, except as set forth in an applicable agreement between you and Oracle.
Contents
Preface
Audience v
Documentation Accessibility v
Related Documents v
Conventions vi
Changes in This Release
Changes in Oracle Application Express Release 19.1 vii
1 About Oracle Application Express
2 Before You Begin
3 Populating Your Workspace
3.1 Installing the Sample Datasets 3-1
3.2 Reviewing the Created Tables with Object Browser 3-4
4 Creating the Initial Application
4.1 Running the Create Application Wizard 4-1
4.2 Adding a Cards Page 4-2
4.3 Adding a Dashboard Page 4-3
4.4 Moving Pages in the Create Application Wizard 4-5
4.5 Configuring Features and Advanced Settings 4-6
4.6 Completing the Create Application Wizard 4-7
4.7 Running the Application for the First Time 4-9
iii

5 Developing the Projects Page
5.1 Navigating to Page Designer from the Application Runtime 5-1
5.2 Creating a Form Page Using the Create Page Wizard 5-2
5.3 Linking Project Cards to Maintain Project Form 5-3
5.4 Updating the Maintain Project Form in Page Designer 5-6
5.5 Creating a Dynamic Action 5-14
5.6 Adding Validations to Completed Date 5-16
6 Developing the Milestones Page
6.1 Creating an Interactive Grid Page 6-1
6.2 Updating the Navigation Menu for Milestones 6-2
6.3 Hiding Columns in the Application Runtime 6-4
6.4 Adding Project Names to the Milestones Interactive Grid 6-6
6.5 Changing the Appearance of an Interactive Grid in Page Designer 6-8
6.6 Finalizing the Milestones Interactive Grid in the Runtime 6-9
7 Developing the Tasks Page
7.1 Creating an Interactive Report Page 7-1
7.2 Updating the Tasks Page in the Runtime 7-2
7.3 Applying Lookups to the Tasks Interactive Report 7-4
7.4 Updating the Remaining Columns in the Tasks Report 7-5
7.5 Updating the Project and Milestone Fields in the Update Task Form 7-7
7.6 Updating the Remaining Fields in the Update Task Form 7-10
8 Developing the Dashboard Page
8.1 Deleting Regions in Page Designer 8-1
8.2 Updating the Series in the Project Costs Chart 8-3
8.3 Updating the Appearance of the Dashboard Chart 8-5
8.4 Updating the Live Template Options for the Dashboard Chart 8-6
8.5 Adding a Classic Report Region from Gallery 8-7
A Importing an Application into a Workspace
Index
iv

Preface
Oracle Application Express Tutorial: Building an Application demonstrates how to builda working application for managing projects and tasks using some of the latest fea‐tures of Oracle Application Express.
AudienceOracle Application Express Tutorial: Building an Application is intended for workspaceadministrators who want to set up an Oracle Application Express development envi‐ronment and application developers who want to learn how to build database-centricweb applications using Oracle Application Express.
To use this guide, you must have a general understanding of relational database con‐cepts and the operating system environment under which Oracle Application Expressis running.
Documentation AccessibilityFor information about Oracle's commitment to accessibility, visit the Oracle Accessibili‐ty Program website at http://www.oracle.com/pls/topic/lookup?ctx=acc&id=docacc.
Access to Oracle Support
Oracle customers that have purchased support have access to electronic supportthrough My Oracle Support. For information, visit http://www.oracle.com/pls/topic/look‐up?ctx=acc&id=info or visit http://www.oracle.com/pls/topic/lookup?ctx=acc&id=trs ifyou are hearing impaired.
Related DocumentsFor more information, see these Oracle resources:
• Oracle Application Express Release Notes
• Oracle Application Express Installation Guide
• Oracle Application Express End User’s Guide
• Oracle Application Express App Builder User’s Guide
• Oracle Application Express Administration Guide
• Oracle Application Express SQL Workshop Guide
• Oracle Application Express API Reference
• Oracle Application Express Application Migration Guide
v
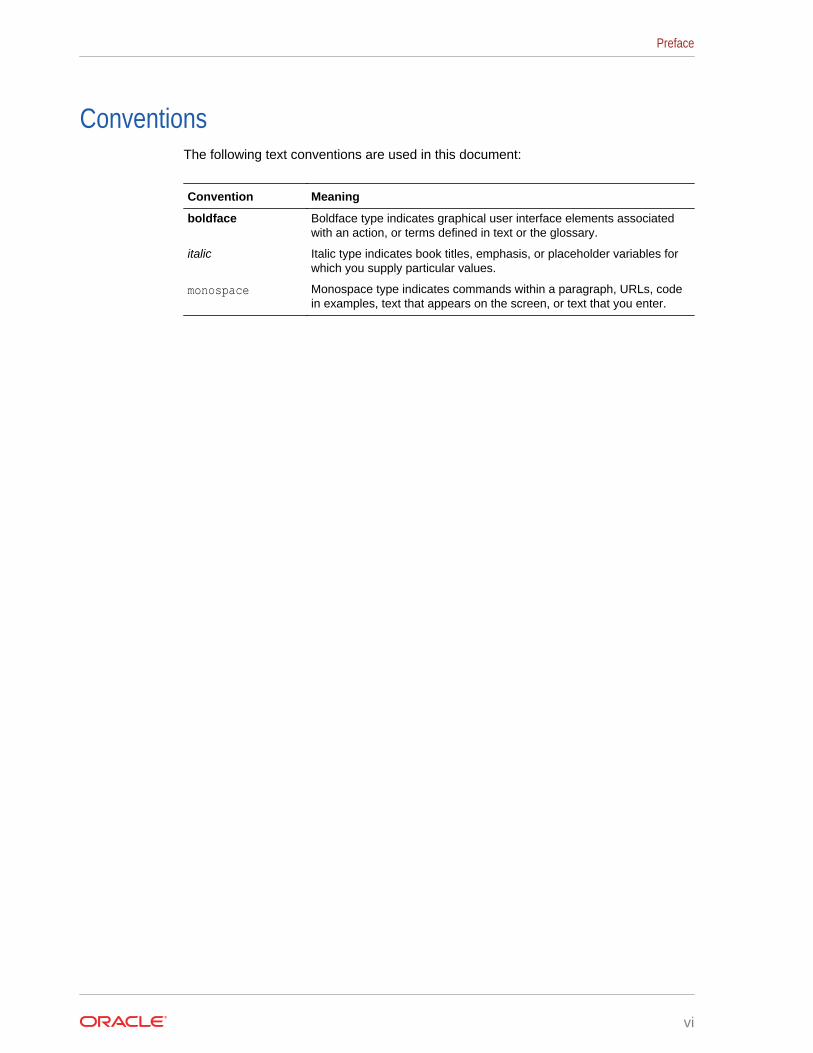
ConventionsThe following text conventions are used in this document:
Convention Meaning
boldface Boldface type indicates graphical user interface elements associatedwith an action, or terms defined in text or the glossary.
italic Italic type indicates book titles, emphasis, or placeholder variables forwhich you supply particular values.
monospace Monospace type indicates commands within a paragraph, URLs, codein examples, text that appears on the screen, or text that you enter.
Preface
vi

Changes in This Release
Changes in Oracle Application Express Release 19.1The following are changes in Oracle Application Express Tutorial: Building an Applica‐tion for Oracle Application Express release 19.1.
New FeaturesOracle Application Express Tutorial: Building an Application contains expanded con‐tent for Oracle Application Express release 19.1:
• Creating a new Interactive Grid page
• Creating a new Interactive Report with Form page(s)
• Configuring charts and creating a new report region on the Dashboard page
• Appendix for importing application export scripts enabling the user to skip aroundthe tutorial
Other ChangesThe following are additional changes in the release:
• All content has been updated to reflect new functionality.
• Screen captures and graphics have been added and updated to reflect the currentOracle Application Express user interface.
vii
1About Oracle Application Express
Oracle Application Express is an environment designed for rapid application develop‐ment and deployment.
You can develop professional applications that are both fast and secure using only aweb browser and limited programming experience. Oracle Application Express accel‐erates the application development process with features such as user interfacethemes, navigational controls, form handlers, and flexible reports. The deployed appli‐cations require only a browser and access to an Oracle database running ApplicationExpress.
This tutorial is intended to guide you through almost every step of creating an app witha focused amount of context. For more in-depth information about Oracle ApplicationExpress, a good place to start is the "Quick Start" section of the Oracle Application Ex‐press App Builder User’s Guide.
About This Tutorial
In Oracle Application Express Tutorial: Building an Application, you create a simpleproject management application for the fictitious AnyCo Corp. The application man‐ages IT project information stored in database tables. This tutorial shows you how tobuild, modify, and run the application. Each chapter is a further lesson that advancesthe work of previous one so that the concepts build on one another.
Oracle Application Express Tutorial: Building an Application is intended to be followedin the order it is written. To skip to the beginning of any lesson, you can import one ofthe exported application files stored in the .zip file accompanying this tutorial. This fea‐ture is useful for skipping ahead in the tutorial to your skill level or checking your work.
See the appendix "Importing an Application into a Workspace."
1-1
2Before You Begin
For this tutorial, you must have access to an Oracle Application Express environmentand an account with development privileges.
Accessing an Oracle Application Express Environment
You must have access to an Oracle Application Express release 19.1 or later. You canaccess Oracle Application Express in one of the following ways:
• Request an account on apex.oracle.com.
• Subscribe to an account on the Oracle Database Cloud Service which includesOracle Application Express.
• Install a local installation of Oracle Database which includes Oracle ApplicationExpress release 19.1 or later.
Oracle Application Express Development User Account
If you are accessing Oracle Application Express in a hosted environment, requestingan account creates a workspace and an account. If you are managing Oracle Applica‐tion Express locally, you will create a workspace and account manually. In either sce‐nario, your Oracle Application Express account must have developer privileges.
2-1
3Populating Your Workspace
To build an Oracle Application Express app, you need a complete set of tables and da‐ta.
About This Lesson
In this lesson, you install Sample Datasets provided by Oracle.
Once installed, you also review the output of the scripts in Object Browser to confirmthe presence of the tables and data.
The sample tables and data that you load in these steps resemble the kind of informa‐tion that real Application Express project management apps use every day. They in‐clude information typical of data sets for employees, projects, and calendars.
3.1 Installing the Sample DatasetsThe Application Express SQL Workshop comes with several sample datasets intendedto enhance app experimentation.
To install the Project Data sample dataset in SQL Workshop:
1. Sign in to your Oracle Application Express workspace.
2. Click SQL Workshop, click Utilities, and click Sample Datasets.
3-1
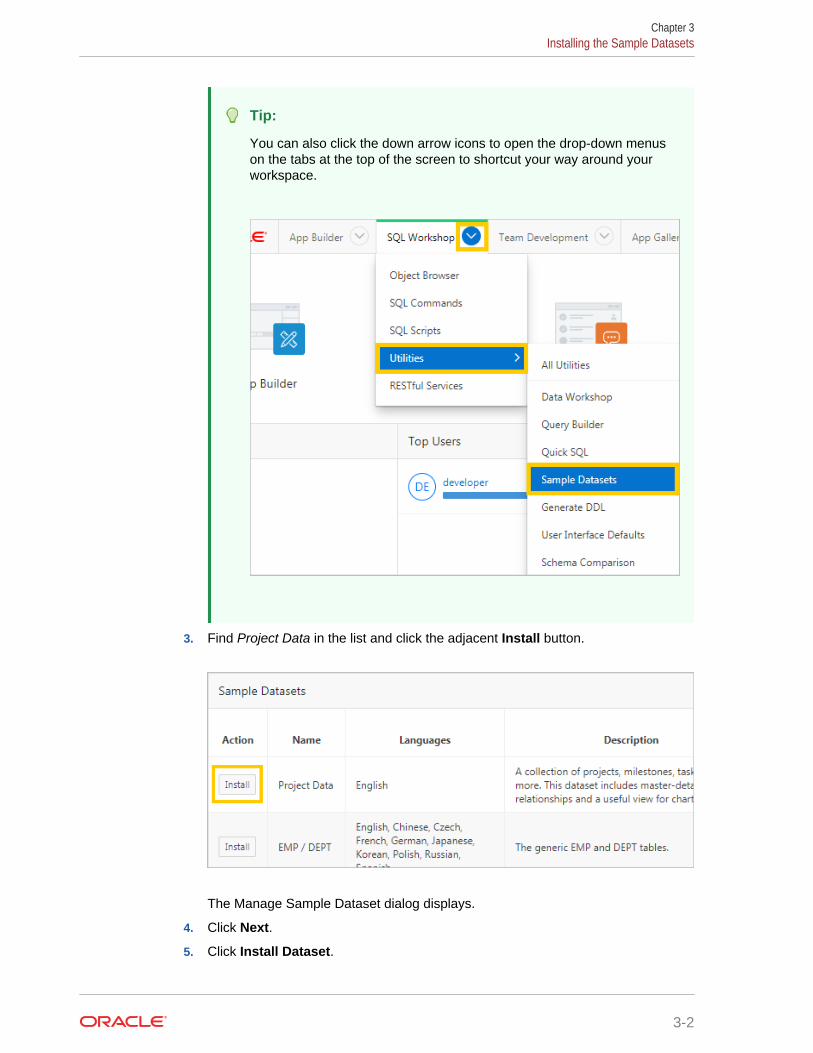
Tip:
You can also click the down arrow icons to open the drop-down menuson the tabs at the top of the screen to shortcut your way around yourworkspace.
3. Find Project Data in the list and click the adjacent Install button.
The Manage Sample Dataset dialog displays.
4. Click Next.
5. Click Install Dataset.
Chapter 3Installing the Sample Datasets
3-2
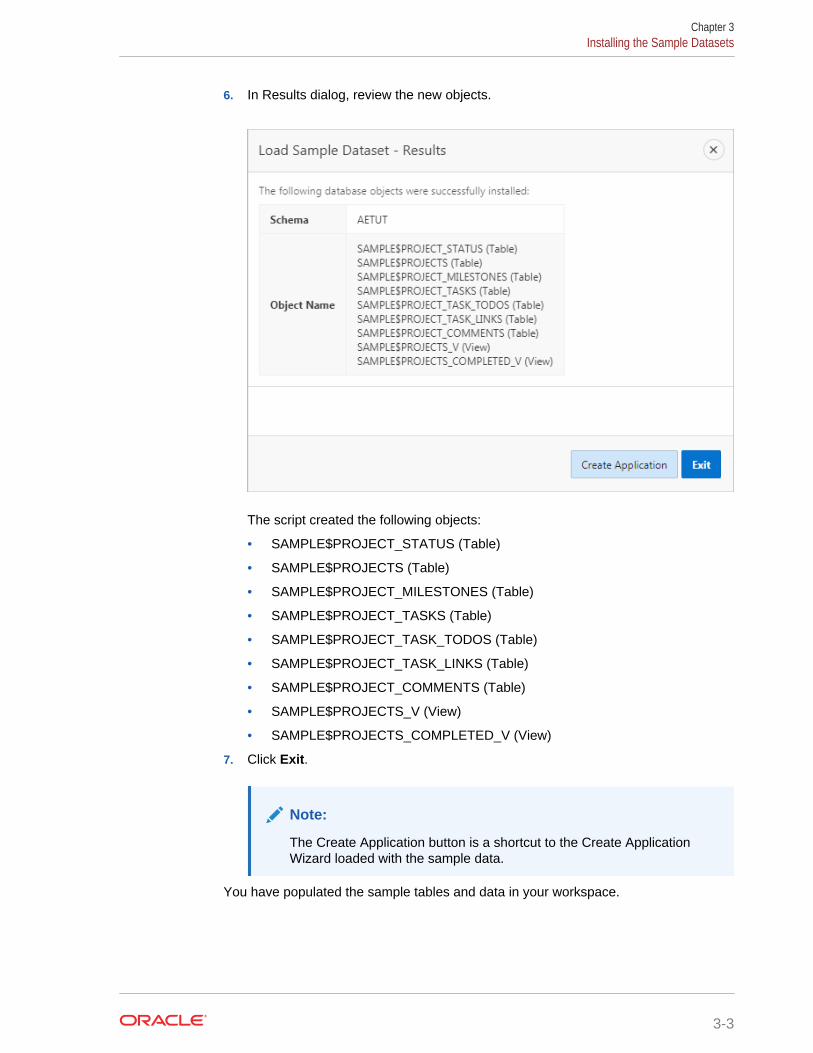
6. In Results dialog, review the new objects.
The script created the following objects:
• SAMPLE$PROJECT_STATUS (Table)
• SAMPLE$PROJECTS (Table)
• SAMPLE$PROJECT_MILESTONES (Table)
• SAMPLE$PROJECT_TASKS (Table)
• SAMPLE$PROJECT_TASK_TODOS (Table)
• SAMPLE$PROJECT_TASK_LINKS (Table)
• SAMPLE$PROJECT_COMMENTS (Table)
• SAMPLE$PROJECTS_V (View)
• SAMPLE$PROJECTS_COMPLETED_V (View)
7. Click Exit.
Note:
The Create Application button is a shortcut to the Create ApplicationWizard loaded with the sample data.
You have populated the sample tables and data in your workspace.
Chapter 3Installing the Sample Datasets
3-3
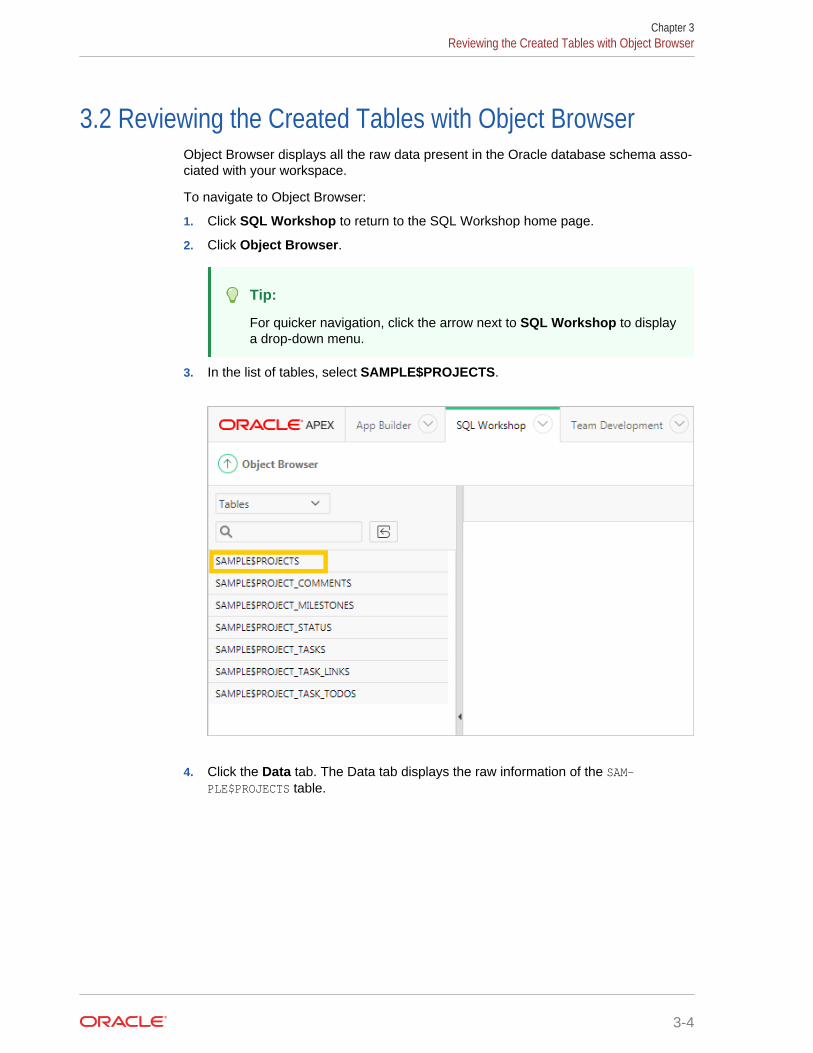
3.2 Reviewing the Created Tables with Object BrowserObject Browser displays all the raw data present in the Oracle database schema asso‐ciated with your workspace.
To navigate to Object Browser:
1. Click SQL Workshop to return to the SQL Workshop home page.
2. Click Object Browser.
Tip:
For quicker navigation, click the arrow next to SQL Workshop to displaya drop-down menu.
3. In the list of tables, select SAMPLE$PROJECTS.
4. Click the Data tab. The Data tab displays the raw information of the SAM-PLE$PROJECTS table.
Chapter 3Reviewing the Created Tables with Object Browser
3-4
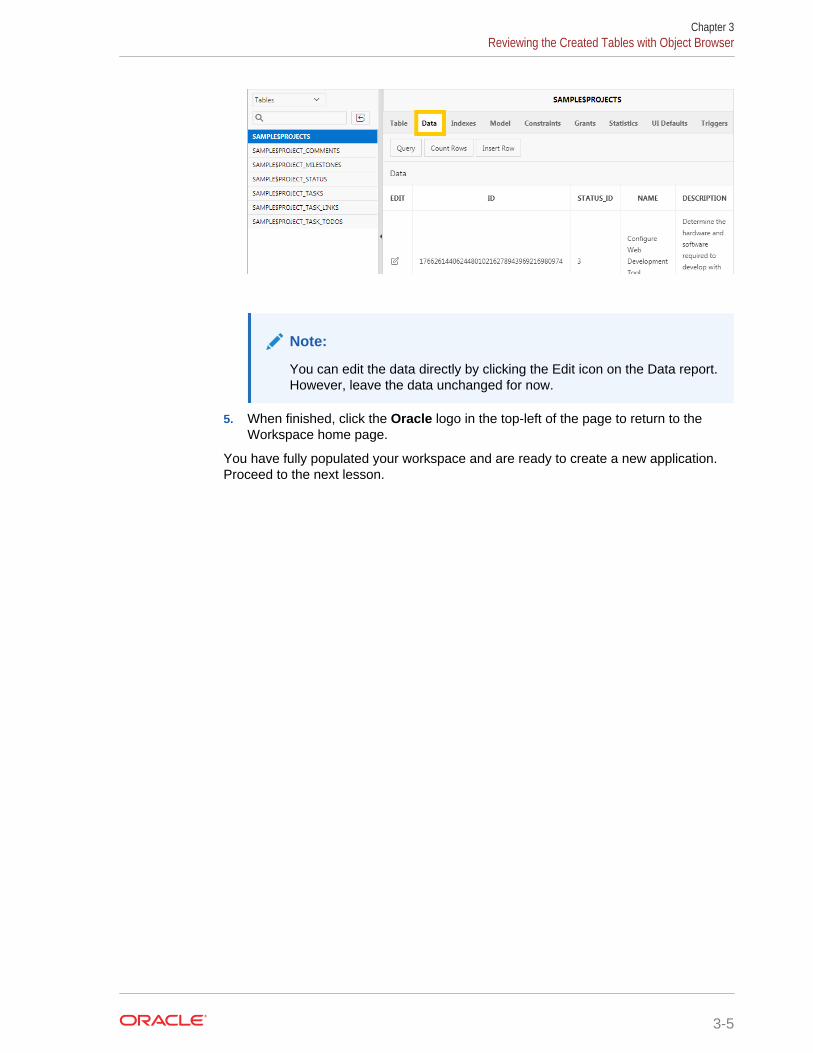
Note:
You can edit the data directly by clicking the Edit icon on the Data report.However, leave the data unchanged for now.
5. When finished, click the Oracle logo in the top-left of the page to return to theWorkspace home page.
You have fully populated your workspace and are ready to create a new application.Proceed to the next lesson.
Chapter 3Reviewing the Created Tables with Object Browser
3-5
4Creating the Initial Application
About This Lesson
In this lesson, you use the Create Application Wizard to build the foundational pagesof your application based on the sample dataset.
After you build the foundation of your app, use Page Designer’s Create Page Wizardto add a new page to the existing app and run the app for the first time.
WARNING:
It is important to complete this chapter in one sitting. You cannot save yourwork until the end of the chapter. If you stop before completion and your ses‐sion times out, all your progress will be lost, and you will have to start thechapter again.
4.1 Running the Create Application WizardWith the tables populated in your workspace, you can get started quickly with the Cre‐ate Application Wizard.
The Create Application Wizard enables you to create many different types of pages,including reports, forms, and a master detail.
To create the initial application:
1. Click App Builder and select Create.
The Create Application Wizard appears.
Tip:
You can also click the down arrow icon on the tabs at the top of thescreen to view a list of shortcuts to the wizard and other pages.
2. Click New Application.
To customize your app name and appearance:
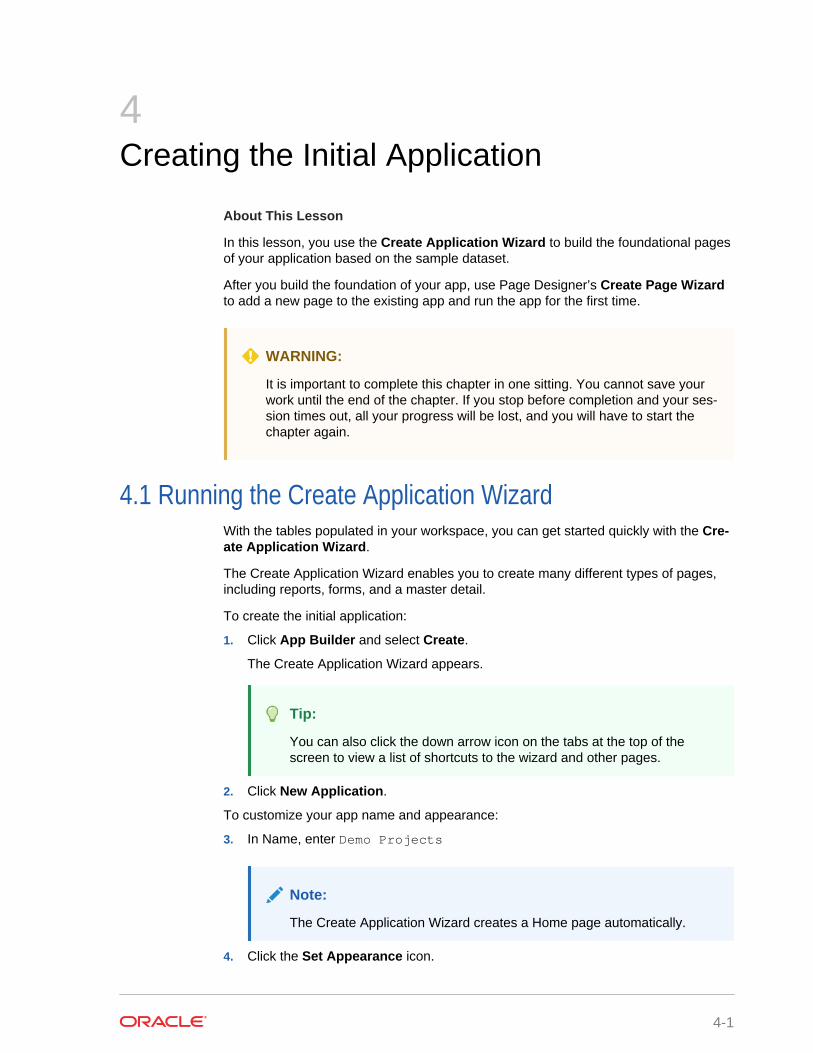
3. In Name, enter Demo Projects
Note:
The Create Application Wizard creates a Home page automatically.
4. Click the Set Appearance icon.
4-1

The Appearance dialog displays.
5. Click Vita - Red.
6. For Application Icon, click Choose New Icon.
The Choose Application Icon dialog displays.
7. Click the red circle icon.
8. Choose a new application icon, such as the trio of people.
9. Click Set Application Icon and click Save Changes.
4.2 Adding a Cards PageOften at the beginning of development, you only know some of the pages that your ap‐plication requires. You can create as few or as many pages as you want in the CreateApplication Wizard. Save some time by generating a small batch of pages now. Youcan always add more later with a different wizard (the Create Page Wizard).
Start with a cards page that enables employees to quickly view and maintain their con‐tact information.
Note:
A cards page consists of individual boxes, which resemble index cards, laidout on a page. Each card holds up to three pieces of information.
Chapter 4Adding a Cards Page
4-2
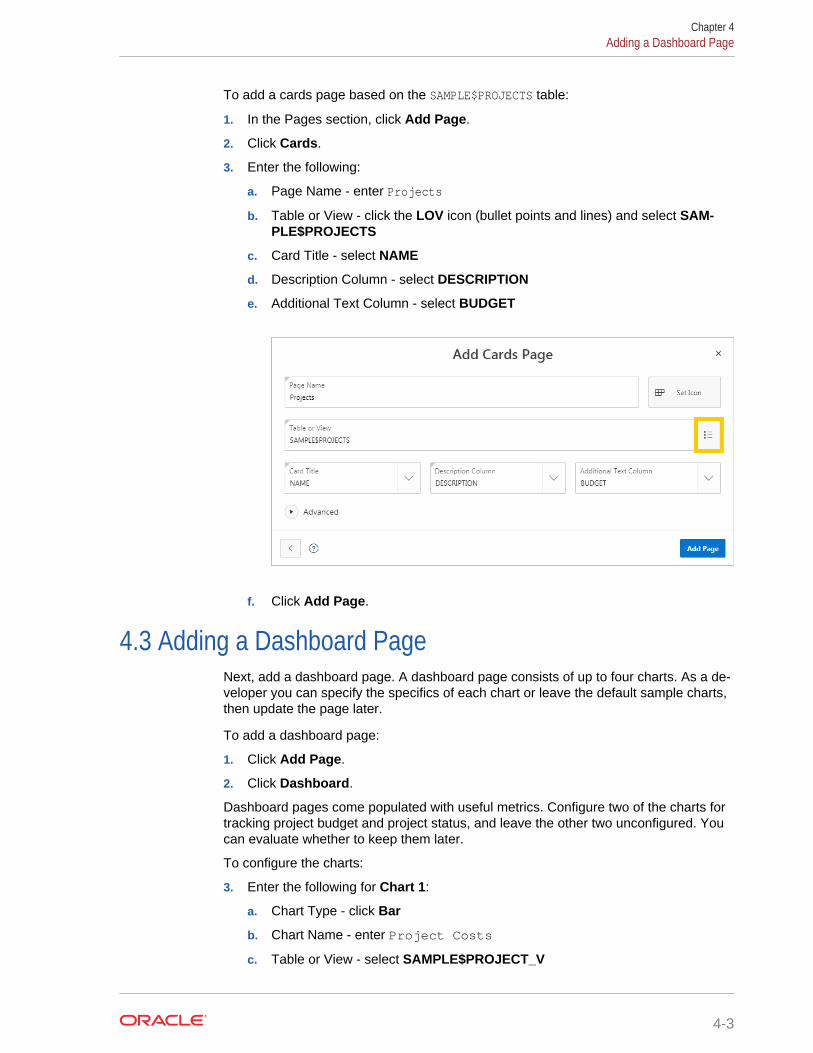
To add a cards page based on the SAMPLE$PROJECTS table:
1. In the Pages section, click Add Page.
2. Click Cards.
3. Enter the following:
a. Page Name - enter Projects
b. Table or View - click the LOV icon (bullet points and lines) and select SAM‐PLE$PROJECTS
c. Card Title - select NAME
d. Description Column - select DESCRIPTION
e. Additional Text Column - select BUDGET
f. Click Add Page.
4.3 Adding a Dashboard PageNext, add a dashboard page. A dashboard page consists of up to four charts. As a de‐veloper you can specify the specifics of each chart or leave the default sample charts,then update the page later.
To add a dashboard page:
1. Click Add Page.
2. Click Dashboard.
Dashboard pages come populated with useful metrics. Configure two of the charts fortracking project budget and project status, and leave the other two unconfigured. Youcan evaluate whether to keep them later.
To configure the charts:
3. Enter the following for Chart 1:
a. Chart Type - click Bar
b. Chart Name - enter Project Costs
c. Table or View - select SAMPLE$PROJECT_V
Chapter 4Adding a Dashboard Page
4-3
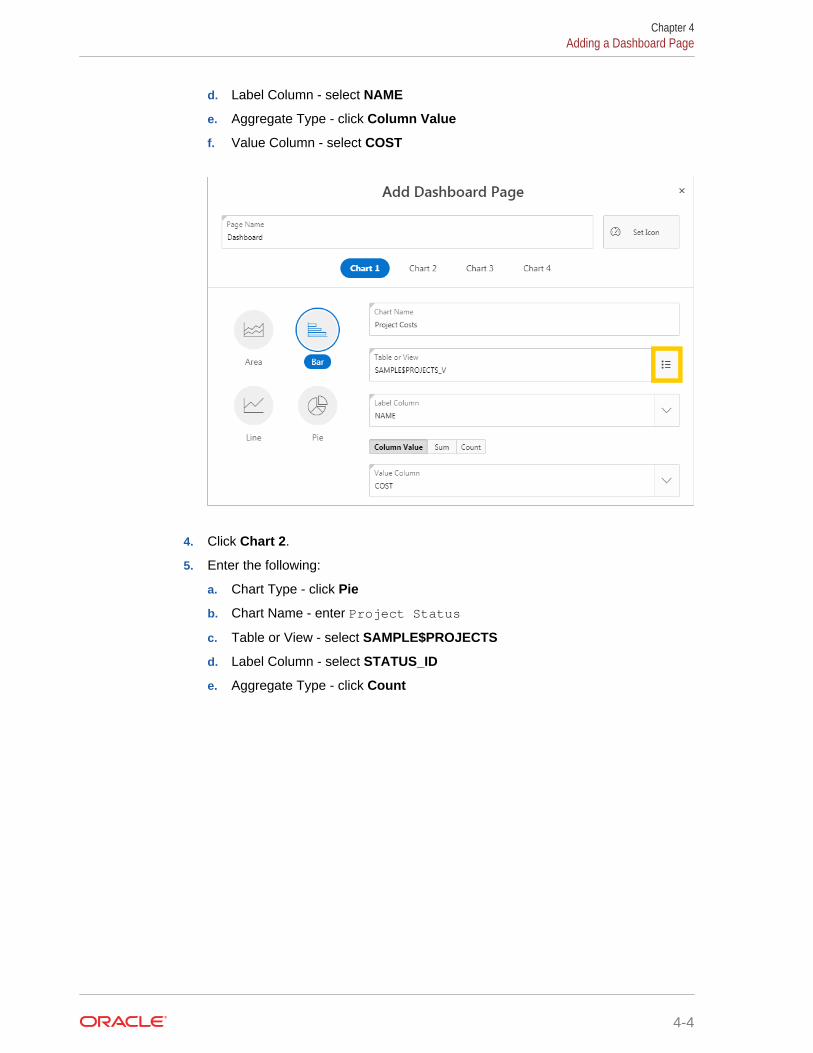
d. Label Column - select NAME
e. Aggregate Type - click Column Value
f. Value Column - select COST
4. Click Chart 2.
5. Enter the following:
a. Chart Type - click Pie
b. Chart Name - enter Project Status
c. Table or View - select SAMPLE$PROJECTS
d. Label Column - select STATUS_ID
e. Aggregate Type - click Count
Chapter 4Adding a Dashboard Page
4-4

6. Click Add Page.
4.4 Moving Pages in the Create Application WizardOnce you create a page, you can click the Edit icon to edit the page name, change theicon that displays in the navigation menu, edit Advanced options, or delete the page.In addition to the Edit button, you can change the order of pages by dragging anddropping.
To move a page in the Create Application Wizard:
1. For the Dashboard page, adjacent to the Edit button, click and hold the hambur‐ger icon (horizontal lines).
2. Drag the Dashboard page above the Projects page and release the mouse.
The Dashboard page snaps into place.
Chapter 4Moving Pages in the Create Application Wizard
4-5
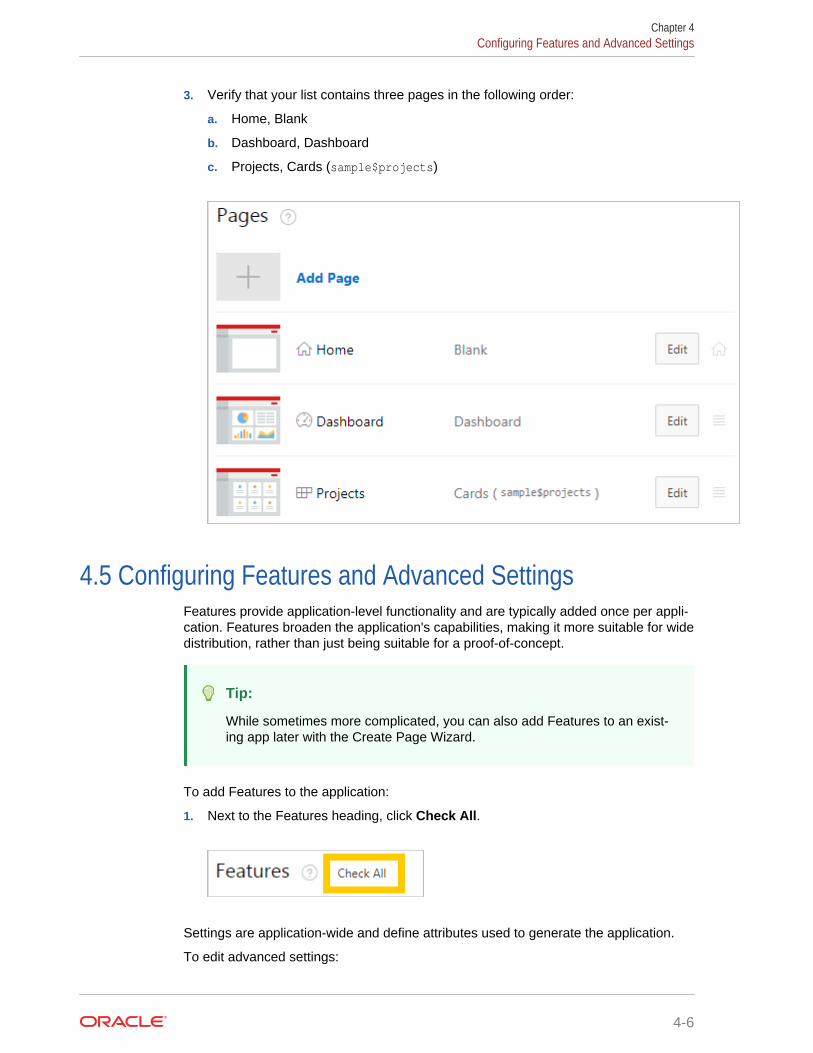
3. Verify that your list contains three pages in the following order:
a. Home, Blank
b. Dashboard, Dashboard
c. Projects, Cards (sample$projects)
4.5 Configuring Features and Advanced SettingsFeatures provide application-level functionality and are typically added once per appli‐cation. Features broaden the application's capabilities, making it more suitable for widedistribution, rather than just being suitable for a proof-of-concept.
Tip:
While sometimes more complicated, you can also add Features to an exist‐ing app later with the Create Page Wizard.
To add Features to the application:
1. Next to the Features heading, click Check All.
Settings are application-wide and define attributes used to generate the application.
To edit advanced settings:
Chapter 4Configuring Features and Advanced Settings
4-6
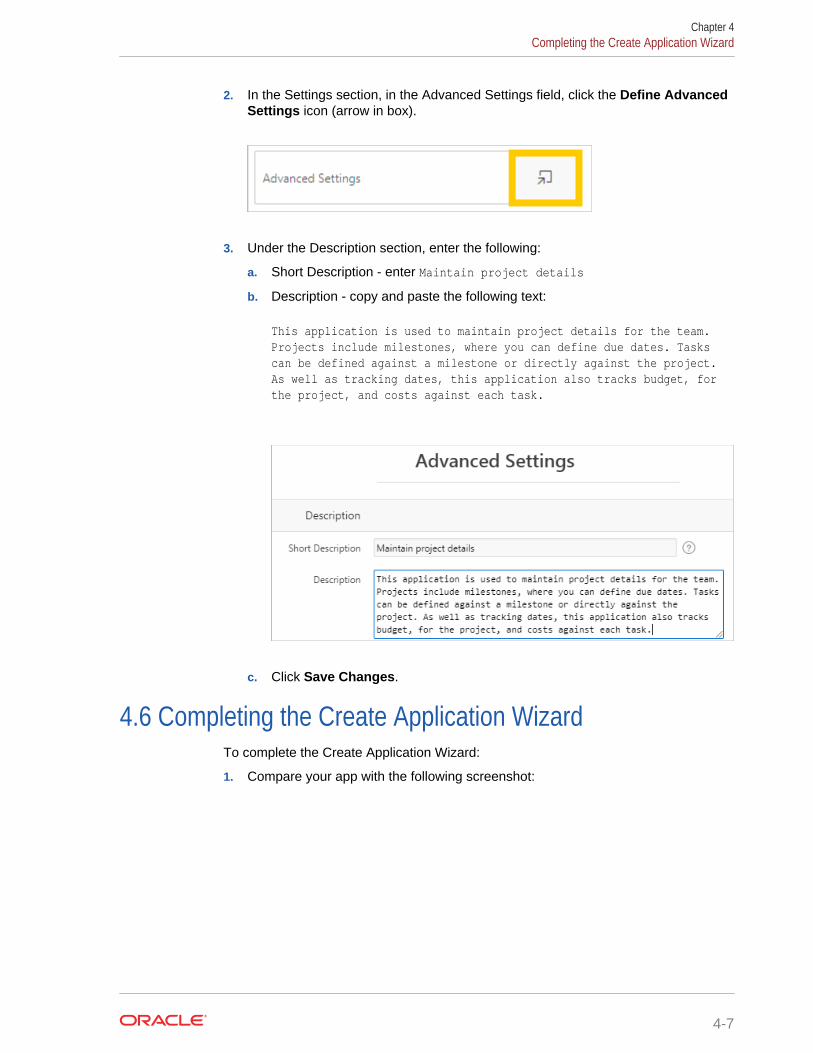
2. In the Settings section, in the Advanced Settings field, click the Define AdvancedSettings icon (arrow in box).
3. Under the Description section, enter the following:
a. Short Description - enter Maintain project details
b. Description - copy and paste the following text:
This application is used to maintain project details for the team. Projects include milestones, where you can define due dates. Tasks can be defined against a milestone or directly against the project. As well as tracking dates, this application also tracks budget, for the project, and costs against each task.
c. Click Save Changes.
4.6 Completing the Create Application WizardTo complete the Create Application Wizard:
1. Compare your app with the following screenshot:
Chapter 4Completing the Create Application Wizard
4-7

2. Click Create Application.
A progress bar displays. When complete, Application Express navigates to the Ap‐plication home page in App Builder.
Chapter 4Completing the Create Application Wizard
4-8
Note:
Page 0 is a global page where you can define components to be dis‐played on all pages. Page 9999 is the Sign In page where end users au‐thenticate when first accessing the application (enter their username andpassword). Pages 1000 and greater are administrative pages created forthe features that you selected.
4.7 Running the Application for the First TimeYour app is functionally ready to run.
When you "run" an app, you are telling Application Express to open a new browserwindow and render the app. The rendered app is called the "application runtime" (orjust "runtime"). As you create new pages, you can run them individually, or run an en‐tire application.
Run the app for the first time from the Application home page and review the applica‐tion runtime.
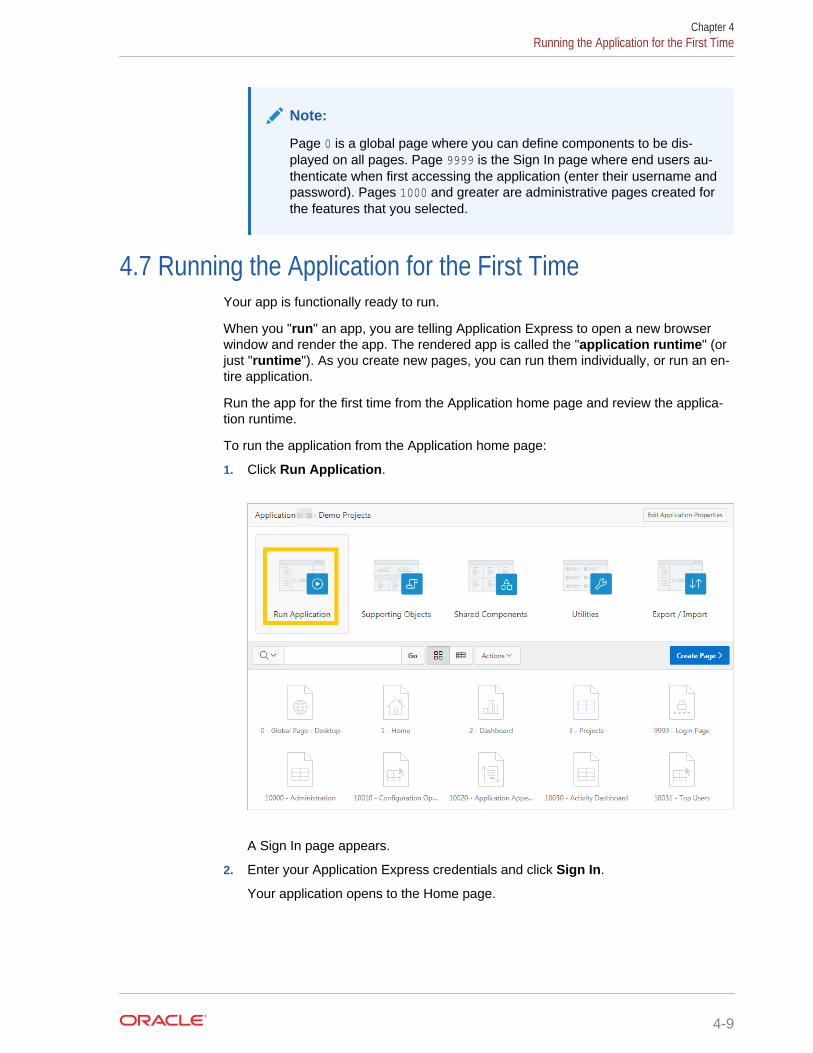
To run the application from the Application home page:
1. Click Run Application.
A Sign In page appears.
2. Enter your Application Express credentials and click Sign In.
Your application opens to the Home page.
Chapter 4Running the Application for the First Time
4-9
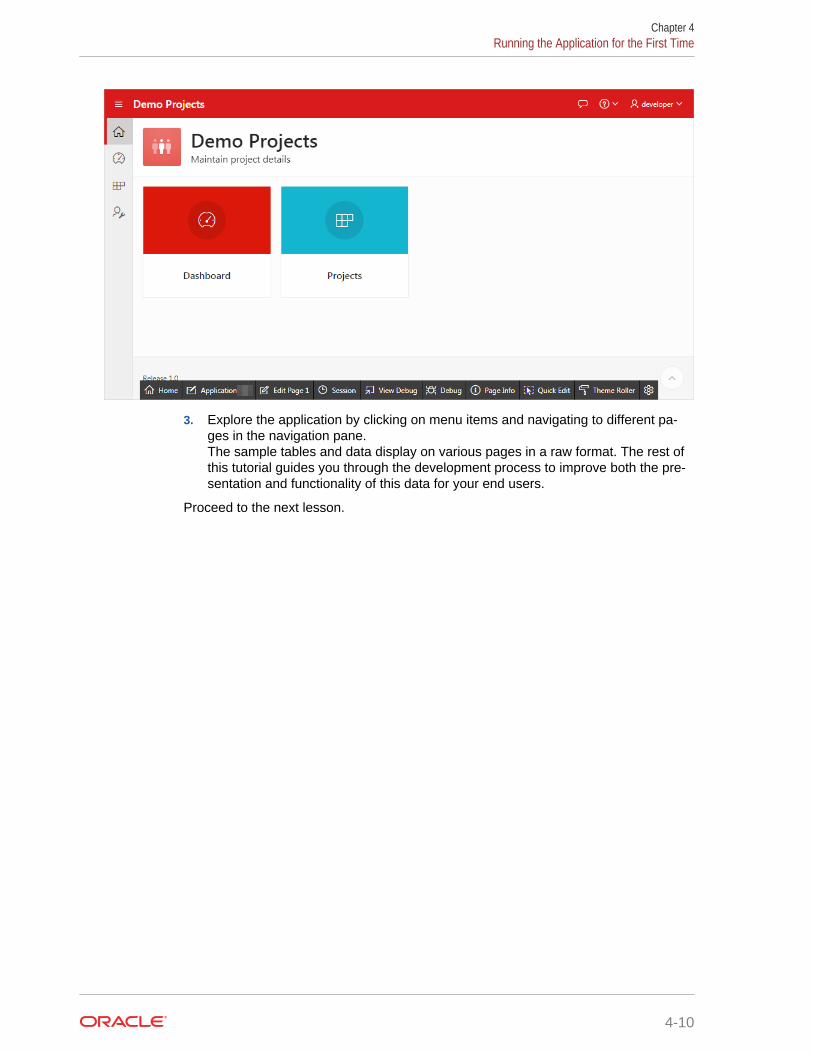
3. Explore the application by clicking on menu items and navigating to different pa‐ges in the navigation pane.The sample tables and data display on various pages in a raw format. The rest ofthis tutorial guides you through the development process to improve both the pre‐sentation and functionality of this data for your end users.
Proceed to the next lesson.
Chapter 4Running the Application for the First Time
4-10
5Developing the Projects Page
Use the Create Page Wizard and Page Designer to add a sophisticated form page forthe Projects report.
About This Lesson
In this lesson, you are introduced to the two primary means of development: Page De‐signer and the Application Runtime ("runtime" for short).
In Page Designer, use the Rendering tab and Layout tab to add new regions to theProjects page. Then, use the Property Editor to edit a wide array of attributes for re‐gion and page components, including SQL statements and appearance options.
In the runtime, you use the Runtime Developer toolbar to make changes on the pageimmediately and to quickly shift back to Page Designer.
Starting from here:
5 - Projects.sqlIf you have not completed the previous lessons, you can use the appendix"Importing an Application into a Workspace" to import the above SQL scriptinto your workspace and continue working from this lesson forward.
5.1 Navigating to Page Designer from the Application Run‐time
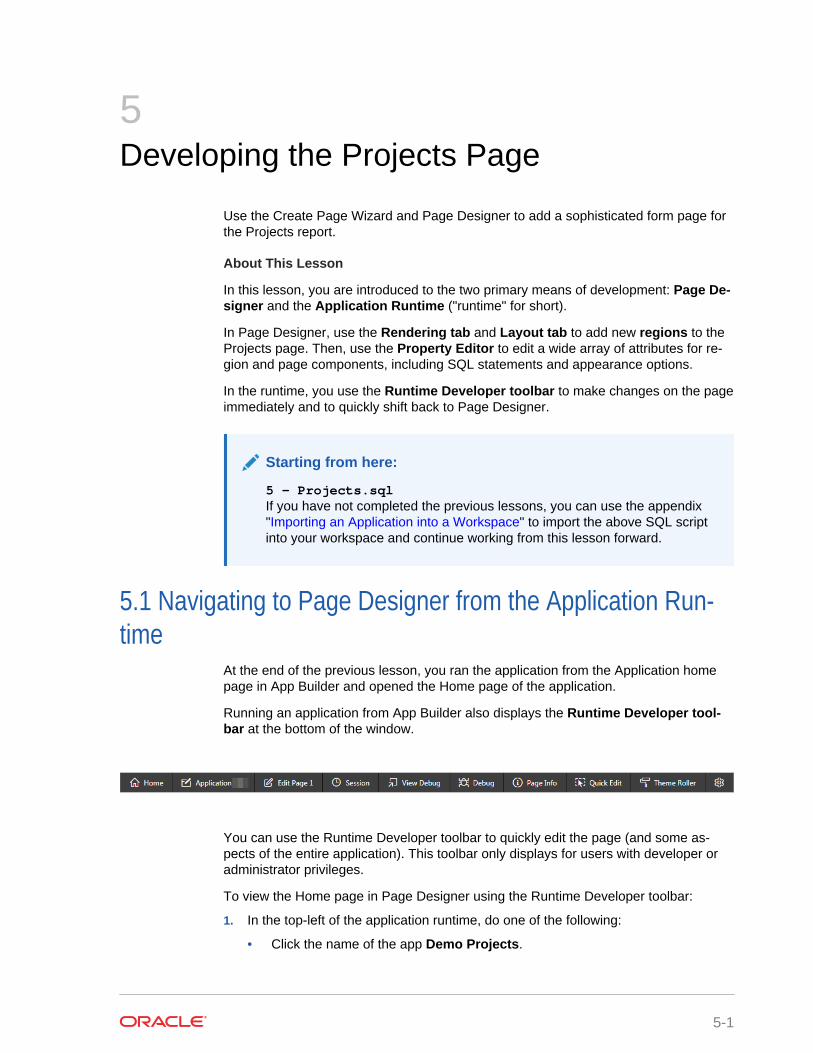
At the end of the previous lesson, you ran the application from the Application homepage in App Builder and opened the Home page of the application.
Running an application from App Builder also displays the Runtime Developer tool‐bar at the bottom of the window.
You can use the Runtime Developer toolbar to quickly edit the page (and some as‐pects of the entire application). This toolbar only displays for users with developer oradministrator privileges.
To view the Home page in Page Designer using the Runtime Developer toolbar:
1. In the top-left of the application runtime, do one of the following:
• Click the name of the app Demo Projects.
5-1
• Click the Home link in the sidebar. (Do not click Home on the Developer Tool‐bar.)
The runtime Home page displays.
2. On the Runtime Developer toolbar, click Edit Page 1.
Note:
The number in the Edit Page # button corresponds to its assigned pagenumber in Page Designer.
Page Designer displays page 1.
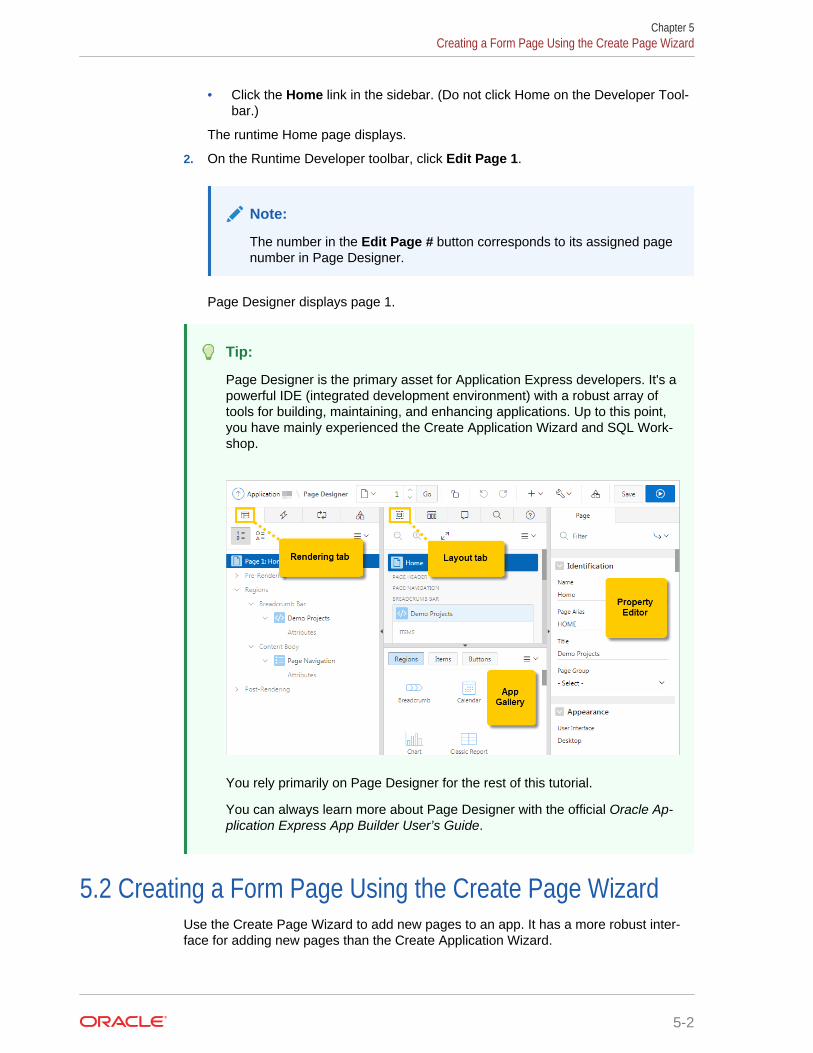
Tip:
Page Designer is the primary asset for Application Express developers. It's apowerful IDE (integrated development environment) with a robust array oftools for building, maintaining, and enhancing applications. Up to this point,you have mainly experienced the Create Application Wizard and SQL Work‐shop.
You rely primarily on Page Designer for the rest of this tutorial.
You can always learn more about Page Designer with the official Oracle Ap‐plication Express App Builder User’s Guide.
5.2 Creating a Form Page Using the Create Page WizardUse the Create Page Wizard to add new pages to an app. It has a more robust inter‐face for adding new pages than the Create Application Wizard.
Chapter 5Creating a Form Page Using the Create Page Wizard
5-2
Add a form to the Projects report to give your users a way to edit the information them‐selves.
To open the Create Page Wizard in Page Designer:
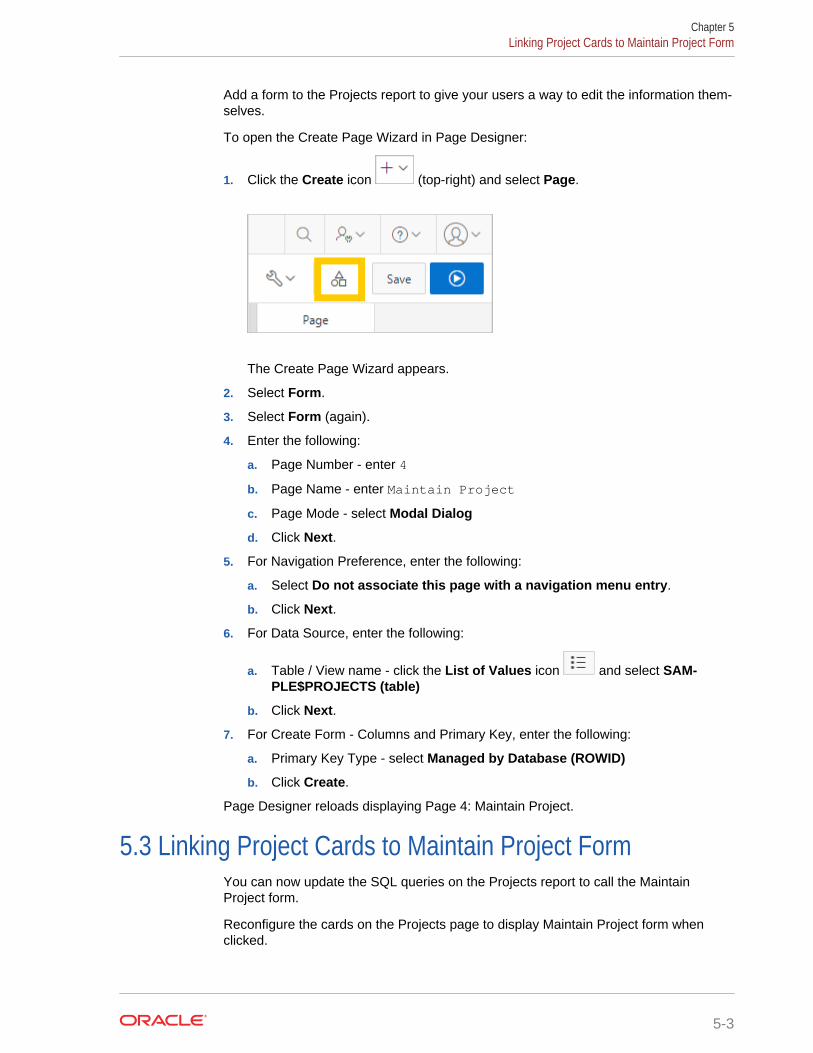
1. Click the Create icon (top-right) and select Page.
The Create Page Wizard appears.
2. Select Form.
3. Select Form (again).
4. Enter the following:
a. Page Number - enter 4
b. Page Name - enter Maintain Project
c. Page Mode - select Modal Dialog
d. Click Next.
5. For Navigation Preference, enter the following:
a. Select Do not associate this page with a navigation menu entry.
b. Click Next.
6. For Data Source, enter the following:
a. Table / View name - click the List of Values icon and select SAM‐PLE$PROJECTS (table)
b. Click Next.
7. For Create Form - Columns and Primary Key, enter the following:
a. Primary Key Type - select Managed by Database (ROWID)
b. Click Create.
Page Designer reloads displaying Page 4: Maintain Project.
5.3 Linking Project Cards to Maintain Project FormYou can now update the SQL queries on the Projects report to call the MaintainProject form.
Reconfigure the cards on the Projects page to display Maintain Project form whenclicked.
Chapter 5Linking Project Cards to Maintain Project Form
5-3
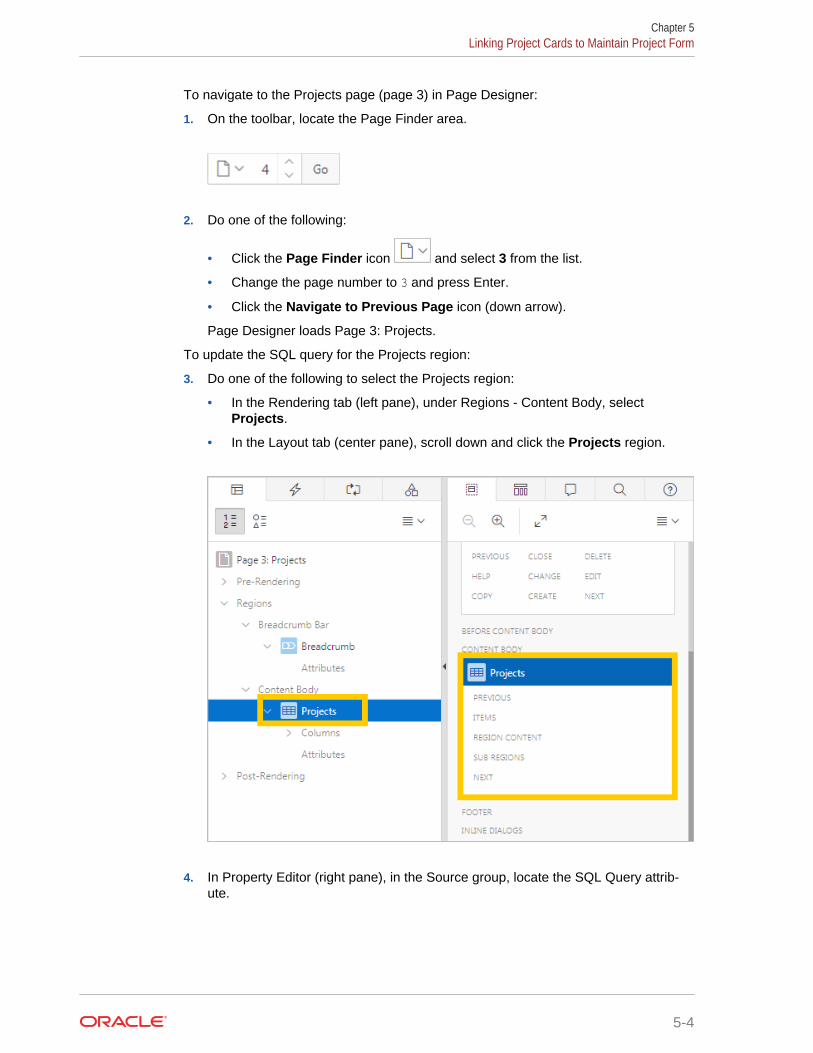
To navigate to the Projects page (page 3) in Page Designer:
1. On the toolbar, locate the Page Finder area.
2. Do one of the following:
• Click the Page Finder icon and select 3 from the list.
• Change the page number to 3 and press Enter.
• Click the Navigate to Previous Page icon (down arrow).
Page Designer loads Page 3: Projects.
To update the SQL query for the Projects region:
3. Do one of the following to select the Projects region:
• In the Rendering tab (left pane), under Regions - Content Body, selectProjects.
• In the Layout tab (center pane), scroll down and click the Projects region.
4. In Property Editor (right pane), in the Source group, locate the SQL Query attrib‐ute.
Chapter 5Linking Project Cards to Maintain Project Form
5-4
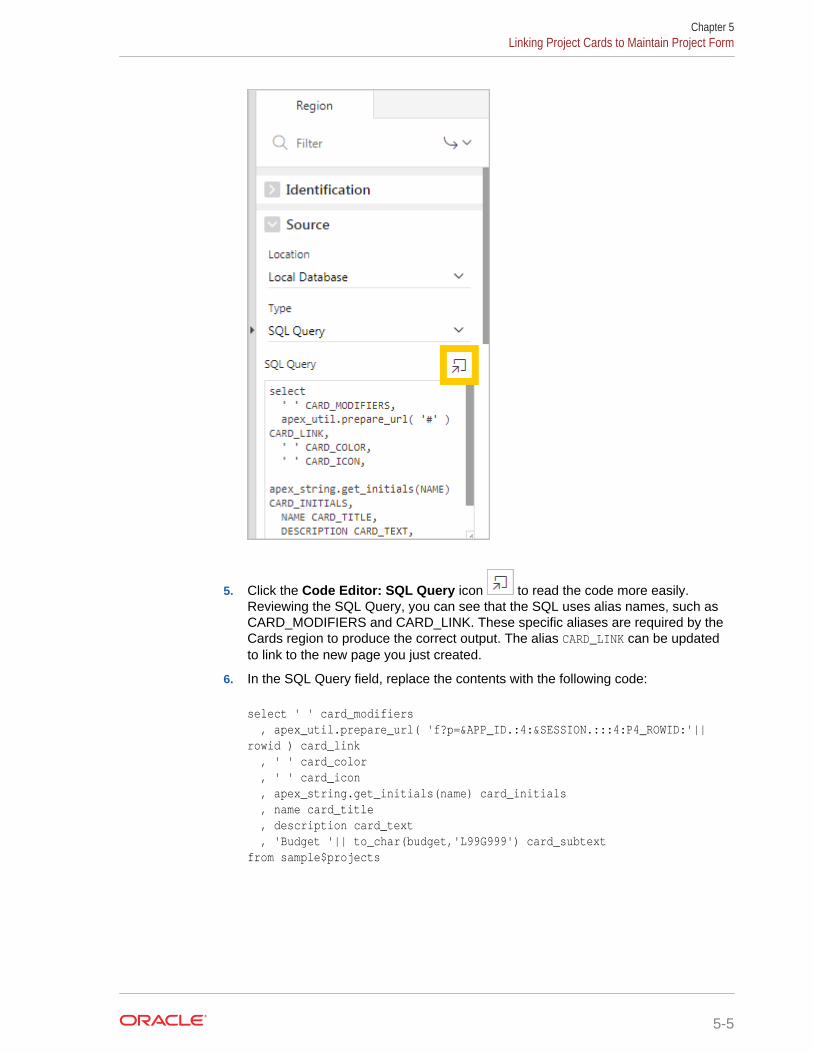
5. Click the Code Editor: SQL Query icon to read the code more easily.Reviewing the SQL Query, you can see that the SQL uses alias names, such asCARD_MODIFIERS and CARD_LINK. These specific aliases are required by theCards region to produce the correct output. The alias CARD_LINK can be updatedto link to the new page you just created.
6. In the SQL Query field, replace the contents with the following code:
select ' ' card_modifiers , apex_util.prepare_url( 'f?p=&APP_ID.:4:&SESSION.:::4:P4_ROWID:'|| rowid ) card_link , ' ' card_color , ' ' card_icon , apex_string.get_initials(name) card_initials , name card_title , description card_text , 'Budget '|| to_char(budget,'L99G999') card_subtextfrom sample$projects
Chapter 5Linking Project Cards to Maintain Project Form
5-5

7. Click the Validate icon to verify.
The message Validation successful displays at the top of the window.
8. Click OK.
9. Click Save and Run Page .
a. If you receive a warning dialog, click Try Again.
Tip:
You can also click the "Save" button and then "Save and Run Page"to avoid this warning.
The Projects page loads in the runtime.
10. Click a project to view the Maintain Project form for that project.You should hide several fields to restrict access. For example, if one had full ac‐cess to project IDs or timestamps, one could easily compromise your database--byaccident or otherwise.
To quickly return to Maintain Project form in Page Designer:
11. On the Runtime Developer toolbar at the bottom of the screen, click Edit Page 4.
Page Designer loads Page 4: Maintain Project.
5.4 Updating the Maintain Project Form in Page DesignerUse Page Designer to make the following updates to the Maintain Project form (page4) to improve usability and security:
• Hide a column by changing the type to hidden
• Move an item within an existing region
• Change an item to a select list
• Change multiple items to text fields
• Create a sub region to organize items into a read-only, expandable group
To rename a region:
1. In the Rendering or Layout tab, click Create Form.
2. In Property Editor:
Chapter 5Updating the Maintain Project Form in Page Designer
5-6
a. Identification: Title - enter Maintain Project
End users do not need to see the ID column in the form. Change P4_ID to a hiddencolumn to keep it from rendering in the app at all.
To hide a column in Page Designer:
3. In the Layout tab, click the P4_ID item.
4. In Property Editor:
a. Identification: Type - select Hidden.
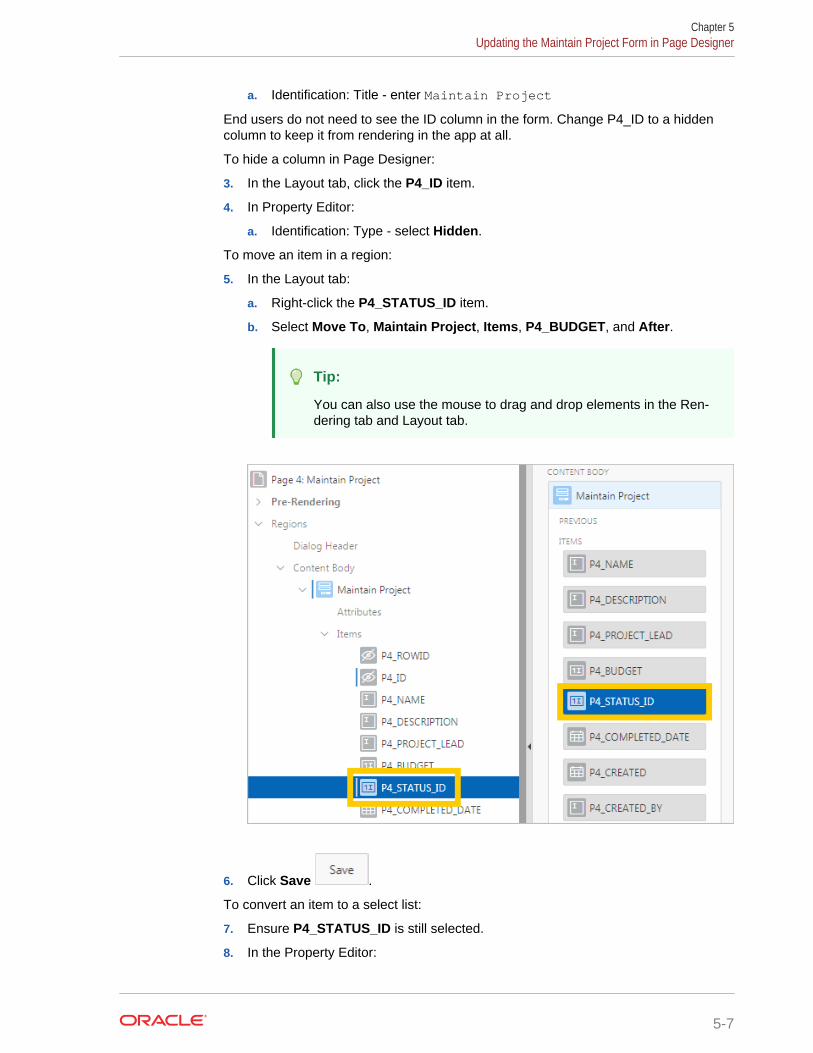
To move an item in a region:
5. In the Layout tab:
a. Right-click the P4_STATUS_ID item.
b. Select Move To, Maintain Project, Items, P4_BUDGET, and After.
Tip:
You can also use the mouse to drag and drop elements in the Ren‐dering tab and Layout tab.
6. Click Save .
To convert an item to a select list:
7. Ensure P4_STATUS_ID is still selected.
8. In the Property Editor:
Chapter 5Updating the Maintain Project Form in Page Designer
5-7

a. Identification: Type - select Select List.
b. Label: Label - enter Status
c. List of Values: Type - select SQL Query.
d. List of Values: SQL Query - enter the following:
select description d, id rfrom SAMPLE$PROJECT_STATUSorder by display_order
e. List of Values: Display Extra Values - select No.
f. List of Values: Null Display Value - enter the following:
- Select Status -
Chapter 5Updating the Maintain Project Form in Page Designer
5-8
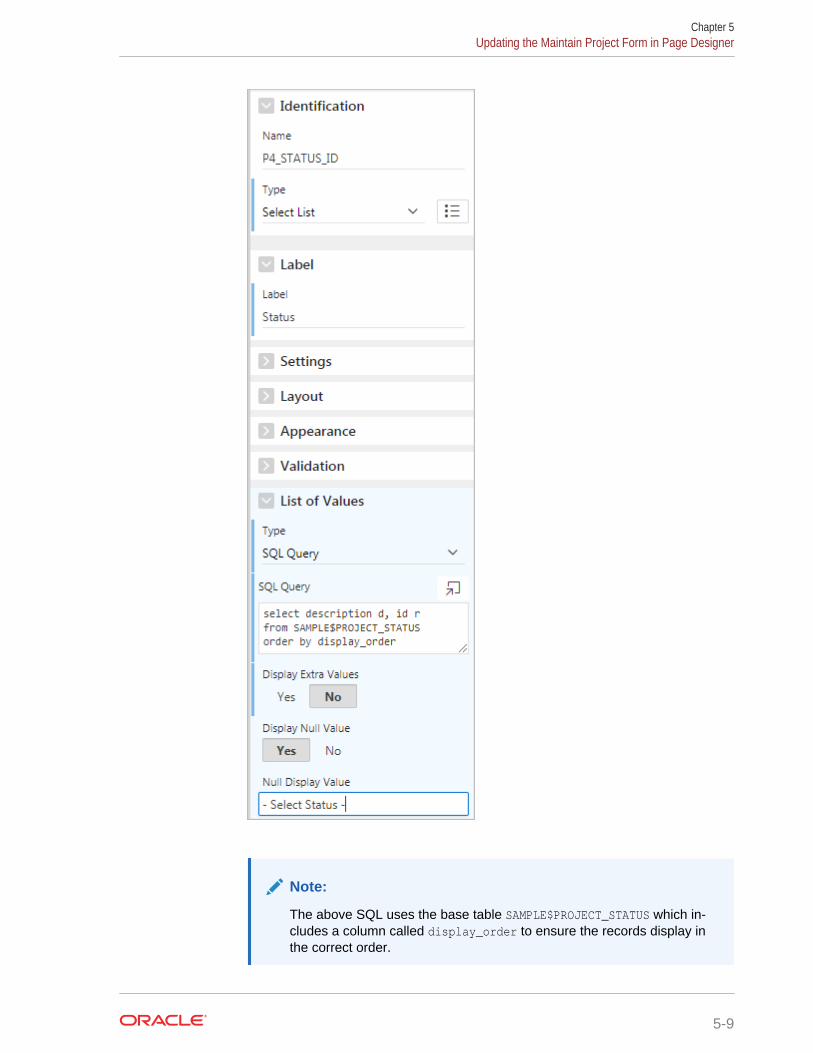
Note:
The above SQL uses the base table SAMPLE$PROJECT_STATUS which in‐cludes a column called display_order to ensure the records display inthe correct order.
Chapter 5Updating the Maintain Project Form in Page Designer
5-9

9. Click Save.
To change multiple items simultaneously:10. Press and hold the Ctrl key and click the following items to select both of them:
a. P4_NAME
b. P4_PROJECT_LEAD
11. In the Property Editor:
a. Identification: Type - select Text Field.
Note:
When selecting multiple elements, the Property Editor only displays theattributes that all the selected elements have in common.
To create a collapsible sub region:12. In the Rendering tab, right-click the Maintain Project region and select Create
Sub Region.
The New sub region appears within the Sub Regions folder.
Chapter 5Updating the Maintain Project Form in Page Designer
5-10
13. In the Property Editor:
a. Identification: Title - enter Audit Details
b. Appearance: Template - select Collapsible.
c. Server-side Condition: Type - select Item is NOT NULL.
d. Server-side Condition: Item - enter P4_ROWID (you can also select the pagefrom a pop-up list).
Note:
Setting the Server-side Condition checks that the Rowid is not null andonly displays the region when a user updates the record.
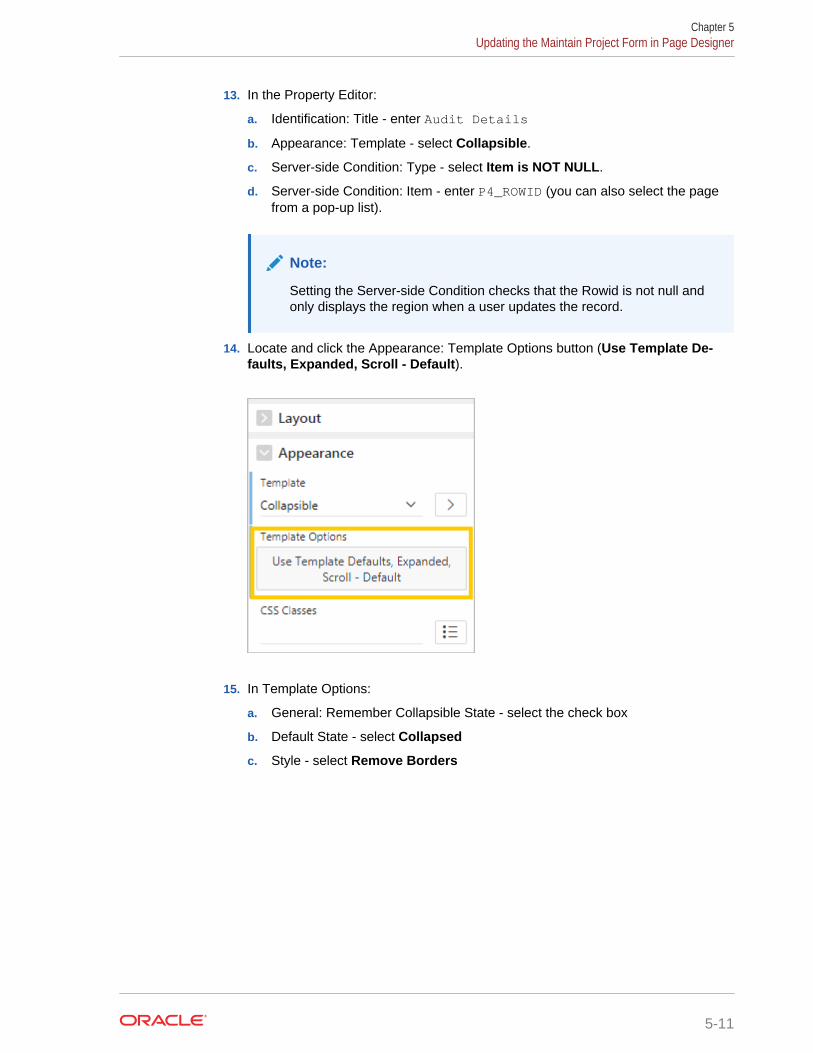
14. Locate and click the Appearance: Template Options button (Use Template De‐faults, Expanded, Scroll - Default).
15. In Template Options:
a. General: Remember Collapsible State - select the check box
b. Default State - select Collapsed
c. Style - select Remove Borders
Chapter 5Updating the Maintain Project Form in Page Designer
5-11
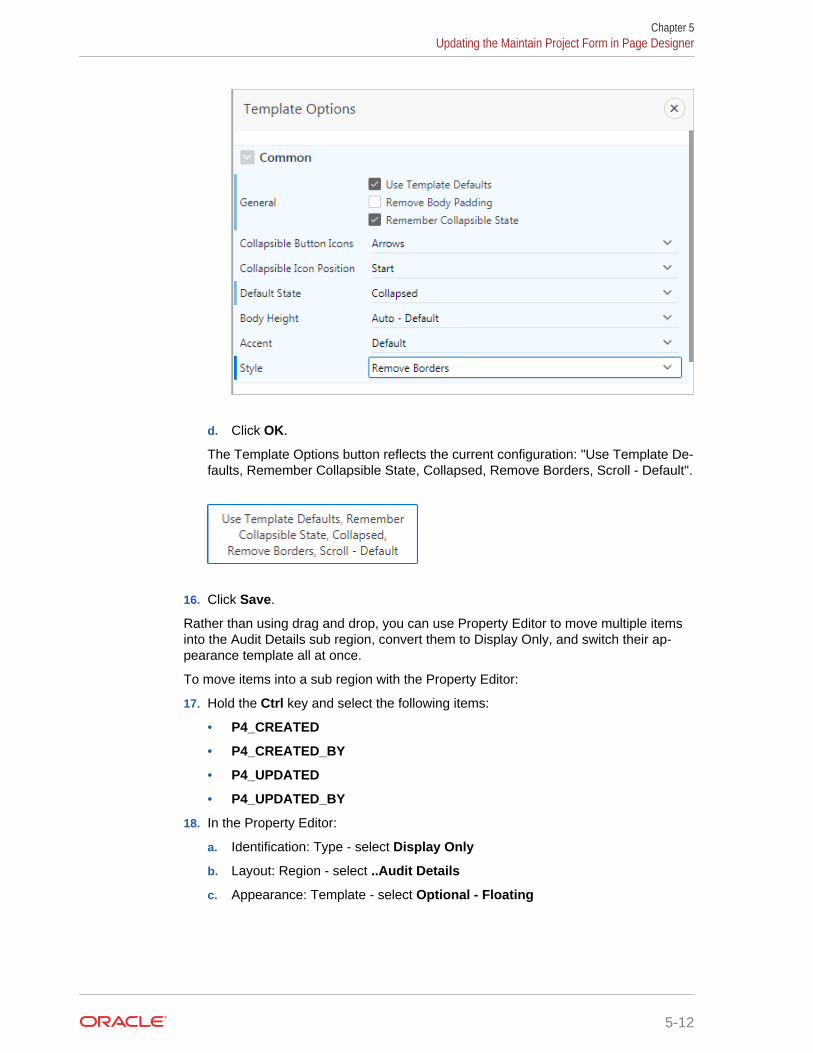
d. Click OK.
The Template Options button reflects the current configuration: "Use Template De‐faults, Remember Collapsible State, Collapsed, Remove Borders, Scroll - Default".
16. Click Save.
Rather than using drag and drop, you can use Property Editor to move multiple itemsinto the Audit Details sub region, convert them to Display Only, and switch their ap‐pearance template all at once.
To move items into a sub region with the Property Editor:
17. Hold the Ctrl key and select the following items:
• P4_CREATED
• P4_CREATED_BY
• P4_UPDATED
• P4_UPDATED_BY
18. In the Property Editor:
a. Identification: Type - select Display Only
b. Layout: Region - select ..Audit Details
c. Appearance: Template - select Optional - Floating
Chapter 5Updating the Maintain Project Form in Page Designer
5-12

Note:
The double periods are a shortening device for the names of sub re‐gions in the interface. Think of it as actually reading "the sub regionAudit Details."
The items move into the sub region.
19. Click Save.
The Maintain Project form is a modal page. You cannot run a modal page directly fromPage Designer the way you can other pages. You must navigate to the associatednon-modal page in the runtime (in this case, page 3 - Projects), then open the modalpage from there.
To run the modal Maintain Project page:
20. In the runtime, reload the Projects page. (Click your browser's refresh or reloadbutton.)
21. Click a project card.
Note the changed Status field and expandable Audit Details region. Trying clickingeach and observe how the page responds.
Chapter 5Updating the Maintain Project Form in Page Designer
5-13
22. When finished, click Edit Page 4 on the toolbar to return to Maintain Project inPage Designer.
5.5 Creating a Dynamic ActionAdd a Dynamic Action to the P4_STATUS_ID item select lists so that when the userchanges the project Status to "Completed," the completion date displays.
Dynamic Actions within Application Express are used to declaratively define client-sidebehaviors without writing JavaScript or AJAX. Instead, the Application Express engineimplements the necessary code based on your declaration.
To create a Dynamic Action:
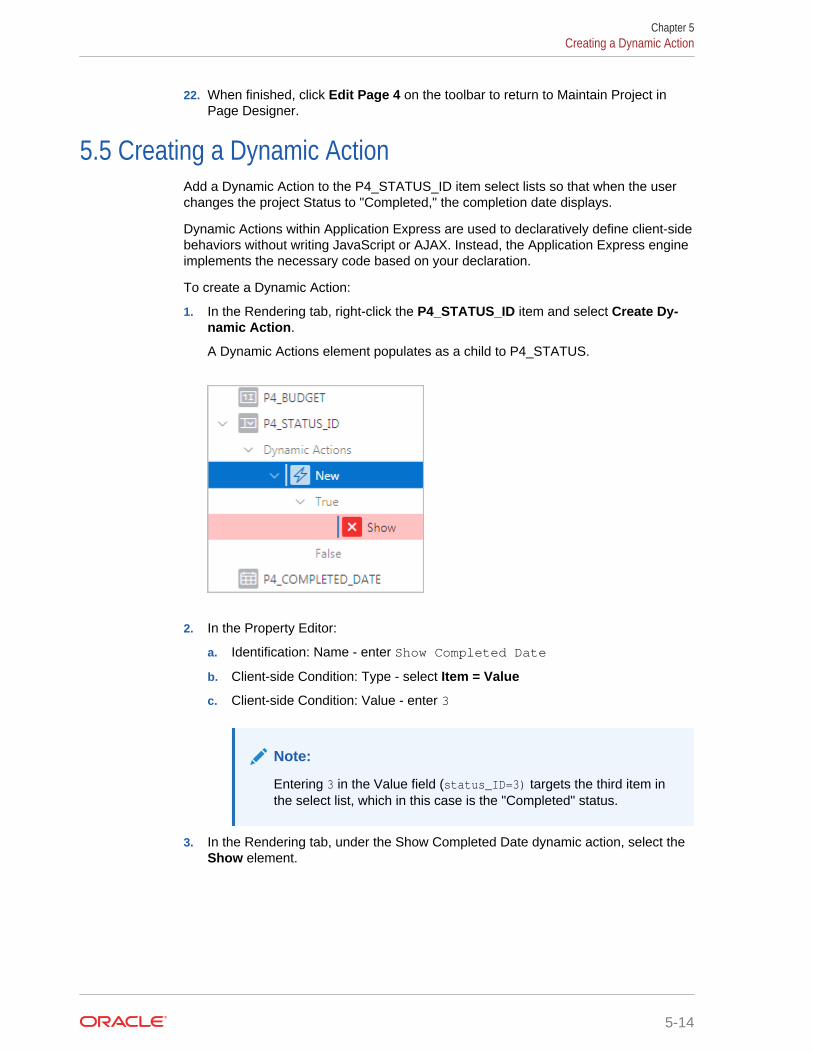
1. In the Rendering tab, right-click the P4_STATUS_ID item and select Create Dy‐namic Action.
A Dynamic Actions element populates as a child to P4_STATUS.
2. In the Property Editor:
a. Identification: Name - enter Show Completed Date
b. Client-side Condition: Type - select Item = Value
c. Client-side Condition: Value - enter 3
Note:
Entering 3 in the Value field (status_ID=3) targets the third item inthe select list, which in this case is the "Completed" status.
3. In the Rendering tab, under the Show Completed Date dynamic action, select theShow element.
Chapter 5Creating a Dynamic Action
5-14
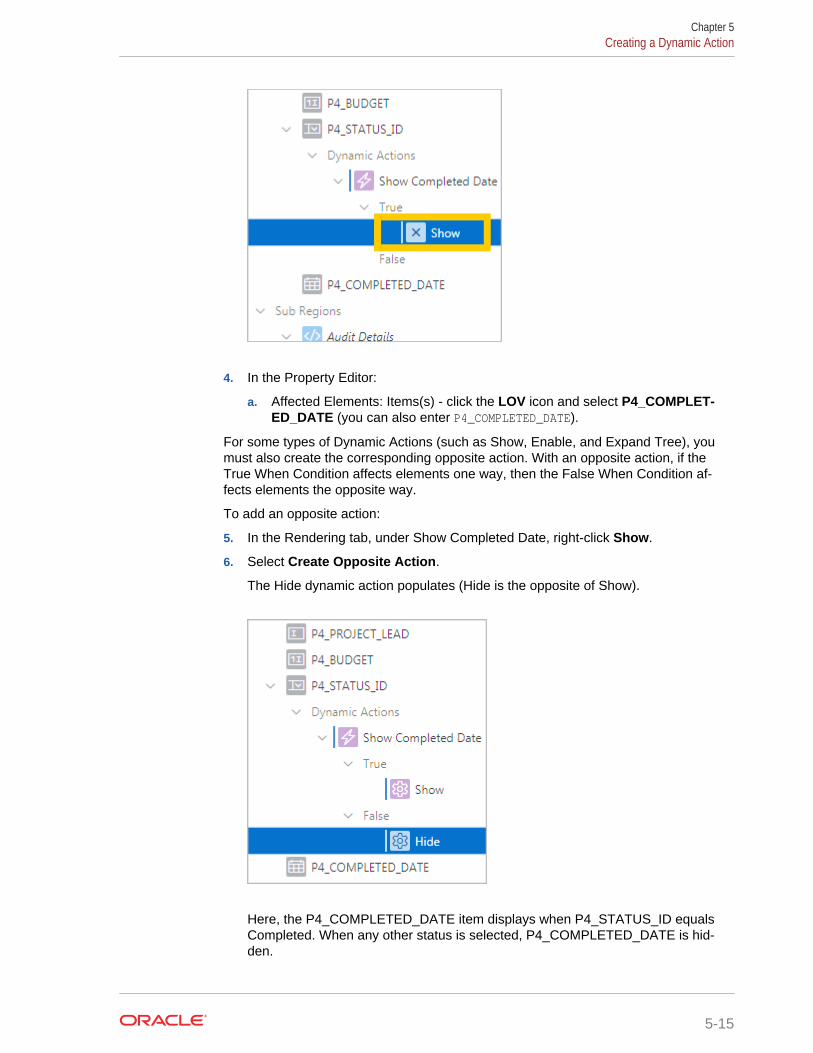
4. In the Property Editor:
a. Affected Elements: Items(s) - click the LOV icon and select P4_COMPLET‐ED_DATE (you can also enter P4_COMPLETED_DATE).
For some types of Dynamic Actions (such as Show, Enable, and Expand Tree), youmust also create the corresponding opposite action. With an opposite action, if theTrue When Condition affects elements one way, then the False When Condition af‐fects elements the opposite way.
To add an opposite action:
5. In the Rendering tab, under Show Completed Date, right-click Show.
6. Select Create Opposite Action.
The Hide dynamic action populates (Hide is the opposite of Show).
Here, the P4_COMPLETED_DATE item displays when P4_STATUS_ID equalsCompleted. When any other status is selected, P4_COMPLETED_DATE is hid‐den.
Chapter 5Creating a Dynamic Action
5-15
7. Click Save.
5.6 Adding Validations to Completed DatePage validations ensure the data entered by end users is correct. If a validation fails,then an error message is raised, and the values are not saved to the database.
Add two validations to the Completed Date item so that:
• When a user changes the status to Completed, they must also add the date.
• A user cannot enter a date in the future.
To create a new validation:
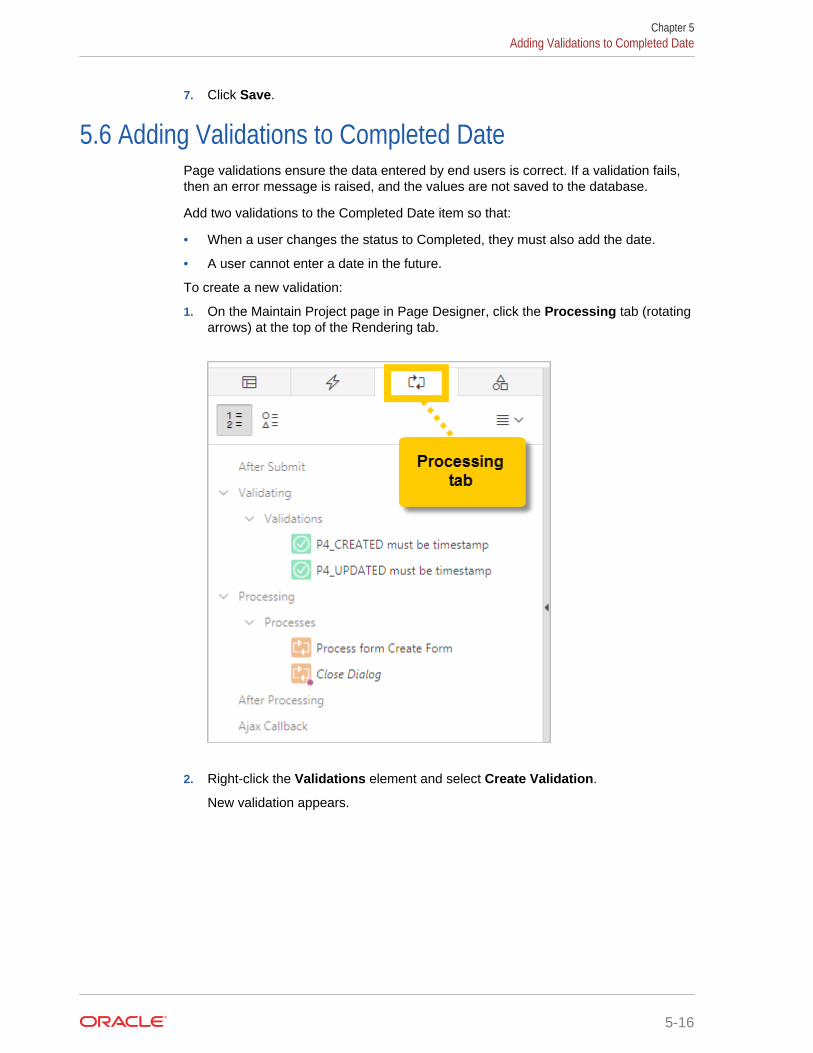
1. On the Maintain Project page in Page Designer, click the Processing tab (rotatingarrows) at the top of the Rendering tab.
2. Right-click the Validations element and select Create Validation.
New validation appears.
Chapter 5Adding Validations to Completed Date
5-16
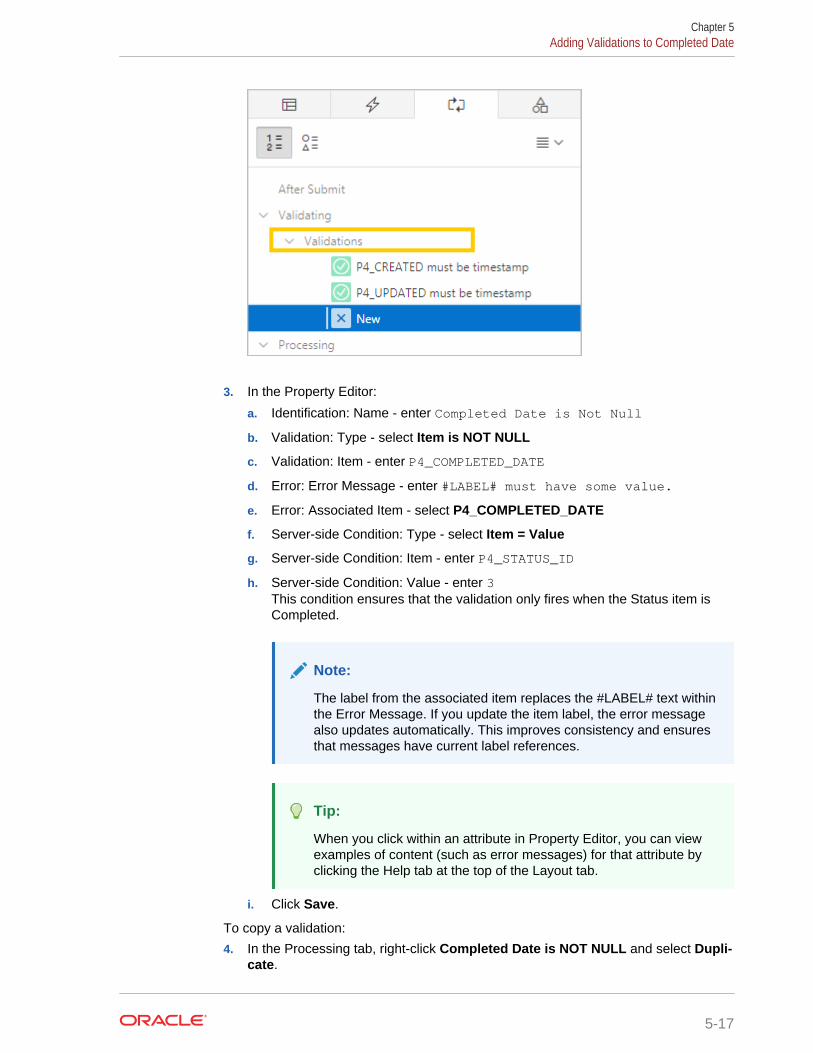
3. In the Property Editor:
a. Identification: Name - enter Completed Date is Not Null
b. Validation: Type - select Item is NOT NULL
c. Validation: Item - enter P4_COMPLETED_DATE
d. Error: Error Message - enter #LABEL# must have some value.
e. Error: Associated Item - select P4_COMPLETED_DATE
f. Server-side Condition: Type - select Item = Value
g. Server-side Condition: Item - enter P4_STATUS_ID
h. Server-side Condition: Value - enter 3This condition ensures that the validation only fires when the Status item isCompleted.
Note:
The label from the associated item replaces the #LABEL# text withinthe Error Message. If you update the item label, the error messagealso updates automatically. This improves consistency and ensuresthat messages have current label references.
Tip:
When you click within an attribute in Property Editor, you can viewexamples of content (such as error messages) for that attribute byclicking the Help tab at the top of the Layout tab.
i. Click Save.
To copy a validation:
4. In the Processing tab, right-click Completed Date is NOT NULL and select Dupli‐cate.
Chapter 5Adding Validations to Completed Date
5-17
The item "Completed Date is NOT NULL_1" appears, selected.
5. In the Property Editor:
a. Identification: Name - enter Completed Date is not Forward Dated
b. Validation: Type - select PL/SQL Expression
c. Validation: PL/SQL Expression - enter :P4_COMPLETED_DATE <= SYSDATE
Tip:
Ensure you include the colon ( : ). To reference a page item in PL/SQL, you use the :ITEM_NAME syntax. SYSDATE returns the currentdate from the Oracle Database.
d. Error: Error Message - enter #LABEL# cannot be a future date
e. Server-side Condition: Type - select Item is NOT NULL
f. Server-side Condition: Item - enter P4_COMPLETED_DATE
6. Click Save.
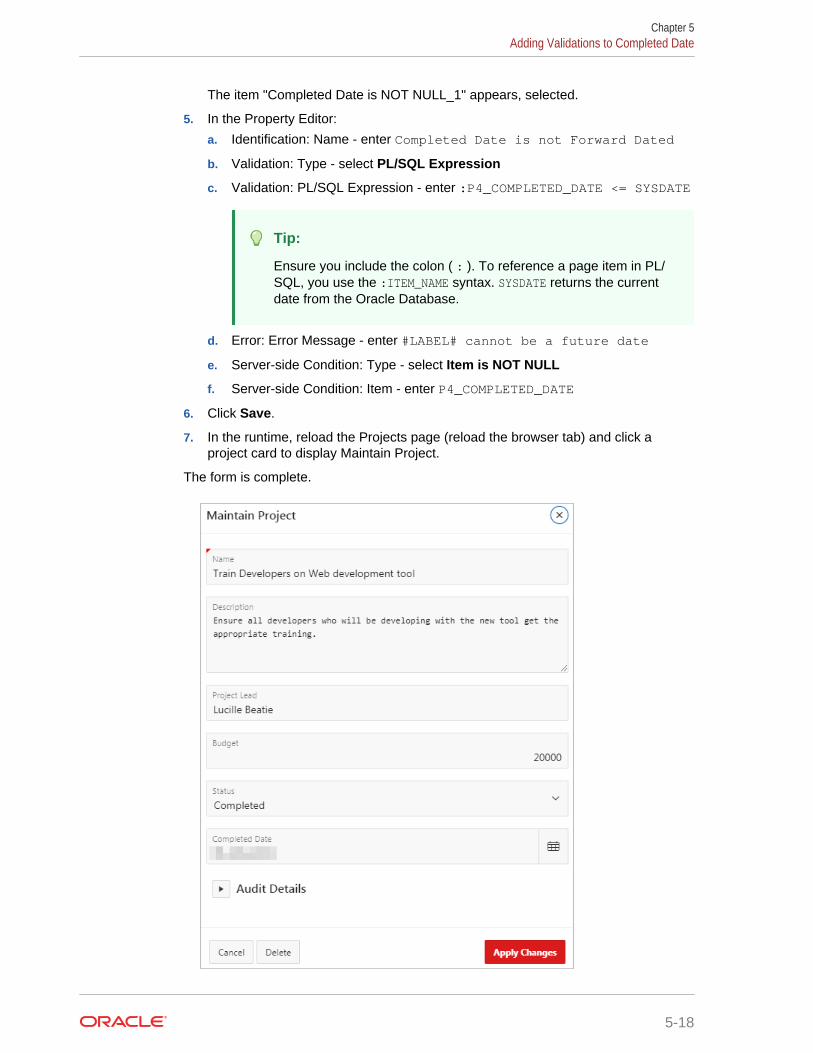
7. In the runtime, reload the Projects page (reload the browser tab) and click aproject card to display Maintain Project.
The form is complete.
Chapter 5Adding Validations to Completed Date
5-18
Try the following tasks to see how the application behaves:
• Change the Status and see how the Completed Date displays or vanishes.
• Find an In-Progress project, change the status to Completed but leave the Com‐pletion Date empty, and click Apply Changes. (An error message should display.)
• Enter a Completion Date in the future and click Apply Changes. (An error mes‐sage should display.)
When finished, click Application ##### on the Developer Toolbar to return to the Ap‐plication home page.
Chapter 5Adding Validations to Completed Date
5-19
6Developing the Milestones Page
Use the Create Page Wizard and Page Designer to add an interactive grid page to theapplication so that users can manage project Milestones.
In this lesson, you use the Create Page Wizard to add a new interactive grid page.Similar to the older interactive report, interactive grids do not require a paired formpage to change the content displayed on the page.
In addition to the DEMO_PROJECTS table, the app also contains the DEMO_MILESTONESand DEMO_TASKS tables. These two tables contain data for incremental milestones andtasks that help to track the progress of an entire project more precisely.
Currently, your app only supports changes to the status of entire projects. Develop theMilestones interactive grid so that your users can view and change the status of thesetasks and milestones.
Add and configure a Milestones entry in the Desktop Navigation Menu so it displaysacross the entire app.
Use Dynamic LOVs (or lookups) to intelligently substitute information from anothertable by checking against the ID of the content in the original table.
Repeat some familiar tasks to clean up both the report and form in Page Designer andin the runtime.
Starting from here:
6 - Milestones.sqlIf you have not completed the previous lessons, you can use the appendix"Importing an Application into a Workspace" to import the above SQL scriptinto your workspace and continue working from this lesson forward. You canfind this script in the /files subdirectory of where you unzipped the .zip fileaccompanying this tutorial.
6.1 Creating an Interactive Grid PageStart by using the Create Page Wizard to add a new page.
To add an interactive grid page to the application:
1. On the Application home page, click Create Page.
The Create Page Wizard displays.
2. Click Report.
3. Click Interactive Grid.
4. Enter the following:
6-1
a. Page Number - enter 5
b. Page Name - enter Milestones
c. Click Next.
5. For Navigation Menu, click Create a new navigation menu entry.
6. Use the default settings and click Next.
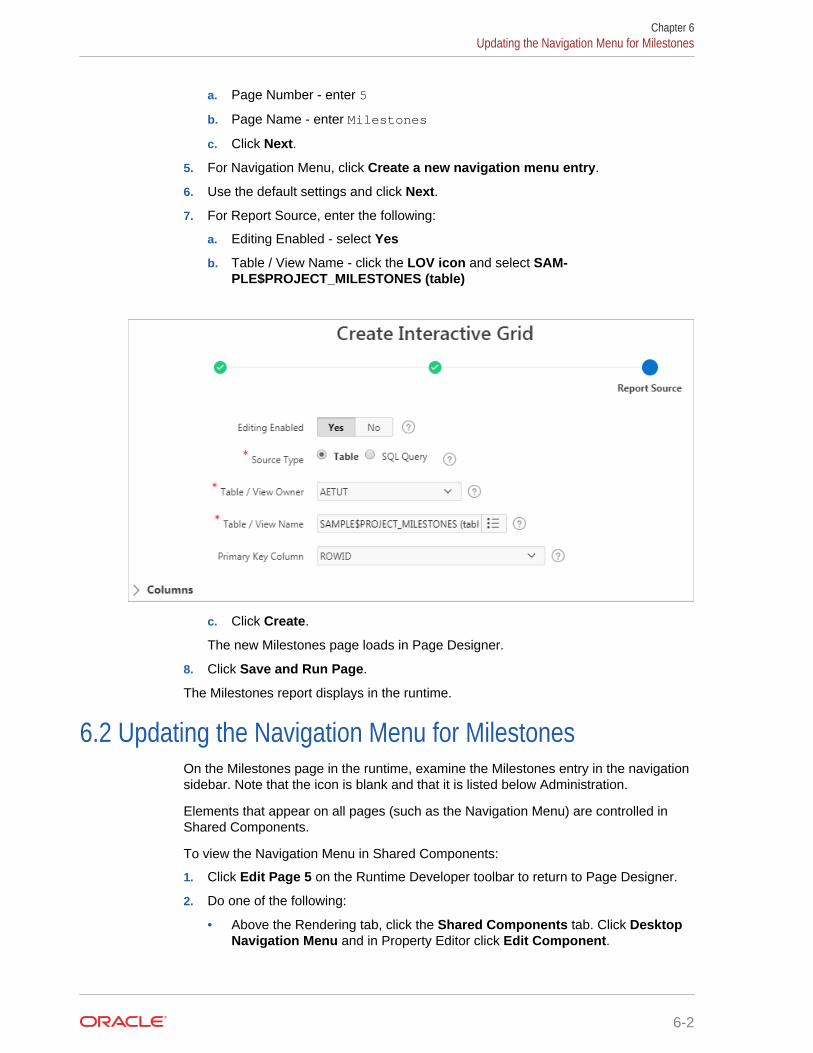
7. For Report Source, enter the following:
a. Editing Enabled - select Yes
b. Table / View Name - click the LOV icon and select SAM‐PLE$PROJECT_MILESTONES (table)
c. Click Create.
The new Milestones page loads in Page Designer.
8. Click Save and Run Page.
The Milestones report displays in the runtime.
6.2 Updating the Navigation Menu for MilestonesOn the Milestones page in the runtime, examine the Milestones entry in the navigationsidebar. Note that the icon is blank and that it is listed below Administration.
Elements that appear on all pages (such as the Navigation Menu) are controlled inShared Components.
To view the Navigation Menu in Shared Components:
1. Click Edit Page 5 on the Runtime Developer toolbar to return to Page Designer.
2. Do one of the following:
• Above the Rendering tab, click the Shared Components tab. Click DesktopNavigation Menu and in Property Editor click Edit Component.
Chapter 6Updating the Navigation Menu for Milestones
6-2
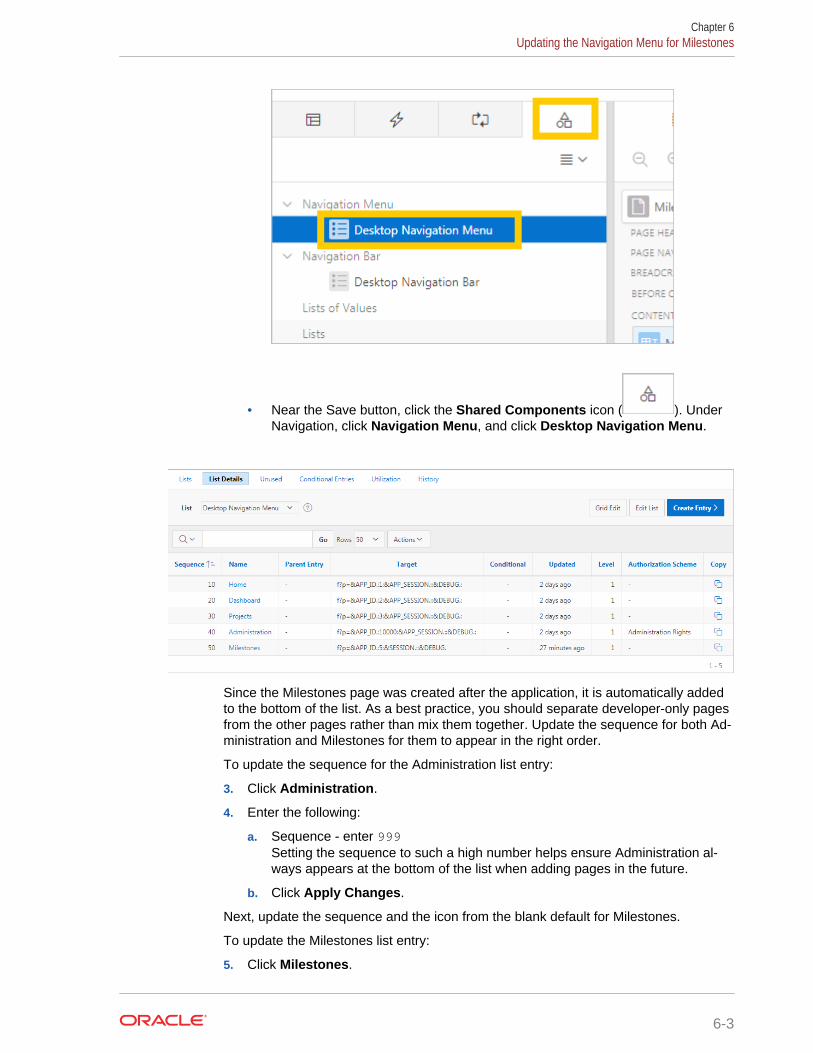
• Near the Save button, click the Shared Components icon ( ). UnderNavigation, click Navigation Menu, and click Desktop Navigation Menu.
Since the Milestones page was created after the application, it is automatically addedto the bottom of the list. As a best practice, you should separate developer-only pagesfrom the other pages rather than mix them together. Update the sequence for both Ad‐ministration and Milestones for them to appear in the right order.
To update the sequence for the Administration list entry:
3. Click Administration.
4. Enter the following:
a. Sequence - enter 999Setting the sequence to such a high number helps ensure Administration al‐ways appears at the bottom of the list when adding pages in the future.
b. Click Apply Changes.
Next, update the sequence and the icon from the blank default for Milestones.
To update the Milestones list entry:
5. Click Milestones.
Chapter 6Updating the Navigation Menu for Milestones
6-3
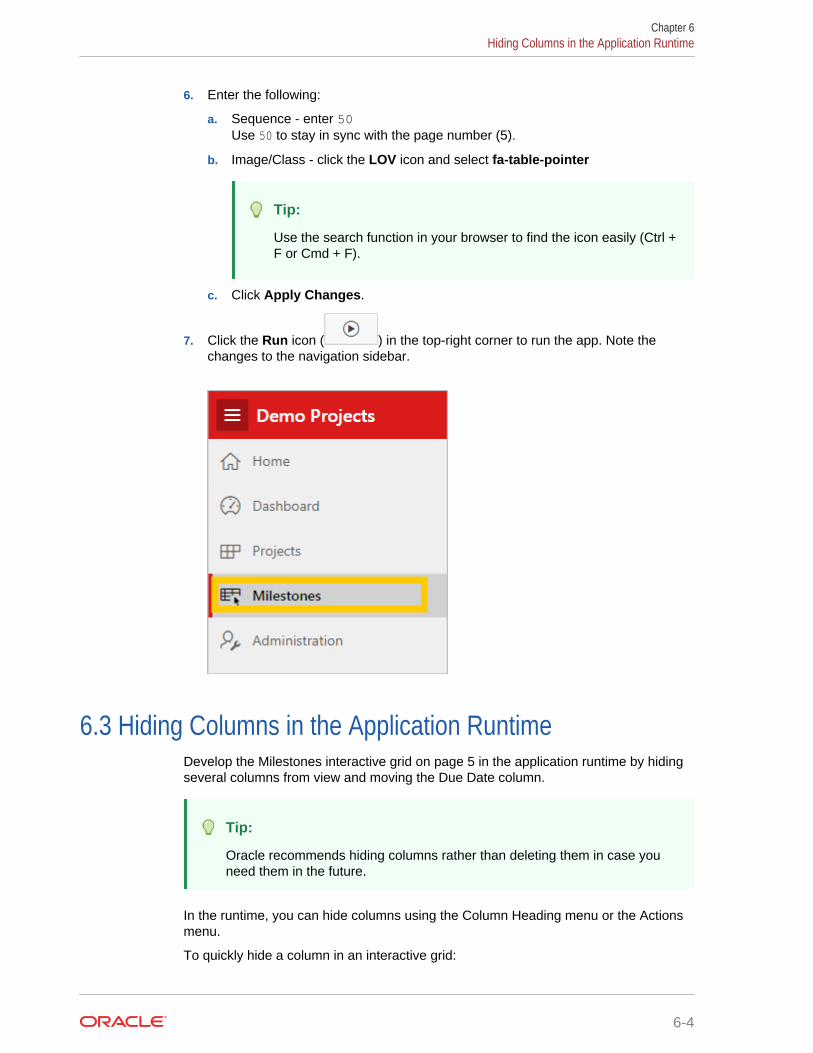
6. Enter the following:
a. Sequence - enter 50Use 50 to stay in sync with the page number (5).
b. Image/Class - click the LOV icon and select fa-table-pointer
Tip:
Use the search function in your browser to find the icon easily (Ctrl +F or Cmd + F).
c. Click Apply Changes.
7. Click the Run icon ( ) in the top-right corner to run the app. Note thechanges to the navigation sidebar.
6.3 Hiding Columns in the Application RuntimeDevelop the Milestones interactive grid on page 5 in the application runtime by hidingseveral columns from view and moving the Due Date column.
Tip:
Oracle recommends hiding columns rather than deleting them in case youneed them in the future.
In the runtime, you can hide columns using the Column Heading menu or the Actionsmenu.
To quickly hide a column in an interactive grid:
Chapter 6Hiding Columns in the Application Runtime
6-4

1. Click the Id column heading and select Hide.
To hide multiple columns in an interactive grid:
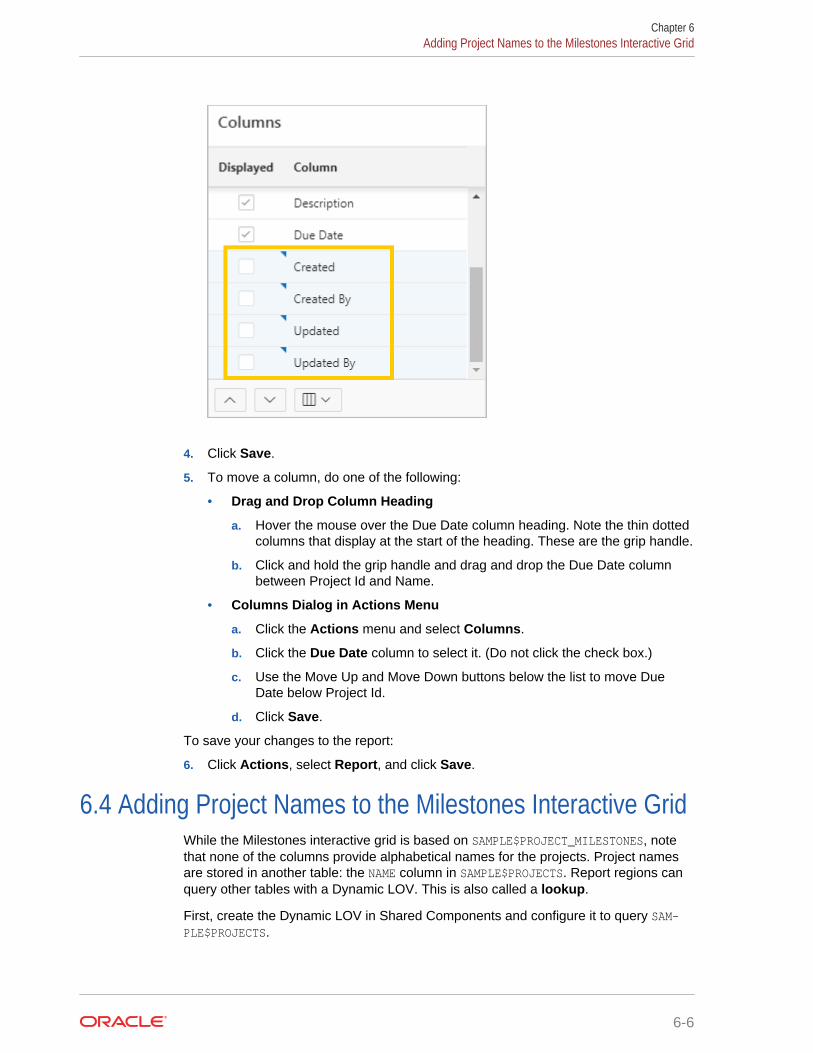
2. Click the Actions menu and select Columns.
3. In the list of columns on the left, click the check boxes adjacent to the followingcolumns to deselect them:
• Created
• Created By
• Updated
• Updated By
Chapter 6Hiding Columns in the Application Runtime
6-5
4. Click Save.
5. To move a column, do one of the following:
• Drag and Drop Column Heading
a. Hover the mouse over the Due Date column heading. Note the thin dottedcolumns that display at the start of the heading. These are the grip handle.
b. Click and hold the grip handle and drag and drop the Due Date columnbetween Project Id and Name.
• Columns Dialog in Actions Menu
a. Click the Actions menu and select Columns.
b. Click the Due Date column to select it. (Do not click the check box.)
c. Use the Move Up and Move Down buttons below the list to move DueDate below Project Id.
d. Click Save.
To save your changes to the report:
6. Click Actions, select Report, and click Save.
6.4 Adding Project Names to the Milestones Interactive GridWhile the Milestones interactive grid is based on SAMPLE$PROJECT_MILESTONES, notethat none of the columns provide alphabetical names for the projects. Project namesare stored in another table: the NAME column in SAMPLE$PROJECTS. Report regions canquery other tables with a Dynamic LOV. This is also called a lookup.
First, create the Dynamic LOV in Shared Components and configure it to query SAM-PLE$PROJECTS.
Chapter 6Adding Project Names to the Milestones Interactive Grid
6-6
Then use Page Designer to convert the PROJECT_ID column to a Select List, andchoose the Dynamic LOV / lookup to display the alphanumerical name of the refer‐enced project instead of the numerical ID.
To return to Page Designer:
1. Click Edit Page 5 on the Runtime Developer Toolbar.
To create a new Dynamic LOV lookup:
2. Click the Shared Components icon ( ).
3. Under Other Components, click List of Values.
4. Click Create.
5. Select From Scratch and click Next.
6. For Name and Type:
a. Name - enter Project Name
b. Type - select Dynamic
c. Click Next.
7. Delete the Query contents then copy and paste the following code:
select NAME d, ID rfrom SAMPLE$PROJECTSorder by NAME
8. Click Create List of Values.
The Lists of Values screen redisplays with the Project Name item.
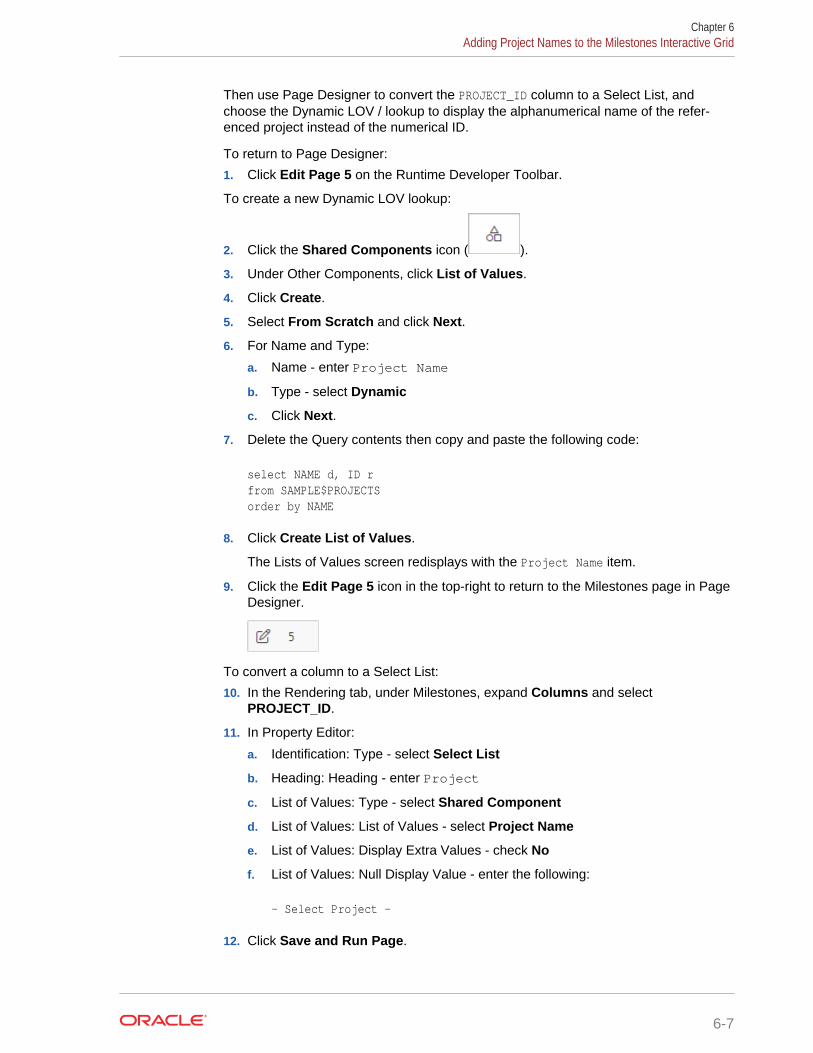
9. Click the Edit Page 5 icon in the top-right to return to the Milestones page in PageDesigner.
To convert a column to a Select List:
10. In the Rendering tab, under Milestones, expand Columns and selectPROJECT_ID.
11. In Property Editor:
a. Identification: Type - select Select List
b. Heading: Heading - enter Project
c. List of Values: Type - select Shared Component
d. List of Values: List of Values - select Project Name
e. List of Values: Display Extra Values - check No
f. List of Values: Null Display Value - enter the following:
- Select Project -
12. Click Save and Run Page.
Chapter 6Adding Project Names to the Milestones Interactive Grid
6-7
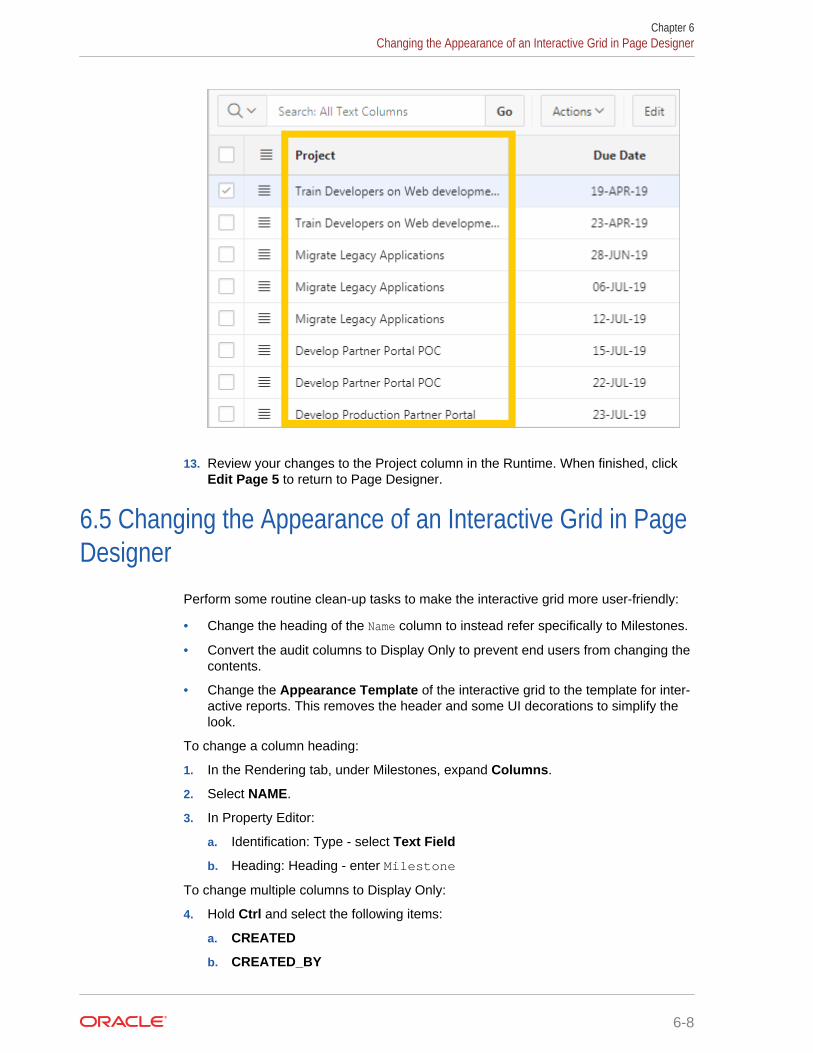
13. Review your changes to the Project column in the Runtime. When finished, clickEdit Page 5 to return to Page Designer.
6.5 Changing the Appearance of an Interactive Grid in PageDesigner
Perform some routine clean-up tasks to make the interactive grid more user-friendly:
• Change the heading of the Name column to instead refer specifically to Milestones.
• Convert the audit columns to Display Only to prevent end users from changing thecontents.
• Change the Appearance Template of the interactive grid to the template for inter‐active reports. This removes the header and some UI decorations to simplify thelook.
To change a column heading:
1. In the Rendering tab, under Milestones, expand Columns.
2. Select NAME.
3. In Property Editor:
a. Identification: Type - select Text Field
b. Heading: Heading - enter Milestone
To change multiple columns to Display Only:
4. Hold Ctrl and select the following items:
a. CREATED
b. CREATED_BY
Chapter 6Changing the Appearance of an Interactive Grid in Page Designer
6-8
c. UPDATED
d. UPDATED_BY
5. In Property Editor:
a. Identification: Type - select Display Only
To change the Appearance Template for a region:
6. In the Rendering tab, under Content Body, select the Milestones region.
7. In Property Editor:
a. Appearance: Template - select Interactive Report
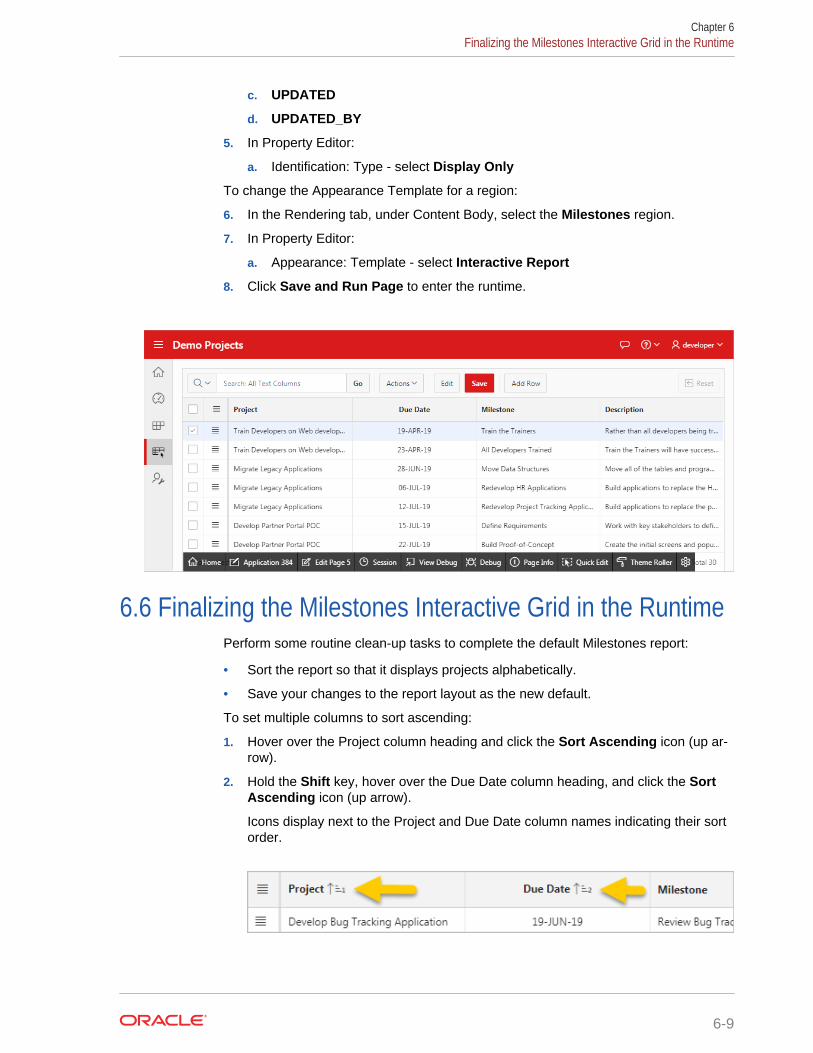
8. Click Save and Run Page to enter the runtime.
6.6 Finalizing the Milestones Interactive Grid in the RuntimePerform some routine clean-up tasks to complete the default Milestones report:
• Sort the report so that it displays projects alphabetically.
• Save your changes to the report layout as the new default.
To set multiple columns to sort ascending:
1. Hover over the Project column heading and click the Sort Ascending icon (up ar‐row).
2. Hold the Shift key, hover over the Due Date column heading, and click the SortAscending icon (up arrow).
Icons display next to the Project and Due Date column names indicating their sortorder.
Chapter 6Finalizing the Milestones Interactive Grid in the Runtime
6-9
To save the report layout as the new default:
3. Click the Actions menu, select Report, and select Save.You cannot use the Save button at the top of the report for this step because itdoes not overwrite the report default.
4. Click Application ##### on the Runtime Developer toolbar to return to the Appli‐cation home page.
The Milestones page is complete. Proceed to the next lesson.
Chapter 6Finalizing the Milestones Interactive Grid in the Runtime
6-10
7Developing the Tasks Page
Use the Create Page Wizard to create a new Report with Form for end users to man‐age their project tasks.
About This Lesson
In this lesson, you add a new pair of pages to your app: Report with Form.
"Report with Form" (or "Report and Form") is the most common page construct withinweb applications. End users view the report and submit changes with a form page.
In your app, the Tasks report displays details for work to be done toward the associat‐ed project (based on the SAMPLE$PROJECT_TASKS table). The Update Task form ena‐bles users to update the task, such as changing the status or moving the due date.
Use the Create Page Wizard to generate the pair of pages. Begin with the Reportpage. Repeat some familiar tasks to develop the report (update Navigation Menu inShared Components, hide extraneous columns, apply lookups to the report).
Apply a format mask for columns with set date and numbering formats.
Use the decode SQL statement to convert all instances of "Y" or "N" in a Yes/No col‐umn to display instead as Yes or No.
For the modal Form page, use Page Designer to refine the fields to mirror their coun‐terparts in the Report. Many of the procedures for the Form are very similar to thosefor the Report.
Starting from here:
7 - Tasks.sqlIf you have not completed the previous lessons, you can use the appendix"Importing an Application into a Workspace" to import the above SQL scriptinto your workspace and continue working from this lesson forward. You canfind this script in the /files subdirectory of where you unzipped the .zip fileaccompanying this tutorial.
7.1 Creating an Interactive Report PageUse the Create Page Wizard to add a new interactive report with form page to yourapp. Base it on SAMPLE$PROJECTS_TASKS.
To add an interactive report with form to the application:
1. In the Application home page, click Create Page.
2. Click Report.
3. Click Report with Form.
7-1

4. For Page Attributes:
a. Report Page Number - enter 6
b. Report Page Name - enter Tasks
c. Form Page Number - enter 7
d. Form Page Name - enter Update Task
e. Form Page Mode - select Modal Dialog
f. Click Next.
5. For Navigation Menu:
a. Navigation Preference - select Create a new navigation menu entry
b. Click Next.
6. For Data Source:
a. Table / View Name - click the LOV icon.
b. Select SAMPLE$PROJECTS_TASKS
c. In the list of Columns, double-click ID (Number) to move it to the left column(this removes it from display in the report).The ID column contains the numeric identifier for each row in the table. Usersdo not need to view or access this information at any time. Since you wouldhide the columns in both pages later anyway, this step saves you time.
d. Click Next.
7. For Form Page:
a. Primary Key Column - select ID (Number)Note that the wizard removes ID to match the columns in the report in the pre‐vious screen.
b. Click Create.
The wizard creates the pages. Page Designer loads the interactive report page(page 6, Tasks).
The page contains the interactive report region Report 1.
To rename a report region:
8. Click Report 1 in Layout tab or Rendering tab.
9. In Property Editor:
a. Identification: Title - enter Tasks
10. Click Save and Run Page to view the interactive report in the runtime.
In the runtime, note that the Tasks item in the Navigation Menu (left side) displays lastand has a blank icon. Note also that as you scroll right, the report displays numericalidentifiers in several columns as well as audit detail columns.
Perform the same tasks as you did for Milestones to update the Tasks page.
7.2 Updating the Tasks Page in the RuntimeComplete some routine tasks in the runtime to perform an initial update to the Taskspage (similar to those that you performed for the Milestones page, except Tasks usesan interactive report instead of an interactive grid):
Chapter 7Updating the Tasks Page in the Runtime
7-2
• Update the Navigation Menu in Shared Components
• Hide the audit columns from the default report in the runtime
To view the Navigation Menu in Shared Components:
1. Click Edit Page 6 on the Runtime Developer toolbar to return to Page Designer.
2. Near the Save button, click the Shared Components icon .
3. Under Navigation, click Navigation Menu.
4. Click Desktop Navigation Menu.
To update the Tasks list entry:
5. Click Tasks.
6. For List Entry:
a. Sequence - enter 60
b. Image/Class - click the LOV icon and select fa-table
c. Click Apply Changes.
7. Click the Run icon (play button) in the top-right corner to run the app. Note thechanges to the navigation sidebar.
Hide the audit columns from displaying in the default report in the runtime.
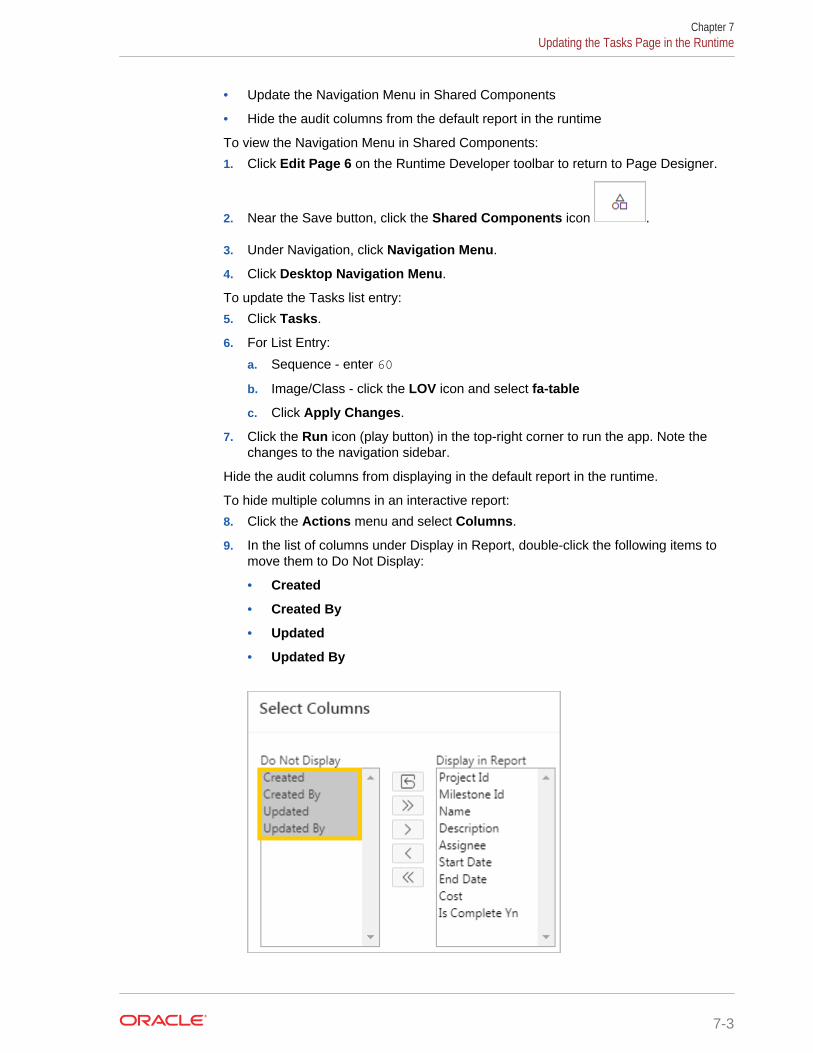
To hide multiple columns in an interactive report:
8. Click the Actions menu and select Columns.
9. In the list of columns under Display in Report, double-click the following items tomove them to Do Not Display:
• Created
• Created By
• Updated
• Updated By
Chapter 7Updating the Tasks Page in the Runtime
7-3
10. Click Apply.
To save the report layout as the new default:
11. Click the Actions menu, select Report, and click Save Report.
12. In Save Report:
a. Save - select As Default Report Settings
b. Use the default setting (Primary) and click Apply.
7.3 Applying Lookups to the Tasks Interactive ReportThe dynamic LOV you created earlier is also called a lookup (because the query"looks up" a value in another table).
First, copy the PROJECT NAME Dynamic LOV in Shared Components and configureit to query SAMPLE$PROJECT_MILESTONES.
Then apply the two lookups to the PROJECT_ID and MILESTONE_ID columns.
To copy an LOV:
1. Click Edit Page 6 on the Runtime Developer toolbar to return to Page Designer.
2. Click the Shared Components icon.
3. Under Other Components, click List of Values.
4. Click Copy.
5. For Copy List of Values:
a. Copy List of Values - select PROJECT NAME - Dynamic
b. New List of Values Name - enter Milestone Name
c. Click Copy.
The Lists of Values screen redisplays with the MILESTONE NAME item.
6. Click MILESTONE NAME.
7. Under Query, delete the contents then copy and paste the following code:
select NAME d, ID rfrom SAMPLE$PROJECT_MILESTONESorder by NAME
8. Click the Validate icon (checkmark) to confirm the query works.
9. Click Apply Changes.
10. Click the Edit Page 6 icon in the top-right to return to the Tasks page in Page De‐signer.
Apply the Project Name dynamic LOV to the PROJECT_ID column (similar to the proc‐ess for the Milestones page). Then apply the Milestone Name dynamic LOV to MILE-STONE_ID.
To apply the PROJECT NAME LOV to an interactive report:
11. In the Rendering tab, under Tasks, expand Columns and select PROJECT_ID.
12. In Property Editor:
Chapter 7Applying Lookups to the Tasks Interactive Report
7-4
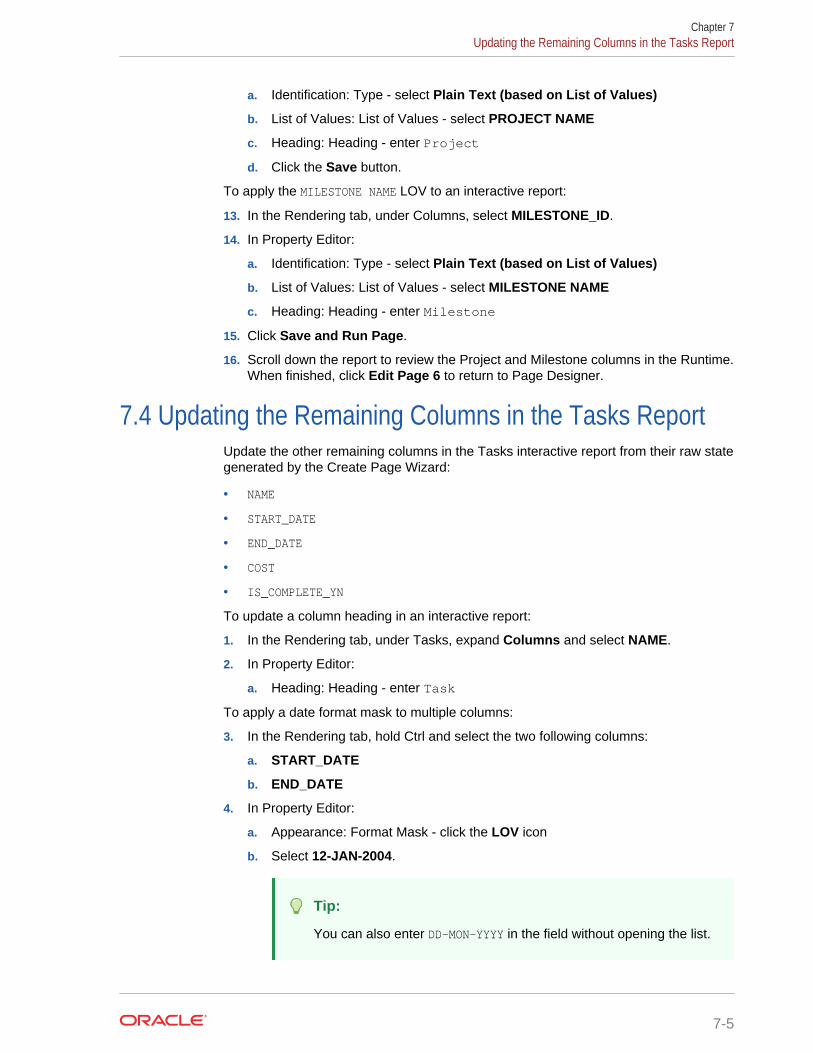
a. Identification: Type - select Plain Text (based on List of Values)
b. List of Values: List of Values - select PROJECT NAME
c. Heading: Heading - enter Project
d. Click the Save button.
To apply the MILESTONE NAME LOV to an interactive report:
13. In the Rendering tab, under Columns, select MILESTONE_ID.
14. In Property Editor:
a. Identification: Type - select Plain Text (based on List of Values)
b. List of Values: List of Values - select MILESTONE NAME
c. Heading: Heading - enter Milestone
15. Click Save and Run Page.
16. Scroll down the report to review the Project and Milestone columns in the Runtime.When finished, click Edit Page 6 to return to Page Designer.
7.4 Updating the Remaining Columns in the Tasks ReportUpdate the other remaining columns in the Tasks interactive report from their raw stategenerated by the Create Page Wizard:
• NAME
• START_DATE
• END_DATE
• COST
• IS_COMPLETE_YN
To update a column heading in an interactive report:
1. In the Rendering tab, under Tasks, expand Columns and select NAME.
2. In Property Editor:
a. Heading: Heading - enter Task
To apply a date format mask to multiple columns:
3. In the Rendering tab, hold Ctrl and select the two following columns:
a. START_DATE
b. END_DATE
4. In Property Editor:
a. Appearance: Format Mask - click the LOV icon
b. Select 12-JAN-2004.
Tip:
You can also enter DD-MON-YYYY in the field without opening the list.
Chapter 7Updating the Remaining Columns in the Tasks Report
7-5
c. Click Save.
To apply a dollar amount format mask to a column:
5. In the Rendering tab, select COST.
6. In Property Editor:
a. Appearance: Format Mask - click the LOV icon
b. Select $5,234.10.
c. Click Save.
To configure an interactive report with a _YN column to display "Yes" and "No" (insteadof Y or N):
7. In the Rendering tab, select IS_COMPLETE_YN.
8. In Property Editor:
a. Heading: Heading - enter Complete
b. Click Save.
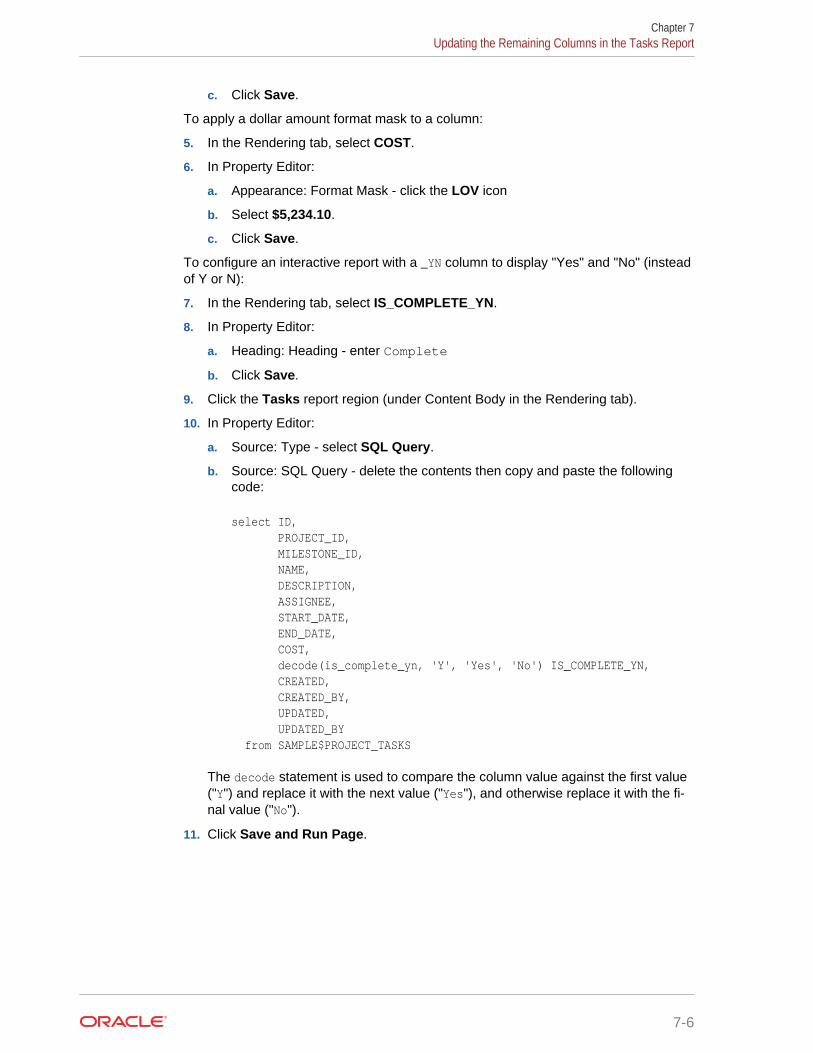
9. Click the Tasks report region (under Content Body in the Rendering tab).
10. In Property Editor:
a. Source: Type - select SQL Query.
b. Source: SQL Query - delete the contents then copy and paste the followingcode:
select ID, PROJECT_ID, MILESTONE_ID, NAME, DESCRIPTION, ASSIGNEE, START_DATE, END_DATE, COST, decode(is_complete_yn, 'Y', 'Yes', 'No') IS_COMPLETE_YN, CREATED, CREATED_BY, UPDATED, UPDATED_BY from SAMPLE$PROJECT_TASKS
The decode statement is used to compare the column value against the first value("Y") and replace it with the next value ("Yes"), and otherwise replace it with the fi‐nal value ("No").
11. Click Save and Run Page.
Chapter 7Updating the Remaining Columns in the Tasks Report
7-6
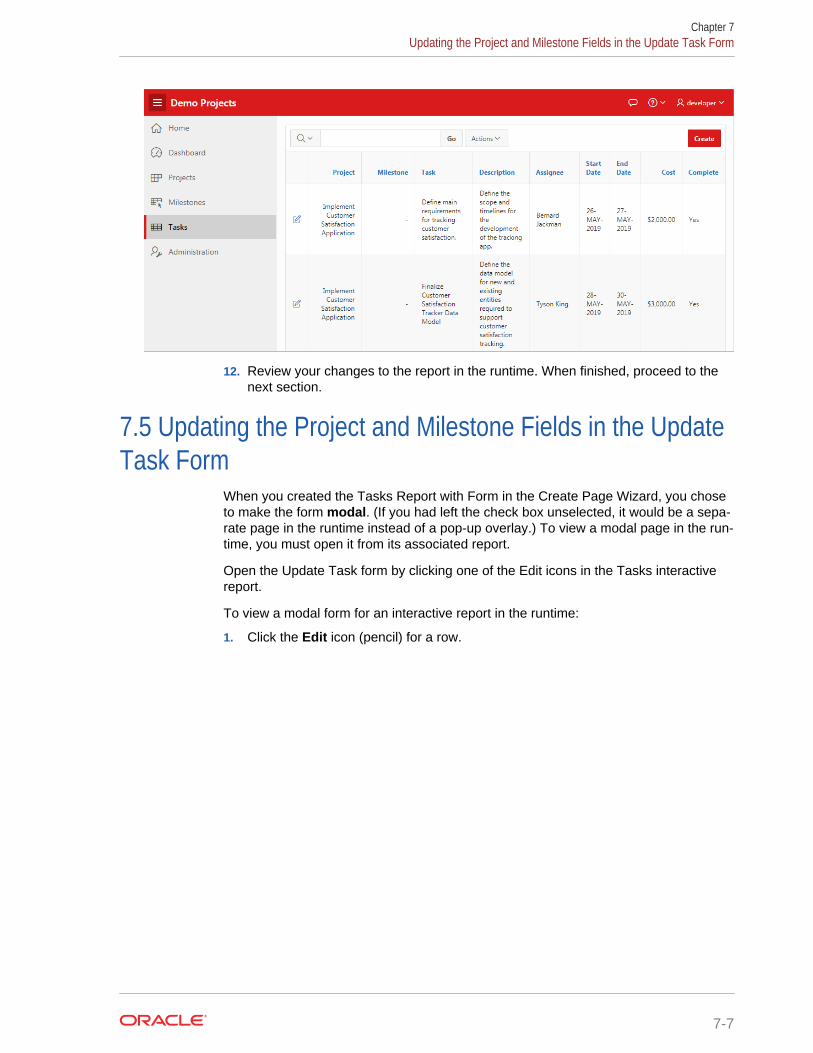
12. Review your changes to the report in the runtime. When finished, proceed to thenext section.
7.5 Updating the Project and Milestone Fields in the UpdateTask Form
When you created the Tasks Report with Form in the Create Page Wizard, you choseto make the form modal. (If you had left the check box unselected, it would be a sepa‐rate page in the runtime instead of a pop-up overlay.) To view a modal page in the run‐time, you must open it from its associated report.
Open the Update Task form by clicking one of the Edit icons in the Tasks interactivereport.
To view a modal form for an interactive report in the runtime:
1. Click the Edit icon (pencil) for a row.
Chapter 7Updating the Project and Milestone Fields in the Update Task Form
7-7
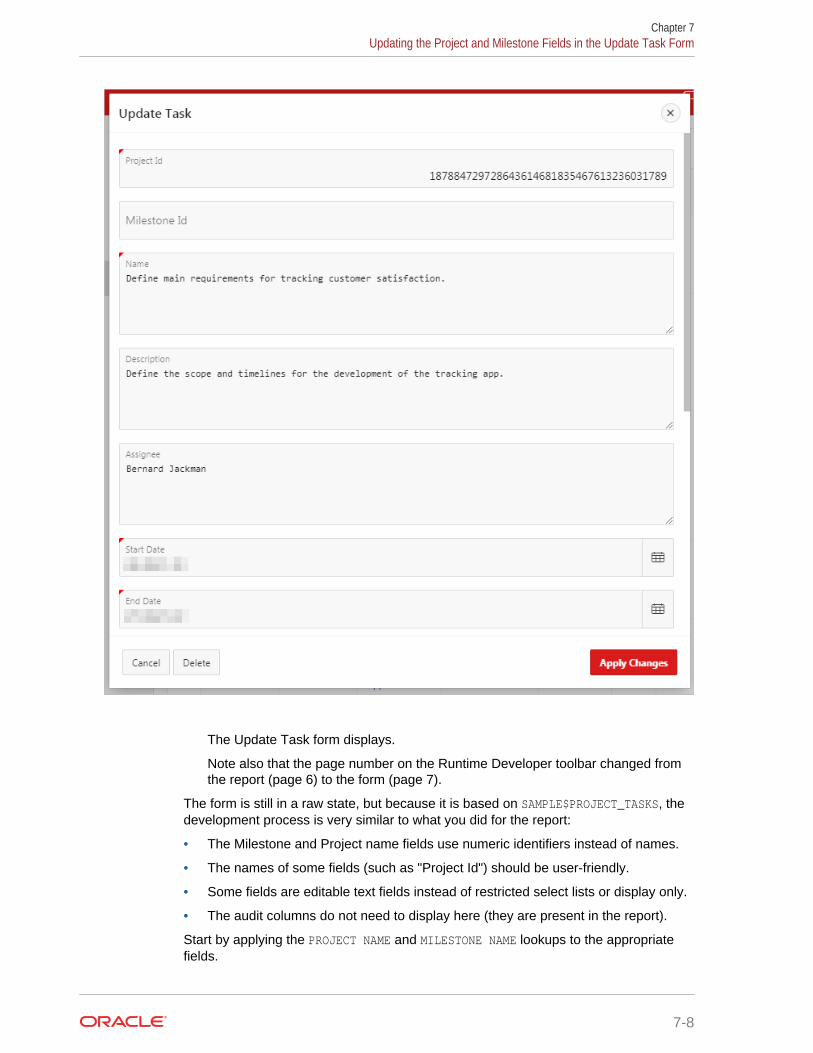
The Update Task form displays.
Note also that the page number on the Runtime Developer toolbar changed fromthe report (page 6) to the form (page 7).
The form is still in a raw state, but because it is based on SAMPLE$PROJECT_TASKS, thedevelopment process is very similar to what you did for the report:
• The Milestone and Project name fields use numeric identifiers instead of names.
• The names of some fields (such as "Project Id") should be user-friendly.
• Some fields are editable text fields instead of restricted select lists or display only.
• The audit columns do not need to display here (they are present in the report).
Start by applying the PROJECT NAME and MILESTONE NAME lookups to the appropriatefields.
Chapter 7Updating the Project and Milestone Fields in the Update Task Form
7-8
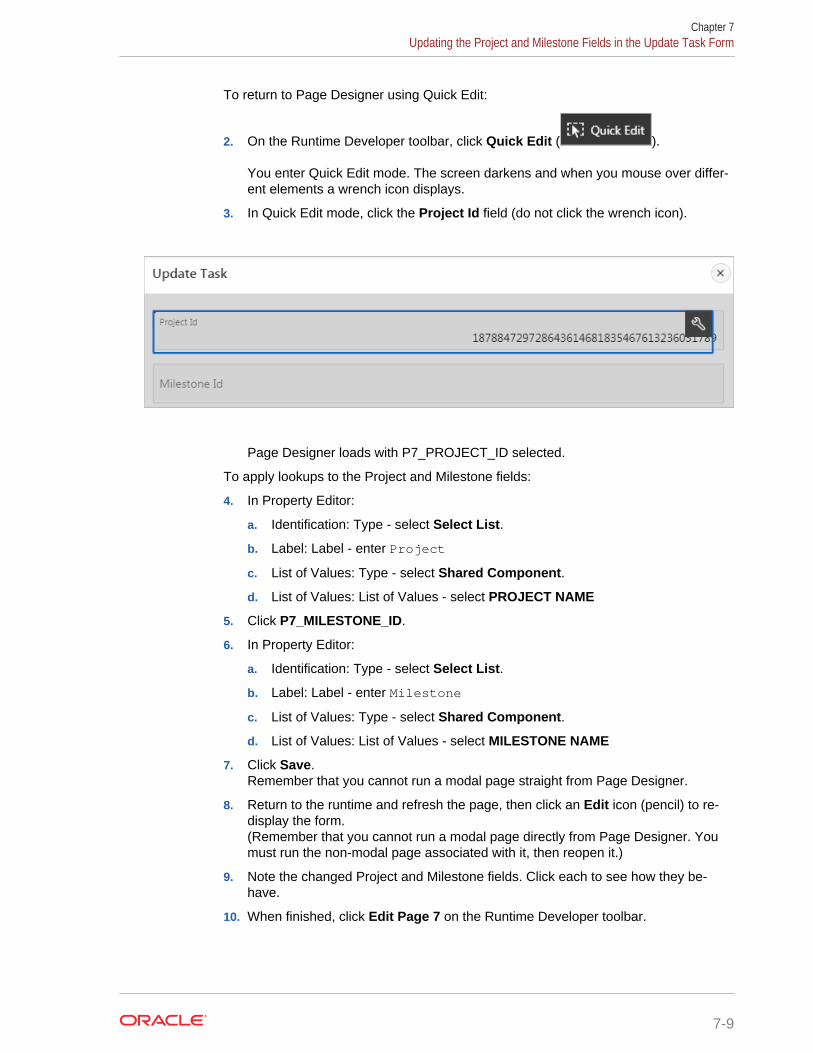
To return to Page Designer using Quick Edit:
2. On the Runtime Developer toolbar, click Quick Edit ( ).
You enter Quick Edit mode. The screen darkens and when you mouse over differ‐ent elements a wrench icon displays.
3. In Quick Edit mode, click the Project Id field (do not click the wrench icon).
Page Designer loads with P7_PROJECT_ID selected.
To apply lookups to the Project and Milestone fields:
4. In Property Editor:
a. Identification: Type - select Select List.
b. Label: Label - enter Project
c. List of Values: Type - select Shared Component.
d. List of Values: List of Values - select PROJECT NAME
5. Click P7_MILESTONE_ID.
6. In Property Editor:
a. Identification: Type - select Select List.
b. Label: Label - enter Milestone
c. List of Values: Type - select Shared Component.
d. List of Values: List of Values - select MILESTONE NAME
7. Click Save.Remember that you cannot run a modal page straight from Page Designer.
8. Return to the runtime and refresh the page, then click an Edit icon (pencil) to re‐display the form.(Remember that you cannot run a modal page directly from Page Designer. Youmust run the non-modal page associated with it, then reopen it.)
9. Note the changed Project and Milestone fields. Click each to see how they be‐have.
10. When finished, click Edit Page 7 on the Runtime Developer toolbar.
Chapter 7Updating the Project and Milestone Fields in the Update Task Form
7-9
7.6 Updating the Remaining Fields in the Update Task FormFinally, perform a series of small tasks to update the Update Task form's presentation:
• Name - change the Name field to a text field and change the label to Task.
• Assignee - change to a select list based on SQL query.
• Start Date and End Date - change the format mask to DD-MM-YYYY.
• Cost - change the alignment and format mask ($5,234.10).
• Is Complete Yn - change the label and type to a switch.
• Hide the audit columns (Created, Created By, Updated, Updated By).
To update the P7_NAME field:
1. Click P7_NAME.
2. In Property Editor:
a. Identification: Type - select Text Field.
b. Label: Label - enter Task
To update the P7_ASSIGNEE field:
3. Click P7_ASSIGNEE.
4. In Property Editor:
a. Identification: Type - select Select List.
b. List of Values: Type - select SQL Query.
c. List of Values: SQL Query - copy and paste the following code:
select distinct ASSIGNEE as d, ASSIGNEE as r from SAMPLE$PROJECT_TASKS order by 1
d. Click Save.
To update the P7_START_DATE and P7_END_DATE fields:
5. Hold Shift or Ctrl and click P7_START_DATE and P7_END_DATE to select themboth.
6. In Property Editor:
a. Appearance: Format Mask - click the LOV icon.
b. Select 12-JAN-2004.
c. Settings: Show - select Both.
7. Click P7_END_DATE to only select it.
8. In Property Editor:
a. Layout: Start New Row - select No.
b. Click Save.
To update the P7_COST field:
Chapter 7Updating the Remaining Fields in the Update Task Form
7-10
9. Click P7_COST.
10. In Property Editor:
a. Settings: Number Alignment - select Left.
b. Appearance: Format Mask - click the LOV icon.
c. Select $5,234.10.
d. Click Save.
To update the P7_IS_COMPLETE_YN field:
11. Click P7_IS_COMPLETE_YN.
12. In Property Editor:
a. Identification: Type - select Switch.
b. Label: Label - enter Complete
To hide the audit column fields:
13. Hold Ctrl or Shift and select the four following items:
• P7_CREATED
• P7_CREATED_BY
• P7_UPDATED
• P7_UPDATED_BY
14. In Property Editor:
a. Identification: Type - select Hidden.
b. Click Save.
15. Return to the runtime and refresh the page.
16. Click an Edit icon (pencil) to redisplay the form.
Chapter 7Updating the Remaining Fields in the Update Task Form
7-11
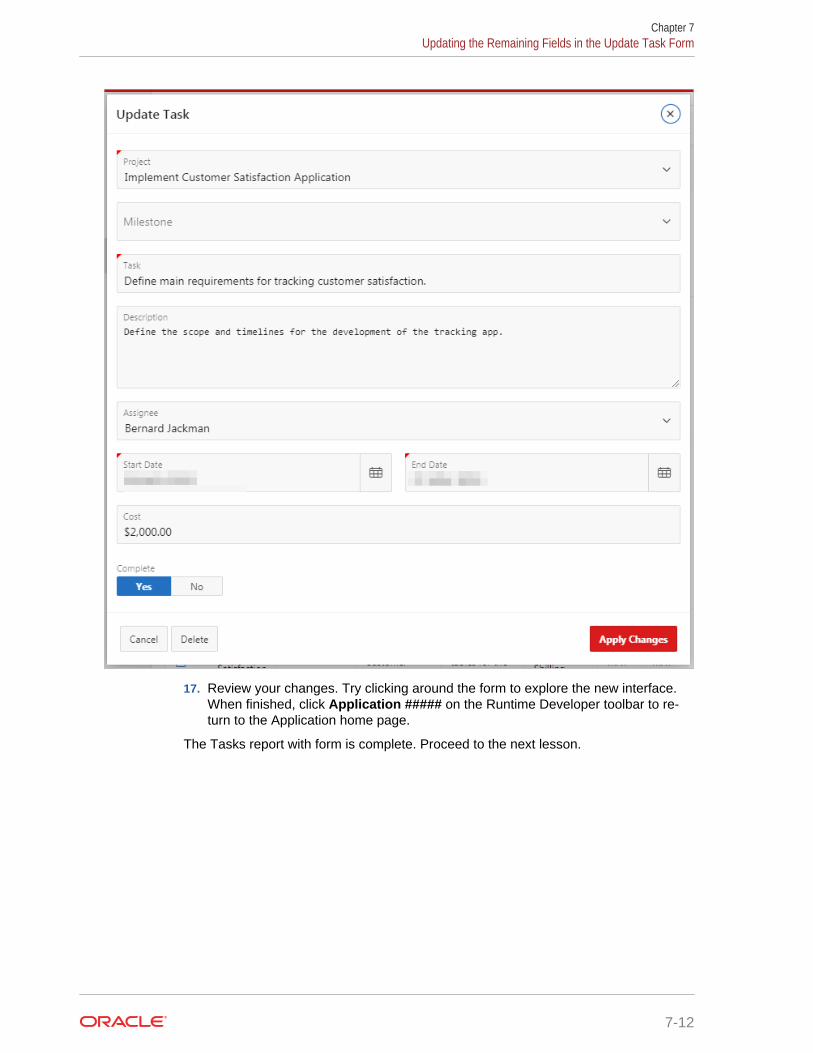
17. Review your changes. Try clicking around the form to explore the new interface.When finished, click Application ##### on the Runtime Developer toolbar to re‐turn to the Application home page.
The Tasks report with form is complete. Proceed to the next lesson.
Chapter 7Updating the Remaining Fields in the Update Task Form
7-12
8Developing the Dashboard Page
Update and add new regions to the Dashboard page with Page Designer.
About This Lesson
In this lesson, you modify the regions of an existing page without the aid of a wizard.
You develop the Dashboard page generated by the Create App Wizard by deleting allbut one of the existing chart regions. You update the series, attributes, and TemplateOptions of the remaining chart region to improve usability and appearance.
You add a new report region from scratch using the Gallery instead of a wizard. Re‐configure the report's SQL query and Template Options.
Starting from here:
8 - DashboardIf you have not completed the previous lessons, you can use the appendix"Importing an Application into a Workspace" to import the above SQL scriptinto your workspace and continue working from this lesson forward. You canfind this script in the /files subdirectory of where you unzipped the .zip fileaccompanying this tutorial.
8.1 Deleting Regions in Page DesignerYou created multiple charts for the Dashboard in the Create App Wizard. Review theoutput in the runtime.
To view the runtime:
1. On the Application home page, click 2 - Dashboard.
2. Click Save and Run Page.
Note the four charts on the page. You decide that the bar chart is the best way topresent Costs info rather than a line or pie chart (Chart 3 and Chart 4). You also de‐cide to replace one chart (Project Status) with a report later.
8-1
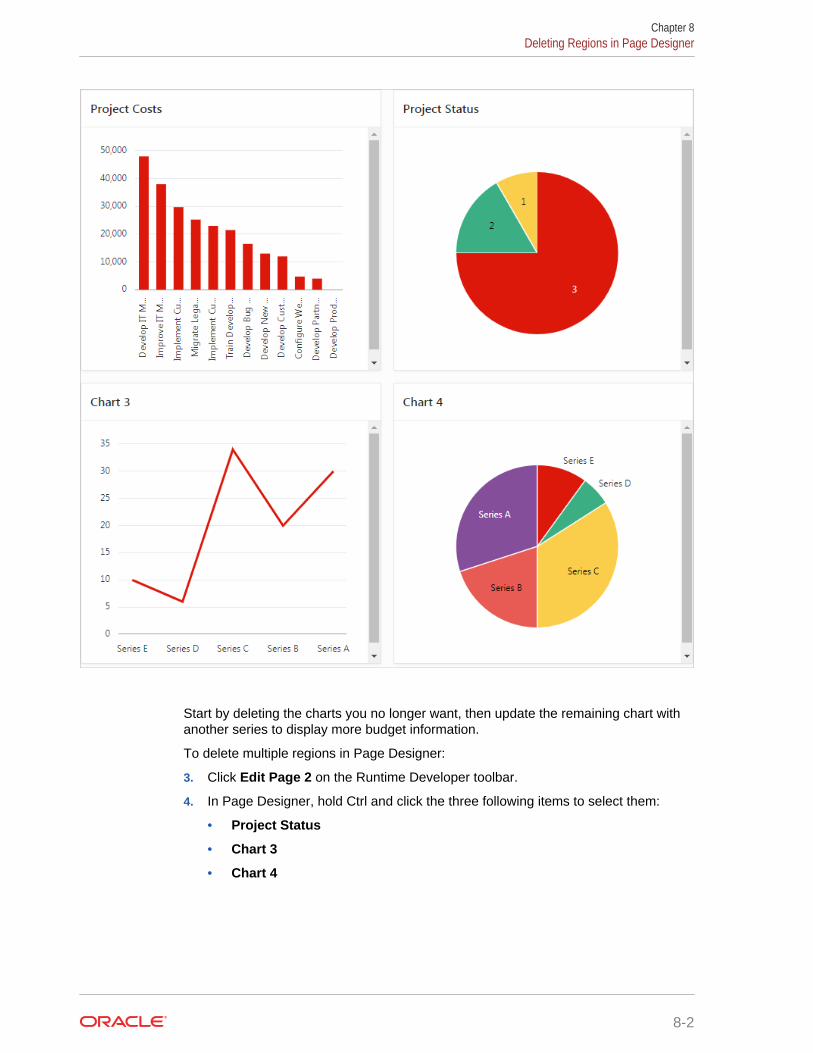
Start by deleting the charts you no longer want, then update the remaining chart withanother series to display more budget information.
To delete multiple regions in Page Designer:
3. Click Edit Page 2 on the Runtime Developer toolbar.
4. In Page Designer, hold Ctrl and click the three following items to select them:
• Project Status
• Chart 3
• Chart 4
Chapter 8Deleting Regions in Page Designer
8-2
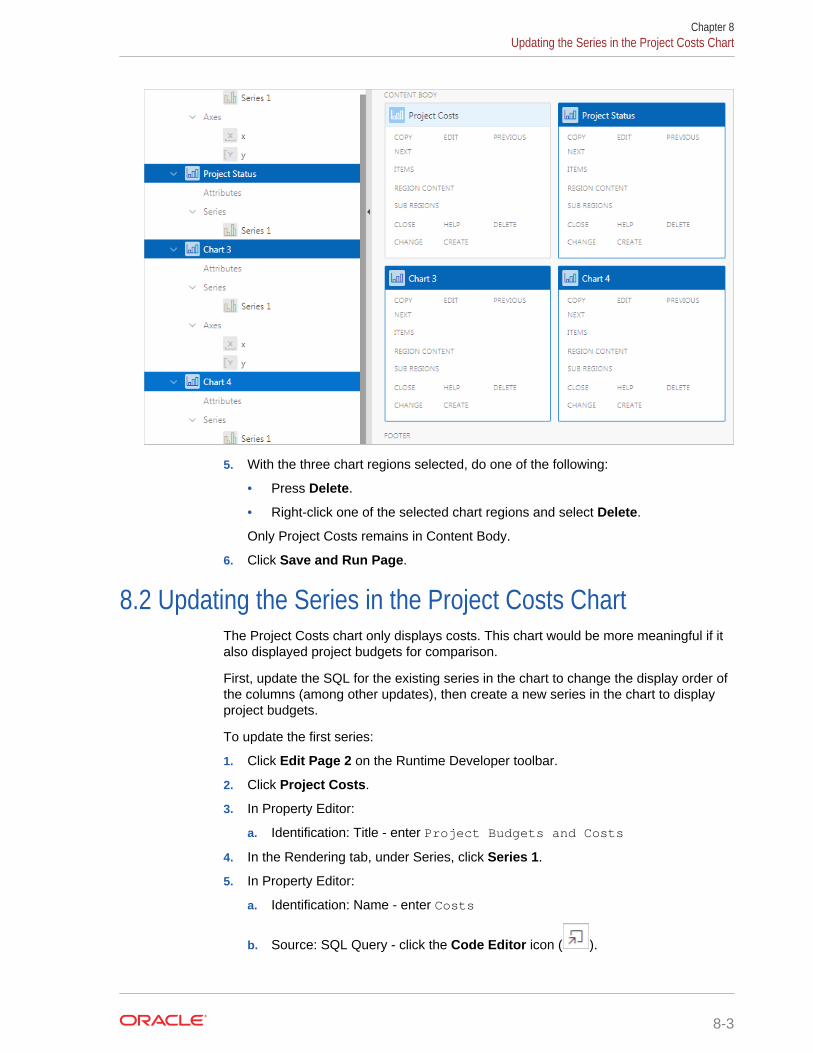
5. With the three chart regions selected, do one of the following:
• Press Delete.
• Right-click one of the selected chart regions and select Delete.
Only Project Costs remains in Content Body.
6. Click Save and Run Page.
8.2 Updating the Series in the Project Costs ChartThe Project Costs chart only displays costs. This chart would be more meaningful if italso displayed project budgets for comparison.
First, update the SQL for the existing series in the chart to change the display order ofthe columns (among other updates), then create a new series in the chart to displayproject budgets.
To update the first series:
1. Click Edit Page 2 on the Runtime Developer toolbar.
2. Click Project Costs.
3. In Property Editor:
a. Identification: Title - enter Project Budgets and Costs
4. In the Rendering tab, under Series, click Series 1.
5. In Property Editor:
a. Identification: Name - enter Costs
b. Source: SQL Query - click the Code Editor icon ( ).
Chapter 8Updating the Series in the Project Costs Chart
8-3
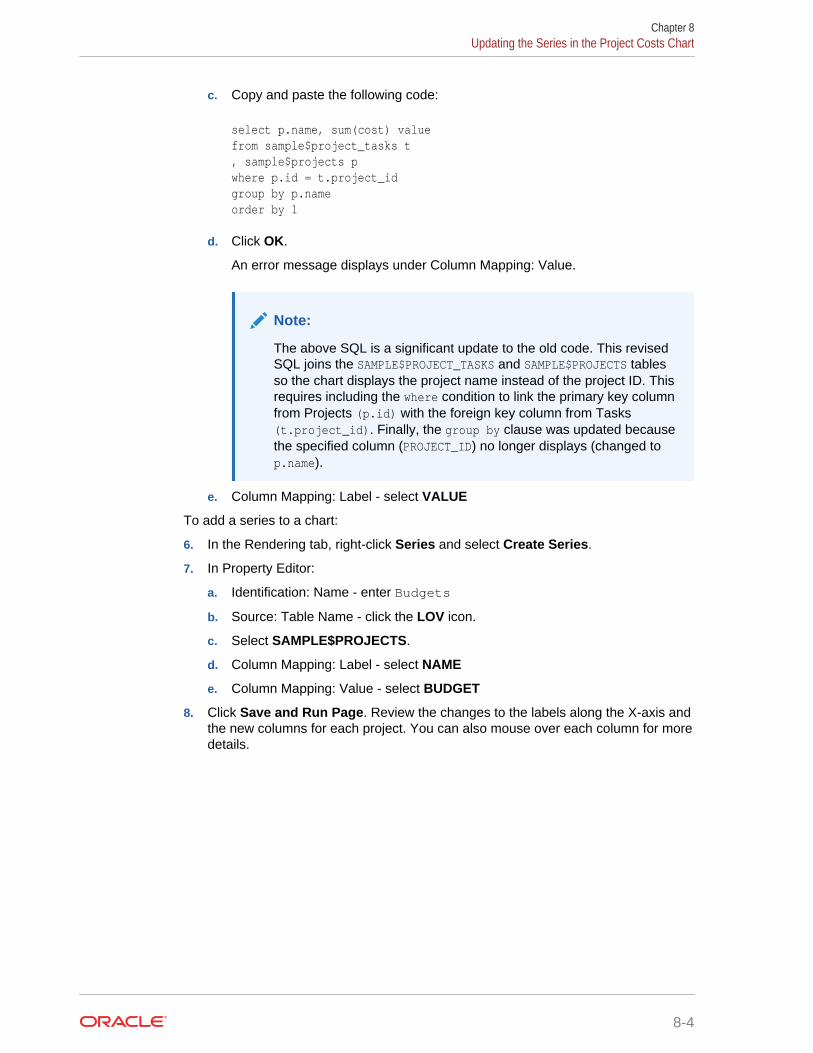
c. Copy and paste the following code:
select p.name, sum(cost) valuefrom sample$project_tasks t, sample$projects pwhere p.id = t.project_idgroup by p.nameorder by 1
d. Click OK.
An error message displays under Column Mapping: Value.
Note:
The above SQL is a significant update to the old code. This revisedSQL joins the SAMPLE$PROJECT_TASKS and SAMPLE$PROJECTS tablesso the chart displays the project name instead of the project ID. Thisrequires including the where condition to link the primary key columnfrom Projects (p.id) with the foreign key column from Tasks(t.project_id). Finally, the group by clause was updated becausethe specified column (PROJECT_ID) no longer displays (changed top.name).
e. Column Mapping: Label - select VALUE
To add a series to a chart:
6. In the Rendering tab, right-click Series and select Create Series.
7. In Property Editor:
a. Identification: Name - enter Budgets
b. Source: Table Name - click the LOV icon.
c. Select SAMPLE$PROJECTS.
d. Column Mapping: Label - select NAME
e. Column Mapping: Value - select BUDGET
8. Click Save and Run Page. Review the changes to the labels along the X-axis andthe new columns for each project. You can also mouse over each column for moredetails.
Chapter 8Updating the Series in the Project Costs Chart
8-4

8.3 Updating the Appearance of the Dashboard ChartWhile the chart is more usable now, it still needs some aesthetic improvements:
• The labels are too constrained by the space.
• The chart lacks a legend to indicate which column represents which value (cost orbudget).
• The chart does not fit vertically in the region (note the scroll bar).
• The cost and budget values lack a dollar sign.
These changes are in the region attributes and axis properties for the chart.
To change the attributes of a region:
1. Click Edit Page 2 on the Runtime Developer toolbar.
2. In the Rendering tab, under Project Budgets and Costs, click Attributes.
3. In Property Editor:
a. Layout: Height - enter 600
b. Legend: Show - click Yes
c. Legend: Position - select Top
d. Legend: Hide and Show Behavior - select No Rescaling
To change the properties of an axis:
4. In the Rendering tab, under Axes, click y.
5. In Property Editor:
a. Value: Format - select Currency
b. Value: Currency - enter $
6. Click Save and Run Page.
Chapter 8Updating the Appearance of the Dashboard Chart
8-5
8.4 Updating the Live Template Options for the DashboardChart
If you scroll down the chart region in the runtime, you can see your changes. (You mayneed to maximize your window to view all the labels properly.) The individual elementslook good, but obviously you must alter the way the region displays on the page.
The final changes you need to make are in the Live Template Options, which you ac‐cess using Quick Edit on the Runtime Developer toolbar.
To open Live Template Options:
1. Click Quick Edit on the Runtime Developer toolbar.
You enter Quick Edit mode (screen darkens, mouse cursor becomes a crosshair).
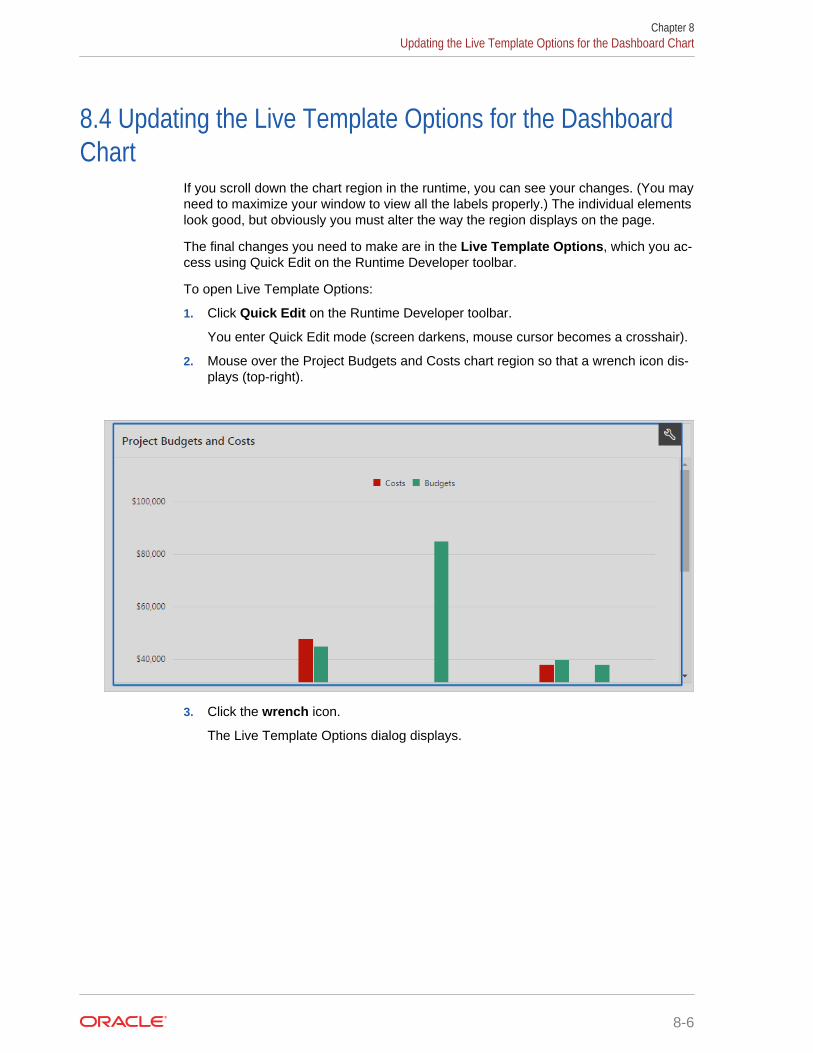
2. Mouse over the Project Budgets and Costs chart region so that a wrench icon dis‐plays (top-right).
3. Click the wrench icon.
The Live Template Options dialog displays.
Chapter 8Updating the Live Template Options for the Dashboard Chart
8-6
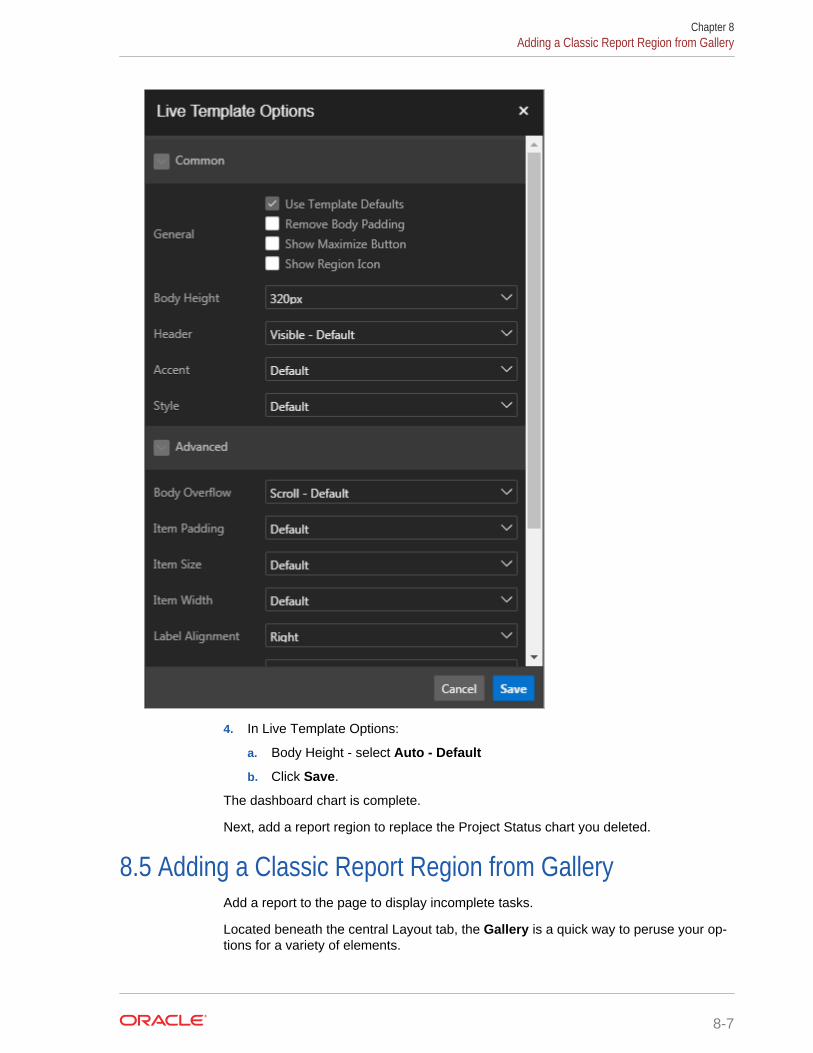
4. In Live Template Options:
a. Body Height - select Auto - Default
b. Click Save.
The dashboard chart is complete.
Next, add a report region to replace the Project Status chart you deleted.
8.5 Adding a Classic Report Region from GalleryAdd a report to the page to display incomplete tasks.
Located beneath the central Layout tab, the Gallery is a quick way to peruse your op‐tions for a variety of elements.
Chapter 8Adding a Classic Report Region from Gallery
8-7
To add a classic report region from the Gallery:
1. Click Edit Page 2 on the Runtime Developer toolbar to return to Page Designer.
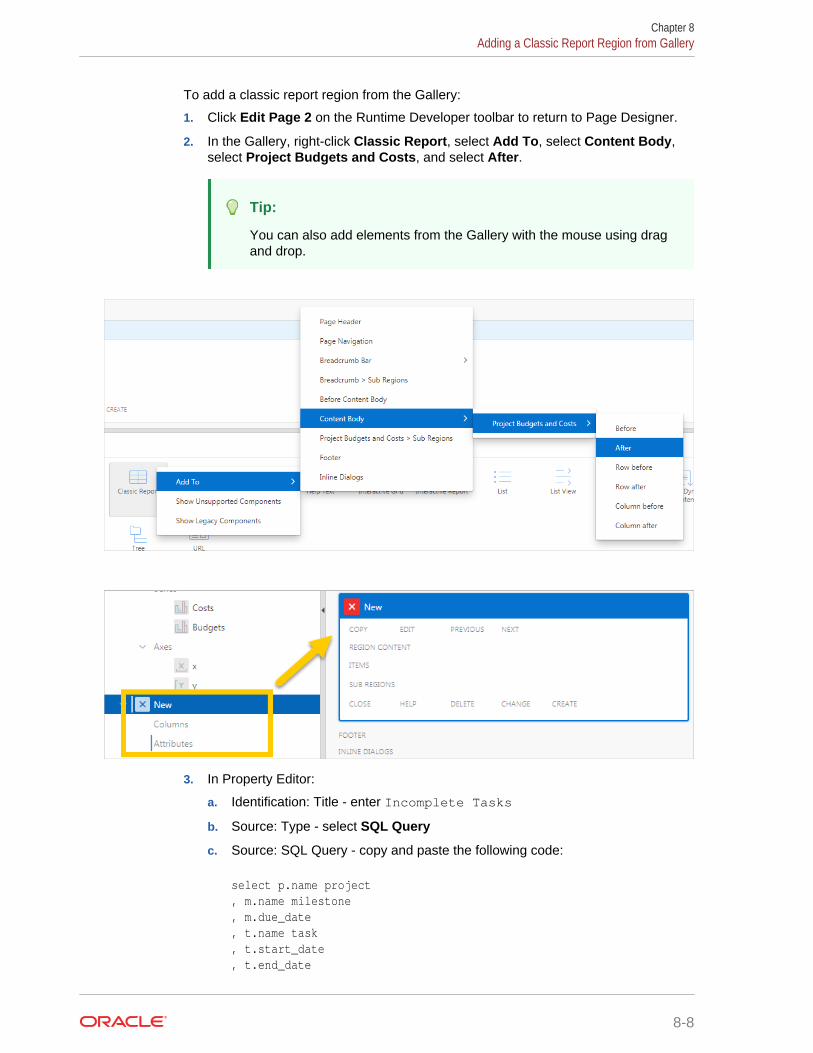
2. In the Gallery, right-click Classic Report, select Add To, select Content Body,select Project Budgets and Costs, and select After.
Tip:
You can also add elements from the Gallery with the mouse using dragand drop.
3. In Property Editor:
a. Identification: Title - enter Incomplete Tasks
b. Source: Type - select SQL Query
c. Source: SQL Query - copy and paste the following code:
select p.name project, m.name milestone, m.due_date, t.name task, t.start_date, t.end_date
Chapter 8Adding a Classic Report Region from Gallery
8-8
from sample$projects p, sample$project_milestones m, sample$project_tasks twhere p.id = m.project_idand p.id = t.project_idand t.milestone_id = m.id (+)and nvl(t.is_complete_yn, 'N') = 'N'
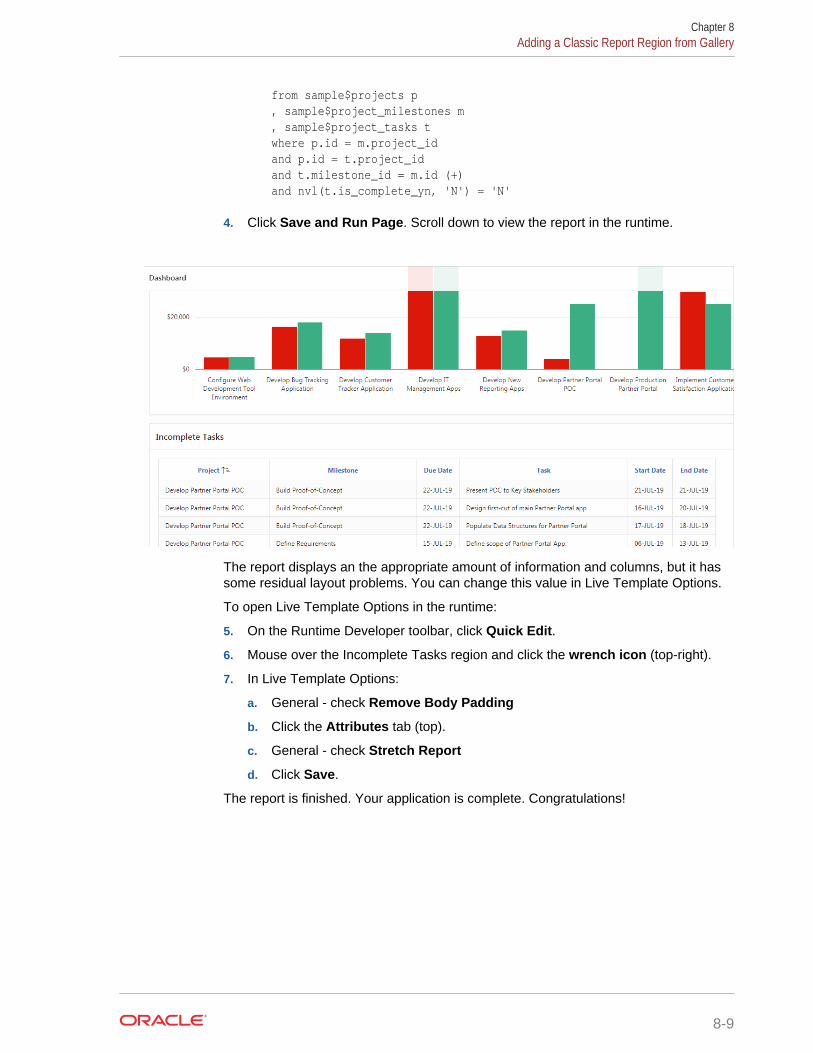
4. Click Save and Run Page. Scroll down to view the report in the runtime.
The report displays an the appropriate amount of information and columns, but it hassome residual layout problems. You can change this value in Live Template Options.
To open Live Template Options in the runtime:
5. On the Runtime Developer toolbar, click Quick Edit.
6. Mouse over the Incomplete Tasks region and click the wrench icon (top-right).
7. In Live Template Options:
a. General - check Remove Body Padding
b. Click the Attributes tab (top).
c. General - check Stretch Report
d. Click Save.
The report is finished. Your application is complete. Congratulations!
Chapter 8Adding a Classic Report Region from Gallery
8-9
AImporting an Application into a Workspace
Upload a SQL script to your Oracle Application Express workspace to start at the be‐ginning of any chapter in this tutorial.
You can use the Import functionality of App Builder to upload a script to your work‐space to start at the beginning of a chapter. Each script creates an application tomatch the start of a chapter. Use these scripts to skip around the tutorial or to checkyour work prior to that chapter.
The files you upload are contained in a downloadable .zip file located here: http://www.oracle.com/technetwork/developer-tools/apex/application-express/apex19-demo-basic-5586158.zip
Each file incorporates all the changes you are instructed to make in the chapters pre‐ceding it and creates a new application named "Demo Projects" with a new applicationID.
Tip:
If you already have a Demo Projects app in your workspace, you may wantto rename you existing Demo Projects app by editing the Name attribute onthe Edit Application Definition page. See "Editing Application Attributes" inthe Oracle Application Express App Builder User’s Guide.
Prerequisites
To import an application, you must have the following:
• The .zip file containing the application export scripts: http://www.oracle.com/tech‐network/developer-tools/apex/application-express/apex19-demo-ba‐sic-5586158.zip
• The sample dataset installed in "Populating Your Workspace"
• Sufficient space allocated to your workspace
– to request more space, see "Requesting More Storage" in Oracle ApplicationExpress Administration Guide
Procedure
To import an application export file (*.sql):
1. On the Workspace home page, click App Builder to navigate to the App BuilderHome Page.
2. Click Import.
The Import dialog displays.
3. For Import:
a. Import file - click the appropriate button to browse your system for a file (forexample, in Chrome the Choose File button).
A-1
b. Locate the extracted .zip archive.
c. Select the desired script and click Open.
Tip:
To determine the appropriate script file name, see Starting fromhere at the beginning of a chapter.
d. For File Type, select Database Application, Page or Component Export.
e. Click Next.
4. On the File Import Confirmation page, click Next.
5. On the Install Database Application page, click Install Application.
The new application builds.
6. Click Edit Application to navigate to the imported application’s overview in Appli‐cation Builder.
You have imported the new application into your workspace.
Appendix A
A-2
Index
Aalias (SQL), 5-3App Gallery, 8-7Appearance Template, 6-8application runtime, 4-7, 4-9
CCards page, 4-2Classic Report, 8-7Create Application wizard
Advanced Settings, 4-6Features, 4-6Settings, 4-6
Create Application Wizard, 4-1Add Page function, 4-1
DDashboard page, 4-3Developer Toolbar, 5-1Display Only, 6-8dynamic action, 5-14Dynamic LOV, 6-6, 7-4
Fform page, 5-2Format Mask, 7-5
Hhidden column, 5-6
Iimport an application, A-1interactive grid, 6-1interactive report
column heading, 7-5
Llink (SQL), 5-3list of values (LOV), 5-6Live Template Options, 8-6lookup, 6-6, 7-4
NNavigation Menu, 6-2, 7-2
Oopposite action, 5-14
PProcessing tab, 5-16projects page, 5-2
QQuick Edit
Live Template Options, 8-6
Rregion, 5-6runtime, 4-7, 4-9, 5-1
SSave and Run Page, 4-7, 4-9Select List, 6-6Shared Components
Navigation Menu, 6-2, 7-2sub region, 5-6
TTemplate
Appearance, 6-8Template Options, 5-6
Index-1

Vvalidation, 5-16
Index
Index-2